interactions between proteins, dna and...
TRANSCRIPT
Interactions betweenproteins, DNA and RNA
—The energy, length and time coordinate system
to find your way in the cell
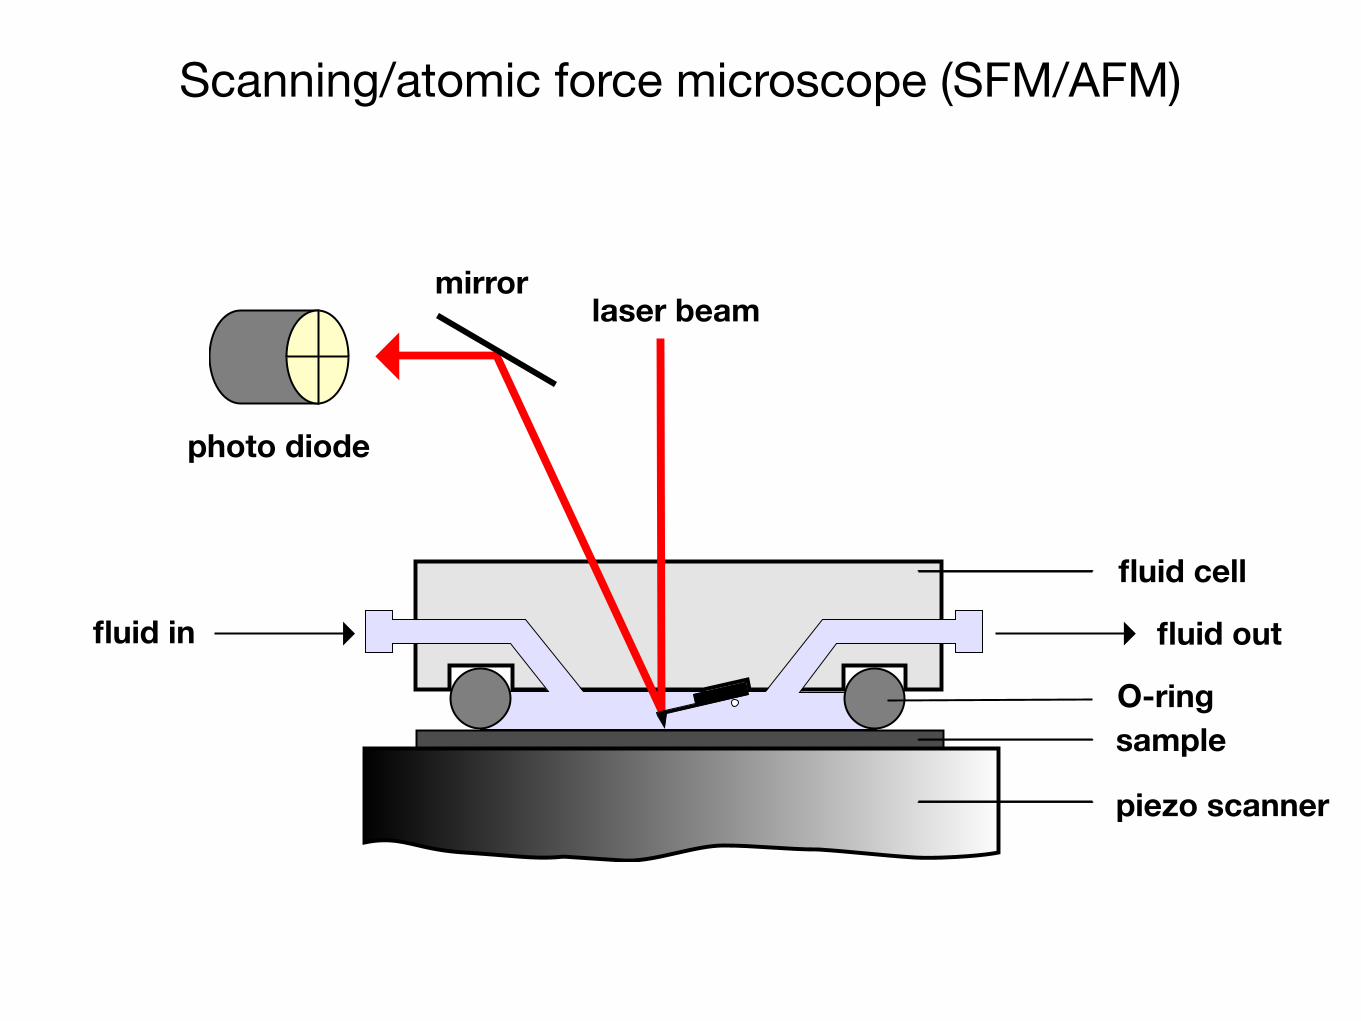
Scanning/atomic force microscope (SFM/AFM)
laser beammirror
photo diode
sample
piezo scanner
fluid in fluid out
fluid cell
O-ring
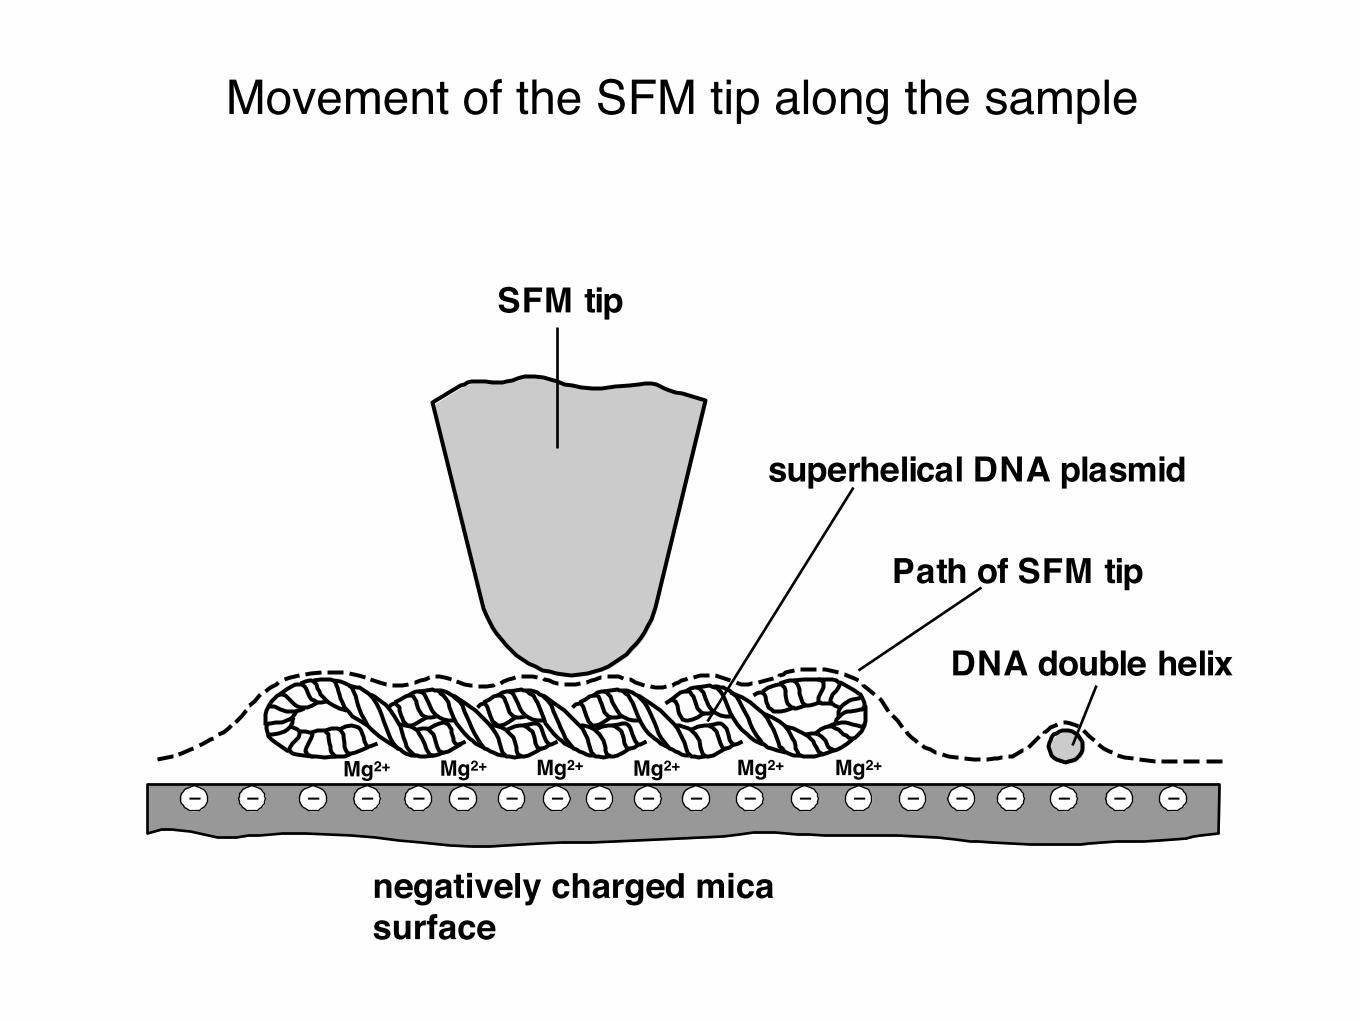
Movement of the SFM tip along the sample
Path of SFM tip
SFM tip
superhelical DNA plasmid
DNA double helix
Mg2+
negatively charged mica surface
Mg2+Mg2+Mg2+Mg2+Mg2+
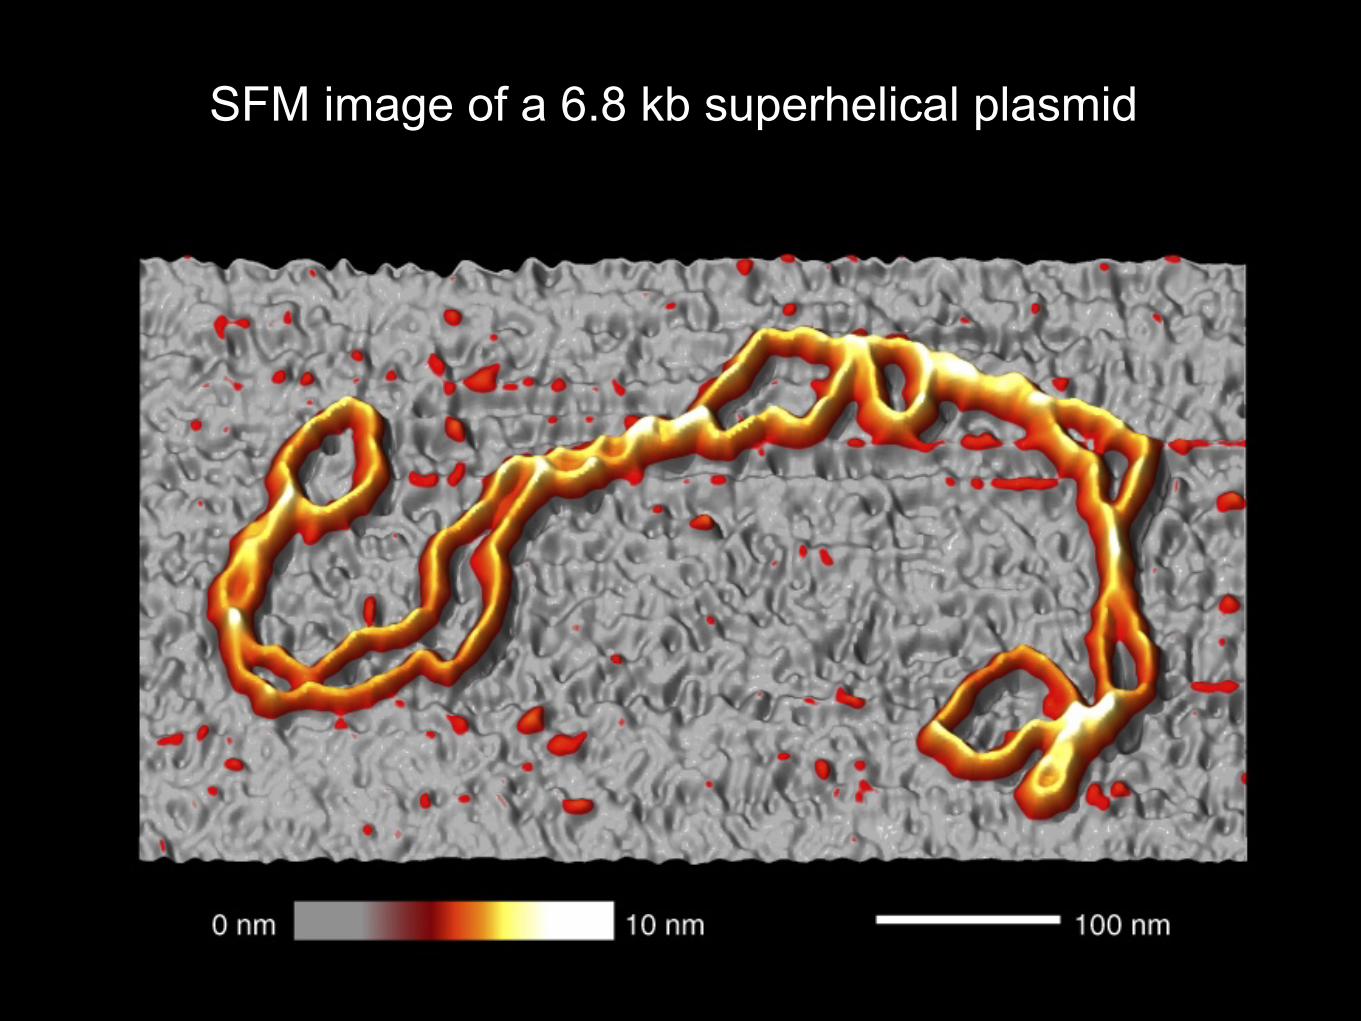
SFM image of a 6.8 kb superhelical plasmid
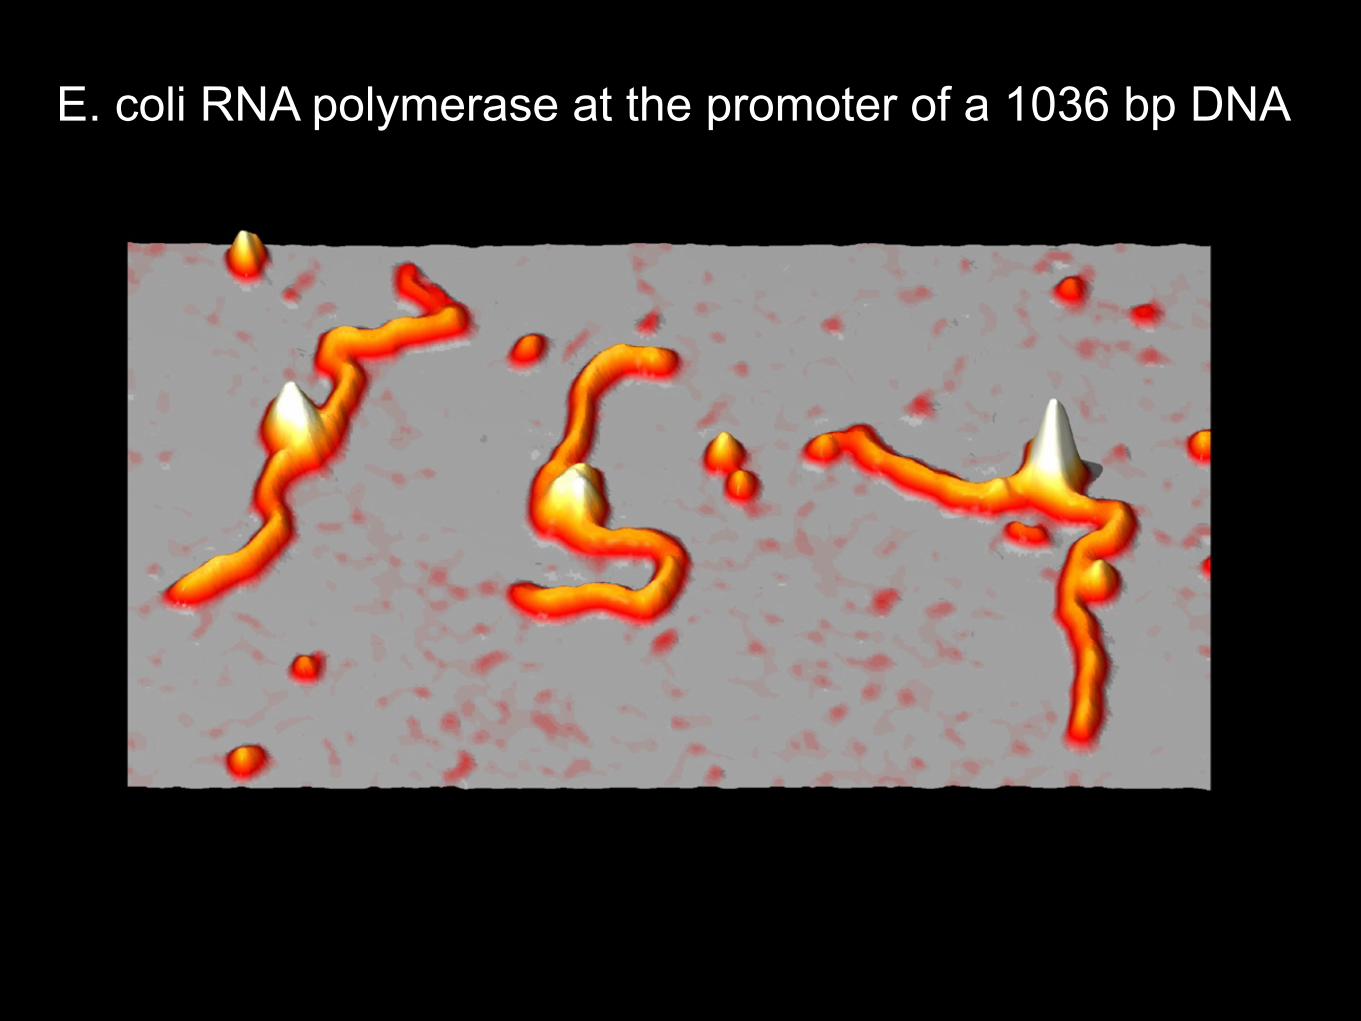
E. coli RNA polymerase at the promoter of a 1036 bp DNA
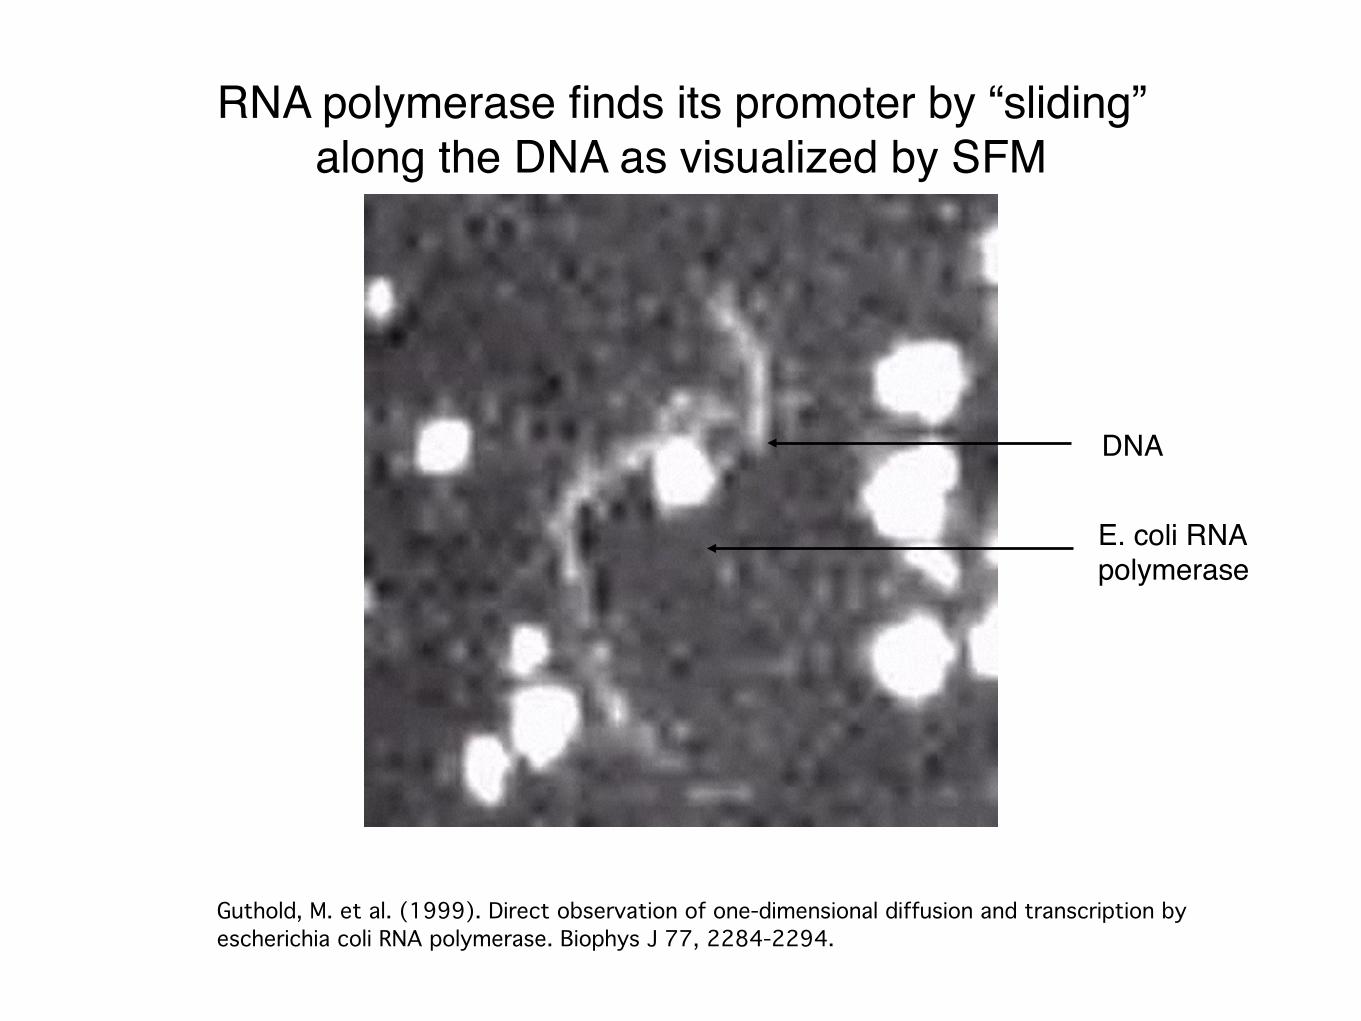
RNA polymerase finds its promoter by “sliding”along the DNA as visualized by SFM
Guthold, M. et al. (1999). Direct observation of one-dimensional diffusion and transcription by escherichia coli RNA polymerase. Biophys J 77, 2284-2294.
DNA
E. coli RNA polymerase
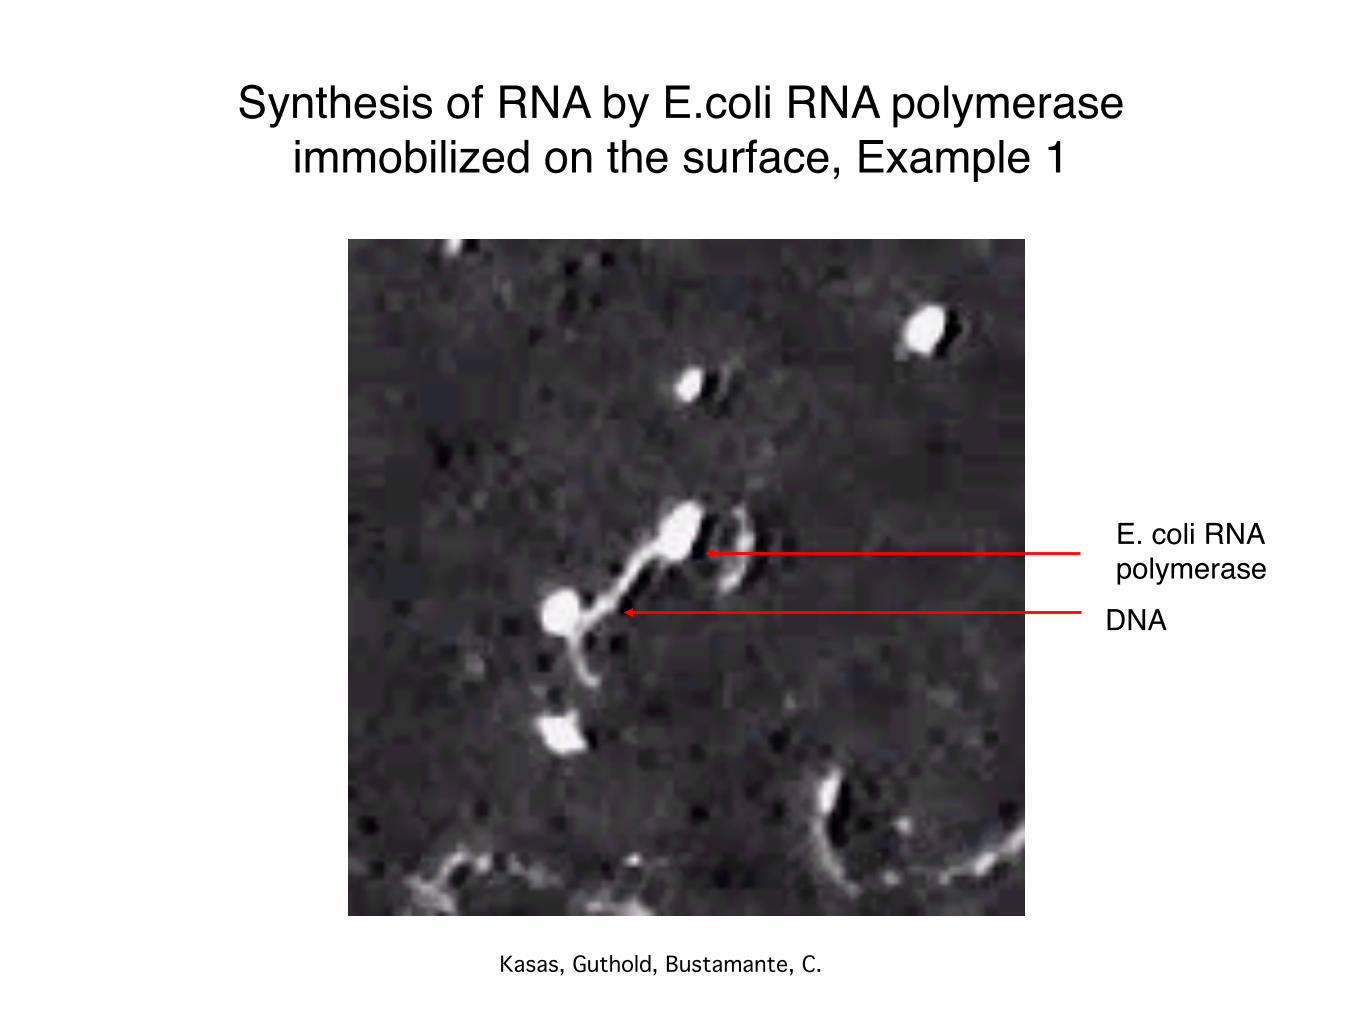
Synthesis of RNA by E.coli RNA polymeraseimmobilized on the surface, Example 1
Kasas, Guthold, Bustamante, C.
DNA
E. coli RNA polymerase
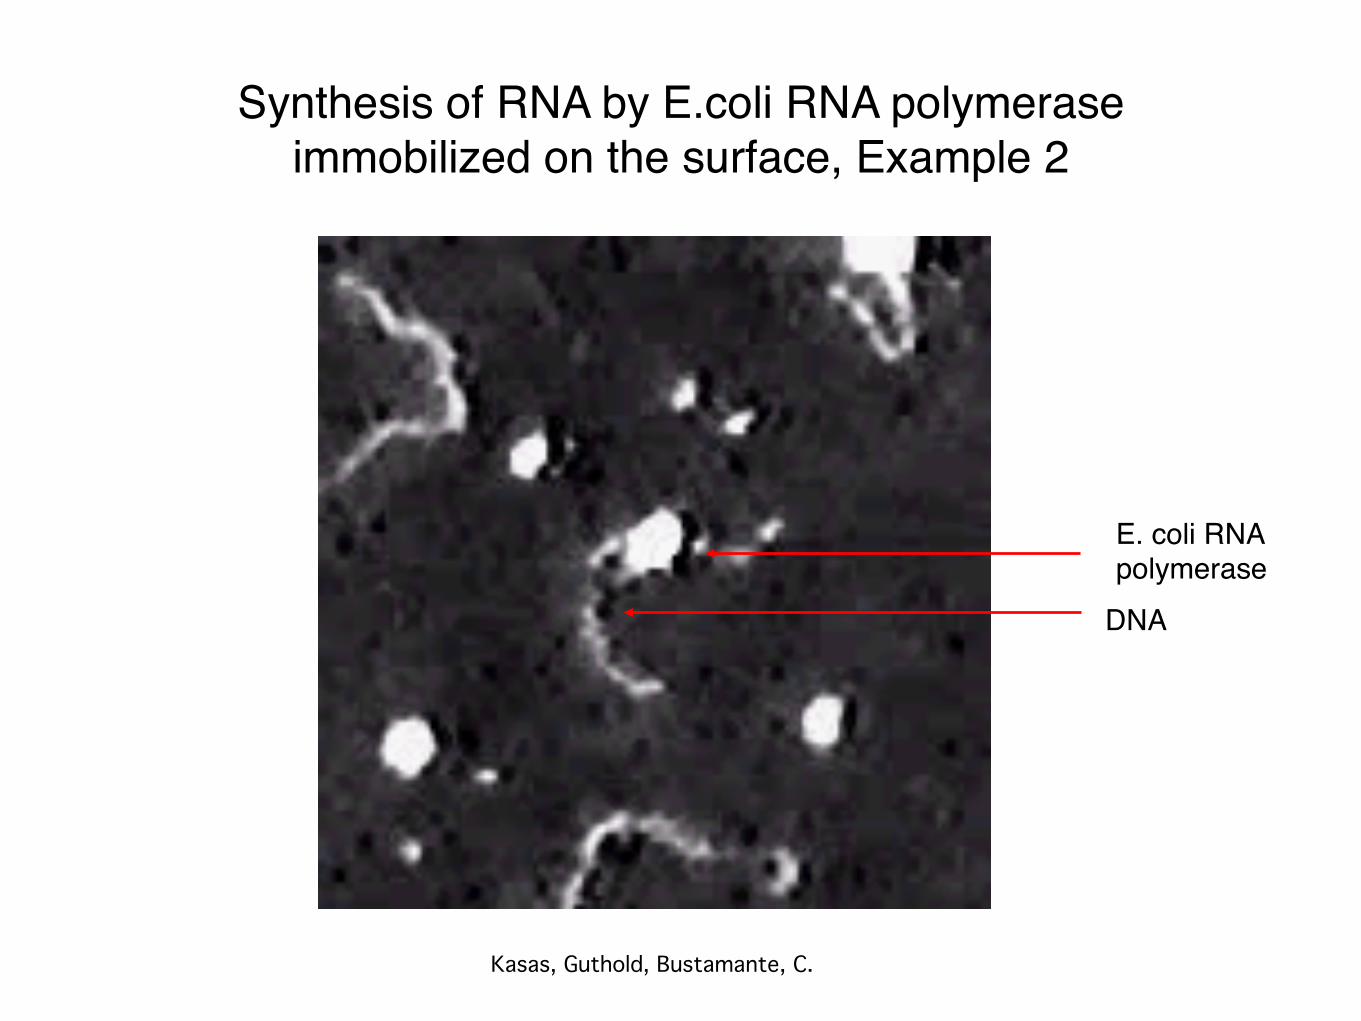
Synthesis of RNA by E.coli RNA polymeraseimmobilized on the surface, Example 2
Kasas, Guthold, Bustamante, C.
DNA
E. coli RNA polymerase
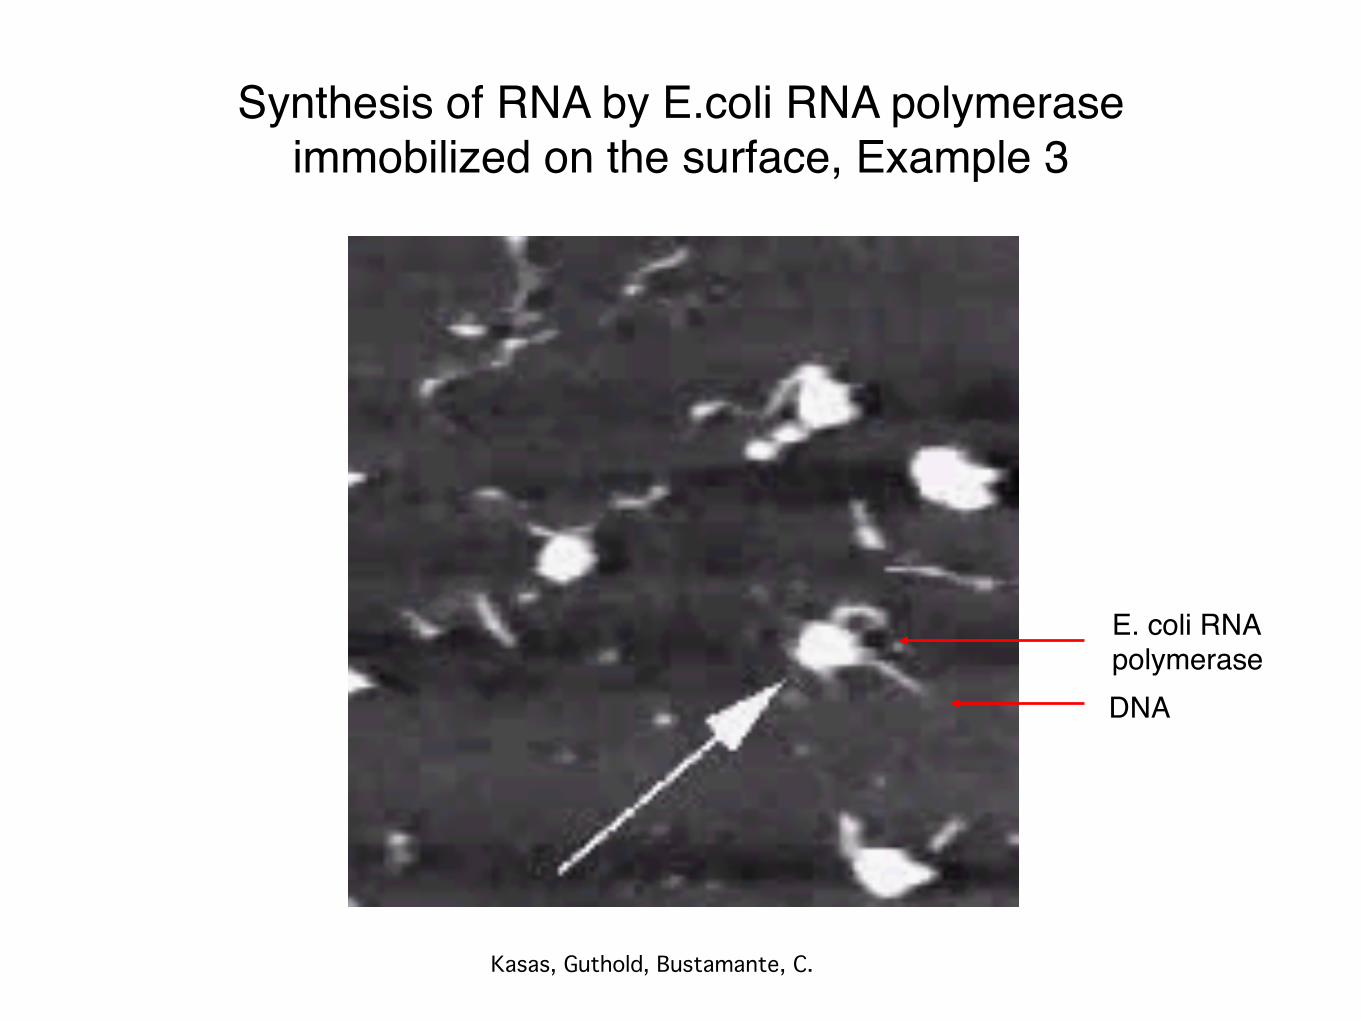
Synthesis of RNA by E.coli RNA polymeraseimmobilized on the surface, Example 3
Kasas, Guthold, Bustamante, C.
DNA
E. coli RNA polymerase
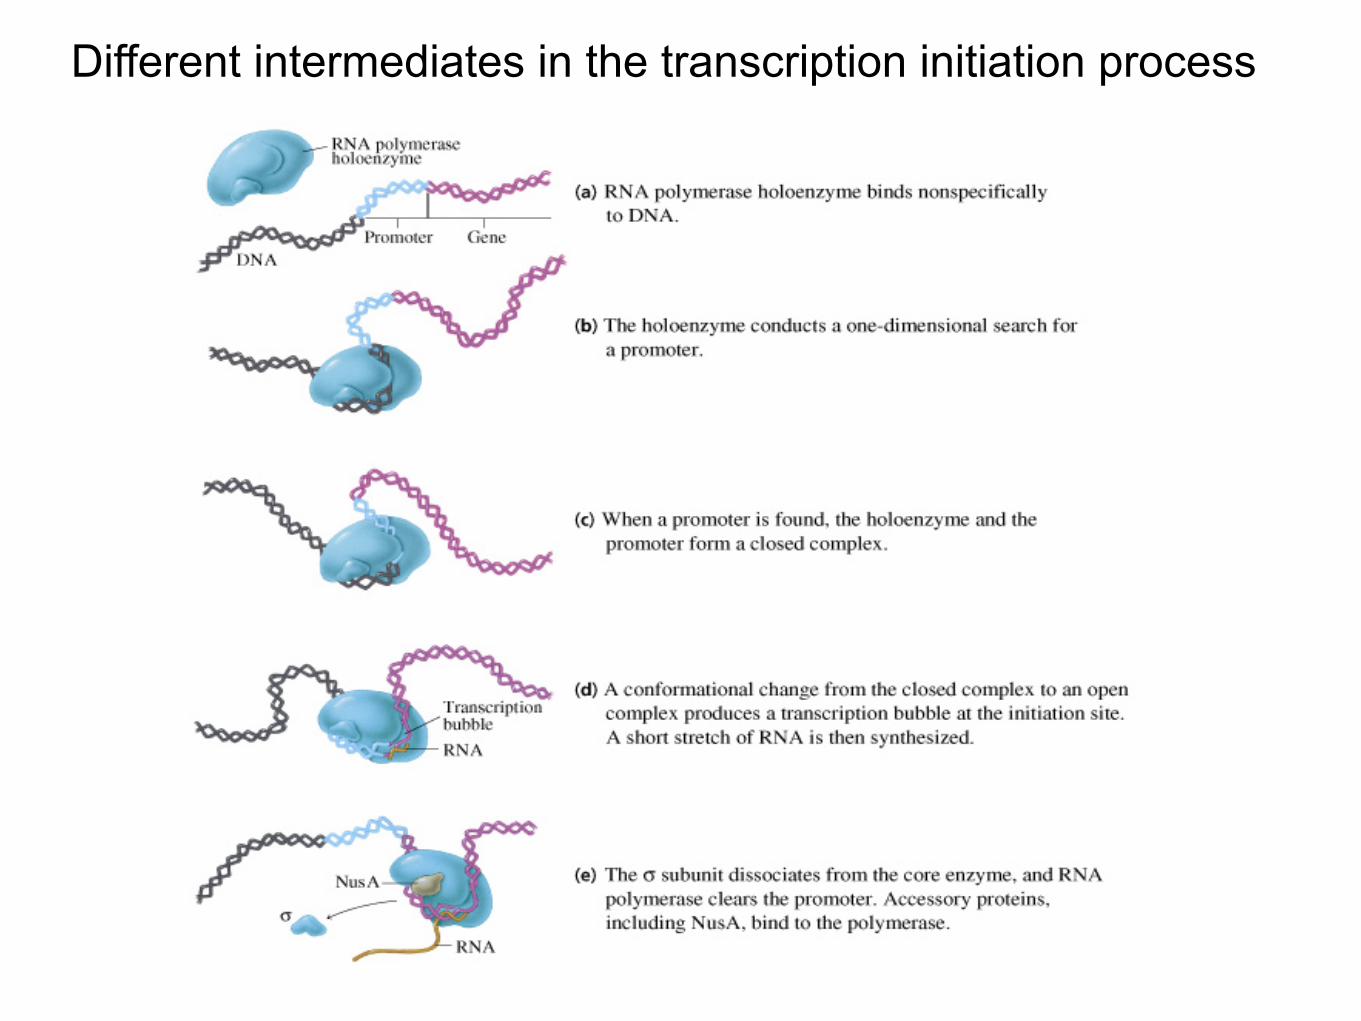
Different intermediates in the transcription initiation process
Reaction mechanism of transcription by yeast RNA polymerase II
http://www.cramer.genzentrum.lmu.de/assets/Lab-Cramer/Lab-Cramer-Publications/txnmovie.mov
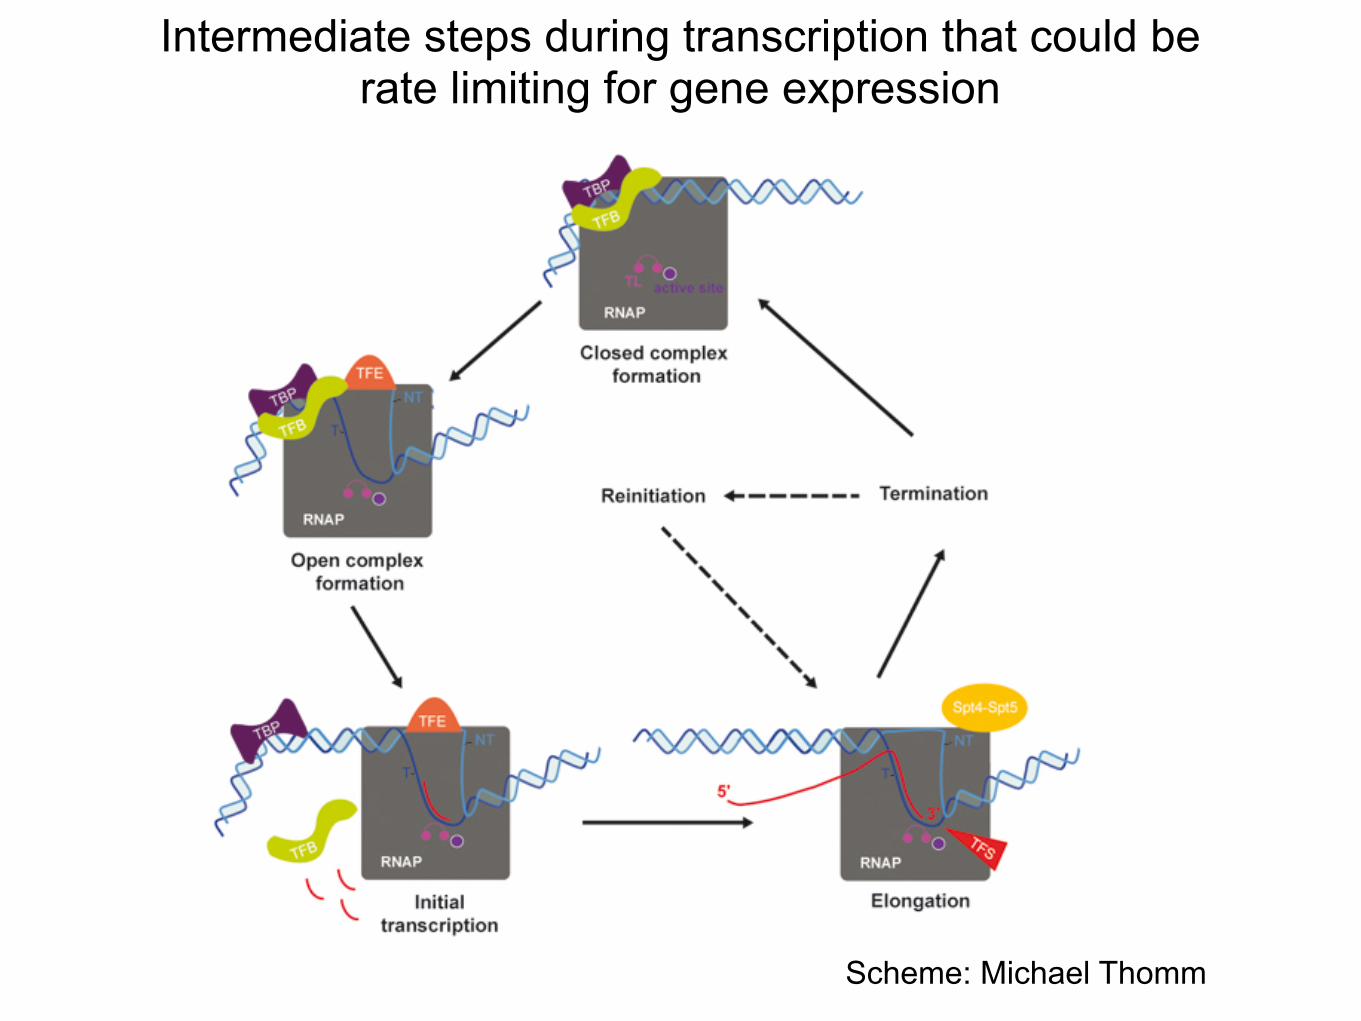
Intermediate steps during transcription that could be rate limiting for gene expression
Scheme: Michael Thomm
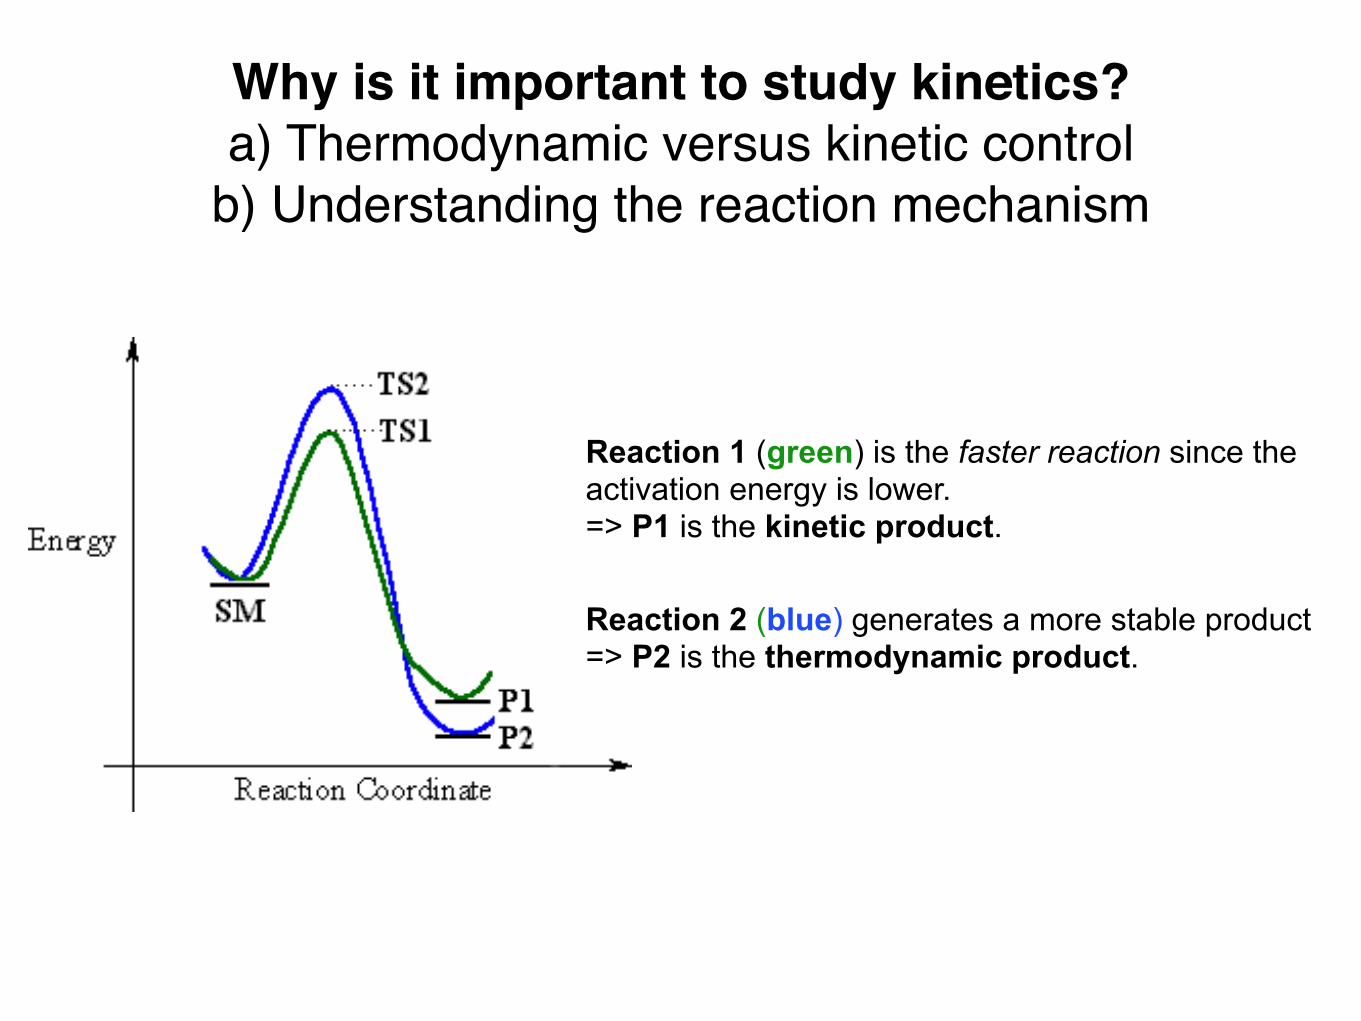
Why is it important to study kinetics?a) Thermodynamic versus kinetic control
b) Understanding the reaction mechanism
Reaction 1 (green) is the faster reaction since the activation energy is lower.=> P1 is the kinetic product.
Reaction 2 (blue) generates a more stable product => P2 is the thermodynamic product.
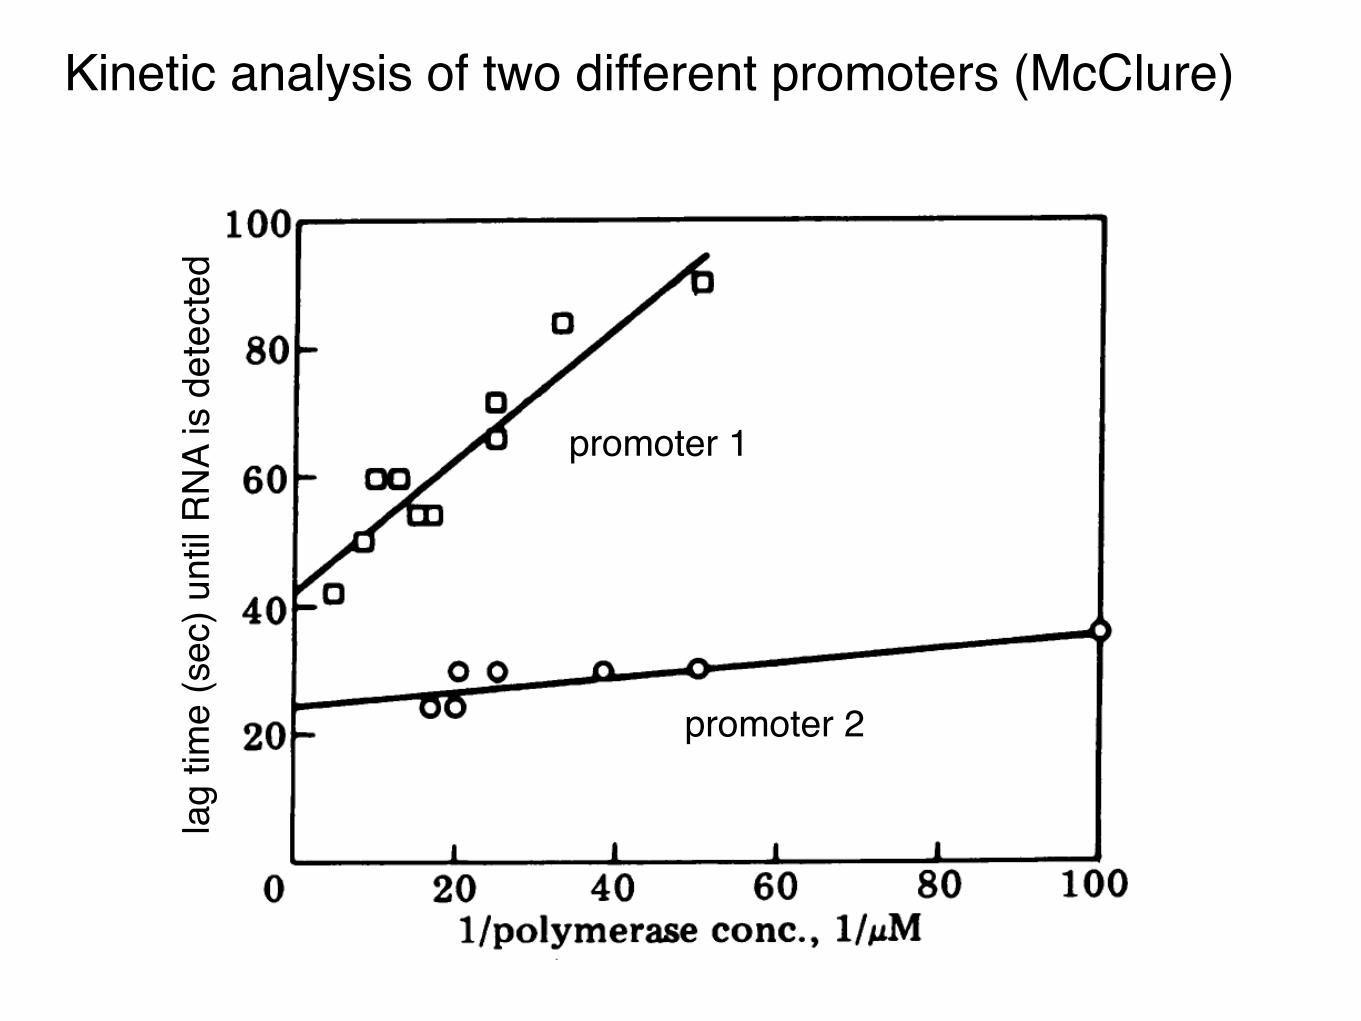
Kinetic analysis of two different promoters (McClure)
lag
time
(sec
) unt
il R
NA
is d
etec
ted
promoter 1
promoter 2
Calculating reaction kinetics
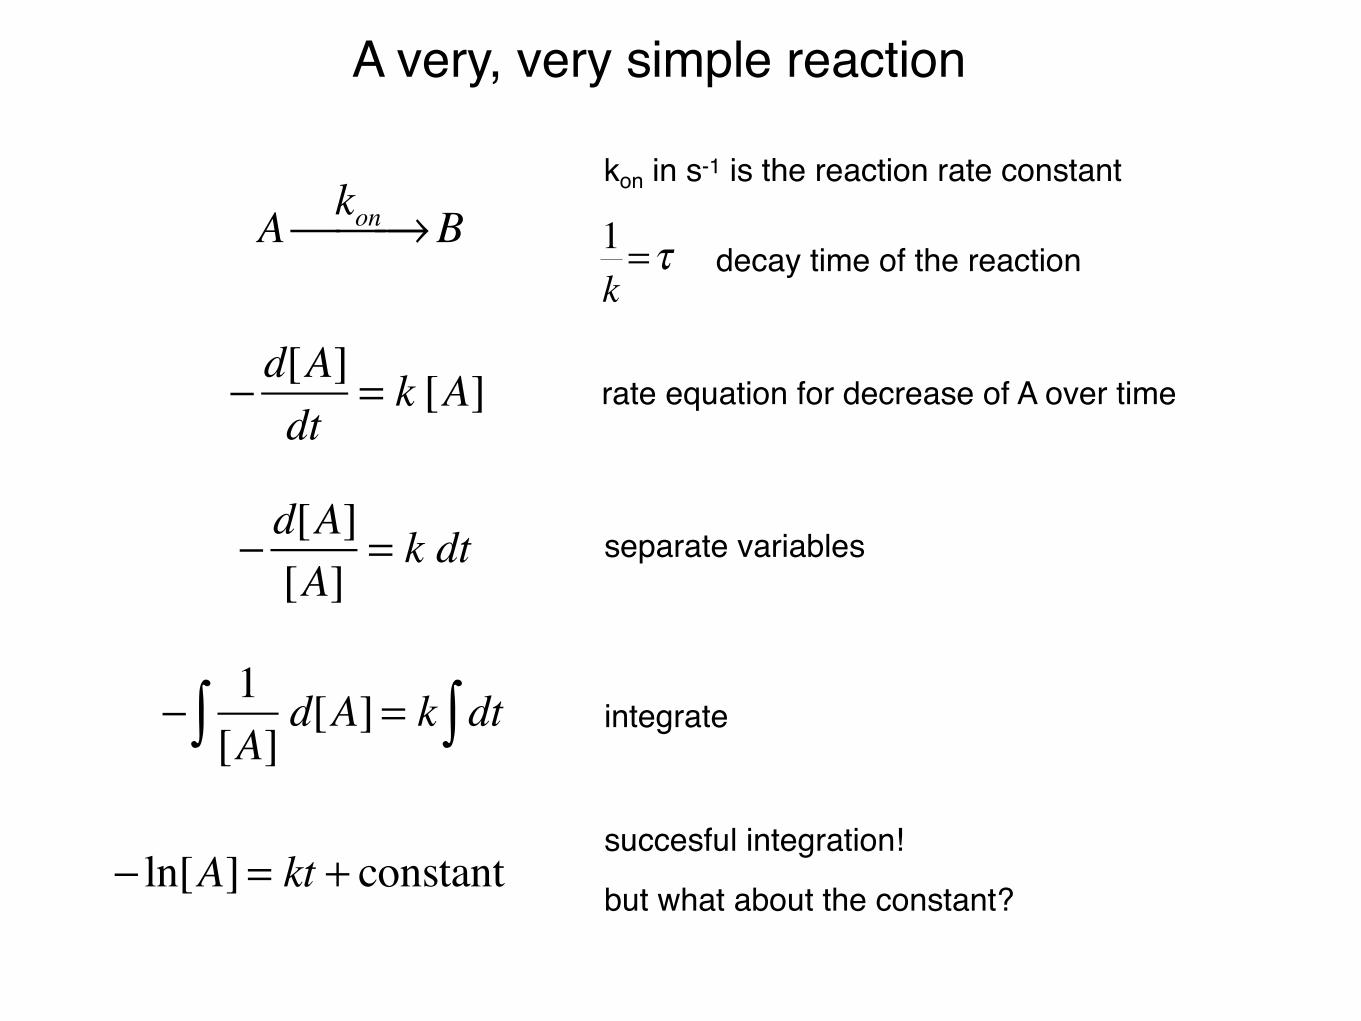
A very, very simple reaction
kon in s-1 is the reaction rate constant
�
1k
=τ decay time of the reaction
− d[A][A]
= k dt separate variables
− 1[A]∫ d[A]= k dt∫ integrate
− ln[A]= kt + constantsuccesful integration!
but what about the constant?
rate equation for decrease of A over time− d[A]dt
= k [A]
A kon⎯ →⎯⎯ B
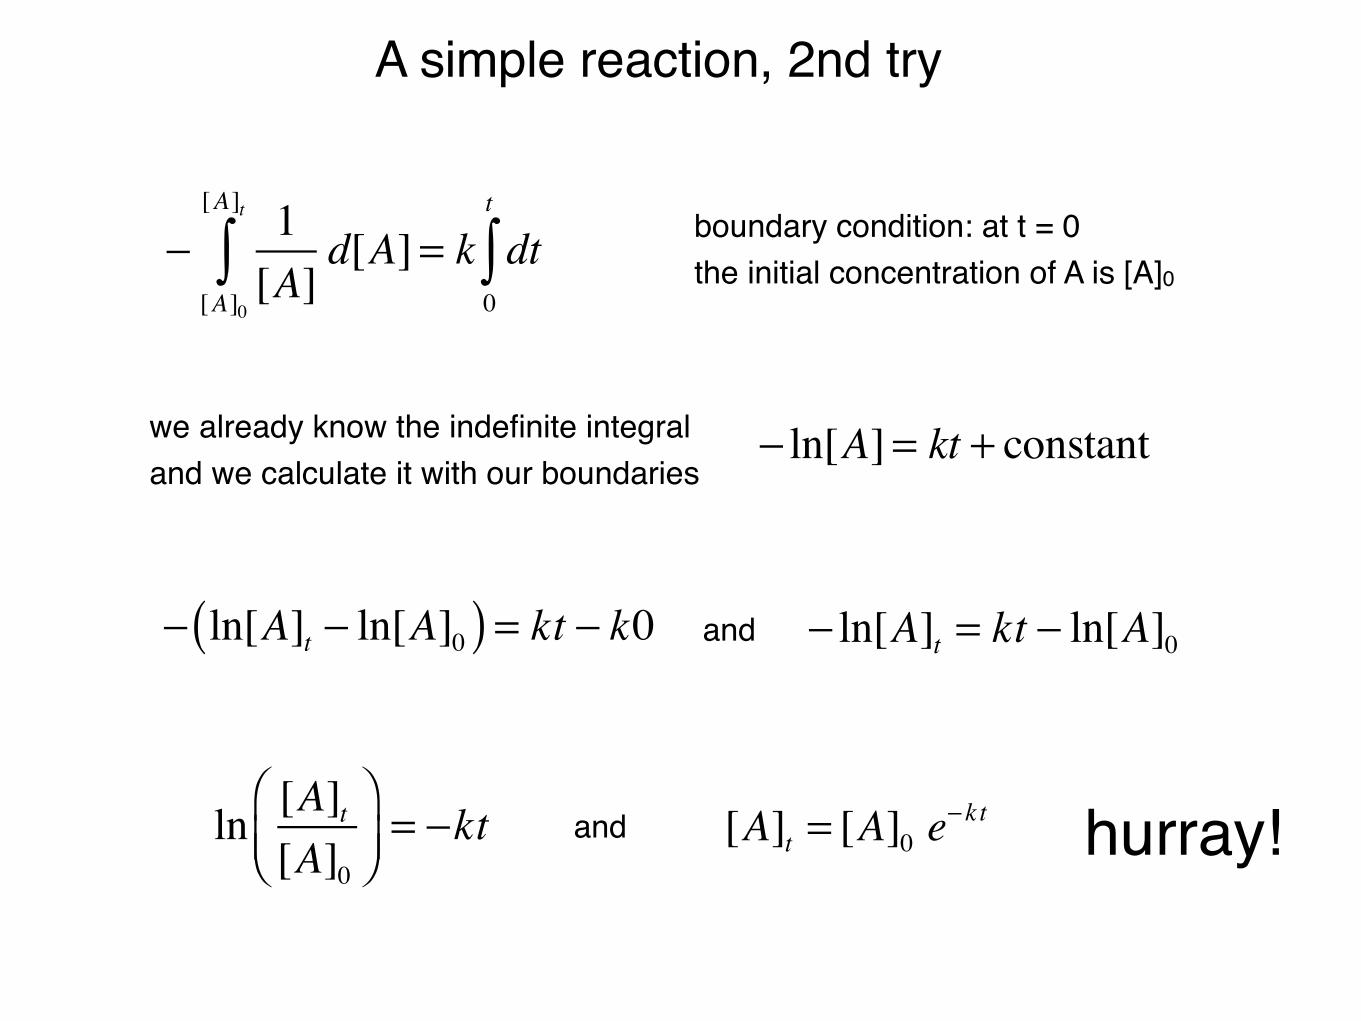
A simple reaction, 2nd try
boundary condition: at t = 0the initial concentration of A is [A]0− 1
[A][A]0
[A]t
∫ d[A]= k dt0
t
∫
we already know the indefinite integraland we calculate it with our boundaries
− ln[A]= kt + constant
andln [A]t[A]0
⎛⎝⎜
⎞⎠⎟= −kt [A]t = [A]0 e
−k t hurray!
− ln[A]t − ln[A]0( ) = kt − k0 − ln[A]t = kt − ln[A]0and
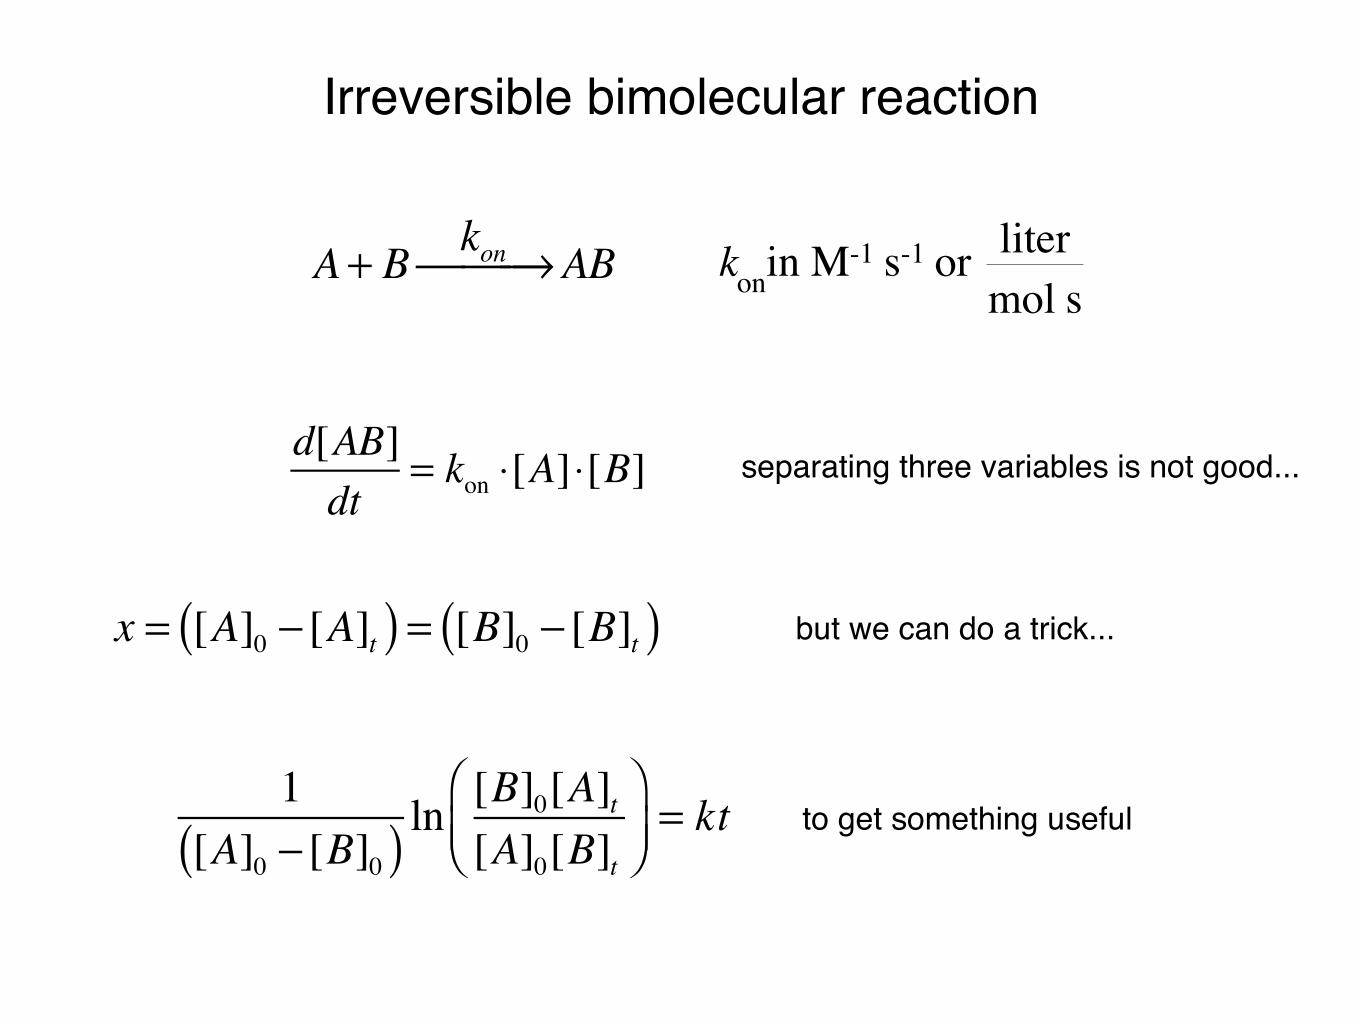
Irreversible bimolecular reaction
�
konin M-1 s-1 or litermol s
but we can do a trick...x = [A]0 − [A]t( ) = [B]0 − [B]t( )
1[A]0 − [B]0( ) ln
[B]0[A]t[A]0[B]t
⎛⎝⎜
⎞⎠⎟= kt to get something useful
A + B kon⎯ →⎯⎯ AB
separating three variables is not good...d[AB]dt
= kon ⋅[A]⋅[B]
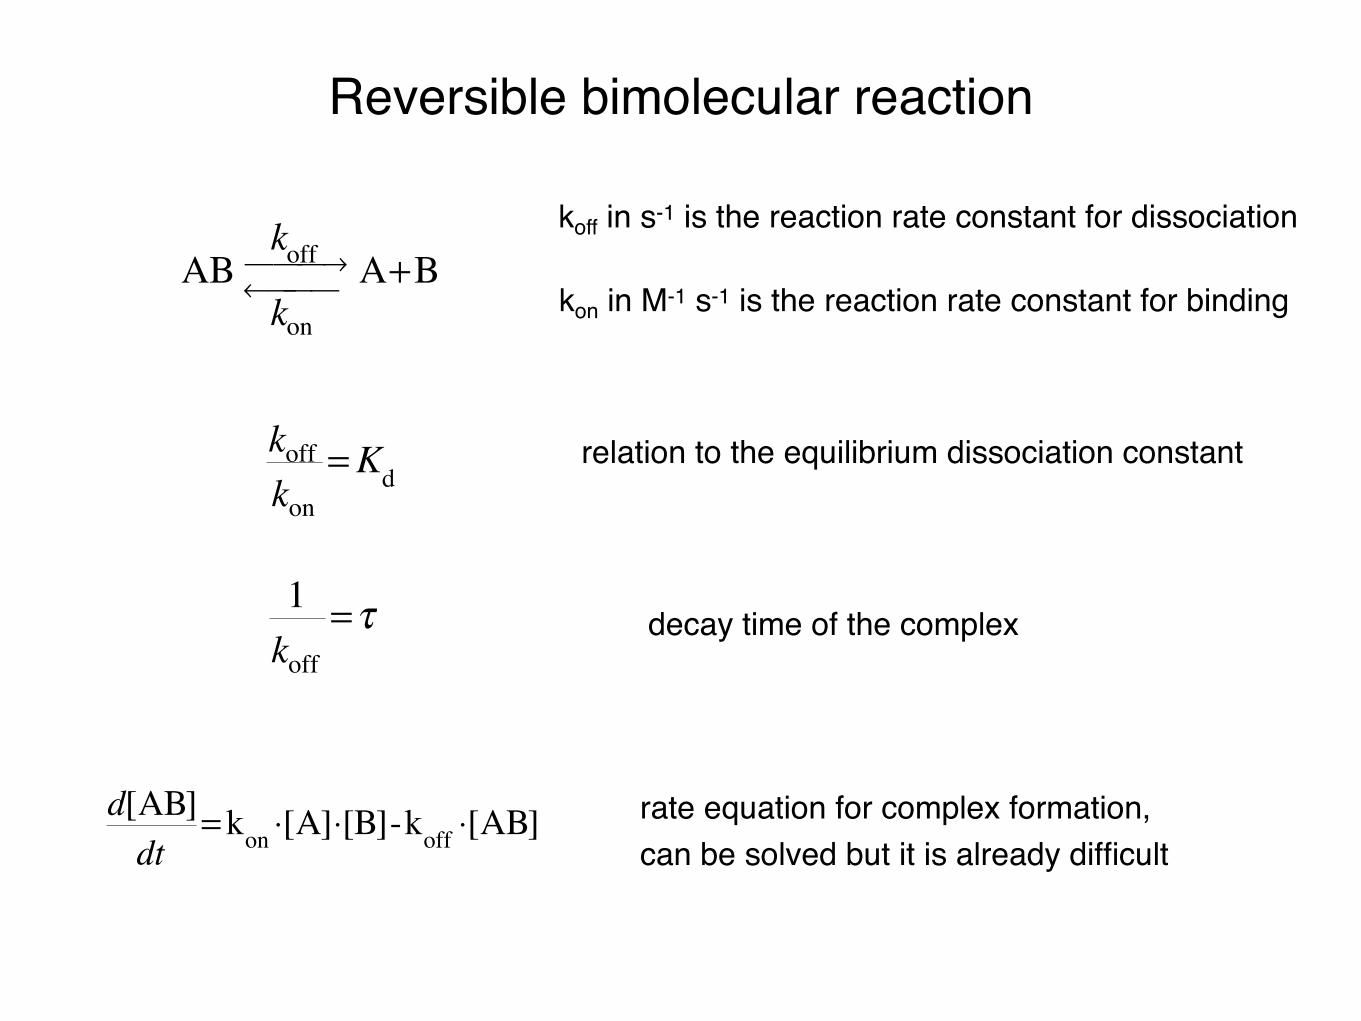
Reversible bimolecular reaction
�
ABkon
← ⎯ ⎯ ⎯
koff⎯ → ⎯ ⎯ A+Bkon in M-1 s-1 is the reaction rate constant for binding
koff in s-1 is the reaction rate constant for dissociation
�
koffkon
=Kd relation to the equilibrium dissociation constant
�
1koff
=τ decay time of the complex
�
d[AB]dt
=kon ⋅[A]⋅[B]-koff ⋅[AB]rate equation for complex formation,can be solved but it is already difficult
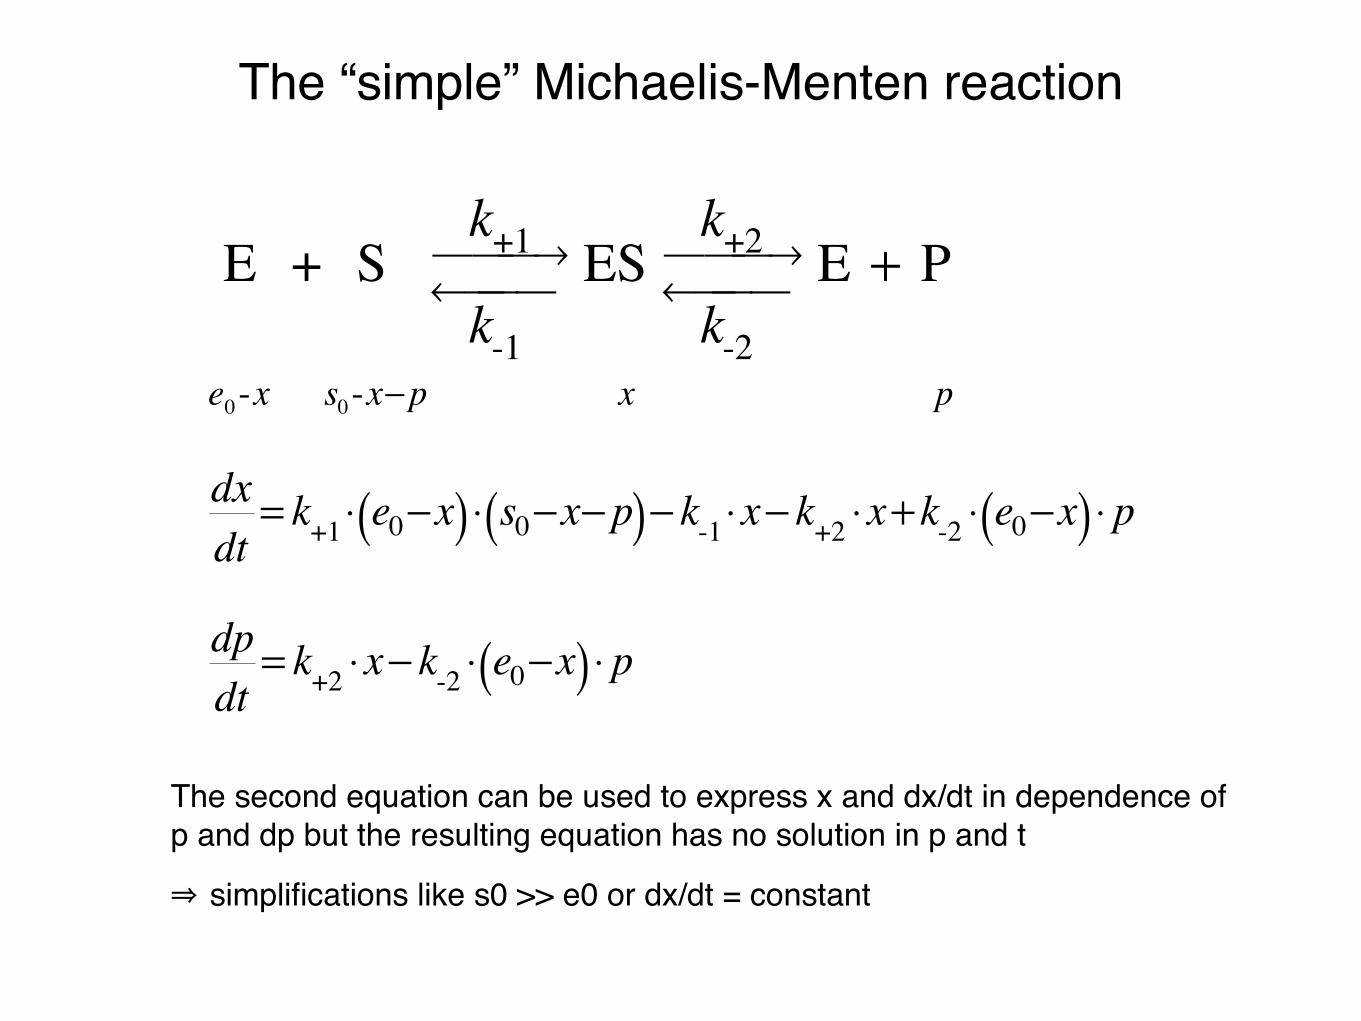
The “simple” Michaelis-Menten reaction
�
E + S k-1
← ⎯ ⎯ ⎯
k+1⎯ → ⎯ ⎯ ES k-2
← ⎯ ⎯ ⎯
k+2⎯ → ⎯ ⎯ E + P
e0-x s0-x−p x p
�
dxdt
= k+1 ⋅ e0−x( ) ⋅ s0−x−p( )− k-1 ⋅x− k+2 ⋅x+k-2 ⋅ e0−x( ) ⋅ p
dpdt
= k+2 ⋅x− k-2 ⋅ e0−x( ) ⋅ p
The second equation can be used to express x and dx/dt in dependence of p and dp but the resulting equation has no solution in p and t
⇒ simplifications like s0 >> e0 or dx/dt = constant
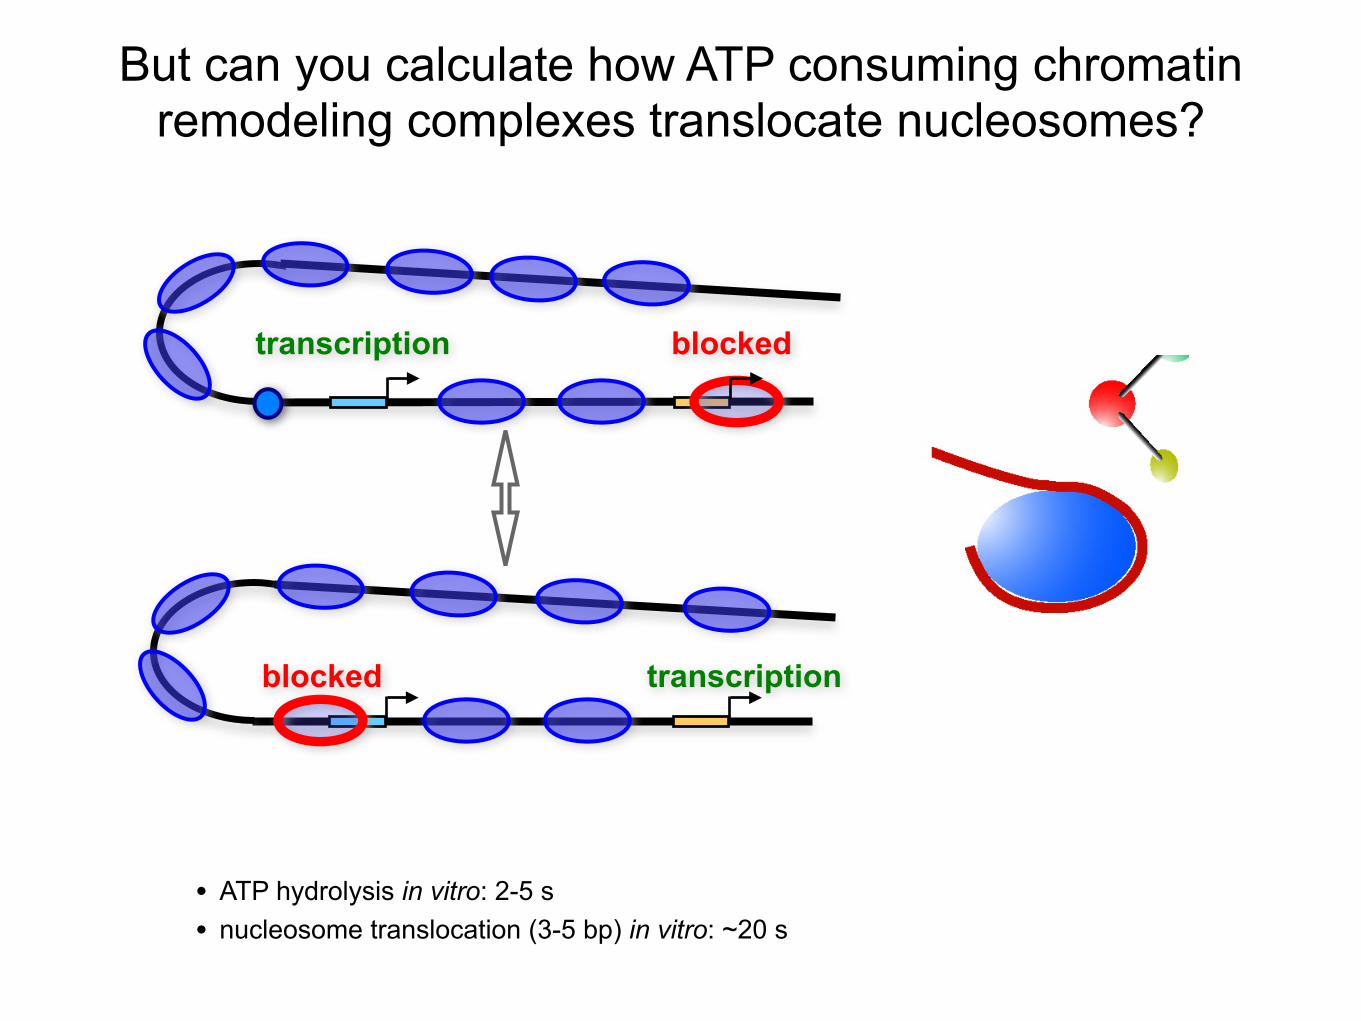
But can you calculate how ATP consuming chromatin remodeling complexes translocate nucleosomes?
transcription blocked
transcriptionblocked
• ATP hydrolysis in vitro: 2-5 s• nucleosome translocation (3-5 bp) in vitro: ~20 s
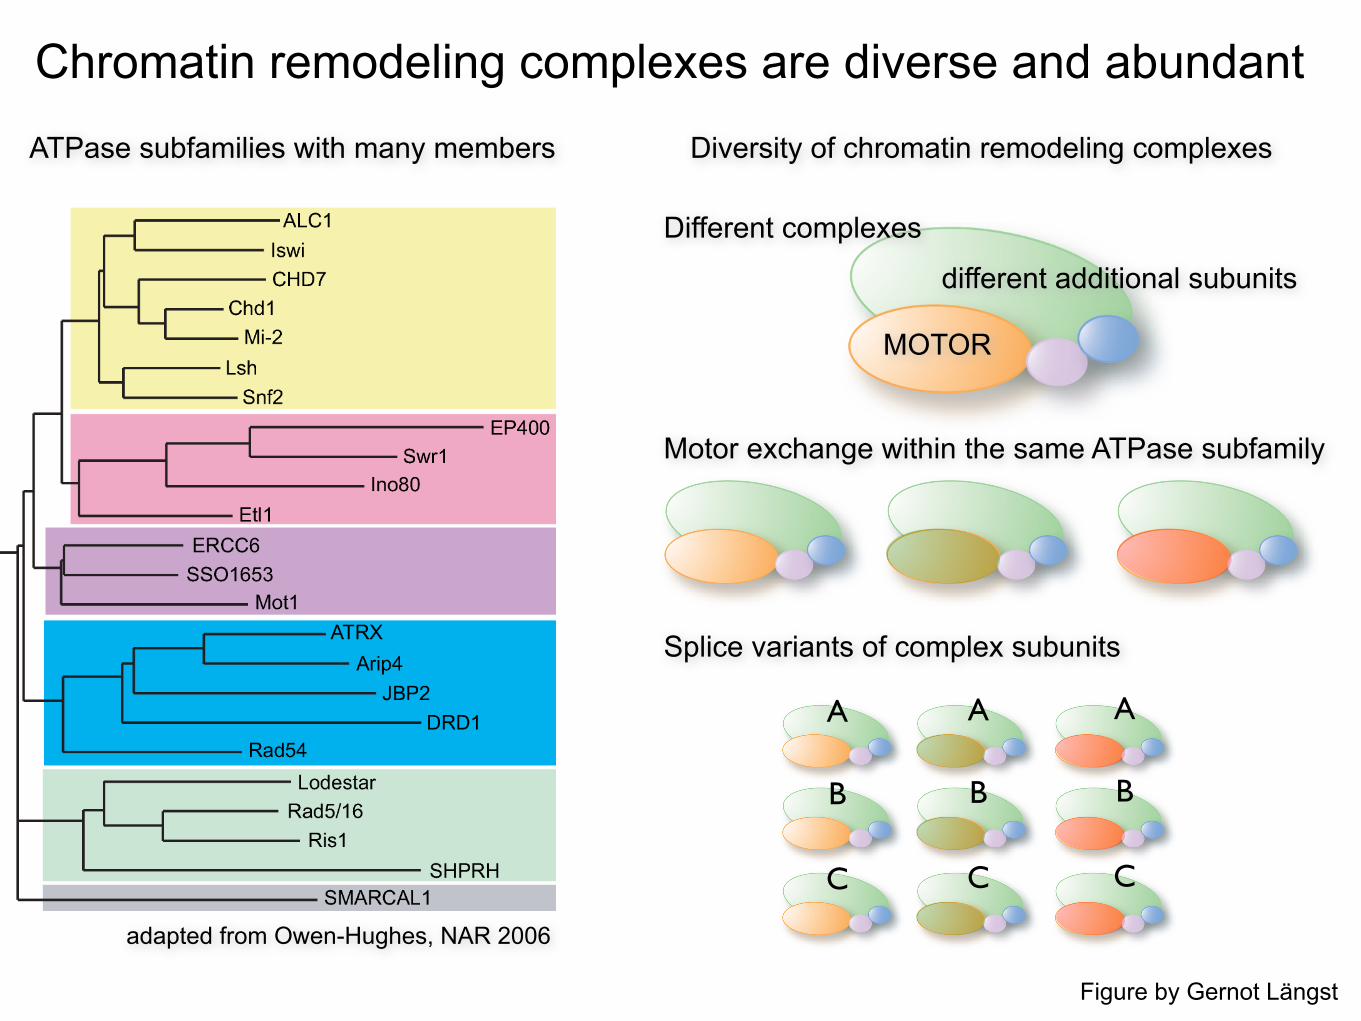
Chromatin remodeling complexes are diverse and abundant
proteins can disrupt chromatin as measured using a range ofdifferent assays (8), although other DNA–protein interactionscan also be affected. For example, Rad54 promotesRad51-dependent strand pairing (13), and Mot1 displacesthe TATA-binding protein (TBP) from DNA (19). Thus
although many Snf2 family proteins are likely to act toalter chromatin structure, this is not the case for all membersof the family.
Early biochemical studies and sequence alignmentssuggested that members of the Snf2 family could be further
Figure 1. Tree view of Snf2 family. (A) Schematic diagram illustrating hierarchical classification of superfamily, family and subfamily levels. (B) Unrooted radialneighbour-joining tree from a multiple alignment of helicase-like region sequences excluding insertions at the minor and major insertion regions frommotifs I to Iaand conserved blocks C–K for 1306 Snf2 proteins identified in theUniref database. The clear division into subfamilies is illustrated bywedge backgrounds, colouredby grouping of subfamilies. Subfamilies DRD1 and JBP2 were not clearly separated, as discussed in text. (C) In order to illustrate the relationship betweensubfamilies, a rooted tree was calculated using HMMprofiles for full-length alignments of the helicase regions. Groupings of subfamilies are indicated by colouringas in (B).
2888 Nucleic Acids Research, 2006, Vol. 34, No. 10
adapted from Owen-Hughes, NAR 2006
ATPase subfamilies with many members Diversity of chromatin remodeling complexes
MOTOR
different additional subunits
Different complexes
Motor exchange within the same ATPase subfamily
Splice variants of complex subunits
A
B
C
A
B
C
A
B
C
Figure by Gernot Längst
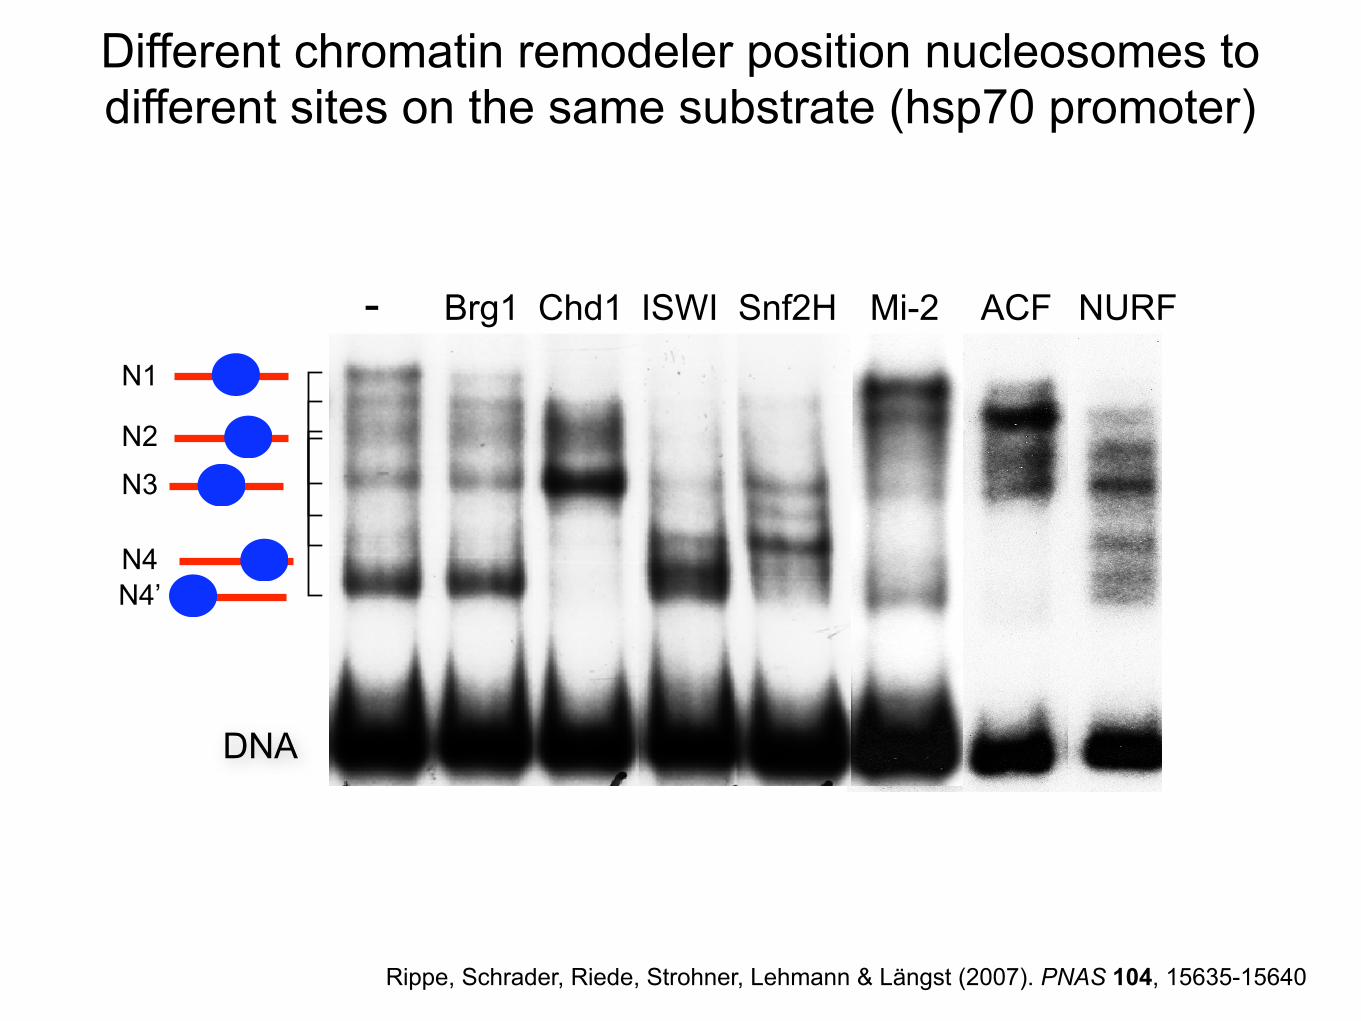
Different chromatin remodeler position nucleosomes to different sites on the same substrate (hsp70 promoter)
DNA
N1
N2
N3
N4
N4’
ACF NURF- Brg1 Chd1 ISWI Snf2H Mi-2
Rippe, Schrader, Riede, Strohner, Lehmann & Längst (2007). PNAS 104, 15635-15640
�
E + S k-1
← ⎯ ⎯ ⎯
k+1⎯ → ⎯ ⎯ ES k+2(or kcat )⎯ → ⎯ ⎯ ⎯ ⎯ ⎯ ⎯ E + P
�
KM = k-1+k+2
k1= dissociation rates of ES
formation rate of ESin mol
liter⎛ ⎝ ⎜
⎞ ⎠ ⎟
�
"reaction efficiency" = kcat
KM= catalysis rate
binding site saturation
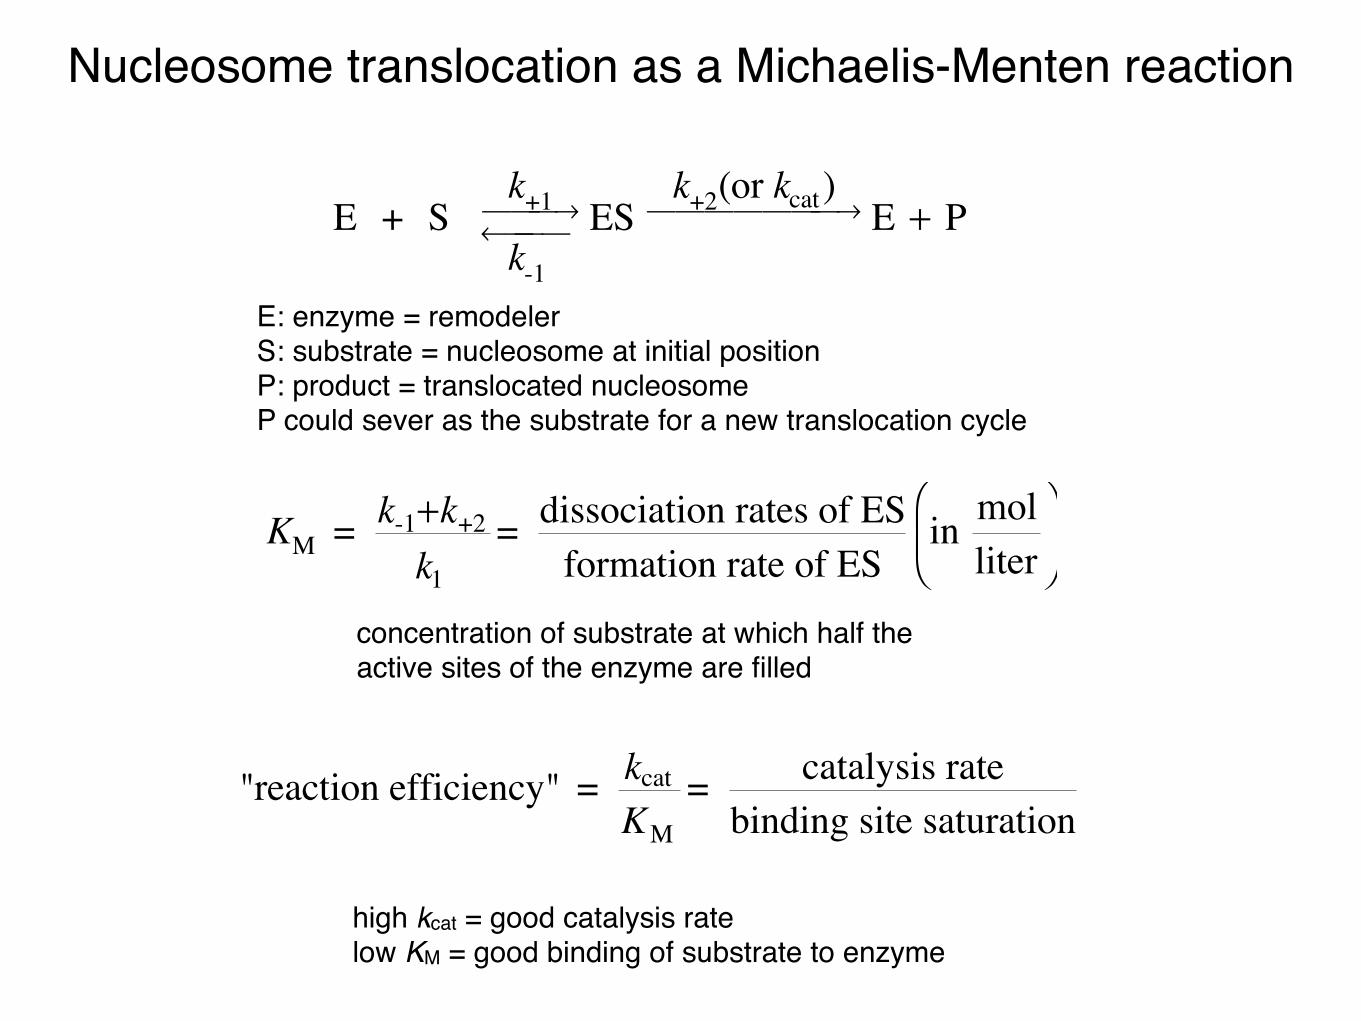
Nucleosome translocation as a Michaelis-Menten reaction
E: enzyme = remodelerS: substrate = nucleosome at initial positionP: product = translocated nucleosomeP could sever as the substrate for a new translocation cycle
concentration of substrate at which half the active sites of the enzyme are filled
high kcat = good catalysis ratelow KM = good binding of substrate to enzyme
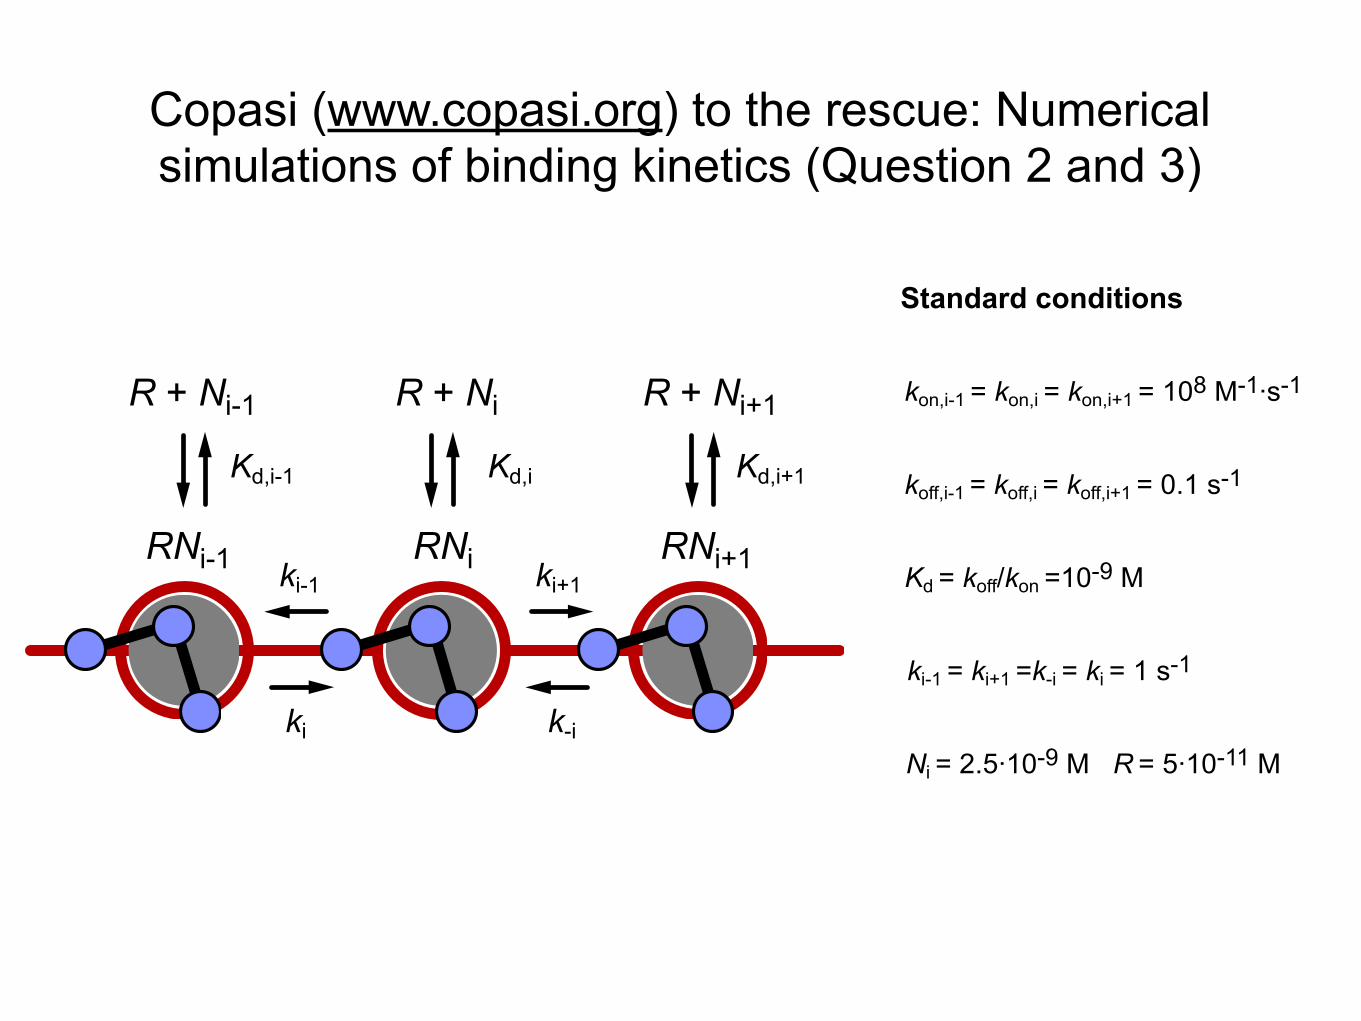
kon,i-1� =� kon,i� =� kon,i+1� =� 108� M-1·∙s-1
koff,i-1� =� koff,i� =� koff,i+1� =� 0.1� s-1
Kd� =� koff/kon� =10-9� M
Ni� =� 2.5·∙10-9� M� � � R� =� 5·∙10-11� M
Standard conditions
ki-1� =� ki+1� =k-i� =� ki� =� 1� s-1
R +� Ni
Kd,i+1Kd,i-1 Kd,i
ki+1ki-1
ki k-i
RNi
R +� Ni-1 R +� Ni+1
RNi-1 RNi+1
Copasi (www.copasi.org) to the rescue: Numerical simulations of binding kinetics (Question 2 and 3)
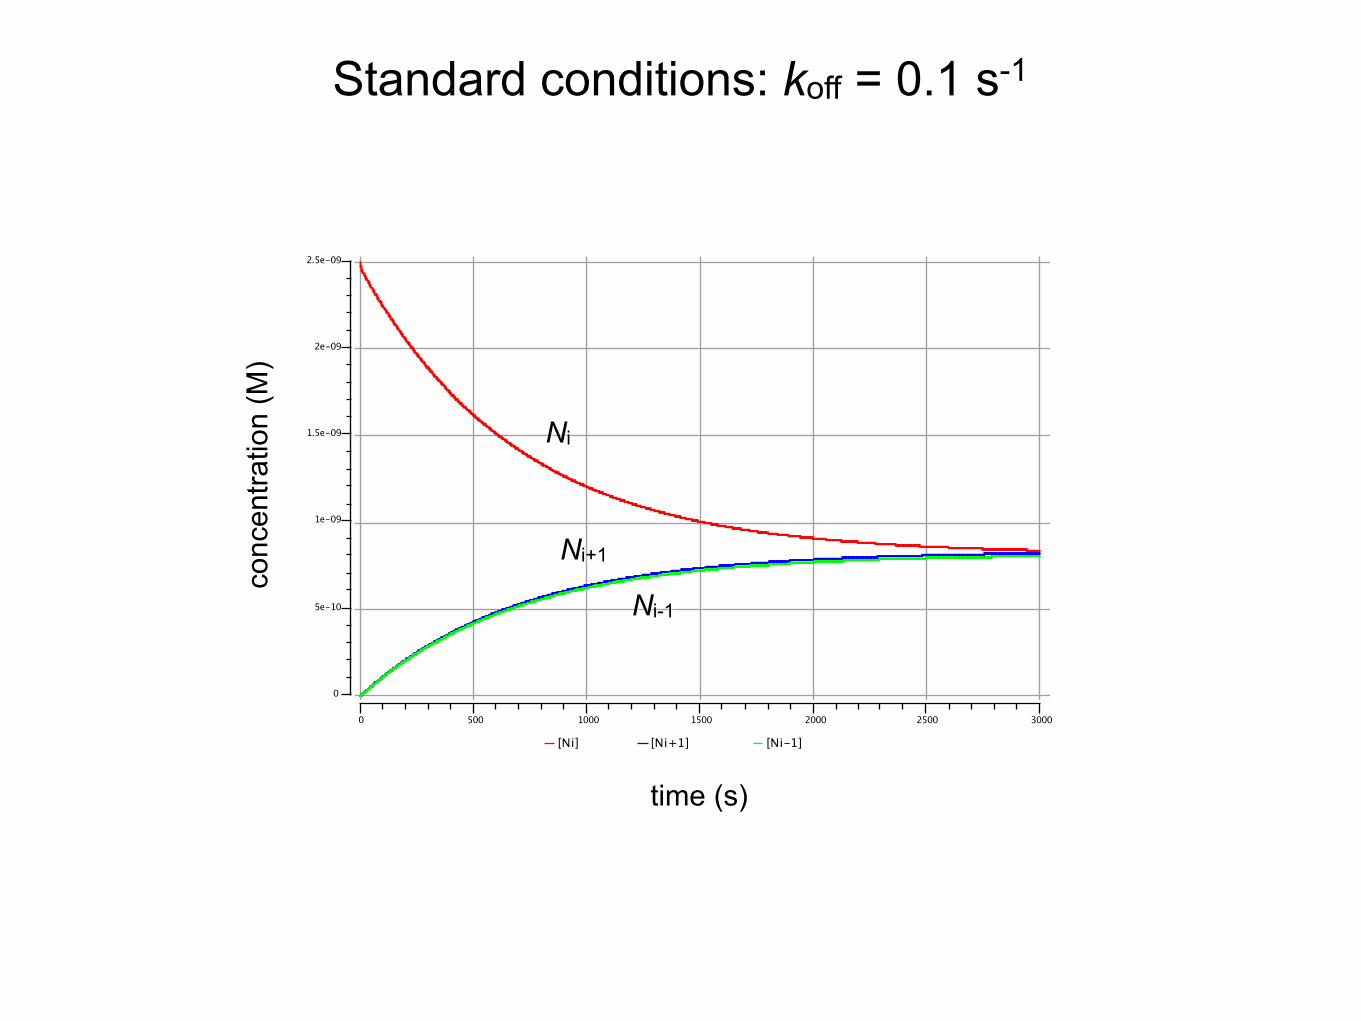
Standard conditions: koff = 0.1 s-1
time (s)
conc
entra
tion
(M)
Ni
Ni-1
Ni+1

10x reduced binding affinity at Ni+1: koff,i+1 = 1 s-1
time (s)
conc
entra
tion
(M)
Ni
Ni-1
Ni+1
this works perfect and is beautifully simple
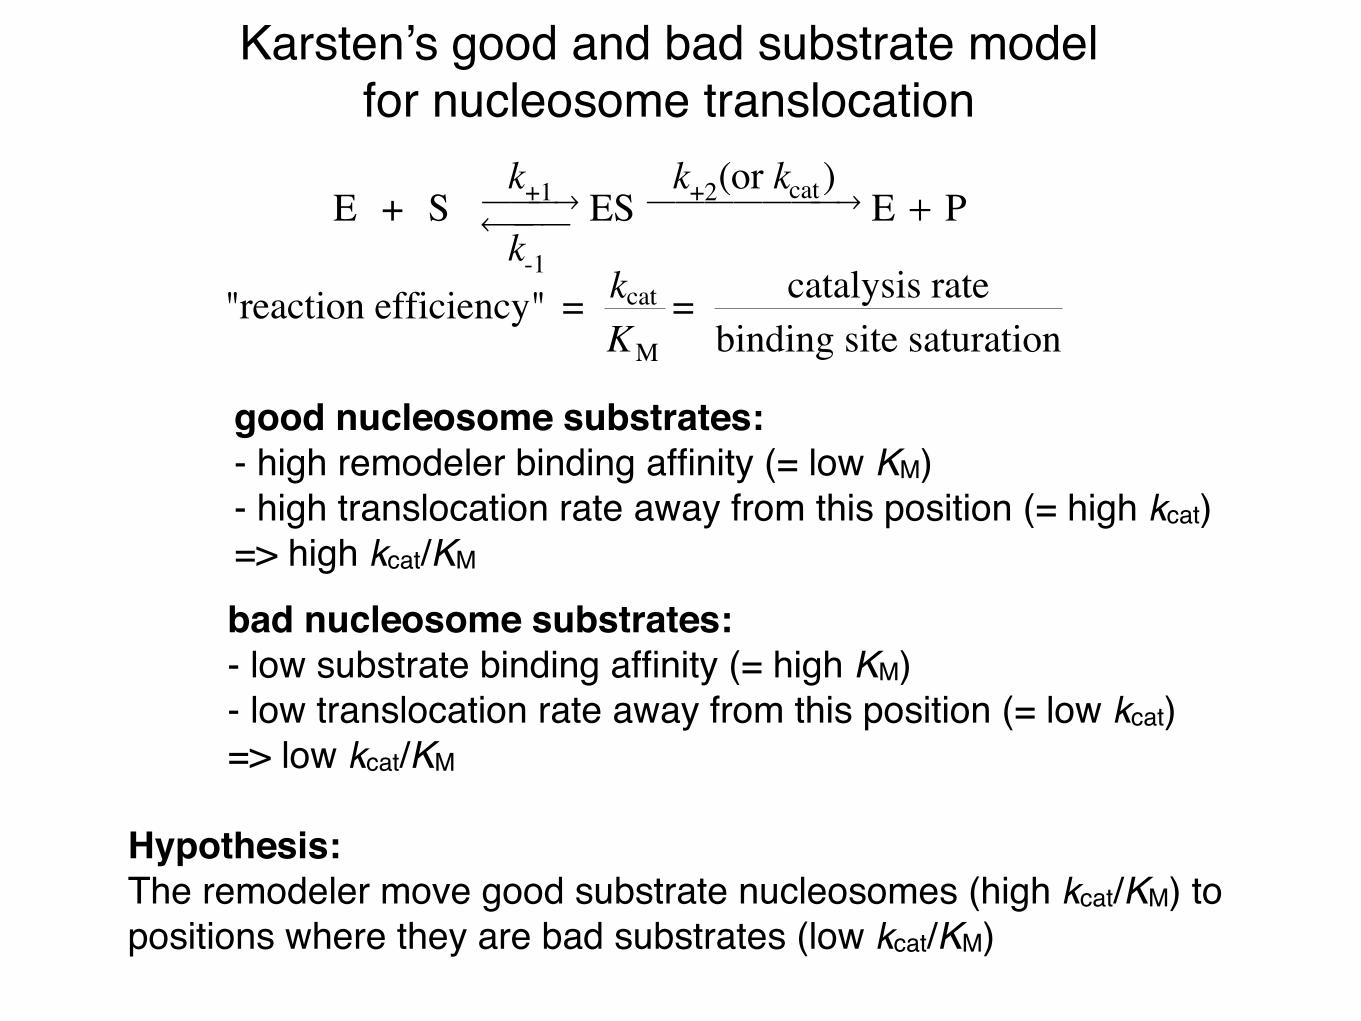
�
E + S k-1
← ⎯ ⎯ ⎯
k+1⎯ → ⎯ ⎯ ES k+2(or kcat )⎯ → ⎯ ⎯ ⎯ ⎯ ⎯ ⎯ E + P
�
"reaction efficiency" = kcat
KM= catalysis rate
binding site saturation
Karsten’s good and bad substrate modelfor nucleosome translocation
good nucleosome substrates:- high remodeler binding affinity (= low KM)- high translocation rate away from this position (= high kcat)=> high kcat/KM
bad nucleosome substrates:- low substrate binding affinity (= high KM)- low translocation rate away from this position (= low kcat)=> low kcat/KM
Hypothesis:The remodeler move good substrate nucleosomes (high kcat/KM) to positions where they are bad substrates (low kcat/KM)
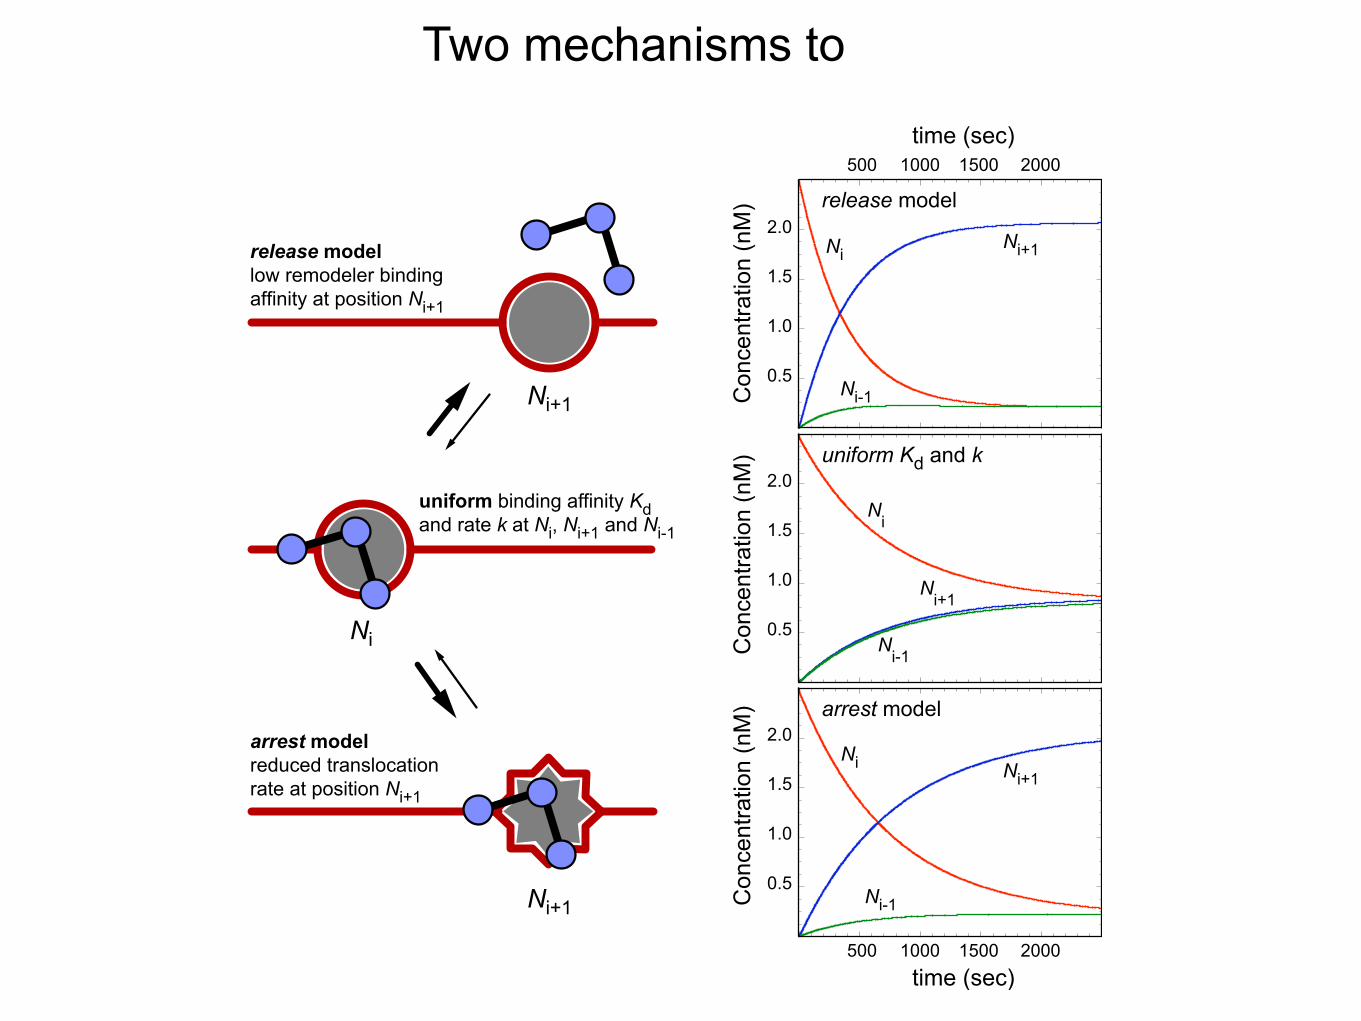
Two mechanisms to
Ni+1
Ni
Ni+1
0.5
1.0
1.5
2.0
0.5
1.0
1.5
2.0
0.5
1.0
1.5
2.0
500 1000 1500 2000time (sec)
500 1000 1500 2000time (sec)
Ni+1
Ni
Ni-1
release model
Con
cent
ratio
n (n
M)
Con
cent
ratio
n (n
M)
Con
cent
ratio
n (n
M) arrest model
uniform binding affinity Kdand rate k at Ni, Ni+1 and Ni-1
release modellow remodeler bindingaffinity at position Ni+1
arrest modelreduced translocationrate at position Ni+1
uniform Kd and k
Ni+1
Ni-1
Ni
Ni+1
Ni-1
Ni
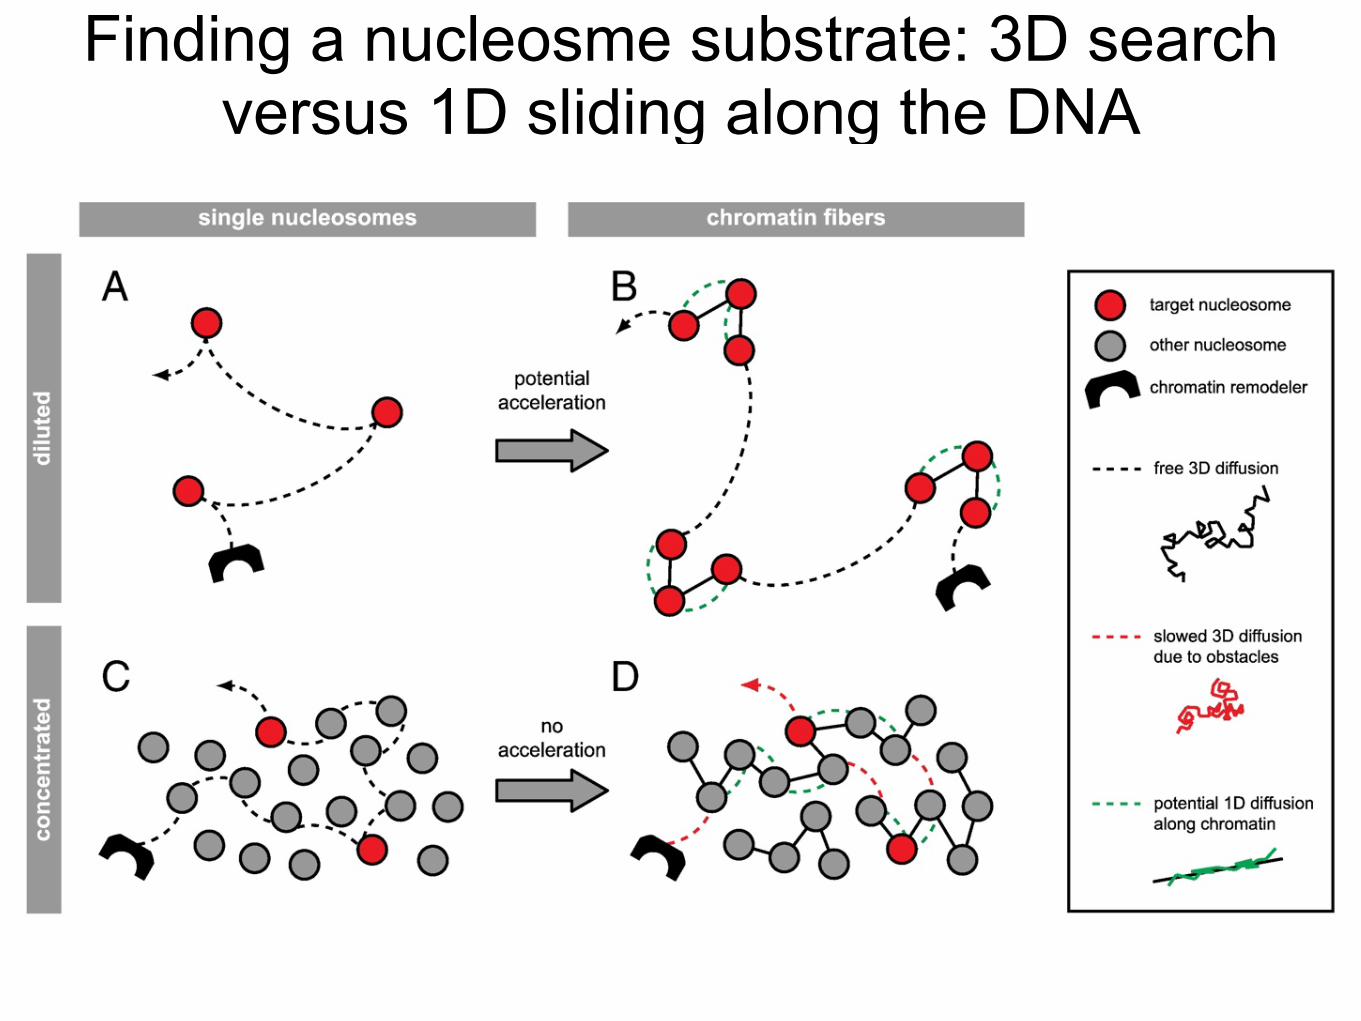
Finding a nucleosme substrate: 3D search versus 1D sliding along the DNA