intelligent transport system - tmt.or.jp · intelligent transport system japan traffic management...
TRANSCRIPT
Japan Traffic Management Technology AssociationInstitute of Urban Traffic Research
Intel l igent Transport System

Intel l igent Transport System
Japan Traffic Management Technology AssociationInstitute of Urban Traffic Research
Current Road Traffic Conditions And Systems
1━1 Current Road Traffic Conditions .................2
1━2 Conditions of Traffic Accidents ..................4
1━3 Traffic Administration System ....................6
1━4 Traffic Police Organization ..........................8
1━5 Budget for Traffic Police ............................10
Traffic Management and Control by Police
2━1 Traffic Management and Control by Police .....12
2━2 Traffic Flow Management ..........................14
2━3 Community Zone ........................................15
What is community zone
Methods of community zone
(1)Software
(2)Hardware
2━4 Transportation Demand Management ......16
Meaning of transportation demand management
Main Measures of Transportation Demand Management
2━5 Road Pricing ...............................................18
Meaning of road pricing
Road pricing system
Problems in road pricing
TOPICS:Examples overseas
2━6 Traffic Information andTraffic Management & Control ..................19
Traffic administration by the police
3━1 Traffic guidance and law enforcement .....20
Tightening of crackdown on violations that aremalicious,dangerous and troublesome to others.
Effective promotion of crackdown on illegal parking
Promote measures against motorcycle gangs and hot rodders
3━2 Analysis of traffic accidents ......................22
Advanced analysis of traffic accidents
Traffic Accident Research and Analysis Center
3━3 Judicial Investigation of Traffic Accidents ...24
Simplification of judicial investigation of traffic accidents
Investigation of hit-and-run cases
Investigation of special traffic cases
3━4 Traffic Safety Education ............................26
Guide on traffic safety education
National Traffic Safety Campaign and Traffic Safety Education
Traffic safety education for the so-called "traffic vulnerable group"
Driver education
3━5 Drivers Management ..................................28
(1) Driver's license examination
(2) Renewal of a driver's license
(3) Administrative disposition on driver's license
(4) Drivers management system
(5) Driver education
(6) Measures against wrongful foreign drivers in Japan
Transport systems and Society
4━1 Environmental problems and Traffic police ....30
4━2 Aging Society and Japan Traffic Police ...32
4━3 Economic activities and Traffic police .....34
4━4 Traffic management in disasters ..............36
4
3
2
1
3
2
1
2
1
3
2
1
3
2
1
2
1
2
1
Policy section
Theory of traffic management
5━1 Mechanism of traffic congestion ..............38
5━2 Traffic flow simulation ...............................39
Traffic Management and Control System
1━1 Traffic Control Center ................................42
(1) System structure
(2)Information collecting sub-system
(3) Signal control sub-system
(4) Information supply sub-system
(5) Operation management sub-system
1━2 Information Collection Equipment ............44
(1) Ultrasonic vehicle detectors
(2) Infrared vehicle detectors (optical beacons)
(3) Radar vehicle detectors
(4) Image processing vehicle detectors
(5) Bus detectors
(6) Travel time measuring (AVI) terminals
(7) CCTV cameras
1━3 Signal Control Equipment .........................46
Site control
(1)Multistage signal controllers
(2) Push-button signal controllers
(3) Traffic Actuated Control
(a) Semi-actuated signal controllers
(b) Full-actuated signal controllers
(c) Traffic actuated signal controllers for right-hand turns
(d) Signal controllers for semi-actuatedcontrol during slack hours
(e) Speed traffic actuated signal controllers
1━4 History of traffic signals ............................50
Development of traffic signals
Number of traffic signals
1━5 Signal Control Method ...............................52
Phase
Clearance period
(1) Amber signal display
(2) Red signal display at both sides
Three factors in signal controlling
(1) Cycle
(2) Split
(3) Offset
1━6 TOPICS:Pedestrian-friendly Control .........54
Sensor actuated control for the elderly and the disabled
Sensor actuated control for pedestrians
Display of pedestrians' waiting time
Audible signals
Audible accessories for pedestrian signals
1━7 Link Coordination Control .........................56
Traffic control method for road line
Multistage link coordination control
Link actuated system control
1━8 Area (Wide-area) Control ...........................58
Area traffic control sequence1
3
2
1
5
4
3
2
1
3
2
1
2
1
1
Technology section
Area traffic control method
(a) Combination and splitting of subareas
(b) Subarea control suitable for traffic conditions
1━9 Information Supply Unit InformationBoards and Other Devices .........................60
Information Supply Unit
Types
(1) Information boards
(2) Roadside radio transmitters
(3) Traffic information service via telephone and fax
(4) Information terminals
(5) Vehicle Information and Communication System (VICS)
Information to be supplied
1━10 Effects of the Traffic Control System .......62
The Traffic Control System
Traffic Control System Equipment
How the Traffic Control System Works
Effects in Detail
Aims
1━11 Parking Guidance Systems .....................64
Parking Guidance Systems
Parking Guidance System Equipment
Effects
1━12 Illegal Parking Deterrence System ..........66
Illegal Parking Deterrence System
Effects
Expected Developments
1━13 High-speed Driving Deterrence System ....68
High-speed Driving Deterrence System
Effects
Expected Developments
1━14 Oncoming Traffic Indication System ......70
Oncoming Traffic Indication System
Effects
Number of Units Installed
1━15 Centerline Shifting System ......................72
Centerline Shifting System
Effects
Changes in Lane Usage
Reversing Lane Directions
Universal Traffic Management Systems
2━1 UTMS21 .......................................................74
2━2 ITS (Intelligent Transport System) ............76
2━3 System architecture ...................................78
2━4 Infrared Beacons ........................................80
2━5 International standardization ....................82
2━6 Integrated Traffic Control Systems (ITCS) ...84
2━7 TOPICS:MODERATO ..................................86
2━8 Advanced Mobile Information Systems ...88
Advanced Mobile Information Systems
Information Supply Means
Relationships between AMIS and VICS
2━9 VICS .............................................................90
VICS Overview
Three Media2
1
3
2
1
4
3
2
1
3
2
1
3
2
1
3
2
1
3
2
1
5
4
3
2
1
3
2
1
2
VICS Information Service Areas
The Number of Installed Infrared Beacons
2━10 Public Transportation Priority Systems ....92
Public Transportation Priority Systems
Systems Overview
Advantages of PTPS
Actual Installation Cases
2━11 Examples of Public TransportationPriority Systems .......................................94
Overview
Service Types
Effects
Introduction to Other Areas
2━12 Mobile Operation Control Systems .........96
Mobile Operation Control Systems
System Overview
Advantages of MOCS
Actual Cases of Installation
2━13 Dynamic Route Guidance Systems ........98
Dynamic Route Guidance Systems
Differences between Different Types of VehicleNavigation Systems
Actual Cases of Installation
2━14 Demonstration Test of Dynamic Route Guidance Systems ......................100
Overview
(1) First demonstration test (End of October 1996)
(2) Second demonstration test (End of February 1997)
(3) Third demonstration test (End of March 1998)
Test Results
Expected Developments
2━15 Environmental ProtectionManagement Systems (EPMS) ..............102
2━16 TOPICS:Verification Test of EPMS .......104
2━17 Information Collection Equipment ........106
Examples of Driving Safety Support Systems
(1) Crossing collision warning system
(2) Right-turning accident prevention system
(3) Hazardous zone avoidance control system
(4) Pedestrian support system
Pedestrian safety support system
2━18 Help System for Emergency Life Saving and Public Safety (HELP) .........108
2━19 Emergency Communication Systemin Europe and America ..........................110
2━20 Intelligent Integrated ITV Systems ........112
TOPICS:Intelligent Illegal Parking Deterrence System
2━21 UTMS in Nagano .....................................114
Introduction of UTMS in Nagano
Overview of UTMS in Nagano
(1) Signal control (ITCS and PTPS)
(2) Traffic information supply (AMIS, DRGS, and PTPS)
2━22 Nagano Winter Olympic Games Traffic Measures .116
Traffic measures for Nagano Winter Olympic Games
Total traffic volume control
To ensure the smooth operation of the official vehiclesof the Games by setting up traffic restrictions
Effects of traffic measures
2━23 Deployment of Optical (Infrared Ray)Communication Technology .................118
4
3
2
1
2
1
2
1
3
2
1
3
2
1
4
3
2
1
4
3
2
1
4
3
2
1
4
3

1
●Current Road Traffic Conditions And Systems
●Traffic Management and Control by Police
●Traffic administration by the police
●Transport systems and Society
●Theory of traffic management
Current Road Traffic Conditions
2
Current Road Traffic Conditions And Systems 1━1
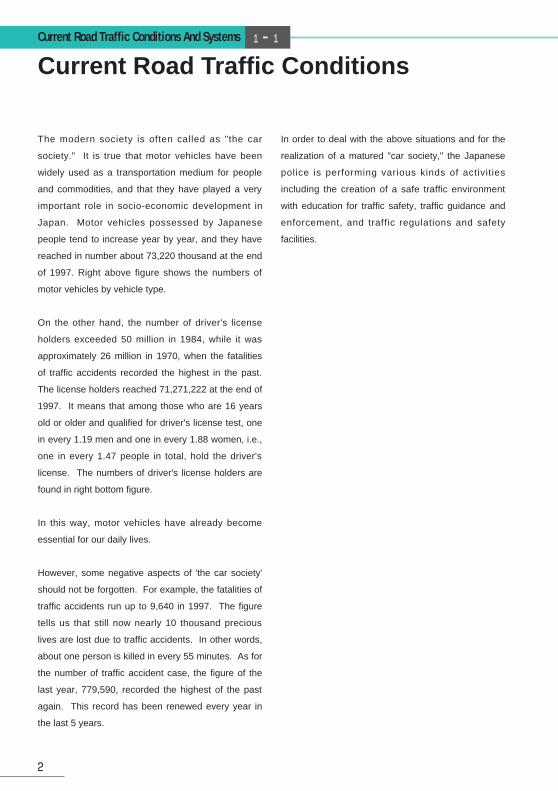
The modern society is often called as "the car
society." It is true that motor vehicles have been
widely used as a transportation medium for people
and commodities, and that they have played a very
important role in socio-economic development in
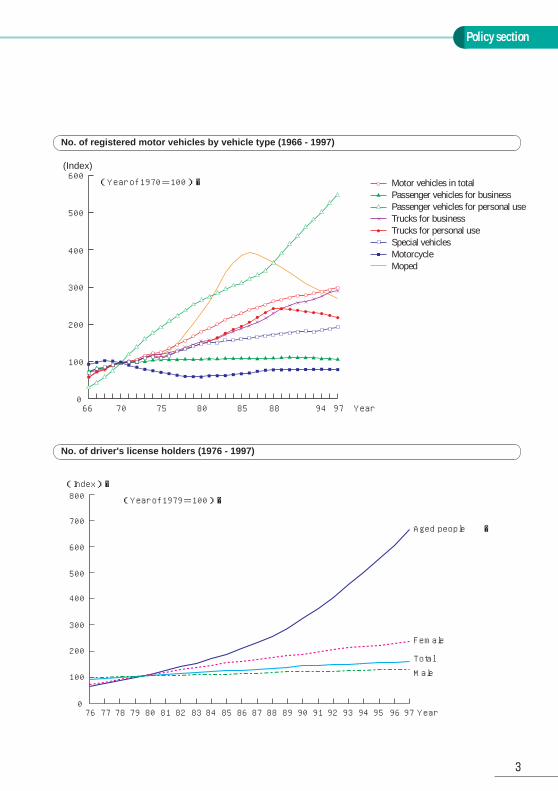
Japan. Motor vehicles possessed by Japanese
people tend to increase year by year, and they have
reached in number about 73,220 thousand at the end
of 1997. Right above figure shows the numbers of
motor vehicles by vehicle type.
On the other hand, the number of driver's license
holders exceeded 50 million in 1984, while it was
approximately 26 million in 1970, when the fatalities
of traffic accidents recorded the highest in the past.
The license holders reached 71,271,222 at the end of
1997. It means that among those who are 16 years
old or older and qualified for driver's license test, one
in every 1.19 men and one in every 1.88 women, i.e.,
one in every 1.47 people in total, hold the driver's
license. The numbers of driver's license holders are
found in right bottom figure.
In this way, motor vehicles have already become
essential for our daily lives.
However, some negative aspects of 'the car society'
should not be forgotten. For example, the fatalities of
traffic accidents run up to 9,640 in 1997. The figure
tells us that still now nearly 10 thousand precious
lives are lost due to traffic accidents. In other words,
about one person is killed in every 55 minutes. As for
the number of traffic accident case, the figure of the
last year, 779,590, recorded the highest of the past
again. This record has been renewed every year in
the last 5 years.
In order to deal with the above situations and for the
realization of a matured "car society," the Japanese
police is performing various kinds of activities
including the creation of a safe traffic environment
with education for traffic safety, traffic guidance and
enforcement, and traffic regulations and safety
facilities.
Policy section
3
No. of driver's license holders (1976 - 1997)
No. of registered motor vehicles by vehicle type (1966 - 1997)
66 70 75
100
0
200
300
400
500
600
80 85 88 94 97 Year
(Index)
(Year of 1970=100)� Motor vehicles in totalPassenger vehicles for businessPassenger vehicles for personal useTrucks for businessTrucks for personal useSpecial vehiclesMotorcycleMoped
79787776
100
0
200
300
400
700
500
600
800
80 81 82 83 84 85 86 87 88 89 9493929190 95 96 97 Year
(Index)�
(Year of 1979=100)�
Aged people �
Female
Total
Male
Conditions of Traffic Accidents
4
Current Road Traffic Conditions And Systems 1━2
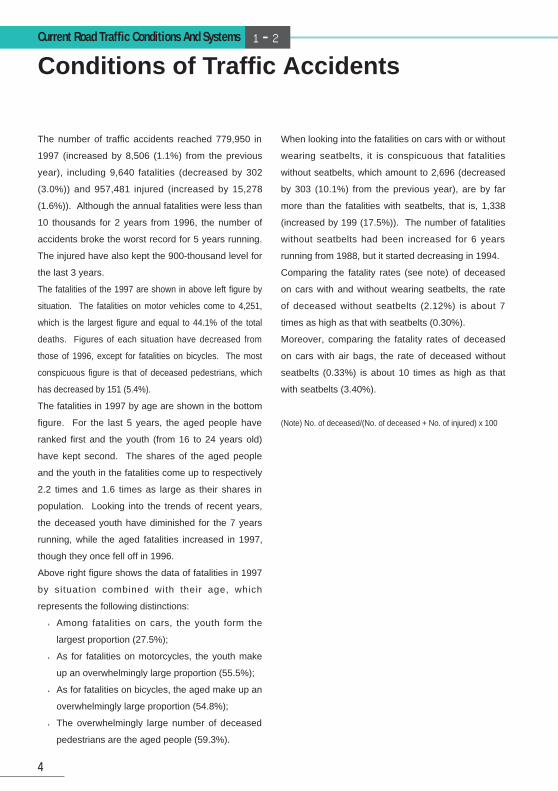
The number of traffic accidents reached 779,950 in
1997 (increased by 8,506 (1.1%) from the previous
year), including 9,640 fatalities (decreased by 302
(3.0%)) and 957,481 injured (increased by 15,278
(1.6%)). Although the annual fatalities were less than
10 thousands for 2 years from 1996, the number of
accidents broke the worst record for 5 years running.
The injured have also kept the 900-thousand level for
the last 3 years.
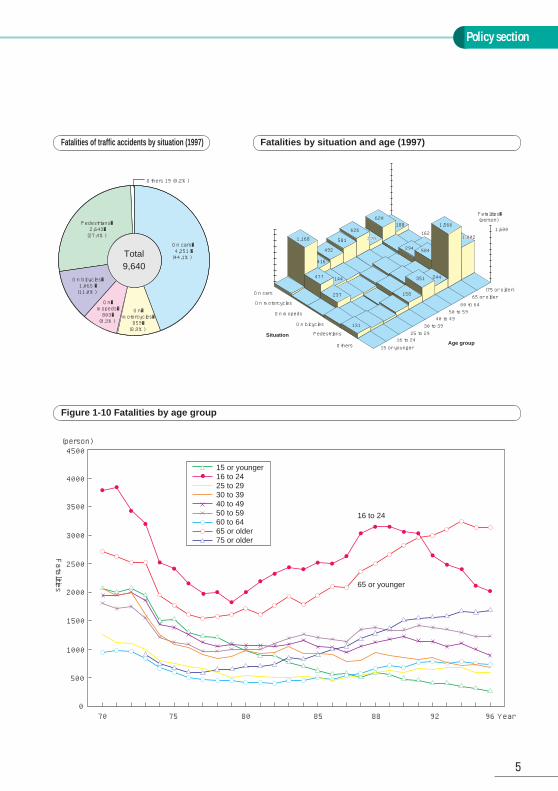
The fatalities of the 1997 are shown in above left figure by
situation. The fatalities on motor vehicles come to 4,251,
which is the largest figure and equal to 44.1% of the total
deaths. Figures of each situation have decreased from
those of 1996, except for fatalities on bicycles. The most
conspicuous figure is that of deceased pedestrians, which
has decreased by 151 (5.4%).
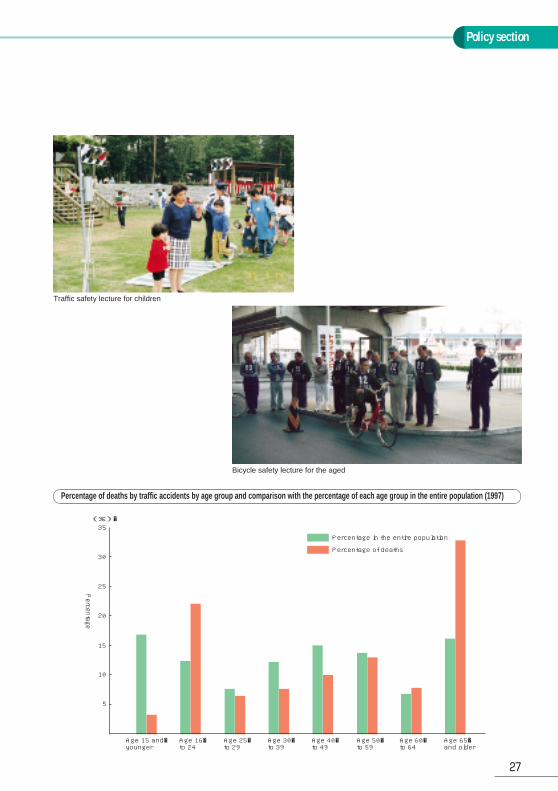
The fatalities in 1997 by age are shown in the bottom
figure. For the last 5 years, the aged people have
ranked first and the youth (from 16 to 24 years old)
have kept second. The shares of the aged people
and the youth in the fatalities come up to respectively
2.2 times and 1.6 times as large as their shares in
population. Looking into the trends of recent years,
the deceased youth have diminished for the 7 years
running, while the aged fatalities increased in 1997,
though they once fell off in 1996.
Above right figure shows the data of fatalities in 1997
by situation combined with their age, which
represents the following distinctions:
●Among fatalities on cars, the youth form the
largest proportion (27.5%);
●As for fatalities on motorcycles, the youth make
up an overwhelmingly large proportion (55.5%);
●As for fatalities on bicycles, the aged make up an
overwhelmingly large proportion (54.8%);
●The overwhelmingly large number of deceased
pedestrians are the aged people (59.3%).
When looking into the fatalities on cars with or without
wearing seatbelts, it is conspicuous that fatalities
without seatbelts, which amount to 2,696 (decreased
by 303 (10.1%) from the previous year), are by far
more than the fatalities with seatbelts, that is, 1,338
(increased by 199 (17.5%)). The number of fatalities
without seatbelts had been increased for 6 years
running from 1988, but it started decreasing in 1994.
Comparing the fatality rates (see note) of deceased
on cars with and without wearing seatbelts, the rate
of deceased without seatbelts (2.12%) is about 7
times as high as that with seatbelts (0.30%).
Moreover, comparing the fatality rates of deceased
on cars with air bags, the rate of deceased without
seatbelts (0.33%) is about 10 times as high as that
with seatbelts (3.40%).
(Note) No. of deceased/(No. of deceased + No. of injured) x 100
Policy section
5
Fatalities of traffic accidents by situation (1997)
Figure 1-10 Fatalities by age group
Fatalities by situation and age (1997)
Others 19 (0.2%)
On cars� 4,251 �(44.1%)Total
9,640On bicycles�1,065 �(11.0%)
On�mopeds�803�(8.3%)
On�motorcycles�859�(8.9%)
Pedestrians� 2,643� (27.4%)
On cars
On motorcycles
Others
On mopeds
On bicycles
PedestriansSituation
Age group15 or younger
65 or older (75 or older)
16 to 2425 to 29
30 to 3940 to 49
50 to 5960 to 64
Fatalities�(person)
1,600
1,168
1,566
1,0021,002
477
237
131
144
416
492
581
626
620188
294
351
158
584
244
162278278
4500
4000
3500
3000
2500
2000
1500
1000
500
0
(person)
70 75 80 85 88 92 96 Year
15 or younger16 to 2425 to 2930 to 3940 to 4950 to 5960 to 6465 or older75 or older
Fatalities
16 to 24
65 or younger
Traffic Administration System
6
Current Road Traffic Conditions And Systems 1━3
Traffic administration in a broad sense in this country
is under the charge of several administrative
agencies. Road traffic consists of three elements,
"people," "roads," and "vehicles." The road
administrators such as the Ministry of Construction
take charge of building a part of hardware, the road,
and the Ministry of Transport takes the responsibility
of controlling another part of hardware, the vehicles,
while, the police manages software, that is, the road
traffic including 'people,' 'vehicles,' and 'roads.'
As for building roads that is under the charge of road
administrators, the Ministry of Construction and local
governments, the Ministry of Construction takes
responsibil i ty for it under the Road Law and
determines the criteria of road structures and fixes
the standard on permissible size and weight of
vehicles to go through the road. Meanwhile, each
road administrator constructs, maintains and
manages roads.
Management of the vehicles themselves, which is
under the charge of the Ministry of Transport,
includes administration concerning the body of
vehicles, such as technical standards for safety of
vehicles, vehicle registration and insurance. In
addition to that, the Ministry of Transport is in charge
of authorization to give approvals and permissions of
road transportation business l ike passenger
transportation by buses or taxis and cargo
transportation by trucks.
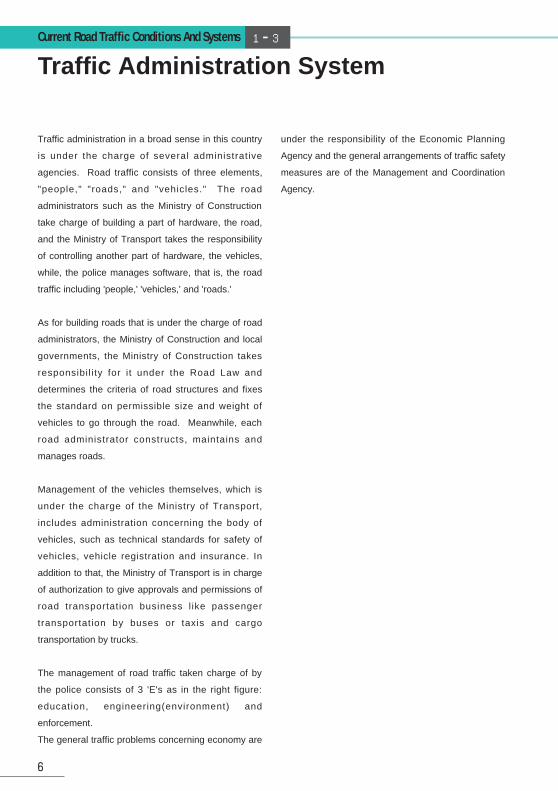
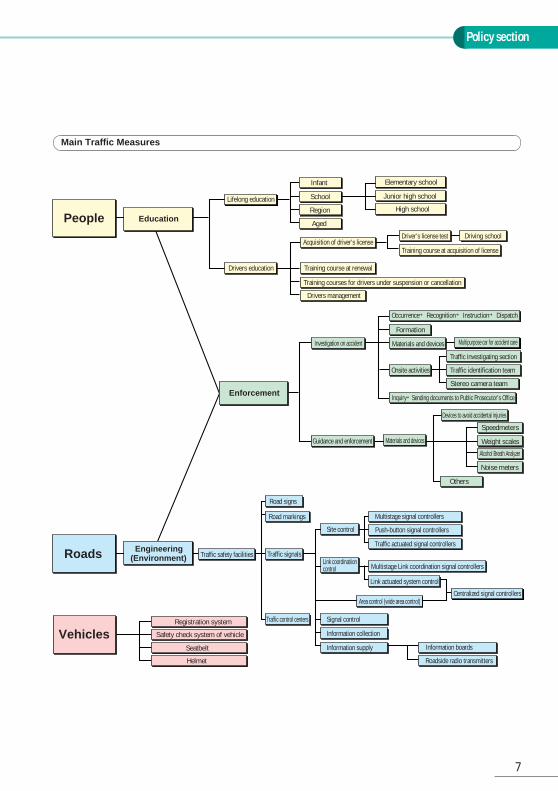
The management of road traffic taken charge of by
the police consists of 3 'E's as in the right figure:
education, engineering(environment) and
enforcement.
The general traffic problems concerning economy are
under the responsibility of the Economic Planning
Agency and the general arrangements of traffic safety
measures are of the Management and Coordination
Agency.
Policy section
7
People Education
Roads
Vehicles
Enforcement
Engineering(Environment)
Registration system
Safety check system of vehicle
Seatbelt
Helmet
Traffic safety facilities
Traffic control centers
Traffic signals
Road markings
Signal control
Information collection
Information supply
Link coordinatiioncontrol
Site control
Area control (wide area control)
Road signs
Information boards
Roadside radio transmitters
Multistage signal controllers
Multistage Link coordination signal controllers
Traffic actuated signal controllers
Push-button signal controllers
Link actuated system control
Centralized signal controllers
Guidance and enforcement Materials and devices
Materials and devices
Others
Inquiry→Sending documents to Public Prosecutor's Office
Devices to avoid accidental injuries
Speedmeters
Weight scales
Alcohol Breath Analyzer
Noise meters
Investigation on accident
Occurrence→Recognition→Instruction→Dispatch
Formation
Onsite activities
Multipurpose car for accident care
Traffic identification team
Traffic investigating section
Stereo camera team
Lifelong education
Drivers education
Infant
School
Region
Aged
Acquisition of driver's license
Training course at renewal
Training courses for drivers under suspension or cancellation
Drivers management
Elementary school
Junior high school
High school
Driver's license test
Training course at acquisition of license
Driving school
Main Traffic Measures
Traffic Police Organization
8
Current Road Traffic Conditions And Systems 1━4
The Japanese police organization is formed by local
police organizations and the National Police Agency.
Local police organizations are organized in each
prefecture for pursuing the duties of police, that is, to
protect personal life, body and property and to
maintain public safety and order. Under the
administration of the Public Safety Commission,
which is under the control of the Prime Minister, the
National Police Agency was established as the
national agency to direct and supervise the local
police headquarters within the scope of its official
capacity. Furthermore, 7 Regional Police Bureaus
operate as its local branch offices.
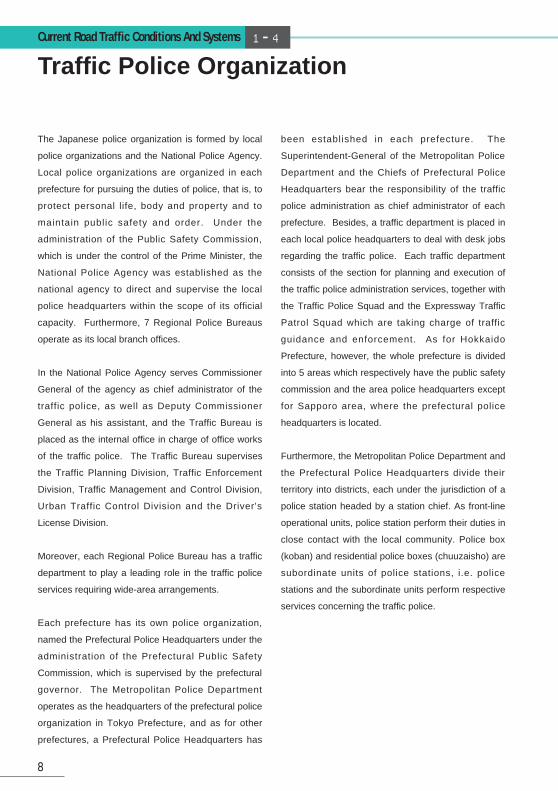
In the National Police Agency serves Commissioner
General of the agency as chief administrator of the
traffic police, as well as Deputy Commissioner
General as his assistant, and the Traffic Bureau is
placed as the internal office in charge of office works
of the traffic police. The Traffic Bureau supervises
the Traffic Planning Division, Traffic Enforcement
Division, Traffic Management and Control Division,
Urban Traffic Control Division and the Driver's
License Division.
Moreover, each Regional Police Bureau has a traffic
department to play a leading role in the traffic police
services requiring wide-area arrangements.
Each prefecture has its own police organization,
named the Prefectural Police Headquarters under the
administration of the Prefectural Public Safety
Commission, which is supervised by the prefectural
governor. The Metropolitan Police Department
operates as the headquarters of the prefectural police
organization in Tokyo Prefecture, and as for other
prefectures, a Prefectural Police Headquarters has
been established in each prefecture. The
Superintendent-General of the Metropolitan Police
Department and the Chiefs of Prefectural Police
Headquarters bear the responsibility of the traffic
police administration as chief administrator of each
prefecture. Besides, a traffic department is placed in
each local police headquarters to deal with desk jobs
regarding the traffic police. Each traffic department
consists of the section for planning and execution of
the traffic police administration services, together with
the Traffic Police Squad and the Expressway Traffic
Patrol Squad which are taking charge of traffic
guidance and enforcement. As for Hokkaido
Prefecture, however, the whole prefecture is divided
into 5 areas which respectively have the public safety
commission and the area police headquarters except
for Sapporo area, where the prefectural police
headquarters is located.
Furthermore, the Metropolitan Police Department and
the Prefectural Police Headquarters divide their
territory into districts, each under the jurisdiction of a
police station headed by a station chief. As front-line
operational units, police station perform their duties in
close contact with the local community. Police box
(koban) and residential police boxes (chuuzaisho) are
subordinate units of police stations, i.e. police
stations and the subordinate units perform respective
services concerning the traffic police.
Policy section
9
National Public Safety Commission
National Police Agency
Commissioner-General's Secretariat
Community Safety Bureau
Criminal Investigation Bureau
Organized Crime Control Department
Traffic Bureau Traffic Planning Division
Traffic Enforcement Division
Traffic Management & Control division
Driver's License Division
Urban Traffic Control Division
Security Bureau
Info-Communication Bureau
(Local Organizations)
Regional Police Bureaus
Traffic Section of Public Safety Department
(Tohoku, Kanto, Chubu, Kinki, Chugoku, Shikoku, Kyushu)
Prefectural Public Safety Commission
Prefectural Police Headquarters
Traffic Department
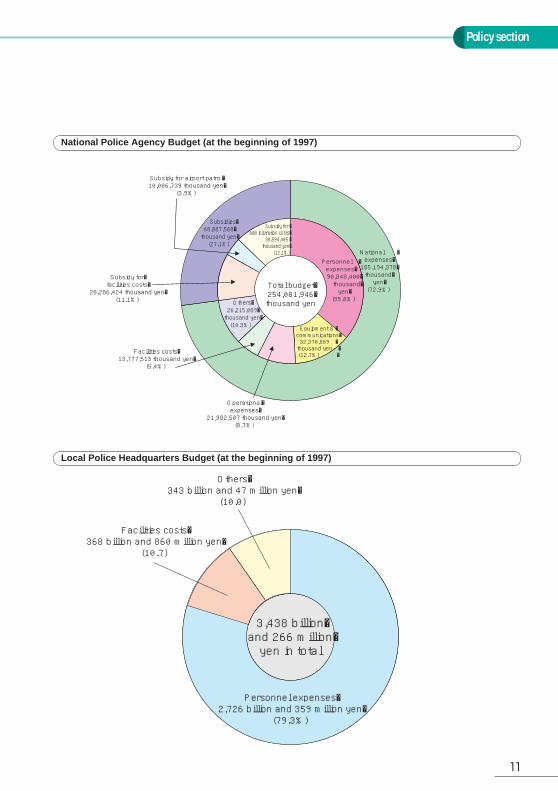
Budget for Traffic Police
10
Current Road Traffic Conditions And Systems 1━5
The budget for the traffic police is composed of the
police budget included in the national budget and the
local police budget included in the prefectural budget.
Expenses for local police organizations are imposed
in principle on prefectural governments, but a certain
kind of expenses are paid from the national budget.
The national budget allotted to the traffic police is
used for the police vehicles purchased by local police
organizations to utilize for the traffic police, expenses
for the police school to foster traffic police officers,
special expenses for local police organizations like
some investigations of serious traffic crimes, and
subsidies to local police organizations to execute
programs in accordance with to the Emergency
Measure Law Relating to the Improvement of Traffic
Safety Facilities.
With regard to the establishment of traffic safety
facilities, the Emergency Measure Law Relating to
the Improvement of Traffic Safety Facilities has
clarif ied the national government's duty on
development of countermeasures against traffic
accidents. The national government has made up a
plan of installing the facilities together with local
governments so that they may positively join the
program. Also a subsidy system has been developed
under which the national government offers subsidies
for a part of expenses for such facil i t ies. In
cooperation with the road administrators the Seven-
Year Plan for Traffic Safety Facilities Improvement is
being earnestly promoted since 1996.
The Seven-Year Plan for Traffic Safety Facilities
Improvement consists of the Earmarked Traffic
Safety Facility Improvement Programs whose costs
are partly or wholly borne by the national
government, and the local government's self-
programs for Traffic Safety Facilities. The traffic
police carries out the said Seven-Year Plan with 840
billion yen for seven years, of which 210 billion yen is
covered by the Earmarked Traffic Safety Facility
Improvement Program and the remaining 630 billion
yen by the local governments' self-programs. As for
the Earmarked Traffic Safety Facility Improvement
Program, a half of the expenses are granted to the
local police headquarters as subsidies, which
amounts to 18.413 billion yen in the budget of 1997.
The Universal Traffic Management Systems (UTMS)
being an important part of the Intelligent Transport
System (ITS) are deployed under the budget for the
Earmarked Traffic Safety Facility Improvement
Programs, since the systems need to be deployed
under uniformed functions covering wide-area
throughout Japan and with supply of real time
information. In 1997, approximately 75% of the whole
expenses of the Earmarked Traffic Safety Facility
Improvement Programs are appropriated for
deployment of the UTMS.
Policy section
11
Subsidies�68,887,568�thousand yen�(27.1%)
Subsidy for �administration costs�
30,594,405 �thousand yen�
(12.1%)
Subsidy for airport patrol�10,006,739 thousand yen�
(3.9%)
Personnel �expenses� 90,848,400� thousand� yen� (35.8%)
National �expenses�185,194,378�thousand�yen�(72.9%)
Subsidy for�facilities costs�
28,286,424 thousand yen�(11.1%) Others�
26,215,089�thousand yen�(10.3%)
Facilities costs�13,777,513 thousand yen�
(5.4%)
Operational�expenses�
21,982,507 thousand yen�(8.7%)
Equipment & �communications�32,370,869 �thousand yen �(12.7%) �
Total budget�254,081,946�thousand yen
3,438 billion�and 266 million�yen in total
Others�343 billion and 47 million yen�
(10.0)
Facilities costs�368 billion and 860 million yen�
(10.7)
Personnel expenses�2,726 billion and 359 million yen�
(79.3%)
National Police Agency Budget (at the beginning of 1997)
Local Police Headquarters Budget (at the beginning of 1997)
Traffic Management and Control by Police
12
Traffic Management and Control by Police 2━1
The traffic management and control means to
manage and control the traffic generally with traffic
regulation using signs, markings and signals, supply
of traffic information utilizing the traffic control system,
and permits of use of roads. It is the duty totally
entrusted to the police according to the Road Traffic
Law.
The object of the traffic management and control is,
as stated in the provisions of the Road Traffic Law,
"to avoid dangers on roads, to ensure safe and
smooth traff ic f low and to support preventing
obstacles caused by road traffic." It is not only
aiming to prevent traffic accidents but also to create
smooth traffic flow. The prevention of the so-called
traffic pollution is one of the object as well.
The Road Traffic Law prescribes the authorities of the
police to realize these objectives concerning the
traffic management and control.
First of all, the Prefectural Public Safety Commissions
and the chiefs of the police station have an authority
to carry out traffic regulation, which is to be executed
with traffic signals, road signs, road markings and
onsite instructions by police off icers. Traff ic
regulation shall be executed against a specified
object and within a limited area, a certain section of a
road or a specified place, and it can be carried out at
limited dates or hours.
The traffic information is supplied by the Prefectural
Public Safety Commissions to drivers, and it includes
essential information for vehicles to go through a
road. While the traffic regulation ensures safe and
smooth traffic flow by a forcible power called traffic
enforcement against offenders, the traffic information
supply system aims to ensure the same by
stimulating drivers to select the route voluntarily.
The right to grant permits for using roads for
constructions, street stall and so on rests with the
chief of the police station.
The traffic management and control on national trunk
roads is left within the authority of the National Public
Safety Commission.
As for the traffic regulations at disasters, which
constitutes the exception of the traffic regulations in
normal times, the authority at such times also rests
with the police.
Policy section
13
(1) Traffic regulations by prefectural public safety commissions
(2) Traffic information supply
(3) Permit for using roads
By signals
By road signs and road markings
Onsite instructions by police officers
By chief of the police station or chief of the Expressway Traffic Patrol Squad
By police officers or traffic wardens
Permit for using a road
Permit for entering into the closed road
Permit for parking at no-parking zone
Permit for parking at time-limited parking zone
Permission for releasing restrictions (Permission for carrying load other than fixed equipment, permissionfor carrying people on deck, and permission for loading beyond limits)
Permit for towing beyond limits
Parking Space Certificate
Traffic Flow Management
14
Traffic Management and Control by Police 2━2
Among many duties of traffic management and
control, the most important and difficult task is to
manage and control traffic flow, that is, to manage
and control traffic volume, speed and direction of
traffic flow.
Traffic flow is greatly affected by social demands for
traffic and geographic conditions of roads. Since
motor vehicles continue to increase these days, the
volume of traffic flow has a tendency to grow still the
more, which causes serious social problems such as
traffic jam, noise and car exhaust fumes.
Under these difficult traffic situations, the police
manages and controls traffic flow by applying traffic
regulations with signs, markings and signals as the
base, and by utilizing intelligent systems, especially in
urban areas, such as the general traffic control
system with l ink coordination signal functions
together with traffic control system to supply traffic
information. The adoption of the Universal Traffic
Management Systems (UTMS) to be stated later is a
new challenge focusing on the Advanced Traffic
Control Systems with the key technology of infrared
beacon that enables two-way communications
between motor vehicles and the traffic control
system. With the success at Nagano Olympic as a
turning point, the UTMS have started operations one
after another.
The police also grapples with many other measures
in cooperation with governmental agencies
concerned, in order to ensure smooth traffic flow.
The main measures include the creation of
community zones and the transportation demand
management.
The community zone is created to secure traffic
safety in the living area of the residents by the
cooperation between the police and the road
administrator, applying some traffic regulations such
as maximum speed restrictions and prohibition of
heavy vehicles, and simultaneously adopting physical
measures like creation of humps and narrows.
Transportation demand management includes
recommendation of staggered office hours to the
society through governmental agencies concerned in
order to realize time shifting of traffic demands, and it
also includes the support to public mass
transportation for reducing traffic volume of vehicles
through establishing the PTPS (Public Transportation
Priority Systems), or by creating exclusive or priority
bus lanes.
Policy section
15
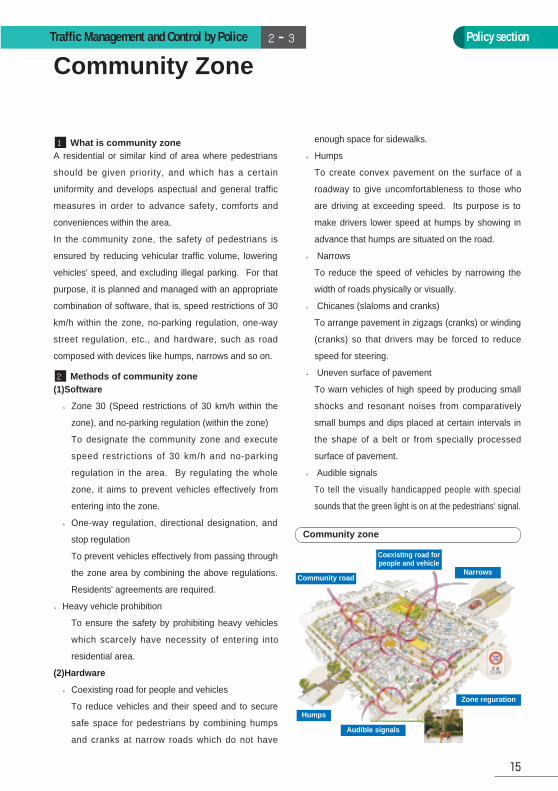
Community ZoneTraffic Management and Control by Police 2━3
A residential or similar kind of area where pedestrians
should be given priority, and which has a certain
uniformity and develops aspectual and general traffic
measures in order to advance safety, comforts and
conveniences within the area.
In the community zone, the safety of pedestrians is
ensured by reducing vehicular traffic volume, lowering
vehicles' speed, and excluding illegal parking. For that
purpose, it is planned and managed with an appropriate
combination of software, that is, speed restrictions of 30
km/h within the zone, no-parking regulation, one-way
street regulation, etc., and hardware, such as road
composed with devices like humps, narrows and so on.
(1)Software
●Zone 30 (Speed restrictions of 30 km/h within the
zone), and no-parking regulation (within the zone)
To designate the community zone and execute
speed restrictions of 30 km/h and no-parking
regulation in the area. By regulating the whole
zone, it aims to prevent vehicles effectively from
entering into the zone.
●One-way regulation, directional designation, and
stop regulation
To prevent vehicles effectively from passing through
the zone area by combining the above regulations.
Residents' agreements are required.
●Heavy vehicle prohibition
To ensure the safety by prohibiting heavy vehicles
which scarcely have necessity of entering into
residential area.
(2)Hardware
●Coexisting road for people and vehicles
To reduce vehicles and their speed and to secure
safe space for pedestrians by combining humps
and cranks at narrow roads which do not have
enough space for sidewalks.
●Humps
To create convex pavement on the surface of a
roadway to give uncomfortableness to those who
are driving at exceeding speed. Its purpose is to
make drivers lower speed at humps by showing in
advance that humps are situated on the road.
● Narrows
To reduce the speed of vehicles by narrowing the
width of roads physically or visually.
● Chicanes (slaloms and cranks)
To arrange pavement in zigzags (cranks) or winding
(cranks) so that drivers may be forced to reduce
speed for steering.
● Uneven surface of pavement
To warn vehicles of high speed by producing small
shocks and resonant noises from comparatively
small bumps and dips placed at certain intervals in
the shape of a belt or from specially processed
surface of pavement.
● Audible signals
To tell the visually handicapped people with special
sounds that the green light is on at the pedestrians' signal.
What is community zone1
Methods of community zone2
Community road
Humps
Audible signals
Zone reguration
Narrows
Coexisting road forpeople and vehicle
Community zone
Transportation Demand Management
16
Traffic Management and Control by Police 2━4
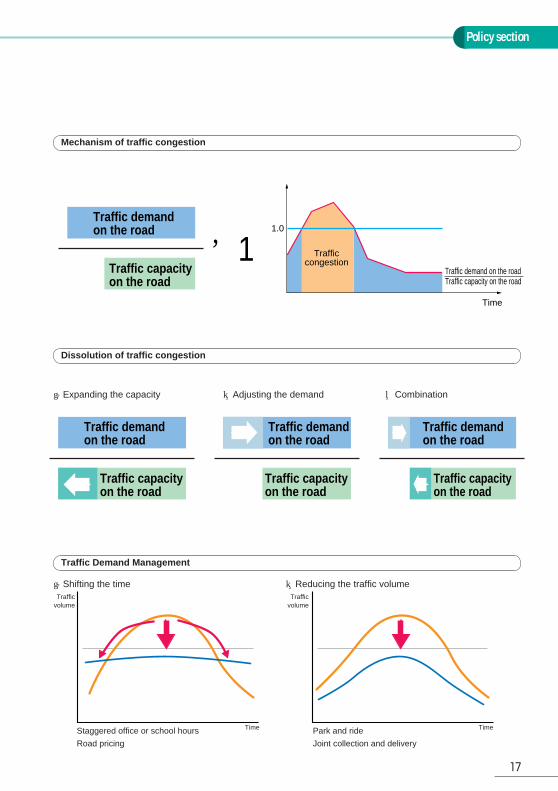
Traffic congestion is a phenomenon generated from
the transportation demand that exceeds the traffic
throughput (capacity) of a road during a certain
period of time. Accordingly, dissolution of a traffic
congestion can be achieved by (1) expanding traffic
throughput of the road or (2) adjusting transportation
demand to the road capacity. The past efforts to
dissolve traffic congestion focused on the method (1).
In other words, they mainly took countermeasures
against bottlenecks by constructing road networks
such as bypasses and ring roads, constructing
multileveled intersections and railroad crossing, and
improving the intersection configuration, as well as
they sought fulfillment and advancement of the traffic
control system.
However, the above method has some problems.
Sometimes it is necessary to acquire a new site, and
in other cases it is not economical to provide a new
facility on roads merely due to a limited hours of
traffic congestion.
Transportation Demand Management (TDM) is a
system to moderate traffic congestion within a city or
a region by stimulating drivers to change their traffic
actions.
●Bus lanes and Public Transportation Priority
Systems (PTPS)
●A scheme to reduce the transportation demand by
giving priority to bus, one of the public mass
transportation media, in order to expand its
convenience and then advance its usage rate.
● Promotion of flextime and staggered office or
school hours
A scheme to shift the time period of commuters'
transportation in the whole area so that the peak of
the morning rush-hour traffic congestion caused by
the concentrated transportation demand may be
moderated.
●Park and ride
A scheme to lessen the total number of motor
vehicles by creating parking lots near railroad
stations and bus stops to urge passengers on
private cars or other transport of inefficient carrying
capacity to change to efficient ones, that is, public
mass transportation media such as the bus and the
railway.
●Joint collection and delivery
In accordance with the changing social situations,
attentive services to offer "whatever required at
whenever required" have won popularity, and, as a
result, cargo trucks for collection and delivery have
decreased their carrying eff iciency. It has
produced a situation that a considerable number of
trucks are currently running on the road. This
scheme aims to diminish the number of trucks on
the road by advancing joint collection and delivery
to increase the carrying efficiency of trucks.
●Road pricing
A scheme to charge a toll concerning congested
areas or time periods for promoting utilization of
public mass transportation media and for
moderating the peak of congestion in rush-hours.
●Driving regulations
A scheme to restrict motor vehicles on roads within
the congested area and time period for the purpose
of advancing uti l ization of public mass
transportation media and moderating the peak of
rush-hours congestion. License plate numbers are
sometimes used for such restrictions.
Meaning of transportation demand management1
Main Measures of Transportation Demand Management2
Policy section
17
Mechanism of traffic congestion
Dissolution of traffic congestion
Traffic Demand Management
①Expanding the capacity ②Adjusting the demand
①Shifting the time ②Reducing the traffic volume
③Combination
Staggered office or school hours
Road pricing
Time
Trafficvolume
Time
Trafficvolume
Park and ride
Joint collection and delivery
Traffic demandon the road
Traffic capacityon the road
>1Traffic demand on the road Traffic capacity on the road
Trafficcongestion
Time
1.0
Traffic demandon the road
Traffic capacityon the road
Traffic demandon the road
Traffic capacityon the road
Traffic capacityon the road
Traffic demandon the road
18
Road PricingTraffic Management and Control by Police 2━5
This is one of the methods of TDM, charging tolls on
vehicles on roads within congested areas or time periods,
in order to increase usage of public transportation media or
to moderate the peak of rush-hours congestion. This
measure aims to dissolve traffic congestion by levying tolls
to vehicles entering into a certain area or going along a
specified route, and by pressing those who have little
necessity of using cars in the congested area to use public
mass transportation media like bus or railroad instead. It
also aims at dissolution of traffic congestion by charging
higher tolls during a specified time period of rush-hours and
diversifying the timing of transit.
●Entrance charge system
A system to charge a toll on vehicles entering into a
specified area in order to prevent vehicles from entering
into certain areas such as centers of cities and tourist
towns. (Kamakura City has started a social experiment
of adopting the road pricing system combined with other
methods like the park and ride system.)
●Passerby charge system
A system to charge a toll on vehicles going through a
specified area for reducing the number of vehicles
running within a certain area like centers of cities, etc.
Generally speaking, roads are applied with "the principle of
opening roads free of charge (by the understanding that it
is prescribed that roads are to be constructed by a public
entity and opened to citizens free of charge)." Therefore
the road pricing system which discriminates road users by
collecting tolls is against the major premise of the above
principle. Besides, there is no consensus existing on
fairness, privacy, or the use of collected money.
Meaning of road pricing1
Road pricing system2
Problems in road pricing3
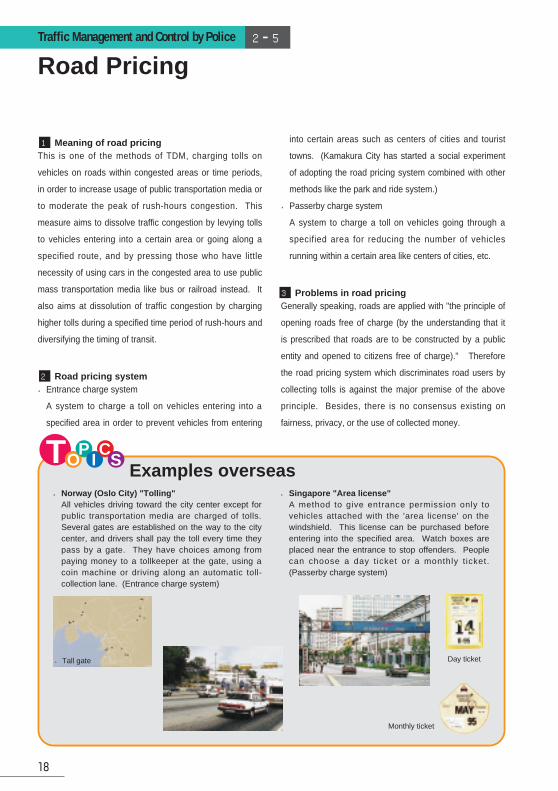
Examples overseasTO
PICS
●Norway (Oslo City) "Tolling"All vehicles driving toward the city center except forpublic transportation media are charged of tolls.Several gates are established on the way to the citycenter, and drivers shall pay the toll every time theypass by a gate. They have choices among frompaying money to a tollkeeper at the gate, using acoin machine or driving along an automatic toll-collection lane. (Entrance charge system)
●Singapore "Area license"A method to give entrance permission only tovehicles attached with the 'area license' on thewindshield. This license can be purchased beforeentering into the specified area. Watch boxes areplaced near the entrance to stop offenders. Peoplecan choose a day ticket or a monthly t icket.(Passerby charge system)
Day ticket
Monthly ticket
●Tall gate
Traffic Information and Traffic Management & Control
Policy sectionTraffic Management and Control by Police 2━6
19
When the police is going to accomplish its duties on
traffic management and control, it is important to
carry out traffic guidance and enforcement on the
base of each traffic regulation, as well as to urge
drivers to disperse the traffic flow voluntarily with their
own judgment by supplying drivers with appropriate
and real-time traffic information at appropriate timing
including traffic jam information. That is why the
traffic information supply to drivers constitutes the
essential method of traffic control, according to the
Road Traffic Law, and it is included in the duties of
the Prefectural Public Safety Commission (hereinafter
stated as the Public Safety Commission). Therefore,
the Public Safety Commission is positively advancing
installation of traffic information collecting equipment
including vehicle detectors, traffic information supply
units including information boards and roadside radio
transmitters in order to do its duty of traff ic
information supply. Furthermore, it is simultaneously
promoting infrared beacons (infrared vehicle detector)
that have both functions of collecting and supplying
traffic information.
As stated above, the Road Traffic Law prescribes that
traffic information shall be supplied by the Public
Safety Commission. If there were plural suppliers of
traffic information, the investment might be made for
twice, which would be a substantial waste of money.
Moreover, inconsistent informations might generate
drivers' confusion. Consequently even on
expressways, where facilities should be installed with
collected tolls from the viewpoint that beneficiaries
should bear the cost, and in case that it is the road
administrator who installs a facility to collect and
supply traff ic information, the Public Safety
Commission must be ensured to collect and supply
traffic information practically by itself in a unified
system, by reflecting its opinions to policies to
establish and operate such facilities, and by receiving
traffic information from the road administrator.
For the purpose of realizing the complete supply of
traffic information and assisting its supply in a unified
system, Juridical Person Japan Road Traff ic
Information Center was established in 1970, and
since then it has played an important role for over a
quarter of a century.
In recent years, private companies are actively
supplying traffic information on the background of
increasing and diversif ied demands for such
information together with development of integrated
communication technologies. However, if the
supplied information or the way of it is inappropriate,
its effects on the traffic flow would be enormous.
Besides that, it may be against the intention of the
Public Safety Commission to supply traff ic
information in a unified system. Accordingly, in the
amendment of the Road Traffic Law in 1997 a
provision was added concerning the duties of traffic
information suppliers. It prescribes that traffic
information suppliers must be careful to support safe
and smooth traffic flow by supplying correct and
appropriate traffic information.
Traffic guidance and law enforcement
20
Traffic administration by the police 3━1
(1) Crackdown is focused on malicious and
dangerous violations of traffic rules, such as
driving without a license, driving while intoxicated,
driving at speeds remarkably exceeding the speed
limits, ignoring traffic signal, overloading, passing
other vehicles recklessly, etc. Another priority of
crackdown is given to vicious cases of violations,
such as obstruction to the operation of buses in
bus lanes.
(2) Guidance and crackdown activities are conducted
in tandem with advertising activit ies for
enlightenment of drivers and passengers, to
increase the use of seat belts. On roads,
policemen aggressively direct drivers and
passengers to use seat belts.
(3)Guidance and crackdown are promoted at
weekends and at nights, when serious accidents,
such as fatal accidents, are increasing, and at
intersections.
The police have tightened crackdown on illegal
parking at intersections of trunk roads, pedestrian
crossings, bus stops, etc. In addition, the police
make efforts to promote effective crackdown by
increasing the use of instruments to stop wheels of
illegally parked vehicles and more strictly applying a
rule to remove forcibly such vehicles and store them
at the certain place. Efforts are made to clarify the
background responsibility of the drivers of illegally
parked vehicles, and to establish various systems,
such as a system to guide drivers to parking lots to
prevent illegal parking, and to warn drivers of illegally
parked vehicles to abandon.
The police promote stricter crackdowns on
motorcycle gangs and hot rodders cruising by giving
them individual guidance and taking into protective
custody. To do so, the police gather information
through activities of all departments of the police and
analyze the current situation of motorcycle gangs and
hot rodders based on the obtained information. In
addition, to make such gang groups disband and
make their members leave such groups, stricter
crackdown is pursued on violations of rules
prohibiting dangerous massive behaviors, lack of
silencers of vehicles, etc. Moreover, to take up
vehicles from motorcycle gangs and hot rodders,
illegally remodeled vehicles are confiscated more
strictly, and efforts are made to clarify the background
responsibility of remodeling workshops that were
involved in illegal remodeling.
Guidance and Law Enforcement are essential part of traffic police activities to establish the order of traffic
and realize a safe and smooth traffic environment. Without the understanding and endorsement of the
people, they could not be conducted effectively.
Therefore, the police devote more efforts to traffic monitoring activity and traffic patrols to prevent violations
of traffic rules. At the same time, the police promote effective guidance and crackdown by focusing on
malicious, dangerous and troublesome cases of violations and taking into account local traffic conditions,
the types and incidence of traffic accidents, and people's demand for crackdown.
Tightening of crackdown on violations that aremalicious, dangerous and troublesome to others.
1
Effective promotion of crackdown on illegal parking2
Promote measures against motorcycle gangsand hot rodders
3
Policy section
21
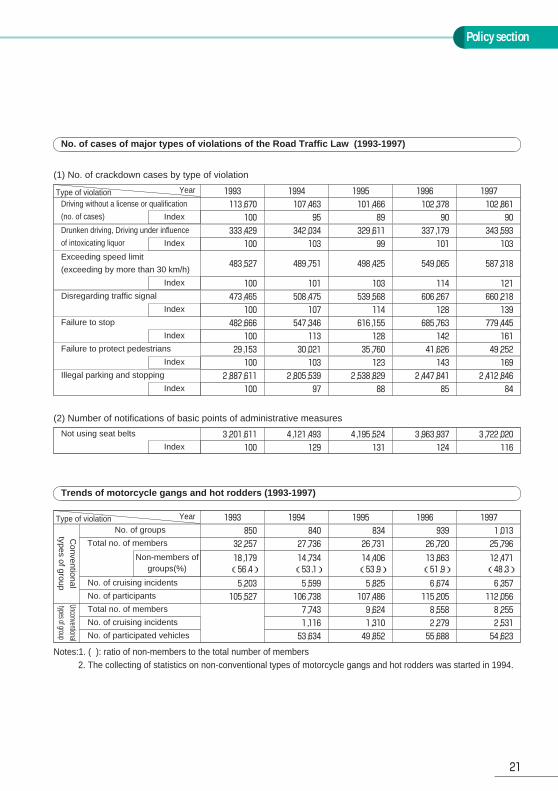
No. of cases of major types of violations of the Road Traffic Law (1993-1997)
(1) No. of crackdown cases by type of violation
(2) Number of notifications of basic points of administrative measures
Notes:1. ( ): ratio of non-members to the total number of members2. The collecting of statistics on non-conventional types of motorcycle gangs and hot rodders was started in 1994.
Trends of motorcycle gangs and hot rodders (1993-1997)
Type of violation Year 1993 1994 1995 1996 1997Driving without a license or qualification
(no. of cases)113,670 107,463 101,466 102,378 102,861
Index 100 95 89 90 90Drunken driving, Driving under influence
of intoxicating liquor333,429 342,034 329,611 337,179 343,593
Index 100 103 99 101 103Exceeding speed limit
(exceeding by more than 30 km/h)483,527 489,751 498,425 549,065 587,318
Index 100 101 103 114 121Disregarding traffic signal 473,465 508,475 539,568 606,267 660,218
Index 100 107 114 128 139Failure to stop 482,666 547,346 616,155 685,763 779,445
Index 100 113 128 142 161Failure to protect pedestrians 29,153 30,021 35,760 41,626 49,252
Index 100 103 123 143 169Illegal parking and stopping 2,887,611 2,805,539 2,538,829 2,447,841 2,412,846
Index 100 97 88 85 84
Not using seat belts 3,201,611 4,121,493 4,195,524 3,963,937 3,722,020Index 100 129 131 124 116
Type of violation Year 1993 1994 1995 1996 1997No. of groups
Conventional
typesofgroup
Unconventionaltypesofgroup
850 840 834 939 1,013Total no. of members 32,257 27,736 26,731 26,720 25,796
Non-members ofgroups(%)
18,179(56.4)
14,734(53.1)
14,406(53.9)
13,863(51.9)
12,471(48.3)
No. of cruising incidents 5,203 5,599 5,825 6,674 6,357No. of participants 105,527 106,738 107,486 115,205 112,056Total no. of members 7,743 9,624 8,558 8,255No. of cruising incidents 1,116 1,310 2,279 2,531No. of participated vehicles 53,634 49,852 55,688 54,623
22
To plan really effective measures for traffic safety
under the current severe traffic conditions, it is very
important to establish a comprehensive investigation
and analysis system for traffic accidents and to make
an accurate analysis of causes of traffic accidents by
sophisticating statistics for traffic accidents.
The police has been working at investigating traffic
accidents from scientific viewpoints and with actual
evidences to identify the facts and causes of
accidents. A traffic accident statistic report is
prepared for each case of traffic accidents to collect
data which are uti l ized to implement effective
preventive measures against traffic accidents. Based
on the collected data, statistic and case analyses are
performed in the daily work.
Moreover, the police started a three-year plan in 1997
to make a database of images such as sketches of
traffic accident scenes in addition to the traditional
integrated database of traffic accidents, for labor-
saving in the documenting of traffic accident statistic
reports and for sophistication of traffic accident
analysis.
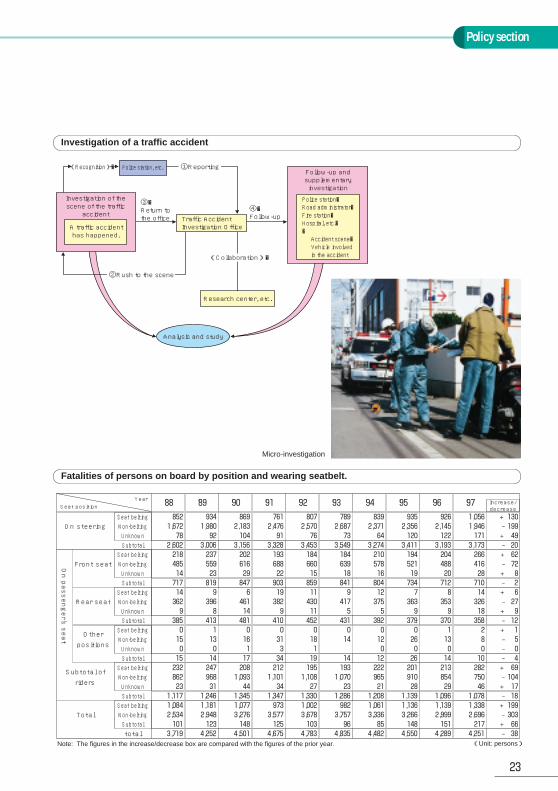
The Traffic Accident Research and Analysis Center
was established on March 5, 1992 under the joint
control of National Police Agency, Ministry of
Transport and Ministry of Construction. Its objectives
are to contribute to traffic safety measures taken by
both the public and private sectors, by establishing a
comprehensive traffic accident analysis system which
can make both the macro- and micro-analysis,
concentrating traffic-related data possessed by
relevant ministries and agencies, and making detail
analysis of each case of traffic accidents.
On July 11, 1992 under the Road Traffic Law, the
Center was designated by the National Public Safety
Commission as an analysis center for traffic accident
investigation which conducts researches and studies
for preventing traffic accidents and for minimizing
damages caused by traffic accidents.
Personnel of the Center go to the scenes of actual
traff ic accidents to make comprehensive and
scientific investigation (micro-investigation) from the
viewpoints of persons, vehicles, roads and
paramedics. During 1997, data for 319 cases of
traffic accidents were collected, totaling to about
1,200 cases since its establishment.
Results of the analysis are provided to the Traffic
Police in developing traffic safety programs and
measures, and are also provided to other traffic-
related agencies and organizations, while paying
attention to the protection of privacy, to promote the
implementation of effective traffic safety measures.
Analysis of traffic accidentsTraffic administration by the police 3━2
Advanced analysis of traffic accidents1
Traffic Accident Research and AnalysisCenter
2
Policy section
23
Police station, etc. ①Reporting
②Rush to the scene
(Collaboration)�
Research center, etc.
Analysis and study
(Recognition)�
Investigation of the scene of the traffic
accident
Follow-up and supplementary investigation
A traffic accident has happened.
Traffic Accident Investigation Office
③�Return to the office
④�Follow-up
Police station�Road administrator�Fire station�Hospital, etc.��Accident scene�Vehicle involved in the accident
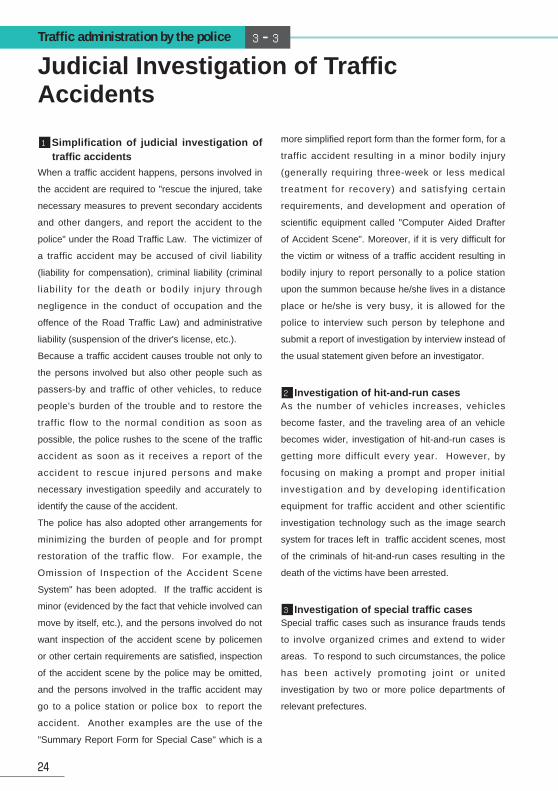
Seat positionYear '88 '89 '90 '91 '92 '93 '94 '95 '96 '97 Increase/
decreaseSeat belting 852 934 869 761 807 789 839 935 926 1,056 + 130
On steering Non-belting 1,672 1,980 2,183 2,476 2,570 2,687 2,371 2,356 2,145 1,946 - 199Unknown 78 92 104 91 76 73 64 120 122 171 + 49Subtotal 2,602 3,006 3,156 3,328 3,453 3,549 3,274 3,411 3,193 3,173 - 20Seat belting 218 237 202 193 184 184 210 194 204 266 + 62
Front seat Non-belting 485 559 616 688 660 639 578 521 488 416 - 72Unknown 14 23 29 22 15 18 16 19 20 28 + 8Subtotal 717 819 847 903 859 841 804 734 712 710 - 2Seat belting 14 9 6 19 11 9 12 7 8 14 + 6
Rear seat Non-belting 362 396 461 382 430 417 375 363 353 326 - 27Unknown 9 8 14 9 11 5 5 9 9 18 + 9Subtotal 385 413 481 410 452 431 392 379 370 358 - 12Seat belting 0 1 0 0 0 0 0 0 1 2 + 1Other
positionsNon-belting 15 13 16 31 18 14 12 26 13 8 - 5Unknown 0 0 1 3 1 0 0 0 0 - 0
Onpassenger'sseat
Subtotal 15 14 17 34 19 14 12 26 14 10 - 4Seat belting 232 247 208 212 195 193 222 201 213 282 + 69Subtotal of
ridersNon-belting 862 968 1,093 1,101 1,108 1,070 965 910 854 750 - 104Unknown 23 31 44 34 27 23 21 28 29 46 + 17Subtotal 1,117 1,246 1,345 1,347 1,330 1,286 1,208 1,139 1,096 1,078 - 18Seat belting 1,084 1,181 1,077 973 1,002 982 1,061 1,136 1,139 1,338 + 199
Total Non-belting 2,534 2,948 3,276 3,577 3,678 3,757 3,336 3,266 2,999 2,696 - 303Subtotal 101 123 148 125 103 96 85 148 151 217 + 66total 3,719 4,252 4.501 4,675 4,783 4,835 4,482 4,550 4,289 4,251 - 38
Note: The figures in the increase/decrease box are compared with the figures of the prior year. (Unit: persons)
Micro-investigation
Investigation of a traffic accident
Fatalities of persons on board by position and wearing seatbelt.
24
Judicial Investigation of TrafficAccidents
Traffic administration by the police 3━3
When a traffic accident happens, persons involved in
the accident are required to "rescue the injured, take
necessary measures to prevent secondary accidents
and other dangers, and report the accident to the
police" under the Road Traffic Law. The victimizer of
a traffic accident may be accused of civil liability
(liability for compensation), criminal liability (criminal
l iabil i ty for the death or bodily injury through
negligence in the conduct of occupation and the
offence of the Road Traffic Law) and administrative
liability (suspension of the driver's license, etc.).
Because a traffic accident causes trouble not only to
the persons involved but also other people such as
passers-by and traffic of other vehicles, to reduce
people's burden of the trouble and to restore the
traffic flow to the normal condition as soon as
possible, the police rushes to the scene of the traffic
accident as soon as it receives a report of the
accident to rescue injured persons and make
necessary investigation speedily and accurately to
identify the cause of the accident.
The police has also adopted other arrangements for
minimizing the burden of people and for prompt
restoration of the traffic flow. For example, the
Omission of Inspection of the Accident Scene
System" has been adopted. If the traffic accident is
minor (evidenced by the fact that vehicle involved can
move by itself, etc.), and the persons involved do not
want inspection of the accident scene by policemen
or other certain requirements are satisfied, inspection
of the accident scene by the police may be omitted,
and the persons involved in the traffic accident may
go to a police station or police box to report the
accident. Another examples are the use of the
"Summary Report Form for Special Case" which is a
more simplified report form than the former form, for a
traffic accident resulting in a minor bodily injury
(generally requiring three-week or less medical
treatment for recovery) and satisfying certain
requirements, and development and operation of
scientific equipment called "Computer Aided Drafter
of Accident Scene". Moreover, if it is very difficult for
the victim or witness of a traffic accident resulting in
bodily injury to report personally to a police station
upon the summon because he/she lives in a distance
place or he/she is very busy, it is allowed for the
police to interview such person by telephone and
submit a report of investigation by interview instead of
the usual statement given before an investigator.
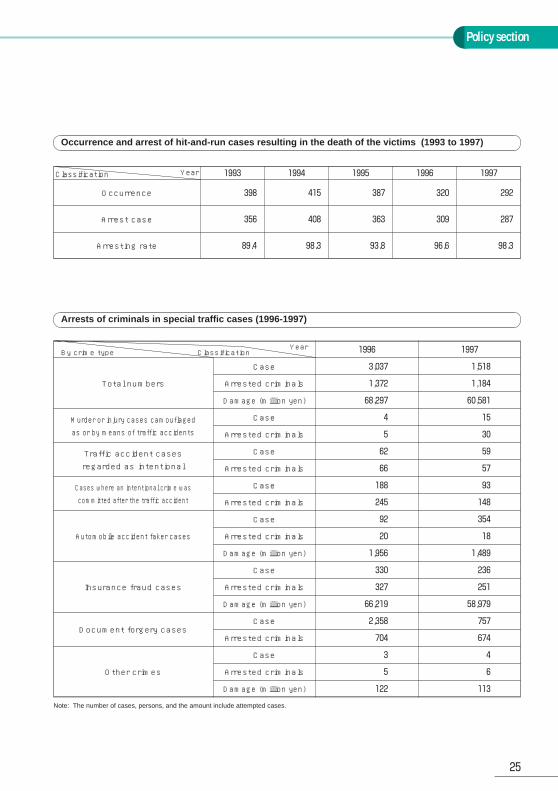
As the number of vehicles increases, vehicles
become faster, and the traveling area of an vehicle
becomes wider, investigation of hit-and-run cases is
getting more difficult every year. However, by
focusing on making a prompt and proper initial
investigation and by developing identif ication
equipment for traffic accident and other scientific
investigation technology such as the image search
system for traces left in traffic accident scenes, most
of the criminals of hit-and-run cases resulting in the
death of the victims have been arrested.
Special traffic cases such as insurance frauds tends
to involve organized crimes and extend to wider
areas. To respond to such circumstances, the police
has been actively promoting joint or united
investigation by two or more police departments of
relevant prefectures.
Simplification of judicial investigation oftraffic accidents
1
Investigation of hit-and-run cases2
Investigation of special traffic cases3
Policy section
25
Occurrence
Classification Year 1993 1994 1995 1996 1997
398 415 387 320 292
Arrest case 356 408 363 309 287
Arresting rate 89.4 98.3 93.8 96.6 98.3
Total numbers
1996By crime type ClassificationYear 1997
3,037Case 1,518
1,372Arrested criminals 1,184
68,297Damage (million yen) 60,581
Automobile accident faker cases
92Case 354
20Arrested criminals 18
1,956Damage (million yen) 1,489
Insurance fraud cases
330Case 236
327Arrested criminals 251
66,219Damage (million yen) 58,979
Other crimes
3Case 4
5Arrested criminals 6
122Damage (million yen) 113
Murder or injury cases camouflagedas or by means of traffic accidents
4Case 15
5Arrested criminals 30
Traffic accident casesregarded as intentional
62Case 59
66Arrested criminals 57
Cases where an intentional crime wascommitted after the traffic accident
188Case 93
245Arrested criminals 148
Document forgery cases2,358Case 757
704Arrested criminals 674
Note: The number of cases, persons, and the amount include attempted cases.
Occurrence and arrest of hit-and-run cases resulting in the death of the victims (1993 to 1997)
Arrests of criminals in special traffic cases (1996-1997)
26
Under the Road Traffic Law revised in 1997, the
National Public Safety Commission published a
Guide on Traffic Safety Education in August 1998, a
guide for traffic safety educators to provide traffic
safety education effectively and properly. The police,
safe driving supervisors, traffic safety campaign
promoters in the community, and traffic safety
educators in private organizations and local
governments will use this Guide on Traffic Safety
Education to implement traffic safety education in
Japan systematically and step by step.
National Traffic Safety Campaign is implemented in
spring and autumn every year to spread knowledge
on traffic safety and to raise people's awareness
toward traff ic safety as well as to promote
observance of traffic rules and practice of good traffic
manner. During the campaign, national and local
public organizations and private organizations such
as the Traffic Safety Association cooperate each
other in a wide variety of national campaigns to raise
people's awareness toward traff ic safety by
conducting various activit ies f i t to individual
communities encouraging voluntary participation of
people in the communities.
In addition, in cooperation with related organizations
and groups, the police has been providing practical
traffic safety education programs focusing on
participation and experiencing, fit for various age
groups from little children to the aged, depending on
their involvement to road traffic and the emotional
and physical development and conditions. Based on
the Guide on Traff ic Safety Education, such
education programs will be further promoted.
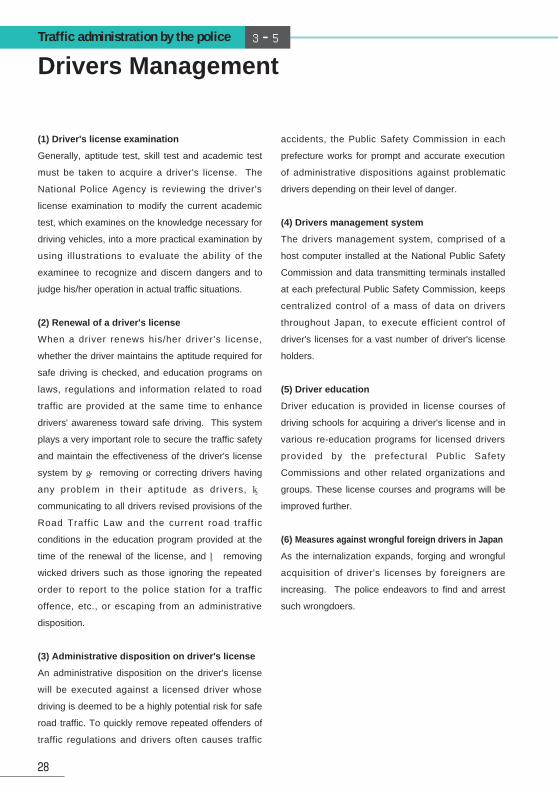
To prevent traffic accidents involving children, the
aged and the physically or mentally impaired while
they are walking or riding bicycles, the police has
been, in cooperation with educational institutes,
welfare organizations and other various groups,
providing traffic safety education and instructions,
and promoting the use of reflecting materials to
prevent traffic accidents at night. Especially,
voluntary activities by traffic safety aged-instructors
for the aged are encouraged.
The Training Academy of Japan Safe Driving Center
provides drivers with opportunities to learn practical
and technical knowledge and skills on driving. It also
provide periodic education programs and on-site
seminars for safe driving supervisors in companies.
Because everybody is involved in the traffic as a
driver, pedestrian, biker, etc., and many traffic
accidents are caused by personal factors, traffic
safety education has great importance as a traffic
safety measure.
Traffic Safety EducationTraffic administration by the police 3━4
Guide on traffic safety education1
National Traffic Safety Campaign andTraffic Safety Education
2
Traffic safety education for the so-called"traffic vulnerable group"
3
Driver education4
Policy section
27
35
30
25
20
15
10
5
Age 15 and�younger
Age 16�to 24
Age 25�to 29
Age 30�to 39
Age 40�to 49
Age 50�to 59
Age 60�to 64
Age 65�and older
Percentage
(%)�
Percentage in the entire population
Percentage of deaths
Percentage of deaths by traffic accidents by age group and comparison with the percentage of each age group in the entire popul ation (1997)
Traffic safety lecture for children
Bicycle safety lecture for the aged
28
(1) Driver's license examination
Generally, aptitude test, skill test and academic test
must be taken to acquire a driver's license. The
National Police Agency is reviewing the driver's
license examination to modify the current academic
test, which examines on the knowledge necessary for
driving vehicles, into a more practical examination by
using illustrations to evaluate the ability of the
examinee to recognize and discern dangers and to
judge his/her operation in actual traffic situations.
(2) Renewal of a driver's license
When a driver renews his/her driver's license,
whether the driver maintains the aptitude required for
safe driving is checked, and education programs on
laws, regulations and information related to road
traffic are provided at the same time to enhance
drivers' awareness toward safe driving. This system
plays a very important role to secure the traffic safety
and maintain the effectiveness of the driver's license
system by ① removing or correcting drivers having
any problem in their aptitude as drivers, ②
communicating to all drivers revised provisions of the
Road Traff ic Law and the current road traff ic
conditions in the education program provided at the
time of the renewal of the license, and ③ removing
wicked drivers such as those ignoring the repeated
order to report to the police station for a traffic
offence, etc., or escaping from an administrative
disposition.
(3) Administrative disposition on driver's license
An administrative disposition on the driver's license
will be executed against a licensed driver whose
driving is deemed to be a highly potential risk for safe
road traffic. To quickly remove repeated offenders of
traffic regulations and drivers often causes traffic
accidents, the Public Safety Commission in each
prefecture works for prompt and accurate execution
of administrative dispositions against problematic
drivers depending on their level of danger.
(4) Drivers management system
The drivers management system, comprised of a
host computer installed at the National Public Safety
Commission and data transmitting terminals installed
at each prefectural Public Safety Commission, keeps
centralized control of a mass of data on drivers
throughout Japan, to execute efficient control of
driver's licenses for a vast number of driver's license
holders.
(5) Driver education
Driver education is provided in license courses of
driving schools for acquiring a driver's license and in
various re-education programs for licensed drivers
provided by the prefectural Public Safety
Commissions and other related organizations and
groups. These license courses and programs will be
improved further.
(6) Measures against wrongful foreign drivers in Japan
As the internalization expands, forging and wrongful
acquisition of driver's licenses by foreigners are
increasing. The police endeavors to find and arrest
such wrongdoers.
Drivers ManagementTraffic administration by the police 3━5
Policy section
29
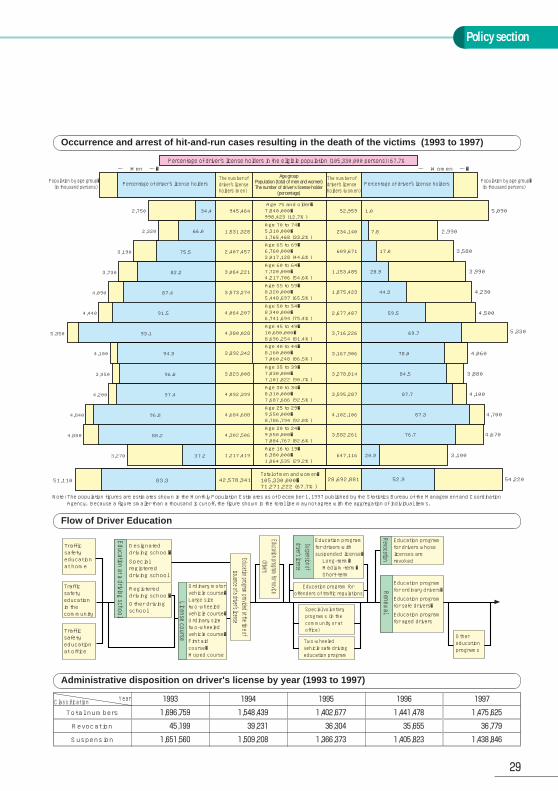
Occurrence and arrest of hit-and-run cases resulting in the death of the victims (1993 to 1997)
Flow of Driver Education
Administrative disposition on driver's license by year (1993 to 1997)
Percentage of driver's license holders in the eligible population (105,330,000 persons): 67.7%ー Men ー� ー Women ー�
Population by age group� (in thousand persons)
Population by age group� (in thousand persons)Percentage of driver's license holders Percentage of driver's license holders
5,330
28,692,881 52.9 54,220
2,750 52,959
234,140
1.0 5,090
7.8 2,990
609,671 17.0 3,580
1,153,485 28.9 3,990
1,875,423 44.3 4,230
2,677,487 59.5 4,500
3,716,226 69.7
3,167,906 78.0 4,060
3,278,814 84.5 3,880
3,595,287 87.7 4,100
4,102,106 87.3 4,700
3,582,261 76.7 4,670
647,116 20.9 3,100
945,464
1,531,328
2,407,457
34.4
2,320 66.0
3,190 75.5
3,064,2213,730 82.2
Age 75 and older�7,840,000�998,423 (12.7%)
Age 70 to 74�5,310,000�1,765,468 (33.2%)Age 65 to 69�6,760,000�3,017,128 (44.6%)
Age 60 to 64�7,720,000�4,217,706 (54.6%)
3,573,2744,090 87.4Age 55 to 59�8,320,000�5,448,697 (65.5%)
4,064,2074,440 91.5Age 50 to 54�8,940,000�6,741,694 (75.4%)
4,980,0285,350 93.1Age 45 to 49�10,680,000�8,696,254 (81.4%)
3,892,3424,100 94.9Age 40 to 44�8,160,000�7,060,248 (86.5%)
3,823,0083,950 96.8Age 35 to 39�7,830,000�7,101,822 (90.7%)
4,092,3994,200 97.4Age 30 to 34�8,310,000�7,687,686 (92.5%)
4,684,6884,840 96.8Age 25 to 29�9,550,000�8,786,794 (92.0%)
4,302,5064,880 88.2Age 20 to 24�9,550,000�7,884,767 (82.6%)
1,217,4193,270 37.2Age 16 to 19�6,380,000�1,864,535 (29.2%)
42,578,34151,110 83.3Total of men and women�105,330,000�71,271,222 (67.7%)
The number of driver's license holders (men)
Age group Population (total of men and women)The number of driver's license holder
(percentage)
The number of driver's license holders (women)
Note: The population figures are estimates shown in the Monthly Population Estimates as of December 1, 1997 published by the Statistics Bureau of the Management and Coordination Agency. Because a figure smaller than a thousand is cut off, the figure shown in the total line may not agree with the aggregation of individual items.
Education at a driving school
License course
RevocationRenewal
Traffic safety education at home
Designated driving school�
Special registered driving school
Registered driving school�Other driving school
Ordinary motor vehicle course�Large size two-wheeled vehicle course�Ordinary size two-wheeled vehicle course�First aid course�Moped course
Traffic safety education in the community
Traffic safety education at office
Education program provided at the time of issuance of a driver's license
Education program for novice drivers
Education program for offenders of traffic regulations
Special voluntary programs (in the community or at office)
Two-wheeled vehicle safe driving education program
Suspension of driver's license
Education program for drivers with suspended license� Long-term� Medium-term� Short-term
Education program for drivers whose licenses are revoked
Education program for ordinary drivers�
Education program for safe drivers�
Education program for aged drivers
Other education programs
Classification Year 1993 1994 1995 1996
Total numbers 1,696,759 1,548,439 1,402,677 1,441,478
Revocation 45,199 39,231 36,304 35,655
Suspension 1,651,560 1,509,208 1,366,373 1,405,823
1997
1,475,625
36,779
1,438,846

Environmental problems and Traffic police
30
Transport systems and Society 4━1
Global warming caused by greenhouse gases
including carbon dioxide, CO2,is a worldwide problem
to cope with. Japan accounts for 4.8% of all the CO2
emissions in the world, being placed fourth. About
20% of the CO2 emissions in Japan is produced by
the transportation sector and approx. 88% of it is
emitted by automobiles. Therefore, reduction of CO2
is one of the urgent problems for us to solve.
In the Kyoto protocol adopted in the Third Conference
of the Parties to the United Nations Framework
Convention on Climate Change, UNFCCC-COP3, in
September 1997, Japan accepted the emission
targets to cut by 6% from 1990 level in the period
from 2008 to 2012. The police is expected to take
measures to control global warming, cutting CO2
emissions from automobiles by optimized traffic
management system. The "Guidelines on
promotional measures against global warming,"
which was compiled following the COP3 (passed the
Cabinet in June 1998) includes traffic management
policies which the police should promote. The
following are four major systems shown in the
guideline.
・ITS (Intelligent Transport System)
VICS (Vehicle Information Communication System)
UTMS (Universal Traffic Management Systems)
・TDM (Transportation Demand Management)
Among them, the EPMS (Environment Protection
Management Systems), one of the sub-systems of
the UTMS, draws particular attention. Aiming to
alleviate traffic pollution, the EPMS controls traffic
signals to minimize the number of times vehicles
have to stop, while collecting necessary information
on air pollution and traffic volume by utilizing infrared
beacon and environmental sensors. The EPMS also
provides information on detours and warning in a
heavily polluted areas. An experimental operation of
this system conducted in Shizuoka in the period from
1996 to 1997 showed that there is a certain
correlation between vehicle's speed and CO2
concentration and that the introduction of the traffic
control system reduced the amount of CO2
emissions. The system will soon be put into practice
along the Route 43 in Hyogo Prefecture.
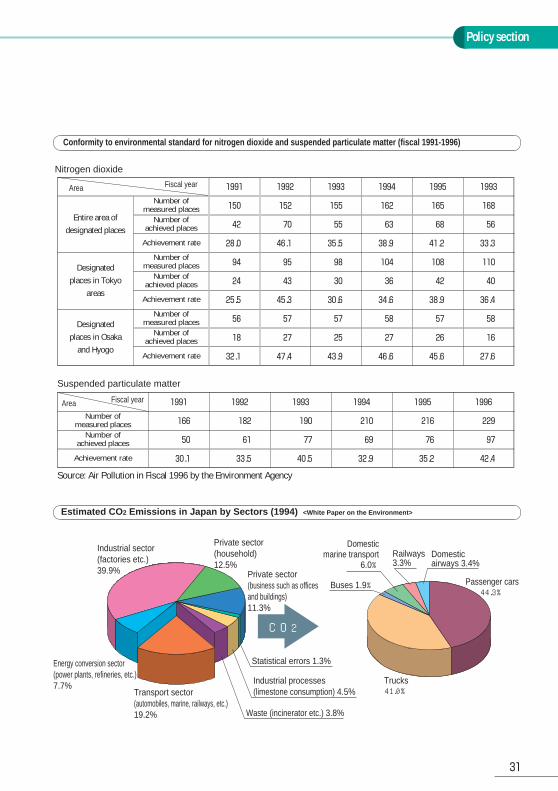
Policy section
31
Conformity to environmental standard for nitrogen dioxide and suspended particulate matter (fiscal 1991-1996)
Estimated CO 2 Emissions in Japan by Sectors (1994) <White Paper on the Environment>
1992 1993 1994 1995 19931991Area Fiscal year
Number of measured places 152 155 162 165 168150
Entire area ofdesignated places
Designatedplaces in Tokyo
areas
Designatedplaces in Osaka
and Hyogo
Number of achieved places 70 55 63 68 5642
Achievement rate
Number of measured places
Number of achieved places
Achievement rate
Number of measured places
Number of achieved places
Achievement rate
46.1 35.5 38.9 41.2 33.328.0
95 98 104 108 11094
43 30 36 42 4024
45.3 30.6 34.6 38.9 36.425.5
57 57 58 57 5856
27 25 27 26 1618
47.4 43.9 46.6 45.6 27.632.1
1992 1993 1994 1995 19961991Area Fiscal year
Number of measured places 182 190 210 216 229166
Number of achieved places 61 77 69 76 9750
Achievement rate 33.5 40.5 32.9 35.2 42.430.1
Nitrogen dioxide
Suspended particulate matter
Source: Air Pollution in Fiscal 1996 by the Environment Agency
Private sector (household)12.5%
Passenger cars44.3%
Trucks41.0%
Domesticairways 3.4%
Private sector(business such as offices and buildings)11.3%
Statistical errors 1.3%
Industrial processes (limestone consumption) 4.5%
Railways3.3%
Domesticmarine transport
6.0%
Buses 1.9%
Waste (incinerator etc.) 3.8%
Transport sector (automobiles, marine, railways, etc.)19.2%
Energy conversion sector(power plants, refineries, etc.)7.7%
Industrial sector (factories etc.)39.9%
CO2
32
In Japan, the numbers of traffic accidents caused byelderly drivers due to deterioration of their physicalfunction and those involving elderly pedestrians havesharply increased in recent years, while our society hasbeen aging in a way no other advanced countries have.Therefore, in order to reduce such accidents, it isextremely important to take measures targeting theelderly. In this context, the police has provided and willprovide various programs to assure safety driving by theelderly as well as to protect elderly pedestrians.
Programs to assure safety driving by the elderly includecounseling and medical check-ups to help elderlypeople to recognize their own physical function anddriving technique. Educational programs for elderlydrivers are also offered, one of which is a lecture using adriving simulation system. Furthermore, the police hasconducted R&D aiming to make the DSSS (DrivingSafety Support Systems), one of the sub-systems of theUTMS (Universal Traffic Management Systems), fit forpractical use. The DSSS makes use of theinfrastructure of the Traffic Management and ControlSystem and IC cards. Two-way communicationbetween an infrared vehicle detector installed close bytraffic signals and a vehicle with UTMS in-vehicle-unitenables to detect a pedestrian with an IC card comingtoward the intersection. Since such warning device willhelp reduce traffic accidents involving elderly drivers,earliest possible realization is anticipated.
In order to protect elderly pedestrians, the policeencourage private organizations to voluntarily providetraff ic safety educational programs. It has alsopromoted to install pedestrian signals specially designedfor the elderly and the disabled. Such signals willlengthen the time the green light is on when it detects aperson holding a portable transmitter crossing the road.Furthermore, the police emphasizes the construction ofthe Community Zones where elderly people can walkaround in peace. In order to support these safetyprograms for elderly pedestrians, the DSSS is alsoexpected to play an important role.
Aging Society and Japan Traffic PoliceTransport systems and Society 4━2
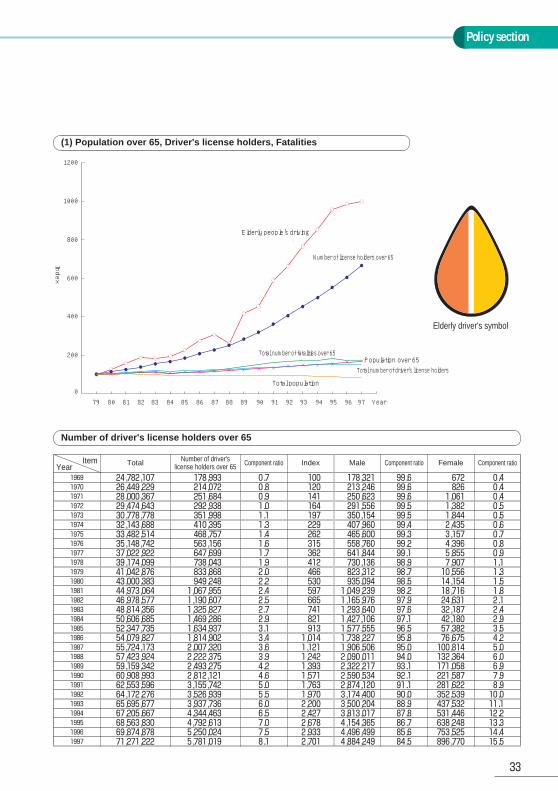
Policy section
33
79 80 81 820
200
400
600
1000
800
1200
83 84 85 86 87 88 90 91 92 9389 94 95 96 97 Year
Index
Elderly people's driving
Number of license holders over 65
Total number of fatalities over 65Population over 65
Total number of driver's license holders
Total population
YearItem Total Number of driver's
license holders over 65 Component ratio Index Male Component ratio Female Component ratio
1969 24,782,107 178,993 0.7 100 178,321 99.6 672 0.41970 26,449,229 214,072 0.8 120 213,246 99.6 826 0.41971 28,000,367 251,684 0.9 141 250,623 99.6 1,061 0.41972 29,474,643 292,938 1.0 164 291,556 99.5 1,382 0.51973 30,778,778 351,998 1.1 197 350,154 99.5 1,844 0.51974 32,143,688 410,395 1.3 229 407,960 99.4 2,435 0.61975 33,482,514 468,757 1.4 262 465,600 99.3 3,157 0.71976 35,148,742 563,156 1.6 315 558,760 99.2 4,396 0.81977 37,022,922 647,699 1.7 362 641,844 99.1 5,855 0.91978 39,174,099 738,043 1.9 412 730,136 98.9 7,907 1.11979 41,042,876 833,868 2.0 466 823,312 98.7 10,556 1.31980 43,000,383 949,248 2.2 530 935,094 98.5 14,154 1.51981 44,973,064 1,067,955 2.4 597 1,049,239 98.2 18,716 1.81982 46,978,577 1,190,607 2.5 665 1,165,976 97.9 24,631 2.11983 48,814,356 1,325,827 2.7 741 1,293,640 97.6 32,187 2.41984 50,606,685 1,469,286 2.9 821 1,427,106 97.1 42,180 2.91985 52,347,735 1,634,937 3.1 913 1,577,555 96.5 57,382 3.51986 54,079,827 1,814,902 3.4 1,014 1,738,227 95.8 76,675 4.21987 55,724,173 2,007,320 3.6 1,121 1,906,506 95.0 100,814 5.01988 57,423,924 2,222,375 3.9 1,242 2,090,011 94.0 132,364 6.01989 59,159,342 2,493,275 4.2 1,393 2,322,217 93.1 171,058 6.91990 60,908,993 2,812,121 4.6 1,571 2,590,534 92.1 221,587 7.91991 62,553,596 3,155,742 5.0 1,763 2,874,120 91.1 281,622 8.91992 64,172,276 3,526,939 5.5 1,970 3,174,400 90.0 352,539 10.01993 65,695,677 3,937,736 6.0 2,200 3,500,204 88.9 437,532 11.11994 67,205,667 4,344,463 6.5 2,427 3,813,017 87.8 531,446 12.21995 68,563,830 4,792,613 7.0 2,678 4,154,365 86.7 638,248 13.31996 69,874,878 5,250,024 7.5 2,933 4,496,499 85.6 753,525 14.41997 71,271,222 5,781,019 8.1 2,701 4,884,249 84.5 896,770 15.5
Elderly driver's symbol
(1) Population over 65, Driver's license holders, Fatalities
Number of driver's license holders over 65
Economic activities and Traffic police
34
Transport systems and Society 4━3
Rapid movement toward deregulation in recent years
has made business owners' demands for physical
distribution extremely diversified and sophisticated.
Responding to such demands, the government has
been implementing various policies to reduce
distribution cost and grade up distribution systems
and the traffic police is required to cooperate for the
efficient distribution through the optimum traffic
control.
The traffic police has conducted R&D aiming at the
earliest nationwide adoption of the MOCS ( Mobil
Operation Control Systems), one of the sub-systems
of the UTMS. Through the two-way communication
between an infrared vehicle detector and a vehicle
with UTMS in-vehicle unit, a business office can trace
its trucks and give them operating information, which
enables the office to conduct an efficient operating
management. After an experimental operation of the
system which started in April 1996 in Sapporo proved
the system's effectiveness, the system was put into
practical use there. The system also played a major
role in the Nagano Winter Olympic Games held in
February 1998, supporting the efficient operation of
Games-related vehicles.
In order to control traffic congestion caused by
activated economic activities and to minimize its
adverse influence on economic activities, traffic
volume should be reduced as much as possible.
Since promotion of the usage of mass transportation
systems as well as the appropriate traffic control are
considered to help reduce traffic, the police has
introduced the PTPS (Public Transportation Priority
Systems), one of the sub-systems of the UTMS in
order to encourage people to use buses. Under the
systems, lanes exclusively for buses and the priority
signal control will help them run on time. The system
has been introduced in Tokyo and Sapporo and will
be introduced in Hamamatsu city.
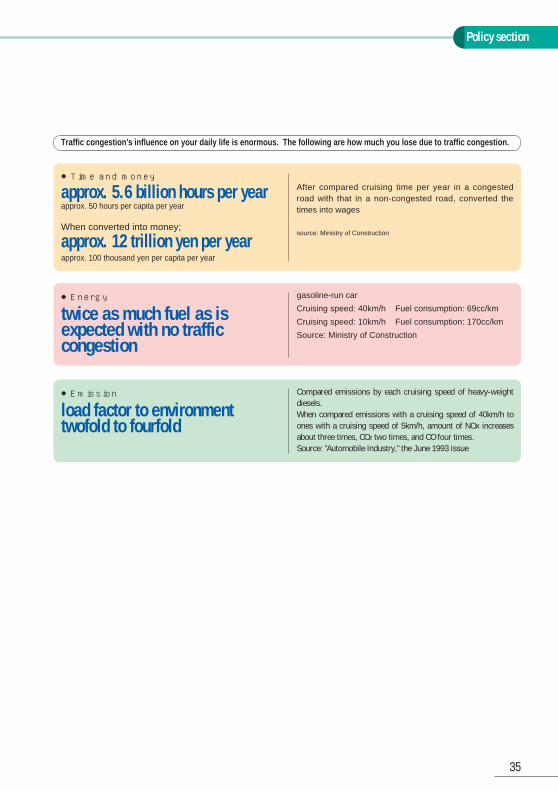
Policy section
35
●Time and money
approx. 5.6 billion hours per yearapprox. 50 hours per capita per year
When converted into money;
approx. 12 trillion yen per yearapprox. 100 thousand yen per capita per year
After compared cruising time per year in a congestedroad with that in a non-congested road, converted thetimes into wages
source: Ministry of Construction
●Energy
twice as much fuel as isexpected with no trafficcongestion
gasoline-run car
Cruising speed: 40km/h Fuel consumption: 69cc/km
Cruising speed: 10km/h Fuel consumption: 170cc/km
Source: Ministry of Construction
Traffic congestion's influence on your daily life is enormous. The following are how much you lose due to traffic congestion.
●Emission
load factor to environmenttwofold to fourfold
Compared emissions by each cruising speed of heavy-weightdiesels.When compared emissions with a cruising speed of 40km/h toones with a cruising speed of 5km/h, amount of NOx increasesabout three times, CO2 two times, and CO four times.Source: "Automobile Industry," the June 1993 issue
Traffic management in disasters
36
Transport systems and Society 4━4
It is presumed that, in the events of natural disasters
such as earthquakes, storms, and floods, traffic will
be greatly damaged due to the limited number of
roads available because many roads would be cut off
or blocked by collapsed buildings. Once the power is
cut, traffic signals will stop functioning, which will lead
a chaotic situation in the city and main road networks
connecting cities. Secondary disaster is another
anxiety and rescue vehicles would also be prevented
from reaching the devastated areas. It is, therefore,
inevitable for the police to direct appropriate traffic
management so that routes for rescue vehicles are
secured and smooth evacuation instructions can be
given, while collecting information on damaged roads
and traffic conditions.
In order to make such traffic management possible in
disasters, the police takes preventive measures
including disaster drills, a planning of a detailed traffic
control procedures in disasters, and educational
programs to confirm drivers what they should do
when a devastating earthquake hit the region.
Rescue vehicles which are to be sent to the
devastated areas will be selected and, step by step,
traffic information boards will be setting up at places
where people can easily obtain information on
detours and damages to the roads.
The police also promotes to install disaster-resistant
traffic safety facilities. For example, various vehicle
detectors, CCTV cameras, and information boards
will be installed in major roads which will be used in
an emergency to support the central traffic control
system; the traffic control center, a nucleus of the
traffic management and control system, will be
reinforced to be earthquake-resistant so that the
center may continue to direct the appropriate traffic
control according to the situation even in a disaster;
traffic signals at major intersections are being
equipped with a self-starting power generator, which
will prevent them from stop working when the electric
power fails.
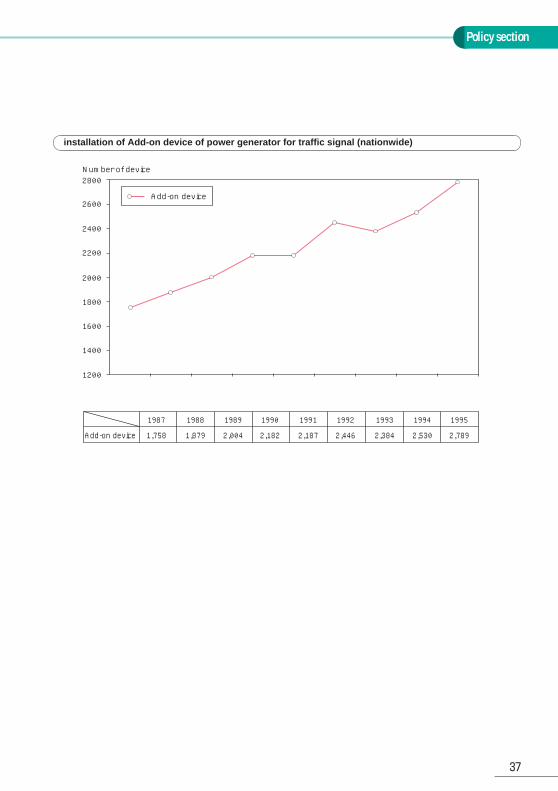
Policy section
37
installation of Add-on device of power generator for traffic signal (nationwide)
2800
2600
2400
2200
2000
1800
1600
1400
1200
Number of device
Add-on device
Add-on device
1987 1988 1989 1990 1991 1992 1993 1994 1995
1,758 1,879 2,004 2,182 2,187 2,446 2,384 2,530 2,789
Mechanism of traffic congestion
38
Theory of traffic management 5━1
When traffic demand exceeds traffic capacity, roads
become congested. The traff ic capacity is
determined by various factors such as width,
configuration, and incline of a road. When many
vehicles pass at a certain section of road and its
volume exceeds the inherent road capacity, some
vehicles will not pass through there and the traffic
congestion is getting appeared.
The section of a road where vehicles gather more
than the road's capacity is called a "bottleneck."
Intersections on roads and merging places, sags*1),
and tunnels on expressways can be bottlenecks. In
the section called sags, where a downward incline
changes into an upward one, speed gradually slows
down. When drivers are unaware of the change, they
keep the same distance between themselves and the
cars they are following. Slowing down with little
change in a distance between noses of the two
cars*2) will lengthen a time between noses of the two
cars*3). Eventually, the number of cars which can
pass through the section per hour will decrease.
Capacity at a sag section depends on whether a
driver is aware of the change or not. A survey shows
that the traffic capacity at a sag where the change is
hardly noticed is 20-30% less than that at other sags
where a change is distinct.
Even though there is only a little amount of excess in
traffic demand at first, if such situation goes on for a
long time of period, traffic will be congested and
cause a great problem. For example, in November
1990, congestion caused by 10% excess of the
demand for 2 hours, beginning at the Kasai junction
of the Metropolitan Expressway, eventually extended
to seven-km-long and lasted approx. 4 hours.
There are two possible ways to mitigate and
eventually dissolve traffic congestion; one is to
increase the capacity of a road and the other is to
adjust traffic demands. In order to increase the
capacity, constructing new lines and widening roads
may be helpful. Such projects, however, require to
obtain proper amount of land, which is quite difficult in
Japan. Therefore, the TDM measure which aims to
adjust traffic demands, broadly transportation
demands, has drawn peoples' attention. The method
is to give some incentives to drivers so that they are
encouraged to change their departure time or to take
trains or other public transportation system instead.
The said congestion on the Metropolitan Expressway
could be dissolved if 20% of drivers change their
departure time by averaging 15 minutes up to 30
minutes.
*1) a section where a downward incline changes into
an upward incline
*2) a distance from the nose of a car to the nose of
the following car
*3) a time period which two cars with no other cars in
between pass through a point
Policy section
39
Traffic flow simulationTheory of traffic management 5━2
Simulation means to reproduce actual conditions
through various means. While conventional methods
use models for a simulation, computerized numerical
simulation has recently been adopted in many cases.
Traffic flow simulation is one of those which adopt the
computerized numerical simulation method and is
divided into two major groups according to what is to
be modeled; micro-simulation and macro-simulation.
The former aims to model movements of a car, such
as how to follow a car and how to change lanes. The
latter aims to describe traff ic phenomena by
approximating a traffic flow as a fluid or considering
several cars as one group.
The traffic flow simulation method is used for various
purposes including assessment of effect of improved
or newly constructed roads, traffic operation plans,
and dissemination of traffic information. Although a
simulation is modeled according to each case, all the
simulations take the following procedures:
1)Specification:
Input and output of simulation shall be decided
upon taking the simulation purposes into
consideration.
2)Modeling:
Modeling of traffic phenomena shall be made to
meet the above specification.
3)Implementation:
Programming shall be progressed according to the
model.
4) Verification of a simulation:
Verif ication shall be conducted whether the
program correctly reproduces a traffic phenomenon
according to the model under a virtual traffic
condition.
5) Validation of reproductivity:
Validation shall be confirmed how well the
simulation reproduces the actual situation.
With the progress of the ITS technologies, the police
is expected to manage and control traffic much more
dynamically and effectively than ever. It is also
expected to put a traffic flow simulation model into
practical use since it helps reproduce or predict traffic
situations which vary from moment to moment.

40
41
●Traffic Management and Control System
●Universal Traffic Management Systems
(1) System structureThe traffic control system is structured hierarchically toallow for future expansion and ensure safety.The lowerlayer of the system directly controls the traffic signals,the vehicle detectors, the roadside transmitters, and themessage sign terminals; its structure is designed forextra equipment be added easily in the future.The upperlayer of the system integrates the lower layer andconsists of the signal control subsystem, the informationcollection and supply sub-systems, as well as theoperation management sub-system which interfaceswith the supervisors, and the traffic information database. These systems are connected by a local areanetwork (LAN), which permits large volumes of data tobe sent at high speeds.
(2)Information collecting sub-systemThe traff ic control system collects informationtransmitted from roadside vehicle detectors (ultrasonic,infrared, etc.), such as traffic volume and speed, andvehicle types. Collected data are sent to the trafficcontrol center. Congestion length, saturated trafficvolume, and division rate are calculated from thisinformation. Also, based on data sent from the traveltime measuring terminals, the traffic control centercalculates travel times and estimates travel times forthose roads not fitted with such terminals.
(3) Signal control sub-systemBased on the traffic data gathered by the information
collecting sub-system, the signal control sub-systemdetermines the cycle lengths, split control, and offsetvalues which control the signal devices; this is carriedout in the upper layer of the system. Having processedthe data, the signal control sub-system then directlyoperates the signal controllers via the lower layer of thesystem.
(4) Information supply sub-systemThis system provides drivers automatically withinformation about congestion, travel times, trafficregulations, and parking space availability throughroadside transmitters, variable information boards,information terminals, and in-vehicle navigation units.Information is also provided automatically in response totelephone or fax inquiries.
(5) Operation management sub-systemThis system manages and operates prefecture-widetraffic control systems. It provides traffic supervisorswith information on traffic and on how the systems arefunctioning through man-machine interfaces such as thetraff ic wall map and CRT displays. The traff icsupervisors are the ones who take charge of theoperation of the traffic control center. Based on theprovided information, they change control parametersettings. This system also exchanges traffic and roadinformation with systems operated by other prefecturesand road administrators.
Traffic Management and Control System
42
The traffic management and control system is designed to distribute and guide fitly
the volume and the flow of the traffic in the overcrowded cities based on the
existing road network. This system works to support urban mechanism through
making the most of facilities of motor vehicle.
The traffic management and control system has been established in every
prefecture in Japan and is being operated through the traffic control center of the
Police Headquarters as the nucleus.
The traffic control center located in each prefecture manages traffic covering the
entire area of its region by integrating the information transmitted from the city
centers in the main cities and the sub-centers in medium-sized and small cities of
the prefectures in which they are located.
Incidentally, there were 170 control centers in total in Japan at the end of 1997,
including 47 headquarter centers, 28 city centers, and 95 sub-centers.
1
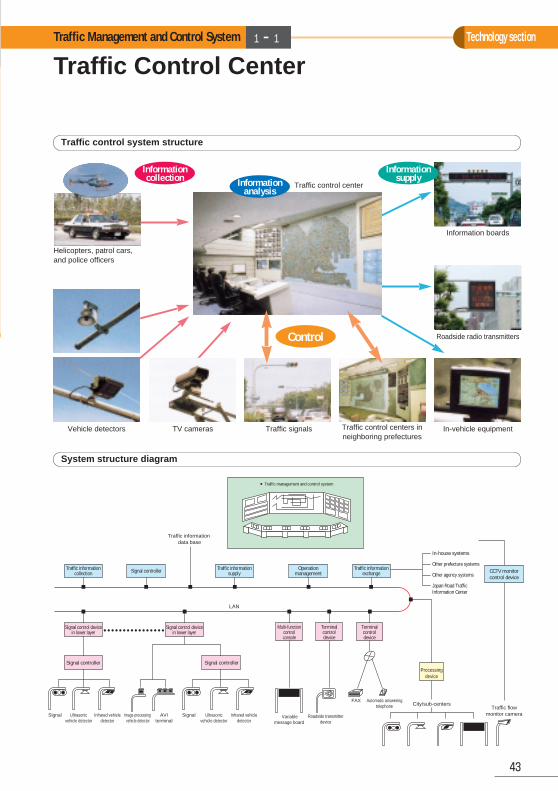
Technology section
43
Traffic control system structure
●Traffic management and control system
Traffic informationcollection
Traffic information data base
In-house systems
Other prefecture systems
Other agency systems
Japan Road TrafficInformation Center
CCTV monitorcontrol device
Processingdevice
City/sub-centersTraffic flow
monitor cameraSignal Ultrasonicvehicle detector
Ultrasonicvehicle detector
Infrared vehicledetector
Infrared vehicledetector
Variablemessage board
Roadside transmitterdevice
FAX Automatic answeringtelephone
Image processing vehicle detector
AVIterminal
Signal
LAN
Signal controller Traffic informationsupply
Operationmanagement
Traffic informationexchange
Signal control devicein lower layer
Signal controller Signal controller
Signal control devicein lower layer
Multi-functioncontrolconsole
Terminalcontroldevice
Terminalcontroldevice
System structure diagram
Informationanalysis
Control
Helicopters, patrol cars,and police officers
Traffic control center
Vehicle detectors TV cameras Traffic signals Traffic control centers inneighboring prefectures
In-vehicle equipment
Information boards
Roadside radio transmitters
Informationsupply
Informationcollection
Traffic Control CenterTraffic Management and Control System 1━1
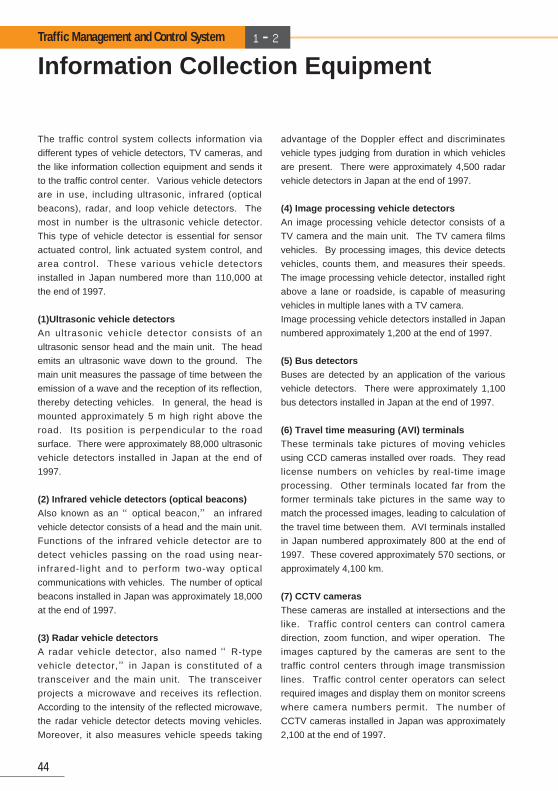
The traffic control system collects information via
different types of vehicle detectors, TV cameras, and
the like information collection equipment and sends it
to the traffic control center. Various vehicle detectors
are in use, including ultrasonic, infrared (optical
beacons), radar, and loop vehicle detectors. The
most in number is the ultrasonic vehicle detector.
This type of vehicle detector is essential for sensor
actuated control, link actuated system control, and
area control. These various vehicle detectors
installed in Japan numbered more than 110,000 at
the end of 1997.
(1)Ultrasonic vehicle detectorsAn ultrasonic vehicle detector consists of an
ultrasonic sensor head and the main unit. The head
emits an ultrasonic wave down to the ground. The
main unit measures the passage of time between the
emission of a wave and the reception of its reflection,
thereby detecting vehicles. In general, the head is
mounted approximately 5 m high right above the
road. Its position is perpendicular to the road
surface. There were approximately 88,000 ultrasonic
vehicle detectors installed in Japan at the end of
1997.
(2) Infrared vehicle detectors (optical beacons)Also known as an “optical beacon,” an infrared
vehicle detector consists of a head and the main unit.
Functions of the infrared vehicle detector are to
detect vehicles passing on the road using near-
infrared-l ight and to perform two-way optical
communications with vehicles. The number of optical
beacons installed in Japan was approximately 18,000
at the end of 1997.
(3) Radar vehicle detectorsA radar vehicle detector, also named “R-type
vehicle detector,” in Japan is constituted of a
transceiver and the main unit. The transceiver
projects a microwave and receives its reflection.
According to the intensity of the reflected microwave,
the radar vehicle detector detects moving vehicles.
Moreover, it also measures vehicle speeds taking
advantage of the Doppler effect and discriminates
vehicle types judging from duration in which vehicles
are present. There were approximately 4,500 radar
vehicle detectors in Japan at the end of 1997.
(4) Image processing vehicle detectorsAn image processing vehicle detector consists of a
TV camera and the main unit. The TV camera films
vehicles. By processing images, this device detects
vehicles, counts them, and measures their speeds.
The image processing vehicle detector, installed right
above a lane or roadside, is capable of measuring
vehicles in multiple lanes with a TV camera.
Image processing vehicle detectors installed in Japan
numbered approximately 1,200 at the end of 1997.
(5) Bus detectorsBuses are detected by an application of the various
vehicle detectors. There were approximately 1,100
bus detectors installed in Japan at the end of 1997.
(6) Travel time measuring (AVI) terminalsThese terminals take pictures of moving vehicles
using CCD cameras installed over roads. They read
license numbers on vehicles by real-time image
processing. Other terminals located far from the
former terminals take pictures in the same way to
match the processed images, leading to calculation of
the travel time between them. AVI terminals installed
in Japan numbered approximately 800 at the end of
1997. These covered approximately 570 sections, or
approximately 4,100 km.
(7) CCTV camerasThese cameras are installed at intersections and the
like. Traffic control centers can control camera
direction, zoom function, and wiper operation. The
images captured by the cameras are sent to the
traffic control centers through image transmission
lines. Traffic control center operators can select
required images and display them on monitor screens
where camera numbers permit. The number of
CCTV cameras installed in Japan was approximately
2,100 at the end of 1997.
Information Collection Equipment
44
Traffic Management and Control System 1━2
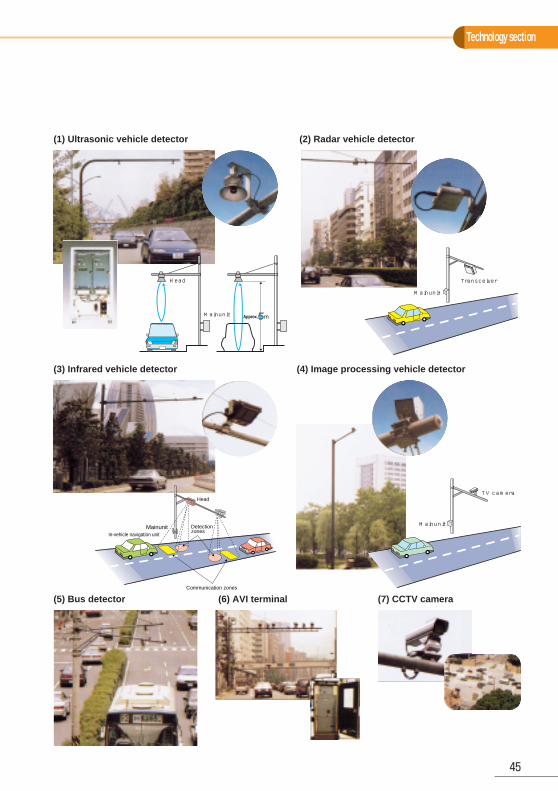
Technology section
45
(1) Ultrasonic vehicle detector (2) Radar vehicle detector
(3) Infrared vehicle detector
(5) Bus detector (6) AVI terminal (7) CCTV camera
(4) Image processing vehicle detector
Head
Mainunit Approx.
Transceiver
Mainunit
Head
Detectionzones
Communication zones
In-vehicle navigation unitMainunit
TV camera
Mainunit
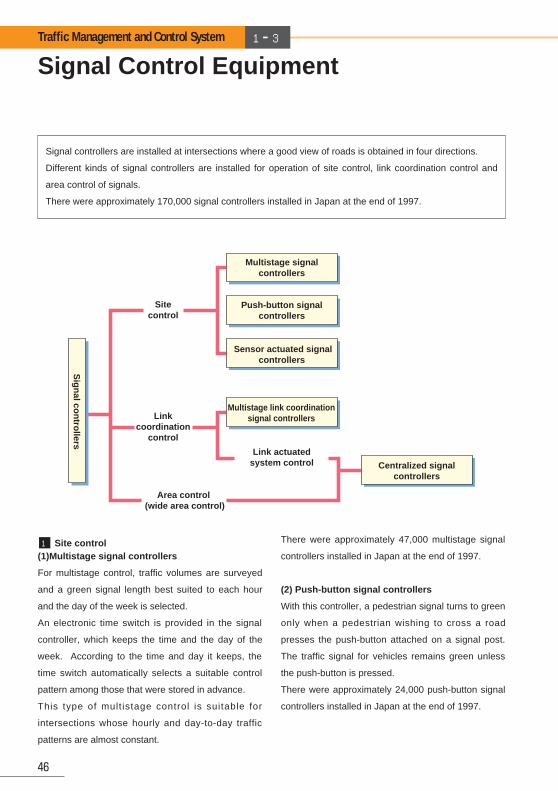
Signal Control Equipment
46
Traffic Management and Control System 1━3
Signal controllers are installed at intersections where a good view of roads is obtained in four directions.
Different kinds of signal controllers are installed for operation of site control, link coordination control and
area control of signals.
There were approximately 170,000 signal controllers installed in Japan at the end of 1997.
(1)Multistage signal controllers
For multistage control, traffic volumes are surveyed
and a green signal length best suited to each hour
and the day of the week is selected.
An electronic time switch is provided in the signal
controller, which keeps the time and the day of the
week. According to the time and day it keeps, the
time switch automatically selects a suitable control
pattern among those that were stored in advance.
This type of multistage control is suitable for
intersections whose hourly and day-to-day traffic
patterns are almost constant.
There were approximately 47,000 multistage signal
controllers installed in Japan at the end of 1997.
(2) Push-button signal controllers
With this controller, a pedestrian signal turns to green
only when a pedestrian wishing to cross a road
presses the push-button attached on a signal post.
The traffic signal for vehicles remains green unless
the push-button is pressed.
There were approximately 24,000 push-button signal
controllers installed in Japan at the end of 1997.
Sitecontrol
Linkcoordination
control
Link actuatedsystem control
Area control (wide area control)
Multistage link coordinationsignal controllers
Centralized signalcontrollers
Multistage signalcontrollers
Push-button signalcontrollers
Sensor actuated signalcontrollers
Sig
nal co
ntro
llers
Site control1
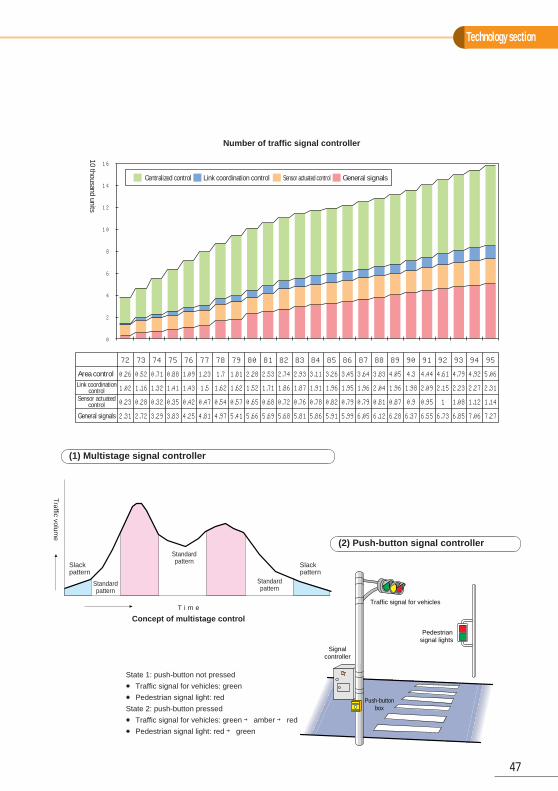
Technology section
47
Traffic volum
e
T i m e
Concept of multistage control
Slackpattern
Slackpattern
Standardpattern
Standardpattern
Standardpattern
Traffic signal for vehicles
Signalcontroller
Pedestriansignal lights
Push-buttonbox
0
2
4
6
8
10
12
14
16
10 thousand units
Number of traffic signal controller
Centralized control Link coordination control Sensor actuated control General signals
Area control
Sensor actuatedcontrol
Link coordinationcontrol
General signals
72
0.26
1.02
0.23
2.31
0.52
1.16
0.28
2.72
0.71
1.32
0.32
3.29
0.88
1.41
0.35
3.83
1.09
1.43
0.42
4.25
1.23
1.5
0.47
4.81
1.7
1.62
0.54
4.97
1.81
1.62
0.57
5.41
2.28
1.52
0.65
5.66
2.53
1.71
0.68
5.69
2.74
1.86
0.72
5.68
2.93
1.87
0.76
5.81
3.11
1.91
0.78
5.86
3.26
1.96
0.82
5.91
3.45
1.95
0.79
5.99
3.64
1.96
0.79
6.05
3.83
2.04
0.81
6.12
4.05
1.96
0.87
6.28
4.3
1.98
0.9
6.37
4.44
2.09
0.95
6.55
4.61
2.15
1
6.73
4.79
2.23
1.08
6.85
4.92
2.27
1.12
7.06
5.06
2.31
1.14
7.27
73 74 75 76 77 78 79 80 81 82 83 84 85 86 87 88 89 90 91 92 93 94 95
State 1: push-button not pressed
● Traffic signal for vehicles: green
● Pedestrian signal light: red
State 2: push-button pressed
● Traffic signal for vehicles: green → amber → red
● Pedestrian signal light: red → green
(1) Multistage signal controller
(2) Push-button signal controller
48
Signal Control EquipmentTraffic Management and Control System 1━3
(3) Traffic Actuated Control
Although the multistage control works satisfactorily if
traffic flow profiles are constant, it cannot deal with
traffic volumes that vary in an unpredictable manner.
To overcome this difficulty, the traffic actuated control
uses vehicle detectors for determining green signal
length according to the measured traffic volume.
(a) Semi-actuated signal controllers
This controller keeps the green signal for the main
road. It turns the signal for the subordinate road
green only when it detects a vehicle or pedestrian on
that road. The semi-actuated control is suitable for
such intersections that the subordinate roads have
relatively low traffic volumes. There were 10,471
semi-actuated signal controllers in Japan at the end
of 1996.
(b) Full-actuated signal controllers
While the semi-actuated control uses vehicle
detectors only on subordinate roads, this control
method provides vehicle detectors on all directions
including the main road so as to control green signal
lengths in each direction according to their traffic
volumes. The full-actuated control is suitable for
such intersections that traffic volumes substantially
change in each direction or traffic conditions vary in
an unpredictable manner. The number of full-
actuated signal controllers installed in Japan was 970
at the end of 1996.
(c) Traffic actuated signal controllers for right-hand turns
Where right-turn vehicles are many and have
substantial hourly changes, fixed time control of them
would result in congestion due to jamming right-turns
or in wasted right-turn signal lengths. Therefore by
installing the vehicle detectors for right-turn lane, the
traffic actuated signal control for right-hand turns
performs the signal control so that right-turn arrow
signal lengths may change according to the volumes
of right-turns. This control improves processing
capacity of intersections as well as increases the
safety of r ight-turns. Traff ic actuated signal
controllers for right-hand turns installed in Japan
numbered 1,792 at the end of 1996.
(d) Signal controllers for semi-actuated control during slack hours
These controllers carry out a kind of semi-actuated
signal control. They perform standard signal control
during daytime hours when traffic volumes are high,
while during slack hours as in the nighttime they
conduct semi-actuated control with the traffic on main
roads given a priority.
This kind of control is fit for such intersections that the
traffic that crosses the main roads substantially
decreases during slack hours from that in the
daytime. There were 11,626 signal controllers for
semi-actuated control during slack hours installed in
Japan at the end of 1996.
(e) Speed sensor actuated signal controllers
R-type vehicle detectors capable of measuring
vehicle speeds are located near intersections. When
they detect vehicles running at unusually high
speeds, these controllers shorten green signal
displays at downstream intersections if those signals
are green, or lengthen red signal displays if those
signals are red, to stop such vehicles without any
problems. This kind of signal control uses speed
information sent by detectors. The number of speed
sensor actuated signal controllers installed in Japan
was 1,094 at the end of 1996.
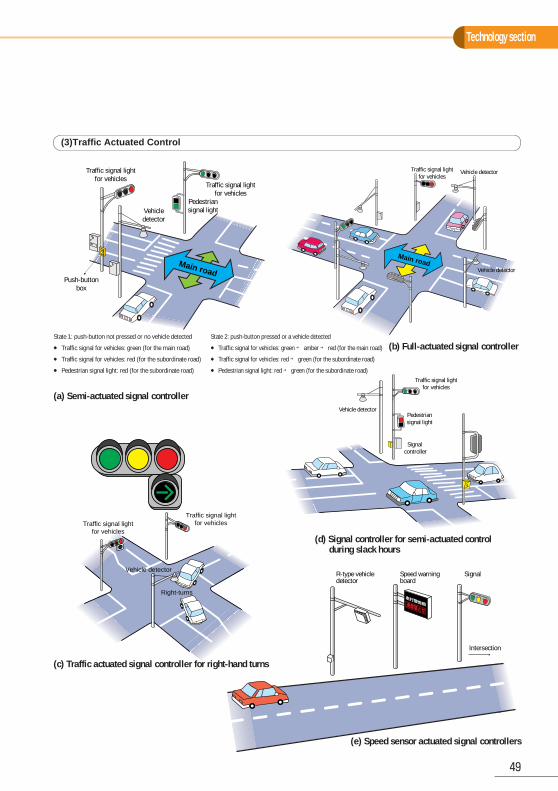
49
Technology section
R-type vehicledetector
Speed warning board
Signal
Intersection
(a) Semi-actuated signal controller
(b) Full-actuated signal controller
Traffic signal lightfor vehicles
Traffic signal lightfor vehicles
Pedestriansignal lightVehicle
detector
Push-buttonbox
Main road
Main road
Vehicle detector
Vehicle detector
Traffic signal lightfor vehicles
Traffic signal lightfor vehicles
Vehicle detector
Traffic signal lightfor vehicles
Right-turns
Vehicle detector
Traffic signal lightfor vehicles
Pedestriansignal light
Signal controller
(e) Speed sensor actuated signal controllers
(d) Signal controller for semi-actuated control during slack hours
(c) Traffic actuated signal controller for right-hand turns
State 1: push-button not pressed or no vehicle detected
● Traffic signal for vehicles: green (for the main road)
● Traffic signal for vehicles: red (for the subordinate road)
● Pedestrian signal light: red (for the subordinate road)
State 2: push-button pressed or a vehicle detected
● Traffic signal for vehicles: green → amber → red (for the main road)
● Traffic signal for vehicles: red → green (for the subordinate road)
● Pedestrian signal light: red → green (for the subordinate road)
(3)Traffic Actuated Control
History of traffic signals
50
Traffic Management and Control System 1━4
(1) Traffic control was first introduced in Japan in
1919. At that time, the police gave signs by waving
their hands. Various types of traffic signals have
since been used, beginning from information-board
type signals which were manually operated, and then
to portable-lamp type signals with electric bulbs, and,
at present, automatically operated signals.
A prototype of the present traffic signals is the
automatic signal which was imported from Reynolds
Co., U.S. in March 1930. The signal with three lights
in green, amber, and red was installed at the top of a
pole which was placed at the center of the Hibiya
intersection in Tokyo. The signal was designed in
two phases way that the amber light was on after the
red one as well as between the green and the red.
This historic first traffic signal and the information-
board type signal are now displayed in the Traffic
Museum in Kanda, Tokyo.
(2) Although instructions and notice by the
Metropolitan Police regarding traffic signal's function
were established in April 1930, trams' conductors
were the only people who understood the meaning of
signals and followed the instructions. Therefore,
"Go," "Caution," and "Stop" in black letters were
added on the surface of each signal light so that
ordinary people were able to understand what they
meant.
(3) With the advance of motor transportation, the
number of traffic signals in major cities in Japan
gradually increased. Although 370 sets of signals
were installed in the district of the Tokyo Metropolitan
Police Department in 1941, most of them were
destroyed during World War II. After the war, the
police started traffic control again with hand-waving
signals, which became so popular that a hand-waving
signals competition was held in December 1948.
Meanwhile, the restoration of traffic signals made
very slow progress in spite of the urgent request by
the U.S. Occupation Army.
(4) Remarkable growth in Japanese economy in
around 1955 was accompanied by a rapid increase in
motor transportation volume. In 1960, the Road
Traffic Law was enacted which established the base
of the present concept concerning traff ic
management. The law also clearly stated that the
Public Safety Commission is responsible for
installation of traffic signals. Concurrently, the
number of traffic accidents has increased. "The
Emergency Measure Law Relating to the
Improvement of Traffic Safety Facilities" was issued
and enacted in April 1966 in response to a public
earnest demand for appropriate road traff ic
environment in the road traffic era. In compliance
with this law, traffic signals facilities have been
greatly improved and the number of signals also
increased. (See Table 1)
(5) Each municipal government adopted its own type
of traffic signals for the visually impaired (Audible
signals) until July 1975, when two of them were
officially designated to be installed nationwide; one
with two kinds of bird's chirping sounds and the other
with two Japanese folk songs. Under the 2nd Five-
year Plan for Traffic Safety Facility Improvement
starting in fiscal 1976, a subsidy was allocated to the
installation of these two types of signals for the
visually impaired.
Development of traffic signals1
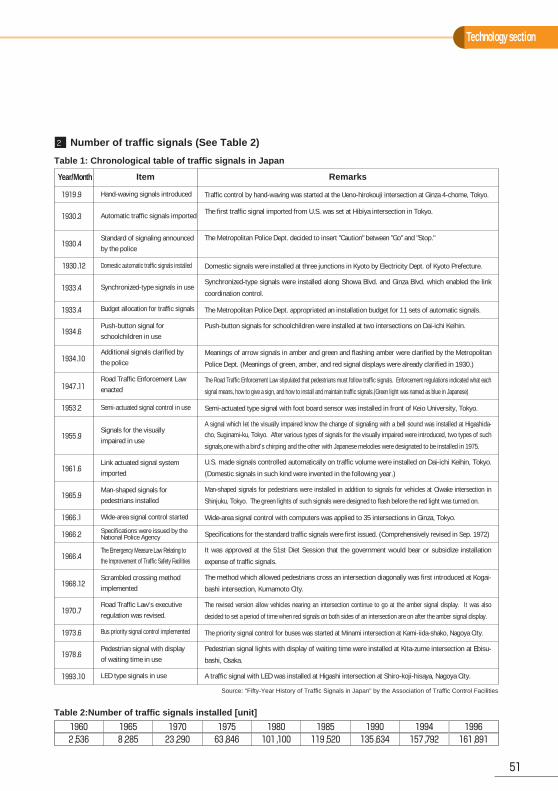
Technology section
51
Traffic control by hand-waving was started at the Ueno-hirokouji intersection at Ginza 4-chome, Tokyo.
The first traffic signal imported from U.S. was set at Hibiya intersection in Tokyo.
The Metropolitan Police Dept. decided to insert "Caution" between "Go" and "Stop."
Domestic signals were installed at three junctions in Kyoto by Electricity Dept. of Kyoto Prefecture.
Synchronized-type signals were installed along Showa Blvd. and Ginza Blvd. which enabled the link
coordination control.
The Metropolitan Police Dept. appropriated an installation budget for 11 sets of automatic signals.
Push-button signals for schoolchildren were installed at two intersections on Dai-ichi Keihin.
Meanings of arrow signals in amber and green and flashing amber were clarified by the Metropolitan
Police Dept. (Meanings of green, amber, and red signal displays were already clarified in 1930.)
The Road Traffic Enforcement Law stipulated that pedestrians must follow traffic signals. Enforcement regulations indicated what each
signal means, how to give a sign, and how to install and maintain traffic signals.(Green light was named as blue in Japanese)
Semi-actuated type signal with foot board sensor was installed in front of Keio University, Tokyo.
A signal which let the visually impaired know the change of signaling with a bell sound was installed at Higashida-cho, Suginami-ku, Tokyo. After various types of signals for the visually impaired were introduced, two types of such
signals,one with a bird's chirping and the other with Japanese melodies were designated to be installed in 1975.
U.S. made signals controlled automatically on traffic volume were installed on Dai-ichi Keihin, Tokyo.
(Domestic signals in such kind were invented in the following year.)
Man-shaped signals for pedestrians were installed in addition to signals for vehicles at Oiwake intersection in
Shinjuku, Tokyo. The green lights of such signals were designed to flash before the red light was turned on.
Wide-area signal control with computers was applied to 35 intersections in Ginza, Tokyo.
Specifications for the standard traffic signals were first issued. (Comprehensively revised in Sep. 1972)
It was approved at the 51st Diet Session that the government would bear or subsidize installation
expense of traffic signals.
The method which allowed pedestrians cross an intersection diagonally was first introduced at Kogai-
bashi intersection, Kumamoto City.
The revised version allow vehicles nearing an intersection continue to go at the amber signal display. It was also
decided to set a period of time when red signals on both sides of an intersection are on after the amber signal display.
The priority signal control for buses was started at Minami intersection at Kami-iida-shako, Nagoya City.
Pedestrian signal lights with display of waiting time were installed at Kita-zume intersection at Ebisu-
bashi, Osaka.
A traffic signal with LED was installed at Higashi intersection at Shiro-koji-hisaya, Nagoya City.
Hand-waving signals introduced1919.9
1930.3
1930.4
1930.12
1933.4
1933.4
1934.6
1934.10
1947.11
1953.2
1955.9
1961.6
1965.9
1966.1
1966.2
1966.4
1968.12
1970.7
1973.6
1978.6
1993.10
Automatic traffic signals imported
Standard of signaling announcedby the police
Domestic automatic traffic signals installed
Synchronized-type signals in use
Budget allocation for traffic signals
Push-button signal forschoolchildren in use
Additional signals clarified bythe police
Road Traffic Enforcement Lawenacted
Semi-actuated signal control in use
Signals for the visuallyimpaired in use
Link actuated signal systemimported
Man-shaped signals forpedestrians installed
Wide-area signal control started
Specifications were issued by theNational Police Agency
The Emergency Measure Law Relating tothe Improvement of Traffic Safety Facilities
Scrambled crossing methodimplemented
Road Traffic Law's executiveregulation was revised.
Bus priority signal control implemented
Pedestrian signal with displayof waiting time in use
LED type signals in use
RemarksItemYear/Month
Table 1: Chronological table of traffic signals in Japan
Source: "Fifty-Year History of Traffic Signals in Japan" by the Association of Traffic Control Facilities
2,536 8,285 23,290 63,846 101,100 119,520 135,634 157,792 161,8911960 1965 1970 1975 1980 1985 1990 1994 1996
Table 2:Number of traffic signals installed [unit]
Number of traffic signals (See Table 2)2
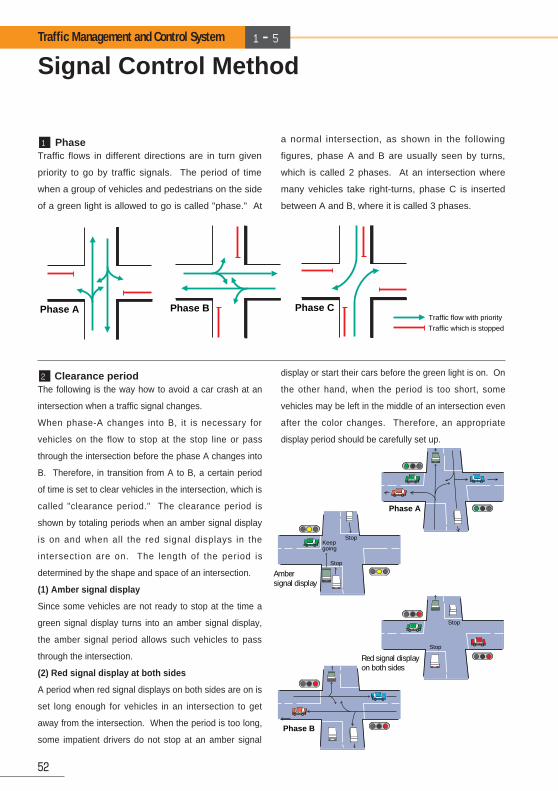
Signal Control Method
52
Traffic Management and Control System 1━5
Traffic flows in different directions are in turn given
priority to go by traffic signals. The period of time
when a group of vehicles and pedestrians on the side
of a green light is allowed to go is called "phase." At
a normal intersection, as shown in the following
figures, phase A and B are usually seen by turns,
which is called 2 phases. At an intersection where
many vehicles take right-turns, phase C is inserted
between A and B, where it is called 3 phases.
The following is the way how to avoid a car crash at an
intersection when a traffic signal changes.
When phase-A changes into B, it is necessary for
vehicles on the flow to stop at the stop line or pass
through the intersection before the phase A changes into
B. Therefore, in transition from A to B, a certain period
of time is set to clear vehicles in the intersection, which is
called "clearance period." The clearance period is
shown by totaling periods when an amber signal display
is on and when all the red signal displays in the
intersection are on. The length of the period is
determined by the shape and space of an intersection.
(1) Amber signal display
Since some vehicles are not ready to stop at the time a
green signal display turns into an amber signal display,
the amber signal period allows such vehicles to pass
through the intersection.
(2) Red signal display at both sides
A period when red signal displays on both sides are on is
set long enough for vehicles in an intersection to get
away from the intersection. When the period is too long,
some impatient drivers do not stop at an amber signal
display or start their cars before the green light is on. On
the other hand, when the period is too short, some
vehicles may be left in the middle of an intersection even
after the color changes. Therefore, an appropriate
display period should be carefully set up.
Phase A Phase BTraffic flow with priority
Phase C
Traffic which is stopped
Phase A
Phase B
Ambersignal display
Red signal displayon both sides
Keepgoing
Stop
Stop
Stop
Stop
Phase1
Clearance period2
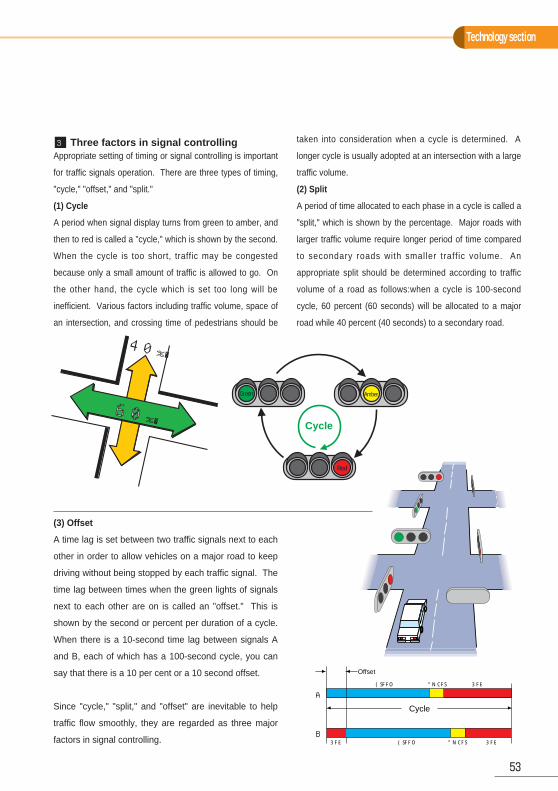
Technology section
53
Appropriate setting of timing or signal controlling is important
for traffic signals operation. There are three types of timing,
"cycle," "offset," and "split."
(1) Cycle
A period when signal display turns from green to amber, and
then to red is called a "cycle," which is shown by the second.
When the cycle is too short, traffic may be congested
because only a small amount of traffic is allowed to go. On
the other hand, the cycle which is set too long will be
inefficient. Various factors including traffic volume, space of
an intersection, and crossing time of pedestrians should be
taken into consideration when a cycle is determined. A
longer cycle is usually adopted at an intersection with a large
traffic volume.
(2) Split
A period of time allocated to each phase in a cycle is called a
"split," which is shown by the percentage. Major roads with
larger traffic volume require longer period of time compared
to secondary roads with smaller traff ic volume. An
appropriate split should be determined according to traffic
volume of a road as follows:when a cycle is 100-second
cycle, 60 percent (60 seconds) will be allocated to a major
road while 40 percent (40 seconds) to a secondary road.
Cycle
Offset
Green Amber Red
Green Amber RedRed
A
B
(3) Offset
A time lag is set between two traffic signals next to each
other in order to allow vehicles on a major road to keep
driving without being stopped by each traffic signal. The
time lag between times when the green lights of signals
next to each other are on is called an "offset." This is
shown by the second or percent per duration of a cycle.
When there is a 10-second time lag between signals A
and B, each of which has a 100-second cycle, you can
say that there is a 10 per cent or a 10 second offset.
Since "cycle," "split," and "offset" are inevitable to help
traffic flow smoothly, they are regarded as three major
factors in signal controlling.
6060%�
40%�
Cycle
Green Amber
Red
Three factors in signal controlling3
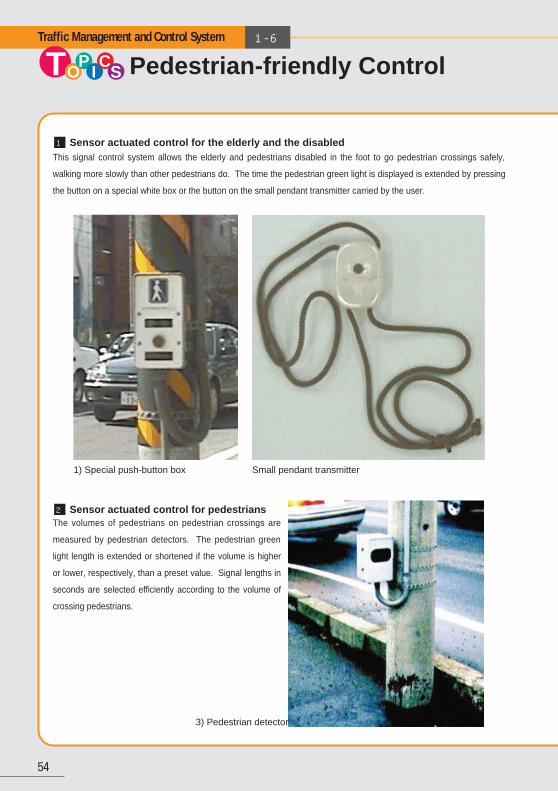
54
This signal control system allows the elderly and pedestrians disabled in the foot to go pedestrian crossings safely,
walking more slowly than other pedestrians do. The time the pedestrian green light is displayed is extended by pressing
the button on a special white box or the button on the small pendant transmitter carried by the user.
The volumes of pedestrians on pedestrian crossings are
measured by pedestrian detectors. The pedestrian green
light length is extended or shortened if the volume is higher
or lower, respectively, than a preset value. Signal lengths in
seconds are selected efficiently according to the volume of
crossing pedestrians.
3) Pedestrian detector
Small pendant transmitter1) Special push-button box
Traffic Management and Control System 1-6
Pedestrian-friendly ControlTOP
ICS
Sensor actuated control for the elderly and the disabled1
Sensor actuated control for pedestrians2
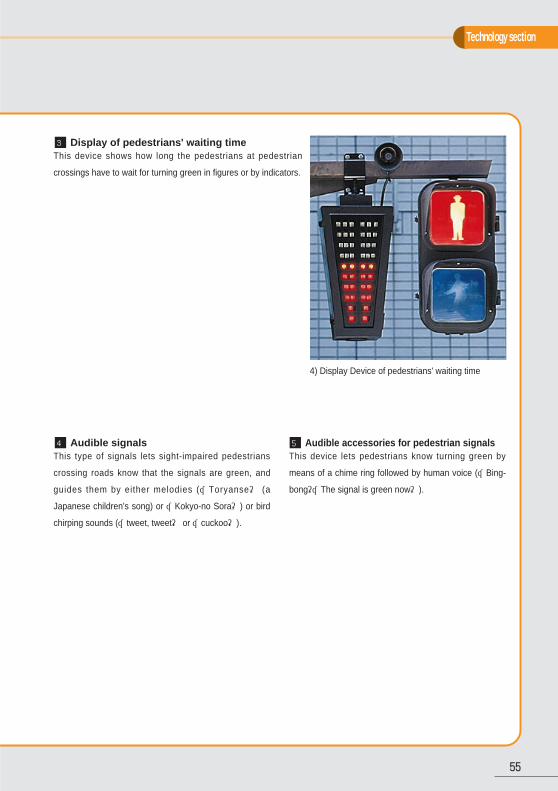
Technology section
55
This device shows how long the pedestrians at pedestrian
crossings have to wait for turning green in figures or by indicators.
This type of signals lets sight-impaired pedestrians
crossing roads know that the signals are green, and
guides them by either melodies (“Toryanse” (a
Japanese children's song) or “Kokyo-no Sora”) or bird
chirping sounds (“tweet, tweet” or “cuckoo”).
This device lets pedestrians know turning green by
means of a chime ring followed by human voice (“Bing-
bong”“The signal is green now”).
4) Display Device of pedestrians' waiting time
Display of pedestrians' waiting time3
Audible signals4 Audible accessories for pedestrian signals5
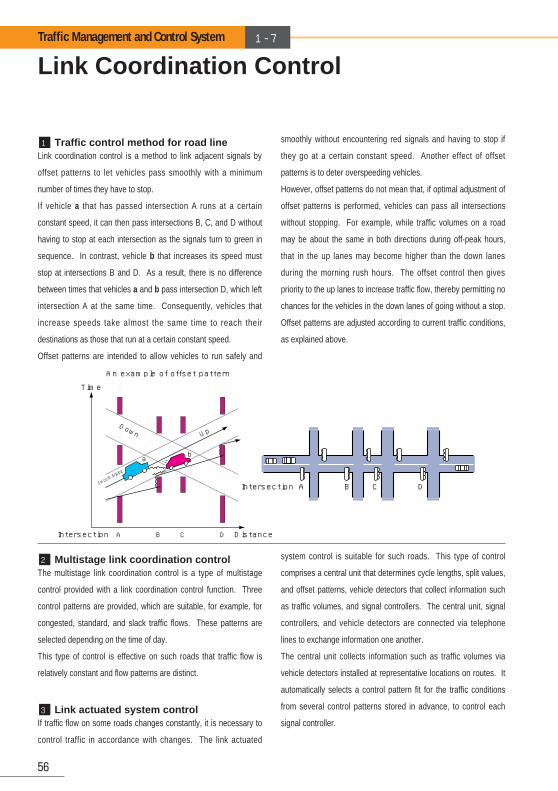
Link Coordination Control
56
Link coordination control is a method to link adjacent signals by
offset patterns to let vehicles pass smoothly with a minimum
number of times they have to stop.
If vehicle a that has passed intersection A runs at a certain
constant speed, it can then pass intersections B, C, and D without
having to stop at each intersection as the signals turn to green in
sequence. In contrast, vehicle b that increases its speed must
stop at intersections B and D. As a result, there is no difference
between times that vehicles a and b pass intersection D, which left
intersection A at the same time. Consequently, vehicles that
increase speeds take almost the same time to reach their
destinations as those that run at a certain constant speed.
Offset patterns are intended to allow vehicles to run safely and
smoothly without encountering red signals and having to stop if
they go at a certain constant speed. Another effect of offset
patterns is to deter overspeeding vehicles.
However, offset patterns do not mean that, if optimal adjustment of
offset patterns is performed, vehicles can pass all intersections
without stopping. For example, while traffic volumes on a road
may be about the same in both directions during off-peak hours,
that in the up lanes may become higher than the down lanes
during the morning rush hours. The offset control then gives
priority to the up lanes to increase traffic flow, thereby permitting no
chances for the vehicles in the down lanes of going without a stop.
Offset patterns are adjusted according to current traffic conditions,
as explained above.
The multistage link coordination control is a type of multistage
control provided with a link coordination control function. Three
control patterns are provided, which are suitable, for example, for
congested, standard, and slack traffic flows. These patterns are
selected depending on the time of day.
This type of control is effective on such roads that traffic flow is
relatively constant and flow patterns are distinct.
If traffic flow on some roads changes constantly, it is necessary to
control traffic in accordance with changes. The link actuated
system control is suitable for such roads. This type of control
comprises a central unit that determines cycle lengths, split values,
and offset patterns, vehicle detectors that collect information such
as traffic volumes, and signal controllers. The central unit, signal
controllers, and vehicle detectors are connected via telephone
lines to exchange information one another.
The central unit collects information such as traffic volumes via
vehicle detectors installed at representative locations on routes. It
automatically selects a control pattern fit for the traffic conditions
from several control patterns stored in advance, to control each
signal controller.
Intersection Distance
Intersection
Down
A B C D
A B C D
An example of offset pattern
Time
Up
Smooth driving
ab
Link actuated system control3
Traffic Management and Control System 1-7
Traffic control method for road line1
Multistage link coordination control2
Technology section
57
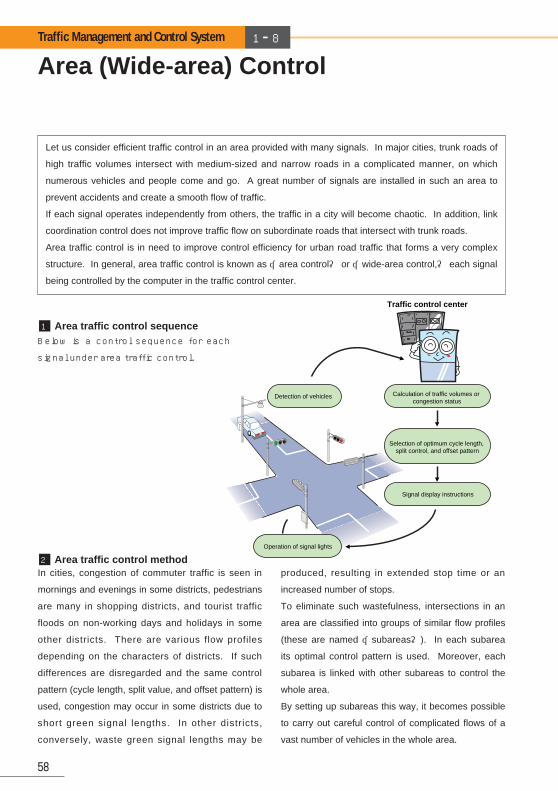
Area (Wide-area) Control
58
Traffic Management and Control System 1━8
Let us consider efficient traffic control in an area provided with many signals. In major cities, trunk roads of
high traffic volumes intersect with medium-sized and narrow roads in a complicated manner, on which
numerous vehicles and people come and go. A great number of signals are installed in such an area to
prevent accidents and create a smooth flow of traffic.
If each signal operates independently from others, the traffic in a city will become chaotic. In addition, link
coordination control does not improve traffic flow on subordinate roads that intersect with trunk roads.
Area traffic control is in need to improve control efficiency for urban road traffic that forms a very complex
structure. In general, area traffic control is known as “area control” or “wide-area control,” each signal
being controlled by the computer in the traffic control center.
Below is a control sequence for each
signal under area traffic control.
Traffic control center
Detection of vehicles Calculation of traffic volumes or congestion status
Selection of optimum cycle length, split control, and offset pattern
Signal display instructions
Operation of signal lights
Area traffic control sequence1
Area traffic control method2In cities, congestion of commuter traffic is seen in
mornings and evenings in some districts, pedestrians
are many in shopping districts, and tourist traffic
floods on non-working days and holidays in some
other districts. There are various flow profiles
depending on the characters of districts. If such
differences are disregarded and the same control
pattern (cycle length, split value, and offset pattern) is
used, congestion may occur in some districts due to
short green signal lengths. In other districts,
conversely, waste green signal lengths may be
produced, resulting in extended stop time or an
increased number of stops.
To eliminate such wastefulness, intersections in an
area are classified into groups of similar flow profiles
(these are named “subareas”). In each subarea
its optimal control pattern is used. Moreover, each
subarea is linked with other subareas to control the
whole area.
By setting up subareas this way, it becomes possible
to carry out careful control of complicated flows of a
vast number of vehicles in the whole area.
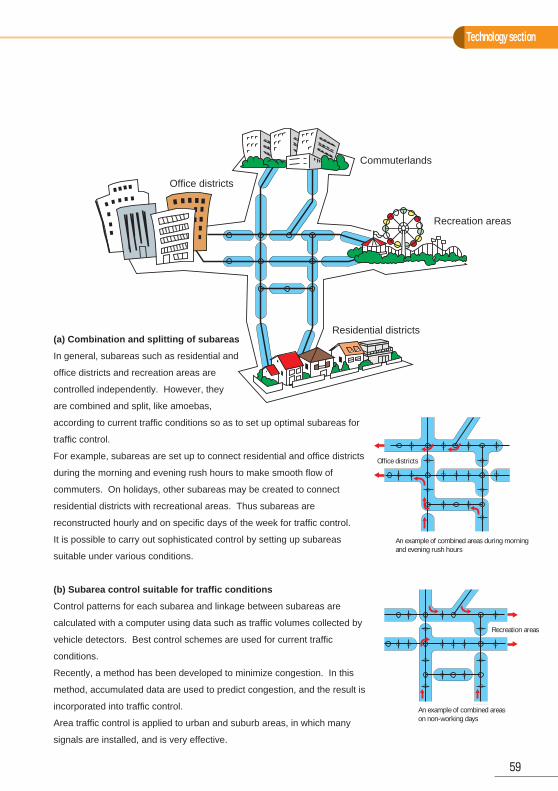
Technology section
59
Office districts
An example of combined areas during morning and evening rush hours
An example of combined areas on non-working days
Recreation areas
Commuterlands
Office districts
Recreation areas
Residential districts(a) Combination and splitting of subareas
In general, subareas such as residential and
office districts and recreation areas are
controlled independently. However, they
are combined and split, like amoebas,
according to current traffic conditions so as to set up optimal subareas for
traffic control.
For example, subareas are set up to connect residential and office districts
during the morning and evening rush hours to make smooth flow of
commuters. On holidays, other subareas may be created to connect
residential districts with recreational areas. Thus subareas are
reconstructed hourly and on specific days of the week for traffic control.
It is possible to carry out sophisticated control by setting up subareas
suitable under various conditions.
(b) Subarea control suitable for traffic conditions
Control patterns for each subarea and linkage between subareas are
calculated with a computer using data such as traffic volumes collected by
vehicle detectors. Best control schemes are used for current traffic
conditions.
Recently, a method has been developed to minimize congestion. In this
method, accumulated data are used to predict congestion, and the result is
incorporated into traffic control.
Area traffic control is applied to urban and suburb areas, in which many
signals are installed, and is very effective.
Information Supply Unit Information Boards and Other Devices
60
Traffic Management and Control System 1━9
The information supply unit is a general term for
equipment intended for real-t ime supply of
information to drivers, such as congestion, accidents,
roadworks, traffic regulations, and travel times.
(1) Information boards
Information boards are installed on the roadside to
supply traffic information. Boards in this category are
as follows: character information, variable message,
preset message, formulated information, small
(character) information, and small (travel time)
information boards.
(2) Roadside radio transmitters
These devices supply traffic information in voice
edited by voice synthesizers at the traffic control
centers. Radio transmitters and antennas installed
on roadside emit radio waves. Drivers can access
this information on their car radios at 1620 kHz.
(3) Traffic information service via telephone and fax
Users can access traffic information edited by traffic
control computers by calling specific numbers. This
information is available in voice for telephones or in
maps and charts for fax machines.
(4) Information terminals
These terminals are mainly installed at public facilities
for user convenience. Traffic information is supplied
in maps and characters on monitor screens.
(5) Vehicle Information and Communication System
(VICS)
VICS is an ITS project promoted jointly by the
National Police Agency, the Ministry of Posts and
Telecommunications, and the Ministry of
Construction. Traffic information collected by local
police headquarters and road administrators is
transmitted to the VICS center through Japan Road
Traffic Information Center.
The VICS center edits and processes the traffic
information and distribute it via the following three
media. (See also descriptions of VICS on page 90.)
● Infrared beacons (infrared ray) intended for
surface roads
● Radio beacons (quasi-microwaves) intended for
expressways
● FM multiplex broadcasts intended for wide areas
The traffic control center (See also description of the
traffic control centers on page 42) receives various
information about traffic conditions such as traffic
volumes, congestion lengths, travel times which are
collected automatically by vehicle detectors including
infrared beacons, traffic accident information reported
by police men at the site, and other related
information such as roadworks and traffic regulations,
edits and processes them , thereafter supply the
following contents, although they slightly differ
depending on the supply media.
● Congestion status: road names, congestion
lengths, and degree of congestion
● Travel times: road names and travel times
● Incident information: road names, location names,
incident information
(accidents, traffic regulations, etc.)
● Parking information: location and space availability
●Wide-area information: messages, cautions, etc.
Information Supply Unit1
Types2
Information to be supplied3
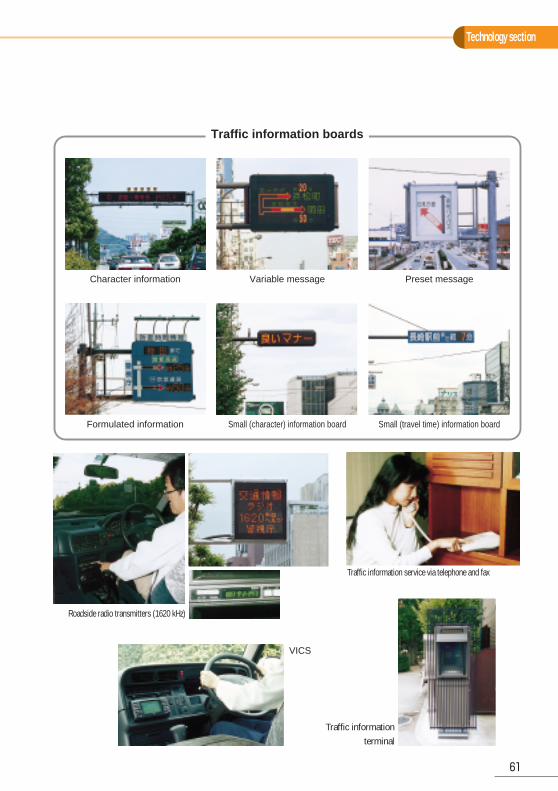
Technology section
61
Traffic information boards
Character information Variable message
Small (character) information board Small (travel time) information board
Preset message
Formulated information
Roadside radio transmitters (1620 kHz)
VICS
Traffic information service via telephone and fax
Traffic informationterminal
Effects of the Traffic Control System
62
Traffic Management and Control System 1━10
Managed and operated by the police, the traffic
control system is a unified system for ensuring safe
and smooth traffic flow. It is designed to distribute
and guide fitly the volume and the flow of the traffic in
the overcrowded cities based on the road network.
This system works to support urban mechanism
through making the most of facilities of motor vehicle.
Traffic safety facilities that constitute the traffic control
system include those listed below. These facilities
are developed and maintained under the Emergency
Measures Law Relating to the Improvement of Traffic
Safety Facilities established in 1966.
(1) Traffic control centers (They are established at the
Police Headquarters. In some main cities, city
centers are also established.)
(2) Information collection equipment such as CCTV
cameras and vehicle detectors
(3) Information supply unit including information
boards and roadside radio transmitters
(4) Traffic signals
(5) Equipment for information exchanges with
neighboring prefectures and other agencies
(1) Collects traffic information from policemen at site,
CCTV cameras, vehicle detectors, and other devices.
(2) Analyzes, processes, and records collected traffic
information.
(3) Controls traffic signals fitly based on the results of
analyses and processing of traffic information.
(4) Provides drivers with traffic information via
information supply unit and other devices (see also
page 60).
The traffic control system has functions shown above.
These functions are supervised by the traffic control
center established at the Police Headquarters in
every prefecture. The center works as the core of the
traffic management and control system.
Economic benefits were calculated on each category
to evaluate the effects of the system. Results are
shown in the table.
Benefits were evaluated in terms both of smooth
traffic flow and reduced accidents.
The traffic management and control system is
constantly improved for advancement along with
technological progress. Universal Traff ic
Management Systems (UTMS: see also page 74)
were developed as an innovative concept to
implement ITS. Based on UTMS, the traff ic
management and control system is constructed so as
to realize a traffic society that is safe, comfortable,
and environmentally friendly.
The Traffic Control System1
Traffic Control System Equipment2
How the Traffic Control System Works3
Effects in Detail4
Aims5
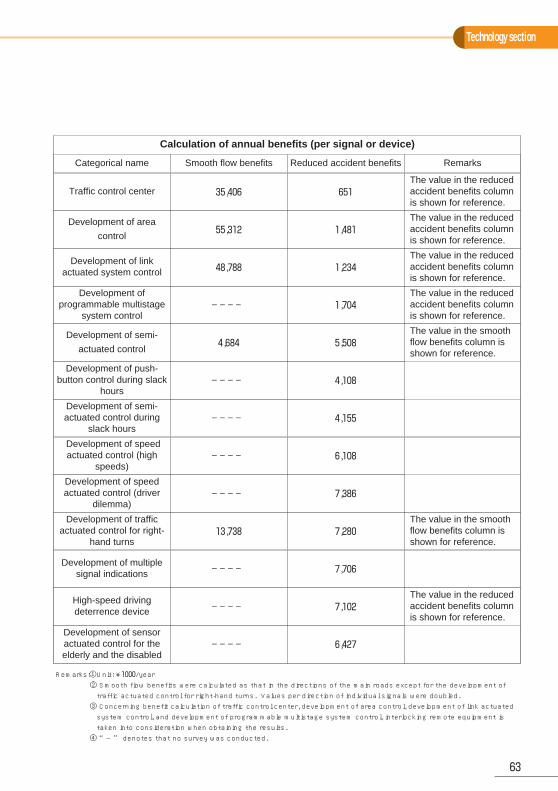
Technology section
63
Calculation of annual benefits (per signal or device)
Categorical name
Traffic control center
Development of area
control
Development of linkactuated system control
Development ofprogrammable multistage
system control
Development of semi-
actuated control
Development of push-button control during slack
hours
Development of semi-actuated control during
slack hours
Development of speedactuated control (high
speeds)
Development of speedactuated control (driver
dilemma)
Development of trafficactuated control for right-
hand turns
Development of multiplesignal indications
High-speed drivingdeterrence device
Development of sensoractuated control for theelderly and the disabled
Smooth flow benefits
35,406
55,312
48,788
────
4,684
────
────
────
────
13,738
────
────
────
Reduced accident benefits
651
1,481
1,234
1,704
5,508
4,108
4,155
6,108
7,386
7,280
7,706
7,102
6,427
Remarks
The value in the reducedaccident benefits columnis shown for reference.
The value in the reducedaccident benefits columnis shown for reference.
The value in the reducedaccident benefits columnis shown for reference.
The value in the reducedaccident benefits columnis shown for reference.
The value in the smoothflow benefits column isshown for reference.
The value in the smoothflow benefits column isshown for reference.
The value in the reducedaccident benefits columnis shown for reference.
Remarks:①Unit: ¥1000/year② Smooth flow benefits were calculated as that in the directions of the main roads except for the development oftraffic actuated control for right-hand turns. Values per direction of individual signals were doubled.③ Concerning benefit calculation of traffic control center, development of area control, development of link actuatedsystem control, and development of programmable multistage system control, interlocking remote equipment istaken into consideration when obtaining the results.④ “―” denotes that no survey was conducted.
Parking Guidance Systems
64
Traffic Management and Control System 1━11
Parking guidance systems provided in urban areas
are connected with the traffic control centers to carry
out unified control of parking information at the traffic
control centers.
The traff ic control centers combine parking
information and other traffic information to supply
information such as parking locations, availability,
congestion near parking areas, using parking
guidance signs and other devices.
Parking guidance systems use entrance signs,
parking guidance signs, and other devices.
Drivers can learn parking space availabil i ty
information in advance, so they can go to nearby
parking areas with available space immediately.
Drivers can also learn congestion status near parking
areas, so they can avoid congestion.
The numbers of vehicles dawdling on the road
searching and waiting for parking space are expected
to decrease.
Parking Guidance Systems1
Parking Guidance System Equipment2
Effects3
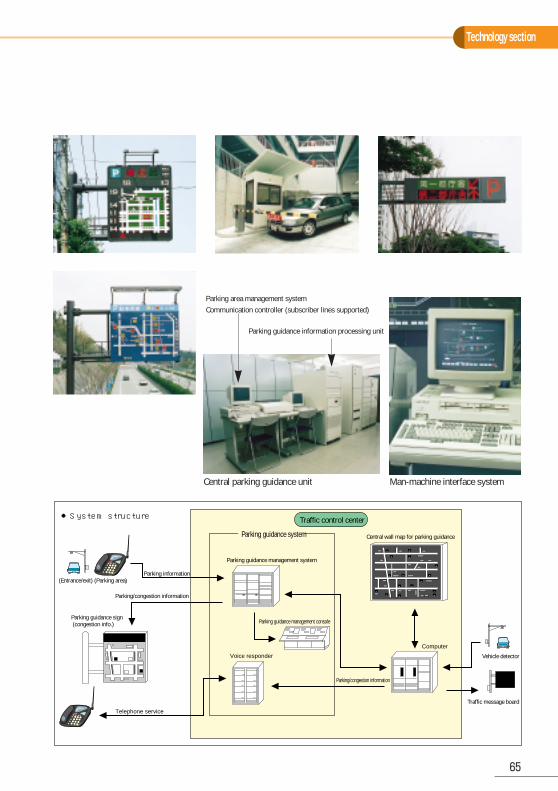
Technology section
65
●System structure
(Entrance/exit) (Parking area)Parking information
Parking/congestion information
Parking guidance sign (congestion info.)
Telephone service
Voice responder
Parking guidance management console
Parking/congestion information
Computer
Vehicle detector
Traffic message board
Parking guidance management system
Central wall map for parking guidanceParking guidance system
Traffic control center
Central parking guidance unit Man-machine interface system
Parking area management systemCommunication controller (subscriber lines supported)
Parking guidance information processing unit
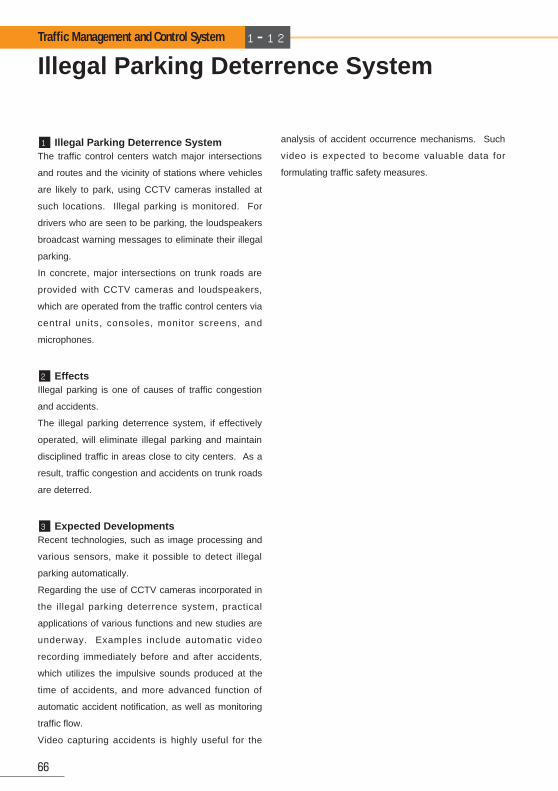
Illegal Parking Deterrence System
66
Traffic Management and Control System 1━12
The traffic control centers watch major intersections
and routes and the vicinity of stations where vehicles
are likely to park, using CCTV cameras installed at
such locations. Illegal parking is monitored. For
drivers who are seen to be parking, the loudspeakers
broadcast warning messages to eliminate their illegal
parking.
In concrete, major intersections on trunk roads are
provided with CCTV cameras and loudspeakers,
which are operated from the traffic control centers via
central units, consoles, monitor screens, and
microphones.
Illegal parking is one of causes of traffic congestion
and accidents.
The illegal parking deterrence system, if effectively
operated, will eliminate illegal parking and maintain
disciplined traffic in areas close to city centers. As a
result, traffic congestion and accidents on trunk roads
are deterred.
Recent technologies, such as image processing and
various sensors, make it possible to detect illegal
parking automatically.
Regarding the use of CCTV cameras incorporated in
the illegal parking deterrence system, practical
applications of various functions and new studies are
underway. Examples include automatic video
recording immediately before and after accidents,
which utilizes the impulsive sounds produced at the
time of accidents, and more advanced function of
automatic accident notification, as well as monitoring
traffic flow.
Video capturing accidents is highly useful for the
analysis of accident occurrence mechanisms. Such
video is expected to become valuable data for
formulating traffic safety measures.
Illegal Parking Deterrence System1
Expected Developments3
Effects2
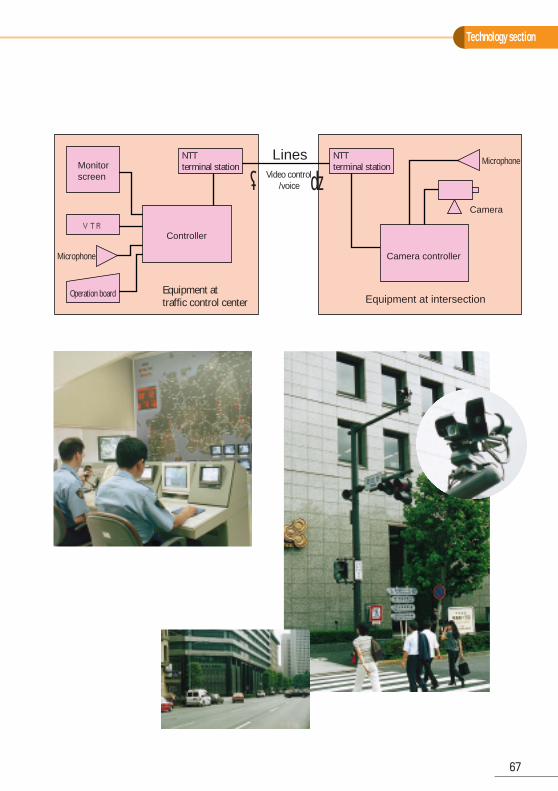
Technology section
67
Monitorscreen
VTR
Microphone
Microphone
Operation board
Controller
Equipment at traffic control center
NTT terminal station
NTT terminal station
Camera controller
Camera
Equipment at intersection
Video control/voice
Lines
(� )�
High-speed Driving Deterrence System
68
Traffic Management and Control System 1━13
The high-speed driving deterrence system is provided
for road sections in which traffic accidents frequently
occur due to overspeeding and reckless driving is
seen constantly. It is one of safety facilities intended
for deterrence of traffic accidents and noise.
In concrete, the system measures speeds of moving
vehicles. For overspeeding ones, warning boards
display messages such as “Slow Down.” Cautions
or warnings are issued directly to drivers to let them
to reduce speed. It is also possible to control signals
ahead of moving vehicles to turn red forcibly, so that
they stop at signals and drive safely.
Overspeeding vehicles and careless driving decrease
in numbers. The system is also useful for prevention
of accidents caused by overspeeding.
The system is capable of real-time recognition of
vehicles that persist in overspeeding as violations.
Their license numbers and features may be sent to
nearby patrol cars, thereby catching violations
immediately. This has become possible by the
progress of science and technologies, especially, the
digital technology. Some prefectures have already
introduced and put into operation.
High-speed Driving Deterrence System1
Effects2
Expected Developments3
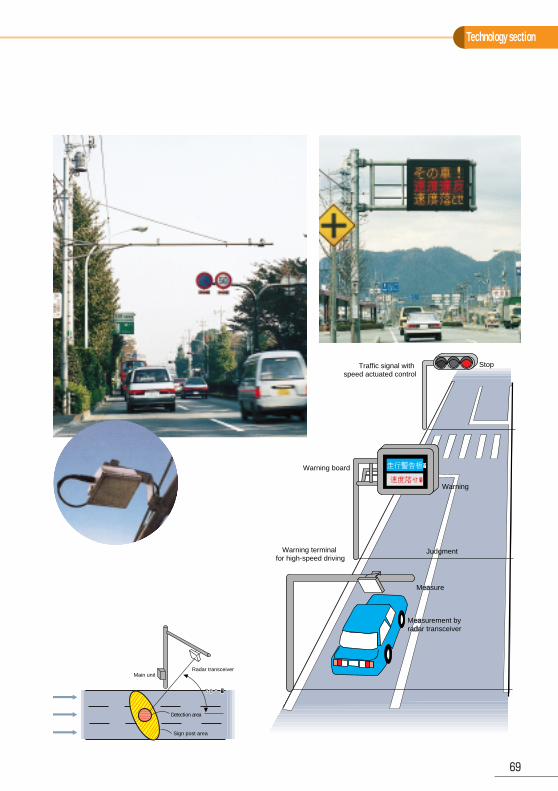
Technology section
69
走行警告板�
速度落せ�
Traffic signal with speed actuated control
Stop
Warning board
Warning
Warning terminal for high-speed driving
Judgment
Measurement by radar transceiver,Measurement by radar transceiver
MeasureMeasure
76°�76°�
Radar transceiverMain unit
Detection area
Sign post area
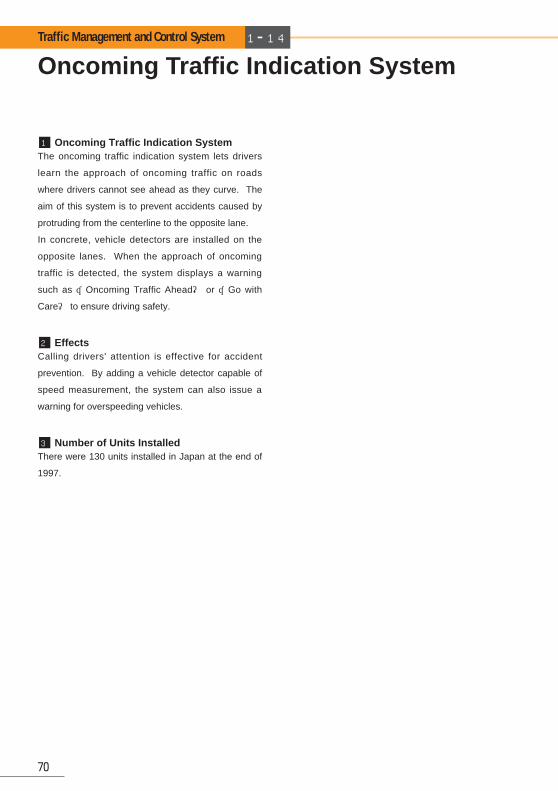
Oncoming Traffic Indication System
70
Traffic Management and Control System 1━14
The oncoming traffic indication system lets drivers
learn the approach of oncoming traffic on roads
where drivers cannot see ahead as they curve. The
aim of this system is to prevent accidents caused by
protruding from the centerline to the opposite lane.
In concrete, vehicle detectors are installed on the
opposite lanes. When the approach of oncoming
traffic is detected, the system displays a warning
such as “Oncoming Traffic Ahead” or “Go with
Care” to ensure driving safety.
Calling drivers' attention is effective for accident
prevention. By adding a vehicle detector capable of
speed measurement, the system can also issue a
warning for overspeeding vehicles.
There were 130 units installed in Japan at the end of
1997.
Oncoming Traffic Indication System1
Effects2
Number of Units Installed3
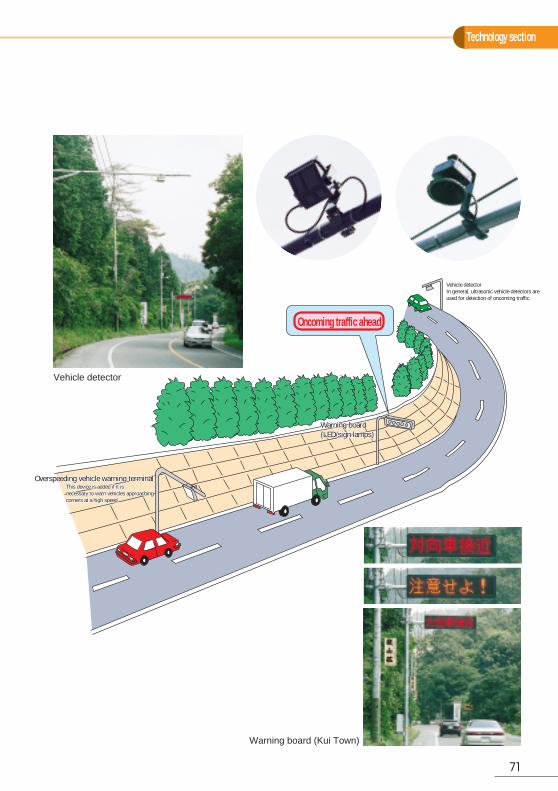
Technology section
71
Oncoming traffic ahead
Vehicle detectorIn general, ultrasonic vehicle detectors are used for detection of oncoming traffic.
Overspeeding vehicle warning terminalOverspeeding vehicle warning terminal
Warning board(LED/sign lamps)Warning board(LED/sign lamps)
This device is added if it is This device is added if it is necessary to warn vehicles approaching necessary to warn vehicles approaching corners at a high speed.
Overspeeding vehicle warning terminalThis device is added if it is necessary to warn vehicles approaching corners at a high speed.
Vehicle detector
Warning board (Kui Town)
Centerline Shifting System
72
Traffic Management and Control System 1━15
The centerline shifting system uses centerline signs,
variable signs, special lights, and other devices to set
up centerline shifting sections. In these sections,
more lanes are allotted in the direction of higher
traffic volumes.
This system deals with predictable variations in traffic
demands. During morning and evening rush hours,
it, for example, increases up lanes in the morning and
down lanes in the evening.
Traffic flow increases by allotting more lanes in the
directions of high traffic volumes, thereby deterring or
alleviating congestion.
The centerline shifting system improves the efficiency
of l imited roads. It is an effective means for
promoting the smooth traffic flow program.
Sufficient publicity periods are provided before
introducing the centerline shifting system so that
every driver may know the implementation of the
system. Police officers attend at the early stage of
introduction to control and guide vehicles.
In order to reverse lane directions in the morning and
evening, vehicles are prohibited to enter the section
for some minutes to clear the vehicles therein.
The time taken for clearing vehicles depends on the
length of the centerline shifting section.
Centerline Shifting System1
Effects2
Changes in Lane Usage3
Reversing Lane Directions4
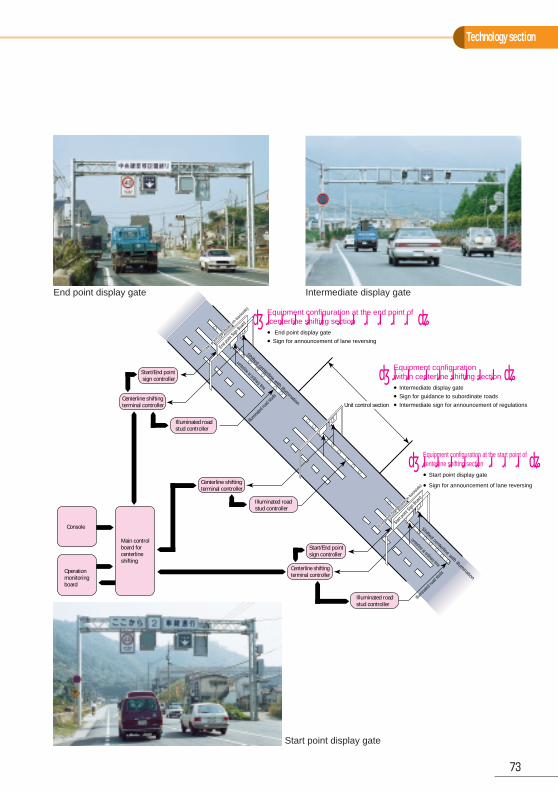
Technology section
73
〔 〕�
Start/End point sign controller
Start/End pointsign controller
Centerline shifting terminal controller
Centerline shiftingterminal controller
Centerline shifting terminal controller
Main control board for centerlineshifting
Illuminated road stud controller
Illuminated roadstud controller
Illuminated roadstud controller
Console
Operation monitoring board
Unit control section
Equipment configuration at the end point of centerline shifting section● End point display gate
●Sign for announcement of lane reversing
〔 〕�Equipment configuration within centerline shifting section●Intermediate display gate
●Sign for guidance to subordinate roads
●Intermediate sign for announcement of regulations
〔 〕�Equipment configuration at the start point of centerline shifting section●Start point display gate
●Sign for announcement of lane reversing
(Sta
rt po
int S
ign B
oard
on
back
side)
(Sta
rt po
int S
ign B
oard
on
back
side)
(Sta
rt po
int S
ign B
oard
on
back
side)
End po
int Sign
Board
Start p
oint S
ign Boa
rd
(End
poin
t Sign
Boa
rd o
n ba
cksid
e)
(End
poin
t Sign
Boa
rd o
n ba
cksid
e)
(End
poin
t Sign
Boa
rd o
n ba
cksid
e)
Shifted centerline with illumination
centerline at ordinary time
Illumina
ted ro
ad st
uds
Shifted centerline with illumination
centerline at ordinary time
Illumina
ted ro
ad st
uds
End point display gate
Start point display gate
Intermediate display gate
UTMS21
74
Universal Traffic Management Systems 2━1
The annual fatalities by traffic accidents in Japan has
decreased to below 10,000 but still remains high
(9,000 range), with the number of traffic accidents
themselves increasing annually.
Meanwhile, the percentage of the aged in Japan's
total population is also increasing sharply. In view of
these, we have been engaged in R&D of practical
Intelligent Transport Systems (ITS), which combines
information communication, electronics and various
other high technologies, taking persons, roads,
vehicles and all other traffic-related factors integrally.
For practical ITS, the National Police Agency has
been promoting the Universal Traffic Management
Systems 21 (UTMS21) concept. The aim is to create
a "safe, comfortable and environment-friendly
automobile society", providing vehicle drivers with
real-t ime traff ic information through two-way
communication with each vehicle, via infrared
veacons -- the key infrastructure of the their sub-
systems.
As shown in right-above figure, the UTMS21 involves
nine systems: Integrated Traffic Control Systems
(ITCS) as a core, Advanced Mobile Information
Systems (AMIS), Public Transportation Priority
Systems (PTPS), Mobile Operation Control Systems
(MOCS), Dynamic Route Guidance Systems
(DRGS), Help System for Emergency Life Saving and
Public Safety (HELP), Environmental Protection
Management Systems (EPMS), Driving Safety
Support Systems (DSSS), and Intelligent Integrated
ITV Systems (IIIS). Some of these systems have
already been realized, some being in R&D process.
AMIS, PTPS and MOCS are already put to practical
service.
With AMIS, traffic information collected by the traffic
control center at each prefectural police headquarters
is supplied to the Vehicle Information and
Communication Systems (VICS) center. At present
the traffic information is being provided for drivers via
FM multiplex broadcasting, infrared beacons and
radio beacons in the Tokyo Metropolitan area, the
Chubu area and the Kinki area.
PTPS/MOCS have been introduced in Sapporo city,
Hokkaido since April 1996. These systems, using
traffic safety facilities (infrared beacons, traffic
signals, traffic control centers etc.) installed by the
police in Sapporo, have successfully improved bus
service punctuality and increased the number of
people using buses in consequence.
To create an environment friendly to physically
impaired persons as well as to the aged persons who
are increasing in number at a rapid pace, the National
Police Agency has been making efforts for early
introduction of DSSS. The Agency has also been
dedicated in R&D of EPMS, to give solutions to the
pollution issues caused by CO2 and NOx emissions,
which are the subject of global concern.
For future tasks, the National Police Agency also
considers development of new sub-systems using
infrared beacons, in the fields of efficient physical
distribution support system, traff ic demand
management system, pedestrian support system etc.
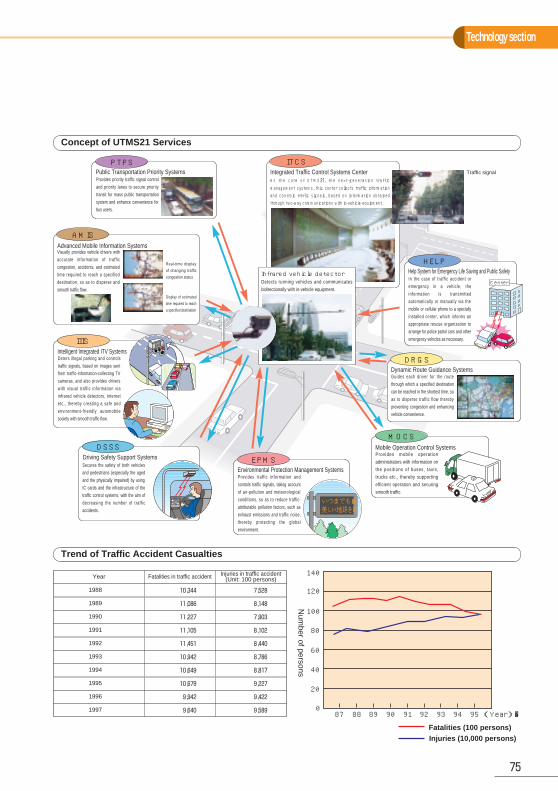
Technology section
75
Concept of UTMS21 Services
Trend of Traffic Accident Casualties
Fatalities (100 persons)Injuries (10,000 persons)
140
120
100
80
60
40
20
0
Num
ber of persons
87 88 89 90 91 92 93 94 95 (Year)�
Injuries in traffic accident(Unit: 100 persons)Fatalities in traffic accidentYear
1988 7,52810,344
1989 8,14811,086
1990 7,90311,227
1991 8,10211,105
1992 8,44011,451
1993 8,78610,942
1994 8,81710,649
1995 9,22710,679
1996 9,4229,942
1997 9,5899,640
PTPS
Provides priority traffic signal control
and priority lanes to secure priority
transit for mass public transportation
system and enhance convenience for
bus users.
HELP
In the case of traff ic accident or
emergency in a vehicle, the
information is transmitted
automatically or manually via the
mobile or cellular phone to a specially
installed center, which informs an
appropriate rescue organization to
arrange for police patrol cars and other
emergency vehicles as necessary.
DRGS
Guides each driver for the route
through which a specified destination
can be reached in the shortest time, so
as to disperse traffic flow thereby
preventing congestion and enhancing
vehicle convenience.
MOCS
Provides mobile operation
administrators with information on
the positions of buses, taxis,
trucks etc., thereby supporting
efficient operation and securing
smooth traffic.
ITCS
As the core of UTMS21, the next-generation traff icmanagement systems, this center collects traffic informationand controls traffic signals, based on information obtainedthrough two-way communications with in-vehicle equipment.
AMIS
Visually provides vehicle drivers with
accurate information of traff ic
congestion, accidents, and estimated
time required to reach a specified
destination, so as to disperse and
smooth traffic flow.
Real-time display
of changing traffic
congestion status
Display of estimated
time required to reach
a specified destination
IIIS
Deters illegal parking and controls
traffic signals, based on images sent
from traffic-information-collecting TV
cameras, and also provides drivers
with visual traff ic information via
infrared vehicle detectors, Internet
etc., thereby creating a safe and
environment-fr iendly automobile
society with smooth traffic flow.
DSSS
Secures the safety of both vehicles
and pedestrians (especially the aged
and the physically impaired) by using
IC cards and the infrastructure of the
traffic control systems, with the aim of
decreasing the number of traff ic
accidents.
EPMS
Provides traff ic information and
controls traffic signals, taking account
of air-pollution and meteorological
conditions, so as to reduce traffic-
attributable pollution factors, such as
exhaust emissions and traffic noise,
thereby protecting the global
environment.
Traffic signal
Infrared vehicle detectorDetects running vehicles and communicates
bidirectionally with in-vehicle equipment.Center
いつまでも�美しい地球を�
Public Transportation Priority Systems
Advanced Mobile Information Systems
Intelligent Integrated ITV Systems
Driving Safety Support Systems
Environmental Protection Management Systems
Mobile Operation Control Systems
Dynamic Route Guidance Systems
Help System for Emergency Life Saving and Public Safety
Integrated Traffic Control Systems Center
ITS (Intelligent Transport System)
76
Universal Traffic Management Systems 2━2
Today, the term "ITS" is often used in various
government guidelines and newspapers. This "ITS" is
an abbreviation for Intelligent Transport System. In
Japan, this term is translated as "advanced road
traffic system."
ITS was introduced as a "trump" in an effort to create
a safe, comfortable, and environment friendly traffic
society. Information communication technology,
electronics technology, other science and technology
are utilized to tackle problems including traffic
accidents and traffic congestion in recent years.
Research and development on ITS have been under
way actively in advanced countries, including Japan,
European countries, and the United States.
Research and development on ITS in Japan have
been led by five relevant ministries and agencies
including the National Police Agency, industries and
academia.
Regarding the specific commitments into ITS in
Japan, the Japanese Government established "The
Advanced Information and Telecommunications
Society Promotion Headquarters" (The Promotion
Headquarters), in which the Prime Minister is the
chairman and concerned ministers are members,
who issued the governmental basic policy, titled as
"Basic Guidelines on the Promotion of an Advanced
Information and Telecommunications Society" in
February 1995. Based on this basic policy, the five
relevant Agency and Ministries jointly prepared a
guideline, named as "Guidelines on the Increasing
Use of Information and Communications in the Fields
of Roads, Traffic, and Vehicles" in August 1995.
This guideline becomes the fundamentals of the
"Comprehensive Plan for ITS in Japan" issued in
July, 1996, which was also jointly prepared by the
said five relevant Agency and Ministries. Following
are the area for ITS development raised by the said
Comprehensive Plan;
① Advances in navigation system
② Electronic toll collection system
③ Assistance for safe driving
④ Optimization of traffic management
⑤ Increasing efficiency in road management
⑥ Support for public transport
⑦ Increasing efficiency in commercial vehicles
operation
⑧ Support for pedestrian
⑨ Support for emergency vehicle operation
The National Police Agency advocates UTMS21,
which is the ITS we promote based on the said
Comprehensive Plan for ITS. At present, some of the
subsystems in UTMS21 are in use, some are under
implementation and some are in research and
development stage. Especially, the National Police
Agency is working at present on research and
development of DSSS to support the elderly and
handicapped, and also is giving priority to traffic
pollution matter such as CO2, NOx, and noise. The
research and development has made progress to the
point where implementation of the Environment
Protection Management Systems is close at hand.
The details are in the chapter of UTMS21(page 74).
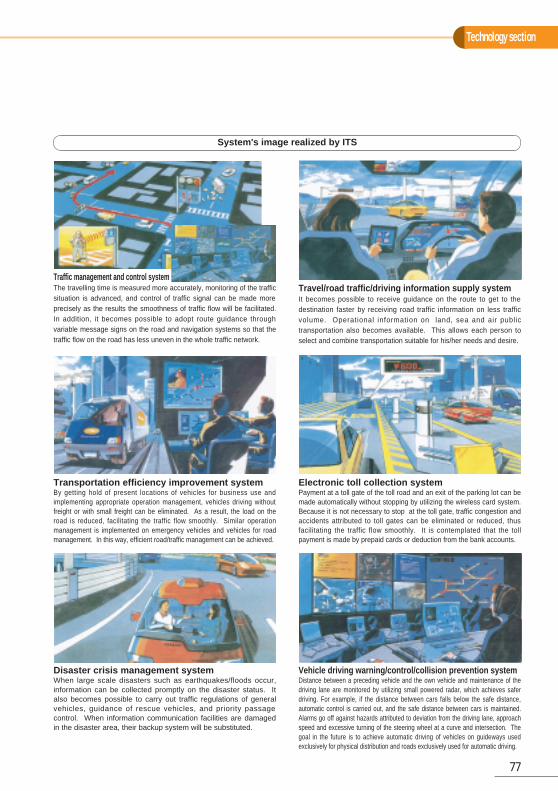
Technology section
77
Traffic management and control systemThe travelling time is measured more accurately, monitoring of the trafficsituation is advanced, and control of traffic signal can be made moreprecisely as the results the smoothness of traffic flow will be facilitated.In addition, it becomes possible to adopt route guidance throughvariable message signs on the road and navigation systems so that thetraffic flow on the road has less uneven in the whole traffic network.
Transportation efficiency improvement systemBy getting hold of present locations of vehicles for business use andimplementing appropriate operation management, vehicles driving withoutfreight or with small freight can be eliminated. As a result, the load on theroad is reduced, facilitating the traffic flow smoothly. Similar operationmanagement is implemented on emergency vehicles and vehicles for roadmanagement. In this way, efficient road/traffic management can be achieved.
Disaster crisis management systemWhen large scale disasters such as earthquakes/floods occur,information can be collected promptly on the disaster status. Italso becomes possible to carry out traffic regulations of generalvehicles, guidance of rescue vehicles, and priority passagecontrol. When information communication facilities are damagedin the disaster area, their backup system will be substituted.
Travel/road traffic/driving information supply systemIt becomes possible to receive guidance on the route to get to thedestination faster by receiving road traffic information on less trafficvolume. Operational information on land, sea and air publictransportation also becomes available. This allows each person toselect and combine transportation suitable for his/her needs and desire.
Electronic toll collection systemPayment at a toll gate of the toll road and an exit of the parking lot can bemade automatically without stopping by utilizing the wireless card system.Because it is not necessary to stop at the toll gate, traffic congestion andaccidents attributed to toll gates can be eliminated or reduced, thusfacilitating the traffic flow smoothly. It is contemplated that the tollpayment is made by prepaid cards or deduction from the bank accounts.
Vehicle driving warning/control/collision prevention systemDistance between a preceding vehicle and the own vehicle and maintenance of thedriving lane are monitored by utilizing small powered radar, which achieves saferdriving. For example, if the distance between cars falls below the safe distance,automatic control is carried out, and the safe distance between cars is maintained.Alarms go off against hazards attributed to deviation from the driving lane, approachspeed and excessive turning of the steering wheel at a curve and intersection. Thegoal in the future is to achieve automatic driving of vehicles on guideways usedexclusively for physical distribution and roads exclusively used for automatic driving.
System's image realized by ITS
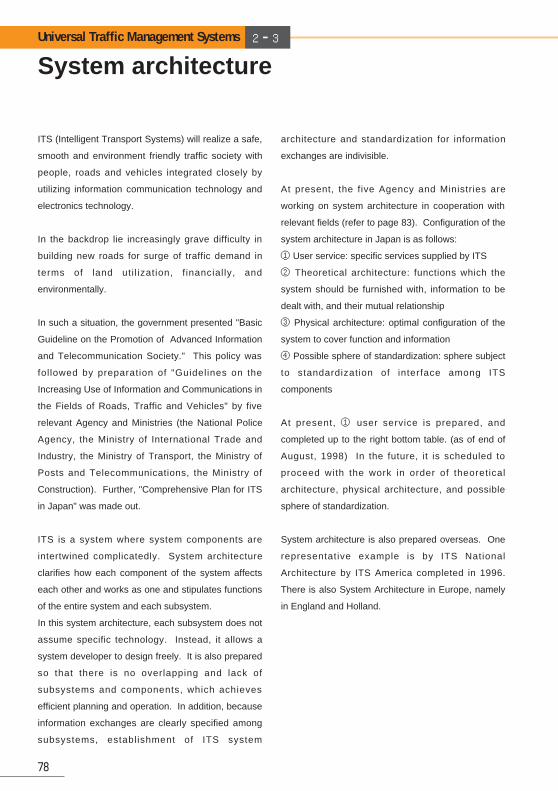
System architecture
78
Universal Traffic Management Systems 2━3
ITS (Intelligent Transport Systems) will realize a safe,
smooth and environment friendly traffic society with
people, roads and vehicles integrated closely by
utilizing information communication technology and
electronics technology.
In the backdrop lie increasingly grave difficulty in
building new roads for surge of traffic demand in
terms of land uti l ization, f inancially, and
environmentally.
In such a situation, the government presented "Basic
Guideline on the Promotion of Advanced Information
and Telecommunication Society." This policy was
followed by preparation of "Guidelines on the
Increasing Use of Information and Communications in
the Fields of Roads, Traffic and Vehicles" by five
relevant Agency and Ministries (the National Police
Agency, the Ministry of International Trade and
Industry, the Ministry of Transport, the Ministry of
Posts and Telecommunications, the Ministry of
Construction). Further, "Comprehensive Plan for ITS
in Japan" was made out.
ITS is a system where system components are
intertwined complicatedly. System architecture
clarifies how each component of the system affects
each other and works as one and stipulates functions
of the entire system and each subsystem.
In this system architecture, each subsystem does not
assume specific technology. Instead, it allows a
system developer to design freely. It is also prepared
so that there is no overlapping and lack of
subsystems and components, which achieves
efficient planning and operation. In addition, because
information exchanges are clearly specified among
subsystems, establishment of ITS system
architecture and standardization for information
exchanges are indivisible.
At present, the five Agency and Ministries are
working on system architecture in cooperation with
relevant fields (refer to page 83). Configuration of the
system architecture in Japan is as follows:
① User service: specific services supplied by ITS
② Theoretical architecture: functions which the
system should be furnished with, information to be
dealt with, and their mutual relationship
③ Physical architecture: optimal configuration of the
system to cover function and information
④ Possible sphere of standardization: sphere subject
to standardization of interface among ITS
components
At present, ① user service is prepared, and
completed up to the right bottom table. (as of end of
August, 1998) In the future, it is scheduled to
proceed with the work in order of theoretical
architecture, physical architecture, and possible
sphere of standardization.
System architecture is also prepared overseas. One
representative example is by ITS National
Architecture by ITS America completed in 1996.
There is also System Architecture in Europe, namely
in England and Holland.
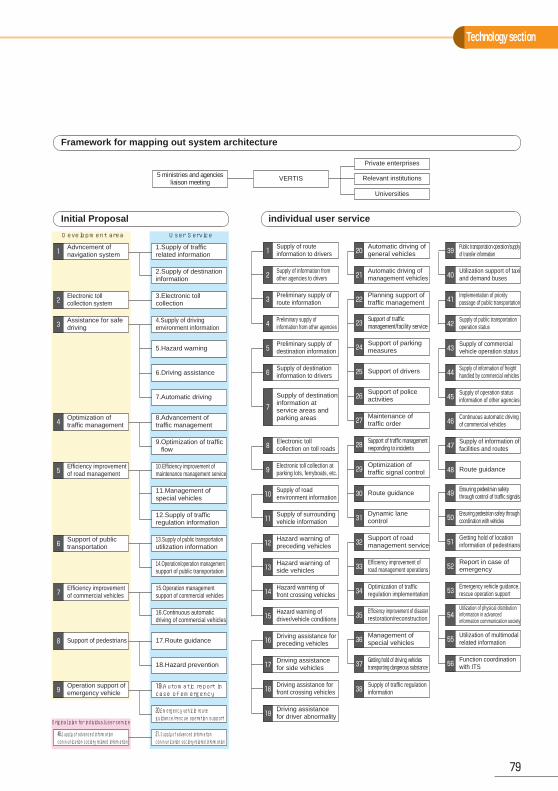
Development area
Original plan for individual user service
User Service
Technology section
79
Advncement ofnavigation system1
Electronic tollcollection system2
Assistance for safedriving3
Optimization oftraffic management4
Efficiency improvementof road management5
Support of publictransportation6
Efficiency improvementof commercial vehicles7
Support of pedestrians8
Operation support ofemergency vehicle9
46.Supply of advanced informationcommunication society related information
21. Supply of advanced informationcommunication society related information
1.Supply of trafficrelated information
5 ministries and agenciesliaison meeting VERTIS
2.Supply of destinationinformation
3.Electronic tollcollection
Private enterprises
Relevant institutions
Universities
4.Supply of drivingenvironment information
5.Hazard warning
6.Driving assistance
7.Automatic driving
8.Advancement oftraffic management
9.Optimization of trafficflow
10.Efficiency improvement ofmaintenance management service
11.Management ofspecial vehicles
12.Supply of trafficregulation information
13.Supply of public transportationutilization information
14.Operation/operation managementsupport of public transportation
15.Operation managementsupport of commercial vehicles
16.Continuous automaticdriving of commercial vehicles
17.Route guidance
18.Hazard prevention
19.Automatic report incase of emergency
20.Emergency vehicle routeguidance/rescue operation support
Supply of routeinformation to drivers1
Supply of information fromother agencies to drivers2
Preliminary supply ofroute information3
Preliminary supply ofinformation from other agencies4
Preliminary supply ofdestination information5
Supply of destinationinformation to drivers6
Supply of destinationinformation atservice areas andparking areas
7
Electronic tollcollection on toll roads8
Electronic toll collection atparking lots, ferryboats, etc.9
Supply of roadenvironment information10
Supply of surroundingvehicle information11
Hazard warning ofpreceding vehicles12
Hazard warning ofside vehicles13
Hazard warning offront crossing vehicles14
Hazard warning ofdriver/vehicle conditions15
Driving assistance forpreceding vehicles16
Driving assistancefor side vehicles17
Driving assistance forfront crossing vehicles18
Driving assistancefor driver abnormality19
Automatic driving ofgeneral vehicles20
Automatic driving ofmanagement vehicles21
Planning support oftraffic management22
Support of trafficmanagement/facility service23
Support of parkingmeasures24
Support of drivers25
Support of policeactivities26
Maintenance oftraffic order27
Support of traffic managementresponding to incidents28
Optimization oftraffic signal control29
Route guidance30
Dynamic lanecontrol31
Support of roadmanagement service32
Efficiency improvement ofroad management operations33
Optimization of trafficregulation implementation34
Efficiency improvement of disasterrestoration/reconstruction35
Management ofspecial vehicles36
Getting hold of driving vehiclestransporting dangerous substance37
Supply of traffic regulationinformation38
Public transportation operation/supplyof transfer information39
Utilization support of taxiand demand buses40
Implementation of prioritypassage of public transportation41
Supply of public transportationoperation status42
Continuous automatic drivingof commercial vehicles46
Supply of operation statusinformation of other agencies45
Supply of information of freighthandled by commercial vehicles44
Supply of commercialvehicle operation status43
Supply of information offacilities and routes47
Route guidance48
Ensuring pedestrian safetythrough control of traffic signals49
Ensuring pedestrian safety throughcoordination with vehicles50
Getting hold of locationinformation of pedestrians51
Report in case ofemergency52
Emergency vehicle guidance,rescue operation support53
Utilization of physical distributioninformation in advancedinformation communication society
54
Utilization of multimodalrelated information55
Function coordinationwith ITS56
Initial Proposal individual user service
Framework for mapping out system architecture
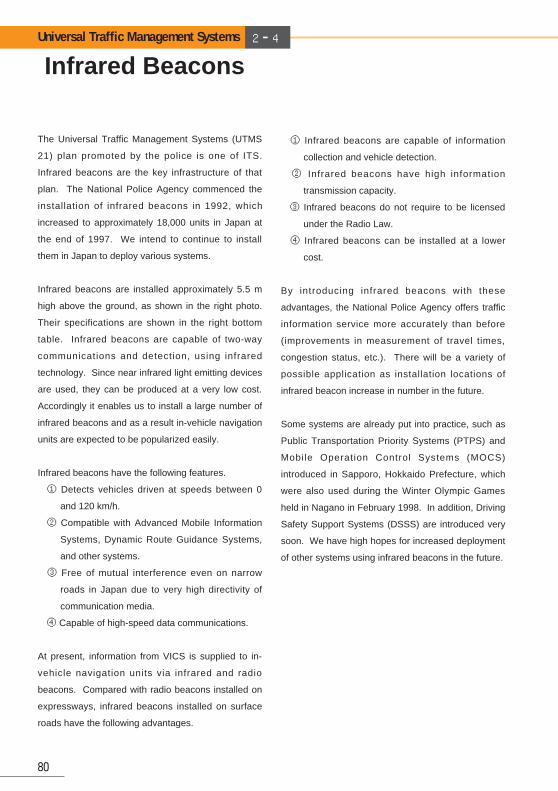
80
Universal Traffic Management Systems 2━4
Infrared Beacons
The Universal Traffic Management Systems (UTMS
21) plan promoted by the police is one of ITS.
Infrared beacons are the key infrastructure of that
plan. The National Police Agency commenced the
installation of infrared beacons in 1992, which
increased to approximately 18,000 units in Japan at
the end of 1997. We intend to continue to install
them in Japan to deploy various systems.
Infrared beacons are installed approximately 5.5 m
high above the ground, as shown in the right photo.
Their specifications are shown in the right bottom
table. Infrared beacons are capable of two-way
communications and detection, using infrared
technology. Since near infrared light emitting devices
are used, they can be produced at a very low cost.
Accordingly it enables us to install a large number of
infrared beacons and as a result in-vehicle navigation
units are expected to be popularized easily.
Infrared beacons have the following features.
① Detects vehicles driven at speeds between 0
and 120 km/h.
② Compatible with Advanced Mobile Information
Systems, Dynamic Route Guidance Systems,
and other systems.
③ Free of mutual interference even on narrow
roads in Japan due to very high directivity of
communication media.
④ Capable of high-speed data communications.
At present, information from VICS is supplied to in-
vehicle navigation units via infrared and radio
beacons. Compared with radio beacons installed on
expressways, infrared beacons installed on surface
roads have the following advantages.
① Infrared beacons are capable of information
collection and vehicle detection.
② Infrared beacons have high information
transmission capacity.
③ Infrared beacons do not require to be licensed
under the Radio Law.
④ Infrared beacons can be installed at a lower
cost.
By introducing infrared beacons with these
advantages, the National Police Agency offers traffic
information service more accurately than before
(improvements in measurement of travel times,
congestion status, etc.). There will be a variety of
possible application as installation locations of
infrared beacon increase in number in the future.
Some systems are already put into practice, such as
Public Transportation Priority Systems (PTPS) and
Mobile Operation Control Systems (MOCS)
introduced in Sapporo, Hokkaido Prefecture, which
were also used during the Winter Olympic Games
held in Nagano in February 1998. In addition, Driving
Safety Support Systems (DSSS) are introduced very
soon. We have high hopes for increased deployment
of other systems using infrared beacons in the future.
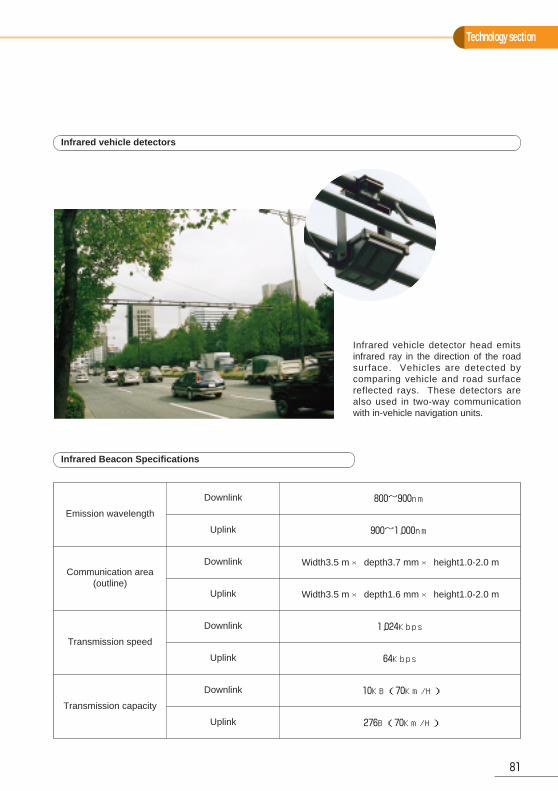
Technology section
81
Infrared vehicle detector head emitsinfrared ray in the direction of the roadsurface. Vehicles are detected bycomparing vehicle and road surfacereflected rays. These detectors arealso used in two-way communicationwith in-vehicle navigation units.
Infrared vehicle detectors
Infrared Beacon Specifications
Emission wavelength
Downlink
Uplink
Communication area (outline)
Downlink
Uplink
Transmission speed
Downlink
Uplink
Transmission capacity
Downlink
Uplink
800~900nm
900~1,000nm
Width3.5 m × depth3.7 mm × height1.0-2.0 m
Width3.5 m × depth1.6 mm × height1.0-2.0 m
1,024Kbps
64Kbps
10KB(70Km/H)
276B(70Km/H)
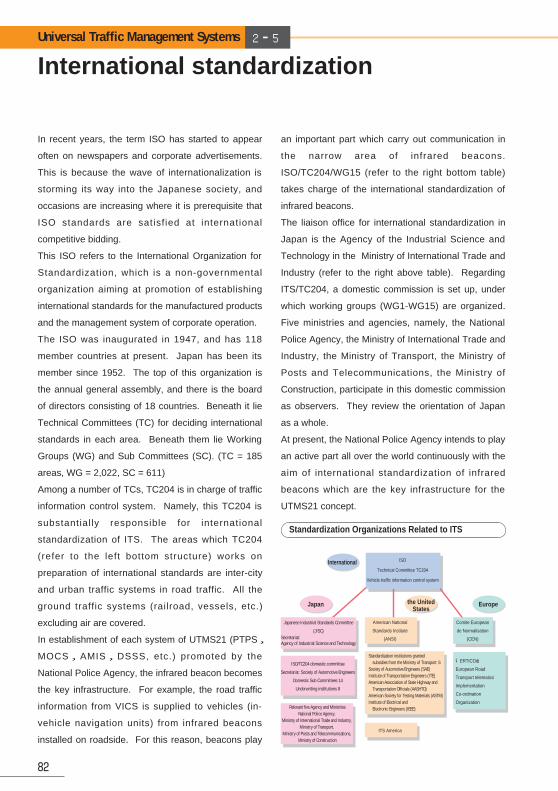
International standardization
82
Universal Traffic Management Systems 2━5
In recent years, the term ISO has started to appear
often on newspapers and corporate advertisements.
This is because the wave of internationalization is
storming its way into the Japanese society, and
occasions are increasing where it is prerequisite that
ISO standards are satisfied at international
competitive bidding.
This ISO refers to the International Organization for
Standardization, which is a non-governmental
organization aiming at promotion of establishing
international standards for the manufactured products
and the management system of corporate operation.
The ISO was inaugurated in 1947, and has 118
member countries at present. Japan has been its
member since 1952. The top of this organization is
the annual general assembly, and there is the board
of directors consisting of 18 countries. Beneath it lie
Technical Committees (TC) for deciding international
standards in each area. Beneath them lie Working
Groups (WG) and Sub Committees (SC). (TC = 185
areas, WG = 2,022, SC = 611)
Among a number of TCs, TC204 is in charge of traffic
information control system. Namely, this TC204 is
substantial ly responsible for international
standardization of ITS. The areas which TC204
(refer to the left bottom structure) works on
preparation of international standards are inter-city
and urban traffic systems in road traffic. All the
ground traffic systems (railroad, vessels, etc.)
excluding air are covered.
In establishment of each system of UTMS21 (PTPS,
MOCS,AMIS,DSSS, etc.) promoted by the
National Police Agency, the infrared beacon becomes
the key infrastructure. For example, the road traffic
information from VICS is supplied to vehicles (in-
vehicle navigation units) from infrared beacons
installed on roadside. For this reason, beacons play
an important part which carry out communication in
the narrow area of infrared beacons.
ISO/TC204/WG15 (refer to the right bottom table)
takes charge of the international standardization of
infrared beacons.
The liaison office for international standardization in
Japan is the Agency of the Industrial Science and
Technology in the Ministry of International Trade and
Industry (refer to the right above table). Regarding
ITS/TC204, a domestic commission is set up, under
which working groups (WG1-WG15) are organized.
Five ministries and agencies, namely, the National
Police Agency, the Ministry of International Trade and
Industry, the Ministry of Transport, the Ministry of
Posts and Telecommunications, the Ministry of
Construction, participate in this domestic commission
as observers. They review the orientation of Japan
as a whole.
At present, the National Police Agency intends to play
an active part all over the world continuously with the
aim of international standardization of infrared
beacons which are the key infrastructure for the
UTMS21 concept.
Standardization Organizations Related to ITS
International
Japan the UnitedStates
Europe
Japanese Industrial Standards Committee
(JISC)Secretariat: Agency of Industrial Science and Technology
�
(ERTICO)
European Road
Transport telematics
Implementation
Co-ordination
Organization
�
ITS America
Standardization institutions granted subsidies from the Ministry of Transport: 6Society of Automotive Engineers (SAE)Institute of Transportation Engineers (ITE)American Association of State Highway and Transportation Officials (AASHTO)American Society for Testing Materials (ASTM)Institute of Electrical and Electronic Engineers (IEEE)
�
Relevant five Agency and MinistriesNational Police Agency,
Ministry of International Trade and Industry, Ministry of Transport,
Ministry of Posts and Telecommunications, Ministry of Construction
�
ISO/TC204 domestic committee
Secretariat: Society of Automotive Engineers
Domestic Sub Committees 14
Underwriting institutions 8
�
American National
Standards Institute
(ANSI)
Comite European
de Normalisation
(CEN)
ISO
Technical Committee TC204
Vehicle traffic information control system
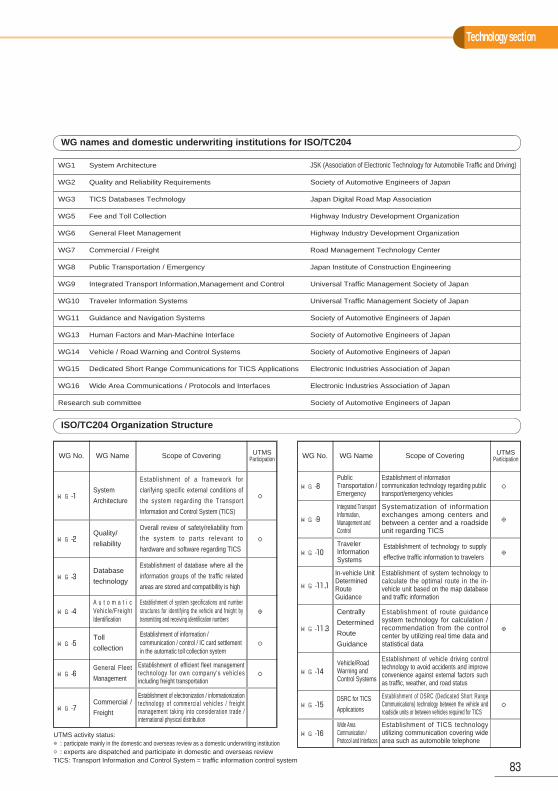
Technology section
83
WG names and domestic underwriting institutions for ISO/TC204
WG1 System Architecture JSK (Association of Electronic Technology for Automobile Traffic and Driving)
WG2 Quality and Reliability Requirements Society of Automotive Engineers of Japan
WG3 TICS Databases Technology Japan Digital Road Map Association
WG5 Fee and Toll Collection Highway Industry Development Organization
WG6 General Fleet Management Highway Industry Development Organization
WG7 Commercial / Freight Road Management Technology Center
WG8 Public Transportation / Emergency Japan Institute of Construction Engineering
WG9 Integrated Transport Information,Management and Control Universal Traffic Management Society of Japan
WG10 Traveler Information Systems Universal Traffic Management Society of Japan
WG11 Guidance and Navigation Systems Society of Automotive Engineers of Japan
WG13 Human Factors and Man-Machine Interface Society of Automotive Engineers of Japan
WG14 Vehicle / Road Warning and Control Systems Society of Automotive Engineers of Japan
WG15 Dedicated Short Range Communications for TICS Applications Electronic Industries Association of Japan
WG16 Wide Area Communications / Protocols and Interfaces Electronic Industries Association of Japan
Research sub committee Society of Automotive Engineers of Japan
Scope of Covering UTMSParticipationWG NameWG No. Scope of Covering UTMS
ParticipationWG NameWG No.
Establishment of a framework for
clarifying specific external conditions of
the system regarding the Transport
Information and Control System (TICS)
○System
ArchitectureWG-1
Overall review of safety/reliability from
the system to parts relevant to
hardware and software regarding TICS○
Quality/
reliabilityWG-2
Establishment of database where all the
information groups of the traffic related
areas are stored and compatibility is high
Database
technologyWG-3
Establishment of system specifications and numberstructures for identifying the vehicle and freight bytransmitting and receiving identification numbers
◎A u t o m a t i cVehicle/FreightIdentification
WG-4
Establishment of information /communication / control / IC card settlementin the automatic toll collection system
○Toll
collectionWG-5
Establishment of efficient fleet managementtechnology for own company's vehiclesincluding freight transportation
○General Fleet
ManagementWG-6
Establishment of electronization / informationizationtechnology of commercial vehicles / freightmanagement taking into consideration trade /international physical distribution
Commercial /
FreightWG-7
Establishment of informationcommunication technology regarding publictransport/emergency vehicles
○PublicTransportation /Emergency
WG-8
Systematization of informationexchanges among centers andbetween a center and a roadsideunit regarding TICS
◎
Integrated TransportInformation,Management andControl
WG-9
Establishment of technology to supply
effective traffic information to travelers ◎TravelerInformationSystems
WG-10
Establishment of system technology tocalculate the optimal route in the in-vehicle unit based on the map databaseand traffic information
In-vehicle UnitDeterminedRouteGuidance
WG-11.1
Establishment of route guidancesystem technology for calculation /recommendation from the controlcenter by utilizing real time data andstatistical data
◎
Centrally
Determined
Route
Guidance
WG-11.3
Establishment of vehicle driving controltechnology to avoid accidents and improveconvenience against external factors suchas traffic, weather, and road status
Vehicle/RoadWarning andControl Systems
WG-14
Establishment of DSRC (Dedicated Short RangeCommunications) technology between the vehicle androadside units or between vehicles required for TICS
○DSRC for TICS
ApplicationsWG-15
Establishment of TICS technologyutilizing communication covering widearea such as automobile telephone
Wide AreaCommunication /Protocol and Interfaces
WG-16
ISO/TC204 Organization Structure
UTMS activity status:◎: participate mainly in the domestic and overseas review as a domestic underwriting institution○: experts are dispatched and participate in domestic and overseas reviewTICS: Transport Information and Control System = traffic information control system
84
The traffic control system on surface roads was
introduced in traffic control centers operated by the
Prefectural Police Headquarters. About 170 centers
have been installed and being operated at the end of
1996.
The traffic control system is a unified system for
ensuring safe and smooth traffic flow. The National
Police Agency works in close cooperation with the
Universal Traffic Management Society of Japan
(UTMS) for further improvements of the traffic control
centers.
The Japanese traffic control system is one of the
world's best systems supported by advanced, up-to-
date information processing and electronics
technologies. The basic functions of the traffic
control system are as follows:
① Information collection
Collects traffic information automatically, such as
traffic volumes and congestion, using various
sensors.
② Signal control
Carries out link coordination and area controls for
precise traffic flow control.
③ Information supply
Provides information such as traffic congestion
status and traffic regulations via information
boards and other devices.
Drivers obtain traffic information from radio or
information boards as they drive on roads.
Information may be “xx-km congestion up to yy.”
In some times, however, they might be able to drive
smoothly without congestion or experience a worse
case than expected. Information sent from roadside
ultrasonic or image processing vehicle detectors is
collected at traff ic control centers, and then
processed in various ways. Time lags occur before
processed information is provided on information
boards and other devices. This is the reason for
differences between supplied information and actual
experience.
To improve the situations as above, the need is for
establishment of a positive traffic control system. It
carries out traffic demand management rather than
simple implementation of policies, such as how to
deal with traffic flow in a passive manner as practiced
conventionally. Integrated Traffic Control Systems
(ITCS) meets the need.
ITCS uses two-way communications between
infrared beacons and vehicles and advanced
information collection sensors such as digital image
processing detectors, as well as existing sensors. It
makes the most of collected information efficiently.
The aims of ITCS are to optimize signal control
automatically and to supply traffic information
automatically. ITCS is the core of the UTMS 21 plan.
Universal Traffic Management Systems 2━6
Integrated Traffic Control Systems (ITCS)
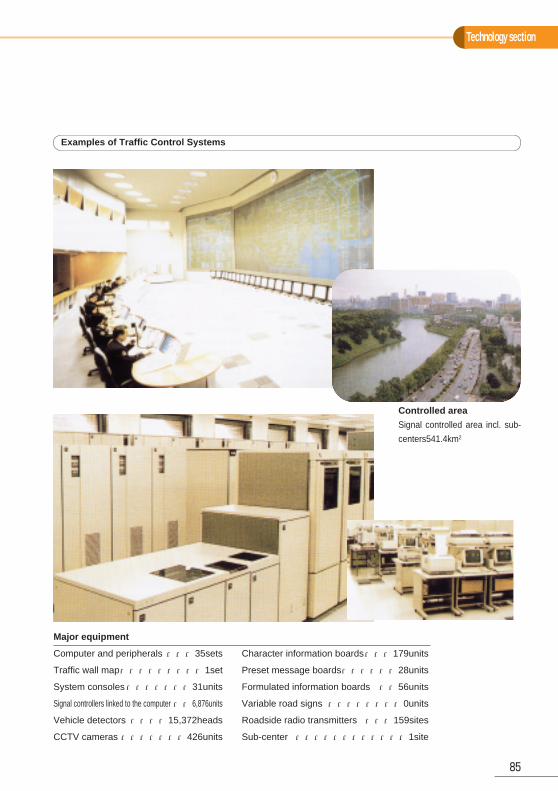
Technology section
85
Major equipment
Computer and peripherals ・・・35sets Character information boards・・・179units
Traffic wall map・・・・・・・・・1set Preset message boards・・・・・・28units
System consoles・・・・・・・31units Formulated information boards ・・56units
Signal controllers linked to the computer・・6,876units Variable road signs ・・・・・・・・0units
Vehicle detectors ・・・・15,372heads Roadside radio transmitters ・・・159sites
CCTV cameras ・・・・・・・426units Sub-center ・・・・・・・・・・・・1site
Controlled area
Signal controlled area incl. sub-
centers541.4km2
Examples of Traffic Control Systems
86
British SCOOT (Split, Cycle and Offset Optimisation
Technique) and Australian SCATS (Sydney
Coordinated Adaptive Traffic System) have been
renowned as signal control systems for area traffic
control. Since no particular attention has been
given to naming of our signal control, there have
been few chances that the Japanese signal control
system, which could be the world's most excellent
signal control system, had international reputation.
Therefore, we intend to review and further improve
various types of advanced signal control systems
adopted in each prefecture. This improved signal
control named MODERATE (Management by
Origin-DEstination Related Adaptation for Traffic
Optimization), is at the center of ITCS, which plays
the core role in UTMS.
In 1997, the Universal Traffic Management Society
of Japan held EPMS demonstration testing in
Shizuoka Prefecture. Data obtained by the test
show that carbon dioxide emission is minimized
when vehicles drive at approximately 35 km/h. This
means that safe and smooth traffic flow achieved
by sophisticated signal control will greatly help
counteract the global warming trend. This is
considered to be a topic that will draw more
attention, in addit ion to the economic effect
produced by elimination of congestion as usually
mentioned.
An outline of MODERATE is shown in the attached
table. Splits at major intersections are calculated
every 5 or 2.5 min in 1% units. This signal control
system was already implemented in some
advanced prefectures and is contributing greatly to
the alleviation of congestion.
Universal Traffic Management Systems 2-7
MODERATOTOP
ICS
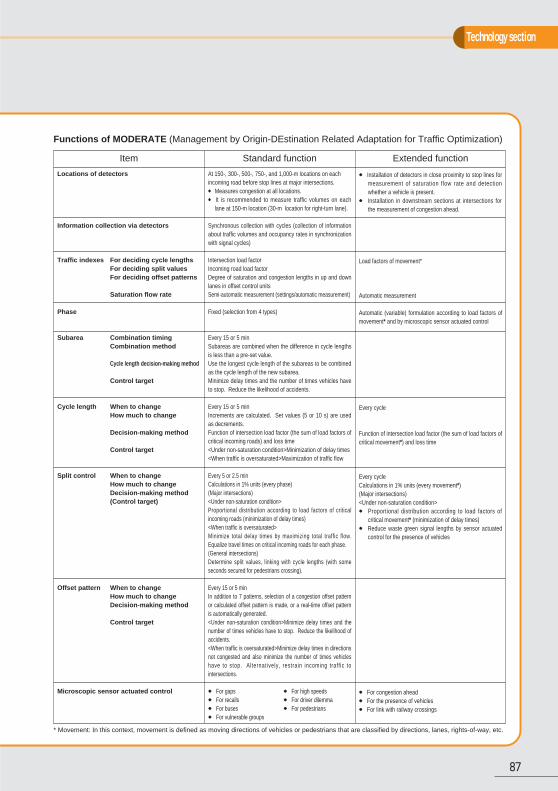
Technology section
87
Functions of MODERATE (Management by Origin-DEstination Related Adaptation for Traffic Optimization)
At 150-, 300-, 500-, 750-, and 1,000-m locations on eachincoming road before stop lines at major intersections.● Measures congestion at all locations.● It is recommended to measure traffic volumes on each
lane at 150-m location (30-m location for right-turn lane).
Synchronous collection with cycles (collection of informationabout traffic volumes and occupancy rates in synchronizationwith signal cycles)
Intersection load factorIncoming road load factorDegree of saturation and congestion lengths in up and downlanes in offset control unitsSemi-automatic measurement (settings/automatic measurement)
Fixed (selection from 4 types)
Every 15 or 5 minSubareas are combined when the difference in cycle lengthsis less than a pre-set value.Use the longest cycle length of the subareas to be combinedas the cycle length of the new subarea.Minimize delay times and the number of times vehicles haveto stop. Reduce the likelihood of accidents.
Every 15 or 5 minIncrements are calculated. Set values (5 or 10 s) are usedas decrements.Function of intersection load factor (the sum of load factors ofcritical incoming roads) and loss time<Under non-saturation condition>Minimization of delay times<When traffic is oversaturated>Maximization of traffic flow
Every 5 or 2.5 minCalculations in 1% units (every phase)(Major intersections)<Under non-saturation condition>Proportional distribution according to load factors of criticalincoming roads (minimization of delay times)<When traffic is oversaturated>Minimize total delay times by maximizing total traffic flow.Equalize travel times on critical incoming roads for each phase.(General intersections)Determine split values, linking with cycle lengths (with someseconds secured for pedestrians crossing).
Every 15 or 5 minIn addition to 7 patterns, selection of a congestion offset patternor calculated offset pattern is made, or a real-time offset patternis automatically generated.<Under non-saturation condition>Minimize delay times and thenumber of times vehicles have to stop. Reduce the likelihood ofaccidents.<When traffic is oversaturated>Minimize delay times in directionsnot congested and also minimize the number of times vehicleshave to stop. Alternatively, restrain incoming traff ic tointersections.
● For gaps ● For high speeds● For recalls ● For driver dilemma● For buses ● For pedestrians● For vulnerable groups
Locations of detectors
Information collection via detectors
Traffic indexes For deciding cycle lengthsFor deciding split valuesFor deciding offset patterns
Saturation flow rate
Phase
Subarea Combination timingCombination method
Cycle length decision-making method
Control target
Cycle length When to changeHow much to change
Decision-making method
Control target
Split control When to changeHow much to changeDecision-making method(Control target)
Offset pattern When to changeHow much to changeDecision-making method
Control target
Microscopic sensor actuated control
● Installation of detectors in close proximity to stop lines formeasurement of saturation flow rate and detectionwhether a vehicle is present.
● Installation in downstream sections at intersections forthe measurement of congestion ahead.
Load factors of movement*
Automatic measurement
Automatic (variable) formulation according to load factors ofmovement* and by microscopic sensor actuated control
Every cycle
Function of intersection load factor (the sum of load factors ofcritical movement*) and loss time
Every cycleCalculations in 1% units (every movement*)(Major intersections)<Under non-saturation condition>● Proportional distribution according to load factors of
critical movement* (minimization of delay times)● Reduce waste green signal lengths by sensor actuated
control for the presence of vehicles
● For congestion ahead● For the presence of vehicles● For link with railway crossings
Standard functionItem Extended function
* Movement: In this context, movement is defined as moving directions of vehicles or pedestrians that are classified by directions, lanes, rights-of-way, etc.
Advanced Mobile Information Systems
88
Universal Traffic Management Systems 2━8
Advanced Mobile Information Systems are known as
AMIS, an acronym for the systems.
AMIS provide drivers with real-time traffic information
such as congestion, accidents, roadworks, and travel
times to destinations, using various media including
infrared beacons and information boards. The aims
of AMIS are to allow traffic flow to decentralize
autonomously, eliminate traffic congestion, and better
drivers' psychological states. AMIS is intended to
achieve higher effects by offering a greater degree of
choice to drivers.
AMIS supply traffic information via information
boards, radio broadcasts, automatic answering
telephone and fax services (see also page 60) as
previously done. In addition, a new system, Vehicle
Information and Communication System (VICS) (see
also page 90), began to provide traffic information to
car navigation systems in 1996.
AMIS refer to the whole systems that supply traffic
information. AMIS include VICS, which is one of
traffic information supply means.
VICS is, in other words, a constituent of AMIS in
traffic information supply activities carried out by the
police, the traffic administrator.
Advanced Mobile Information Systems1
Information Supply Means2
Relationships between AMIS and VICS3
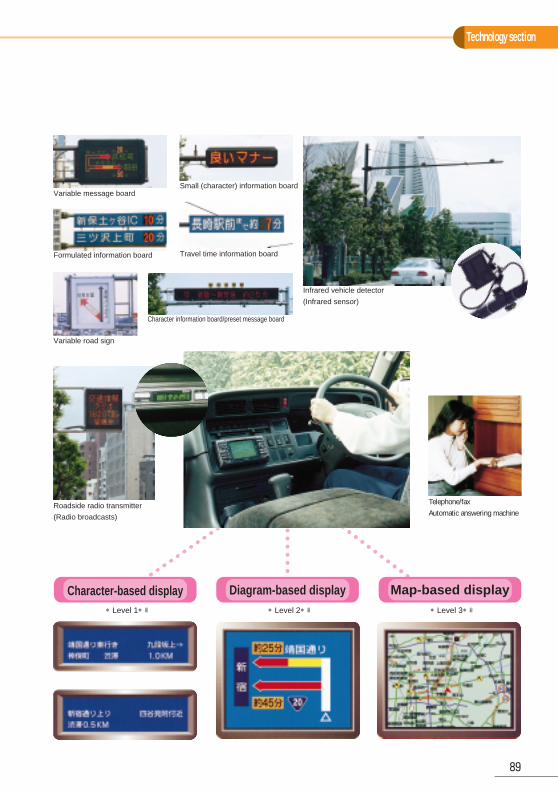
Technology section
89
Roadside radio transmitter
(Radio broadcasts)
Telephone/faxAutomatic answering machine
Infrared vehicle detector
(Infrared sensor)
Small (character) information board
Travel time information board
Variable message board
Formulated information board
Character information board/preset message board
Variable road sign
Diagram-based display Map-based displayCharacter-based display●Level 1●� ●Level 2●� ●Level 3●�
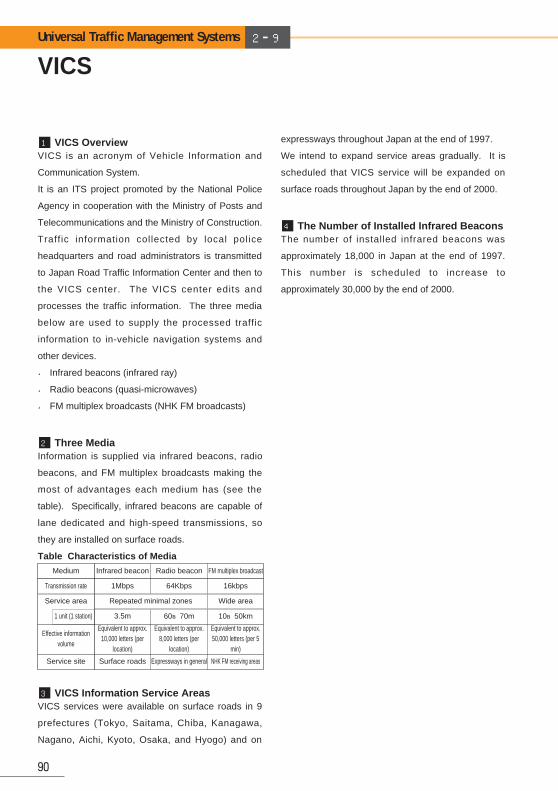
90
VICS is an acronym of Vehicle Information and
Communication System.
It is an ITS project promoted by the National Police
Agency in cooperation with the Ministry of Posts and
Telecommunications and the Ministry of Construction.
Traff ic information collected by local police
headquarters and road administrators is transmitted
to Japan Road Traffic Information Center and then to
the VICS center. The VICS center edits and
processes the traffic information. The three media
below are used to supply the processed traffic
information to in-vehicle navigation systems and
other devices.
● Infrared beacons (infrared ray)
● Radio beacons (quasi-microwaves)
● FM multiplex broadcasts (NHK FM broadcasts)
Information is supplied via infrared beacons, radio
beacons, and FM multiplex broadcasts making the
most of advantages each medium has (see the
table). Specifically, infrared beacons are capable of
lane dedicated and high-speed transmissions, so
they are installed on surface roads.
Table Characteristics of Media
VICS services were available on surface roads in 9
prefectures (Tokyo, Saitama, Chiba, Kanagawa,
Nagano, Aichi, Kyoto, Osaka, and Hyogo) and on
expressways throughout Japan at the end of 1997.
We intend to expand service areas gradually. It is
scheduled that VICS service will be expanded on
surface roads throughout Japan by the end of 2000.
The number of installed infrared beacons was
approximately 18,000 in Japan at the end of 1997.
This number is scheduled to increase to
approximately 30,000 by the end of 2000.
Medium Infrared beacon Radio beacon FM multiplex broadcast
Transmission rate 1Mbps 64Kbps 16kbps
Repeated minimal zones Wide area
3.5m
Service area
1 unit (1 station) 60~70m 10~50km
Effective informationvolume
Equivalent to approx.10,000 letters (per
location)
Equivalent to approx.8,000 letters (per
location)
Equivalent to approx.50,000 letters (per 5
min)
Service site Surface roads Expressways in general NHK FM receiving areas
VICS Overview1
Three Media2
The Number of Installed Infrared Beacons4
VICS Information Service Areas3
Universal Traffic Management Systems 2━9
VICS
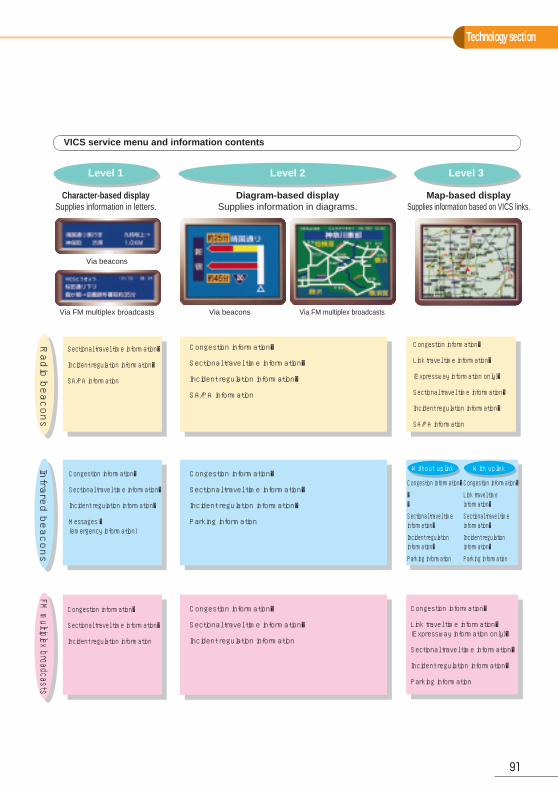
Technology section
91
Map-based displaySupplies information based on VICS links.
Diagram-based displaySupplies information in diagrams.
Character-based displaySupplies information in letters.
Via beacons Via FM multiplex broadcasts
Via beacons
Via FM multiplex broadcasts
Infrared beacons
Without uplink With uplinkCongestion information�
Sectional travel time information�
Incident regulation information�
Parking information
Congestion information�
Sectional travel time information�
Incident regulation information�
Messages �(emergency information)
Radio beacons
Congestion information�
Link travel time information�
(Expressway information only)�
Sectional travel time information�
Incident regulation information�
SA/PA information
Congestion information�
Sectional travel time information�
Incident regulation information�
SA/PA information
Sectional travel time information�
Incident regulation information�
SA/PA information
FM multiplex broadcasts
Congestion information�
Link travel time information�(Expressway information only)�
Sectional travel time information�
Incident regulation information�
Parking information
Congestion information�
Sectional travel time information�
Incident regulation information
Congestion information�
Sectional travel time information�
Incident regulation information
Congestion information���Sectional travel time information�Incident regulation information�Parking information
Congestion information�Link travel time information�Sectional travel time information�Incident regulation information�Parking information
Level 1 Level 2 Level 3
VICS service menu and information contents
92
Public Transportation Priority Systems constitute a
sub-system of UTMS and are known as PTPS, an
acronym for the systems.
PTPS secure bus lanes and carry out priority signal
control for buses, thereby ensuring priority passage
for high-volume public transportation. In this way it
intends to allow high-volume public transportation to
operate efficiently and to give passengers increased
facilities. PTPS aim to encourage people to use high-
volume public transportation rather than their
privately owned vehicles and to suppress traffic
demands.
Infrared beacons receive bus-specific IDs when
buses pass under them provided that buses are
equipped with in-vehicle units for communications
with infrared beacons.
Infrared beacons then send bus-specific IDs to the
traffic control center. The center carries out signal
control so that buses can go without having to stop at
signals ahead (by lengthening green signal display or
shortening red signal display).
PTPS also display expected travel t imes to
destinations in buses, show expected arrival times of
buses at bus stops, and issue warnings to other
vehicles in bus lanes.
The conventional priority signal control for buses is
actuated when a vehicle with a great length is
detected, giving priority to trucks as well. PTPS give
priority only to buses.
Moreover, PTPS send bus-specific IDs obtained via
infrared beacons from in-vehicle units to traffic control
centers. This information can be transmitted to bus
operating companies from the traffic control centers.
Bus companies can then carry out mobile operation
control (driving locations, times, etc.).
PTPS were installed in the following sites.
(1) April 1996: Commencement of operation in
Sapporo (Hokkaido Prefectural Police
Headquarters)
PTPS and MOCS were introduced in fixed-route
buses.
(2) February 1998: Operation for the Winter Olympic
Games in Nagano (Nagano Prefectural Police
Headquarters)
AMIS, PTPS, DRGS, and MOCS were introduced
in the vehicles involved in the games.
(3) May 1998: Commencement of operation in Tokyo
(Metropolitan Police Department)
PTPS were introduced in fixed-route buses.
(4) 1998: Commencement of operation is scheduled
in Hamamatsu (Shizuoka Prefectural Police
Headquarters)
Hamamatsu is designated as an Omnibus Town (a
project of urban development for making the most of
buses and other public transportation).
For detailed information, see Topics on page 94.
Universal Traffic Management Systems 2━10
Public Transportation Priority Systems
Public Transportation Priority Systems1
Systems Overview2
Advantages of PTPS3
Actual Installation Cases4
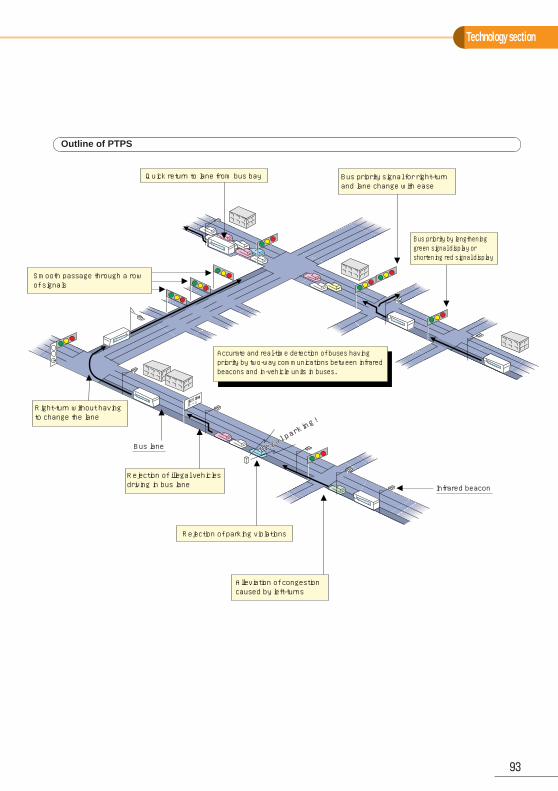
Technology section
93
Outline of PTPS
Rejection of parking violations
Bus lane
Infrared beacon
Illegal parking!
Illegal parking!
Illegal parking!
Quick return to lane from bus bay Bus priority signal for right-turn and lane change with ease
Bus priority by lengthening green signal display or shortening red signal display
Smooth passage through a row of signals
Right-turn without having to change the lane
Rejection of illegal vehicles driving in bus lane
Accurate and real-time detection of buses having priority by two-way communications between infrared beacons and in-vehicle units in buses.
Alleviation of congestion caused by left-turns
違反車�
外へ!!
94
PTPS were introduced and commenced operation in
a 5.7-km section on Route 36 in Sapporo city,
Hokkaido Prefecture in April 1996. Bus priority lanes
were established on a time basis from 7:30 to 9:00.
Infrared in-vehicle units were installed in 212 buses
owned by a bus company.
Needless to say, bus priority signal control is carried
out, which PTPS originally intend to offer. Moreover,
MOCS functions are also implemented to support bus
operations including the following.
● Bus locations: The aim is to enable collection of
data on bus operating conditions.
● Oncoming bus displays: These displays inform
people at bus stops of oncoming buses.
● In-vehicle displays: These displays inform
passengers of travel times and other information.
In this case of Hokkaido, the introduction of PTPS
yielded the following results.
● Travel times in the PTPS section decreased by
6.1%.
● The number of times buses have to stop at signals
decreased by 7.1%.
● The time buses have to stop at signals decreased
by 20.1%.
● Traffic volumes on the PTPS route in rush hours
decreased by 20.8%.
* No specific congestion occurred because traffic flow
was disseminated to other routes.
● Bus users increased by 9.9%.
The survey was conducted during the period between
7:30 and 9:00 on weekdays in May 1996.
Indeed, ninety percent of bus drivers and users
replying to a questionnaire recognized that PTPS
were effective for improvements in facilities.
Because of these favorable effects plus requests of
bus drivers and users, changes were made in the
project by the end of March 1998.
● The PTPS section was extended from 5.7 km to
10.3 km.
● Installation of infrared in-vehicle units increased
from 212 buses to 240 buses.
PTPS were introduced together with AMIS, MOCS,
and DRGS in Nagano as the Winter Olympic Games
were held in February 1998. (See also page 114.)
In May 1998 in Tokyo, infrared in-vehicle units were
installed in 26 prefecture-operated buses to introduce
and operate PTPS in a section approximately 10 km
long on a route from Hamamatsu-cho to Tokyo Big
Sight.
There are many municipal organizations and bus
companies who have much interest in PTPS and
MOCS. Consideration is given everywhere for
introduction of PTPS to improve the facilities of public
transportation.
Universal Traffic Management Systems 2━11
Examples of Public TransportationPriority Systems
Overview1
Service Types2
Effects3
Introduction to Other Areas4
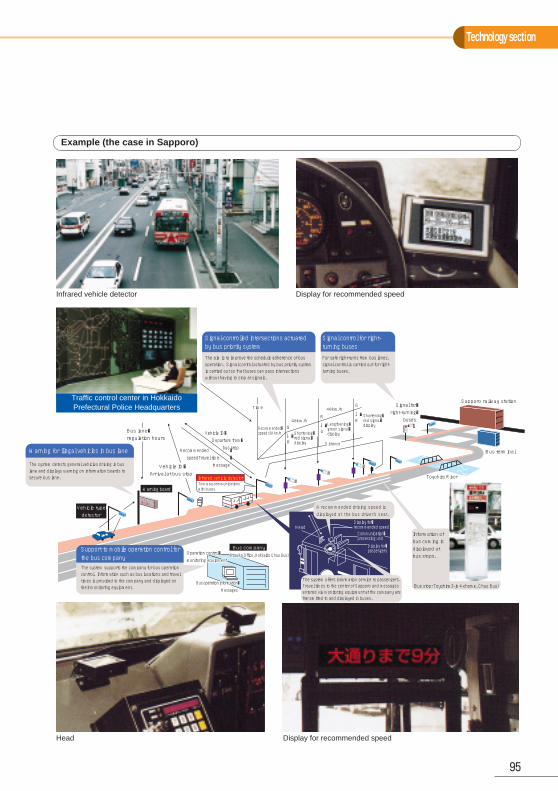
Technology section
95
バスレーン�違反車外へ�
Information of bus coming is displayed at bus stops.
(Bus stop: Toyohira 3-jo 4-chome, Chuo Bus)
Bus company
Sapporo railway station
Bus terminal
Signal for�right-turning�
buses
Toyohira River
Vehicle ID� Departure from� bus stopRecommended �
speedTravel time �Message
Warning board
Vehicle type�detector
Display for�recommended speedCommunication�processing unit
Display for�passengers
Head
A recommended driving speed is displayed at the bus driver's seat.
The system offers information service to passengers. Travel times to the center of Sapporo and messages entered via monitoring equipment at the company are transmitted to and displayed in buses.
Infrared vehicle detector
Bus lane�regulation hours
Vehicle ID�Arrival at bus stop
GG
G
↓�
↓�
↓�
R
RR
Recommended�speed: 30 km/h
40km/h
40km/h
Lengthening�green signal�displayShortening�
red signal�display
Shortening�red signal�display
Time
Distance
Operation control�Operation control�monitoring equipmentmonitoring equipmentOperation control�monitoring equipment
Bus operation information�Bus operation information�MessagesMessages
Bus operation information�Messages
The aim is to improve the schedule adherence of bus operation. Signal control actuated by bus priority system is carried out so that buses can pass intersections without having to stop at signals.
Signal-controlled intersections actuated by bus priority system
The system detects general vehicles driving in bus lane and displays warning on information boards to secure bus lane.
Warning for illegal vehicles in bus lane
The system supports the company for bus operation control. Information such as bus locations and travel times is provided to the company and displayed on their monitoring equipment.
Support to mobile operation control for the bus company
For safe right-turns from bus lanes, signal control is carried out for right-turning buses.
Signal control for right-turning buses
Two-way communications with buses
(Hiraoka Office, Hokkaido Chuo Bus)(Hiraoka Office, Hokkaido Chuo Bus)(Hiraoka Office, Hokkaido Chuo Bus)
Infrared vehicle detector
Traffic control center in HokkaidoPrefectural Police Headquarters
Head
Display for recommended speed
Display for recommended speed
Example (the case in Sapporo)
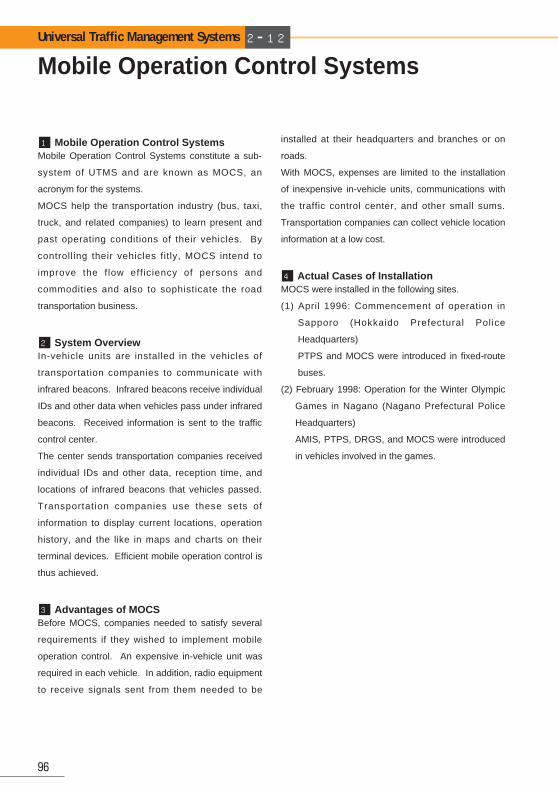
96
Mobile Operation Control Systems constitute a sub-
system of UTMS and are known as MOCS, an
acronym for the systems.
MOCS help the transportation industry (bus, taxi,
truck, and related companies) to learn present and
past operating conditions of their vehicles. By
controlling their vehicles fitly, MOCS intend to
improve the flow eff iciency of persons and
commodities and also to sophisticate the road
transportation business.
In-vehicle units are installed in the vehicles of
transportation companies to communicate with
infrared beacons. Infrared beacons receive individual
IDs and other data when vehicles pass under infrared
beacons. Received information is sent to the traffic
control center.
The center sends transportation companies received
individual IDs and other data, reception time, and
locations of infrared beacons that vehicles passed.
Transportation companies use these sets of
information to display current locations, operation
history, and the like in maps and charts on their
terminal devices. Efficient mobile operation control is
thus achieved.
Before MOCS, companies needed to satisfy several
requirements if they wished to implement mobile
operation control. An expensive in-vehicle unit was
required in each vehicle. In addition, radio equipment
to receive signals sent from them needed to be
installed at their headquarters and branches or on
roads.
With MOCS, expenses are limited to the installation
of inexpensive in-vehicle units, communications with
the traffic control center, and other small sums.
Transportation companies can collect vehicle location
information at a low cost.
MOCS were installed in the following sites.
(1) April 1996: Commencement of operation in
Sapporo (Hokkaido Prefectural Police
Headquarters)
PTPS and MOCS were introduced in fixed-route
buses.
(2) February 1998: Operation for the Winter Olympic
Games in Nagano (Nagano Prefectural Police
Headquarters)
AMIS, PTPS, DRGS, and MOCS were introduced
in vehicles involved in the games.
Universal Traffic Management Systems 2━12
Mobile Operation Control Systems
Mobile Operation Control Systems1
System Overview2
Advantages of MOCS3
Actual Cases of Installation4
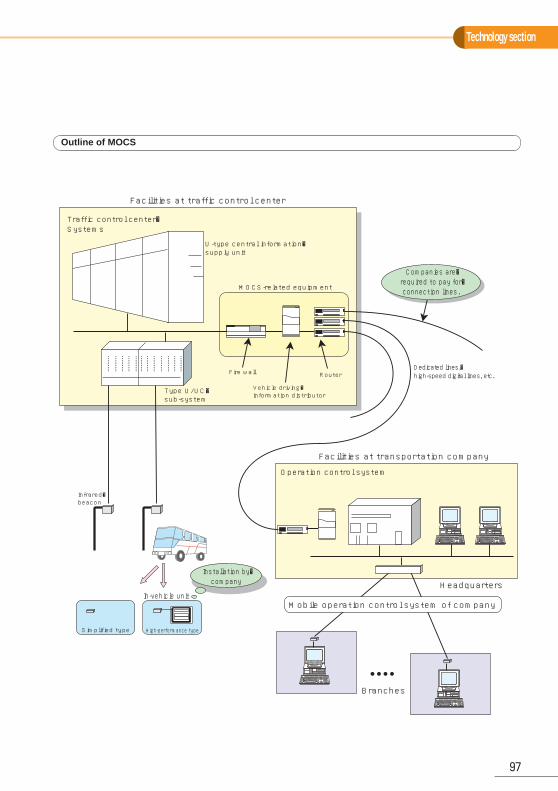
Technology section
97
Facilities at traffic control center
Facilities at transportation company
Branches
Traffic control center�Systems
Operation control system
U-type central information�supply unit
MOCS-related equipment
Type U/UC�sub-system
Fire wall RouterDedicated lines,�high-speed digital lines, etc.
Vehicle driving�information distributor
Infrared�beacon
In-vehicle unit
Simplified type High-performance type
Installation by�company
Companies are�required to pay for�connection lines.
Headquarters
Mobile operation control system of company
Outline of MOCS

98
Dynamic Route Guidance Systems constitute a sub-
system of UTMS and are known as DRGS, an
acronym for the systems.
DRGS use the two-way communication function of
infrared beacons. Drivers provide DRGS with
destination information via vehicle navigation
systems. DRGS then guide drivers individually to
their optimum routes.
DRGS are expected to alleviate traffic congestion by
decentralizing traffic flow and reducing the number of
cruising vehicles looking for their routes.
There are two types of route guidance. One is to
guide drivers according to the shortest driving
distance, and the other, according to the shortest
travel time.
The former selects simply the route of the shortest
distance without due regards to congestion or travel
time.
The latter is further classif ied into those that
calculation is carried out by vehicle navigation
systems and those that calculation is performed at
the traffic control center.
DRGS, which fall into the latter, calculate the route of
shortest travel t imes to destinations without
burdening in-vehicle units, making the most of
information collected at the traffic control center. The
selected routes are transmitted to vehicle navigation
systems via infrared beacons.
Although those that vehicle navigation systems
perform calculations guide drivers according to travel
times, the volumes of information stored in them are
far less than that available to the traffic control center.
DRGS have been tested in Tokyo since 1996. (See
also page 100.)
Surface roads within a 4 km-by-4 km area about the
center of Tokyo were selected for testing in 1996,
which, in 1997, expanded to a 20 km-by-20 km area
about the center of Tokyo including the metropolitan
expressways. On each occasion DRGS vehicles,
VICS vehicles, taxis, and general vehicles were used
for driving tests. DRGS proved to be effective in
each test.
Universal Traffic Management Systems 2━13
Dynamic Route Guidance Systems
Dynamic Route Guidance Systems1 Actual Cases of Installation3
Differences between Different Types of
Vehicle Navigation Systems
2
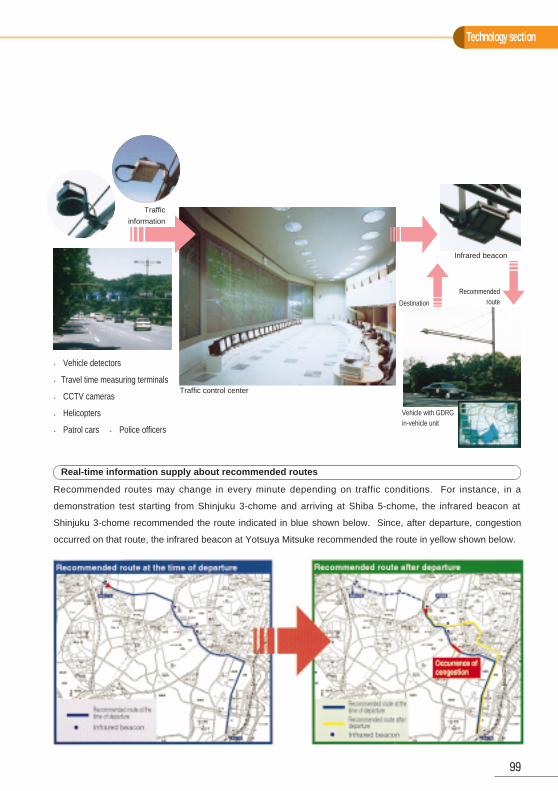
Technology section
99
Recommended routes may change in every minute depending on traffic conditions. For instance, in a
demonstration test starting from Shinjuku 3-chome and arriving at Shiba 5-chome, the infrared beacon at
Shinjuku 3-chome recommended the route indicated in blue shown below. Since, after departure, congestion
occurred on that route, the infrared beacon at Yotsuya Mitsuke recommended the route in yellow shown below.
● Vehicle detectors
●Travel time measuring terminals
● CCTV cameras
● Helicopters
● Patrol cars ● Police officers
Real-time information supply about recommended routes
Traffic control center
Traffic
information
RecommendedrouteDestination
Infrared beacon
Vehicle with GDRGin-vehicle unit
100
Three demonstration tests were conducted in a
period from 1996 to 1998.
(1) First demonstration test (End of October 1996)
A 4 km-by-4 km area about the center of Tokyo was
set up as a route guidance area for testing, in which
100 infrared beacons were used.
The starting point and goal were Shinjuku and Shiba
in Minato-ku. Six groups, each group consisting of as
shown below (4 vehicles in total), were tested in 30
runs in total.
● CDRG vehicle: One that drives according to the route
guidance calculated at the traffic
control center and provided via
infrared beacons. (CDRG: Centrally
Determined Route Guidance)
● VICS vehicle: One that drives according to the
driver's decision in the l ight of
congestion information displayed on
the in-vehicle unit.
● Taxi : One that is driven by an experienced
driver who is familiar with the traffic
conditions.
● SRG vehicle: One that drives the shortest-distance
route to the destination. (SRG: Static
Route Guidance)
(2) Second demonstration test (End of February 1997)
Six pairs of starting point and destination were
selected in the same area as used in the first
demonstration test. Five groups were tested in 60
runs in total, each group consisting of a CDRG
vehicle, a VICS vehicle, a taxi, and an SRG vehicle.
(3) Third demonstration test (End of March 1998)
A 20 km-by-20 km area about the center of Tokyo
was set up as a route guidance area for testing, in
which 180 infrared beacons were used.
While the first and second demonstration tests were
conducted simply on surface roads, the third
demonstration test involved metropolitan
expressways.
Three pairs of starting point and destination were
selected, including Sengoku 1-chome and Kakinoki-
zaka. Six groups were tested in 108 runs in total,
each group consisting of a CDRG vehicle, a taxi, and
an SRG vehicle.
Test results are shown in tables on the right.
The entire test results from the first to the third show
that CDRG is superior to others in comparison of
travel times.
The taxis were driven by drivers with 20 years or
more of experience in driving in Tokyo. The figures
indicate that ordinary persons can drive more
efficiently than professional drivers can if they use
CDRG.
In the three demonstration tests, CDRG proved to be
excellent as route guidance provided via infrared
beacons within a limited range of distances. We
consider that it is necessary to verify route guidance
to remote areas.
To implement optimum route guidance is a significant
challenge. DRGS are the means that can meet the
challenge. We intend to put them into practical use
as soon as possible.
Demonstration Test of Dynamic RouteGuidance Systems
Universal Traffic Management Systems 2━14
Overview1
Test Results2
Expected Developments3
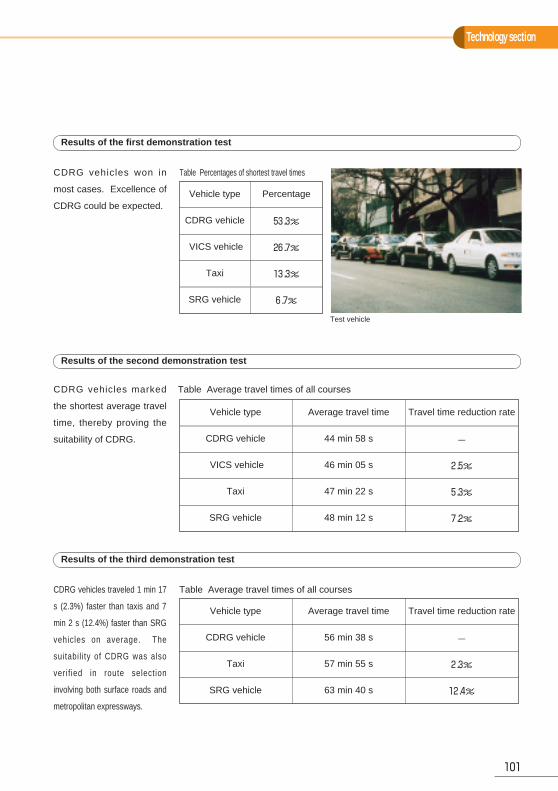
Technology section
101
Table Average travel times of all courses
Table Average travel times of all courses
Table Percentages of shortest travel timesCDRG vehicles won in
most cases. Excellence of
CDRG could be expected.
CDRG vehicles marked
the shortest average travel
time, thereby proving the
suitability of CDRG.
CDRG vehicles traveled 1 min 17
s (2.3%) faster than taxis and 7
min 2 s (12.4%) faster than SRG
vehicles on average. The
suitabil ity of CDRG was also
verif ied in route selection
involving both surface roads and
metropolitan expressways.
Results of the first demonstration test
Results of the second demonstration test
Results of the third demonstration test
Test vehicle
Vehicle type
CDRG vehicle
VICS vehicle
Taxi
SRG vehicle
Vehicle type
CDRG vehicle
VICS vehicle
Taxi
SRG vehicle
Average travel time
44 min 58 s
46 min 05 s
47 min 22 s
48 min 12 s
Travel time reduction rate
-
2.5%
5.3%
7.2%
Vehicle type
CDRG vehicle
Taxi
SRG vehicle
Average travel time
56 min 38 s
57 min 55 s
63 min 40 s
Travel time reduction rate
-
2.3%
12.4%
Percentage
53.3%
26.7%
13.3%
6.7%
102
Environmental problems, as represented by global
warming, have been a matter of worldwide concern in
recent years. The COP3, held in Kyoto in December
1997, agreed that CO2 emission be decreased to the
level in the year 1990. It has also been pointed out
that air pollution by NOx and suspended particulate
matter (SPM) is serious, particularly in the area along
road with heavy traffic.
Environmental Protection Management Systems
(EPMS) is intended to mitigate these environmental
pollution problems. Based on various environment
pollutant measurements taken by environment
sensors (devices for measuring pollutants) installed
on the roadside, EPMS controls the traffic flow in a
limited area and provides traffic information to vehicle
drivers to take other route for traff ic f low
dissemination. The aim is to prevent traff ic
congestion and decrease environmental pollution,
thereby protecting the health of pedestrians and
residents along roads.
Verification test of EPMS has been conducted since
1996 in Shizuoka city, Shizuoka prefecture, to identify
correlation between traffic data and pollution data.
For this test, pollutant-measuring devices have been
installed on the roadside and at intersections to
measure pollutants. During the test, traffic flow is
controlled intentionally to cause local congestion or
smooth flow. This control is attained by manually
changing split and offset values at the traffic control
center. The following data are measured:
● Pollution data (CO2, NOx, CO, SPM)
● Traffic data (Traff ic volume, Rate of road
occupancy, Vehicle speed, Number of diesel-engine
vehicles, etc.)
● Meteorological data (Direction of wind, Wind
velocity, Temperature, Humidity, Daylight hours, etc.)
As shown in figures in page 105 (Relation between
vehicle speed and CO2, and Relation between
vehicle speed and NOx), the test reveals that there is
certain correlation between vehicle speed and
pollutant concentrations, indicating that CO2 and NOx
concentrations by the roadside could be decreased
by controlling vehicle speed.
In the future, the measurement target wil l be
expanded to include noise and vibration as well as
other air pollutants, such as CO and SPM.
Universal Traffic Management Systems 2━15
Environmental Protection ManagementSystems (EPMS)
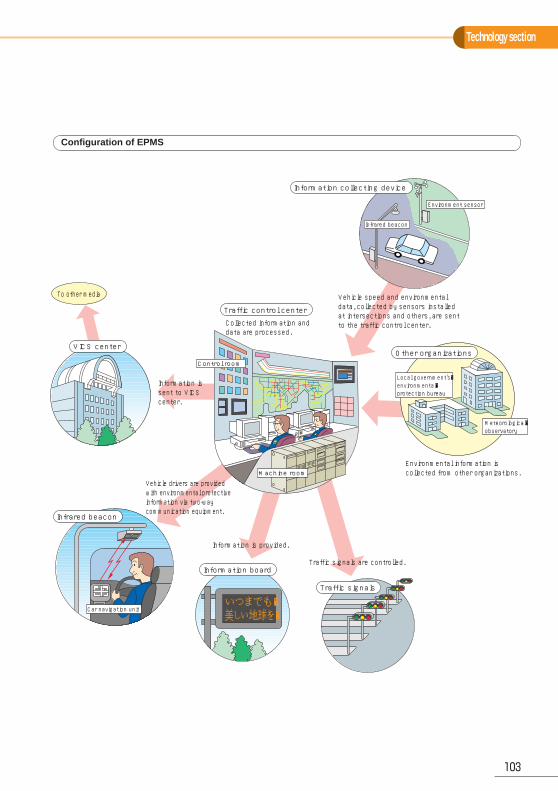
Technology section
103
Configuration of EPMS
Car navigation unit
Infrared beacon
いつまでも�美しい地球を�
Information board
Traffic signals
Other organizations
Local government's�environmental�protection bureau
Meteorological�observatory
Infrared beacon
Environment sensor
Information collecting device
VICS center
Machine room
Control room
Traffic control center
To other media Vehicle speed and environmental data, collected by sensors installed at intersections and others, are sent to the traffic control center.
Environmental information is collected from other organizations.
Traffic signals are controlled.
Information is provided.
Information is sent to VICS center.
Vehicle drivers are provided with environmental protective information via two-way communication equipment.
Collected information and data are processed.
Verification Test of EPMS
104
Basic study of Environmental Protection Management
Systems (EPMS) was started in 1994 and completed in early
1996. Verification test has been conducted since late 1996
in Shizuoka city, Shizuoka prefecture.
In the basic study, correlation between various traffic data
and air-pollutant concentration was theoretically analyzed,
based on the emission factor formula per unit time, a simple
vehicle-running model developed for this study, and the
relation between vehicle speed and exhaust emissions on
the assumption that only one vehicle is running. The
following results were obtained:
① Each air-pollutant concentration is almost proportional to
the traffic volume.
② Analysis using realistic vehicle speed and realistic vehicle-
to-vehicle distance reveals that each air-pollutant
concentration is the lowest when vehicle speed is
between 40 and 50 km/h.
The objective of the verification test is to verify the above-
mentioned results of theoretical analysis. For the test, traffic
signals are intentionally controlled to enable groups of
vehicles to run within a certain speed range, and to decrease
the frequency at which each vehicle must be stopped and
started.
The test site shown in right above map was selected mainly
for the following reasons:
① Wind velocity in Shizuoka city is generally low and
constant throughout the year.
② Air pollution data observed in Shizuoka city by the
municipal and prefectural agencies reveals that the
concentrations of air pollutants, such as CO, NOx and
suspended particulate matter (SPM) are relatively stable
at around environmental standard values.
③ Daily traffic on the roads does not change significantly
from day to day.
④ Percentage of the number of heavy vehicles in the entire
traffic is almost constant.
Measurement items for the verification test are as follows:
① Pollution data (CO2, NOx, SPM) ② Traffic data
(Traffic, Rate of road occupancy, Vehicle speed, Number
of diesel-engine vehicles) ③ Meteorological data (Wind
direction and velocity on the roadside, Temperature,
Humidity, Daylight hours, Precipitation, Other weather
conditions)
For the test, traffic signals along each test road are
intentionally controlled for a particular time of a particular
day, for comparison between controlled and uncontrolled
data. The following control methods are used:
① Inflow limitation split ② Complete priority offset ③
Complete reverse offset ④ Successive stop-and-go
offset ⑤ Inflow limitation split/complete priority offset
The results obtained thus far can be summarized as follows:
① There is a certain correlation between vehicle speed and
the NOx and CO2 concentrations on the roadside.
② When the local mean wind velocity exceeds 3 m/s, the
above correlation tends to be lost due to dispersion of
natural wind and rain.
③ The NOx concentration measured at about 30 m
perpendicularly distant from the roadside is nearly half
that measured on the roadside. The NOx concentration
is reduced in inverse proportion to the square of distance
from the road.
These results prove the effectiveness of EPMS, indicating
that roadside air pollution by automotive exhaust emissions
can be reduced if the speed of vehicles running on the road
is restricted within a specified range by controlling traffic
signals from the traffic control center. Atmospheric influence
of automotive exhaust emissions is obvious, within some 30
m range from the roadside. If EPMS is introduced, however,
pedestrians and residents along the road can be protected
from air pollution caused by exhaust emissions.
In the future, the measurement target will be increased to
include vibration and noise as well.
Universal Traffic Management Systems 2━16
TOP
ICS
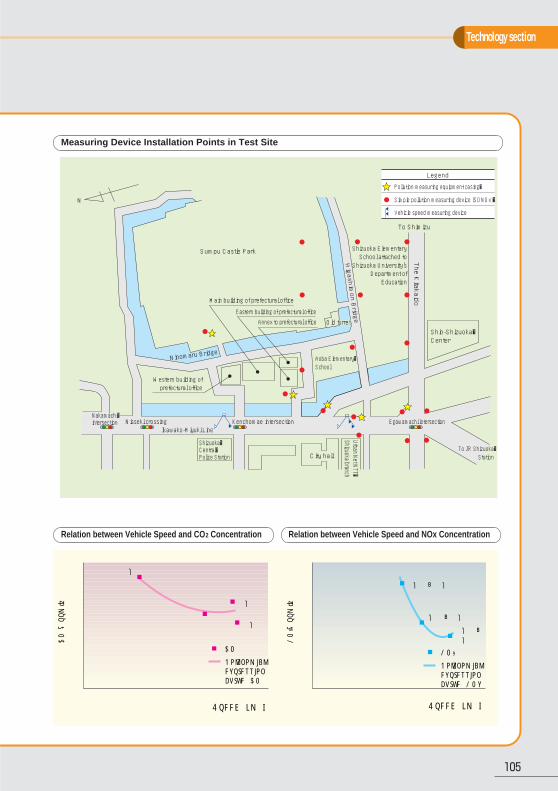
Technology section
105
Nakamachi�intersectionNakamachi�intersection Nisseki crossing
Ikawako-Miyuki Line
Shizuoka�Central�Police Station
Kenchomae intersection
Ninomaru Bridge
City hall
Urban Net NTT�Shizuoka branch
Egawamachi intersection
Shin-Shizuoka�Center
Aoba Elementary�School
Old turretOld turret
Higashimon Bridge
Sumpu Castle Park
N
To Shimizu
The K
itakaido
To JR Shizuoka�Station
Legend
Pollution measuring equipment casing�
Simple pollution measuring device (SONOx)�
Vehicle speed measuring device
Western building of prefectural office
Main building of prefectural office
Eastern building of prefectural officeAnnex to prefectural office
Shizuoka Elementary School attached to
Shizuoka University's Department of Education
Measuring Device Installation Points in Test Site
Relation between Vehicle Speed and CO 2 Concentration Relation between Vehicle Speed and NOx Concentration
380
360
340
320
300
280
260
240
220
20020.0 25.0 30.0 35.0 40.0 45.0
Speed (km/h)
CO2(ppm)�
0
100
200
300
400
500
600
700
0 10 20 30 40Speed (km/h)
NOX(ppm)�
CO2
14:00
14:10
10:10~10:40
10:40~�11:10
11:20~11:5014:20
Polynomial�expression�curve (CO2)
NOX
Polynomial�expression�curve (NOx)
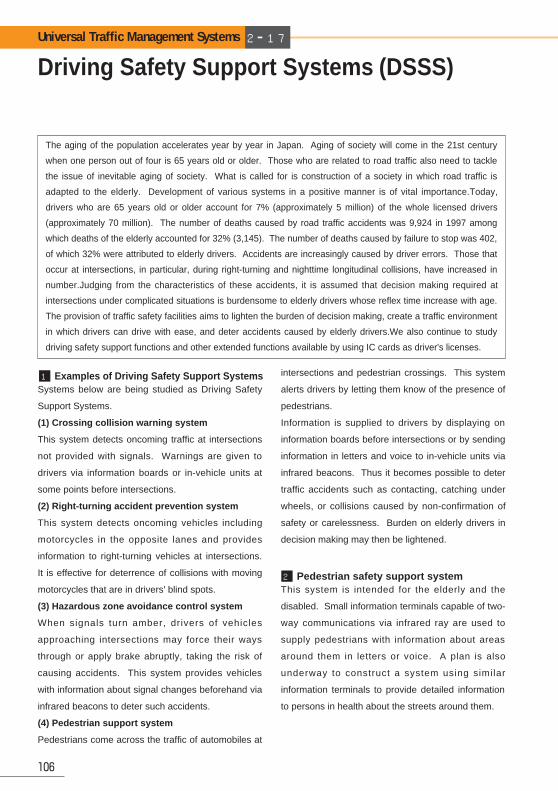
Driving Safety Support Systems (DSSS)
106
Universal Traffic Management Systems 2━17
Systems below are being studied as Driving Safety
Support Systems.
(1) Crossing collision warning system
This system detects oncoming traffic at intersections
not provided with signals. Warnings are given to
drivers via information boards or in-vehicle units at
some points before intersections.
(2) Right-turning accident prevention system
This system detects oncoming vehicles including
motorcycles in the opposite lanes and provides
information to right-turning vehicles at intersections.
It is effective for deterrence of collisions with moving
motorcycles that are in drivers' blind spots.
(3) Hazardous zone avoidance control system
When signals turn amber, drivers of vehicles
approaching intersections may force their ways
through or apply brake abruptly, taking the risk of
causing accidents. This system provides vehicles
with information about signal changes beforehand via
infrared beacons to deter such accidents.
(4) Pedestrian support system
Pedestrians come across the traffic of automobiles at
intersections and pedestrian crossings. This system
alerts drivers by letting them know of the presence of
pedestrians.
Information is supplied to drivers by displaying on
information boards before intersections or by sending
information in letters and voice to in-vehicle units via
infrared beacons. Thus it becomes possible to deter
traffic accidents such as contacting, catching under
wheels, or collisions caused by non-confirmation of
safety or carelessness. Burden on elderly drivers in
decision making may then be lightened.
This system is intended for the elderly and the
disabled. Small information terminals capable of two-
way communications via infrared ray are used to
supply pedestrians with information about areas
around them in letters or voice. A plan is also
underway to construct a system using similar
information terminals to provide detailed information
to persons in health about the streets around them.
The aging of the population accelerates year by year in Japan. Aging of society will come in the 21st century
when one person out of four is 65 years old or older. Those who are related to road traffic also need to tackle
the issue of inevitable aging of society. What is called for is construction of a society in which road traffic is
adapted to the elderly. Development of various systems in a positive manner is of vital importance.Today,
drivers who are 65 years old or older account for 7% (approximately 5 million) of the whole licensed drivers
(approximately 70 million). The number of deaths caused by road traffic accidents was 9,924 in 1997 among
which deaths of the elderly accounted for 32% (3,145). The number of deaths caused by failure to stop was 402,
of which 32% were attributed to elderly drivers. Accidents are increasingly caused by driver errors. Those that
occur at intersections, in particular, during right-turning and nighttime longitudinal collisions, have increased in
number.Judging from the characteristics of these accidents, it is assumed that decision making required at
intersections under complicated situations is burdensome to elderly drivers whose reflex time increase with age.
The provision of traffic safety facilities aims to lighten the burden of decision making, create a traffic environment
in which drivers can drive with ease, and deter accidents caused by elderly drivers.We also continue to study
driving safety support functions and other extended functions available by using IC cards as driver's licenses.
Examples of Driving Safety Support Systems1
Pedestrian safety support system2
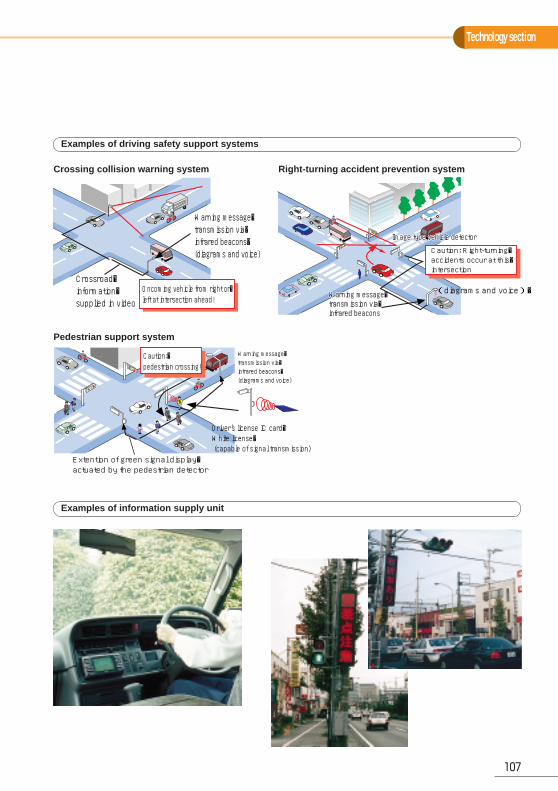
Technology section
107
Examples of driving safety support systems
Examples of information supply unit
Crossroad�information�supplied in video
Warning message�transmission via�infrared beacons�(diagrams and voice)
Oncoming vehicle from right or�left at intersection ahead!
(diagrams and voice)�
Caution: Right-turning�accidents occur at this�intersection
Warning message�Warning message�transmission via�transmission via�infrared beaconsinfrared beacons
Warning message�transmission via�infrared beacons
Image type vehicle detectorImage type vehicle detectorImage type vehicle detector
Warning message�transmission via�infrared beacons�(diagrams and voice)
Driver's license IC card�White license� (capable of signal transmission)
Extention of green signal display�actuated by the pedestrian detector
Caution:�pedestrian crossing!
Crossing collision warning system Right-turning accident prevention system
Pedestrian support system
Help System for Emergency Life Savingand Public Safety (HELP)
108
Universal Traffic Management Systems 2━18
While the death toll by traffic accidents was under
10,000 for the successive two years of 1996 and
1997, the number of traffic accident case recorded a
new high for the last successive five years, with the
injured recording the 900,000 range for the
successive three years. The National Police Agency
has been struggling to improve this situation by
shorting time lag between occurrence of an accident
and calling of rescue, with a wish to help as many
lives as possible. For this purpose, the Agency has
been engaged in R&D of Help System for Emergency
Life Saving and Public Safety (HELP).
The outline of HELP envisaged at present is as
follows (refer to the right concept).
When a traffic accident occurs, the location data
obtained by the global positioning system (GPS) is
sent automatically or manually from the in-vehicle
terminal to the HELP Center (temporary name), in
addition to oral information reported via the mobile or
cellular phone. Based on the oral information given
by the reporter, staff at the HELP Center contacts a
local rescue organization and connects the reporter's
phone line to the organization as necessary.
① In-vehicle terminal:
Two types of in-vehicle terminals are in
consideration at present: the type with a manual
emergency push-button, and the type with
automatic communication function based on an
impact sensor etc.
② HELP Center:
Staff at this Center receives accident information
from an in-vehicle terminal, and if necessary,
contacts a rescue organization and connects the
reporter's phone line to the organization.
HELP is in the process of development at present. To
confirm the effectiveness of this system in reducing
the time lag between occurrence of an accident and
communication to the temporary HELP center,
verification test was carried out in October 1997, in
Tokyo. On the assumption that a traffic accident
occurred during daytime, the time until the HELP
Center received the accident information was
measured in the test.
The result of the verification test is as follows:
① In-vehicle terminal: Average of 59 s
② Pay phone: Average of 84 s
③ Cellular phone: Average of 101 s
Clearly, HELP can reduce the time lag between
occurrence of an accident and reporting, by an
average of 42 seconds.
The National Police Agency has been making every
effort to develop and introduce practical HELP as
early as possible, with the aim of minimizing traffic
accident fatalities, as eagerly desired by various
sectors.
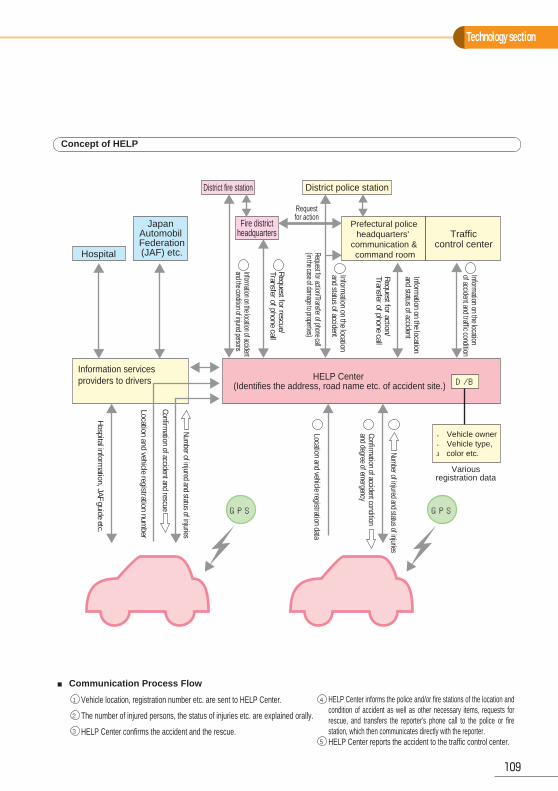
Technology section
109
Concept of HELP
District fire station
Fire districtheadquarters
Requestfor action
Prefectural policeheadquarters'
communication & command room
District police station
HELP Center (Identifies the address, road name etc. of accident site.) D/B
● Vehicle owner● Vehicle type, color etc.
Variousregistration data
Number of injured and status of injuries
23
Confirmation of accident condition
and degree of emergency
Information services providers to drivers
Trafficcontrol center
JapanAutomobil
Federation (JAF) etc.Hospital
Hospital information, JAF guide etc.
Location and vehicle registration number
1
Location and vehicle registration data
54Information on the location of accidentand the condition of injured persons
4Request for rescue/Transfer of phone call
4Information on the location
and status of accident
Information on the location
of accident and traffic condition
Request for action/Transfer of phone call
Information on the location
and status of accident
Request for action/Transfer of phone call (in the case of damage to properties)
Number of injured and status of injuries
Confirmation of accident and rescue GPS GPS
1
2
3
■ Communication Process Flow
Vehicle location, registration number etc. are sent to HELP Center.
The number of injured persons, the status of injuries etc. are explained orally.
HELP Center confirms the accident and the rescue.
4
5
HELP Center informs the police and/or fire stations of the location and condition of accident as well as other necessary items, requests for rescue, and transfers the reporter's phone call to the police or fire station, which then communicates directly with the reporter.HELP Center reports the accident to the traffic control center.
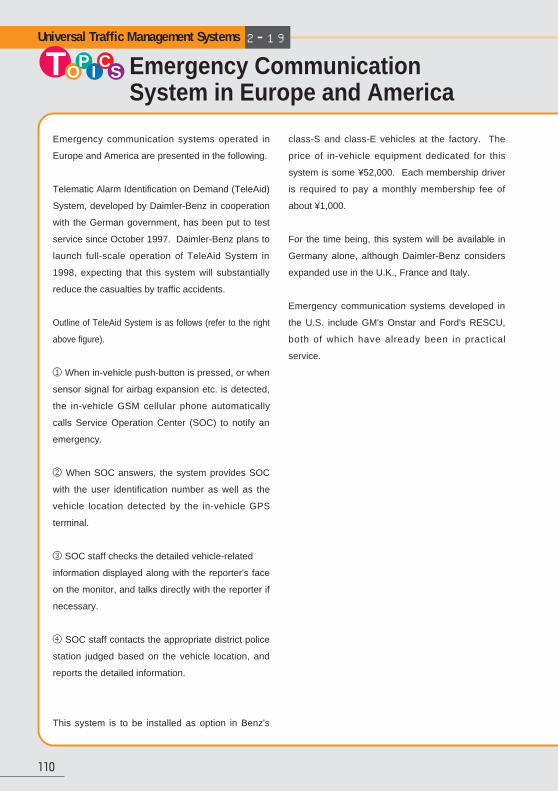
Emergency CommunicationSystem in Europe and America
110
Universal Traffic Management Systems 2━19
TOP
ICS
Emergency communication systems operated in
Europe and America are presented in the following.
Telematic Alarm Identification on Demand (TeleAid)
System, developed by Daimler-Benz in cooperation
with the German government, has been put to test
service since October 1997. Daimler-Benz plans to
launch full-scale operation of TeleAid System in
1998, expecting that this system will substantially
reduce the casualties by traffic accidents.
Outline of TeleAid System is as follows (refer to the right
above figure).
① When in-vehicle push-button is pressed, or when
sensor signal for airbag expansion etc. is detected,
the in-vehicle GSM cellular phone automatically
calls Service Operation Center (SOC) to notify an
emergency.
② When SOC answers, the system provides SOC
with the user identification number as well as the
vehicle location detected by the in-vehicle GPS
terminal.
③ SOC staff checks the detailed vehicle-related
information displayed along with the reporter's face
on the monitor, and talks directly with the reporter if
necessary.
④ SOC staff contacts the appropriate district police
station judged based on the vehicle location, and
reports the detailed information.
This system is to be installed as option in Benz's
class-S and class-E vehicles at the factory. The
price of in-vehicle equipment dedicated for this
system is some ¥52,000. Each membership driver
is required to pay a monthly membership fee of
about ¥1,000.
For the time being, this system will be available in
Germany alone, although Daimler-Benz considers
expanded use in the U.K., France and Italy.
Emergency communication systems developed in
the U.S. include GM's Onstar and Ford's RESCU,
both of which have already been in practical
service.
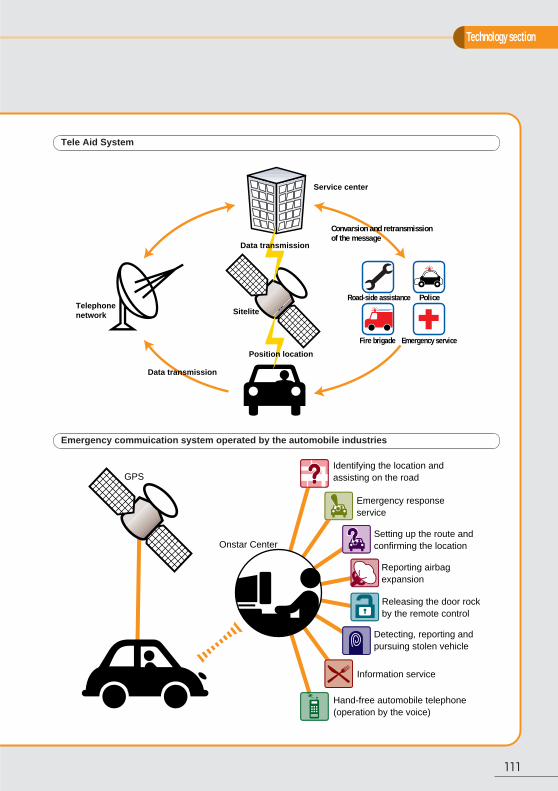
Technology section
111
Service center
Telephonenetwork
Convarsion and retransmissionof the message
Sitelite
Data transmission
Data transmission
Road-side assistance Police
Fire brigade Emergency service
Position location
Identifying the location andassisting on the road
Emergency responseservice
Setting up the route andconfirming the location
Reporting airbagexpansion
Releasing the door rockby the remote control
Onstar Center
GPS
Detecting, reporting andpursuing stolen vehicle
Information service
Hand-free automobile telephone(operation by the voice)
Tele Aid System
Emergency commuication system operated by the automobile industries
Intelligent Integrated ITV Systems
112
Universal Traffic Management Systems 2━20
Intelligent Integrated ITV Systems (IIIS) is designed
to deter illegal parking and control traffic signals,
based on the images sent from TV cameras which
collect traffic information. IIIS also provides drivers
with visual traffic information via infrared vehicle
detectors, Internet etc. The aim is to ensure safe and
smooth traffic flow, creating an environment-friendly
automobile society.
Intelligent Illegal Parking Deterrence SystemTO
PICS
The conventional illegal parking deterrence
system is designed mainly for giving warning from
the traffic control center or a police station
through installed loudspeakers to vehicles illegally
parked near intersections, and for checking the
road for traff ic f low and obstacles. The
conventional system is cost-ineffective, since it
uses expensive cameras with oscillating head
and zooming function, and analog transmission
line of high maintenance cost.
To overcome this problem, new intelligent illegal
parking deterrence system has been developed
based on the state-of-the-art digital image
processing technology. This intelligent system
uses less expensive stationary cameras and
digital transmission line of low maintenance cost.
In addition, the system controls traffic signals
based on the vehicle running speed, the traffic
volume, and the percentage of heavy vehicles in
the entire traffic. This system also automatically
detects traffic accident or congestion near
intersections and automatically notifies such
information to the traffic control center. The
concept of the intell igent i l legal parking
deterrence system is shown by illustration.
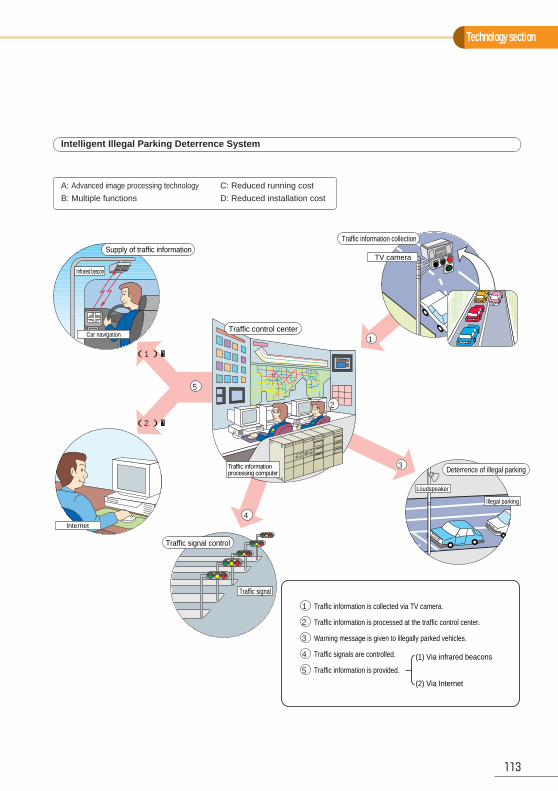
Technology section
113
Intelligent Illegal Parking Deterrence System
Car navigation
Infrared beacon
Supply of traffic information
Loudspeaker
Illegal parking
Deterrence of illegal parkingTraffic informationprocessing computer
Traffic control center
TV camera
Traffic information collection
Traffic signal control
Traffic signal
Internet
1
2
3
4
1
5
4
3
2
5
(1)�
(2)�
Traffic information is collected via TV camera.
Traffic information is processed at the traffic control center.
Warning message is given to illegally parked vehicles.
Traffic signals are controlled.
Traffic information is provided.
(1) Via infrared beacons
(2) Via Internet
A: Advanced image processing technology
B: Multiple functions
C: Reduced running cost
D: Reduced installation cost
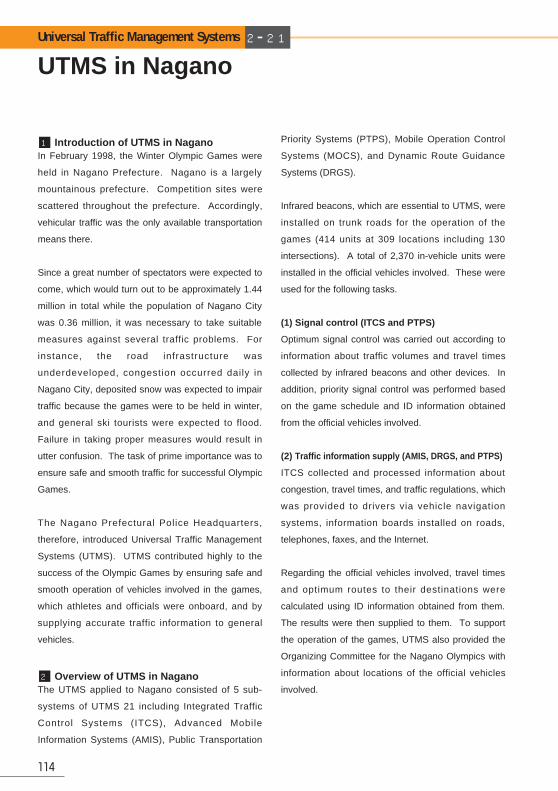
UTMS in Nagano
114
Universal Traffic Management Systems 2━21
Introduction of UTMS in Nagano1In February 1998, the Winter Olympic Games were
held in Nagano Prefecture. Nagano is a largely
mountainous prefecture. Competition sites were
scattered throughout the prefecture. Accordingly,
vehicular traffic was the only available transportation
means there.
Since a great number of spectators were expected to
come, which would turn out to be approximately 1.44
million in total while the population of Nagano City
was 0.36 million, it was necessary to take suitable
measures against several traffic problems. For
instance, the road infrastructure was
underdeveloped, congestion occurred daily in
Nagano City, deposited snow was expected to impair
traffic because the games were to be held in winter,
and general ski tourists were expected to flood.
Failure in taking proper measures would result in
utter confusion. The task of prime importance was to
ensure safe and smooth traffic for successful Olympic
Games.
The Nagano Prefectural Police Headquarters,
therefore, introduced Universal Traffic Management
Systems (UTMS). UTMS contributed highly to the
success of the Olympic Games by ensuring safe and
smooth operation of vehicles involved in the games,
which athletes and officials were onboard, and by
supplying accurate traffic information to general
vehicles.
The UTMS applied to Nagano consisted of 5 sub-
systems of UTMS 21 including Integrated Traffic
Control Systems (ITCS), Advanced Mobile
Information Systems (AMIS), Public Transportation
Priority Systems (PTPS), Mobile Operation Control
Systems (MOCS), and Dynamic Route Guidance
Systems (DRGS).
Infrared beacons, which are essential to UTMS, were
installed on trunk roads for the operation of the
games (414 units at 309 locations including 130
intersections). A total of 2,370 in-vehicle units were
installed in the official vehicles involved. These were
used for the following tasks.
(1) Signal control (ITCS and PTPS)
Optimum signal control was carried out according to
information about traffic volumes and travel times
collected by infrared beacons and other devices. In
addition, priority signal control was performed based
on the game schedule and ID information obtained
from the official vehicles involved.
(2) Traffic information supply (AMIS, DRGS, and PTPS)
ITCS collected and processed information about
congestion, travel times, and traffic regulations, which
was provided to drivers via vehicle navigation
systems, information boards installed on roads,
telephones, faxes, and the Internet.
Regarding the official vehicles involved, travel times
and optimum routes to their destinations were
calculated using ID information obtained from them.
The results were then supplied to them. To support
the operation of the games, UTMS also provided the
Organizing Committee for the Nagano Olympics with
information about locations of the official vehicles
involved.Overview of UTMS in Nagano2
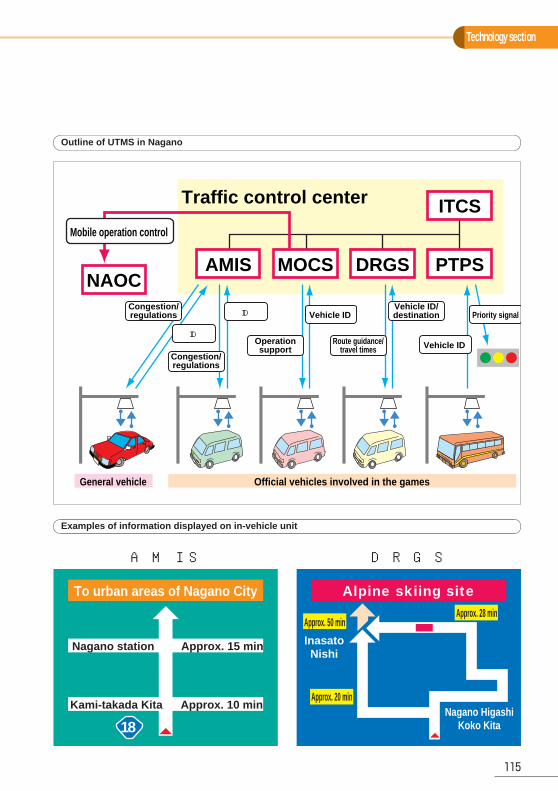
Technology section
115
Examples of information displayed on in-vehicle unit
To urban areas of Nagano City
Nagano station
Kami-takada Kita
Approx. 15 min
Approx. 10 min
18
Alpine skiing site
InasatoNishi
Nagano HigashiKoko Kita
Approx. 50 minApprox. 28 min
Approx. 20 min
General vehicle Official vehicles involved in the games
NAOCAMIS MOCS DRGS PTPS
ITCSTraffic control center
Vehicle ID
Vehicle ID Priority signal
ID
ID
Mobile operation control
Congestion/regulations
Congestion/regulations
Route guidance/travel times
Operationsupport
Vehicle ID/destination
A M I S D R G S
Outline of UTMS in Nagano
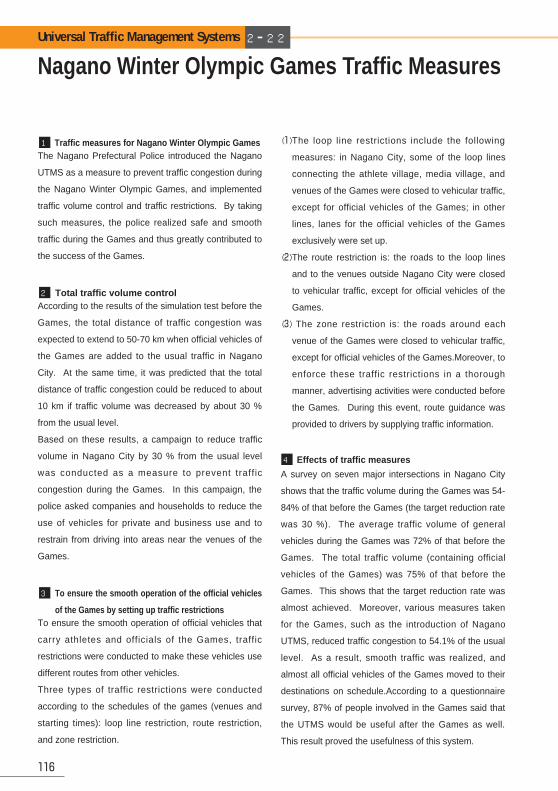
Nagano Winter Olympic Games Traffic Measures
116
Universal Traffic Management Systems 2━22
The Nagano Prefectural Police introduced the Nagano
UTMS as a measure to prevent traffic congestion during
the Nagano Winter Olympic Games, and implemented
traffic volume control and traffic restrictions. By taking
such measures, the police realized safe and smooth
traffic during the Games and thus greatly contributed to
the success of the Games.
According to the results of the simulation test before the
Games, the total distance of traffic congestion was
expected to extend to 50-70 km when official vehicles of
the Games are added to the usual traffic in Nagano
City. At the same time, it was predicted that the total
distance of traffic congestion could be reduced to about
10 km if traffic volume was decreased by about 30 %
from the usual level.
Based on these results, a campaign to reduce traffic
volume in Nagano City by 30 % from the usual level
was conducted as a measure to prevent traff ic
congestion during the Games. In this campaign, the
police asked companies and households to reduce the
use of vehicles for private and business use and to
restrain from driving into areas near the venues of the
Games.
To ensure the smooth operation of official vehicles that
carry athletes and officials of the Games, traffic
restrictions were conducted to make these vehicles use
different routes from other vehicles.
Three types of traffic restrictions were conducted
according to the schedules of the games (venues and
starting times): loop line restriction, route restriction,
and zone restriction.
(1)The loop line restrictions include the following
measures: in Nagano City, some of the loop lines
connecting the athlete village, media village, and
venues of the Games were closed to vehicular traffic,
except for official vehicles of the Games; in other
lines, lanes for the official vehicles of the Games
exclusively were set up.
(2)The route restriction is: the roads to the loop lines
and to the venues outside Nagano City were closed
to vehicular traffic, except for official vehicles of the
Games.
(3) The zone restriction is: the roads around each
venue of the Games were closed to vehicular traffic,
except for official vehicles of the Games.Moreover, to
enforce these traffic restrictions in a thorough
manner, advertising activities were conducted before
the Games. During this event, route guidance was
provided to drivers by supplying traffic information.
A survey on seven major intersections in Nagano City
shows that the traffic volume during the Games was 54-
84% of that before the Games (the target reduction rate
was 30 %). The average traffic volume of general
vehicles during the Games was 72% of that before the
Games. The total traffic volume (containing official
vehicles of the Games) was 75% of that before the
Games. This shows that the target reduction rate was
almost achieved. Moreover, various measures taken
for the Games, such as the introduction of Nagano
UTMS, reduced traffic congestion to 54.1% of the usual
level. As a result, smooth traffic was realized, and
almost all official vehicles of the Games moved to their
destinations on schedule.According to a questionnaire
survey, 87% of people involved in the Games said that
the UTMS would be useful after the Games as well.
This result proved the usefulness of this system.
Traffic measures for Nagano Winter Olympic Games1
Total traffic volume control2
To ensure the smooth operation of the official vehicles
of the Games by setting up traffic restrictions
3
Effects of traffic measures4
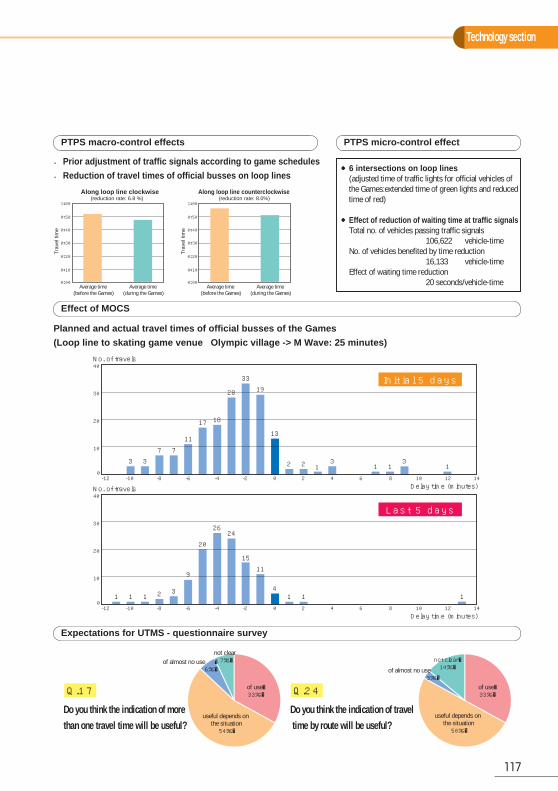
Technology section
117
PTPS macro-control effects PTPS micro-control effect
●Prior adjustment of traffic signals according to game schedules
●Reduction of travel times of official busses on loop lines
1:00
0:50
0:40
0:30
Average time (before the Games)
Average time (during the Games)
Average time (before the Games)
Average time (during the Games)
(reduction rate: 6.8 %) (reduction rate: 8.0%)Along loop line clockwise Along loop line counterclockwise
Tra
vel t
ime
Tra
vel t
ime
0:20
0:10
0:00
1:00
0:50
0:40
0:30
0:20
0:10
0:00
●6 intersections on loop lines (adjusted time of traffic lights for official vehicles ofthe Games:extended time of green lights and reducedtime of red)
●Effect of reduction of waiting time at traffic signalsTotal no. of vehicles passing traffic signals
106,622 vehicle-timeNo. of vehicles benefited by time reduction
16,133 vehicle-timeEffect of waiting time reduction
20 seconds/vehicle-time
Planned and actual travel times of official busses of the Games
(Loop line to skating game venue Olympic village -> M Wave: 25 minutes)
Effect of MOCS
Expectations for UTMS - questionnaire survey
-12
40No. of travels
Delay time (minutes)
30
20
10
0-10
3 3
1 1 1 2 3
20
2624
1511
41 1 1
9
7 7
11
17 18
28
3319
13
2 2 13
1 13
1
-8 -6 -4 -2 0 2 4 6 8 10 12 14
Initial 5 days
-12
40No. of travels
Delay time (minutes)
30
20
10
0-10 -8 -6 -4 -2 0 2 4 6 8 10 12 14
Last 5 days
not clear7%� not clear�
14%�
of use�33%�
of use�33%�
useful depends on the situation54%�
useful depends on the situation50%�
of almost no use �6%� of almost no use
3%�
Q.24 Q.17
Do you think the indication of more than one travel time will be useful?
Do you think the indication of travel time by route will be useful?
Deployment of Optical (Infrared Ray)Communication Technology
118
Universal Traffic Management Systems 2━23
Various optical-communication-technology-applied
equipment and systems have been developed,
manufactured and used in many industrial sectors
recently. Optical communication between television
sets and remote controllers and between personal
computers and peripheral equipment are very
common.
Existing applications of the optical (infrared ray)
communication technology to traffic control have
been mentioned as follows;
One typical application in Japan is infrared beacons,
which have been installed nationwide by the National
Police Agency. At present, the traffic information
collected and processed by the traffic control center
in each Prefectural Police Headquarters is sent to
VICS (Vehicle Information Communication Systems)
Center and distributed to individual in-vehicle units
vie infrared beacons, FM multiplex broadcasting, etc.
Infrared beacons are also used to measure the traffic
volume with their detecting function. The number of
infrared beacons installed in Japan is some 18,000 at
present, and is expected to be increased to some
30,000 by the year 2001.
Application examples of optical communication
technology outside Japan have also been
investigated. As shown in the attached table, optical
communication technology is applied practically to
various traff ic control systems, such as the
emergency vehicle priority system, the public
transportation operation control system, the route
guidance system, the electronic toll collecton (ETC)
system, the vehicle detection system, and the voice
guidance system for sight-impaired persons. Some
of these systems provide the same functions as do
the UTMS21 systems which are promoted in Japan
by the National Police Agency. Some have not yet
been used in Japan for various reasons. Following
are typical systems that have not yet been adopted in
Japan.
① Emergency Vehicle Priority System (see right
above figure)
The system comprises infrared ray transmitters
installed in respective emergency vehicles (Each
ID number is added to the emitted ray) and
infrared ray receivers installed mainly in the upper
part of traffic signal poles. When an emergency
vehicle equipped with an infrared beam transmitter
comes to a point some 800 m before an
intersection with an infrared ray receiver, the
receiver catches the infrared beam emitted from
the vehicle, and turns the traffic signal at the
intersection green, enabling the emergency vehicle
to run through the intersection safely and
smoothly.
At present, this emergency vehicle priority system
has been adopted in 850 cities worldwide. Infrared
beam receivers are installed at some 30,000
intersections, and beam transmitters are mounted
on an average of 75 emergency vehicles for each
city.
② Electronic Toll Collecting (ETC) System
Electronic toll collecting (ETC) systems can be
classified roughly in radio type and infrared ray
type. The infrared ray ETC system, which is
presented this time, has not been and is not likely
to be adopted in Japan although it is put to
practical use in many other countries.
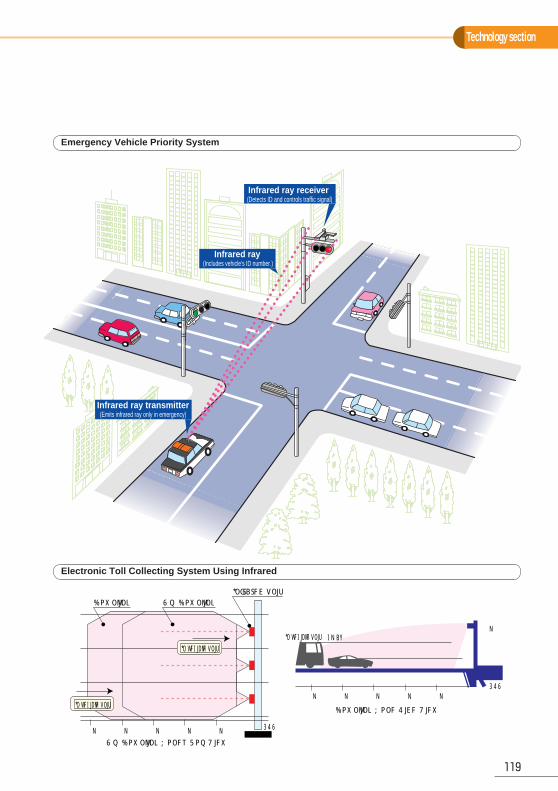
50m 40m 30m 20m 10m RSU
Infrared unit
Up/Downlink Zones-Top View
Downlink Zone-Side View
50m 40m 30m 20m 10m
5.5m
RSU
hmax
�
Infrared ray receiver (Detects ID and controls traffic signal)
In-vehicle unit
In-vehicle unit
Up/DownlinkDownlink
In-vehicle unit
Infrared ray (Includes vehicle's ID number.)
Infrared ray transmitter(Emits infrared ray only in emergency)
Technology section
119
Emergency Vehicle Priority System
Electronic Toll Collecting System Using Infrared

ITS developed by Japanese PolicePublished by Institute of Urban Traffic Research
3-2-25 Kitahama Chuo-ku Osaka, Japan 〒541-0041
phone 06-204-0040
Fax 06-204-0220
URL http://www.toshikotsu.or.jp/
E-mail [email protected]
TRAFFIC BUREAU, NATIONAL POLICE AGENCYJAPAN TRAFFIC MANAGEMENT TECHNOLOGY ASSOCIATION
UNIVERSAL TRAFFIC MANAGEMENT SOCIETY OF JAPAN
INSTITUTE OF URBAN TRAFFIC RESEARCH
Edited by
Materialsprovided by
Published by
ITS developed by Japanese Police
ISBN4-924905-39-9
C3465 ¥1905E9784924905399
1923465019051