intellectual property valuation application of the relief ... · intellectual property valuation...
TRANSCRIPT

Intellectual Property ValuationApplication of the Relief fromApplication of the Relief from
Royalty Method
Robert F. Reilly, CPAWillamette Management Associates
• Four types of intellectual property• Three types of intellectual property analyses• Use of royalty rate data in intellectual property analyses• Intellectual property royalty rate data sources• Intellectual property royalty rate data sources• Two types of intellectual property royalty rate data• Purpose of making royalty rate normalization adjustments• Common types of normalization adjustments• Royalty rate analysis illustrative example• Relief from royalty method illustrative example• Relief from royalty method illustrative example• Questions and discussion
• Royalty rate data are commonly used in the analysis of intellectual property (“IP”)
• There are four types of IP:• PatentsPatents• Trademarks• Copyrights• Trade secrets• Trade secrets
• Many arm’s‐length, third‐party IP license agreements include both intellectual property and related intangible assets
• So, consider the bundle of intangible assets included in the license—as well as the bundle of IP legal rights included in the license
• Common types of patents• Utility patents Plant patents• Design patents Process/method patents
• Related intangible assetsRelated intangible assets• Patent applications Technology development rights• Technology sharing agreements Engineering drawings and designs• Unpatented proprietary technology Schematics and technical documentation• Unpatented proprietary technology Schematics and technical documentation• Regulatory approvals and licenses (e.g., FDA approvals, OSHA approvals)

• Related intellectual property• Trade names• Logos• Service marks• Service names• Trade dress
• Related intangible assetsRelated intangible assets• Brand names• Advertising programs• Brochures and marketing materials• Brochures and marketing materials• Name‐related goodwill
• Copyrights are available for:• Literary works• Musical works• Dramatic works• Pantomimes and choreographed works• Pictorial, graphic, or sculptural works• Motion pictures and audiovisual worksp• Sound recordings• Architectural works• Computer software (object code and source code)Computer software (object code and source code)

• Related intangible assets• Engineering drawings• Blueprints• Manuals and procedures• Training films

• Trade secrets intellectual property• Customer information• Books and records• Product/formulas and recipes• Procedures and know‐how• Pricing and cost information• Accounting documentation
• Related intangible assets• Employee training materials• Process flow chartsProcess flow charts• Plant diagrams and schematics• Financial plans and projections
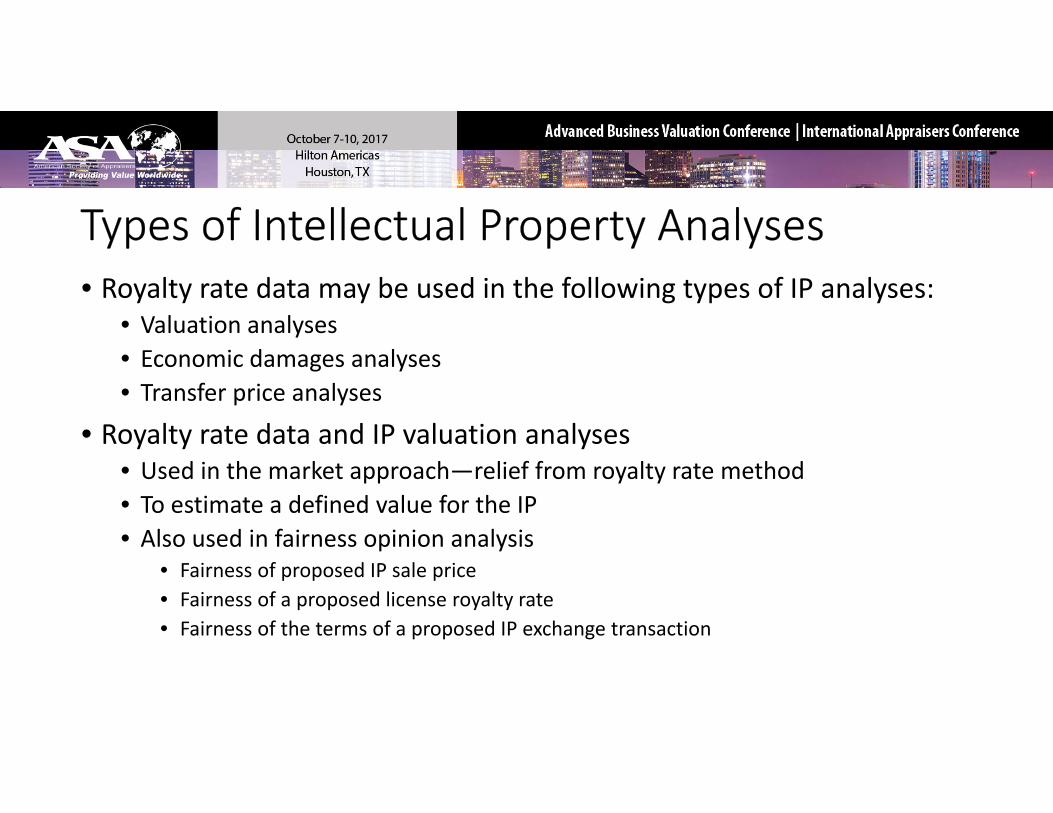
• Royalty rate data may be used in the following types of IP analyses:• Valuation analyses• Economic damages analyses• Transfer price analyses
• Royalty rate data and IP valuation analyses• Used in the market approach—relief from royalty rate method• To estimate a defined value for the IP• To estimate a defined value for the IP• Also used in fairness opinion analysis
• Fairness of proposed IP sale price• Fairness of a proposed license royalty rateFairness of a proposed license royalty rate• Fairness of the terms of a proposed IP exchange transaction

• Royalty rate data and IP damages analyses• As a reasonable royalty rate damages measure• May be used for tort damages or breach of contract damages
• Royalty rate data and transfer price analysesRoyalty rate data and transfer price analyses• Used in comparable uncontrolled transaction (CUT) method• International (taxation) transfers of intangible property• Interstate (taxation) transfers of intangible property• Interstate (taxation) transfers of intangible property• Intercompany transfers between controlled entities with minority ownership interests
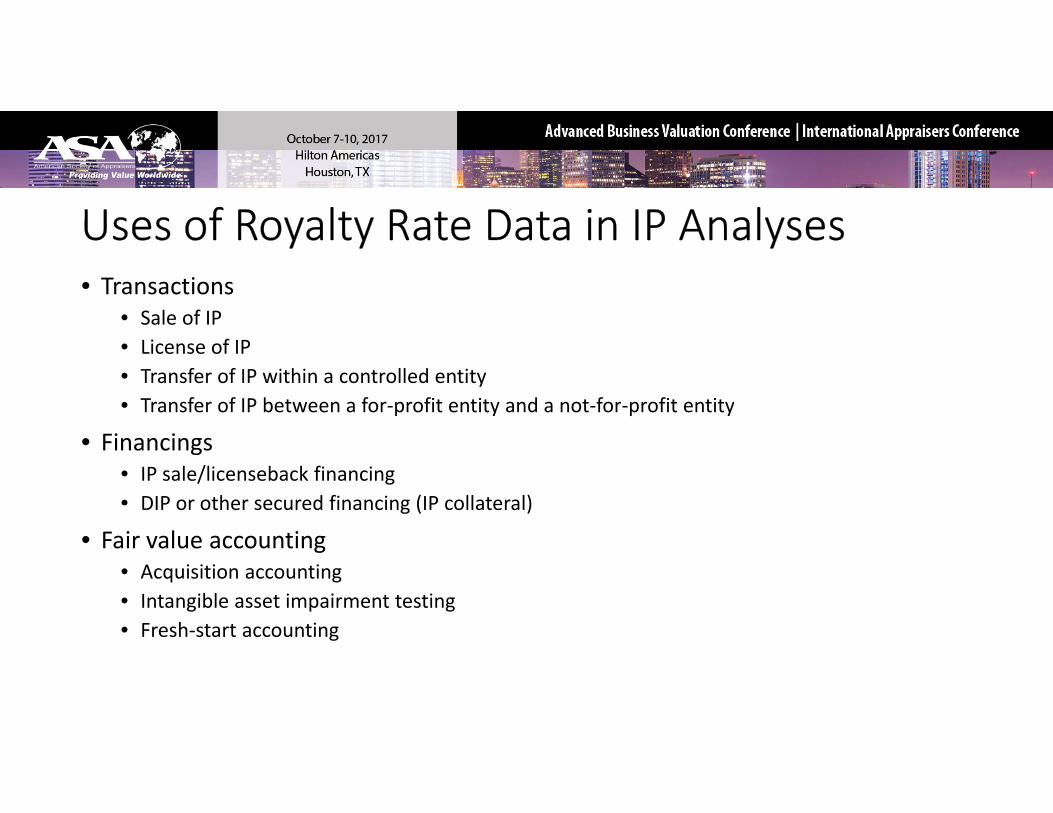
• Transactions• Sale of IP• License of IP• Transfer of IP within a controlled entity• Transfer of IP between a for‐profit entity and a not‐for‐profit entity• Transfer of IP between a for‐profit entity and a not‐for‐profit entity
• Financings• IP sale/licenseback financing• DIP or other secured financing (IP collateral)DIP or other secured financing (IP collateral)
• Fair value accounting• Acquisition accounting• Intangible asset impairment testingIntangible asset impairment testing• Fresh‐start accounting
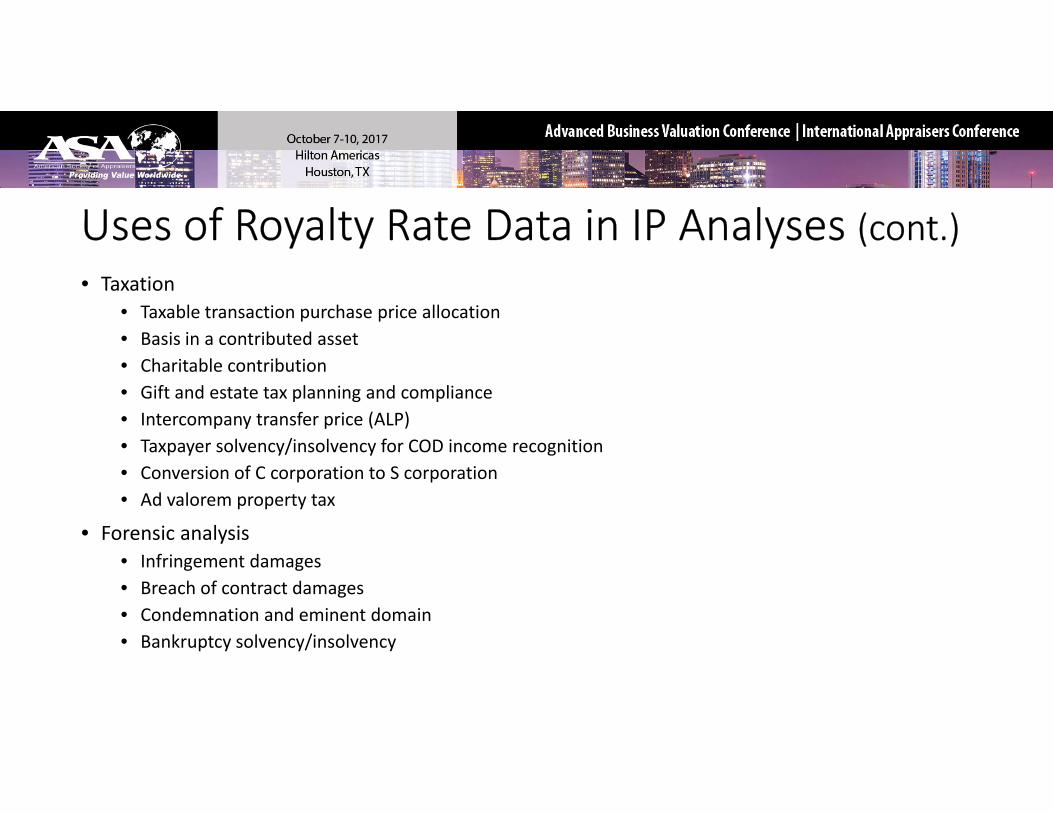
• TaxationT bl t ti h i ll ti• Taxable transaction purchase price allocation
• Basis in a contributed asset• Charitable contribution• Gift and estate tax planning and compliance• Intercompany transfer price (ALP)• Taxpayer solvency/insolvency for COD income recognition• Conversion of C corporation to S corporation• Ad valorem property taxAd valorem property tax
• Forensic analysis• Infringement damages• Breach of contract damages• Condemnation and eminent domain• Bankruptcy solvency/insolvency
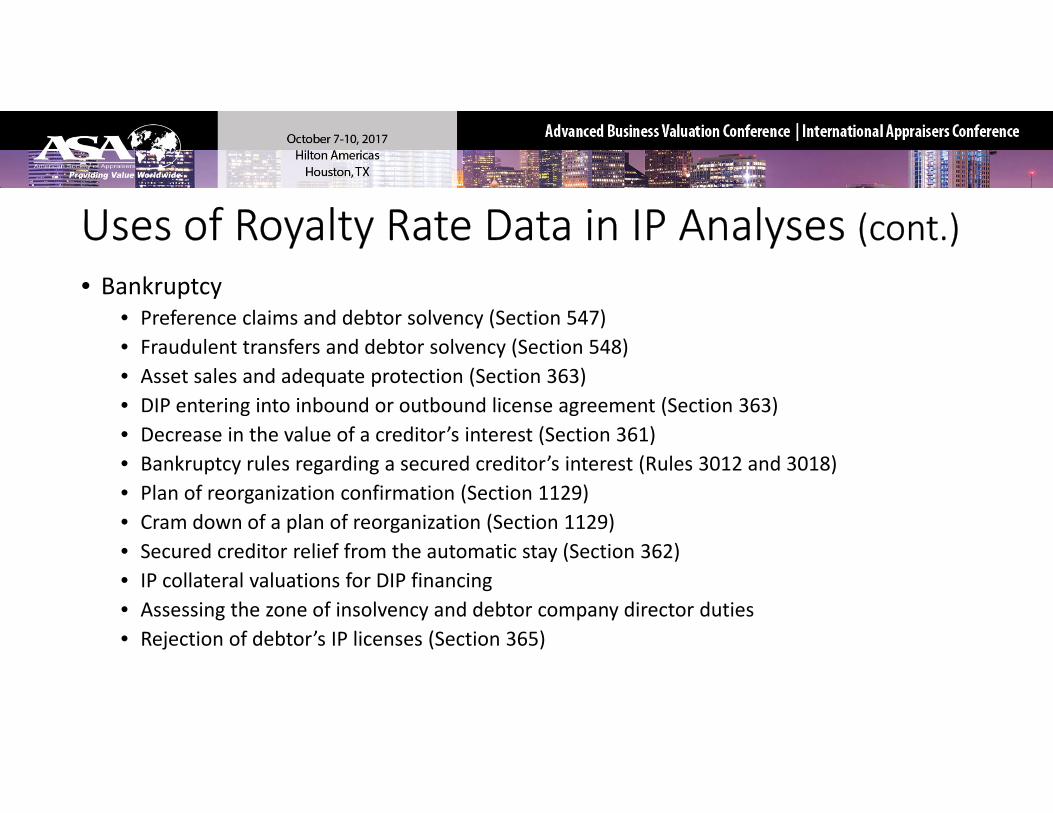
• Bankruptcy• Preference claims and debtor solvency (Section 547)• Fraudulent transfers and debtor solvency (Section 548)• Asset sales and adequate protection (Section 363)• DIP entering into inbound or outbound license agreement (Section 363)• DIP entering into inbound or outbound license agreement (Section 363)• Decrease in the value of a creditor’s interest (Section 361)• Bankruptcy rules regarding a secured creditor’s interest (Rules 3012 and 3018)• Plan of reorganization confirmation (Section 1129)• Cram down of a plan of reorganization (Section 1129)• Secured creditor relief from the automatic stay (Section 362)• IP collateral valuations for DIP financingA i th f i l d d bt di t d ti• Assessing the zone of insolvency and debtor company director duties
• Rejection of debtor’s IP licenses (Section 365)
• Market approach methodsR li f f lt th d• Relief from royalty method
• Comparable uncontrolled transactions method• Comparable profit margin method
• Cost approach methodspp• Replacement cost new less depreciation method• Reproduction cost new less depreciation method• Trended historical cost less depreciation method
• Income approach methods• Multiperiod excess earnings method• Capitalized excess earnings method• Incremental income method• Differential income method• Profit split method• Residual profit split method
• Valuation pricing metrics are based on either comparable or guideline• Licenses of IP• Sales of IP• Companies that use IP
V l ti bl d d• Valuation variables and procedures• Quantitative/qualitative analysis of the subject IP• Guideline license/sale/company selection criteria• Guideline license/sale/company selectionGuideline license/sale/company selection• Verification of the selected transactional data• Analysis of the selected transactional data• Selection of the appropriate pricing metrics• Selection of the pricing multiples specific to the subject IP• Application of the selected pricing multiples to the subject IP metrics
• Market approach valuation considerations• Seasoned guideline IP/development stage subject IP• Development stage guideline IP/seasoned subject IP• State of the competition in the owner/operator industry• Comparable profit margins—is the subject IP the only reason for the difference in profit margins between the owner/operator company and the selected CPM companies?
1. To estimate a defined value for a specific ownership interest in the IP2. To measure an appropriate royalty rate or license fee associated with the
third party license of the IP3. To calculate the arm’s‐length price (ALP) for the intercompany transfer of IP
between controlled foreign entities of a multinational taxpayer corporation4. To quantify the expected remaining useful life (RUL) of the ownership or
operating (or associated rate of change in the value) of the IP5. To determine the amount of lost profits or other economic damages
associated with a damages event suffered by the IP6. To opine on the fairness (or solvency, adequate consideration, excess
benefits, etc.) of an IP sale or license transaction
• The first element is a complete definition of the IP.• That definition should specify exactly what patent, copyright, trademark, or trade secret is the valuation subject.
• This definition should include the registration number and country for• This definition should include the registration number and country for the patent or for the copyright and trademark (if registered).
• This definition should describe any commercial intangible assets to be considered with the IP.
• The second element is a description of the bundle of legal rights.• Which of the following bundles should be included in the valuation?
1. Fee simple interest2. Term/reversion interest/3. Licensor/licensee interest4. Sublicensee interest5. Territory (domestic/international) interest5. Territory (domestic/international) interest6. Product line/industry interest7. Life/residual interest8 Use rights8. Use rights9. Development rights10. Commercialization/exploitation rights
The third element describes any contract or license terms in effect1. Licensor/licensee responsibility common contract terms:
• Identity of the licensor and the licensee• Term of the agreement (including any renewal options)Term of the agreement (including any renewal options)• The intellectual property legal protection requirements• Amount and responsibility for research and development expenditures• Amount and responsibility for marketing advertising or other promotional• Amount and responsibility for marketing, advertising, or other promotional expenditures
• Responsibility to obtain and maintain any licenses, permits, or other regulatory approvalsg y pp
• Milestone dates for regulatory approvals, commercialization, sales levels, etc.

2. Other common IP contract terms:• Minimum use, production, or sales requirements• Minimum marketing, promotion, or commercialization expense requirements• Research and development technology development payments, development completion payments
• Party responsible to obtain the required regulatory approvals• Milestone license payments• Rights to any future developments• Rights to sublicense
• The fourth element is the standard (or definition) of value the analyst is asked to conclude:
• Fair value• Fair market value• Use value• User value• Owner value• Investment value• Acquisition value• Collateral value
• The fifth element is the premise of value that the analyst should apply:
• value in continued use• value in place (but not in use)• value in exchange—orderly disposition basis• value in exchange—voluntary liquidation basis• value in exchange—involuntary liquidation basisg y q

• The purpose of the valuation considers the following questions:1. What will the IP valuation be used for?2. Who will rely on (or receive a copy of) the valuation?3. What form and format of IP valuation report is required?4. Are there any legal instructions (e.g., specific statutory definitions, judicial
precedent, or reporting requirements) that the analyst should consider?
• The analyst typically gathers and analyzes information related to the current IP owner/operator
• Such information typically includes the following:• Owner/operator historical and prospective financial statementsOwner/operator historical and prospective financial statements• Owner/operator historical and prospective development/maintenance costs• Owner/operator current and expected resource/capacity constraints
• Description and estimate of the IP economic benefits to the current owner/operator
• Associated revenue increase (e.g., related product unit price/volume, market size/position)
• Associated expense decrease (e.g., expense related to product returns, COGS, SGA, R&D)
• Associated investment decrease (e.g., inventory, capital expenditures)• Associated risk decrease (existence of IP licensees/contracts, decrease of cost of capital components)
• Assessment of IP impact on owner/operator strategic position: SWOT –strengths weaknesses opportunities and threatsstrengths, weaknesses, opportunities, and threats
• The analyst may consider the IP market potential outside of the current owner/operator
• The analyst may consider the following factors:• Change in the market definition or the market size for an alternativeChange in the market definition or the market size for an alternative owner/user
• Change in alternative/competitive uses to an alternative owner/user• The IP ability to create inbound/outbound license opportunities to anThe IP ability to create inbound/outbound license opportunities to an alternative owner/user
• Whether the current owner can (1) operate the IP and also (2) outbound license the IP (in different products, different markets, different territories, etc.)
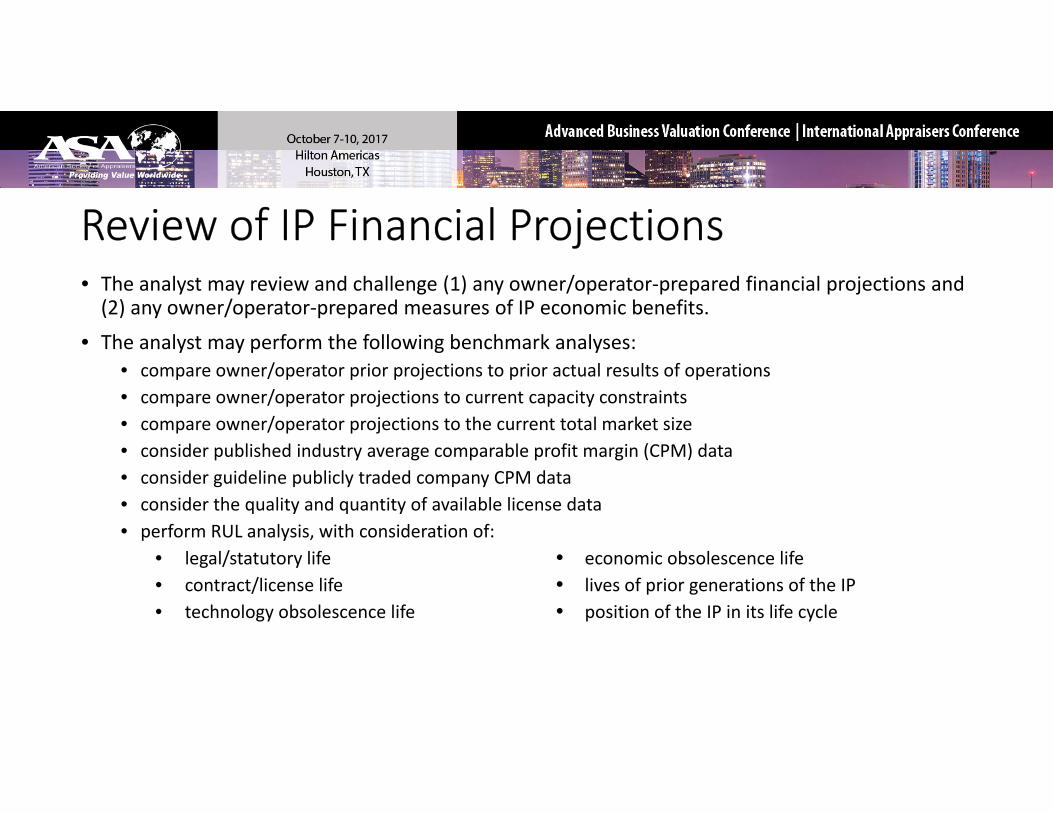
• The analyst may review and challenge (1) any owner/operator‐prepared financial projections and (2) any owner/operator prepared measures of IP economic benefits(2) any owner/operator‐prepared measures of IP economic benefits.
• The analyst may perform the following benchmark analyses:• compare owner/operator prior projections to prior actual results of operations• compare owner/operator projections to current capacity constraints• compare owner/operator projections to the current total market size• consider published industry average comparable profit margin (CPM) data• consider guideline publicly traded company CPM data• consider the quality and quantity of available license data• consider the quality and quantity of available license data• perform RUL analysis, with consideration of:
• legal/statutory life economic obsolescence life• contract/license life lives of prior generations of the IP• technology obsolescence life position of the IP in its life cycle
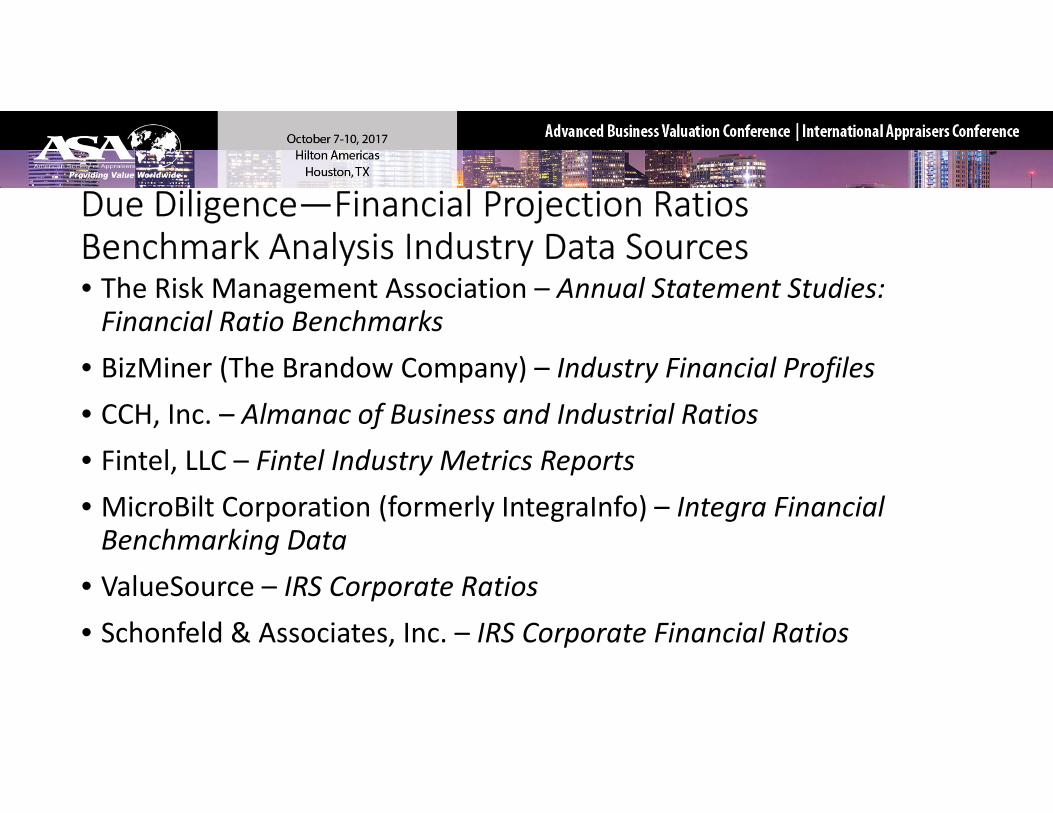
• The Risk Management Association – Annual Statement Studies: Financial Ratio Benchmarks
• BizMiner (The Brandow Company) – Industry Financial ProfilesCCH I Al f B i d I d t i l R ti• CCH, Inc. – Almanac of Business and Industrial Ratios
• Fintel, LLC – Fintel Industry Metrics Reports• MicroBilt Corporation (formerly IntegraInfo) Integra Financial• MicroBilt Corporation (formerly IntegraInfo) – Integra Financial Benchmarking Data
• ValueSource – IRS Corporate Ratios• Schonfeld & Associates, Inc. – IRS Corporate Financial Ratios
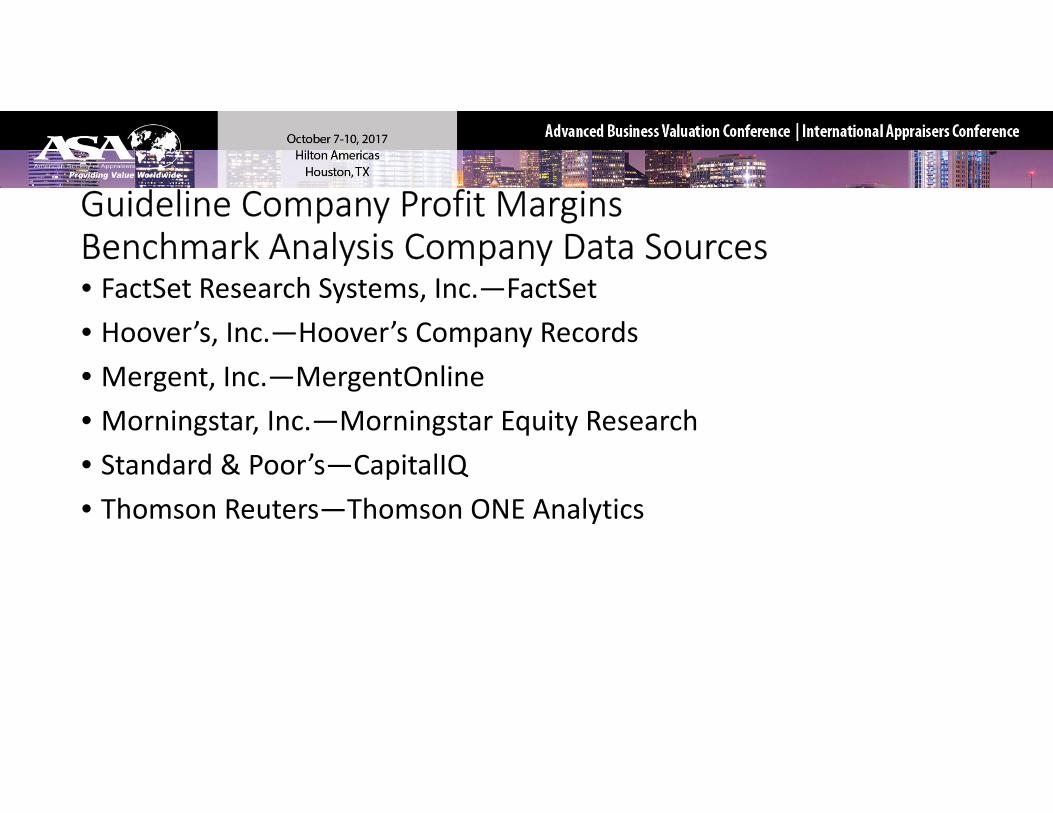
• FactSet Research Systems, Inc.—FactSet• Hoover’s, Inc.—Hoover’s Company Records• Mergent, Inc.—MergentOnline• Morningstar, Inc.—Morningstar Equity Research• Standard & Poor’s—CapitalIQ• Thomson Reuters Thomson ONE Analytics• Thomson Reuters—Thomson ONE Analytics
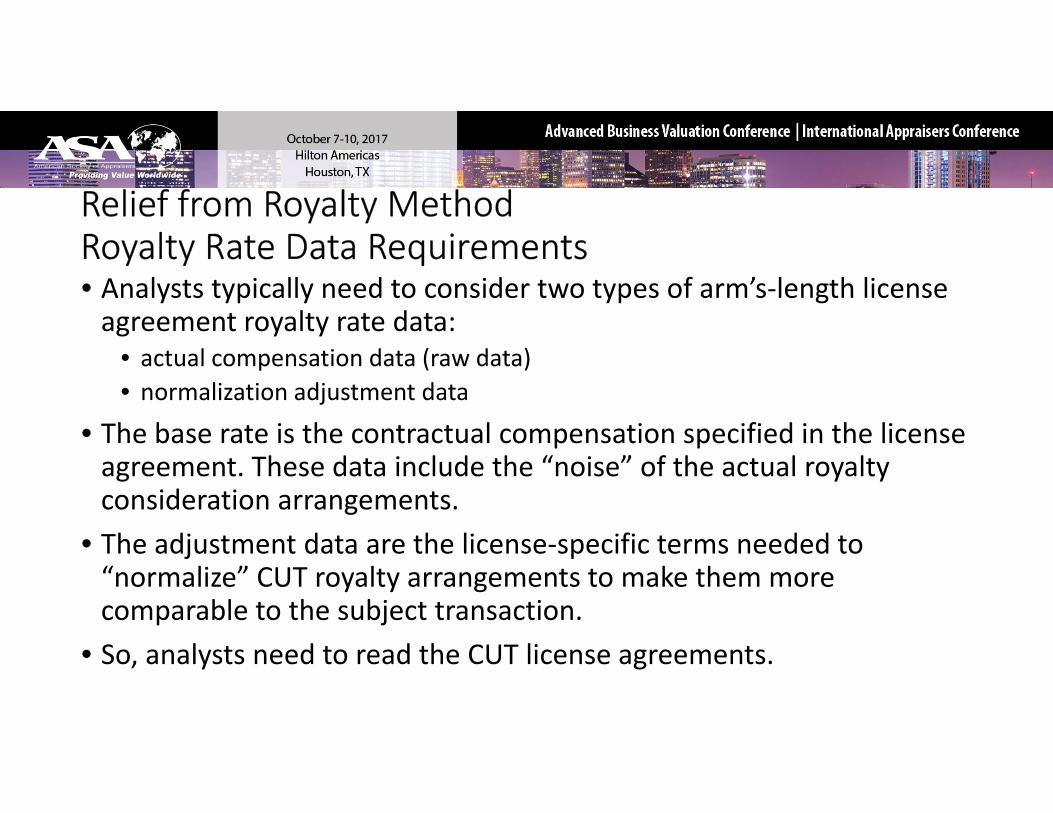
• Analysts typically need to consider two types of arm’s‐length license agreement royalty rate data:
• actual compensation data (raw data)• normalization adjustment data
• The base rate is the contractual compensation specified in the license agreement. These data include the “noise” of the actual royalty consideration arrangementsconsideration arrangements.
• The adjustment data are the license‐specific terms needed to “normalize” CUT royalty arrangements to make them more
bl t th bj t t ticomparable to the subject transaction.• So, analysts need to read the CUT license agreements.
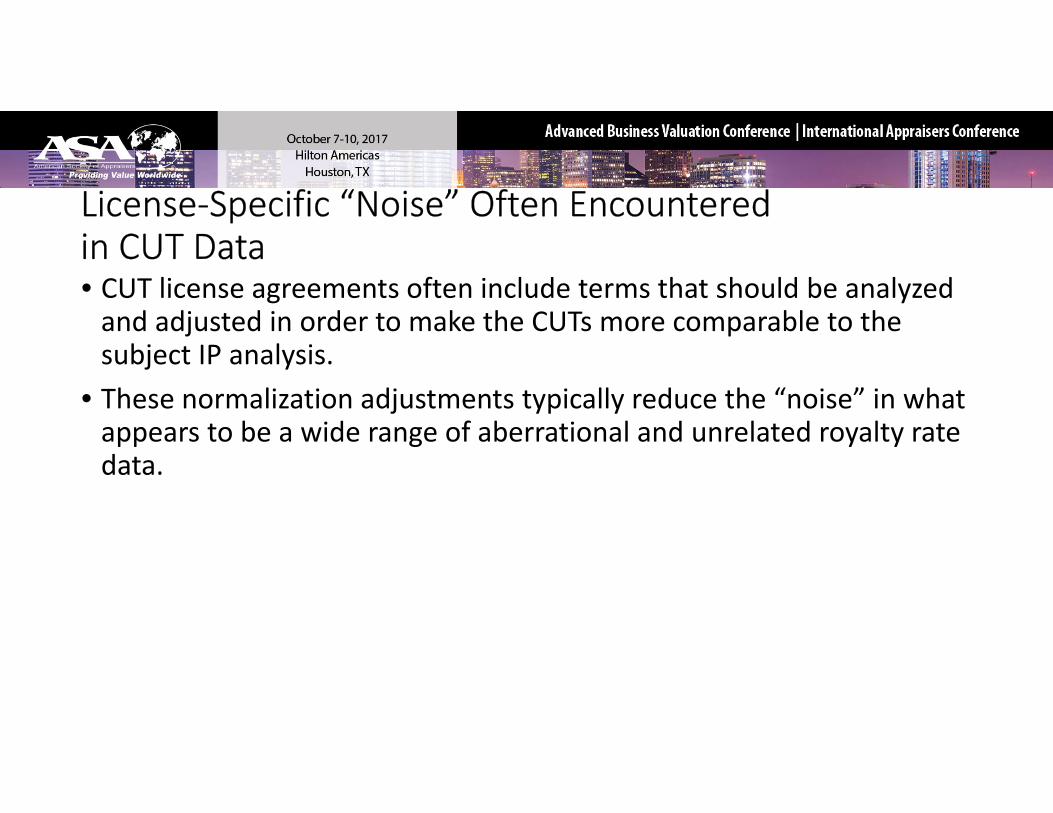
• CUT license agreements often include terms that should be analyzed and adjusted in order to make the CUTs more comparable to the subject IP analysis.
• These normalization adjustments typically reduce the “noise” in whatThese normalization adjustments typically reduce the noise in what appears to be a wide range of aberrational and unrelated royalty rate data.
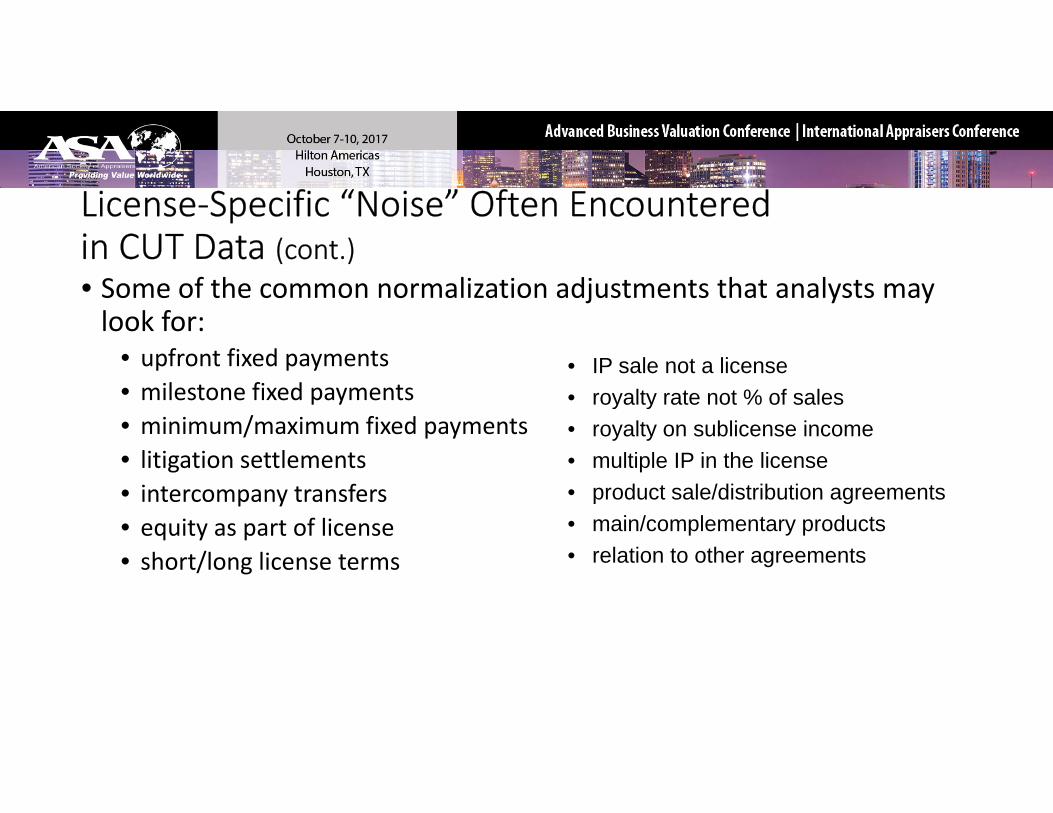
• Some of the common normalization adjustments that analysts may look for:
• upfront fixed payments• milestone fixed payments
• IP sale not a license• royalty rate not % of sales
• minimum/maximum fixed payments• litigation settlements• intercompany transfers
y y• royalty on sublicense income• multiple IP in the license• product sale/distribution agreementsp y
• equity as part of license• short/long license terms
• main/complementary products• relation to other agreements
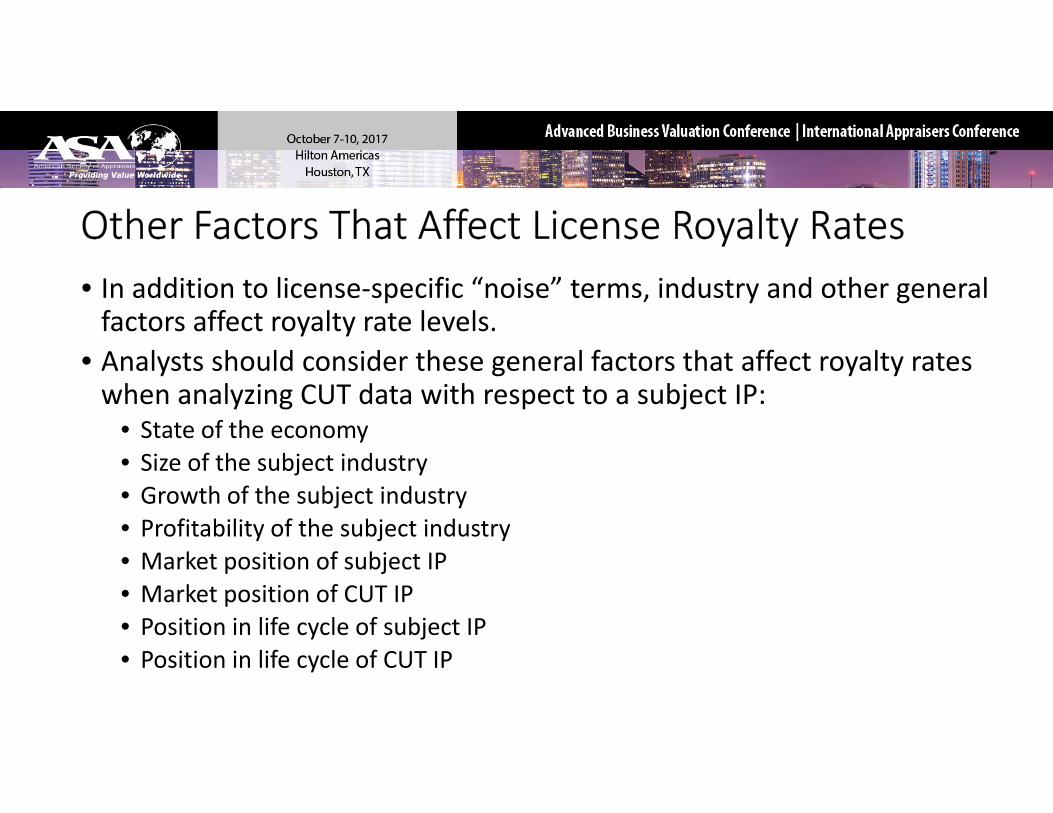
• In addition to license‐specific “noise” terms, industry and other general factors affect royalty rate levels.
• Analysts should consider these general factors that affect royalty rates when analyzing CUT data with respect to a subject IP:y g p j
• State of the economy• Size of the subject industry• Growth of the subject industryj y• Profitability of the subject industry• Market position of subject IP• Market position of CUT IPp• Position in life cycle of subject IP• Position in life cycle of CUT IP

• Analysts generally use one of three procedures to manage the noise of anomalous royalty rate data:
• Eliminate the anomalous observations from the selected royalty rate data• Quantitatively adjust for the impact of the normalization factors• Qualitatively access the impact of the normalization factors• In addition to these three procedures, analysts use central tendency analyses that minimize the impact of any anomalous observations:
• Median royalty rate• Trimmed mean royalty rate• Interquartile range of royalty rates
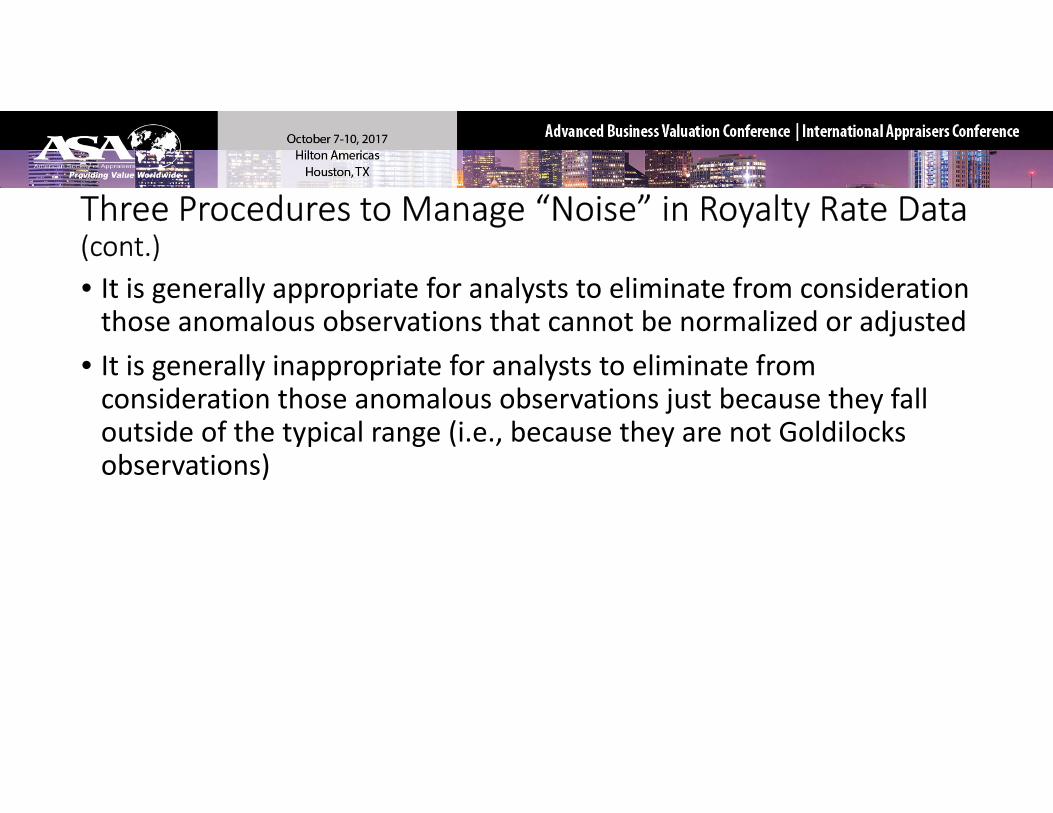
• It is generally appropriate for analysts to eliminate from consideration those anomalous observations that cannot be normalized or adjusted
• It is generally inappropriate for analysts to eliminate from consideration those anomalous observations just because they fallconsideration those anomalous observations just because they fall outside of the typical range (i.e., because they are not Goldilocks observations)
• ktMINE• RoyaltySource• RoyaltyRange• Royalty Connection• RoyaltyStat• IntangibleSpring• IntangibleSpring• Markables
• ktMINE is an interactive intellectual property database that provides direct access to license royalty rates, actual license agreements, and detailed agreement summaries. The subscription‐based database contains over 12,000 intellectual property license agreements. The intellectual property license database is updated frequently. License agreements are searchable by industry, keyword, and various other parameters. The full text of each intellectual property license agreement is available. Available at www.bvmarketdata.com.
• AUS Consultants offers a database that provides intellectual property license transaction royalty rates. The database can be searched by industry, technology, and/or keyword. The information provided includes the license royalty rates, name of the licensee and the licensor, a description of the intellectual property licensed (or sold, if applicable), the transaction terms, and the original sources of the information provided. Preliminary results are available online and a final report is sent to the subscriber via email. A subscription is not necessary. Analysts can pay per search. Available at www.royaltysource.com.
• RoyaltyRange database consists of manually gathered and analyzed data. The reports contain more than 50 detailed standardized comparability factors on royalty rates and license terms. Each report is supplemented with original unredacted agreements, as well as filings and other types of documents the data are gathered from. The database focuses on European transactions, but also contains some U.S. transactions. The database excludes agreements between related parties, agreements with undisclosed remuneration mechanisms, royalty‐free agreements, agreements where royalties are expressed in other forms than percentage, agreements with individuals, universities, and other noncommercial entities. It is available at www.royaltyrange.com
• Royalty ConnectionTM provides online access to intellectual property license royalty rate and other license information on all types of technology, patents, trade secrets, and know‐how. The data are aggregated from arm’s‐length sale/license transactions, litigation settlements, and court‐awarded royalty order from 1990 to the present. The intellectual property license database is frequently updated. Users can search by industry, product category, or keyword. The information provided includes the consideration paid for the intellectual property license and any restrictions (such as geographic or exclusivity). Available at www.royaltyconnection.com.
• RoyaltyStat is a subscription‐based database of intellectual property license royalty rates and license agreements, compiled from Securities and Exchange Commission documents. It is searchable by SIC code or by full text. The results can be viewed online or achieved. The intellectual property transaction database is updated daily. The full text of each intellectual property license agreement in the database is available. Available at www.royaltystat.com.
• IntangibleSpring is a subscription‐based database of royalty rates sourced from license agreements filed with the SEC. Using a combination of text mining, natural language processing, and manual review, this database identifies and extracts complete license agreements from filings with the SEC. This database excludes agreements with incomplete pricing data. Available from www.intangiblespring.com.
• This database is different from the other databases discussed. Rather than drawing royalty rates from actual transactions of intellectual property, Markables gathers its data from purchase price allocations published in SEC filings. It has over 9,000 trademark valuations published in the financial reports of publicly traded companies from all over the world. Each record contains trademark value, revenues, reported or implied trademark royalty rates, customer value, enterprise value, trademark profit split, and other data, and a detailed description of the business as of the date of the valuation. Available at www.markables.net.

• IP license databases are searchable by industry (SIC or other classifications).
• In most cases, the license agreements are searchable by keyword.• Databases may be searched for a particular timeframe• Databases may be searched for a particular timeframe.• Results may be filtered by territory (worldwide or specific countries).• Results may be filtered by exclusive vs. nonexclusive licenses.Results may be filtered by exclusive vs. nonexclusive licenses.• In most cases, the actual license agreements may be downloaded from the databases (or accessed via links).
• There are usually a lot of duplicates in these databases.• Often, there are multiple updates of the same license agreement (another type of duplication).
• Some “license agreements” are actually purchase agreementsSome license agreements are actually purchase agreements.• Some license agreements are between related parties (not at arm’s length).• Often, a license agreement involves several different intellectual properties ( d k d ) k d ff l h l f(e.g., trademark and patent), making it difficult to get at the royalty rate for just the trademark, for example.
• The consideration in the license agreements is often on an unusable basis (e.g., per 1,000 barrels of beer rather than as a percent of net sales).

• The analyst’s assignment objective is to estimate the fair market value of a pharmaceutical industry patent and related know‐how owned and operated by Alpha Company (“Alpha”).
• The analyst’s assignment purpose is to assist management in its taxThe analyst s assignment purpose is to assist management in its tax planning and compliance related to the Alpha conversion from C corporation status to S corporation status as of January 1, 2018.
• The analyst decided to use the market approach and the relief from• The analyst decided to use the market approach and the relief from royalty method to value this commercialized patent.
• The subject patent relates to a molecular compound. Alpha developed the biochemical compound to cure the debilitating disease called antisocial personality disorder (“APD”). Victims of APD are socially awkward and generally unpopular.
• The patented compound is called Suave. The prescription drug product that uses this compound is called Debonair.
• Alpha has been producing and selling Debonair in the United States• Alpha has been producing and selling Debonair in the United States for a number of years.
• SIC code 2834, pharmaceuticals industry• Technology intangibles and manufacturing/process intangibles• Either the licensor or the licensee is a U.S. company• No territory restrictions• No restrictions on the type of the agreement• No restrictions on the license start date or stop date• No restrictions on the license start date or stop date
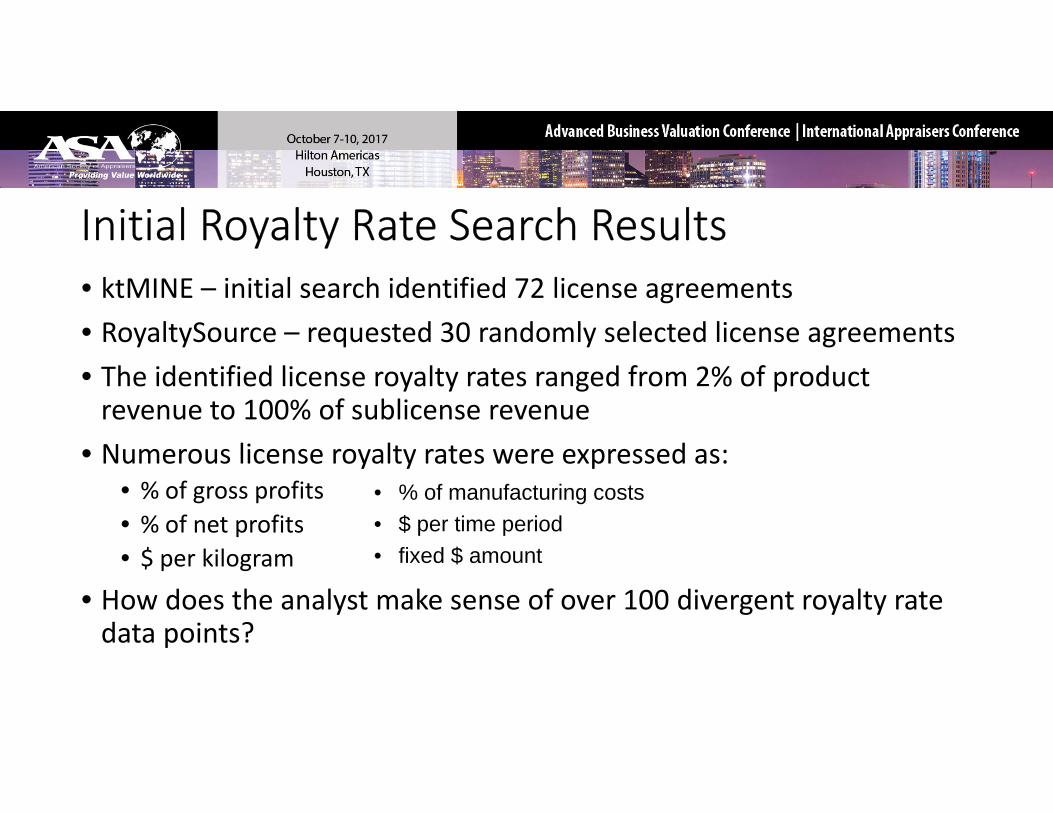
• ktMINE – initial search identified 72 license agreements• RoyaltySource – requested 30 randomly selected license agreements• The identified license royalty rates ranged from 2% of product revenue to 100% of sublicense revenuerevenue to 100% of sublicense revenue
• Numerous license royalty rates were expressed as:• % of gross profits • % of manufacturing costs• % of net profits• $ per kilogram
• How does the analyst make sense of over 100 divergent royalty rate
• $ per time period• fixed $ amount
How does the analyst make sense of over 100 divergent royalty rate data points?
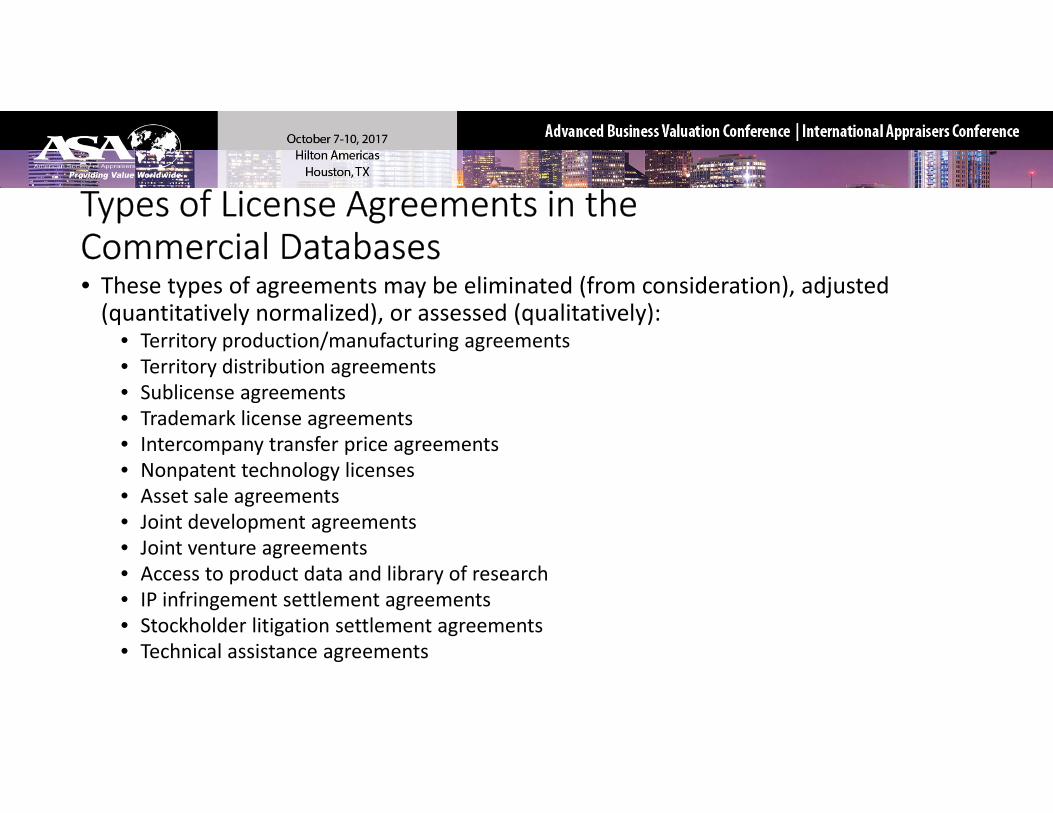
• These types of agreements may be eliminated (from consideration), adjusted ( tit ti l li d) d ( lit ti l )(quantitatively normalized), or assessed (qualitatively):
• Territory production/manufacturing agreements• Territory distribution agreements• Sublicense agreements• Trademark license agreements• Intercompany transfer price agreements• Nonpatent technology licenses• Asset sale agreementsg• Joint development agreements• Joint venture agreements• Access to product data and library of research• IP infringement settlement agreementsIP infringement settlement agreements• Stockholder litigation settlement agreements• Technical assistance agreements

• These products may be eliminated (from consideration), adjusted (quantitatively normalized), or assessed (qualitatively) :
• Generic drugs• Cosmetic products• Nonhuman drugs• Medical and surgical devices• Radiation delivery systemsy y• Over‐the‐counter products• Dietary supplement products• Nonprescription skin care productsp p p• Multiple pharmaceutical products (product portfolios)• Multiple patents and know‐how (IP portfolios)
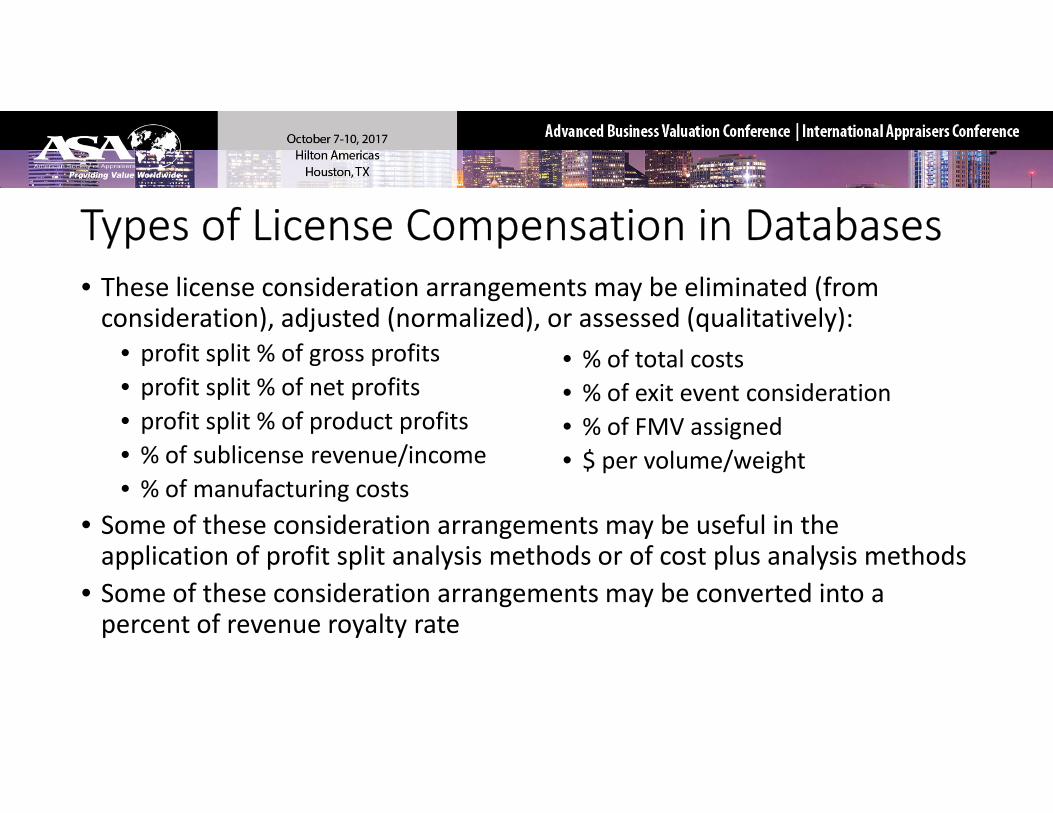
• These license consideration arrangements may be eliminated (from d ) d d ( l d) d ( l l )consideration), adjusted (normalized), or assessed (qualitatively):
• profit split % of gross profits• profit split % of net profits
• % of total costs• % of exit event consideration
• profit split % of product profits• % of sublicense revenue/income• % of manufacturing costs
• % of FMV assigned• $ per volume/weight
• Some of these consideration arrangements may be useful in the application of profit split analysis methods or of cost plus analysis methods
• Some of these consideration arrangements may be converted into a g ypercent of revenue royalty rate
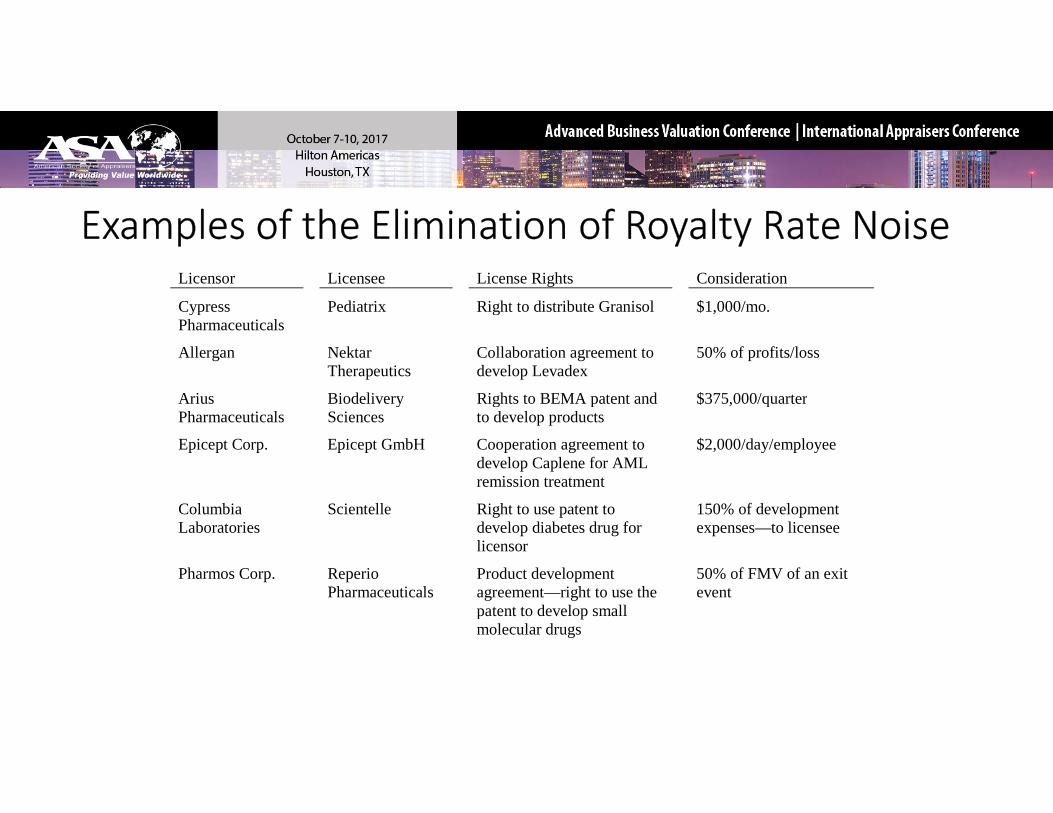
Licensor Licensee License Rights Consideration
Cypress Pediatrix Right to distribute Granisol $1 000/moCypress Pharmaceuticals
Pediatrix Right to distribute Granisol $1,000/mo.
Allergan Nektar Therapeutics
Collaboration agreement to develop Levadex
50% of profits/loss
Arius Biodelivery Rights to BEMA patent and $375,000/quarter Pharmaceuticals
ySciences
g pto develop products
q
Epicept Corp. Epicept GmbH Cooperation agreement to develop Caplene for AML remission treatment
$2,000/day/employee
C l bi S i t ll Ri ht t t t t 150% f d l tColumbia Laboratories
Scientelle Right to use patent to develop diabetes drug for licensor
150% of development expenses—to licensee
Pharmos Corp. Reperio Pharmaceuticals
Product development agreement—right to use the
50% of FMV of an exit event
patent to develop small molecular drugs
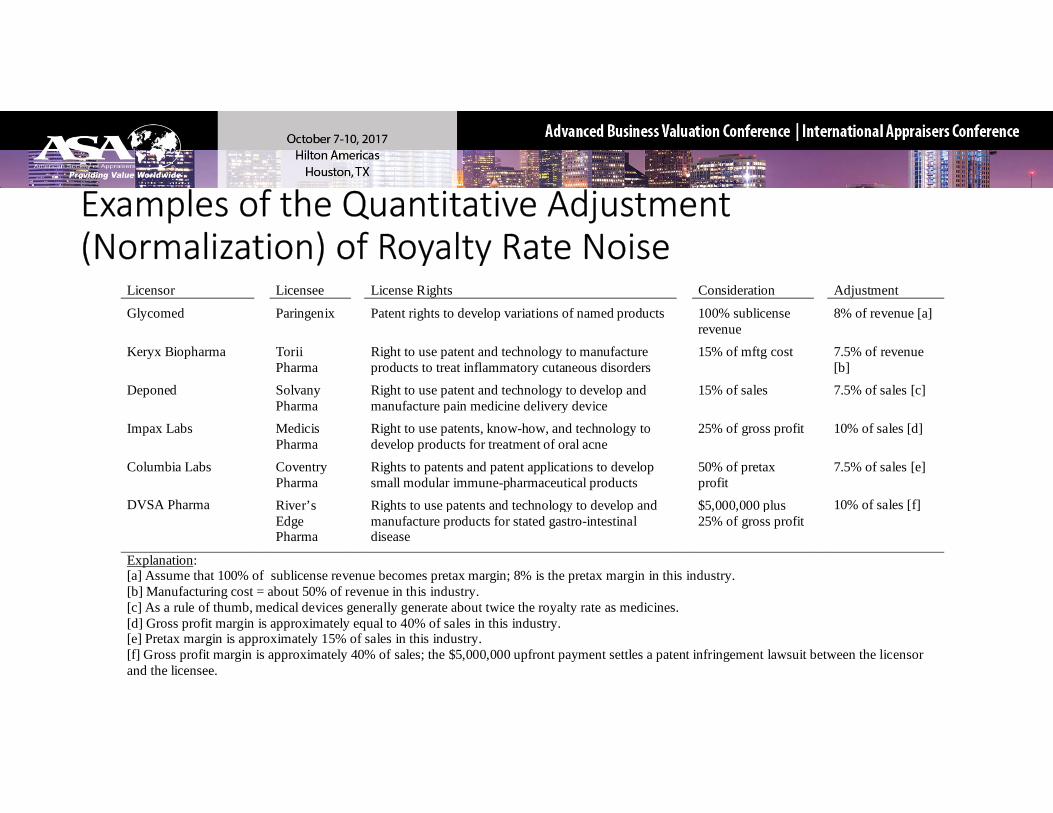
Licensor Licensee License Rights Consideration Adjustment
l d i i i h d l i i f d d bli fGlycomed Paringenix Patent rights to develop variations of named products 100% sublicense revenue
8% of revenue [a]
Keryx Biopharma Torii Pharma
Right to use patent and technology to manufacture products to treat inflammatory cutaneous disorders
15% of mftg cost 7.5% of revenue [b]
Deponed Solvany Pharma
Right to use patent and technology to develop and manufacture pain medicine delivery device
15% of sales 7.5% of sales [c] Pharma manufacture pain medicine delivery device
Impax Labs Medicis Pharma
Right to use patents, know-how, and technology to develop products for treatment of oral acne
25% of gross profit 10% of sales [d]
Columbia Labs Coventry Pharma
Rights to patents and patent applications to develop small modular immune-pharmaceutical products
50% of pretax profit
7.5% of sales [e]
DVSA Pharma River’s Rights to use patents and technology to develop and $5 000 000 plus 10% of sales [f]DVSA Pharma River s Edge Pharma
Rights to use patents and technology to develop and manufacture products for stated gastro-intestinal disease
$5,000,000 plus 25% of gross profit
10% of sales [f]
Explanation: [a] Assume that 100% of sublicense revenue becomes pretax margin; 8% is the pretax margin in this industry. [b] Manufacturing cost = about 50% of revenue in this industry. [ ] A l f th b di l d i ll t b t t i th lt t di i[c] As a rule of thumb, medical devices generally generate about twice the royalty rate as medicines. [d] Gross profit margin is approximately equal to 40% of sales in this industry. [e] Pretax margin is approximately 15% of sales in this industry. [f] Gross profit margin is approximately 40% of sales; the $5,000,000 upfront payment settles a patent infringement lawsuit between the licensor and the licensee.
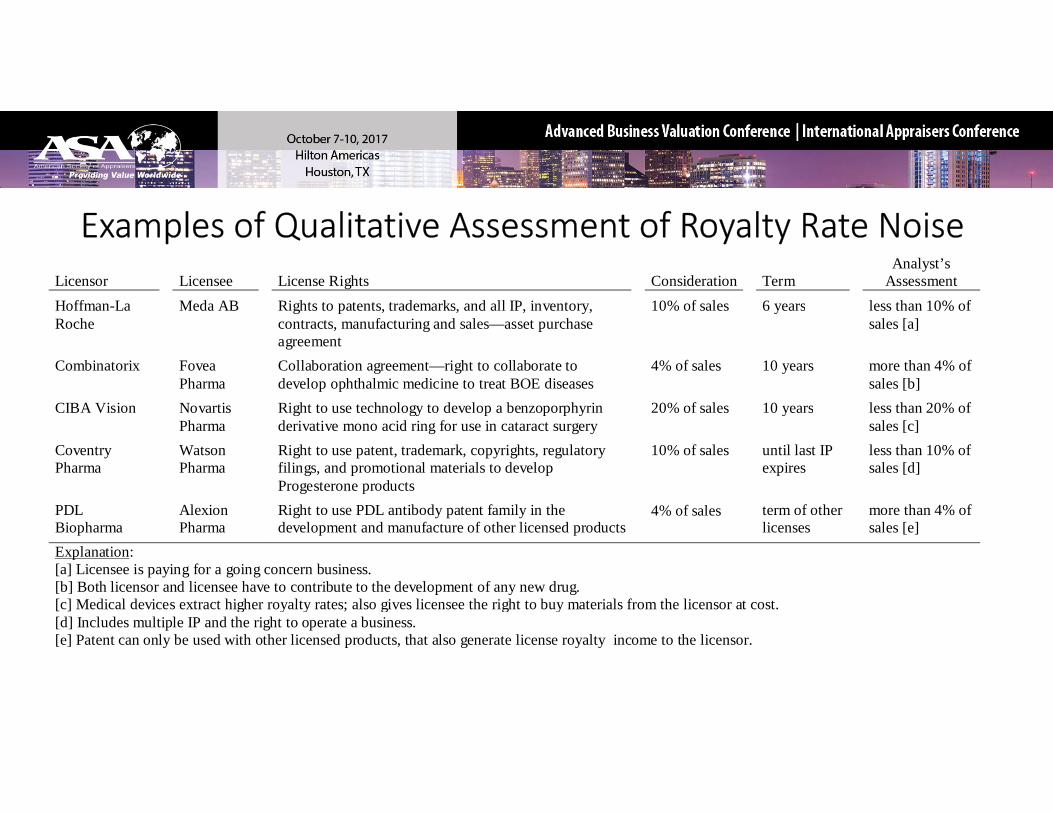
Licensor
Licensee
License Rights
Consideration
Term
Analyst’s Assessment
Hoffman-La Meda AB Rights to patents trademarks and all IP inventory 10% of sales 6 years less than 10% ofHoffman La Roche
Meda AB Rights to patents, trademarks, and all IP, inventory, contracts, manufacturing and sales—asset purchase agreement
10% of sales 6 years less than 10% of sales [a]
Combinatorix Fovea Pharma
Collaboration agreement—right to collaborate to develop ophthalmic medicine to treat BOE diseases
4% of sales 10 years more than 4% of sales [b]
CIBA Vision Novartis Right to use technology to develop a benzoporphyrin 20% of sales 10 years less than 20% ofCIBA Vision Novartis Pharma
Right to use technology to develop a benzoporphyrin derivative mono acid ring for use in cataract surgery
20% of sales 10 years less than 20% of sales [c]
Coventry Pharma
Watson Pharma
Right to use patent, trademark, copyrights, regulatory filings, and promotional materials to develop Progesterone products
10% of sales until last IP expires
less than 10% of sales [d]
PDL Al i Ri h PDL ib d f il i h 4% f l f h h 4% fPDL Biopharma
Alexion Pharma
Right to use PDL antibody patent family in the development and manufacture of other licensed products
4% of sales term of other licenses
more than 4% of sales [e]
Explanation: [a] Licensee is paying for a going concern business. [b] Both licensor and licensee have to contribute to the development of any new drug. [c] Medical devices extract higher royalty rates; also gives licensee the right to buy materials from the licensor at cost[c] Medical devices extract higher royalty rates; also gives licensee the right to buy materials from the licensor at cost. [d] Includes multiple IP and the right to operate a business. [e] Patent can only be used with other licensed products, that also generate license royalty income to the licensor.
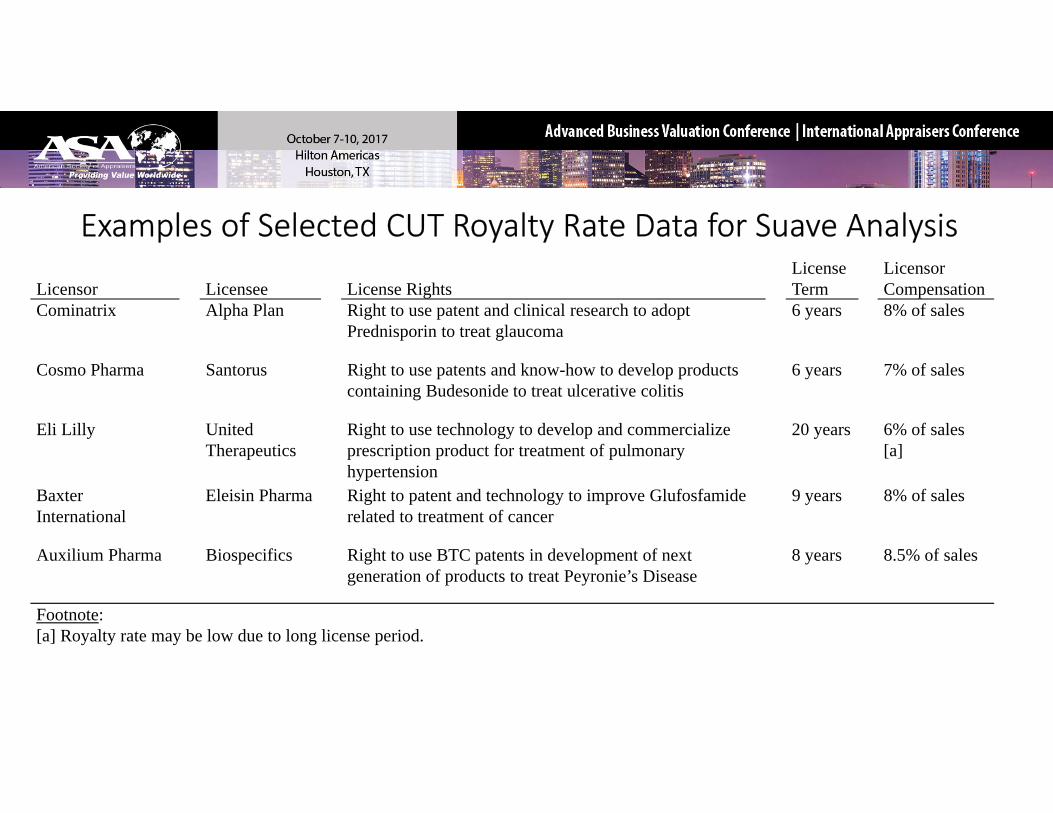
Licensor Licensee License RightsLicenseTerm
LicensorCompensation
Cominatrix Alpha Plan Right to use patent and clinical research to adopt 6 years 8% of salesCominatrix Alpha Plan Right to use patent and clinical research to adopt Prednisporin to treat glaucoma
6 years 8% of sales
Cosmo Pharma Santorus Right to use patents and know-how to develop products containing Budesonide to treat ulcerative colitis
6 years 7% of sales
Eli Lilly United Therapeutics
Right to use technology to develop and commercialize prescription product for treatment of pulmonary hypertension
20 years 6% of sales [a]
Baxter Eleisin Pharma Right to patent and technology to improve Glufosfamide 9 years 8% of salesInternational related to treatment of cancer
Auxilium Pharma Biospecifics Right to use BTC patents in development of next generation of products to treat Peyronie’s Disease
8 years 8.5% of sales
Footnote:[a] Royalty rate may be low due to long license period.
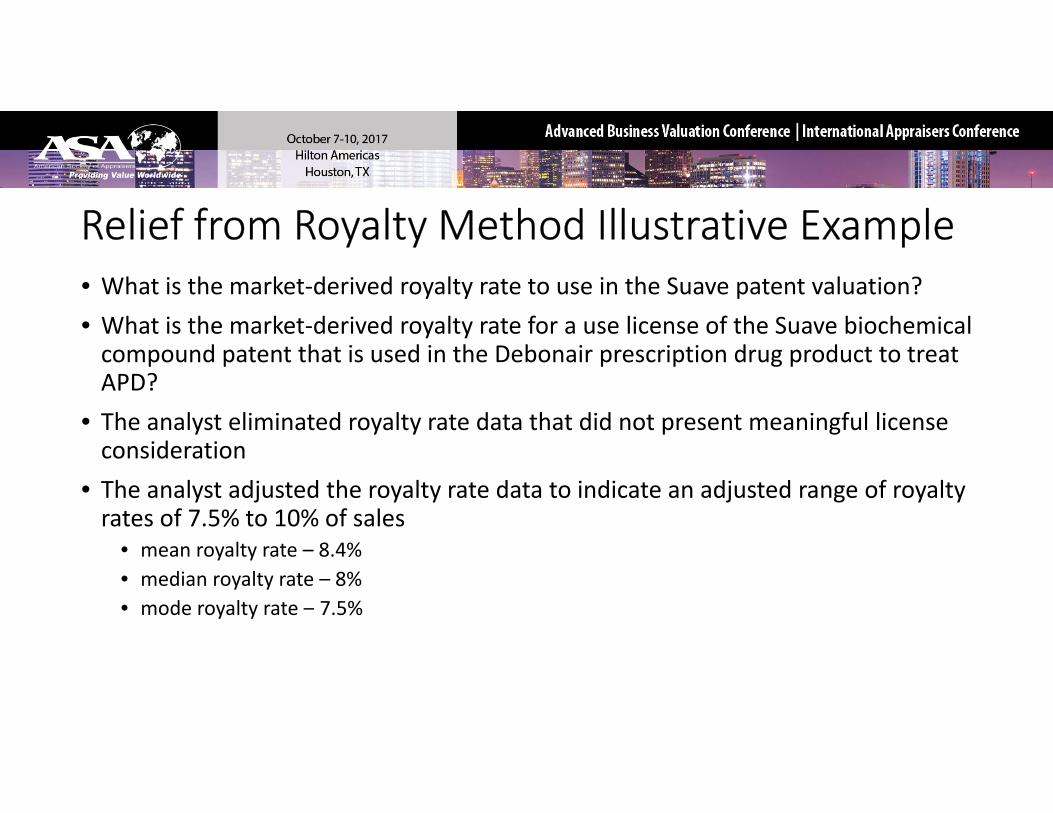
• What is the market‐derived royalty rate to use in the Suave patent valuation?• What is the market‐derived royalty rate for a use license of the Suave biochemical compound patent that is used in the Debonair prescription drug product to treat APD?
• The analyst eliminated royalty rate data that did not present meaningful license consideration
• The analyst adjusted the royalty rate data to indicate an adjusted range of royalty rates of 7.5% to 10% of sales
• mean royalty rate – 8.4%• median royalty rate – 8%
d lt t 7 5%• mode royalty rate – 7.5%
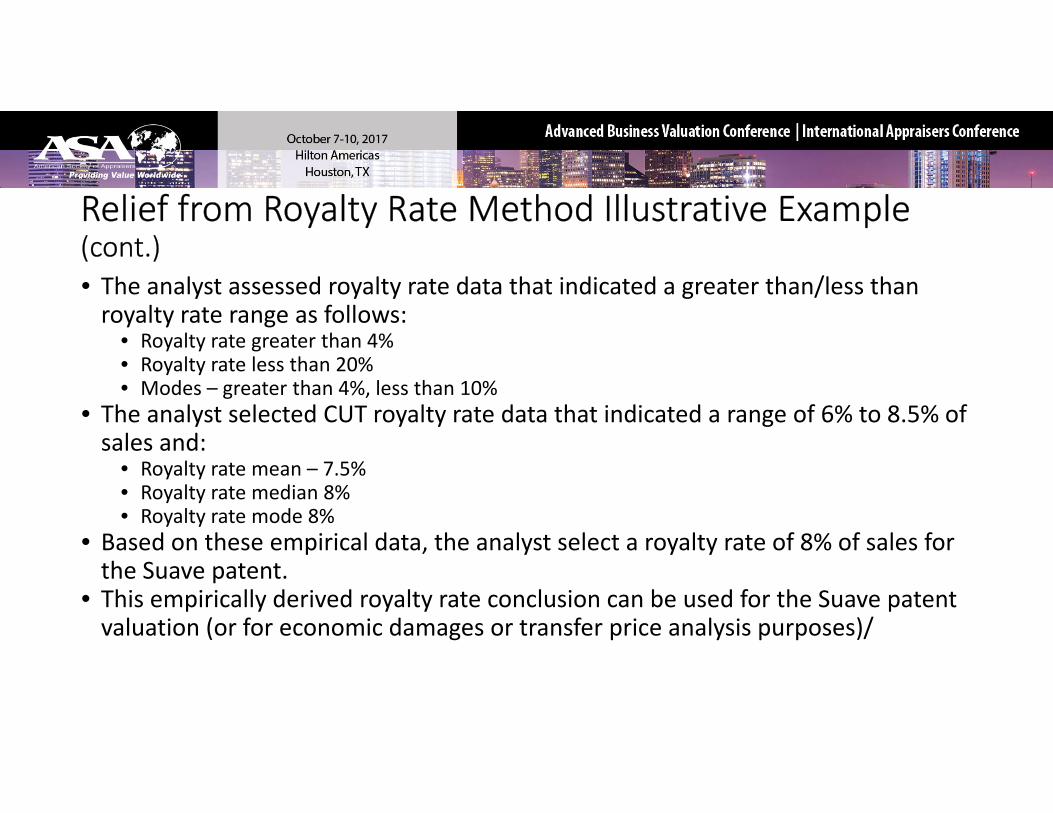
• The analyst assessed royalty rate data that indicated a greater than/less than lt t f llroyalty rate range as follows:
• Royalty rate greater than 4%• Royalty rate less than 20%• Modes – greater than 4%, less than 10%
Th l t l t d CUT lt t d t th t i di t d f 6% t 8 5% f• The analyst selected CUT royalty rate data that indicated a range of 6% to 8.5% of sales and:
• Royalty rate mean – 7.5%• Royalty rate median 8%• Royalty rate mode 8%
• Based on these empirical data, the analyst select a royalty rate of 8% of sales for the Suave patent.
• This empirically derived royalty rate conclusion can be used for the Suave patentThis empirically derived royalty rate conclusion can be used for the Suave patent valuation (or for economic damages or transfer price analysis purposes)/
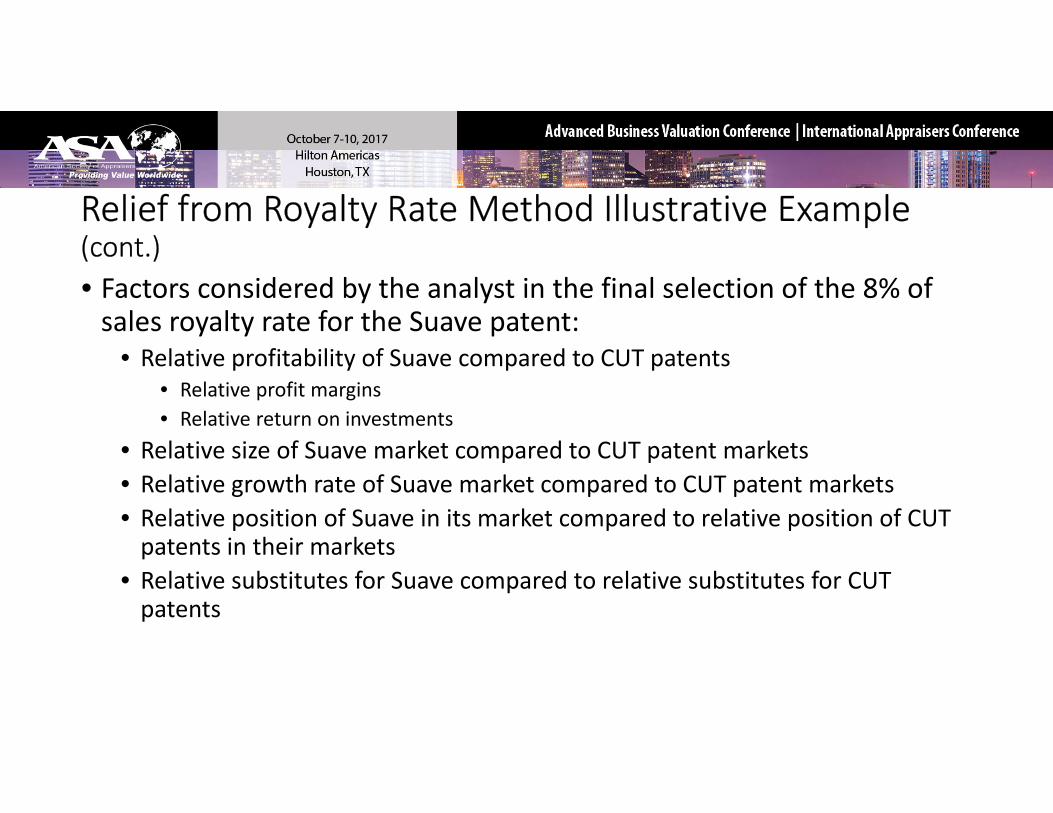
• Factors considered by the analyst in the final selection of the 8% of sales royalty rate for the Suave patent:
• Relative profitability of Suave compared to CUT patents• Relative profit margins• Relative return on investments
• Relative size of Suave market compared to CUT patent markets• Relative growth rate of Suave market compared to CUT patent markets• Relative position of Suave in its market compared to relative position of CUT patents in their markets
• Relative substitutes for Suave compared to relative substitutes for CUT t tpatents
• Relative age of Suave in its life cycle compared to relative ages of CUT patents i th i lif lin their life cycles
• Comparative analyses are ideally prepared on patent‐to‐patent basis. Alternatively, comparative analyses may have to be performed in a:
• company to company basis• company‐to‐company basis• industry‐to‐industry basis
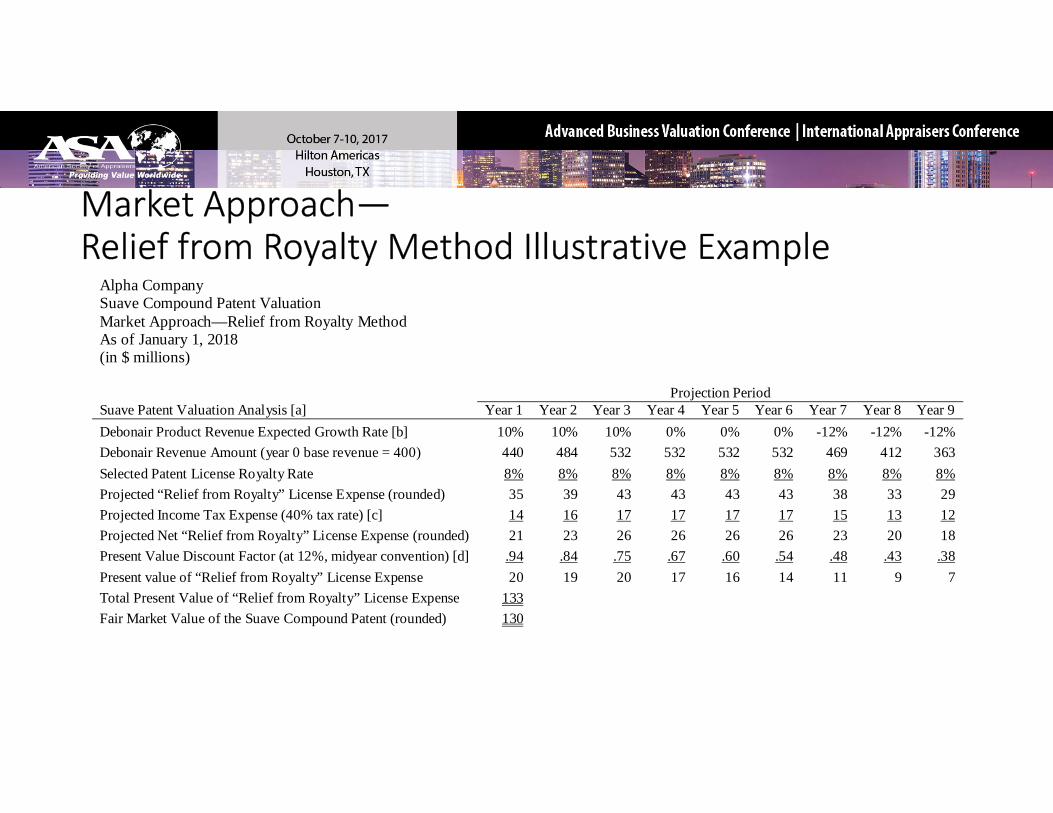
Alpha Company Suave Compound Patent Valuation Suave Co pou d ate t Va uat oMarket Approach—Relief from Royalty Method As of January 1, 2018 (in $ millions) Projection Period S P t t V l ti A l i [ ] Y 1 Y 2 Y 3 Y 4 Y 5 Y 6 Y 7 Y 8 Y 9Suave Patent Valuation Analysis [a] Year 1 Year 2 Year 3 Year 4 Year 5 Year 6 Year 7 Year 8 Year 9 Debonair Product Revenue Expected Growth Rate [b] 10% 10% 10% 0% 0% 0% -12% -12% -12% Debonair Revenue Amount (year 0 base revenue = 400) 440 484 532 532 532 532 469 412 363 Selected Patent License Royalty Rate 8% 8% 8% 8% 8% 8% 8% 8% 8% Projected “Relief from Royalty” License Expense (rounded) 35 39 43 43 43 43 38 33 29 Projected Income Tax Expense (40% tax rate) [c] 14 16 17 17 17 17 15 13 12 Projected Net “Relief from Royalty” License Expense (rounded) 21 23 26 26 26 26 23 20 18 Present Value Discount Factor (at 12%, midyear convention) [d] .94 .84 .75 .67 .60 .54 .48 .43 .38 Present value of “Relief from Royalty” License Expense 20 19 20 17 16 14 11 9 7 Total Present Value of “Relief from Royalty” License Expense 133 y y pFair Market Value of the Suave Compound Patent (rounded) 130
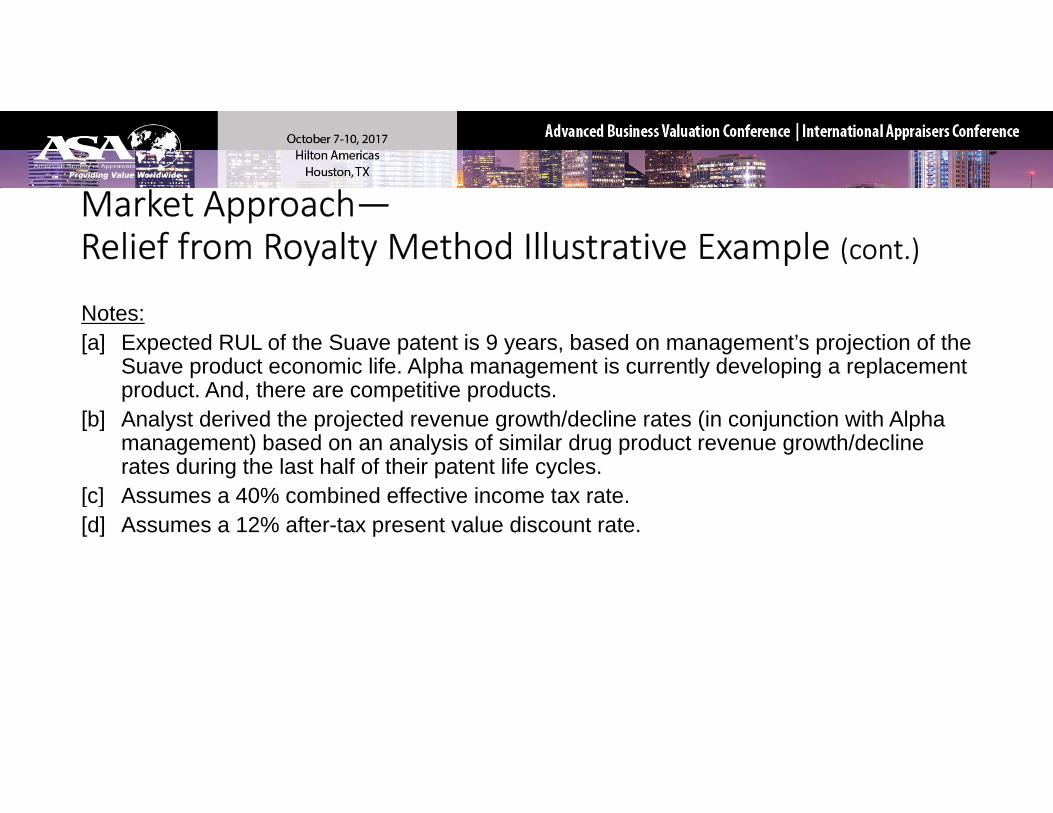
N tNotes:[a] Expected RUL of the Suave patent is 9 years, based on management’s projection of the
Suave product economic life. Alpha management is currently developing a replacement product. And, there are competitive products.
[b] Analyst derived the projected revenue growth/decline rates (in conjunction with Alpha management) based on an analysis of similar drug product revenue growth/decline rates during the last half of their patent life cycles.
[c] Assumes a 40% combined effective income tax rate.[ ][d] Assumes a 12% after-tax present value discount rate.

• Use several IP license databases, if possible• Know what IP you are analyzing, what industry you are analyzing, and what bundle of legal rights you are analyzing
• Print and read each license agreement that may provide empirical• Print and read each license agreement that may provide empirical royalty rate data
• Examine the license agreement for terms and conditions that will justify elimination, adjustment, or assessment—or reliance on the license royalty rate
• The commercial license databases include documents other than arm’s‐length license agreements:
• Asset purchase agreements• Intercompany transfer price agreements• Product sale, manufacturing, distribution agreements• Joint venture, collaboration, etc., agreements
• There are various types of license compensation formula that are not yp pparticularly useful to a royalty rate analysis
• $ per unit• $ per period$ p p• Equity as payment• % of gross profit or net profit
• Be prepared to eliminate, adjust, and assess license royalty rate data in order to extract meaningful IP pricing metrics
• Real estate appraisers regularly eliminate, adjust, and assess empirical sales data in performing real estate appraisalssales data in performing real estate appraisals
• Valuation analysts regularly eliminate, adjust, and assess guideline company pricing multiple data in performing market approach business valuationsbusiness valuations
• The procedure to eliminate, adjust, and assess empirical data should be a well‐used tool in the valuation analyst’s toolbox
• In order to encourage the reader’s acceptance, the effective IP valuation report should be:
• Clear, convincing, and cogent• Well‐organized, well‐written, and well‐presented• Free of grammar, punctuation, spelling, and mathematical errors• Procedurally and mathematically replicable, without the use of any unexplained or unsourced valuation variables
• The persuasive IP valuation report will tell a narrative story that:• Defines the valuation analyst’s assignment,• Describes the analyst’s data gathering and due diligence procedures,• Justifies the analyst’s selection of (and rejection of) the generally accepted valuation approaches, methods, and procedures,
• Explains how the analyst performed the valuation synthesis and reached the final value conclusion,
• Defends the analyst’s IP value conclusion, and• Describes all of the data sources that the analyst relied on (and includes copies of non‐public source documents)
• An effective IP valuation report will avoid these common errors:• Failure to apply the defined standard of value• Failure to apply the defined premise of value• Analytical internal inconsistencies• Arithmetic errors in the valuation analysis• Insufficient support for the selected valuation variables• Reliance on industry or other rules of thumby• Insufficient data and inadequate market research• Inadequate due diligence procedures
• There is a lot of noise in IP license database royalty rate raw data• Analysts can effectively use these empirical data to perform IP valuation, damages, and transfer price analyses
• Analysts may use the “eliminate adjust and assess” procedures to• Analysts may use the eliminate, adjust, and assess procedures to reach a reasonable range of royalty rates—and a final, supportable royalty rate conclusion
• Analysts should not use the Goldilocks procedure:• select a predetermined royalty rate that is “just right”• then eliminate, adjust, and assess the data to justify the predetermined “just right” royalty rate

• Analysts should be prepared to explain all selections, rejections, or adjustments of available license royalty rate data
• If the license market for the subject IP is efficient, then the analyst should be able to modulate the noise in the royalty rate data—and toshould be able to modulate the noise in the royalty rate data and to reach a reasonable range of royalty rates and a supportable IP valuation conclusion
• Questions and discussion• Questions and discussion
• Publicly traded company research sources:• Bloomberg ─ Bloomberg is a fully searchable online database that provides financial information on nearly all active and inactive US publicly traded companies and active and inactive international companies. Companies may be searched by industry sectors or by SIC codes Detailed financialbe searched by industry sectors or by SIC codes. Detailed financial information is available. The information is updated frequently. More information is available at www.bloomberg.com/professional/.
• MergentOnline ─MergentOnline is a fully searchable online database thatMergentOnline MergentOnline is a fully searchable online database that provides financial information on over 15,000 active and inactive US publicly traded companies and approximately 20,000 active and inactive international companies. Companies are listed by SIC codes and by North American Industry Classification System (NAICS) codes. More information is available at www.mergentonline.com.

• S&P Capital IQ ─ S&P Capital IQ contains detailed financial and textual i f ti i t l 79 000 bli l t d d i (b thinformation on approximately 79,000 publicly traded companies (both domestic and foreign). The information is derived from documents filed with the SEC and similar global securities regulators (as well as proprietary research). The database may be searched by SIC code or by S&P’s industryresearch). The database may be searched by SIC code or by S&P s industry classifications. Detailed financial information is available. The information is updated frequently. More information is available at www.capitaliq.com.
• Thompson ONE – Thompson ONE is a fully searchable database that provides financial information on approximately 52,000 public companies over 1 million private companies. Companies may be searched by GICS codes or SIC codes. Detailed financial information is available. The information is updated frequently More information is available at www thomsonreuters comfrequently. More information is available at www.thomsonreuters.com.
• Industry Financial Research Sources:• Occupational Safety & Health Administration – The US Department of Labor, Occupational Safety & Health Administration website provides SIC codes. Codes can be searched by keyword, or the SIC code “tree” can be viewed and browsedbrowsed.
• US Census Bureau – The US Census Bureau NAICS website provides a searchable database of NAICS codes. NAICS codes are amore recent classification system than SIC codes Therefore they can be better for newerclassification system than SIC codes. Therefore, they can be better for newer industries, such as some high‐tech industries.
• FirstResearch – FirstResearch is an industry research database that was d l d t id i f ti f l l It id ideveloped to provide information for sales people. It provides an overview, valuation pricing multiples, growth rates, and information on how to analyze a company in a particular industry. Information is updated quarterly. It is available at www.firstresearch.com.available at www.firstresearch.com.
• IBISWorld – IBISWorld is one of the largest independent publishers of US industry research. Research includes information on major companies in the industry, growth rates, key financial data, and outlook for the industries. The research covers approximately 700 different market segments. Some international reports are also available. Information is updated quarterly for most industries and less frequently for some. It is available at www ibisworld com and also through other database aggregatorswww.ibisworld.com and also through other database aggregators.
• S&P Industry Surveys – S&P Industry Surveys are available on approximately 50 i d t t Th t id l b l i d t i f ti ll50 industry sectors. The reports provide global industry information as well as information on the US industries. Major companies are discussed, and detailed information on the recent past and the outlook for the future are provided. A glossary of specialized terms is provided. Also, comparableprovided. A glossary of specialized terms is provided. Also, comparable financial information on major companies in the industry is provided. The information is updated twice a year. These surveys are available from various sources, including S&P NetAdvantage and Alacra.com.
• ABI/Inform – Articles from US and international general interest and trade publications may be searched. This database is available at most libraries and through database aggregators such as Alacra.com.

• Bloomberg Industries – This component of the Bloomberg database provides i d t d t i t ti h ti d itt l i f t findustry data, interactive charting, and written analysis from a team of industry experts. Contact information for each industry expert is provided so that an analyst can follow up with questions if needed. More information is available at www.bloomberg.com/professional/.available at www.bloomberg.com/professional/.
• MarketResearch.com – This database provides access to industry and market research reports from many different sources. It provides information on products, trends, regions, demographics, industries, and companies from its collection of over 700 research publishers. More information is available at www.marketresearch.com.
• S&P Capital IQ – This database provides access to analyst research as well as k t h t C it l IQ S&P i d t l ifi tisome market research reports. Capital IQ uses S&P industry classifications.
These classifications can be helpful in grouping companies in comparable industries. In addition, comparative ration information is available More information is available at www.capitaliq.com.information is available at www.capitaliq.com.
• Thomson One – This database provides access to analyst research and market research reports. More information is available at www.thomsonreuters.com.
• Westlaw – Articles from US and international general interest and trade gpublications may be searched. Westlaw also provides access to the Investext analyst research database. More information is available at www.westlaw.com.
• Almanac of Financial Ratios, CCH, Inc. – This resource is available in print and b k f t Th b k i l d 50 ti f i di te‐book formats. The book includes 50 comparative performance indicators
and covers all of North America using NAICS data. The information is calculated and derived from the latest available IRS data on nearly 5 million companies. It includes companies in nearly 200 industries. The book is issuedcompanies. It includes companies in nearly 200 industries. The book is issued annually. More information is available at www.cchgroup.com.
• Annual Statement Studies: Financial Ratio Benchmarks and eStatement Studies database, The Risk Management Association – Both the book and the online database contain financial statement ratios and common‐size balance sheet and income statement line items, arrayed by asset and sales size. Six different asset and sales size categories are presented. The book and database cover over 700 industries sorted by NAICS codes The book is issueddatabase cover over 700 industries, sorted by NAICS codes. The book is issued annually. More information is available at www.rmahq.org.
• Ibbotson Cost of Capital, Morningstar – This annual book contains five t f t f it i ht d t f it lseparate measures of cost of equity, weighted average cost of capital,
statistics on sales and profitability, capitalization, beta, equity valuation multiples, enterprise valuation multiples, financial ratios, equity returns, and capital structure. It is organized by SIC code. Quarterly updates are availablecapital structure. It is organized by SIC code. Quarterly updates are available online at ccrc.morningstar.com/
• IRS Corporate Ratios, Schonfeld & Associates, Inc. – This book includes 76 financial ratios that are based on the most recently available income statement and balance sheet data compiled by the IRS. The data focuses on the comparison of financial ratios for companies with and without net income. The contrast between profitable and unprofitable companies highlights which ratios are critical in the achievement of financial success Thehighlights which ratios are critical in the achievement of financial success. The book is issued annually. More information is available at www.saibooks.com.