integration of htgrs and seawater desalination - art … documents/year 2011/integration of... ·...
TRANSCRIPT
Document ID: TEV-1302Revision ID: 0
Effective Date: 08/17/2011
Technical Evaluation Study
Project No. 23843
Integration of HTGRs andSeawater Desalination
08/17/2011

Form 412.09 (Rev. 10)
Idaho National Laboratory
INTEGRATION OF HTGRS AND
SEAWATER DESALINATION
Identifier: Revision: Effective Date:
TEV-1302
0
08/17/2011 Page: 3 of 48
REVISION LOG
Rev. Date Affected Pages Revision Description
0 08/17/2011 All Newly issued document
Form 412.09 (Rev. 10)
Idaho National Laboratory
INTEGRATION OF HTGRS AND
SEAWATER DESALINATION
Identifier: Revision: Effective Date:
TEV-1302
0
08/17/2011 Page: 4 of 48
CONTENTS
ACRONYMS ...................................................................................................................................5
1. INTRODUCTION ...............................................................................................................7
1.1 Conventional Seawater Desalination .......................................................................7
1.1.1 Reverse Osmosis ......................................................................................8 1.1.2 Multi-Stage Flash Distillation ..................................................................9 1.1.3 Multi-Effect Distillation .........................................................................11
1.2 Conventional Seawater Desalination .....................................................................13
1.3 HTGR-Integrated Seawater Desalination ..............................................................14
2. PROCESS MODELING APPROACH AND ASSUMPTIONS .......................................15
2.1 Desalination Model – Approach and Assumptions ...............................................15
3. PROCESS MODELING RESULTS..................................................................................16
4. ECONOMIC MODELING OVERVIEW ..........................................................................19
4.1 Capital Cost Estimation .........................................................................................19
4.2 Estimation of Revenue ...........................................................................................21
4.3 Estimation of Manufacturing Costs .......................................................................23
4.4 Economic Comparison ...........................................................................................25
4.4.1 Cash Flow ...............................................................................................26 4.4.2 Internal Rate of Return ...........................................................................29
5. ECONOMIC MODELING RESULTS ..............................................................................30
6. SENSITIVITY ANALYSIS ..............................................................................................35
7. DISCUSSION ....................................................................................................................38
8. CONCLUSIONS AND RECOMMENDATIONS ............................................................39
9. REFERENCES ..................................................................................................................39
10. APPENDIXES ...................................................................................................................40
Form 412.09 (Rev. 10)
Idaho National Laboratory
INTEGRATION OF HTGRS AND
SEAWATER DESALINATION
Identifier: Revision: Effective Date:
TEV-1302
0
08/17/2011 Page: 5 of 48
ACRONYMS
AACE Association for the Advancement of Cost Engineering
ATCF after tax cash flow
BTCF before tax cash flow
CEPCI Chemical Engineering Plant Cost Index
EIA Energy Information Administration
GIF GEN-IV International Forum
HTGR high temperature gas-cooled reactor
IAEA International Atomic Energy Agency
IRR internal rate of return
MACRS modified accelerated cost recovery system
MARR minimum annual rate of return
MED multi-effect distillation
MSF multi-stage flash distillation
MW(e) megawatt (electric)
MW(t) megawatt (thermal)
NGCC natural gas combined cycle
NGNP next generation nuclear plant
NIBT net income before taxes
O&M operations and maintenance
PW present worth
RO reverse osmosis
TDS total dissolved solids
TEV technical evaluation
TCI total capital investment
USBR united states bureau of reclamation
NOMENCLATURE
Ck capital expenditures
c_months total number of months in the current modules construction period
CapF capital breakdown per month
dk depreciation
Form 412.09 (Rev. 10)
Idaho National Laboratory
INTEGRATION OF HTGRS AND
SEAWATER DESALINATION
Identifier: Revision: Effective Date:
TEV-1302
0
08/17/2011 Page: 6 of 48
Ek cash outflows
i' IRR
k year
month current month in reactor/fossil construction period
Number total number of reactor modules/fossil trains
Rk revenues
t tax rate
Tk income taxes
y exponent for current module/train
Form 412.09 (Rev. 10)
Idaho National Laboratory
INTEGRATION OF HTGRS AND
SEAWATER DESALINATION
Identifier: Revision: Effective Date:
TEV-1302
0
08/17/2011 Page: 7 of 48
1. INTRODUCTION
This technical evaluation (TEV) addresses potential integration opportunities for single or multiple high temperature gas-cooled reactor (HTGR) modules with production of electricity and purified water from seawater. The TEV has been prepared as part of a study for the Next Generation Nuclear Plant (NGNP) Project to evaluate the integration of HTGR technology with conventional chemical processes. The NGNP Project is being conducted under U.S. Department of Energy direction to meet a national strategic need identified in the Energy Policy Act of 2005 to promote reliance on safe, clean, economic nuclear energy and to establish a greenhouse-gas-free technology for the production of hydrogen. The NGNP represents an integration of high-temperature reactor technology with advanced hydrogen, electricity, and process heat production capabilities, thereby meeting the mission need identified by the U.S. Department of Energy. The strategic goal of the NGNP Project is to broaden the environmental and economic benefits of nuclear energy in the U.S. economy by demonstrating its applicability to market sectors not being served by light-water reactors.
An HTGR module produces process heat (steam or high-temperature helium), electricity, and/or hydrogen. An HTGR outlet temperature of 750°C for the primary fluid loop is assumed for this study, which reflects the initial HTGR design goals and assumes a conservative outlet temperature; temperatures of up to 950°C are anticipated for advanced HTGR designs. The output from a single HTGR module is assumed to be 600 MW(t). A 25°C approach temperature is also assumed for the heat exchanger between the primary and secondary fluid loops.
Conventional chemical processes generate process heat, electricity, and hydrogen by combusting fossil fuels (i.e., coal and natural gas), resulting in significant emissions of greenhouse gases, such as CO2 (carbon dioxide). An HTGR could produce and supply these products to conventional chemical processes without generating any greenhouse gases. The use of an HTGR to supply process heat, electricity, or hydrogen to conventional processes is referred to as an HTGR-integrated process.
1.1 Conventional Seawater Desalination
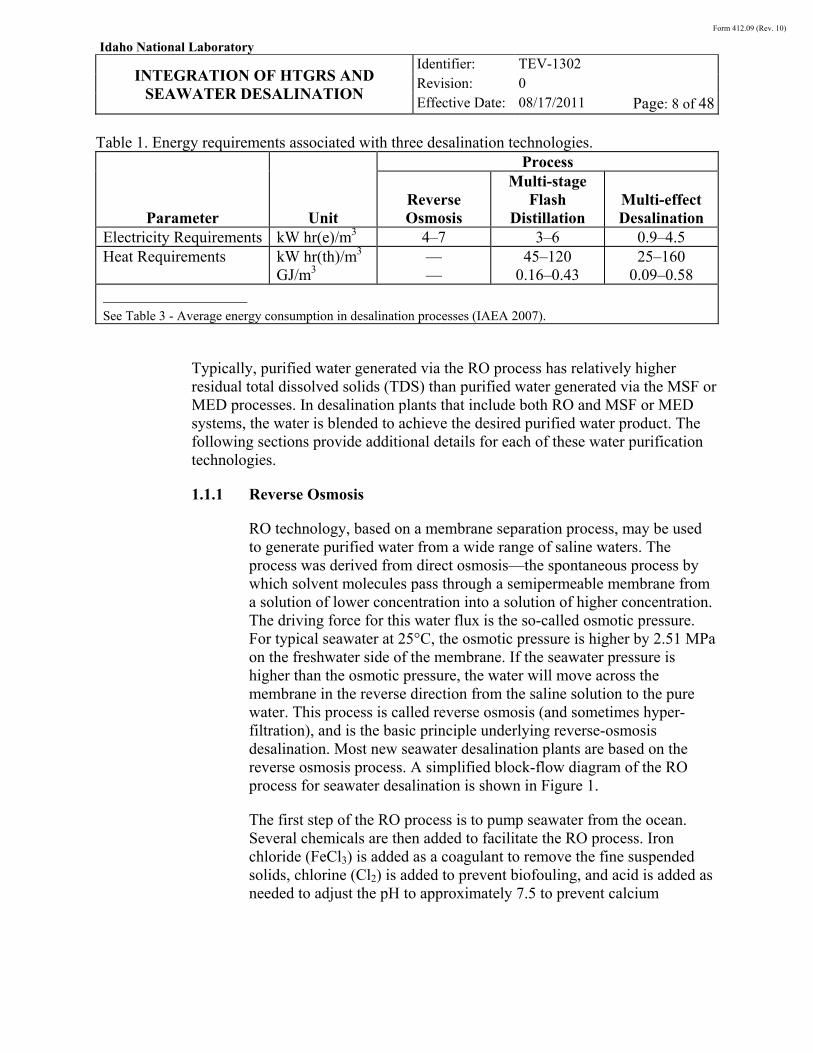
Conventional seawater desalination processes use electricity and/or steam from a conventional electric power station to produce purified water from seawater. Three approaches to seawater desalination are considered in this report: reverse osmosis (RO), multi-stage flash distillation (MSF), and multi-effect distillation (MED). While there are other desalination technologies, these three represent the vast majority of the current market share: RO ~50%, MSF ~44%, MED ~6% (Wilf 2007). The energy requirement for each of these processes is shown in Table 1 (IAEA 2007). RO requires energy only in the form of electricity. MSF and MED require both electricity and heat to desalinate seawater.
Form 412.09 (Rev. 10)
Idaho National Laboratory
INTEGRATION OF HTGRS AND
SEAWATER DESALINATION
Identifier: Revision: Effective Date:
TEV-1302
0
08/17/2011 Page: 8 of 48
Table 1. Energy requirements associated with three desalination technologies.
Parameter Unit
Process
Reverse Osmosis
Multi-stage Flash
Distillation Multi-effect Desalination
Electricity Requirements kW hr(e)/m3 4–7 3–6 0.9–4.5 Heat Requirements kW hr(th)/m3
GJ/m3 — —
45–120 0.16–0.43
25–160 0.09–0.58
See Table 3 - Average energy consumption in desalination processes (IAEA 2007).
Typically, purified water generated via the RO process has relatively higher residual total dissolved solids (TDS) than purified water generated via the MSF or MED processes. In desalination plants that include both RO and MSF or MED systems, the water is blended to achieve the desired purified water product. The following sections provide additional details for each of these water purification technologies.
1.1.1 Reverse Osmosis
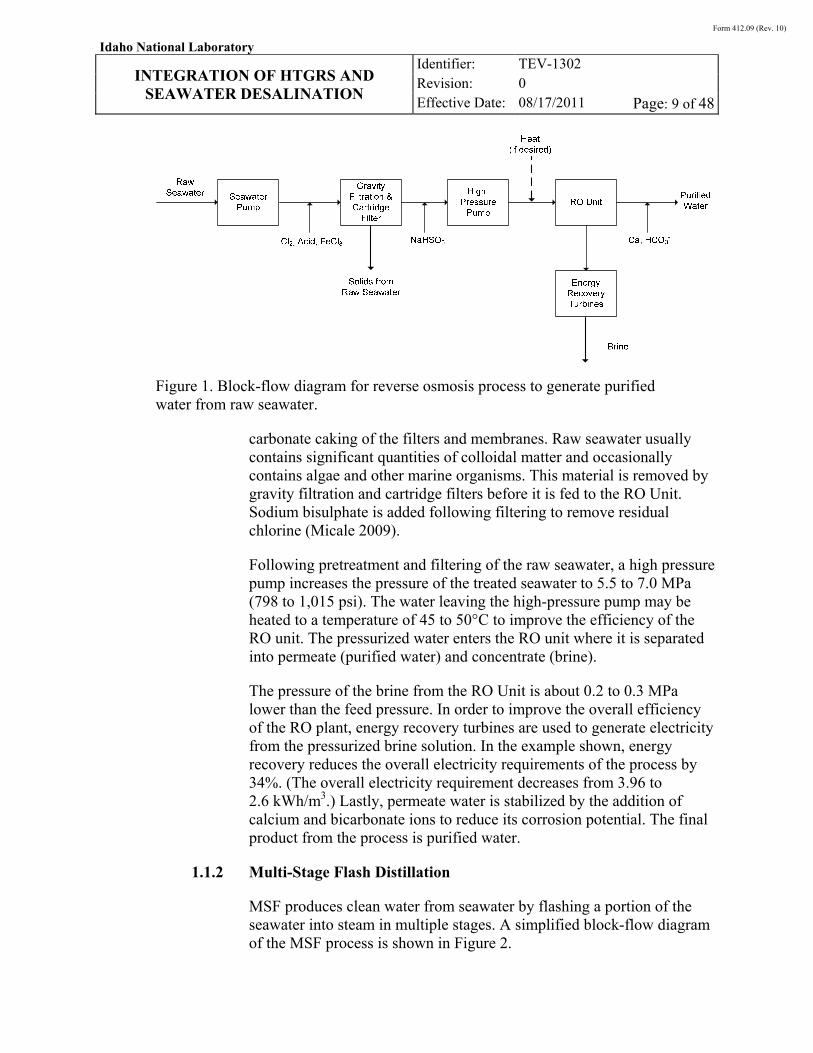
RO technology, based on a membrane separation process, may be used to generate purified water from a wide range of saline waters. The process was derived from direct osmosis—the spontaneous process by which solvent molecules pass through a semipermeable membrane from a solution of lower concentration into a solution of higher concentration. The driving force for this water flux is the so-called osmotic pressure. For typical seawater at 25°C, the osmotic pressure is higher by 2.51 MPa on the freshwater side of the membrane. If the seawater pressure is higher than the osmotic pressure, the water will move across the membrane in the reverse direction from the saline solution to the pure water. This process is called reverse osmosis (and sometimes hyper-filtration), and is the basic principle underlying reverse-osmosis desalination. Most new seawater desalination plants are based on the reverse osmosis process. A simplified block-flow diagram of the RO process for seawater desalination is shown in Figure 1.
The first step of the RO process is to pump seawater from the ocean. Several chemicals are then added to facilitate the RO process. Iron chloride (FeCl3) is added as a coagulant to remove the fine suspended solids, chlorine (Cl2) is added to prevent biofouling, and acid is added as needed to adjust the pH to approximately 7.5 to prevent calcium
Form 412.09 (Rev. 10)
Idaho National Laboratory
INTEGRATION OF HTGRS AND
SEAWATER DESALINATION
Identifier: Revision: Effective Date:
TEV-1302
0
08/17/2011 Page: 9 of 48
Figure 1. Block-flow diagram for reverse osmosis process to generate purified water from raw seawater.
carbonate caking of the filters and membranes. Raw seawater usually contains significant quantities of colloidal matter and occasionally contains algae and other marine organisms. This material is removed by gravity filtration and cartridge filters before it is fed to the RO Unit. Sodium bisulphate is added following filtering to remove residual chlorine (Micale 2009).
Following pretreatment and filtering of the raw seawater, a high pressure pump increases the pressure of the treated seawater to 5.5 to 7.0 MPa (798 to 1,015 psi). The water leaving the high-pressure pump may be heated to a temperature of 45 to 50°C to improve the efficiency of the RO unit. The pressurized water enters the RO unit where it is separated into permeate (purified water) and concentrate (brine).
The pressure of the brine from the RO Unit is about 0.2 to 0.3 MPa lower than the feed pressure. In order to improve the overall efficiency of the RO plant, energy recovery turbines are used to generate electricity from the pressurized brine solution. In the example shown, energy recovery reduces the overall electricity requirements of the process by 34%. (The overall electricity requirement decreases from 3.96 to 2.6 kWh/m3.) Lastly, permeate water is stabilized by the addition of calcium and bicarbonate ions to reduce its corrosion potential. The final product from the process is purified water.
1.1.2 Multi-Stage Flash Distillation
MSF produces clean water from seawater by flashing a portion of the seawater into steam in multiple stages. A simplified block-flow diagram of the MSF process is shown in Figure 2.
Form 412.09 (Rev. 10)
Idaho National Laboratory
INTEGRATION OF HTGRS AND
SEAWATER DESALINATION
Identifier: Revision: Effective Date:
TEV-1302
0
08/17/2011 Page: 10 of 48
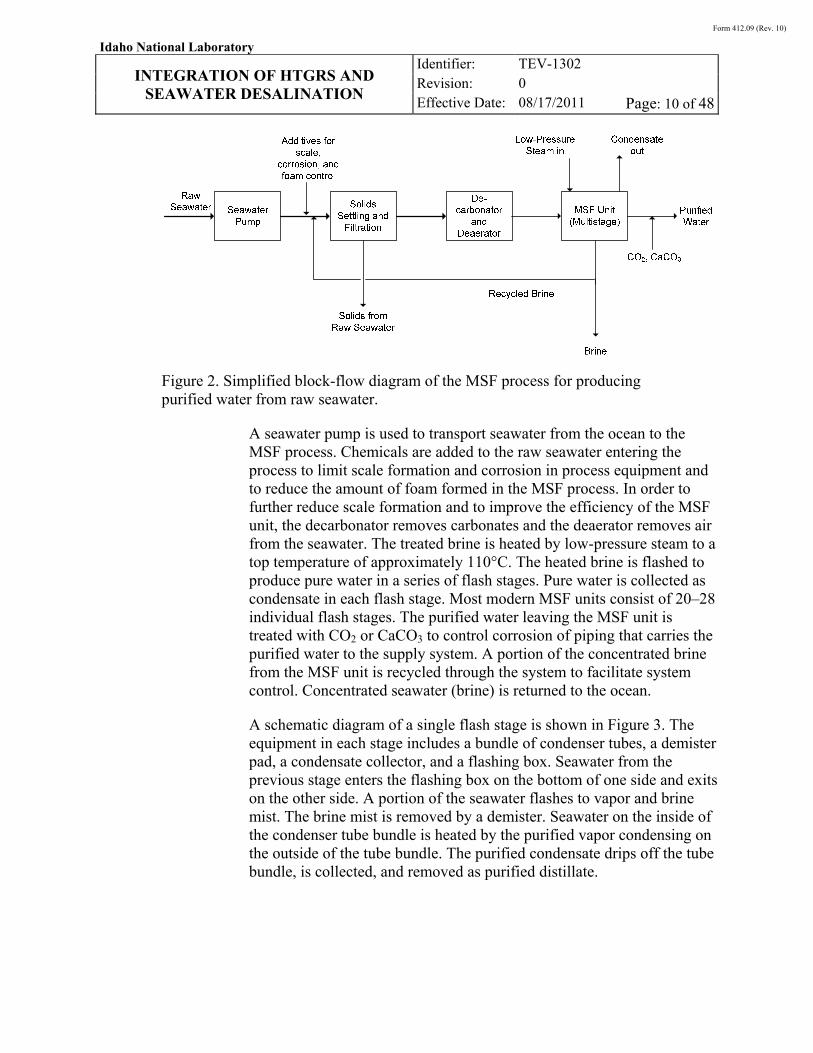
Figure 2. Simplified block-flow diagram of the MSF process for producing purified water from raw seawater.
A seawater pump is used to transport seawater from the ocean to the MSF process. Chemicals are added to the raw seawater entering the process to limit scale formation and corrosion in process equipment and to reduce the amount of foam formed in the MSF process. In order to further reduce scale formation and to improve the efficiency of the MSF unit, the decarbonator removes carbonates and the deaerator removes air from the seawater. The treated brine is heated by low-pressure steam to a top temperature of approximately 110°C. The heated brine is flashed to produce pure water in a series of flash stages. Pure water is collected as condensate in each flash stage. Most modern MSF units consist of 20–28 individual flash stages. The purified water leaving the MSF unit is treated with CO2 or CaCO3 to control corrosion of piping that carries the purified water to the supply system. A portion of the concentrated brine from the MSF unit is recycled through the system to facilitate system control. Concentrated seawater (brine) is returned to the ocean.
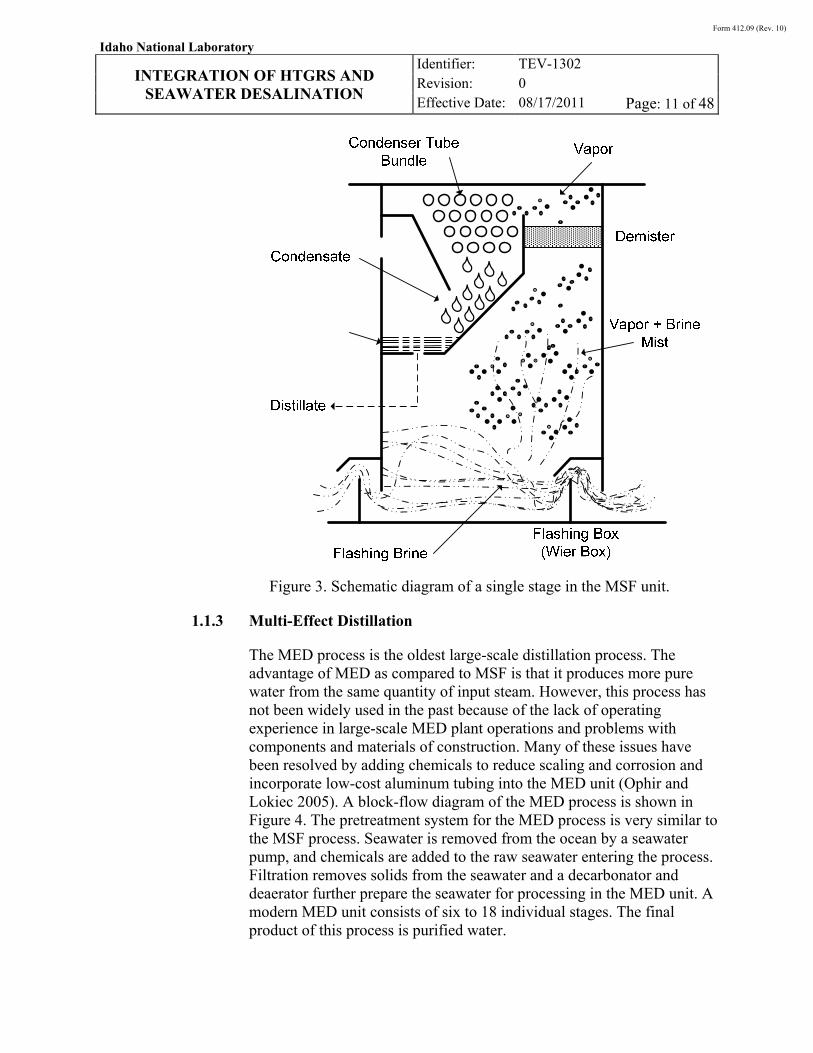
A schematic diagram of a single flash stage is shown in Figure 3. The equipment in each stage includes a bundle of condenser tubes, a demister pad, a condensate collector, and a flashing box. Seawater from the previous stage enters the flashing box on the bottom of one side and exits on the other side. A portion of the seawater flashes to vapor and brine mist. The brine mist is removed by a demister. Seawater on the inside of the condenser tube bundle is heated by the purified vapor condensing on the outside of the tube bundle. The purified condensate drips off the tube bundle, is collected, and removed as purified distillate.
Form 412.09 (Rev. 10)
Idaho National Laboratory
INTEGRATION OF HTGRS AND
SEAWATER DESALINATION
Identifier: Revision: Effective Date:
TEV-1302
0
08/17/2011 Page: 11 of 48
Figure 3. Schematic diagram of a single stage in the MSF unit.
1.1.3 Multi-Effect Distillation
The MED process is the oldest large-scale distillation process. The advantage of MED as compared to MSF is that it produces more pure water from the same quantity of input steam. However, this process has not been widely used in the past because of the lack of operating experience in large-scale MED plant operations and problems with components and materials of construction. Many of these issues have been resolved by adding chemicals to reduce scaling and corrosion and incorporate low-cost aluminum tubing into the MED unit (Ophir and Lokiec 2005). A block-flow diagram of the MED process is shown in Figure 4. The pretreatment system for the MED process is very similar to the MSF process. Seawater is removed from the ocean by a seawater pump, and chemicals are added to the raw seawater entering the process. Filtration removes solids from the seawater and a decarbonator and deaerator further prepare the seawater for processing in the MED unit. A modern MED unit consists of six to 18 individual stages. The final product of this process is purified water.
Form 412.09 (Rev. 10)
Idaho National Laboratory
INTEGRATION OF HTGRS AND
SEAWATER DESALINATION
Identifier: Revision: Effective Date:
TEV-1302
0
08/17/2011 Page: 12 of 48
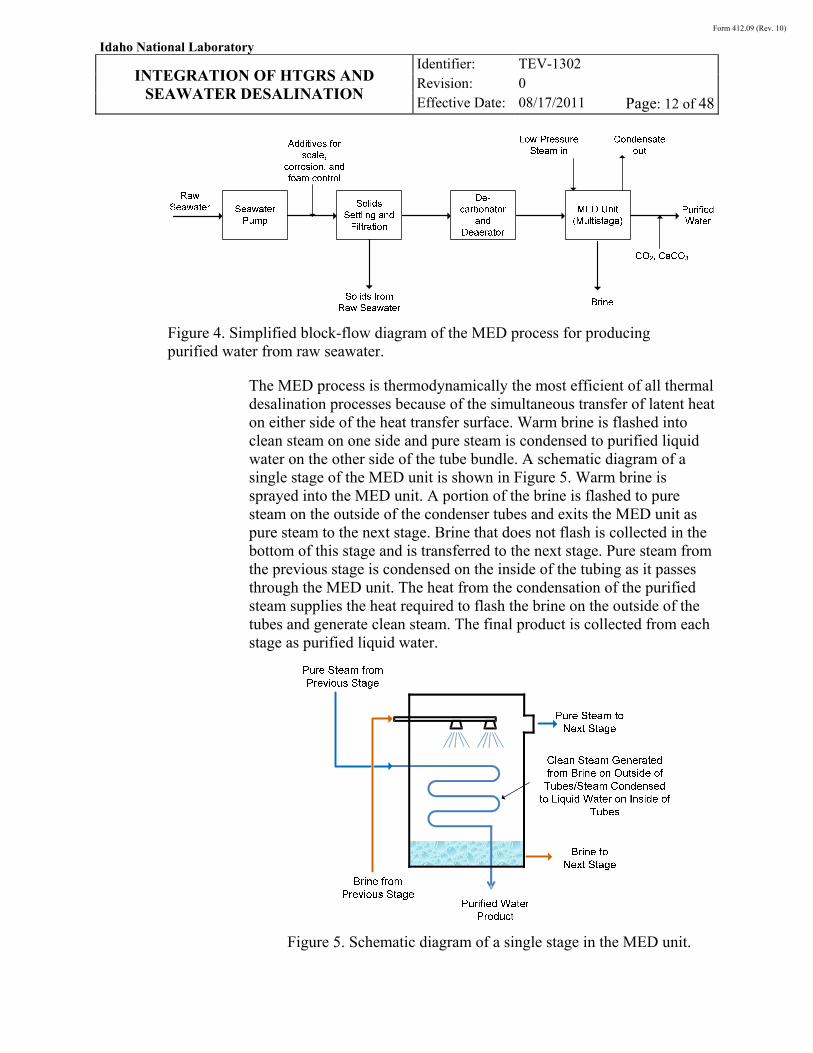
Figure 4. Simplified block-flow diagram of the MED process for producing purified water from raw seawater.
The MED process is thermodynamically the most efficient of all thermal desalination processes because of the simultaneous transfer of latent heat on either side of the heat transfer surface. Warm brine is flashed into clean steam on one side and pure steam is condensed to purified liquid water on the other side of the tube bundle. A schematic diagram of a single stage of the MED unit is shown in Figure 5. Warm brine is sprayed into the MED unit. A portion of the brine is flashed to pure steam on the outside of the condenser tubes and exits the MED unit as pure steam to the next stage. Brine that does not flash is collected in the bottom of this stage and is transferred to the next stage. Pure steam from the previous stage is condensed on the inside of the tubing as it passes through the MED unit. The heat from the condensation of the purified steam supplies the heat required to flash the brine on the outside of the tubes and generate clean steam. The final product is collected from each stage as purified liquid water.
Figure 5. Schematic diagram of a single stage in the MED unit.
Form 412.09 (Rev. 10)
Idaho National Laboratory
INTEGRATION OF HTGRS AND
SEAWATER DESALINATION
Identifier: Revision: Effective Date:
TEV-1302
0
08/17/2011 Page: 13 of 48
1.2 Conventional Seawater Desalination
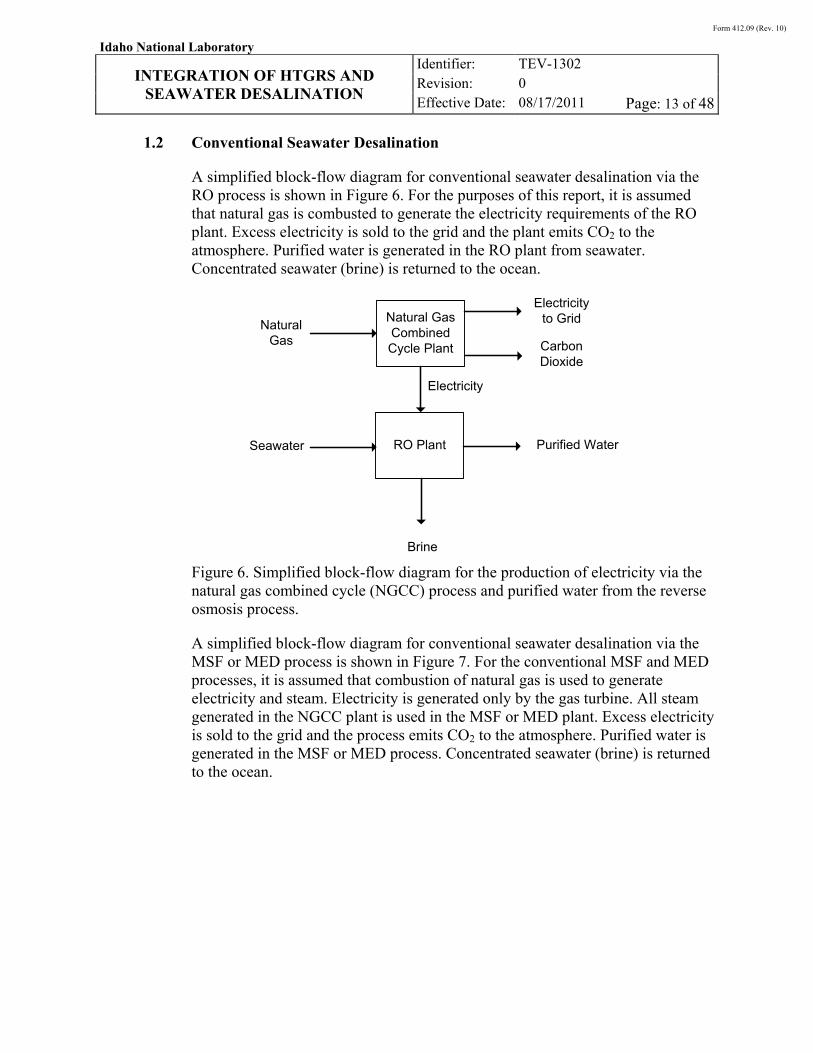
A simplified block-flow diagram for conventional seawater desalination via the RO process is shown in Figure 6. For the purposes of this report, it is assumed that natural gas is combusted to generate the electricity requirements of the RO plant. Excess electricity is sold to the grid and the plant emits CO2 to the atmosphere. Purified water is generated in the RO plant from seawater. Concentrated seawater (brine) is returned to the ocean.
Natural Gas Combined Cycle Plant
RO Plant
Electricity to Grid
Purified WaterSeawater
Natural Gas
Electricity
Carbon Dioxide
Brine
Figure 6. Simplified block-flow diagram for the production of electricity via the natural gas combined cycle (NGCC) process and purified water from the reverse osmosis process.
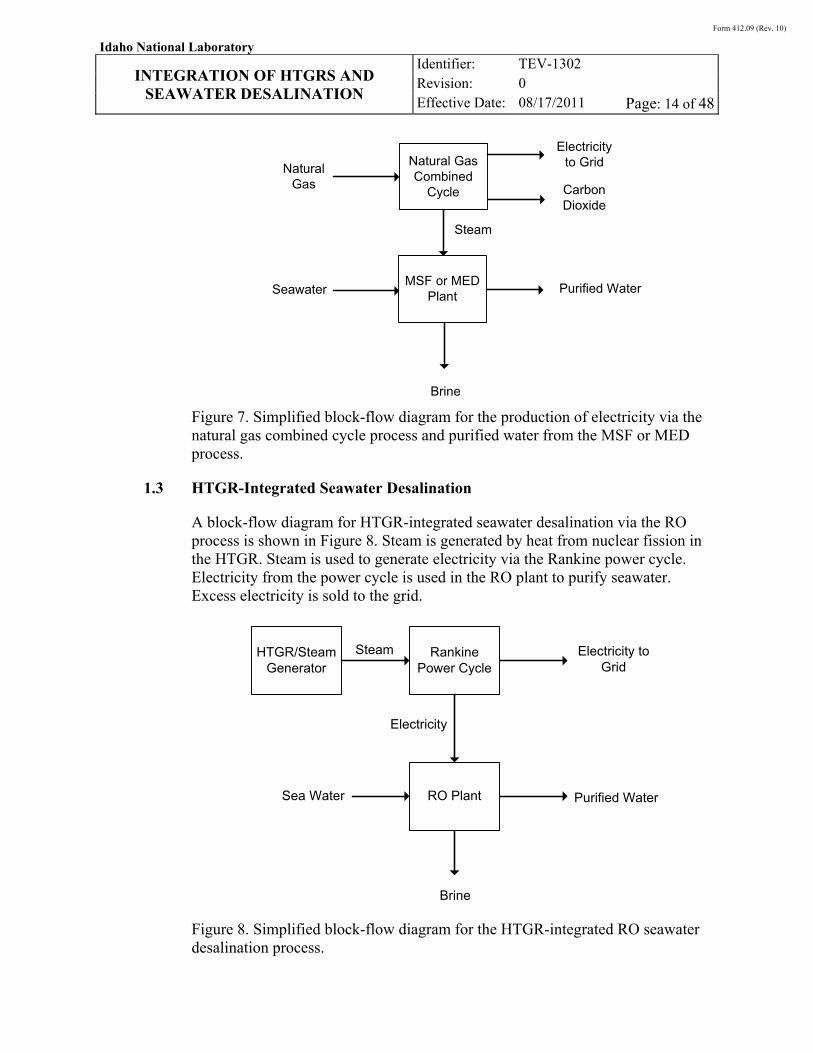
A simplified block-flow diagram for conventional seawater desalination via the MSF or MED process is shown in Figure 7. For the conventional MSF and MED processes, it is assumed that combustion of natural gas is used to generate electricity and steam. Electricity is generated only by the gas turbine. All steam generated in the NGCC plant is used in the MSF or MED plant. Excess electricity is sold to the grid and the process emits CO2 to the atmosphere. Purified water is generated in the MSF or MED process. Concentrated seawater (brine) is returned to the ocean.
Form 412.09 (Rev. 10)
Idaho National Laboratory
INTEGRATION OF HTGRS AND
SEAWATER DESALINATION
Identifier: Revision: Effective Date:
TEV-1302
0
08/17/2011 Page: 14 of 48
Natural Gas Combined
Cycle
MSF or MED Plant
Electricity to Grid
Purified WaterSeawater
Natural Gas
Steam
Carbon Dioxide
Brine
Figure 7. Simplified block-flow diagram for the production of electricity via the natural gas combined cycle process and purified water from the MSF or MED process.
1.3 HTGR-Integrated Seawater Desalination
A block-flow diagram for HTGR-integrated seawater desalination via the RO process is shown in Figure 8. Steam is generated by heat from nuclear fission in the HTGR. Steam is used to generate electricity via the Rankine power cycle. Electricity from the power cycle is used in the RO plant to purify seawater. Excess electricity is sold to the grid.
HTGR/Steam Generator
Rankine Power Cycle
RO Plant Purified WaterSea Water
Brine
Electricity
Steam Electricity to Grid
Figure 8. Simplified block-flow diagram for the HTGR-integrated RO seawater desalination process.
Form 412.09 (Rev. 10)
Idaho National Laboratory
INTEGRATION OF HTGRS AND
SEAWATER DESALINATION
Identifier: Revision: Effective Date:
TEV-1302
0
08/17/2011 Page: 15 of 48
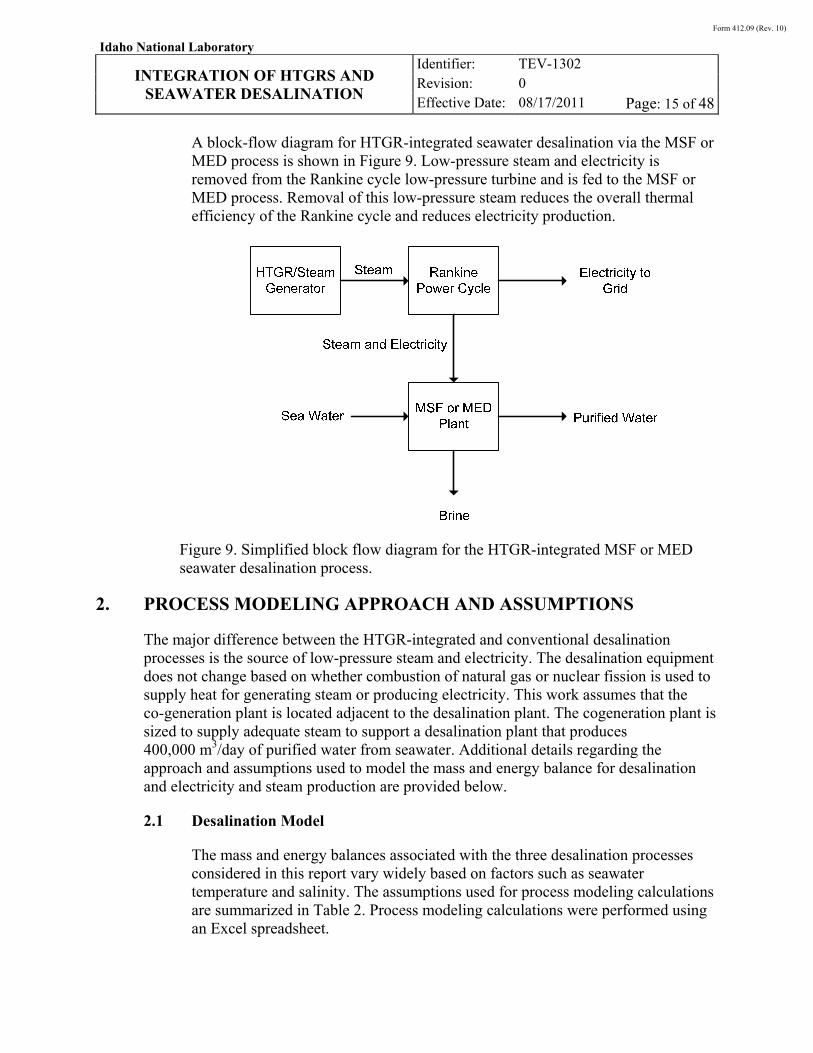
A block-flow diagram for HTGR-integrated seawater desalination via the MSF or MED process is shown in Figure 9. Low-pressure steam and electricity is removed from the Rankine cycle low-pressure turbine and is fed to the MSF or MED process. Removal of this low-pressure steam reduces the overall thermal efficiency of the Rankine cycle and reduces electricity production.
Figure 9. Simplified block flow diagram for the HTGR-integrated MSF or MED seawater desalination process.
2. PROCESS MODELING APPROACH AND ASSUMPTIONS
The major difference between the HTGR-integrated and conventional desalination processes is the source of low-pressure steam and electricity. The desalination equipment does not change based on whether combustion of natural gas or nuclear fission is used to supply heat for generating steam or producing electricity. This work assumes that the co-generation plant is located adjacent to the desalination plant. The cogeneration plant is sized to supply adequate steam to support a desalination plant that produces 400,000 m3/day of purified water from seawater. Additional details regarding the approach and assumptions used to model the mass and energy balance for desalination and electricity and steam production are provided below.
2.1 Desalination Model
The mass and energy balances associated with the three desalination processes considered in this report vary widely based on factors such as seawater temperature and salinity. The assumptions used for process modeling calculations are summarized in Table 2. Process modeling calculations were performed using an Excel spreadsheet.
Form 412.09 (Rev. 10)
Idaho National Laboratory
INTEGRATION OF HTGRS AND
SEAWATER DESALINATION
Identifier: Revision: Effective Date:
TEV-1302
0
08/17/2011 Page: 16 of 48
Table 2. Assumptions used to complete process modeling for desalination of seawater.
Parameter Unit
Process
Reverse Osmosis
Multi-Stage Flash Distillation
Multi-Effect Desalination
Electricity Requirements kW hr(e)/m3 4.5 3 2
Gain Output Ratio (GOR) Kgdistillate/ kgmotive steam
N/A 8.74 (28 stages) 1 11.2 (14 effects)a
Seawater Temperature °C 25 25 25
Seawater Salinity mg/L (ppm) 35,000 35,000 35,000
Top Brine Temperature °C N/A 1051 701
Fresh Water Output m3/day 100,000 100,000 100,000
Density of Fresh Water kg/m3 1,000 1,000 1,000
Density of Seawater at 25°C, 30,000 ppm TDS
kg/m3 1,018 1,018 1,018
Density of Seawater at 25°C, 70,000 ppm TDSb
kg/m3 1,050 1,050 1,050
a. Calculated using default values provided in DEEP 4.0 (IAEA 2000).
b. Based on seawater density calculator: http://www.csgnetwork.com/h2odenscalc.html.
3. PROCESS MODELING RESULTS
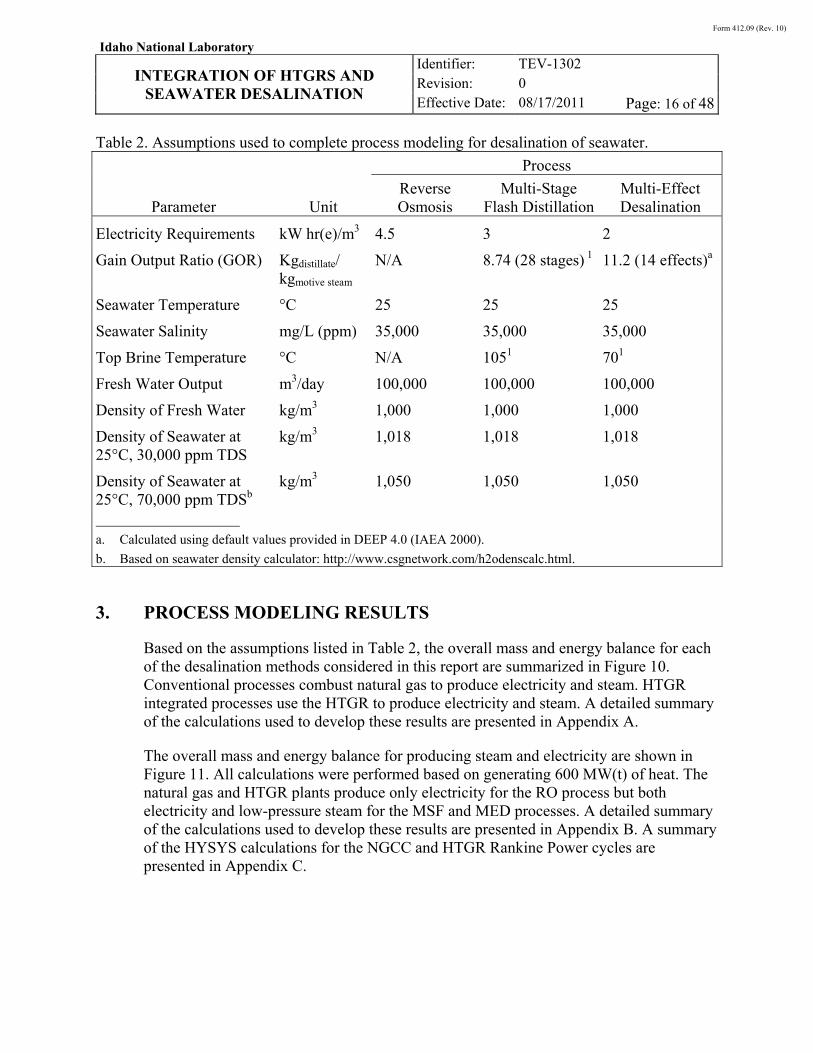
Based on the assumptions listed in Table 2, the overall mass and energy balance for each of the desalination methods considered in this report are summarized in Figure 10. Conventional processes combust natural gas to produce electricity and steam. HTGR integrated processes use the HTGR to produce electricity and steam. A detailed summary of the calculations used to develop these results are presented in Appendix A.
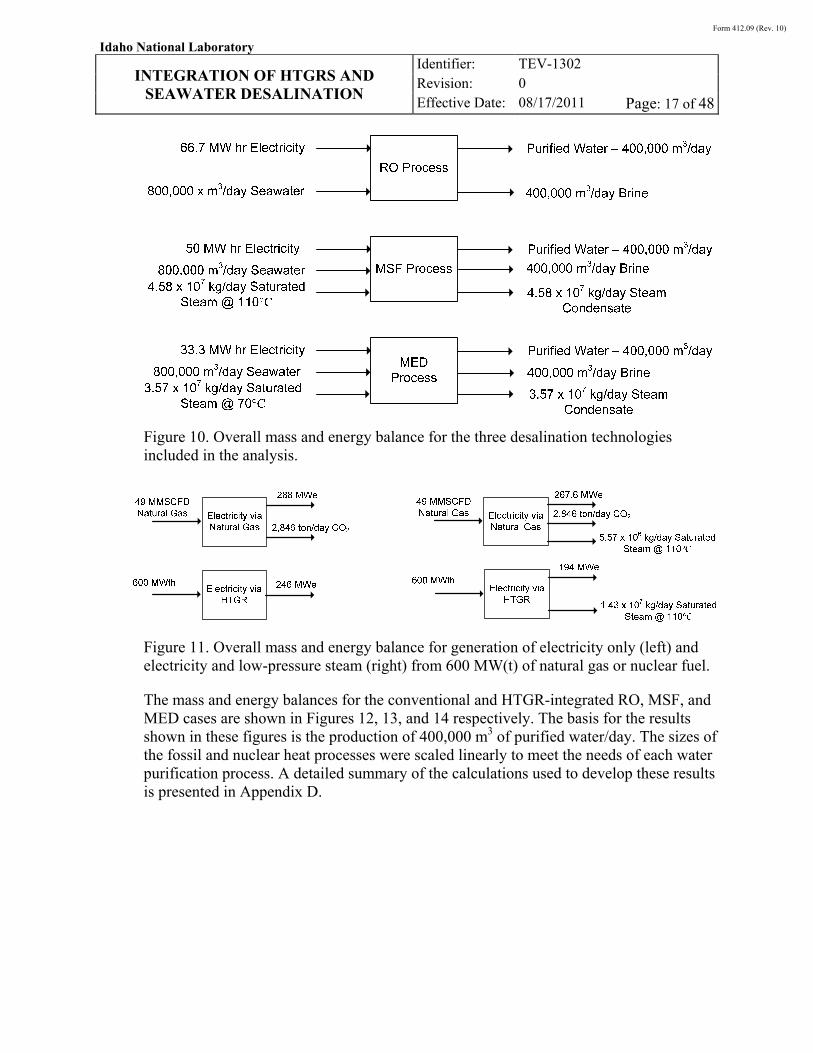
The overall mass and energy balance for producing steam and electricity are shown in Figure 11. All calculations were performed based on generating 600 MW(t) of heat. The natural gas and HTGR plants produce only electricity for the RO process but both electricity and low-pressure steam for the MSF and MED processes. A detailed summary of the calculations used to develop these results are presented in Appendix B. A summary of the HYSYS calculations for the NGCC and HTGR Rankine Power cycles are presented in Appendix C.
Form 412.09 (Rev. 10)
Idaho National Laboratory
INTEGRATION OF HTGRS AND
SEAWATER DESALINATION
Identifier: Revision: Effective Date:
TEV-1302
0
08/17/2011 Page: 17 of 48
Figure 10. Overall mass and energy balance for the three desalination technologies included in the analysis.
Figure 11. Overall mass and energy balance for generation of electricity only (left) and electricity and low-pressure steam (right) from 600 MW(t) of natural gas or nuclear fuel.
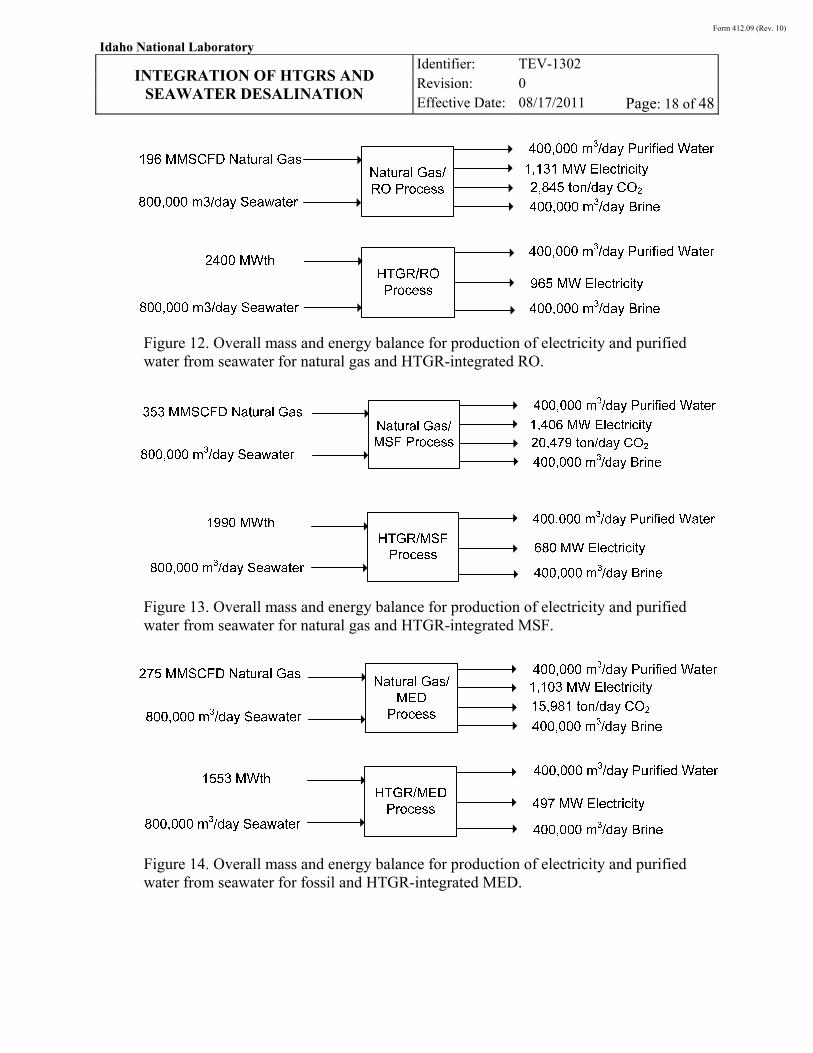
The mass and energy balances for the conventional and HTGR-integrated RO, MSF, and MED cases are shown in Figures 12, 13, and 14 respectively. The basis for the results shown in these figures is the production of 400,000 m3 of purified water/day. The sizes of the fossil and nuclear heat processes were scaled linearly to meet the needs of each water purification process. A detailed summary of the calculations used to develop these results is presented in Appendix D.
Form 412.09 (Rev. 10)
Idaho National Laboratory
INTEGRATION OF HTGRS AND
SEAWATER DESALINATION
Identifier: Revision: Effective Date:
TEV-1302
0
08/17/2011 Page: 18 of 48
Figure 12. Overall mass and energy balance for production of electricity and purified water from seawater for natural gas and HTGR-integrated RO.
Figure 13. Overall mass and energy balance for production of electricity and purified water from seawater for natural gas and HTGR-integrated MSF.
Figure 14. Overall mass and energy balance for production of electricity and purified water from seawater for fossil and HTGR-integrated MED.
Form 412.09 (Rev. 10)
Idaho National Laboratory
INTEGRATION OF HTGRS AND
SEAWATER DESALINATION
Identifier: Revision: Effective Date:
TEV-1302
0
08/17/2011 Page: 19 of 48
4. ECONOMIC MODELING OVERVIEW
The economic viability of the desalination processes was assessed using standard economic evaluation methods, specifically the internal rate of return (IRR). The economics were evaluated for the conventional and HTGR-integrated cases described in the previous section. The total capital investment (TCI)—based on the total equipment costs, annual revenues, and annual manufacturing costs—were first calculated for these cases. The present worth (PW) of the annual cash flows (after taxes) was then calculated for the TCI. The following sections describe the methods used to calculate the capital costs, annual revenues, annual manufacturing costs, and economic results. The calculations assumed that the products being sold are electricity and purified seawater. The results are preliminary and should be refined as the HTGR design progresses, should the design change significantly or additional cost refinements become available.
4.1 Capital Cost Estimation
The Association for the Advancement of Cost Engineering (AACE) International recognizes five classes of estimates. The level of project definition for this study was determined to be an AACE International Class 4 estimate, which has a probable error of -30% and +50% (INL 2011a). A Class 4 estimate is associated with a feasibility study or top-down cost estimate and has one to 15% of full project definition (AACE 2005).
Equipment items for this study were not individually priced. Rather, cost estimates were based on scaled costs for major plant processes from published literature or vendor data. Cost estimates generated in this manner include costs for the fossil power electricity plant (Energy Information Administration [EIA] 2010) and the desalination plant (U.S. Bureau of Reclamation [USBR] 2003). All costs presented are assumed to represent a complete and operable system and include all engineering fees and contingencies. Fixed capital costs were estimated from literature data, scaled linearly with increasing capacity.
Capital costs to install the HTGR are based on the capital cost correlations presented in Section 2.6 of TEV-1196, which apply for a mature commercial nth-of-a-kind HTGR with a reactor outlet temperature of 750°C and a Rankine power cycle. Preconstruction costs, balance of equipment costs, indirect costs, and project contingencies were added in accordance with the costs outlined in Sections 2.1 through 2.5 of TEV-1196 (INL 2011a).
The Chemical Engineering Plant Cost Index (CEPCI) was used to adjust equipment prices from previous years to 2010 values as depicted in Table 3.
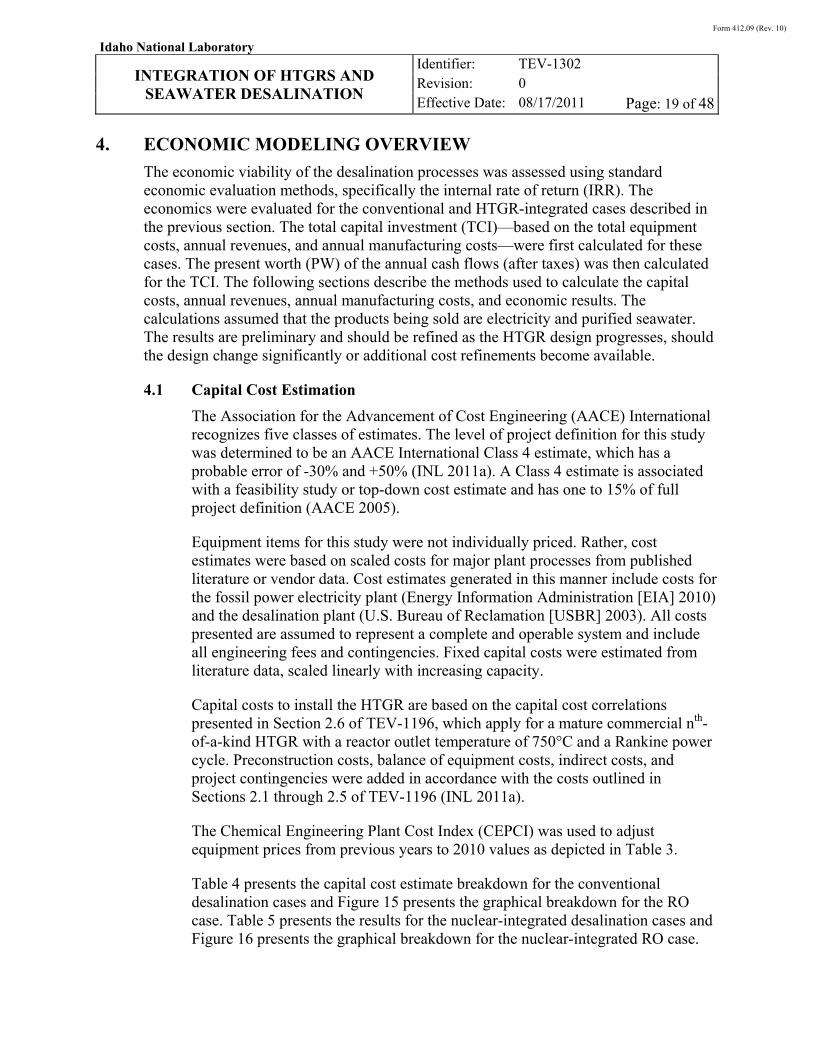
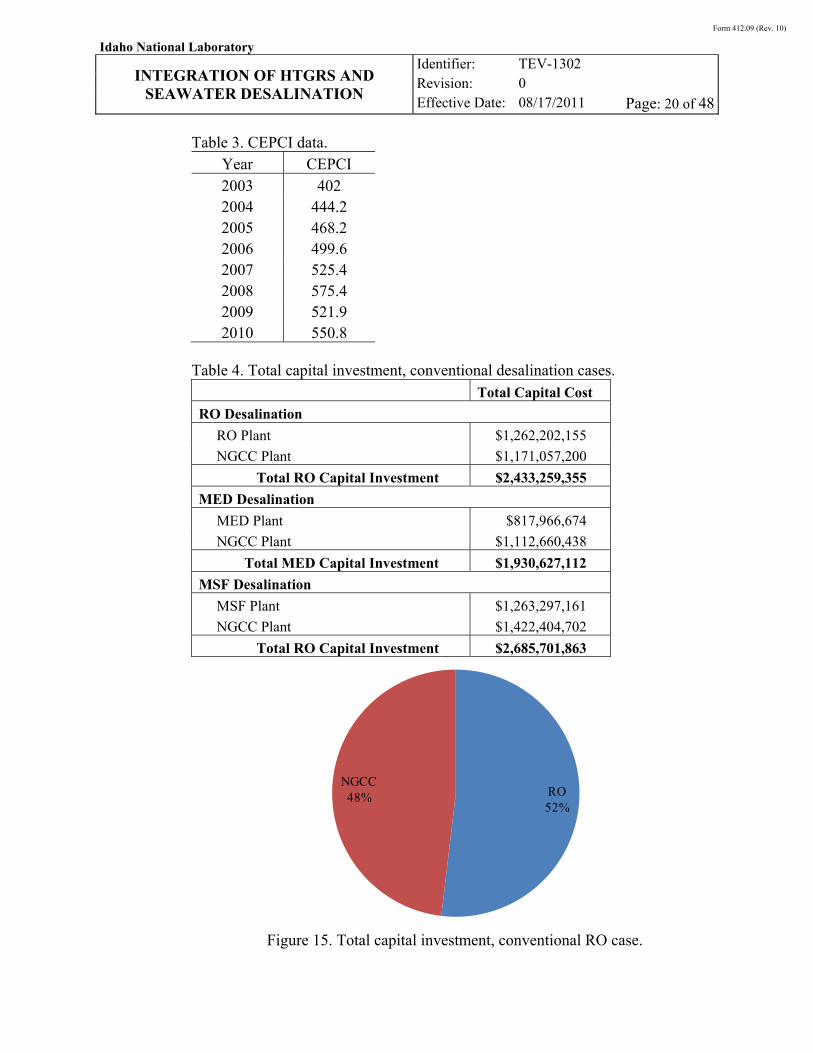
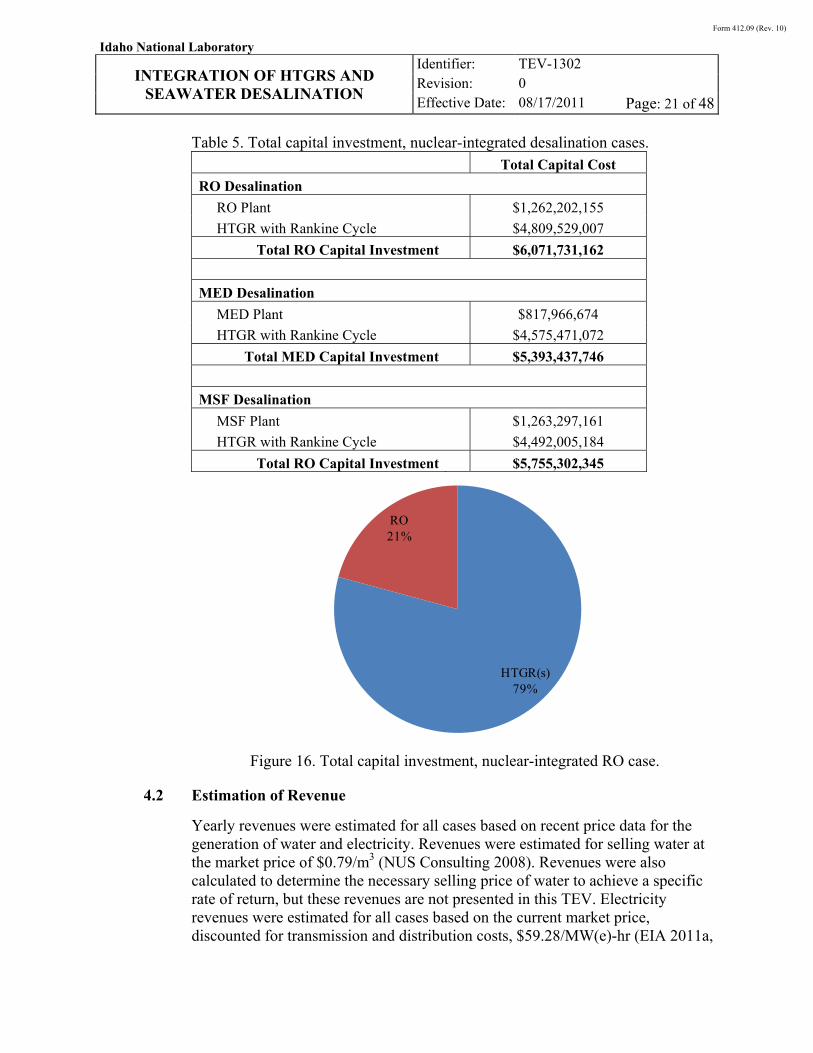
Table 4 presents the capital cost estimate breakdown for the conventional desalination cases and Figure 15 presents the graphical breakdown for the RO case. Table 5 presents the results for the nuclear-integrated desalination cases and Figure 16 presents the graphical breakdown for the nuclear-integrated RO case.
Form 412.09 (Rev. 10)
Idaho National Laboratory
INTEGRATION OF HTGRS AND
SEAWATER DESALINATION
Identifier: Revision: Effective Date:
TEV-1302
0
08/17/2011 Page: 20 of 48
Table 3. CEPCI data. Year CEPCI 2003 402 2004 444.2 2005 468.2 2006 499.6 2007 525.4 2008 575.4 2009 521.9 2010 550.8
Table 4. Total capital investment, conventional desalination cases. Total Capital Cost
RO Desalination
RO Plant $1,262,202,155
NGCC Plant $1,171,057,200
Total RO Capital Investment $2,433,259,355
MED Desalination
MED Plant $817,966,674
NGCC Plant $1,112,660,438
Total MED Capital Investment $1,930,627,112
MSF Desalination
MSF Plant $1,263,297,161
NGCC Plant $1,422,404,702
Total RO Capital Investment $2,685,701,863
Figure 15. Total capital investment, conventional RO case.
RO52%
NGCC48%
Form 412.09 (Rev. 10)
Idaho National Laboratory
INTEGRATION OF HTGRS AND
SEAWATER DESALINATION
Identifier: Revision: Effective Date:
TEV-1302
0
08/17/2011 Page: 21 of 48
Table 5. Total capital investment, nuclear-integrated desalination cases. Total Capital Cost
RO Desalination
RO Plant $1,262,202,155
HTGR with Rankine Cycle $4,809,529,007
Total RO Capital Investment $6,071,731,162
MED Desalination
MED Plant $817,966,674
HTGR with Rankine Cycle $4,575,471,072
Total MED Capital Investment $5,393,437,746
MSF Desalination
MSF Plant $1,263,297,161
HTGR with Rankine Cycle $4,492,005,184
Total RO Capital Investment $5,755,302,345
Figure 16. Total capital investment, nuclear-integrated RO case.
4.2 Estimation of Revenue
Yearly revenues were estimated for all cases based on recent price data for the generation of water and electricity. Revenues were estimated for selling water at the market price of $0.79/m3 (NUS Consulting 2008). Revenues were also calculated to determine the necessary selling price of water to achieve a specific rate of return, but these revenues are not presented in this TEV. Electricity revenues were estimated for all cases based on the current market price, discounted for transmission and distribution costs, $59.28/MW(e)-hr (EIA 2011a,
HTGR(s)79%
RO21%
Form 412.09 (Rev. 10)
Idaho National Laboratory
INTEGRATION OF HTGRS AND
SEAWATER DESALINATION
Identifier: Revision: Effective Date:
TEV-1302
0
08/17/2011 Page: 22 of 48
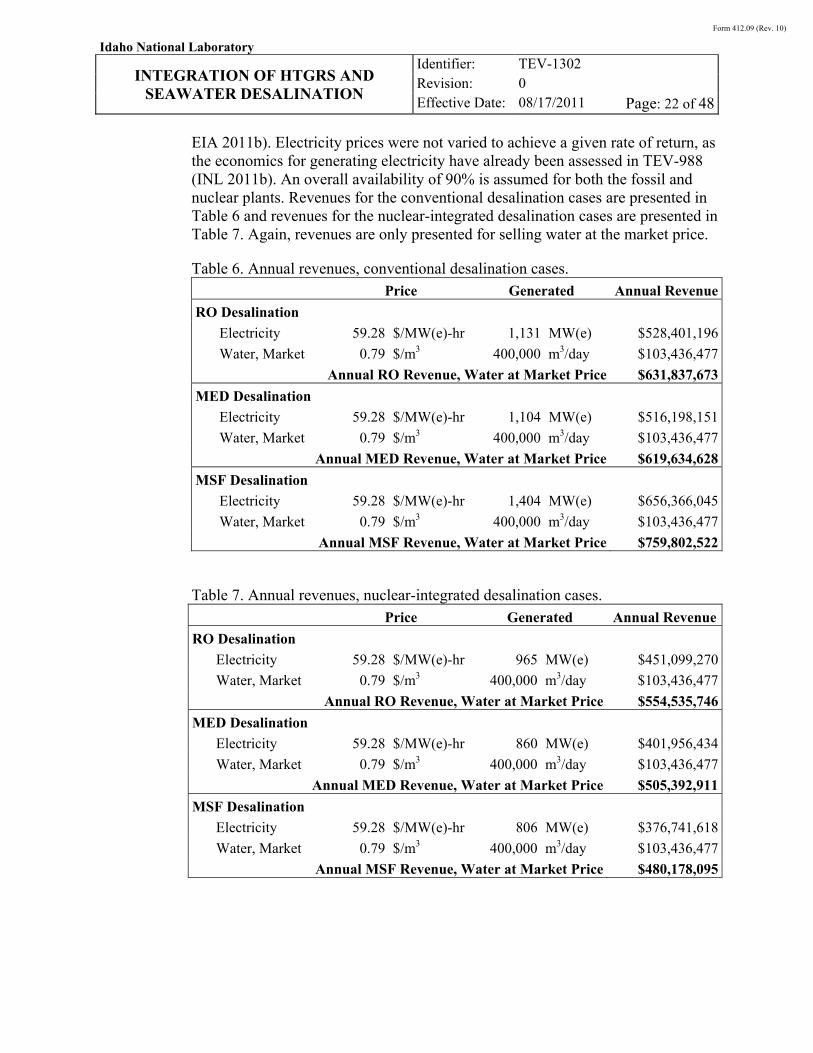
EIA 2011b). Electricity prices were not varied to achieve a given rate of return, as the economics for generating electricity have already been assessed in TEV-988 (INL 2011b). An overall availability of 90% is assumed for both the fossil and nuclear plants. Revenues for the conventional desalination cases are presented in Table 6 and revenues for the nuclear-integrated desalination cases are presented in Table 7. Again, revenues are only presented for selling water at the market price.
Table 6. Annual revenues, conventional desalination cases. Price Generated Annual Revenue
RO Desalination
Electricity 59.28 $/MW(e)-hr 1,131 MW(e) $528,401,196
Water, Market 0.79 $/m3 400,000 m3/day $103,436,477
Annual RO Revenue, Water at Market Price $631,837,673
MED Desalination
Electricity 59.28 $/MW(e)-hr 1,104 MW(e) $516,198,151
Water, Market 0.79 $/m3 400,000 m3/day $103,436,477
Annual MED Revenue, Water at Market Price $619,634,628
MSF Desalination
Electricity 59.28 $/MW(e)-hr 1,404 MW(e) $656,366,045
Water, Market 0.79 $/m3 400,000 m3/day $103,436,477
Annual MSF Revenue, Water at Market Price $759,802,522
Table 7. Annual revenues, nuclear-integrated desalination cases. Price Generated Annual Revenue
RO Desalination
Electricity 59.28 $/MW(e)-hr 965 MW(e) $451,099,270
Water, Market 0.79 $/m3 400,000 m3/day $103,436,477
Annual RO Revenue, Water at Market Price $554,535,746
MED Desalination
Electricity 59.28 $/MW(e)-hr 860 MW(e) $401,956,434
Water, Market 0.79 $/m3 400,000 m3/day $103,436,477
Annual MED Revenue, Water at Market Price $505,392,911
MSF Desalination
Electricity 59.28 $/MW(e)-hr 806 MW(e) $376,741,618
Water, Market 0.79 $/m3 400,000 m3/day $103,436,477
Annual MSF Revenue, Water at Market Price $480,178,095
Form 412.09 (Rev. 10)
Idaho National Laboratory
INTEGRATION OF HTGRS AND
SEAWATER DESALINATION
Identifier: Revision: Effective Date:
TEV-1302
0
08/17/2011 Page: 23 of 48
4.3 Estimation of Manufacturing Costs
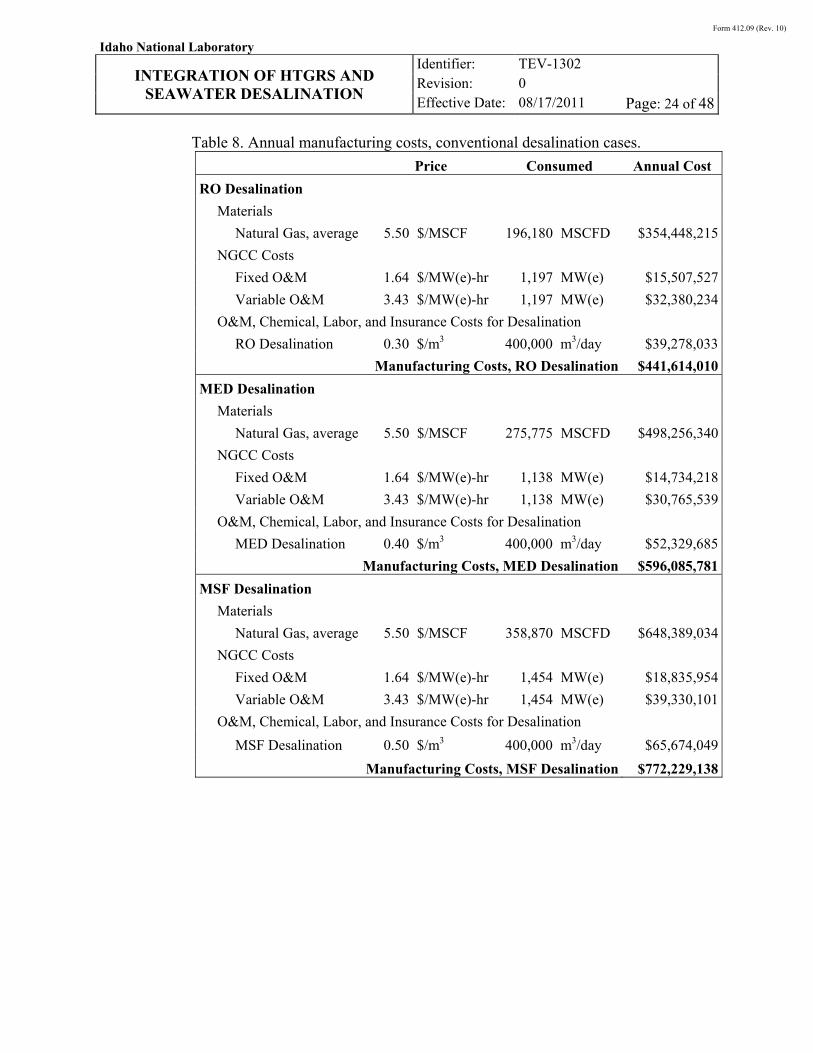
Manufacturing cost is the sum of direct and indirect manufacturing costs. Direct manufacturing costs for this project include the cost of raw materials, utilities, and operating labor and maintenance. Indirect manufacturing costs include estimates for the cost of overhead and insurance and taxes (Perry 2008). Natural gas prices for the conventional desalination cases were varied to account for the large fluctuations seen in the market. Costs were calculated for a low ($4.50/ [MSCF thousand standard cubic feet per day]), average ($5.50/MSCF), and high ($12.00/MSCF) industrial natural gas price. High prices correspond to prices from June 2008, low prices are from September 2009, and the average price was chosen to reflect current natural gas prices (EIA 2011c). Only average natural gas prices are presented in the tables that follow. Fixed and variable operations and maintenance (O&M) costs were estimated for the combined natural gas cycle based on recent data from EIA (2010).
O&M, chemical, labor, and insurance costs were lumped into a cost/m3 of water produced for each desalination method evaluated (USBR 2003). Table 8 describes the manufacturing costs for the conventional desalination cases at the average natural gas price. Again, availability was assumed to be 90%.
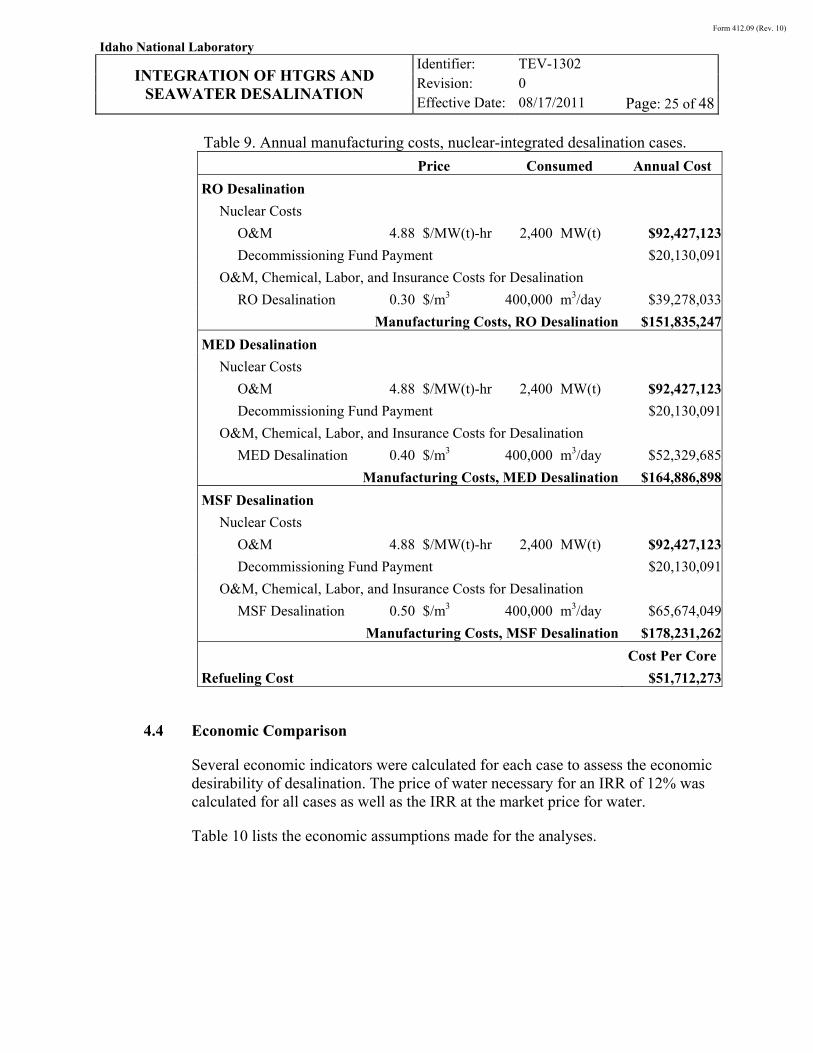
Manufacturing costs for the nuclear plant were based on information presented in TEV-1196. HTGR manufacturing costs include O&M costs, fuel costs, and decommissioning costs. The O&M, fuel, and decommissioning costs are based on the total thermal rating of the plant (INL 2011a). O&M and decommissioning costs are presented on an annual basis, while fuel costs are presented as the total refueling cost per core. Table 9 provides the manufacturing costs for the nuclear-integrated desalination cases. Again, availability was assumed to be 90%.
The decommissioning fund payment is calculated using the decommissioning cost in dollars per MW(t) presented in TEV-1196, which is based on NUREG-1307 (NRC 2010). That cost is multiplied by the total reactor power level to determine the total decommissioning cost and then inflated to the year decommissioning will occur, which is based on the economic recovery period. The sinking fund payment is calculated based on the estimated decommissioning cost and a 5% discount rate (GIF 2007).
It is recognized that the HTGR may operate longer than the specified economic recovery period. However, an economically conservative assumption assumes that the reactor is decommissioned at the end of the recovery period.
Form 412.09 (Rev. 10)
Idaho National Laboratory
INTEGRATION OF HTGRS AND
SEAWATER DESALINATION
Identifier: Revision: Effective Date:
TEV-1302
0
08/17/2011 Page: 24 of 48
Table 8. Annual manufacturing costs, conventional desalination cases.
Price Consumed Annual Cost
RO Desalination
Materials
Natural Gas, average 5.50 $/MSCF 196,180 MSCFD $354,448,215
NGCC Costs
Fixed O&M 1.64 $/MW(e)-hr 1,197 MW(e) $15,507,527
Variable O&M 3.43 $/MW(e)-hr 1,197 MW(e) $32,380,234
O&M, Chemical, Labor, and Insurance Costs for Desalination
RO Desalination 0.30 $/m3 400,000 m3/day $39,278,033
Manufacturing Costs, RO Desalination $441,614,010
MED Desalination
Materials
Natural Gas, average 5.50 $/MSCF 275,775 MSCFD $498,256,340
NGCC Costs
Fixed O&M 1.64 $/MW(e)-hr 1,138 MW(e) $14,734,218
Variable O&M 3.43 $/MW(e)-hr 1,138 MW(e) $30,765,539
O&M, Chemical, Labor, and Insurance Costs for Desalination
MED Desalination 0.40 $/m3 400,000 m3/day $52,329,685
Manufacturing Costs, MED Desalination $596,085,781
MSF Desalination
Materials
Natural Gas, average 5.50 $/MSCF 358,870 MSCFD $648,389,034
NGCC Costs
Fixed O&M 1.64 $/MW(e)-hr 1,454 MW(e) $18,835,954
Variable O&M 3.43 $/MW(e)-hr 1,454 MW(e) $39,330,101
O&M, Chemical, Labor, and Insurance Costs for Desalination
MSF Desalination 0.50 $/m3 400,000 m3/day $65,674,049
Manufacturing Costs, MSF Desalination $772,229,138
Form 412.09 (Rev. 10)
Idaho National Laboratory
INTEGRATION OF HTGRS AND
SEAWATER DESALINATION
Identifier: Revision: Effective Date:
TEV-1302
0
08/17/2011 Page: 25 of 48
Table 9. Annual manufacturing costs, nuclear-integrated desalination cases.
Price Consumed Annual Cost
RO Desalination
Nuclear Costs
O&M 4.88 $/MW(t)-hr 2,400 MW(t) $92,427,123
Decommissioning Fund Payment $20,130,091
O&M, Chemical, Labor, and Insurance Costs for Desalination
RO Desalination 0.30 $/m3 400,000 m3/day $39,278,033
Manufacturing Costs, RO Desalination $151,835,247
MED Desalination
Nuclear Costs
O&M 4.88 $/MW(t)-hr 2,400 MW(t) $92,427,123
Decommissioning Fund Payment $20,130,091
O&M, Chemical, Labor, and Insurance Costs for Desalination
MED Desalination 0.40 $/m3 400,000 m3/day $52,329,685
Manufacturing Costs, MED Desalination $164,886,898
MSF Desalination
Nuclear Costs
O&M 4.88 $/MW(t)-hr 2,400 MW(t) $92,427,123
Decommissioning Fund Payment $20,130,091
O&M, Chemical, Labor, and Insurance Costs for Desalination
MSF Desalination 0.50 $/m3 400,000 m3/day $65,674,049
Manufacturing Costs, MSF Desalination $178,231,262
Cost Per Core
Refueling Cost $51,712,273
4.4 Economic Comparison
Several economic indicators were calculated for each case to assess the economic desirability of desalination. The price of water necessary for an IRR of 12% was calculated for all cases as well as the IRR at the market price for water.
Table 10 lists the economic assumptions made for the analyses.
Form 412.09 (Rev. 10)
Idaho National Laboratory
INTEGRATION OF HTGRS AND
SEAWATER DESALINATION
Identifier: Revision: Effective Date:
TEV-1302
0
08/17/2011 Page: 26 of 48
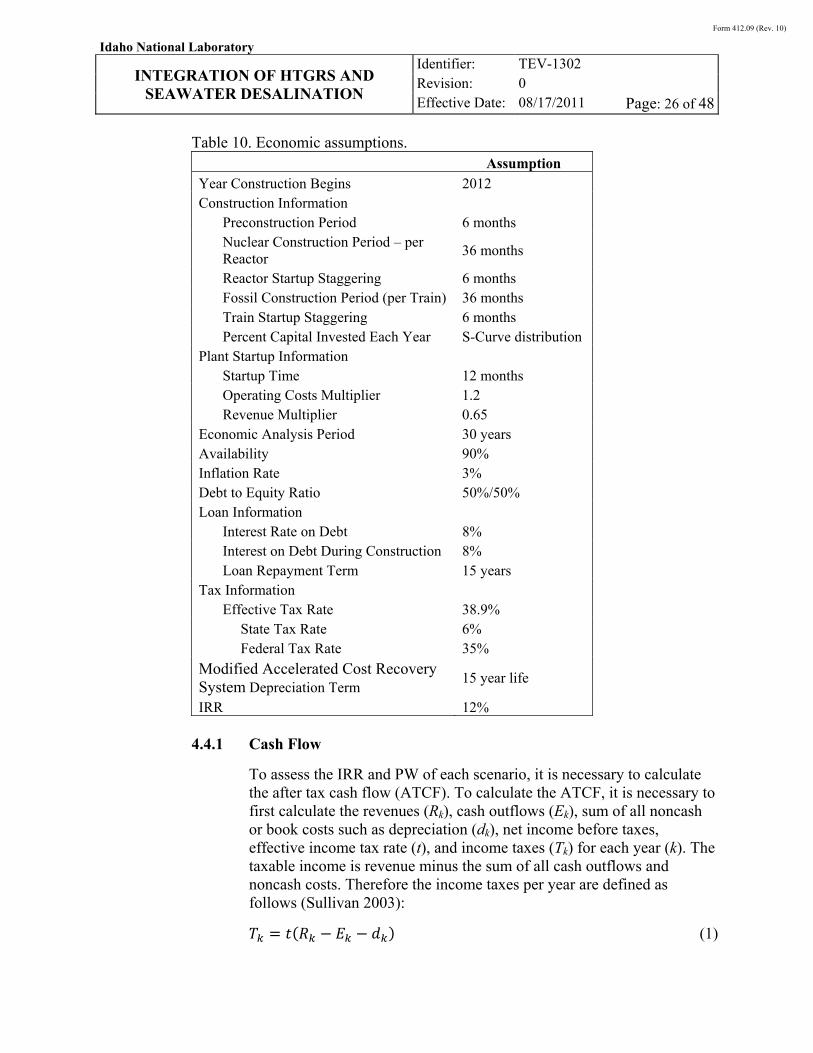
Table 10. Economic assumptions. Assumption Year Construction Begins 2012 Construction Information Preconstruction Period 6 months
Nuclear Construction Period – per Reactor
36 months
Reactor Startup Staggering 6 months Fossil Construction Period (per Train) 36 months Train Startup Staggering 6 months Percent Capital Invested Each Year S-Curve distribution Plant Startup Information Startup Time 12 months Operating Costs Multiplier 1.2 Revenue Multiplier 0.65 Economic Analysis Period 30 years Availability 90% Inflation Rate 3% Debt to Equity Ratio 50%/50% Loan Information Interest Rate on Debt 8% Interest on Debt During Construction 8% Loan Repayment Term 15 years Tax Information Effective Tax Rate 38.9% State Tax Rate 6% Federal Tax Rate 35%
Modified Accelerated Cost Recovery System Depreciation Term
15 year life
IRR 12%
4.4.1 Cash Flow
To assess the IRR and PW of each scenario, it is necessary to calculate the after tax cash flow (ATCF). To calculate the ATCF, it is necessary to first calculate the revenues (Rk), cash outflows (Ek), sum of all noncash or book costs such as depreciation (dk), net income before taxes, effective income tax rate (t), and income taxes (Tk) for each year (k). The taxable income is revenue minus the sum of all cash outflows and noncash costs. Therefore the income taxes per year are defined as follows (Sullivan 2003):
(1)
Form 412.09 (Rev. 10)
Idaho National Laboratory
INTEGRATION OF HTGRS AND
SEAWATER DESALINATION
Identifier: Revision: Effective Date:
TEV-1302
0
08/17/2011 Page: 27 of 48
Depreciation for the economic calculations was calculated using a standard Modified Accelerated Cost Recovery System depreciation method with a property class of 15 years. Depreciation was assumed for the TCI for each reactor module and fossil process train with the first charge occurring the year the corresponding HTGR/process train comes online, i.e. when initial revenues are received. Table 11 presents the recovery rates for a 15-year property class (Perry 2008).
Table 11. Modified accelerated cost recovery system (MACRS) depreciation.
Year Recovery Rate Year Recovery Rate
1 0.05 9 0.0591
2 0.095 10 0.059
3 0.0855 11 0.0591
4 0.077 12 0.059
5 0.0693 13 0.0591
6 0.0623 14 0.059
7 0.059 15 0.0591
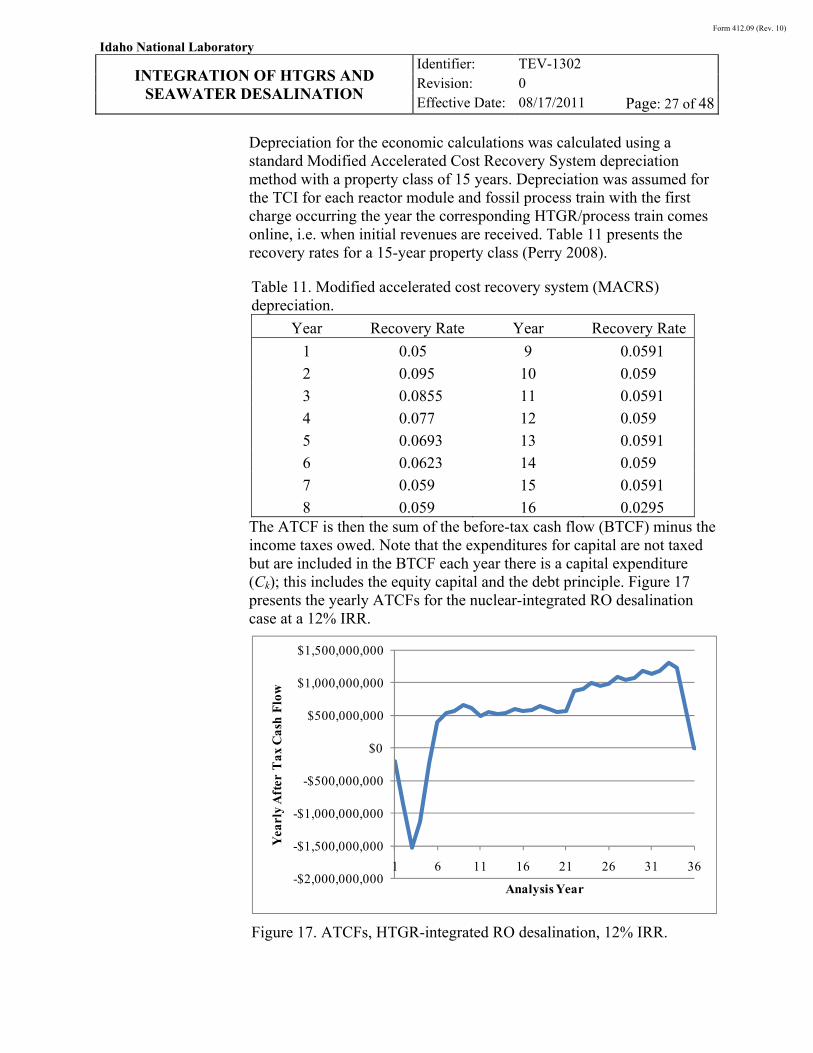
8 0.059 16 0.0295 The ATCF is then the sum of the before-tax cash flow (BTCF) minus the income taxes owed. Note that the expenditures for capital are not taxed but are included in the BTCF each year there is a capital expenditure (Ck); this includes the equity capital and the debt principle. Figure 17 presents the yearly ATCFs for the nuclear-integrated RO desalination case at a 12% IRR.
Figure 17. ATCFs, HTGR-integrated RO desalination, 12% IRR.
-$2,000,000,000
-$1,500,000,000
-$1,000,000,000
-$500,000,000
$0
$500,000,000
$1,000,000,000
$1,500,000,000
1 6 11 16 21 26 31 36
Yea
rly
Aft
er T
ax C
ash
Flo
w
Analysis Year
Form 412.09 (Rev. 10)
Idaho National Laboratory
INTEGRATION OF HTGRS AND
SEAWATER DESALINATION
Identifier: Revision: Effective Date:
TEV-1302
0
08/17/2011 Page: 28 of 48
The BTCF is defined as (Sullivan 2003)
. (2)
The ATCF can then be defined as
. (3)
4.4.1.1 Capital Cash Flows during Construction
Capital cash flows for the HTGR and fossil processes during construction were calculated for each year of construction based on two separate correlations. First, the percentage of capital assigned to each module or train was calculated based on an exponential correlation (Demick 2011). The exponent for the correlation is calculated based on the current module/train number so that
0.102 ln 0.963 0.402 (4)
where y is the exponent for the current module/train and Mod is the module/train being evaluated. The capital fraction is then determined for each module/train by
1 ∑ 11 (5)
where Number is the total number of reactor modules or process trains. The yearly fractional breakdown for each module’s/train’s capital is calculated by applying a generic standard cumulative distribution, the S-Curve, as recommended by the GEN-IV International Forum (GIF) (2007). The capital breakdown per month is calculated as
0.5 sin_
1
1 (6)
where month is the current month in the reactor/fossil construction period and c_months is the total number of months in the current module’s/train’s construction period. The capital fraction for each year is calculated by summing the capital fraction for the corresponding months. The yearly capital fractions are then multiplied by the module/train fraction to determine to overall yearly capital fractional breakdown per module/train.
Form 412.09 (Rev. 10)
Idaho National Laboratory
INTEGRATION OF HTGRS AND
SEAWATER DESALINATION
Identifier: Revision: Effective Date:
TEV-1302
0
08/17/2011 Page: 29 of 48
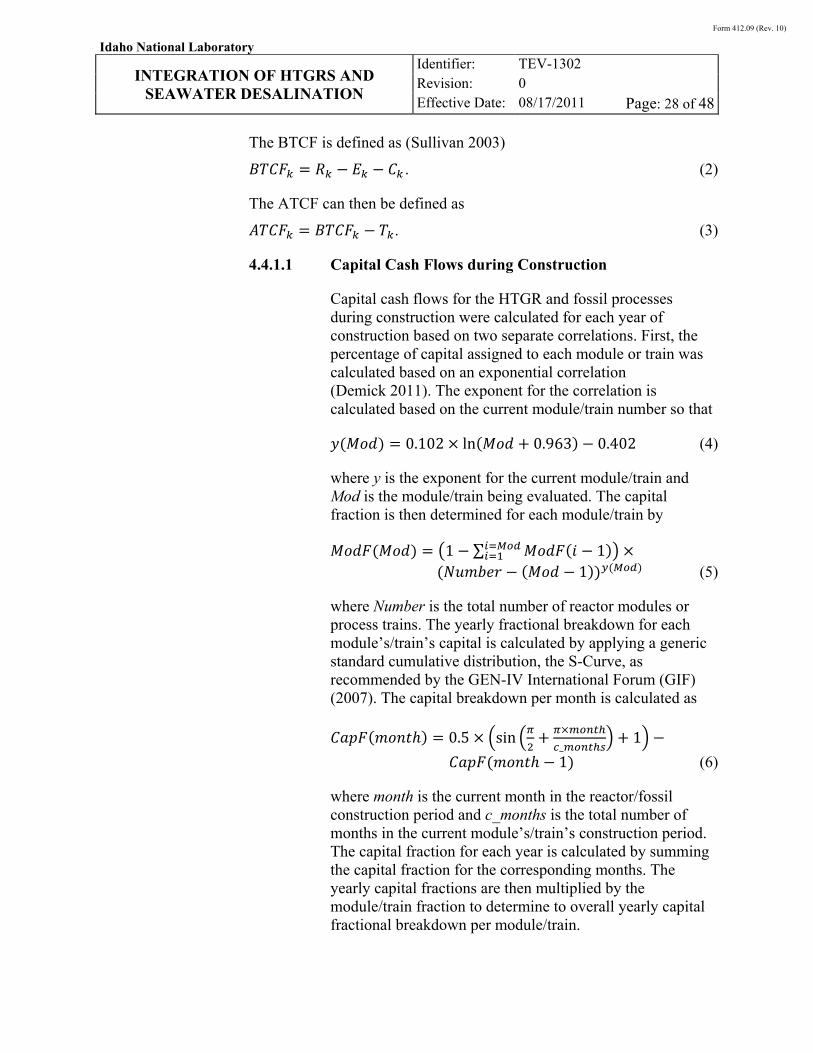
Figure 18 presents the percentage of TCI spent each year of construction for the HTGR-integrated RO desalination case.
Figure 18. Percentage of TCI spent each year of construction, HTGR-integrated RO desalination.
4.4.1.2 Reactor Refueling Cash Flows
Reactor refueling charges occur in the year a refueling is scheduled. The occurrences are determined based on the total number of reactor modules, when the modules come online, and the specified refueling period.
4.4.2 Internal Rate of Return
The IRR is the most widely used method for performing engineering economic analyses. It solves for the interest rate that equates the equivalent worth of an alternative’s cash inflows to the equivalent worth of cash outflows (ATCF), i.e., the interest rate at which the PW is zero. The resulting interest is the IRR (i'). For the project to be economically viable, the calculated IRR must be greater than the desired minimum annual rate of return (Sullivan 2003).
∑ 1 0 (7)
IRR calculations were performed for all cases of the calculated TCI. The price of heat and electricity necessary for an IRR of 12% and a PW of zero was also calculated for each case. All calculations were performed using Excel.
A CO2 tax was added to the calculations in all cases to determine the price of water necessary for a 12% IRR and a CO2 tax of $0/ton to $200/ton, which was then added to the existing yearly tax liability.
0%5%
10%15%20%25%30%35%40%45%
1 2 3 4 5
% T
CI
Construction Year
Form 412.09 (Rev. 10)
Idaho National Laboratory
INTEGRATION OF HTGRS AND
SEAWATER DESALINATION
Identifier: Revision: Effective Date:
TEV-1302
0
08/17/2011 Page: 30 of 48
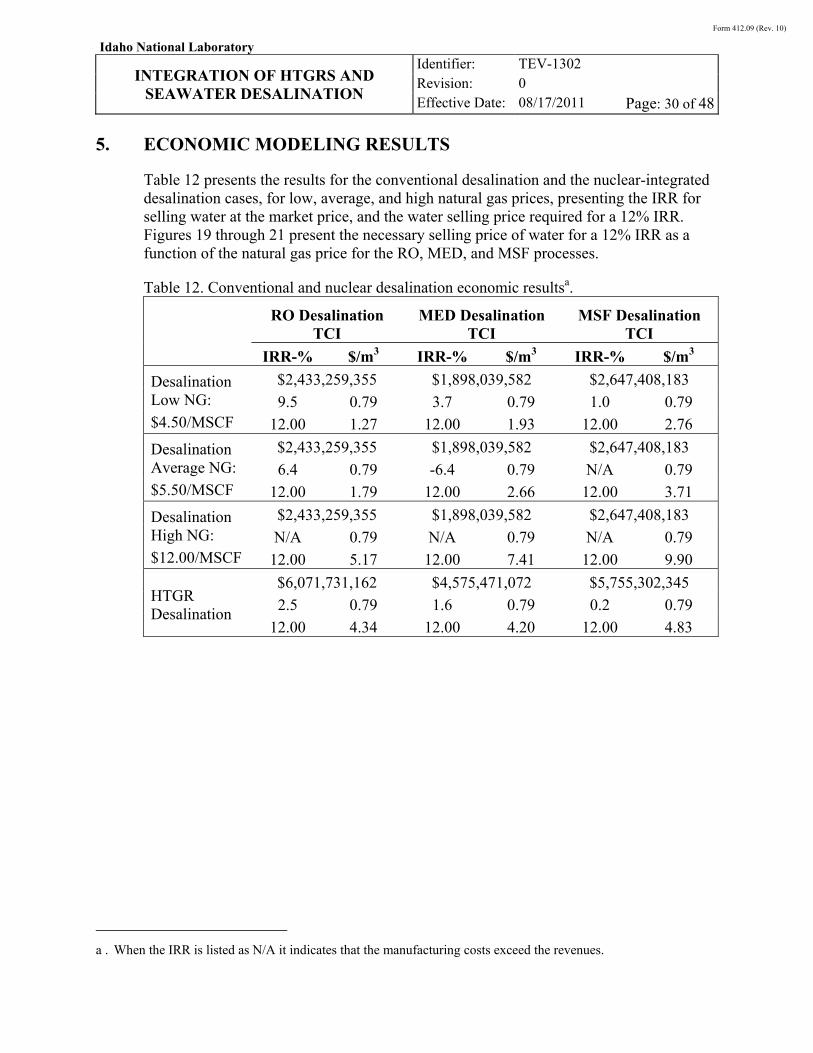
5. ECONOMIC MODELING RESULTS
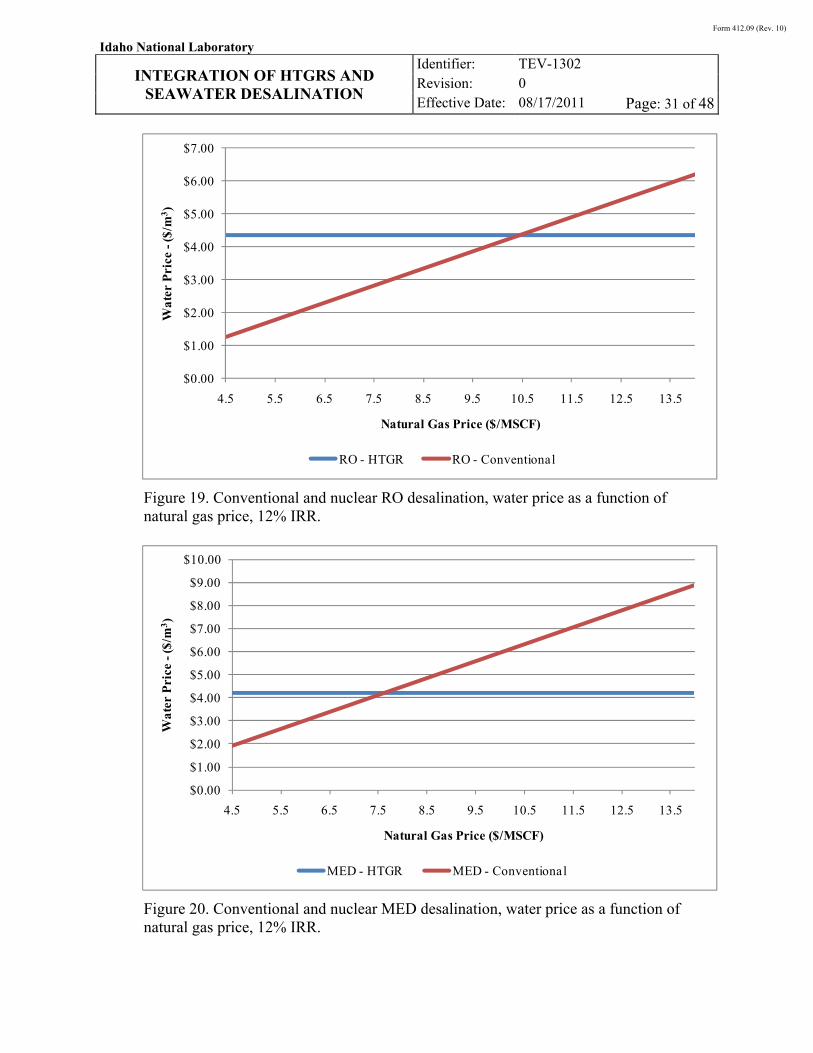
Table 12 presents the results for the conventional desalination and the nuclear-integrated desalination cases, for low, average, and high natural gas prices, presenting the IRR for selling water at the market price, and the water selling price required for a 12% IRR. Figures 19 through 21 present the necessary selling price of water for a 12% IRR as a function of the natural gas price for the RO, MED, and MSF processes.
Table 12. Conventional and nuclear desalination economic resultsa.
RO Desalination TCI
MED Desalination TCI
MSF Desalination TCI
IRR-% $/m3 IRR-% $/m3 IRR-% $/m3
Desalination Low NG:
$4.50/MSCF
$2,433,259,355 $1,898,039,582 $2,647,408,183
9.5 0.79 3.7 0.79 1.0 0.79
12.00 1.27 12.00 1.93 12.00 2.76
Desalination Average NG:
$5.50/MSCF
$2,433,259,355 $1,898,039,582 $2,647,408,183
6.4 0.79 -6.4 0.79 N/A 0.79
12.00 1.79 12.00 2.66 12.00 3.71
Desalination High NG:
$12.00/MSCF
$2,433,259,355 $1,898,039,582 $2,647,408,183
N/A 0.79 N/A 0.79 N/A 0.79
12.00 5.17 12.00 7.41 12.00 9.90
HTGR Desalination
$6,071,731,162 $4,575,471,072 $5,755,302,345
2.5 0.79 1.6 0.79 0.2 0.79
12.00 4.34 12.00 4.20 12.00 4.83
a . When the IRR is listed as N/A it indicates that the manufacturing costs exceed the revenues.
Form 412.09 (Rev. 10)
Idaho National Laboratory
INTEGRATION OF HTGRS AND
SEAWATER DESALINATION
Identifier: Revision: Effective Date:
TEV-1302
0
08/17/2011 Page: 31 of 48
Figure 19. Conventional and nuclear RO desalination, water price as a function of natural gas price, 12% IRR.
Figure 20. Conventional and nuclear MED desalination, water price as a function of natural gas price, 12% IRR.
$0.00
$1.00
$2.00
$3.00
$4.00
$5.00
$6.00
$7.00
4.5 5.5 6.5 7.5 8.5 9.5 10.5 11.5 12.5 13.5
Wat
er P
rice
-($
/m3)
Natural Gas Price ($/MSCF)
RO - HTGR RO - Conventional
$0.00
$1.00
$2.00
$3.00
$4.00
$5.00
$6.00
$7.00
$8.00
$9.00
$10.00
4.5 5.5 6.5 7.5 8.5 9.5 10.5 11.5 12.5 13.5
Wat
er P
rice
-($
/m3)
Natural Gas Price ($/MSCF)
MED - HTGR MED - Conventional
Form 412.09 (Rev. 10)
Idaho National Laboratory
INTEGRATION OF HTGRS AND
SEAWATER DESALINATION
Identifier: Revision: Effective Date:
TEV-1302
0
08/17/2011 Page: 32 of 48
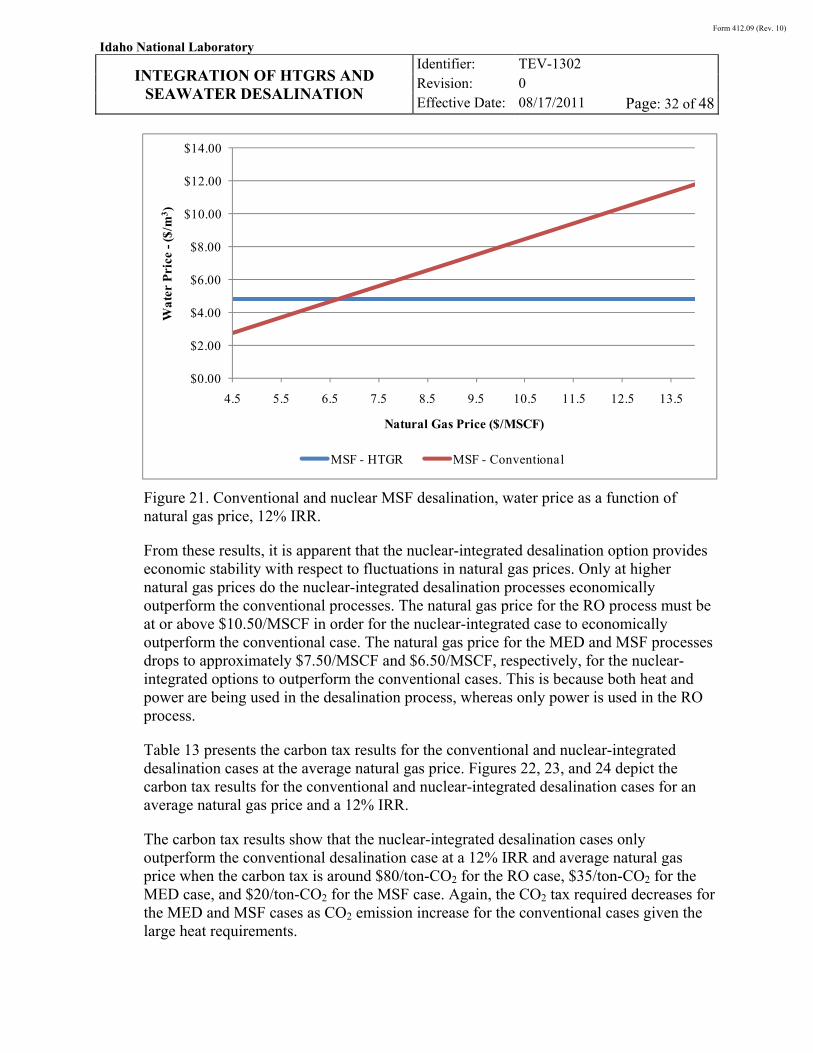
Figure 21. Conventional and nuclear MSF desalination, water price as a function of natural gas price, 12% IRR.
From these results, it is apparent that the nuclear-integrated desalination option provides economic stability with respect to fluctuations in natural gas prices. Only at higher natural gas prices do the nuclear-integrated desalination processes economically outperform the conventional processes. The natural gas price for the RO process must be at or above $10.50/MSCF in order for the nuclear-integrated case to economically outperform the conventional case. The natural gas price for the MED and MSF processes drops to approximately $7.50/MSCF and $6.50/MSCF, respectively, for the nuclear-integrated options to outperform the conventional cases. This is because both heat and power are being used in the desalination process, whereas only power is used in the RO process.
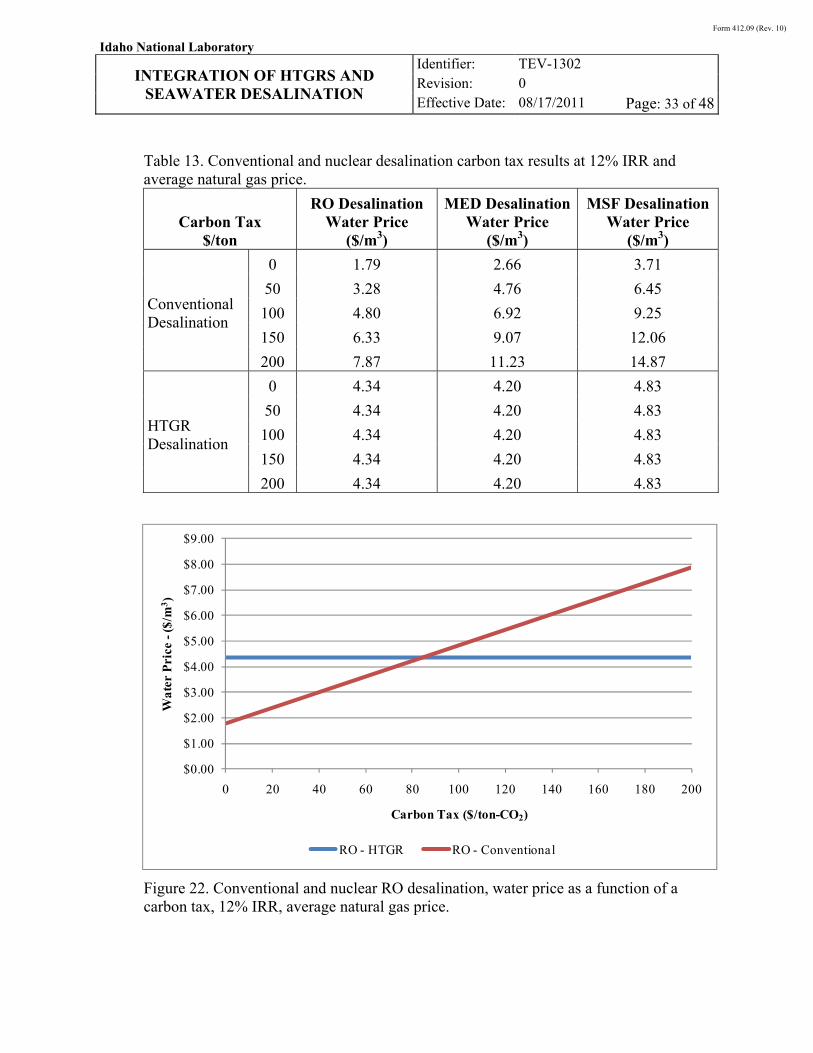
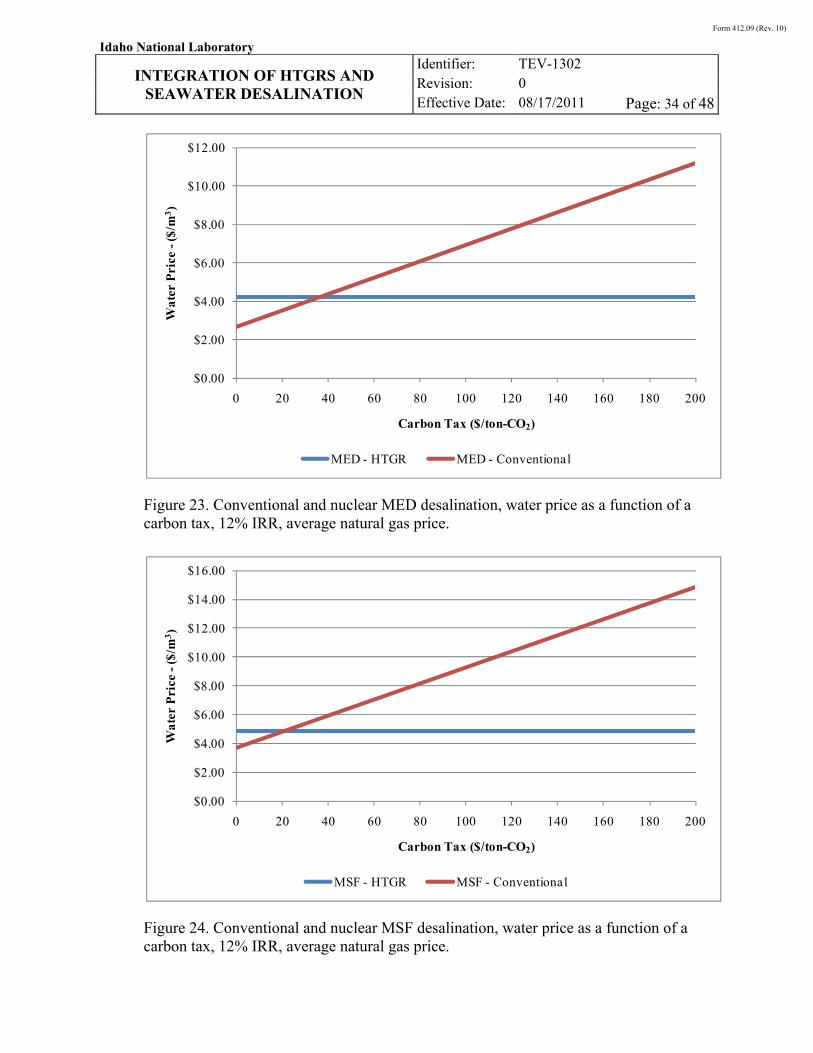
Table 13 presents the carbon tax results for the conventional and nuclear-integrated desalination cases at the average natural gas price. Figures 22, 23, and 24 depict the carbon tax results for the conventional and nuclear-integrated desalination cases for an average natural gas price and a 12% IRR.
The carbon tax results show that the nuclear-integrated desalination cases only outperform the conventional desalination case at a 12% IRR and average natural gas price when the carbon tax is around $80/ton-CO2 for the RO case, $35/ton-CO2 for the MED case, and $20/ton-CO2 for the MSF case. Again, the CO2 tax required decreases for the MED and MSF cases as CO2 emission increase for the conventional cases given the large heat requirements.
$0.00
$2.00
$4.00
$6.00
$8.00
$10.00
$12.00
$14.00
4.5 5.5 6.5 7.5 8.5 9.5 10.5 11.5 12.5 13.5
Wat
er P
rice
-($
/m3)
Natural Gas Price ($/MSCF)
MSF - HTGR MSF - Conventional
Form 412.09 (Rev. 10)
Idaho National Laboratory
INTEGRATION OF HTGRS AND
SEAWATER DESALINATION
Identifier: Revision: Effective Date:
TEV-1302
0
08/17/2011 Page: 33 of 48
Table 13. Conventional and nuclear desalination carbon tax results at 12% IRR and average natural gas price.
Carbon Tax $/ton
RO Desalination Water Price
($/m3)
MED Desalination Water Price
($/m3)
MSF DesalinationWater Price
($/m3)
Conventional Desalination
0 1.79 2.66 3.71
50 3.28 4.76 6.45
100 4.80 6.92 9.25
150 6.33 9.07 12.06
200 7.87 11.23 14.87
HTGR Desalination
0 4.34 4.20 4.83
50 4.34 4.20 4.83
100 4.34 4.20 4.83
150 4.34 4.20 4.83
200 4.34 4.20 4.83
Figure 22. Conventional and nuclear RO desalination, water price as a function of a carbon tax, 12% IRR, average natural gas price.
$0.00
$1.00
$2.00
$3.00
$4.00
$5.00
$6.00
$7.00
$8.00
$9.00
0 20 40 60 80 100 120 140 160 180 200
Wat
er P
rice
-($
/m3)
Carbon Tax ($/ton-CO2)
RO - HTGR RO - Conventional
Form 412.09 (Rev. 10)
Idaho National Laboratory
INTEGRATION OF HTGRS AND
SEAWATER DESALINATION
Identifier: Revision: Effective Date:
TEV-1302
0
08/17/2011 Page: 34 of 48
Figure 23. Conventional and nuclear MED desalination, water price as a function of a carbon tax, 12% IRR, average natural gas price.
Figure 24. Conventional and nuclear MSF desalination, water price as a function of a carbon tax, 12% IRR, average natural gas price.
$0.00
$2.00
$4.00
$6.00
$8.00
$10.00
$12.00
0 20 40 60 80 100 120 140 160 180 200
Wat
er P
rice
-($
/m3)
Carbon Tax ($/ton-CO2)
MED - HTGR MED - Conventional
$0.00
$2.00
$4.00
$6.00
$8.00
$10.00
$12.00
$14.00
$16.00
0 20 40 60 80 100 120 140 160 180 200
Wat
er P
rice
-($
/m3)
Carbon Tax ($/ton-CO2)
MSF - HTGR MSF - Conventional
Form 412.09 (Rev. 10)
Idaho National Laboratory
INTEGRATION OF HTGRS AND
SEAWATER DESALINATION
Identifier: Revision: Effective Date:
TEV-1302
0
08/17/2011 Page: 35 of 48
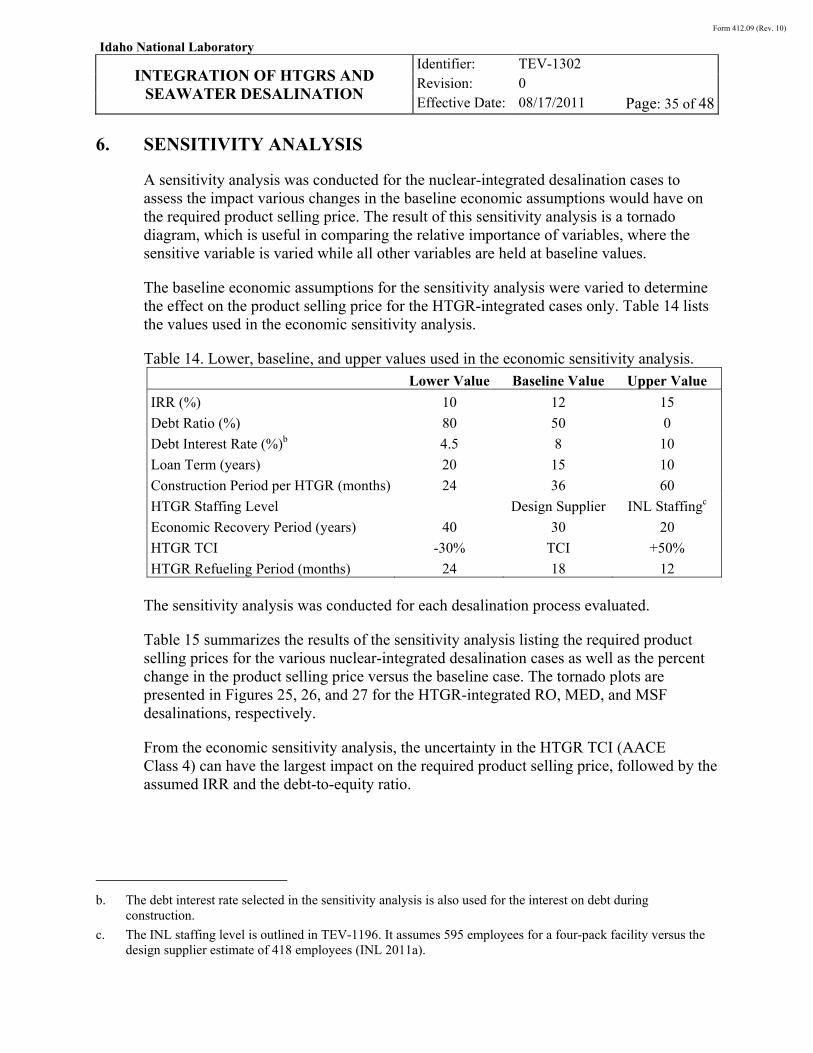
6. SENSITIVITY ANALYSIS
A sensitivity analysis was conducted for the nuclear-integrated desalination cases to assess the impact various changes in the baseline economic assumptions would have on the required product selling price. The result of this sensitivity analysis is a tornado diagram, which is useful in comparing the relative importance of variables, where the sensitive variable is varied while all other variables are held at baseline values.
The baseline economic assumptions for the sensitivity analysis were varied to determine the effect on the product selling price for the HTGR-integrated cases only. Table 14 lists the values used in the economic sensitivity analysis.
Table 14. Lower, baseline, and upper values used in the economic sensitivity analysis. Lower Value Baseline Value Upper Value
IRR (%) 10 12 15
Debt Ratio (%) 80 50 0
Debt Interest Rate (%)b 4.5 8 10
Loan Term (years) 20 15 10
Construction Period per HTGR (months) 24 36 60
HTGR Staffing Level Design Supplier INL Staffingc
Economic Recovery Period (years) 40 30 20
HTGR TCI -30% TCI +50%
HTGR Refueling Period (months) 24 18 12
The sensitivity analysis was conducted for each desalination process evaluated.
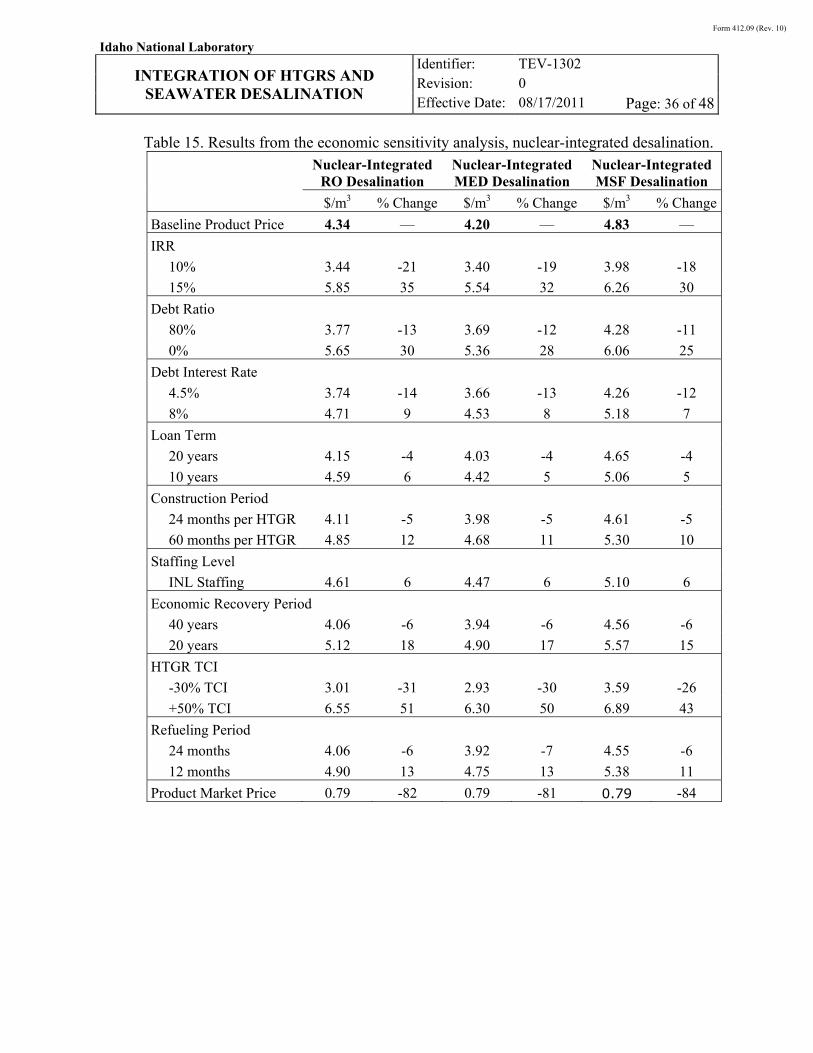
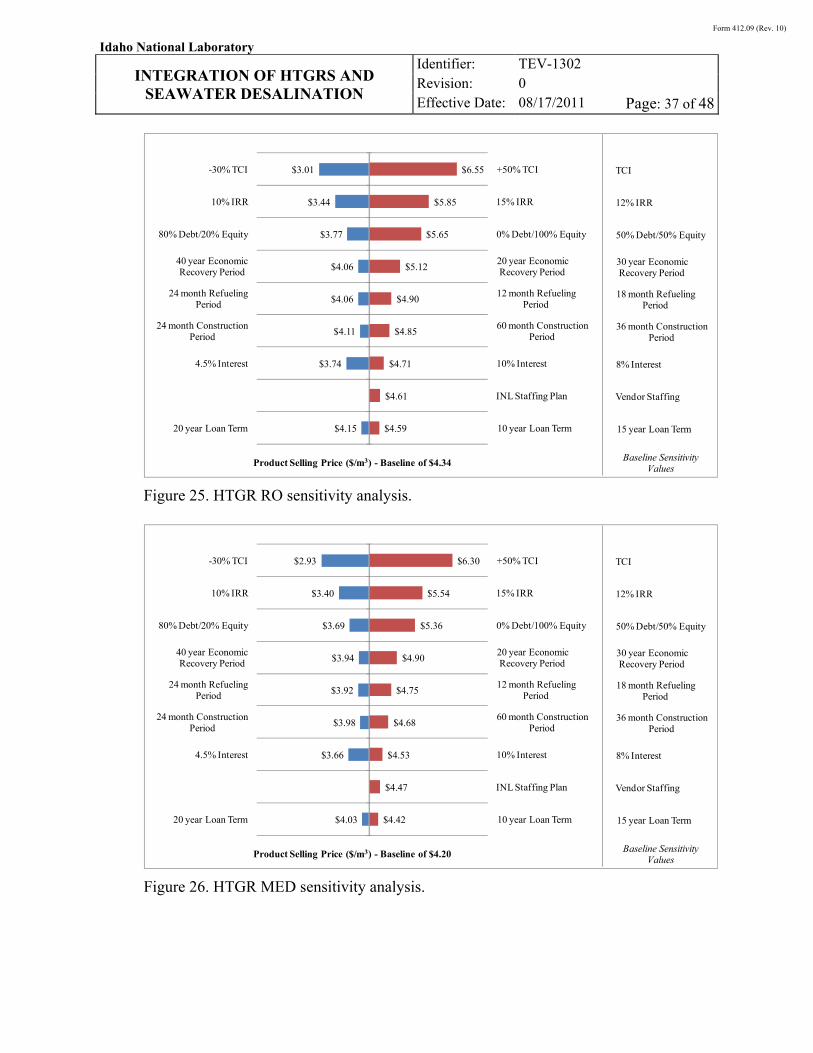
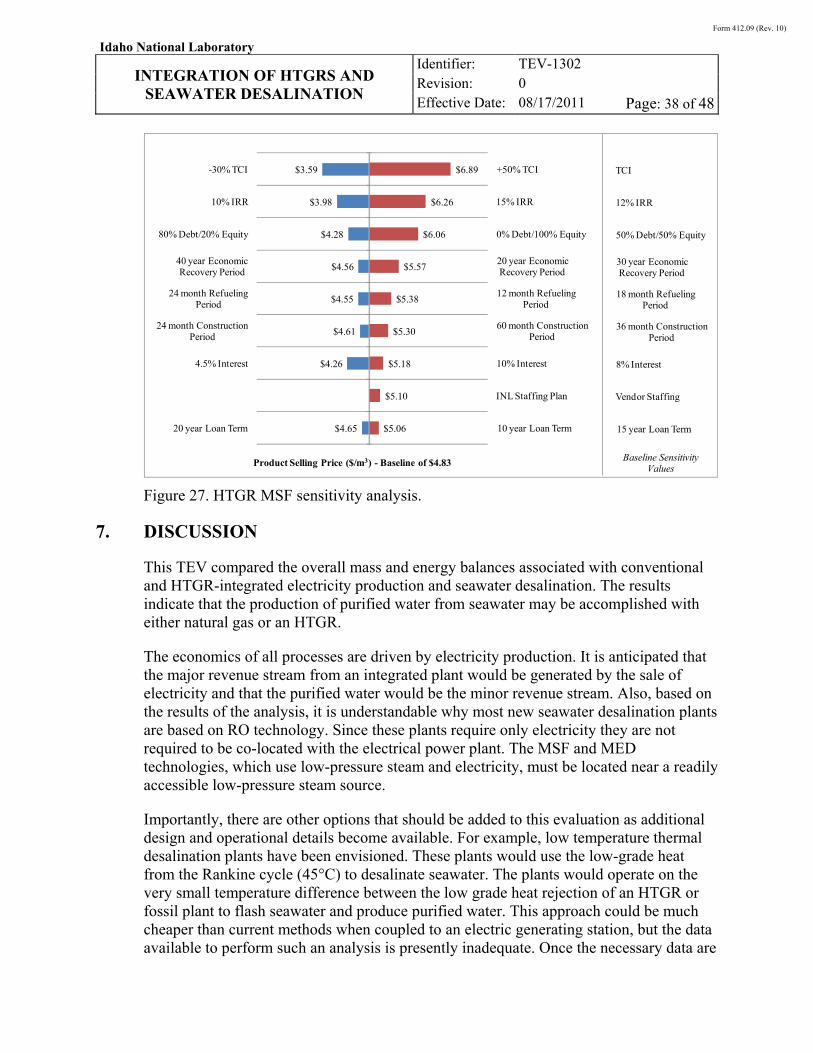
Table 15 summarizes the results of the sensitivity analysis listing the required product selling prices for the various nuclear-integrated desalination cases as well as the percent change in the product selling price versus the baseline case. The tornado plots are presented in Figures 25, 26, and 27 for the HTGR-integrated RO, MED, and MSF desalinations, respectively.
From the economic sensitivity analysis, the uncertainty in the HTGR TCI (AACE Class 4) can have the largest impact on the required product selling price, followed by the assumed IRR and the debt-to-equity ratio.
b. The debt interest rate selected in the sensitivity analysis is also used for the interest on debt during
construction.
c. The INL staffing level is outlined in TEV-1196. It assumes 595 employees for a four-pack facility versus the design supplier estimate of 418 employees (INL 2011a).
Form 412.09 (Rev. 10)
Idaho National Laboratory
INTEGRATION OF HTGRS AND
SEAWATER DESALINATION
Identifier: Revision: Effective Date:
TEV-1302
0
08/17/2011 Page: 36 of 48
Table 15. Results from the economic sensitivity analysis, nuclear-integrated desalination.
Nuclear-IntegratedRO Desalination
Nuclear-Integrated MED Desalination
Nuclear-IntegratedMSF Desalination
$/m3 % Change $/m3 % Change $/m3 % Change
Baseline Product Price 4.34 — 4.20 — 4.83 —
IRR
10% 3.44 -21 3.40 -19 3.98 -18
15% 5.85 35 5.54 32 6.26 30
Debt Ratio
80% 3.77 -13 3.69 -12 4.28 -11
0% 5.65 30 5.36 28 6.06 25
Debt Interest Rate
4.5% 3.74 -14 3.66 -13 4.26 -12
8% 4.71 9 4.53 8 5.18 7
Loan Term
20 years 4.15 -4 4.03 -4 4.65 -4
10 years 4.59 6 4.42 5 5.06 5
Construction Period
24 months per HTGR 4.11 -5 3.98 -5 4.61 -5
60 months per HTGR 4.85 12 4.68 11 5.30 10
Staffing Level
INL Staffing 4.61 6 4.47 6 5.10 6
Economic Recovery Period
40 years 4.06 -6 3.94 -6 4.56 -6
20 years 5.12 18 4.90 17 5.57 15
HTGR TCI
-30% TCI 3.01 -31 2.93 -30 3.59 -26
+50% TCI 6.55 51 6.30 50 6.89 43
Refueling Period
24 months 4.06 -6 3.92 -7 4.55 -6
12 months 4.90 13 4.75 13 5.38 11
Product Market Price 0.79 -82 0.79 -81 0.79 -84
Form 412.09 (Rev. 10)
Idaho National Laboratory
INTEGRATION OF HTGRS AND
SEAWATER DESALINATION
Identifier: Revision: Effective Date:
TEV-1302
0
08/17/2011 Page: 37 of 48
Figure 25. HTGR RO sensitivity analysis.
Figure 26. HTGR MED sensitivity analysis.
$4.15
$3.74
$4.11
$4.06
$4.06
$3.77
$3.44
$3.01
1.34 3.34
20 year Loan Term
4.5% Interest
24 month Construction Period
24 month Refueling Period
40 year Economic Recovery Period
80% Debt/20% Equity
10% IRR
-30% TCI
$4.59
$4.61
$4.71
$4.85
$4.90
$5.12
$5.65
$5.85
$6.55
0 1 2 3
10 year Loan Term
INL Staffing Plan
10% Interest
60 month Construction Period
12 month Refueling Period
20 year Economic Recovery Period
0% Debt/100% Equity
15% IRR
+50% TCI
Product Selling Price ($/m3) - Baseline of $4.34 0 10 20 30 40 50
15 year Loan Term
Vendor Staffing
8% Interest
36 month Construction Period
18 month Refueling Period
30 year Economic Recovery Period
50% Debt/50% Equity
12% IRR
TCI
Baseline Sensitivity Values
$4.03
$3.66
$3.98
$3.92
$3.94
$3.69
$3.40
$2.93
1.2 3.2
20 year Loan Term
4.5% Interest
24 month Construction Period
24 month Refueling Period
40 year Economic Recovery Period
80% Debt/20% Equity
10% IRR
-30% TCI
$4.42
$4.47
$4.53
$4.68
$4.75
$4.90
$5.36
$5.54
$6.30
0 1 2 3
10 year Loan Term
INL Staffing Plan
10% Interest
60 month Construction Period
12 month Refueling Period
20 year Economic Recovery Period
0% Debt/100% Equity
15% IRR
+50% TCI
Product Selling Price ($/m3) - Baseline of $4.20 0 10 20 30 40 50
15 year Loan Term
Vendor Staffing
8% Interest
36 month Construction Period
18 month Refueling Period
30 year Economic Recovery Period
50% Debt/50% Equity
12% IRR
TCI
Baseline Sensitivity Values
Form 412.09 (Rev. 10)
Idaho National Laboratory
INTEGRATION OF HTGRS AND
SEAWATER DESALINATION
Identifier: Revision: Effective Date:
TEV-1302
0
08/17/2011 Page: 38 of 48
Figure 27. HTGR MSF sensitivity analysis.
7. DISCUSSION
This TEV compared the overall mass and energy balances associated with conventional and HTGR-integrated electricity production and seawater desalination. The results indicate that the production of purified water from seawater may be accomplished with either natural gas or an HTGR.
The economics of all processes are driven by electricity production. It is anticipated that the major revenue stream from an integrated plant would be generated by the sale of electricity and that the purified water would be the minor revenue stream. Also, based on the results of the analysis, it is understandable why most new seawater desalination plants are based on RO technology. Since these plants require only electricity they are not required to be co-located with the electrical power plant. The MSF and MED technologies, which use low-pressure steam and electricity, must be located near a readily accessible low-pressure steam source.
Importantly, there are other options that should be added to this evaluation as additional design and operational details become available. For example, low temperature thermal desalination plants have been envisioned. These plants would use the low-grade heat from the Rankine cycle (45°C) to desalinate seawater. The plants would operate on the very small temperature difference between the low grade heat rejection of an HTGR or fossil plant to flash seawater and produce purified water. This approach could be much cheaper than current methods when coupled to an electric generating station, but the data available to perform such an analysis is presently inadequate. Once the necessary data are
$4.65
$4.26
$4.61
$4.55
$4.56
$4.28
$3.98
$3.59
1.83 3.83
20 year Loan Term
4.5% Interest
24 month Construction Period
24 month Refueling Period
40 year Economic Recovery Period
80% Debt/20% Equity
10% IRR
-30% TCI
$5.06
$5.10
$5.18
$5.30
$5.38
$5.57
$6.06
$6.26
$6.89
0 1 2 3
10 year Loan Term
INL Staffing Plan
10% Interest
60 month Construction Period
12 month Refueling Period
20 year Economic Recovery Period
0% Debt/100% Equity
15% IRR
+50% TCI
Product Selling Price ($/m3) - Baseline of $4.83 0 10 20 30 40 50
15 year Loan Term
Vendor Staffing
8% Interest
36 month Construction Period
18 month Refueling Period
30 year Economic Recovery Period
50% Debt/50% Equity
12% IRR
TCI
Baseline Sensitivity Values
Form 412.09 (Rev. 10)
Idaho National Laboratory
INTEGRATION OF HTGRS AND
SEAWATER DESALINATION
Identifier: Revision: Effective Date:
TEV-1302
0
08/17/2011 Page: 39 of 48
available, it is recommended that this process be evaluated and compared to the RO, MSF, and MED processes.
8. CONCLUSIONS AND RECOMMENDATIONS
This study concludes that both an NGCC power plant and an HTGR power plant are capable of supplying the electricity and steam needed to desalinate seawater, and that the economics of desalination in an integrated plant are highly dependent on the economics of electricity production.
The results obtained from this study are based on a seawater temperature of 30°C and a salinity of 30,000 mg/L (ppm). If a plant of significantly different temperature and salinity are desired, additional study would be required. However, since the economics of the process also depend on the economics of electricity generation, it is recommended that the market for electricity be considered when evaluating a potential location for water purification.
9. REFERENCES
AACE, 2005, Cost Estimate Classification System – As Applied in Engineering, Procurement, and Construction for the Process Industries, AACE International Recommended Practice No. 18R-97.
Demick, L., 2011, HTGR Cost Information, personal communications.
EIA, 2010, “Updated Capital Cost Estimates for Electricity Generation Plants,” U.S. Energy Information Administration, November 2010.
EIA, 2011a, Average Retail Price of Electricity to Ultimate Customers: Total by End-Use Sector (http://www.eia.doe.gov/cneaf/electricity/epm/table5_3.html), April 14–29, 2011.
EIA, 2011b, Electricity Explained: Factors Affecting Electricity Price (http://www.eia.gov/energyexplained/index.cfm?page=electricity_factors_affecting_prices), July 28, 2011.
EIA, 2011c, Monthly United States Natural Gas Industrial Price (http://www.eia.gov/dnav/ng/hist/n3035us3m.htm), June 29–July 6, 2011.
Excel 2007, Version 12.0, Redmond, Washington: Microsoft Corporation, 2007.
GIF, 2007, Cost Estimating Guidelines for Generation IV Nuclear Energy Systems, GIF/EMWG/2007/004, Rev. 4.2.
IAEA, 2007, IAEA-TECDOC-1524, “Status of Nuclear Desalination in IAEA Member States,” International Atomic Energy Agency, January 2007.
Form 412.09 (Rev. 10)
Idaho National Laboratory
INTEGRATION OF HTGRS AND
SEAWATER DESALINATION
Identifier: Revision: Effective Date:
TEV-1302
0
08/17/2011 Page: 40 of 48
IAEA, 2000, IAEA-TECDOC-1186, “Examining the Economics of Seawater Desalination Using the DEEP Code, International Atomic Energy Agency, November 2000.
INL, 2011a, “Assessment of High-Temperature Gas-Cooled (HTGR) Capital and Operating Costs,” Idaho National Laboratory, TEV-1196, Rev. 0, April 29, 2011.
INL, 2011b, “Sensitivity of HTGR Heat and Power Production to Reactor Outlet Temperature, Economic Analysis,” Idaho National Laboratory, TEV-988, Rev. 1, June 30, 2011.
Micale, G., A. Cipollina, and L. Rizzuti, “Seawater Desalination: Conventional and Renewable Energy Processes,” Springer-Verlag Berline Heidelbert, 2009.
NRC, 2010, Report of Waste Burial Charges: Changes in Decommissioning Waste Disposal Costs at Low-Level Waste Burial Facilities, NUREG-1307, Rev. 14.
NUS Consulting, 2008, Average Water Costs Increase by 7.3% (http://www.marketwire.com/press-release/Average-US-Water-Costs-Increase-by-73-903477.htm), September 24, 2008–June 30, 2011.
Ophir, A. and Lokiec, F., “Advanced MED Process for Most Economical Sea Water Desalination,” Desalination 182, pp. 187-198, 2005.
Perry, R.H., and D.W. Green, 2008, Perry’s Chemical Engineers’ Handbook (8th Edition), New York: McGraw Hill.
Sullivan, W.G., E.M. Wicks, and J.T. Luxhoj, 2003, Engineering Economy. Upper Saddle River: Printice Hall.
USBR, 2003, “Design Handbook for Planners: Desalination and Water Purification Research and Development Program,” U.S. Department of the Interior Bureau of Reclamation, Report No. 72, 3rd Edition, July 2003.
Wilf, M., 2007, “Desalination,” Kirk-Othmer Encyclopedia of Chemical Technology, New York: John Wiley & Sons.
10. APPENDIXES
Appendix A, Mass and Energy Balance Calculations for Reverse Osmosis, Multi-stage Flash Distillation, and Multiple Effect Distillation
Appendix B, Power Cycle Efficiency and Carbon Dioxide Emissions Calculations
Appendix C, HYSYS Runs – Power Cycle Efficiencies for NGCC and HTGR Powered Rankine Cycles
Form 412.09 (Rev. 10)
Idaho National Laboratory
INTEGRATION OF HTGRS AND
SEAWATER DESALINATION
Identifier: Revision: Effective Date:
TEV-1302
0
08/17/2011 Page: 41 of 48
Appendix D, Fossil and HTGR Integration with RO, MSF, and MED Calculations
Form 412.09 (Rev. 10)
Idaho National Laboratory
INTEGRATION OF HTGRS AND
SEAWATER DESALINATION
Identifier: Revision: Effective Date:
TEV-1302
0
08/17/2011 Page: 42 of 48
Appendix A
Mass and Energy Balance Calculations for Reverse Osmosis, Multi-Stage Flash Distillation, and Multiple Effect Distillation
The overall mass and energy balance calculations for RO, MSF, and MED are based on a purified water production rate of 400,000 m3/day. The assumptions used to complete these calculations are presented in Table 2 in the main body of this Technical Evaluation (TEV). The calculations are shown in separate sections for RO, MSF, and MED.
RO
The RO plant requires only electricity and seawater. Based on the assumptions provided in Table 2 the amount of electricity needed to produce purified water from seawater is 4 kWe hr/m3. The amount of electricity required to support a 100,000 m3/day plant is calculated as
400,000 4
,
66.7 . (A-1)
MSF
The MSF plant requires both electricity and steam. The electricity needs of the plant are calculated from the value provided in Table 2 for the MSF plant, 3 kWe hr/m3 as
400,000 3 ,
50 . (A-2)
The steam needs of the MSF plant are calculated from the GOR of 8.85 kg purified water per kg of steam (saturated steam at 110°C) as
400,000 1
. ,
4.58 10 / . (A-3)
For the Rankine cycle associated with the MSF plant, this means that 4.58 107 kg steam/day would be removed from the low pressure turbine. In order to simplify the analysis, the overall size of the fossil and high temperature gas-cooled reactor (HTGR) plants was sized to generate the required amount of steam, 4.58 107 kg steam/day.
MED
The MED plant requires both electricity and steam. Based on the value provided in Table 2, 2 kWe hr/m3, the electricity needs of the MED plant are calculated as
400,000 2 ,
33.3 . (A-4)
Form 412.09 (Rev. 10)
Idaho National Laboratory
INTEGRATION OF HTGRS AND
SEAWATER DESALINATION
Identifier: Revision: Effective Date:
TEV-1302
0
08/17/2011 Page: 43 of 48
The steam needs of the MED plant are calculated from the GOR of 12.2 kg purified water/kg steam (saturated steam at 110°C) as
400,000
. ,
3.57 10 / . (A-5)
For the Rankine cycle associated with the MED plant, this means that 3.57 107 kg steam/day would be removed from the low pressure turbine. In order to simplify the analysis, the overall size of the natural gas and HTGR plants was sized to generate the required amount of steam, 3.57 107 kg steam/day.
Form 412.09 (Rev. 10)
Idaho National Laboratory
INTEGRATION OF HTGRS AND
SEAWATER DESALINATION
Identifier: Revision: Effective Date:
TEV-1302
0
08/17/2011 Page: 44 of 48
Appendix B
Power Cycle Efficiency and Carbon Dioxide Emissions Calculations
Power Cycle Efficiency
Power cycles considered in this Technical Evaluation (TEV) include the Rankine cycle for the high temperature gas-cooled reactor (HTGR) and the natural gas combined cycle (NGCC). The Rankine cycle model used for calculating overall thermal efficiencies is based on the cycle presented in “Steam, Its Generation and Use – Edition 41.” (see Figure 10 on page 2-18). This cycle consists of high-, intermediate-, and low-pressure turbines. The highest steam pressure in this cycle is 24 MPa (3,481 psi) and the highest steam temperature is 593°C (1,099°F). The HYSYS calculations were scaled to utilize 600 MW(t) of heat produced by an HTGR. With these conditions, the flow rate of the lowest pressure steam (saturated steam at a temperature of 110°C) in the final turbine of the Rankine cycle is 159.7 kg/sec (174.9 kg/sec * 0.9131 = 159.7 kg/sec – see HYSYS calculations presented in Appendix C). This steam is a reasonable selection for use in the MSF or MED process.
Based on calculation performed using HYSYS, the overall thermal efficiency of the HTGR-integrated Rankine power cycle was calculated to be 43% (see HYSYS calculations presented in Appendix C), and 600 MW(t) of nuclear heat would generate 258 MW(e). Similarly, the efficiency of the NGCC process was calculated to be 49.77% and 600 MW(t) would generate 299 MW(e).
HYSYS calculations were used to estimate the overall thermal efficiency of the HTGR-based Rankine cycles if some or all of the low pressure steam was removed from the final steam turbine. The results of the analysis are presented in Table B.1. As the amount of steam removed from the low-pressure turbine increases, the overall power cycle efficiency decreases. In order to simplify the analysis, the heat provided to the power cycle was scaled to generate the exact amount of low-pressure steam needed to support the MSF and MED processes. In other words, the overall power cycle efficiency for RO is assumed to be 41%, and the electrical efficiency for MED and MSF is assumed to be 32.4%, since these two processes use low-pressure steam from the Rankine power cycle.
Table B-1. Overall thermal efficiencies of a subcritical 600 MW(t) Rankine power cycle as low-pressure steam is removed from the final low-pressure turbine.
Description
Flow Rate of Steam Removed from Low-Pressure Turbine
(kg/second) Overall Power Cycle
Efficiency
No low-pressure steam removed from Rankine cycle
0 43%
100% of low-pressure steam (saturated steam at 110°C) removed from Rankine cycle
159.7 34.16%
Form 412.09 (Rev. 10)
Idaho National Laboratory
INTEGRATION OF HTGRS AND
SEAWATER DESALINATION
Identifier: Revision: Effective Date:
TEV-1302
0
08/17/2011 Page: 45 of 48
The overall thermal efficiency for generating electricity in the NGCC plant is 49.77%. This high efficiency is attained by operating a gas turbine in the natural gas combustion chamber and utilizing the steam generated in the combustion chamber to generate power in a Rankine cycle to generate electricity as shown in Figure 6 in the main body of this TEV. Based on HYSYS calculations, the gas turbine in an NGCC plant has a thermal efficiency of 33.63%. The Rankine cycle of the NGCC plant has a thermal efficiency of 16.14% for a combined overall efficiency of 49.77%. It assumed that all the steam, generated by the hot combustion gas leaving the turbine, generates low-pressure steam (saturated steam at 110°C) that is utilized by the MED and MSF distillation processes. The flow rate of steam for a 600 MW(t) NGCC plant is 147.2 kg/sec (1.27 107 kg/day). If this steam is used/removed from the steam cycle, the thermal efficiency of the Rankine cycle portion of the NGCC is reduced from 16% to 16 32.4/41 = 12.6% and the overall thermal efficiency of the NGCC plant is 32 + 12.6 = 44.6%.
Fuel Consumption and Carbon Dioxide Emissions Calculations
The estimated carbon dioxide emissions from the natural gas fired plant were performed in HYSYS. The results of the calculations are shown in Appendix C.
HTGR – Fuel Use and Carbon Dioxide Emission Calculations
The quantity of fuel required to support HTGR operations was estimated based on information presented in the General Atomics Pre-Conceptual Design. The information presented in this report is based on a prismatic reactor. Additional study would be required to develop estimates for the pebble bed concept.
The prismatic reactor fuel is described in the General Atomics Conceptual Design Report for the SC-MHR. The fuel itself is compressed into cylindrical compacts that are loaded into graphite blocks. The amount of fuel required is based on actual uranium fuel and the amount of waste generated is based on the carbon block/fuel combination. This is why the volume of waste produced is significantly greater than the amount of fuel provided. The calculation is based on the following factors: (1) the mass of uranium per fuel element of 4.425 kg/fuel element, (2) 510 fuel elements replaced during refueling, and 3) refueling occurs every 530 days.
For a 600 MW(t) reactor, the amount of fuel used per day is
4.425
4.26 / (B-1)
For the purposes of this report, it is assumed that the uranium is converted to heavy metal waste with the same mass as the uranium fed to the process.
It is assumed that there are no carbon dioxide emissions from HTGR-integrated processes.
Form 412.09 (Rev. 10)
Idaho National Laboratory
INTEGRATION OF HTGRS AND
SEAWATER DESALINATION
Identifier: Revision: Effective Date:
TEV-1302
0
08/17/2011 Page: 46 of 48
Appendix C
HYSYS Runs—Power Cycle Efficiencies for Natural Gas Combined Cycle and High Temperature Gas-cooled Reactor Powered Rankine Cycles
Electronic files in this appendix attached to native file.
Form 412.09 (Rev. 10)
Idaho National Laboratory
INTEGRATION OF HTGRS AND
SEAWATER DESALINATION
Identifier: Revision: Effective Date:
TEV-1302
0
08/17/2011 Page: 47 of 48
Appendix D
Fossil and High Temperature Gas-cooled Reactor Integration with Reverse Osmosis, Multi-Stage Flash Distillation, and Multi-Effect Distillation
Calculations
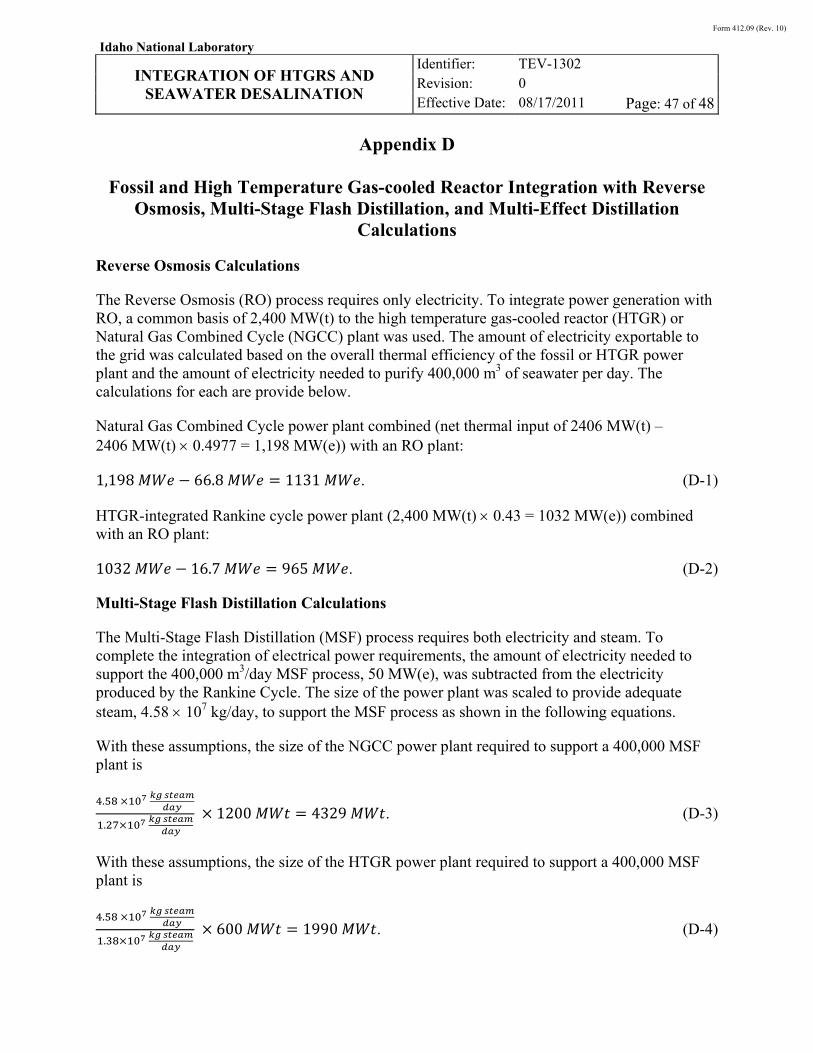
Reverse Osmosis Calculations
The Reverse Osmosis (RO) process requires only electricity. To integrate power generation with RO, a common basis of 2,400 MW(t) to the high temperature gas-cooled reactor (HTGR) or Natural Gas Combined Cycle (NGCC) plant was used. The amount of electricity exportable to the grid was calculated based on the overall thermal efficiency of the fossil or HTGR power plant and the amount of electricity needed to purify 400,000 m3 of seawater per day. The calculations for each are provide below.
Natural Gas Combined Cycle power plant combined (net thermal input of 2406 MW(t) – 2406 MW(t) 0.4977 = 1,198 MW(e)) with an RO plant:
1,198 66.8 1131 . (D-1)
HTGR-integrated Rankine cycle power plant (2,400 MW(t) 0.43 = 1032 MW(e)) combined with an RO plant:
1032 16.7 965 . (D-2)
Multi-Stage Flash Distillation Calculations
The Multi-Stage Flash Distillation (MSF) process requires both electricity and steam. To complete the integration of electrical power requirements, the amount of electricity needed to support the 400,000 m3/day MSF process, 50 MW(e), was subtracted from the electricity produced by the Rankine Cycle. The size of the power plant was scaled to provide adequate steam, 4.58 107 kg/day, to support the MSF process as shown in the following equations.
With these assumptions, the size of the NGCC power plant required to support a 400,000 MSF plant is
.
. 1200 4329 . (D-3)
With these assumptions, the size of the HTGR power plant required to support a 400,000 MSF plant is
.
. 600 1990 . (D-4)
Form 412.09 (Rev. 10)
Idaho National Laboratory
INTEGRATION OF HTGRS AND
SEAWATER DESALINATION
Identifier: Revision: Effective Date:
TEV-1302
0
08/17/2011 Page: 48 of 48
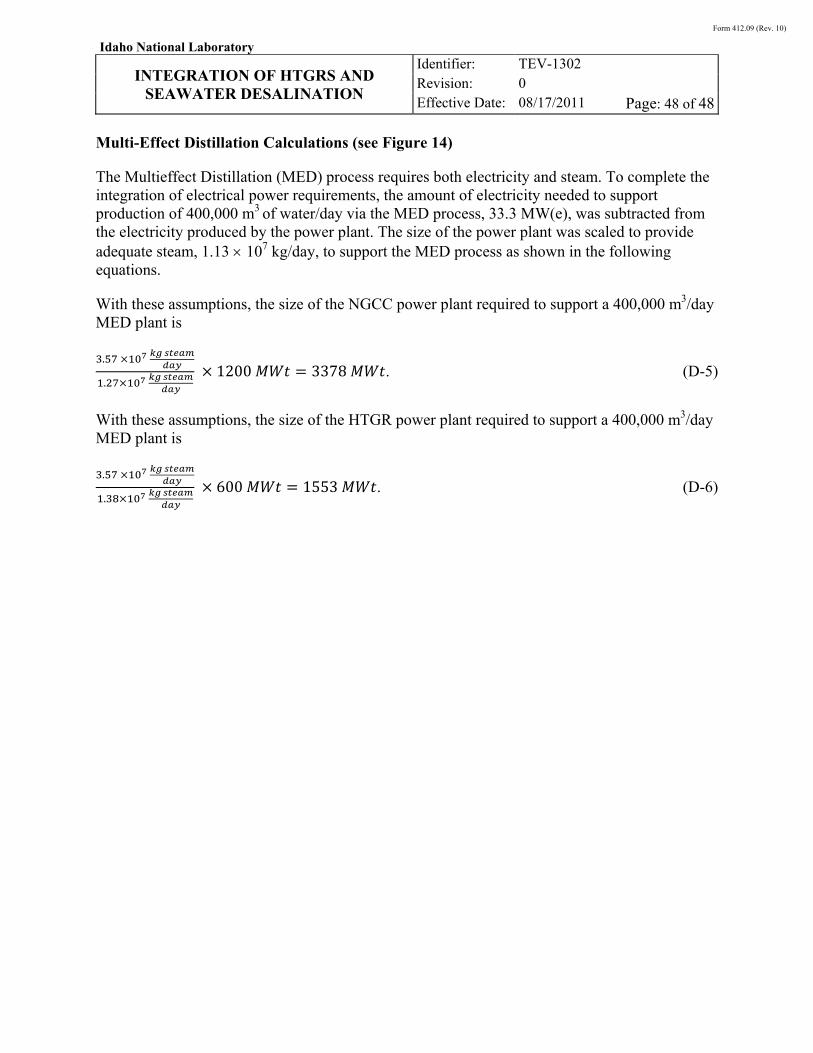
Multi-Effect Distillation Calculations (see Figure 14)
The Multieffect Distillation (MED) process requires both electricity and steam. To complete the integration of electrical power requirements, the amount of electricity needed to support production of 400,000 m3 of water/day via the MED process, 33.3 MW(e), was subtracted from the electricity produced by the power plant. The size of the power plant was scaled to provide adequate steam, 1.13 107 kg/day, to support the MED process as shown in the following equations.
With these assumptions, the size of the NGCC power plant required to support a 400,000 m3/day MED plant is
.
. 1200 3378 . (D-5)
With these assumptions, the size of the HTGR power plant required to support a 400,000 m3/day MED plant is
.
. 600 1553 . (D-6)