integrated science for global disasters and resilience · integrated science for global disasters...
TRANSCRIPT

Integrated Science for Global Disasters and Resilience
By Professor Liaquat Hossain Presentation at Charles Darwin University Darwin, NT, Australia 23rd May 2017
Outline of the Presentation
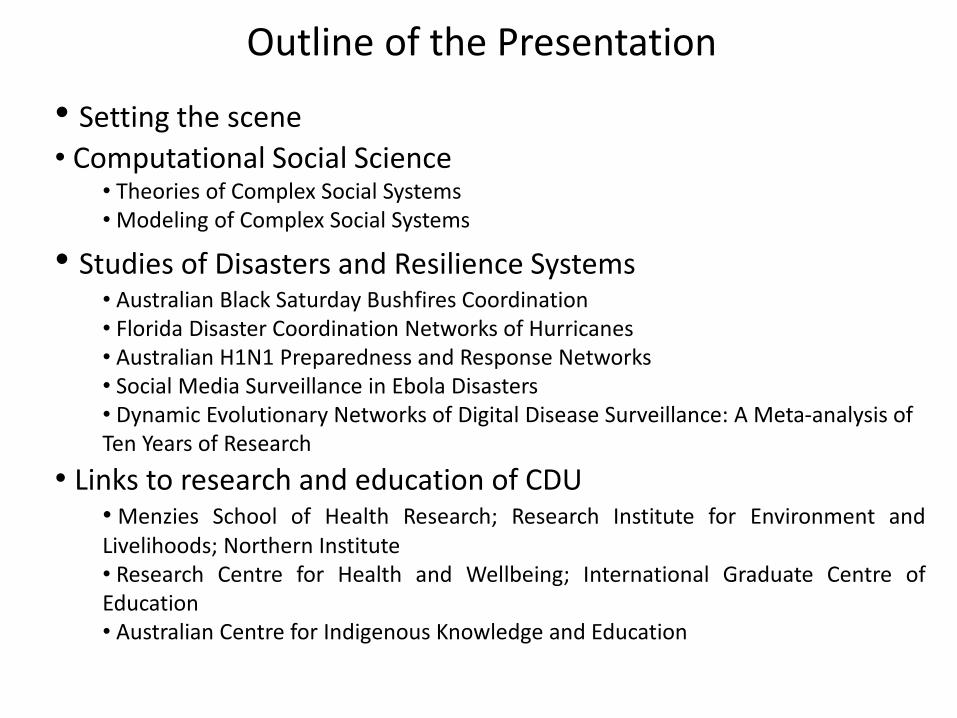
• Setting the scene
• Computational Social Science • Theories of Complex Social Systems • Modeling of Complex Social Systems
• Studies of Disasters and Resilience Systems • Australian Black Saturday Bushfires Coordination • Florida Disaster Coordination Networks of Hurricanes • Australian H1N1 Preparedness and Response Networks • Social Media Surveillance in Ebola Disasters • Dynamic Evolutionary Networks of Digital Disease Surveillance: A Meta-analysis of Ten Years of Research
• Links to research and education of CDU • Menzies School of Health Research; Research Institute for Environment and Livelihoods; Northern Institute • Research Centre for Health and Wellbeing; International Graduate Centre of Education • Australian Centre for Indigenous Knowledge and Education
Globally Networked Systems
Societies and organisations need better ways to respond to sudden risk that may emerge from multiple sources which are interconnected and interdependent (Helbing, 2013:Globally networked risks and how
to respond, Nature, 2 May, 51-59)

Organic and Networked organizations are like
4
Parts fit in many ways Organic Networkeduild
Network as organising model

Computational Social Science
• “Social phenomena are less about the behavior of individuals than of collections of individuals in groups, crowds, organizations, markets, classes, and even entire societies, all of which interact with each other via networks of information and influence, which in turn change over time” (Watts and Strogatz, 1998).
• Computing revolution of the past two decades with increased speed and memory for collecting and analyzing large scale social data has the potential to revolutionize traditional social science, leading to a new paradigm of “computational social science” (Lazer et al., 2009).
Watts, D. J., & Strogatz, S. H. (1998). Collective dynamics of ‘small-world’networks. Nature, 393(6684), 440-442. Lazer, D., Pentland, A. S., Adamic, L., Aral, S., Barabasi, A. L., Brewer, D., ... & Jebara, T. (2009). Life in the network: the coming age of computational social science. Science , 323(5915), 721.

6
Complex Social Systems
• Real-world systems are made up
from a large number of interacting &
interdependent components which
leads to:
• complex behavior, which is
difficult to understand, predict
and manage;
• Show emergence (behavior that is
more than a sum of the parts of the
system alone) and self-organization
(there is no external controller).
http://setandbma.wordpress.com/2012/0
3/05/agile-self-organizing-team/
Approach to science which investigates how relationships between
parts give rise to collective behaviour of a system and how system
interacts and forms relationship with its environment

7
Complex Social Systems
• Observations of interaction networks in health, life, engineering,
physical and biological sciences suggest that the key functional
properties of these networks are the:
• flow of information they can support;
• robustness of the flow to node failure; and,
• efficiency of the network
• Studies have also shown that certain network designs perform
better than others in each of these respects.

The first ‘social physicist’? and emergence of social physics
Thomas Hobbes
1588-1679
Leviathan (1651)

Theories of Complex Social Systems
• Social Physics (Stewart, 1950;
Pentland, 2014 )
• Mathematical Model for Group Structures (Bavelas, 1950)
• Social Capital (Coleman, 1966)
• Strengths of Ties (Granovetter,
1973)
• Network Exchange Theory (Willer, 1988)
• Network Governance (Borgatti,
1997)
• Structural Holes and Bridges (Burt, 2009)

Theories of Complex Social Systems • Immune Network Theory (Jerne, 1974)
• Preferential Attachment Theory (Newman, 2001)
• Link Prediction (Liben-Nowell & Klienberg, 2007)
• Statistical Phys of Social Dynamics (Castellano,
et. al., 2009)
• Socio-medical systems and network science (Christakis & Fowler, 2007: NEJM)
• Digital disease detection (Brownstein et al, 2009: NEJM)
New Theoretical Work:
Social and Organizational Immune Network Theory (working on
theoretical directions which deals with learning, complexities, resilience)
Integrated Science for Complex Emergencies (working on new theoretical
and experimental directions combing Network Science, Neuroscience: Cognitive
and Behavioural Neuroscience, Experimental Physiology )

11
Modeling Complex Social Systems
• A set of actors & links between those actors
• The study of relationships between people
• Focus on measuring the
interactions to determine specific outcomes
• Allows for a prediction or
forecast based on network behaviour
• Insight into how and why information travels
• Insight into relationships and the quality and necessity of ties
0
1
2
3
4
5
6
7
8
1954 1956 1958 1960 1962 1964 1966 1968 1970 1972 1974 1976 1978 1980 1982 1984 1986 1988 1990 1992 1994 1996 1998 2000 2002 2004
Year
Nu
mb
er o
f P
ap
ers P
ub
lish
ed
Internet
Social Capital
Terrorism
Urban &
CommunityFamily, Kinship
& FriendshipOrganisations
Delinquincy
Diffusion
Social Support
Infection &
DiseasesHealth
12
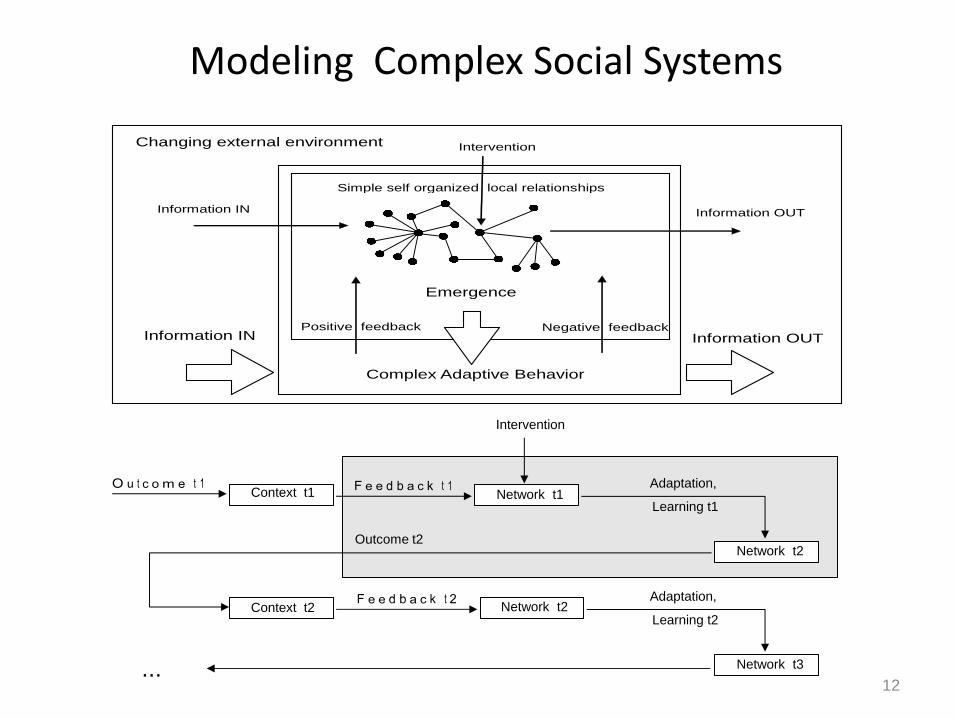
Modeling Complex Social Systems
Emergence
Changing external environment
Complex Adaptive Behavior
Information IN Information OUT
Simple self organized local relationships
Information IN Information OUT
Positive feedback Negative feedback
Intervention
Adaptation,
Outcome t2
...
Context t2
Context t1 Network t1
Network t2
Network t2
Network t3
Learning t2
Adaptation,
Learning t1
Intervention
13
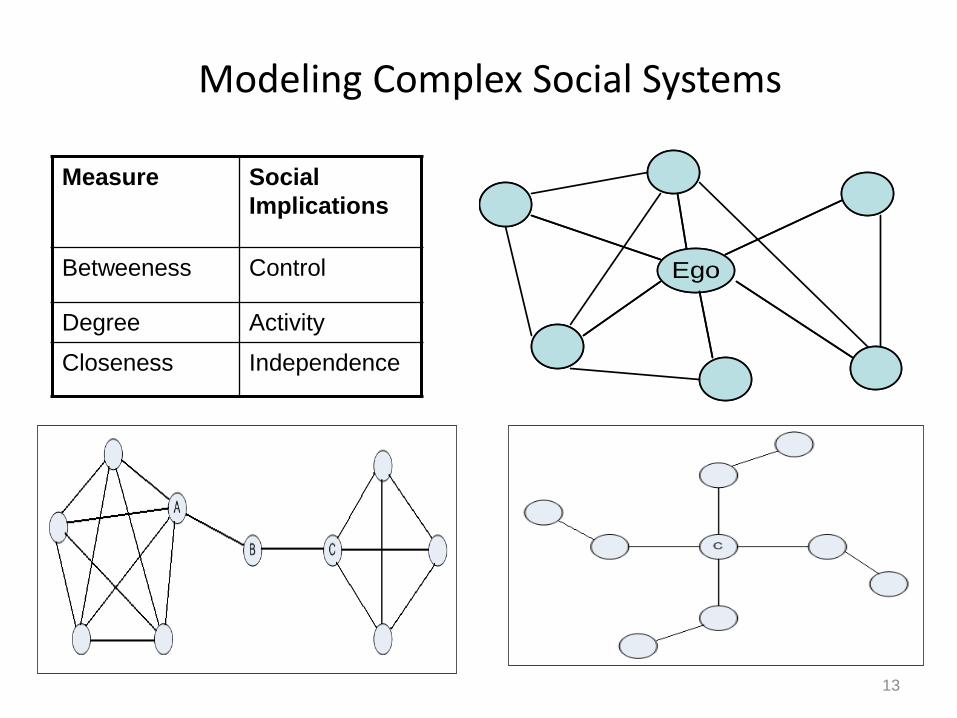
Modeling Complex Social Systems
Measure Social
Implications
Betweeness Control
Degree Activity
Closeness Independence
EgoEgo
14
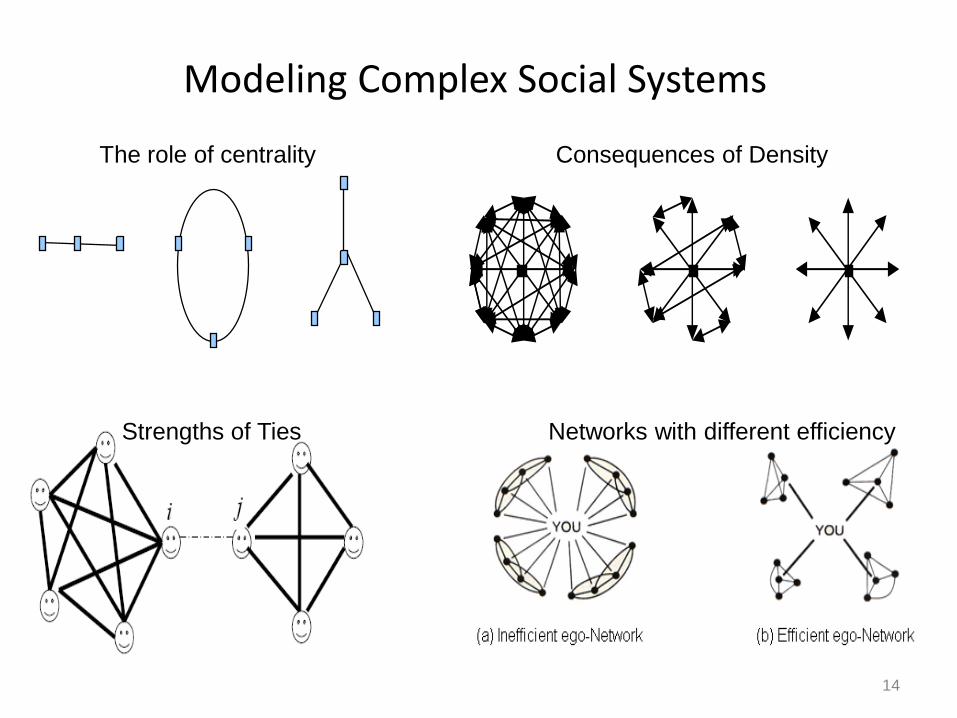
Modeling Complex Social Systems
The role of centrality Consequences of Density
Strengths of Ties Networks with different efficiency

Predicting Links in Complex Social Systems
15 Feczak, S., Hossain, L., and Carlsson, S (2013) “Complex Adaptive Information Flow and Search Transfer,” Knowledge Management Research & Practice, doi: 10.1057/kmrp.2012.47.

Overlapping Community Detection
• Individuals in a social network are described by memberships in more than one communities i.e., overlap between communities
• Interpret the global organization of such networks as the coexistence of their structural subunits (communities) associated with more highly interconnected parts.
Amiri, B., Hossain, L., Crawford, J.W., and Wigand, R. T. (2013) “Toward a Multi-objective Enhanced Firefly Algorithm for Community Detection in Complex Networks”, Knowledge-Based Systems, 46, 1-11.

17
Localized Structure within Globalized Complex Systems
› ERG models are probabilistic models that are presented by locally determined explanatory variables and can effectively identify structural properties of networks.
› This theory-driven modeling approach allows us to test the significance of structural parameters in the process of the formation of a given network.
› It simplifies a complex structure down to a combination of basic parameters such as 2-star, 3-star, and triangle.
› It is very general and scalable as the architecture of the graph is represented by locally determined explanatory variables.
Density or Edge (θ)
Two-Star (σ2)
Three-Star (σ3)
Triangle (τ)
Alt-K-Stars (AS)
Alt-K-Triangles (AT)
Alt-K-2-Paths (A2P)
Hossain, L., et al. (2015) “Exponential Random Graph Modeling of Emergency Collaboration Network”, Knowledge Based Systems, 77, 68- 79. Uddin, S., Hossain, L., et al (2013) “A study of physician collaborations through social network and exponential random graph”, BMC Health Services Research 2013, 13:234 . Uddin, S., Hamra, J., & Hossain, L. (2013). “Exploring communication networks to understand organizational crisis using exponential random graph models”, Computational & Mathematical Organization Theory, 1-17.

Disaster Network Science
• Deals with the study of disaster preparedness and response networks by integrating theories and methods drawn from diverse disciplines such as:
– social and behavioural, biological, physical, natural and computing and information sciences
• Integrate social sciences and humanities aspect to ensure an appreciation of experience, values, community participation in design, response and recovery of global disasters and resilience.
Hossain, L., & Feng, S. (2016). Disaster network science: research and applications. Frontiers in Communication, 1, 1.

Resilience
• Ability to succeed, to live, and to develop in a positive way dynamically despite the stress or adversity that would normally involve the real possibility of a negative outcome (Cyrulnik B. Resilience.
London: Penguin 2009)
• Links observations of how people cope with chronic pain with how communities assist with resilience (Zautra AJ, Hall JS, Murray KE.
Resilience: a new definition of health for people and communities. In: Zautra AJ, Hall JS, Murray KE, eds. Handbook of Adult Resilience. London; New York, NY: Guilford Press 2010;3–34)
• Disaster resilience is the ability to cope with external stresses and disturbances as a result of social, political and environmental change.

Within the context of Global Disasters and Resilience, I have been exploring ...
• Formation and adaptation process of hierarchical, non hierarchical, emerging and self organized structures in global disasters and resilience.
• Preparedness and response to natural and bio-related disasters through hybrid information networks combining hierarchical coordinating systems with the knowledge of community-based emerging ad hoc networks.
• Multi jurisdictional coordinating systems as well as access and sharing of locally situated knowledge through cultivation of community-based ad hoc networks.
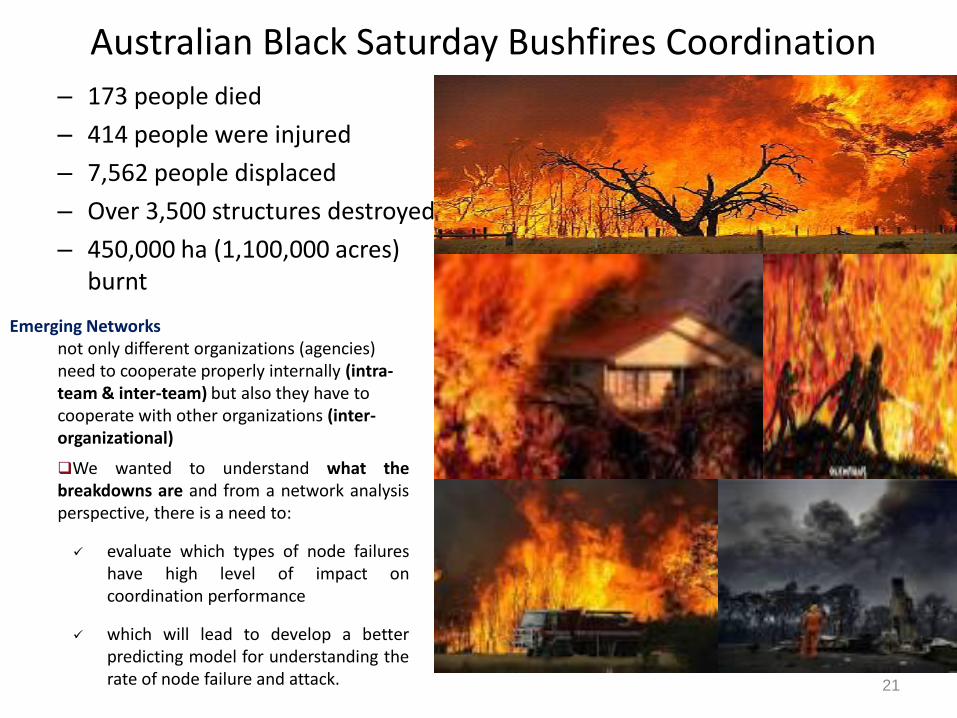
Australian Black Saturday Bushfires Coordination
21
– 173 people died
– 414 people were injured
– 7,562 people displaced
– Over 3,500 structures destroyed
– 450,000 ha (1,100,000 acres) burnt
Emerging Networks
not only different organizations (agencies) need to cooperate properly internally (intra-team & inter-team) but also they have to cooperate with other organizations (inter-organizational)
We wanted to understand what the breakdowns are and from a network analysis perspective, there is a need to:
evaluate which types of node failures have high level of impact on coordination performance
which will lead to develop a better predicting model for understanding the rate of node failure and attack.
22
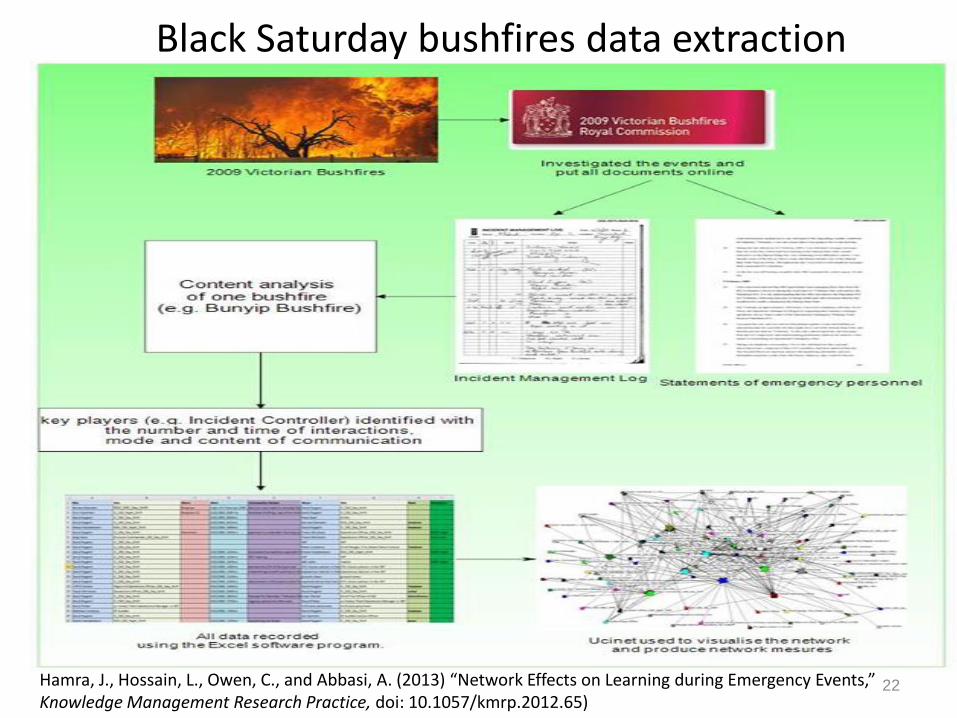
Black Saturday bushfires data extraction
Hamra, J., Hossain, L., Owen, C., and Abbasi, A. (2013) “Network Effects on Learning during Emergency Events,” Knowledge Management Research Practice, doi: 10.1057/kmrp.2012.65)

Organizing Fire Coordination Dataset
23

Rural Fire Coordination Network
24 Abbasi, A., Owen, C., Hossain, L., and Hamra, J. (2013) Social Networks Perspective of Firefighters Job Satisfaction and Adaptive Behaviour on Coordination, Fire Safety Journal, 59, p30-36

25
Sample scores related to network measures

T1 T1-T2 T1-T3 T1-T4
# of Actors 43 59 78 104 # of Interactions (Links) 73 153 213 286
Density 0.04 0.045 0.036 0.027 Diameter (Average Path) 1.921 2.559 2.58 2.776
Clustering Coefficient 0.342 0.469 0.6 0.69
# of Components 3 1 1 1
The Giant Component Size 38 59 78 104
Network Centralization (%)
Degree (undirected) 49.59 41.2 30.72 23.82
In-Degree 5.02 3.04 2.46 3.34
Out-Degree 10.39 7.43 5.18 4.81
Betweenness (undirected) 3.54 7.61 4.69 6.19
26
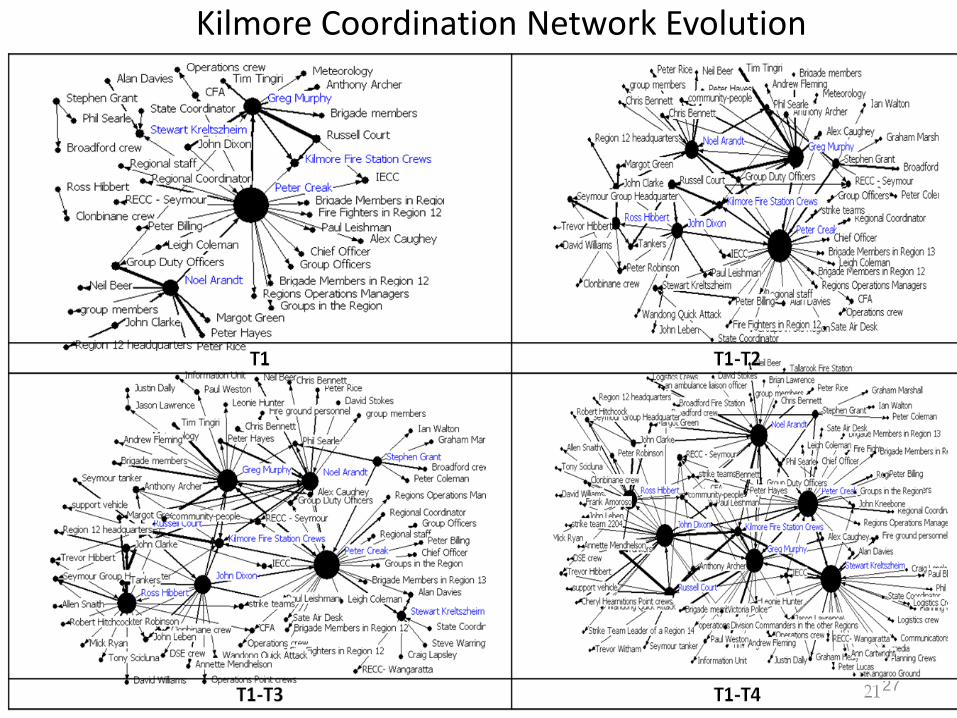
Dynamic Network Analysis of Kilmore Coordination
7 Feb (11:50) (13:05) (16:00) mid-night t(1) t(2) t(3) t(4)
Fire starts Kilmore as ICC IC change
----- T1 --- --------- T2 -------- -------- T3 --------- -------- T4 ---------
27
Kilmore Coordination Network Evolution

28
Access & Sharing of Information during fire Coordination

29
Influential actors in coordination network
Greg Murphy: IC1 -- Kreltszheim: IC2 Peter Creek: RDO (RECC) -- Noel Arandt: DIC1 Russell Court: Tanker1 Crew -- John Dixon: DGO
• Brokering role gives the power and control of the information flow
• Brokering role well express the coordinating role of the RDO (Regional Duty Officer)
• Deputy Incident Controller (DIC) has a better brokering role that the Incident Controller (IC)
• Top 5 brokering roles
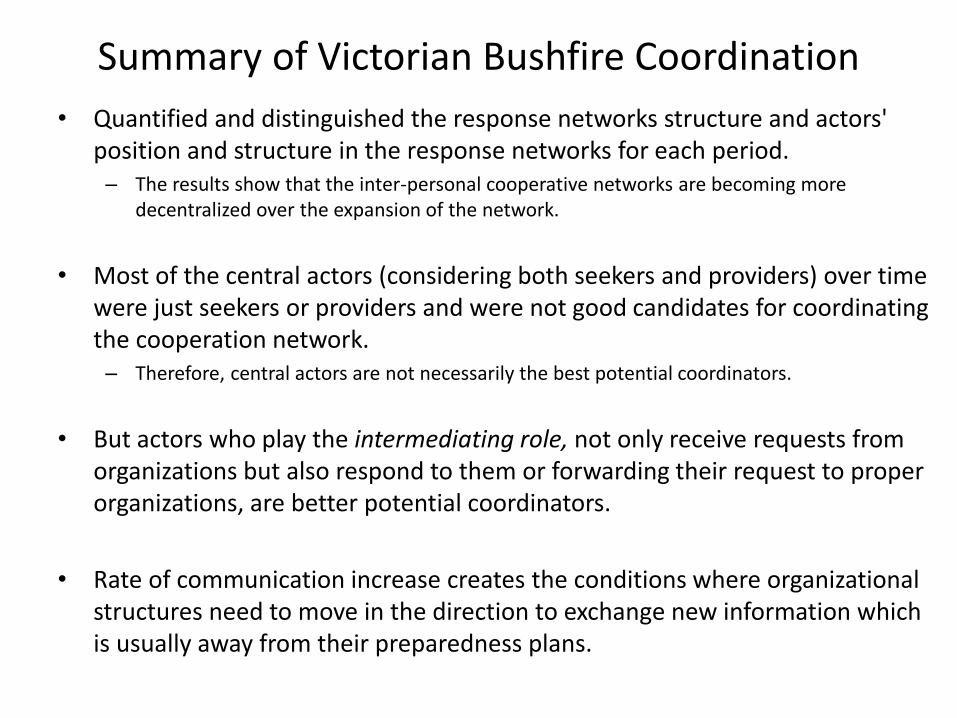
Summary of Victorian Bushfire Coordination
• Quantified and distinguished the response networks structure and actors' position and structure in the response networks for each period.
– The results show that the inter-personal cooperative networks are becoming more decentralized over the expansion of the network.
• Most of the central actors (considering both seekers and providers) over time were just seekers or providers and were not good candidates for coordinating the cooperation network.
– Therefore, central actors are not necessarily the best potential coordinators.
• But actors who play the intermediating role, not only receive requests from organizations but also respond to them or forwarding their request to proper organizations, are better potential coordinators.
• Rate of communication increase creates the conditions where organizational structures need to move in the direction to exchange new information which is usually away from their preparedness plans.

Florida Disaster Coordination Networks of Hurricanes
• Few systematic empirical studies which try to quantify the optimal functioning of emerging networks dealing with natural disasters.
• Analysis of dataset from the 2004 state of Florida’s four consecutive major hurricanes within a period of six weeks.
• Florida State Emergency Response Team (SERT) situation reports before, during, and after the hurricanes have been reviewed.
• Content analysis was conducted on all situation reports for each of the four storms.
Name Dates active Peak
classification
Sustained
wind speeds Pressure Areas affected Deaths
Damage
(USD)
Charley
August 9 - 15,
2004
Category 4
hurricane 150 mph (240 km/h) 941 hPa (27.79 inHg)
Jamaica, Cayman Islands, Cuba,
Florida, The Carolinas 40 $15.1 billion
Frances
August 24 –
September 10,
2004
Category 4
hurricane 145 mph (230 km/h) 935 hPa (27.61 inHg)
The Caribbean, Eastern United
States, Ontario 50 $9.85 billion
Ivan
September 2 – 24,
2004
Category 5
hurricane 165 mph (270 km/h) 910 hPa (26.87 inHg)
The Caribbean, Venezuela,
United States Gulf Coast 124 $23.3 billion
Jeanne
September 13 –
28, 2004
Category 3
hurricane 120 mph (195 km/h) 950 hPa (28.05 inHg)
The Caribbean, Eastern United
States 3,035 $7.66 billion

Inter-organizational Coordination Network statistics & measures
• Jeanne Hurricane is the most centralized
network followed by Frances and Ivan.
• Indicates that in Jeanne network there are
few organizations with very high degree
centrality (connecting to many organizations)
and many with very low degree centrality.
• In less centralized network (e.g., Charley
coordination network) the difference between
organizations with very high and low degree
centrality is lower.
• In terms of betweenness centralization, Frances
shows centralized network as there are few
organizations with very high betweenness centrality
(bridging among the organizations otherwise
disconnected) and many with very low betweenness
centrality.
• American Red Cross (#82) or United States
Government (#72) that have high betweenness
centrality. If we remove each of those nodes,
several nodes will be disconnected from the
rest of the network.
Org. Code Org. Name Org. Abbreviation
01 Florida State Government - Governor's Office FSG-GO
02 Federal Emergency Management Agency FEMA
03 National Hurricane Center NHC
13 Florida Division of Emergency Management FDoEM
22 Orange County Government OCG
52 WFTV Channel 9 WFTV-Channel9
54 A Sun State Trees ASST
63 Progress Energy Florida PEF
66 Florida Insurance Council FIC
72 United States Government USG
80 Orlando Sentinel OS
82 American Red Cross ARC
87 Osceola County Government OCG
94 Charlotte County Emergency management CCEm
128 Lake County Government LCG
164 Department of Children & Families DCF
250 Hillsborough County HC
326 Orange County Government Emergency Management OC EMO
333 Florida State Emergency Response Team SERT
Charley Frances Ivan Jeanne
# of Organizations (actors) 96 38 32 69
# of Interactions (Links) 114 53 37 101
Density .013 .036 0.037 0.021
Connectedness (%) 60 71 61 89
Network Centralization (%)
Degree 4.7 11.9 10.0 14.6
Betweenness 0.5 6.8 1.4 1.3

Four Hurricanes Coordination Network (size of the nodes indicates degree centrality of the node)
1) Charley (2) Frances
(4) Jeanne (3) Ivan
A Abbasi, L Hossain, N Kapucu (2015) “A longitudinal study of emerging networks during natural disaster”, arXiv preprint arXiv:1503.06641.

Top 5 Centralized organizations in each hurricane’s inter-organizational coordination network
• FEMA (#2) is among the top 5 high degree centrality organizations in all hurricanes.
• Florida Division of Emergency Management (#13)
• American Red Cross (#82)
• Florida State Emergency Response Team (#333) are also among the top 5 organization in 3 out of 4 hurricanes, and,
• Organization #13 Florida Division of Emergency Management has been ranked first in all three cases.
Charley Frances Ivan Jeanne
Org. No.
Norm. Degree
(%) Org. No.
Norm. Degree
(%) Org. No.
Norm. Degree
(%) Org. No.
Norm. Degree
(%)
1 13 5.05 2 14.87 13 11.83 13 15.0
2 2 4.63 72 13.51 333 7.53 2 5.59
3 326 3.37 82 13.51 2 6.45 164 3.24
4 333 3.37 1 12.16 72 5.37 333 2.06
5 22 1.90 22 10.81 82 4.31 82 2.06

Inter-organizational coordination network dynamics
Charley Weekly Inter-organizational Coordination Network statistics and measures
W1
Aug(12-18)
W2
Aug(19-24)
W3
Aug(25-29)
All
Aug(12-29)
# of Organizations (actors) 65 34 15 96
# of Interactions (Links) 73 30 11 114
Density (%) 1.8 2.7 5.2 1.3
Connectedness (%) 53 55 28 60
Degree Centralization (%) 4.4 24.5 37.4 4.7
Betweenness Centralization (%) 0.007 0 0 0.5
Frances Weekly Inter-organizational Coordination Network statistics and measures
W1
Sep(01-07)
W2
Sep(08-10)
W3
Sep(15-17&23-24)
All
Sep(01-24)
# of Organizations (actors) 20 19 13 38
# of Interactions (Links) 24 14 15 53
Density (%) 5.8 3.8 9.6 3.6
Connectedness (%) 81 16 100 71
Degree Centralization (%) 28.1 10.1 28.0 11.9
Betweenness Centralization (%) 14.4 0 2.3 6.8
Ivan Weekly Inter-organizational Coordination Network statistics and measures
W1
Sep(10-16)
W2
Sep(17-18)
W3
Oct(01-08)
W4
Oct(21-26)
All
Sep10-Oct26
# of Organizations (actors) 19 9 9 9 32
# of Interactions (Links) 15 8 8 6 37
Density (%) 4.4 11.1 11.1 8.3 3.7
Connectedness (%) 32 44 50 33 61
Degree Centralization (%) 8.8 9.8 51.8 26.8 10.0
Betweenness Centralization (%) .003 1.79 5.36 1.79 1.4
Jeanne Weekly Inter-organizational Coordination Network statistics and measures
W1
Sep26-Oct02
W2
Oct(03-09)
W3
Oct(10-15)
W4
Oct21
W5
Oct26-Nov02
All
Sep26-Nov02
# of Organizations (actors) 24 39 7 15 11 69
# of Interactions (Links) 26 40 8 14 13 101
Density (%) 4.7 2.7 19.1 6.7 10.9 0.021
Connectedness (%) 84 45 100 100 100 89
Degree Centralization (%) 11.5 30.5 44.4 100 41.7 14.6
Betweenness Centralization (%) 1.5 .007 26.7 0 3.3 1.3

Changes in organization position during evolution of Incident Response
Charley’s Top 10 Organizations with high degree centrality over time
Org No. All W1 W2 W3
1 13 5.05 0.31 25.76 42.86
2 2 4.63 5.0 9.09
3 326 3.37 4.69 1.52
4 333 3.37 4.69 7.143
5 22 1.90 1.88 3.03 7.143
6 82 1.26 0.63 1.52 21.43
7 63 1.05 1.56
8 3 1.05 1.56
9 72 1.05 1.56
10 94 0.84 1.56
Frances’ Top 10 Organizations with high degree centrality over time
Org No. All W1 W2 W3
1 2 14.87 31.58 11.11 12.50
2 72 13.51 10.53 33.33
3 82 13.51 21.05 5.56 20.83
4 1 12.16 31.58 5.56 8.33
5 22 10.81 36.84 5.56
6 333 9.46 15.79 16.67 4.17
7 13 6.76 5.26 16.67
8 73 4.05 10.53 5.56
9 128 4.05 16.67
10 84 2.70 5.26 5.56
Ivan’s Top 10 Organizations with high degree centrality over time
Org No. All W1 W2 W3 W4
1 13 11.83 16.67 18.75 62.50 12.50
2 333 7.53 11.11 12.50 37.50
3 2 6.45 11.11 12.50 25.00 12.50
4 72 5.38 18.75 25.00
5 82 4.30 5.56 12.50 25.00
6 1 4.30 11.11 6.25 12.50
7 153 3.23 16.67
8 22 3.23 16.67
9 138 4.05 11.11
10 73 2.70 12.50
Jeanne’s Top 10 Organizations with high degree centrality over time
Org No. All W1 W2 W3 W4 W5
1 13 15.00 8.70 31.58 100 45.00
2 2 5.59 15.22 2.63 44.44 7.14 5.00
3 164 3.24 14.47
4 333 2.06 6.52 7.14 10.00
5 82 2.06 2.63 7.14 20.00
6 1 1.77 13.04
7 72 1.47 10.87
8 128 1.18 8.70
9 354 1.18 4.35 1.32 5.00
10 175 1.18 2.17 1.32 7.14 5.00

Summary of Florida Disaster Coordination Networks • Effective formation and operation of
organizations’ cooperative networks are increasingly becoming important to protect human and natural lives as well as infrastructure during a disaster.
• Network metrics for investigating disaster response coordination and its impact on improving preparedness and response has been highlighted.
• We find that in disasters the rate of communication increases and creates the conditions where organizational structures need to move in the direction to exchange new information which is usually away from their preparedness plans.
• Network connectedness can be considered important indicator for disaster response as it is essential for emergency response participant to reach each others in order to provide needed information and resources.
• Coordination networks which are more connected (i.e., the percentage of actors that can reach to any other actors) have higher network degree centralization (i.e., the network is centralized around just a few actors with high links to others).
• It can be those few actors with high degree centrality (i.e., many links to others), are representing coordination roles in the network which keep the network more connected that is essential for emergency response.

Within the context of Social and Behavioral Interventions, my current projects...
• Harnessing social networks to enhance the effectiveness of peer counselling for IYCF
• (with Michael Dibley, International Health, Usyd)
• Social immunity and resilience networks for Indigenous Community Health (Renal Disease
networks with Alan Cass, George and Menzie Institute, Northern Territory Australia)
• Coordinated Interventions for Mental Health Systems (with Sydney BMRI-Brain and Mind Research
Institute)
• Service-learning in rural, remote, and other underserved communities (with Chris Roberts,
Sydney Medical Education)
Peer Counseling (PC) Network effect
Types
Size
Relationship
Density
Centrality
IYCF
Network effect on PC N etwork effect on IYCF Network effect on PC + IYCF
Peer Network
PC1 PC2
PC3
Social - Cultural Network
Performance (Changed Behaviour Measures)

Within the context of Medical Education and workforce, I have been exploring ...
• Social Ties and Clinical Effectiveness of Rural Physicians (with Sue Page,
President of Australian Rural Doctors Association)
• Social networks and expertise development for Australian breast radiologists (with Patrick Brennan and
Sarah Lewis, Medical Imaging Optimization and Perception Group-MIOPeG, Australia)
Lesion Localisation by Eye tracking of (a) a non-expert observer
(b) an expert radiologist (source: http://www.devchakraborty.com)

40
Australian H1N1 Preparedness and Response Networks
• The Absence of unified approach results in different management and coordination approaches leading to high variability of infection rates; hence mortality and morbidity rates.
• H109 infection in NSW indicates that even within the same state there were large discrepancies within the same states with sometimes similar demographics (by June 17- 2009)
• H1N109 infection rates in Australia by June 17- 2009
Bdeir, F., Hossain, L., and Crawford, J. (2012) “Emerging Coordination and Knowledge transfer Process during Disease
Outbreak,” Knowledge Management Research & Practice, doi:10.1057/kmrp.2012.1

41
Capturing Qualitative & Quantitative Network Data
Hossain, L., Bdeir, F., and Crawford, JW (2014) “H1N1 Outbreak Surveillance through Social Networks”, Journal of Decision
Systems, 23(2), 151-166.

42
Inter-organizational Disease Outbreaks Coordination
• Inbound case definition Communication
• Cases inbound communication
WHO
Federal Chief Health Officer
CDU:
NSW Chief Health Officer/ NSW - HSFAC
HNE
HNE - HSFAC
Inbound Monitoring
HSFAC
EOC
PHEOC
Sentinel
indicator
GPs
PHREDDSInpatient
flow system
Admits to
ICU
Work force
monitoring
Confirmed
cases via
SWABS
PHREDDS: Public Health
Respiratory Emergency
Department Data System.
SWABS: Sample taking system.
LAG LAG LAG LEAD LEAD
Front line

43
Inter-organizational Disease Outbreaks Coordination
Outbound Informal communication
State Public Health
Unit
Case definition outbound
communication structure
HSFAC DCO
DCO: Director of clinical Operations.
DA: Director of Acute.
ED: Emergency Department
Org1 dotted to indicate that it operated at later stage
during the communication process.
Director
Acute
Director
D+C
Director
Mental
Health
7 Hospital
in HNE
Total 37 ED
EDs
Hospital Clusters
EDs
Mental
Hospital
Org1
Outbound Case communication
44
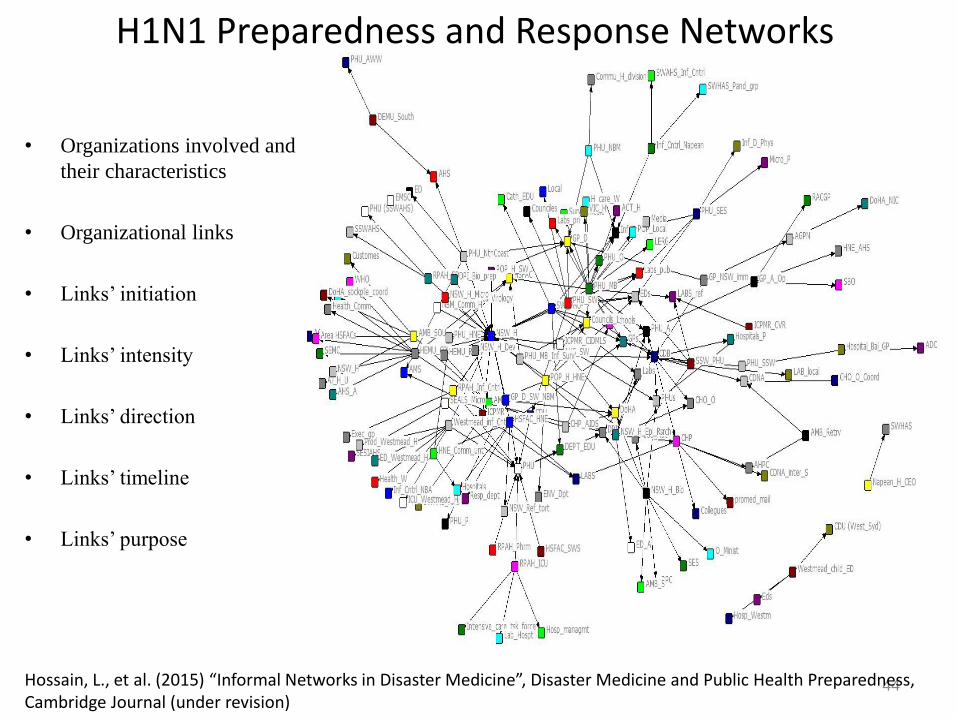
H1N1 Preparedness and Response Networks
• Organizations involved and
their characteristics
• Organizational links
• Links’ initiation
• Links’ intensity
• Links’ direction
• Links’ timeline
• Links’ purpose
Hossain, L., et al. (2015) “Informal Networks in Disaster Medicine”, Disaster Medicine and Public Health Preparedness, Cambridge Journal (under revision)

Social Media Surveillance in Ebola Disasters
• ProMED mails with keyword “Ebola” in the subject heading shows an awareness of the spread of Ebola in April, especially in French correspondences.
• In comparison, news in the mass media was largely responsive to two significant events: WHO declared Ebola an international health emergency on August 8 and Ebola in Texas, USA on September 30.
• Public attention, as captured by Internet search query statistics, spiked and decreased after the WHO declaration, but increased when Ebola reached Texas.
Hossain, L (2015) “Social Media in Ebola Disaster”, Epidemiology & Infection, (Accepted)

Transmission Dynamics of the Ebola Cases
• A systematic analysis of the spread during the months of March to October 2014 was performed using data from Program for Monitoring Emerging Diseases (ProMED) and the Factiva database

Transmission Dynamics of the Ebola Cases

Dynamic Evolutionary Networks of Digital Disease Surveillance: A Meta-analysis of 10 years Research
• First meta-analysis of dynamic evolutionary networks for digital disease surveillance research over 10 years.
• The evolution and dynamical changes that occurred in academic research related to digital disease surveillance for improving accuracy, approach and results.
• Using dynamic network analysis, we are able to show the incorporation of social media based analytics and algorithms which have been proposed and later improved by other researchers as a complex evolutionary learning system.
• First study of web access logs and influenza published in 2004 (Johnson et al, Studies of Health Technology and Information)
• Google Flu Trends introduced in 2008 (Ginsberg et al, Nature), updated in 2009 (Cook et al) and 2011 (Copeland)
• Google Flu Trends criticized for missing 2009 pandemics and for 2013 overshot (Nazer et al, Nature)
• Most studies obtain high to very high correlations with traditional clinical surveillance data (e.g. GFT at 0.94 with US sentinel surveillance influenza-illness-like (ILI) data)
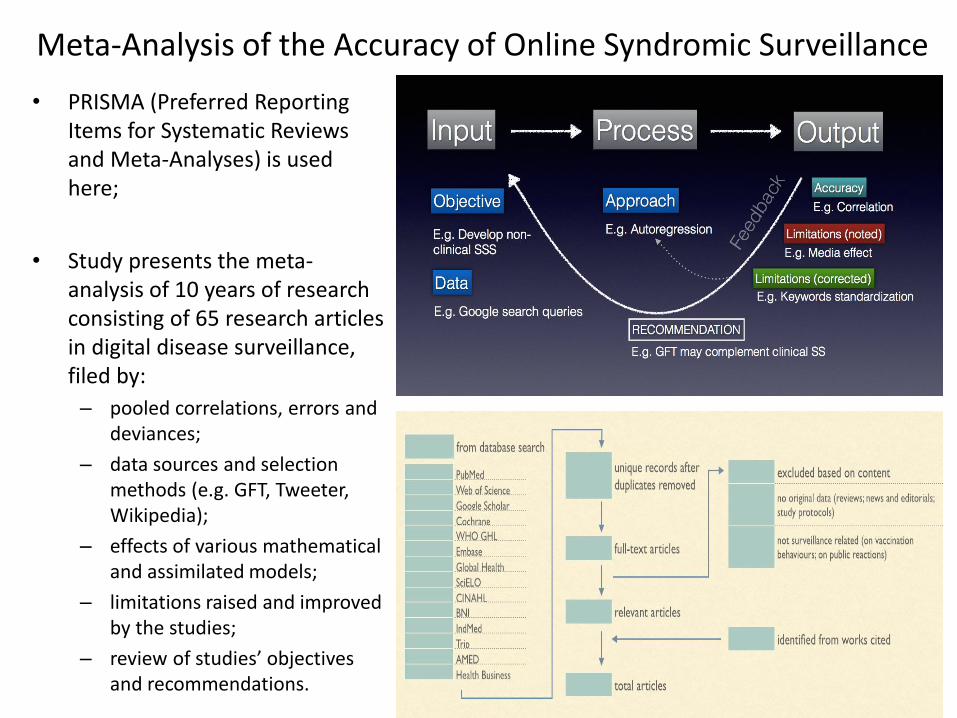
Meta-Analysis of the Accuracy of Online Syndromic Surveillance
• PRISMA (Preferred Reporting Items for Systematic Reviews and Meta-Analyses) is used here;
• Study presents the meta-analysis of 10 years of research consisting of 65 research articles in digital disease surveillance, filed by:
– pooled correlations, errors and deviances;
– data sources and selection methods (e.g. GFT, Tweeter, Wikipedia);
– effects of various mathematical and assimilated models;
– limitations raised and improved by the studies;
– review of studies’ objectives and recommendations.

Article Source_Internet Source_Clinical Appr_Keywords Appr_Accuracies Appr_Modeling Appr_Validation Lim_Cited
P001 I301 C101,C104 A101 A202 . . .
P002 I101 C101,C104 A101 A202 . . .
P003 I105 C104,C109 A101 A202 A301 A501 .
P004 I102 C101 A104 A202 A301 A503,A504 .
P005 I301 C101,C104 A102 A202,A204 A301 A503,A505 .
P006 I102 C101,C104 . A201 . . .
P007 I102,I103 C101 A101 A201 . . .
P008 I102,I303 C101,C103 . A201 . . .
P009 I203 C101 A101 A202 A402 A501 .
P010 I102,I103,I104 C101 A101,A102 A202,A204 A301,A302,A305 A501 .
P011 I103 . A101 A202 A404 A501 .
P012 I201 C101 A102,A104 A202 A301 A503,A504,A505 .
P013 I102 C101,C107 . A203 . . .
P014 I201 C101 A104 A202 A301,A403 A505 .
P015 I102 C101 . A202 A302 A501 .
P016 I201 . A101,A104 A202 . . .
P017 I102 C101,C104 . A202 . A502 .
P018 I201 C101 . . A304 A503,A504 .
P019 I102,I107,I304 C101,C104 A101,A102 A202,A204 A301 A505 .
P020 I102,I201 C104 A102,A104,A105 A202 A304 A506 .
P021 I102,I201 C104,C106 A101 A202 A304 A503 .
P022 I102 C102,C104 . A202 . . L502,L601,L603,L604,L606
P023 I102 C102,C105 . A202 . . L502
P024 I102 C101 . A202 A301 A503 .
P025 I201 C101 A104 A202,A204 A301,A403 A502,A505 .
P026 I201 . . A202 A304,A402 A501 .
P027 I102 C101,C106 . A202 . . .
P028 I102 C101 . . A303 A503 .
P029 I201 . A101 . A301 A505 .
P030 I102 . . . A401,A403 A501 .
P031 I102 C101 . . A302,A304,A401 A502 .
P032 I103 C101,C104 A101,A102 A202 . . .
P033 I102 C105 . . A302,A303 A505 L803
Data Sources and Populate using PRISMA Article
Analysis of web access logs for surveillance of influenza
Infodemiology: tracking flu-related searches on the web for syndromic surveillance
Using Internet searches for influenza surveillance
Detecting influenza epidemics using search engine
Web queries as a source for syndromic surveillance
Interim analysis of pandemic influenza (H1N1) 2009 in Australia: surveillance trends, age of infection and effectiveness of seasonal vaccination
Google Trends: a web-based tool for real-time surveillance of disease outbreaks
Interpreting “Google Flu Trends” data for pandemic H1N1 influenza: the New Zealand experience
Text and structural data mining of influenza mentions in web and social media
Improving the timeliness of data on influenza-like illnesses using Google search data
A rapid method for assessing social versus independent interest in health issues: a case study of ‘bird flu’ and swine flu’
Tracking the flu pandemic by monitoring the social web
Monitoring influenza activity in Europe with Google Flu Trends: comparison with the findings of sentinel physician networks - results for 2009-10
Detecting influenza outbreaks by analyzing Twitter messages
Predicting consumer behavior with Web search
Pandemics in the age of Twitter: content analysis of Tweets during the 2009 H1N1 outbreak
Monitoring influenza activity in the United States: a comparison of traditional surveillance systems with Google Flu Trends
The use of Twitter to track levels of disease activity and public concern in the U.S. during the influenza A H1N1 pandemic
Web query-based surveillance in Sweden during the influenza A(H1N1)2009 pandemic, April 2009 to February 2010
You are what you Tweet: analyzing Twitter for public health
Twitter catches the flu: detecting influenza epidemics using Twitter
“Google Flu Trends” and emergency department triage data predicted the 2009 pandemic H1N1 waves in Manitoba
Google Flu Trends: correlation with emergency department influenza rates and crowding metrics
Optimizing provider recruitment for influenza surveillance networks
Lightweight methods to estimate influenza rates and alcohol sales volume from Twitter messages
Modeling spread of disease from social interactions
Comparison: flu prescription sales data from a retail pharmacy in the US with Google Flu Trends and US ILINet (CDC) data as flu activity indicator
FluBreaks: early epidemic detection from Google Flu Trends
Investigating Twitter as a Source for Studying Behavioral Responses to Epidemics
Forecasting seasonal outbreaks of influenza
Tracking epidemics with Google Flu Trends data and a state-space SEIR model
Using Google Trends for influenza surveillance in south China
Influenza forecasting with Google Flu Trends

Illustration of Data Structure and Coding System

Limitations raised and improved by the articles vs. time
• Uncertainties due to the lack of transparency of the GFT algorithm were often noted in articles from recent years (within the “uncertainties” category, ptrend=.0006). •There is also an increasing demand for accurate depictions of internet user populations’ compositions and behaviors (under the “study population” category, ptrend=.042).
•Most of the limitations improved are about confounding and noises (light green bars), which involve mostly methods for correcting media and calendar/holiday effects.

Network depiction of articles improving limitation(s)

Rank Eigens for Limitations Raised and Improved Rank Eigen Article Region Eigen Article Region Eigen Article Region Eigen Article Region
1 0.389 Signorini et al 2011 US 0.358 Signorini et al 2011 US 0.272 Signorini et al 2011 US 0.291 Liang et al 2013 US
2 0.388 Chew and Eyzenbach 2010 Canada 0.357 Chew and Eyzenbach 2010 Canada 0.270 Chew and Eyzenbach 2010 Canada 0.256 Signorini et al 2011 US
3 0.316 Paul and Dredze 2011 US 0.297 Malik et al 2011 Canada 0.222 Broniatowski et al 2013 US 0.255 Chew and Eysenbach 2010 Canada
4 0.315 Malik et al 2011 Canada 0.288 Paul and Dredze 2011 US 0.221 Kang et al 2013 Various 0.207 Kang et al 2013 Various
5 0.298 Hulth et al 2009 Europe 0.275 Hulth et al 2009 Europe 0.194 Kim et al 2013 Asia 0.186 Malik et al 2011 Canada
6 0.22 Ginsberg et al 2009 US 0.251 Dukic et al 2012 US 0.191 Paul and Dredze 2011 US 0.185 Kim et al 2013 Asia
7 0.218 Polgreen et al 2008 US 0.235 Dugas et al 2012 US 0.191 Malik et al 2011 Canada 0.178 Olson et al 2013 US
8 0.214 Carneiro and Mylonakis 2009 Various 0.197 Polgreen et al 2008 US 0.175 Dukic et al 2012 US 0.176 Paul and Dredze 2011 US
9 0.208 Olson et al 2009 US 0.194 Carneiro and Mylonakis 2009 Various 0.166 Dugas et al 2013 Various 0.172 Dukic et al 2012 US
10 0.206 Ortiz et al 2011 US 0.192 Ginsberg et al 2009 US 0.164 Ortiz et al 2011 US 0.159 Yuan et al 2013 Various
2004-20142004-20132004-20122004-2011
Rank Eigen Article Region Eigen Article Region Eigen Article Region Eigen Article Region
1 0.416 Aramaki et al 2011 Asia 0.415 Aramaki et al 2011 Asia 0.38 Liang et al 2013 US 0.374 Liang et al 2013 US
2 0.411 Lampos and Cristianini 2010 UK 0.411 Lampos and Cristianini 2010 UK 0.335 Lamb et al 2013 US 0.323 Lamb et al 2013 US
3 0.411 Chew and Eysenbach 2010 Canada 0.411 Chew and Eysenbach 2010 Canada 0.324 Broniatowski et al 2013 US 0.313 Broniatowski et al 2013 US
4 0.307 Signorini et al 2011 US 0.269 Signorini et al 2011 US 0.321 Aramaki et al 2011 Asia 0.310 Aramaki et al 2011 Asia
5 Hulth et al 2009 Europe Hulth et al 2009 Europe 0.3 Chew and Eysenbach 2010 Canada 0.291 Chew and Eysenbach 2010 Canada
6 Wilson et al 2009 Australisia Wilson et al 2009 Australisia 0.283 Lampos and Cristianini 2010 UK 0.276 Lampos and Cristianini 2010 UK
7 Collier et al 2011 Asia Collier et al 2011 Asia 0.243 Signorini et al 2011 US 0.243 Signorini et al 2011 US
8 Malik et al 2011 Canada Malik et al 2011 Canada 0.178 Hulth et al 2009 Europe 0.204 Velardi et al 2014 Europe
9 0.153 Culotta 2010b US Culotta 2010b US Wilson et al 2009 Australisia 0.19 Denecke et al 2013 Europe
10 0.051 Johnson et al 2004 US Culotta 2012 US Collier et al 2011 Asia 0.174 Hulth et al 2009 Europe
Malik et al 2011 Canada
Copeland et al 2013 US
deLange et al 2013 Europe
2004-2014
0.303
0.221
0.261
0.177
2004-2011 2004-2012 2004-2013

Publications in Information, Communications and Knowledge Networks
Publications in Decision Support & Complex Emergencies
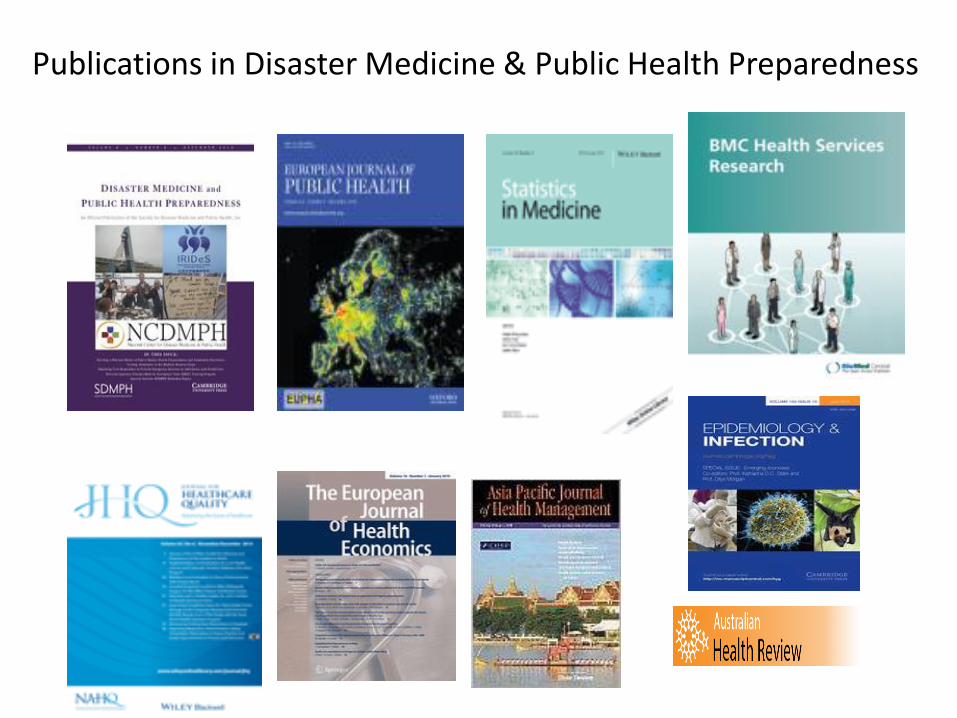
Publications in Disaster Medicine & Public Health Preparedness

Like to see the visibility....

Integrated Science Science is no longer the specialized activity of a professional elite and it is rather a combination of mental operations, a culture of illuminations born during the Enlightenment to establish science as most effective way of learning about the material world ever devised (Wilson, 1998: Integrated Science and The Coming Century of The Environment, Science, 2048-2049).
Source: http://engineering.columbia.edu/files/engineering/obesitymapclusters.png

Research Funding and Sources Secured more than AU$10M in competitively research funding (EU FP 7; NHMRC; ARC Discovery; CRC-Financial Markets; CRC Bushfire, ARDA in the US)
• Health Emergency Learning & Planning (4.5M Euro);
• Integrated SOLutions for sustainable fall preVEntion (iSOLVE) 1.35M AUD;
• BioNet: Socio-technical Info Networks for Health Security (11M HK$);
• Ethnicity, Socio-Economic Status and Social Networks as Drivers of Obesity (0.499M AUD);
• Computational Behavioural Modeling of Markets Systems (0.720M AUD);
• Social & Biologically Inspired Complex Adaptive Learning Net for Emergency (0.325M AUD);
• CRS-Context, Role & Semantic Approach to Insider Threats (1.25M USD)
• EU FP7 Framework 2014-17
(FP7-SEC-2013-1)
• NHMRC-National Health and
Medical Research Council
2014-17
• HK RGC CRF-Collaborative Res Funds (shortlisted) 2015-18
• ARC-Australian Research Council Discovery Project 2000-13
• Commonwealth Research Centre for Financial Markets
• Commonwealth Research Centre for Bush Fire
• ARDA-US Advanced Res Dev Agency
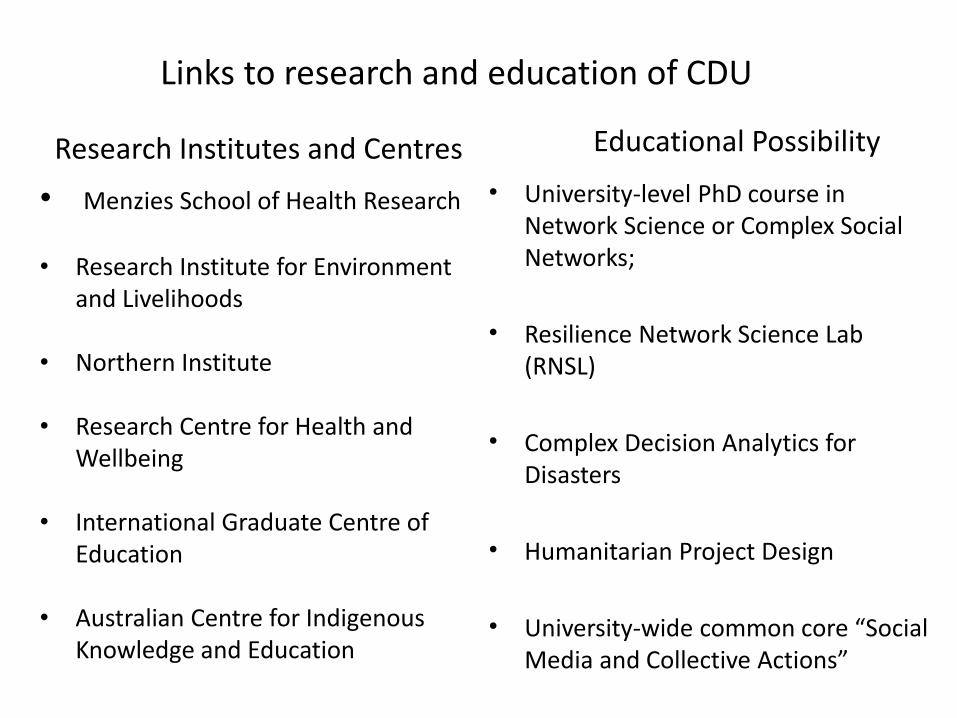
Research Institutes and Centres
• Menzies School of Health Research
• Research Institute for Environment
and Livelihoods
• Northern Institute
• Research Centre for Health and Wellbeing
• International Graduate Centre of Education
• Australian Centre for Indigenous Knowledge and Education
Educational Possibility
• University-level PhD course in Network Science or Complex Social Networks;
• Resilience Network Science Lab (RNSL)
• Complex Decision Analytics for Disasters
• Humanitarian Project Design
• University-wide common core “Social Media and Collective Actions”
Links to research and education of CDU