integrated annual report - afrimat - home · 2014-07-22 · audit & risk committee report 46...
TRANSCRIPT

®
Integrated annual report
2014
Growth through diversifi cation

Defi nitions Contents
Performance highlights 1
Integrated reporting 2
1. Business activitiesBusiness overview 4
Value added statement 6
2. Strategic context Vision, mission and values 8
Strategic milestones 9
Stakeholders 10Identifying principal risks and opportunities 12
Governance structure 13
Ethical leadership 13
Directorate 14
Competitive strengths 16
3. Business performance Chairman’s review 18
CEO’s review 21
Share performance 23
Operational reviews 24
Five-year review 25
4. Governance, sustainability and people
Corporate governance 28
Risk management 34
Mining licence compliance 35
Health and safety 36
Environmental responsibility 38
Human capital 39
Remuneration 41
Social, ethics and sustainability 42
Transformation 43
5. Annual fi nancial statementsDirectors’ responsibility statement 45
Declaration by company secretary 45
Audit & Risk Committee report 46
Independent auditor’s report 48
Directors’ report 49
Statements of fi nancial position 52
Statements of comprehensive income 53
Statements of changes in equity 54
Statements of cash fl ows 56Notes to the annual fi nancial statements 57
Segmental report 104
Analysis of shareholders 106
6. Shareholder informationNotice of annual general meeting 108
Form of proxy 113
Shareholders’ diary IBC
Contact details IBC
‘Afrimat’ or‘company’
Afrimat Limited, listed on the JSE Limited in the ‘Construction & Building Materials’ sector
‘ASPASA’ Aggregate and Sand Producers Association of South Africa
‘B-BBEE’ Broad-Based Black Economic Empowerment
‘BWAWUSA’ Building, Wood & Allied Workers’ Union of South Africa
‘board’ The board of directors of Afrimat, as set out on page 14
‘CEO’ Chief executive officer of Afrimat, Andries J van Heerden
‘Clinker Group’
SA Block (Pty) Limited and its 100%-owned subsidiary Clinker Supplies (Pty) Limited, acquired by Afrimat 1 March 2012
‘Codes’ Department of Trade and Industry’s B-BBEE Codes of Good Practice
‘COLTO’ Committee of Land Transport Officials
‘CSI’ Corporate social investment
‘DIFR’ Disabling Injury Frequency Rate
‘DMR’ Department of Mineral Resources
‘EMP’ Environmental management plan
‘EXCO’ Executive Committee of Afrimat, as set out on page 13
‘FD’ Financial director of Afrimat, Hendrik P Verreynne
‘Glen Douglas’
Glen Douglas Dolomite (Pty) Limited, acquired by Afrimat 1 January 2011
‘the group’ Afrimat Limited, its subsidiaries and associate companies
‘GRI’ Global Reporting Initiative, a best practice benchmark in reporting
‘H&S’ Health and safety
‘HIRA’ Hazard identification and risk assessment
‘Infrasors’ Infrasors Holdings Limited, 79,6% incrementally acquired by Afrimat since 1 March 2013
‘JSE’ JSE Limited incorporating the JSE Securities Exchange, the main board in South Africa
‘King III Report’ King Report on Governance for South Africa 2009
‘LUPO’ Land Use Planning Ordinance
‘NEMA’ National Environmental Management Act, 1998
‘NUM’ National Union of Mineworkers
‘NUMSA’ National Union of Metalworkers of South Africa
‘previous/prior year’ or ‘FY2013’
Year ended 28 February 2013
‘SABS’ South African Bureau of Standards
‘SARMA’ South African Readymix Association
‘SENS’ Stock Exchange News Service, the regulatory information dissemination platform for the JSE
‘SHE’ Safety, health and environment
‘Solidarity’ Solidarity is a South African trade union
‘year’ or ‘year under review’ or ‘FY2014’
Year ended 28 February 2014
Financial definitions‘FY’ Financial year ending 28 February
‘IFRS’ International Financial Reporting Standards
‘HEPS’ Headline earnings per share
‘NAV’ Net asset value
‘PAT’ Profit after tax
‘PBIT’ Profit before interest and taxation
‘ROI’ Return on investment
Read more More info on website
®

Main headingPerformance highlights
Revenue up 42,1%
HEPS up 41,7% to 109 cents
Return on net operating assets
26,0%
Net cash from operating activities up
43,6%
NAV per share up 9,2% to 579 cents
Total dividend up 39,3% to 39 cents
per share
Net debt:equity ratio 15,5%
Acquired 79,6% of Infrasors
incrementally since March 2013
Strong balance sheet
Afrimat’s pursuit of responsible
growth is demonstrated
throughout this year’s report.
1Afrimat integrated annual report 2014
0
400 000
800 000
1 200 000
1 600 000
2 000 000
‘14‘13‘12‘11‘10
854
495
996
137 1
337
585
1 90
1 18
7
778
015
Revenue (R’000)
0
23
46
69
92
115
‘14‘13‘12‘11‘10
51,3 53,3
62,6
76,9
109,
0
HEPS (cents)
0
9
18
27
36
45
‘14‘13‘12‘11‘10
16
17
19
28
39
Total dividends per share (cents)
0
50 000
100 000
150 000
200 000
250 000
‘14‘13‘12‘11‘10
134
757
130
580
146
343
169
764
243
860
Net cash from operating activities (R’000)
0
117
234
351
468
585
‘14‘13‘12‘11‘10
394 43
0
469
530
579
Net asset value per share (cents)
0
259
518
777
1 036
1 295
‘14‘13‘12‘11‘10
313
330
575
844
1 28
9
Share price at year-end (cents)

2 Afrimat integrated annual report 2014
Integrated reporting
Afrimat is a leading black empowered open pit mining group,
supplying industrial minerals and construction materials to a range of industries across South Africa. It is listed in the ‘Construction &
Building Materials’ sector of the JSE Main Board.
Corporate informationThe group’s executive directors are Andries J van Heerden (CEO),
Hendrik P Verreynne (FD) and Gert J Coffee. They can be contacted at the registered offi ce of the company. The company secretary is
Mariëtte Swart. See contact details on the inside back cover of this
integrated annual report.
Company name: Afrimat LimitedCompany registration number: 2006/022534/06JSE share code: AFTISIN: ZAE000086302JSE Main Board sector: Construction &
Building Materials
The integrated annual report 2014 is available in hard copy, on
request, from the company secretary and is also posted on the
group’s website www.afrimat.co.za | .
Our integrated annual report 2014 is aimed at all our stakeholders
with a specifi c focus on our shareholders. It aims to share our
performance for FY2014, including demonstrating how our strategy
of entering the industrial minerals business, embarked on fi ve years
ago, continues to add value. Overall the report is intended to give
our stakeholders a better understanding of the issues, risks and
opportunities that we face in terms of business sustainability, value
creation and growth.
Reporting parametersThis integrated annual report 2014 presents the annual fi nancial
results and the economic, environmental, social and governance performance of the group for the year ended 28 February 2014.
In March 2013, Afrimat acquired a 50,7% stake in resources group
Infrasors, which produces dolomite, limestone and silica. Afrimat
has since incrementally increased its shareholding in Infrasors and
currently owns 79,6%. Treasury shares account for 12,0% and
minorities account for the remaining 8,4% of Infrasors’ gross shares in issue. The acquisition has further expanded Afrimat’s
foothold in industrial minerals as well as its geographical reach within the Gauteng region.
During the year we adapted the group’s reporting segments to better align with the day-to-day business. The contribution of the Readymix business to group results, as a standalone business, has become insignifi cant as it is operationally part of Concrete Products, making standalone reporting for that business immaterial. We therefore now report in two segments, namely Mining & Aggregates: comprising Industrial Minerals, Aggregates and Contracting Services; and Concrete Based Products: comprising Concrete Products and Readymix.
For more information, see the annual fi nancial statements on pages 45 to 105 | .
Frameworks appliedIn compiling this report, we have considered the legislative requirements for reporting and the International Integrated Reporting Framework, issued in December 2013, as well as the Discussion Paper on the Framework for Integrated Reporting and the Integrated Report issued by the IRC South Africa in January 2011. Our report conforms to the requirements of local and international integrated reporting frameworks, the South African Companies Act 2008 and JSE Listings Requirements. We continue to use the GRI guidelines for our sustainable development reporting. The company has also applied the majority of principles in the King III Report. In respect of those which have not been applied, explanation is offered.
Risk managementRefer to page 34 for the risk management report | .
Forward-looking disclaimerThis integrated annual report contains forward-looking statements that, unless otherwise indicated, refl ect the company’s expectations as at 28 February 2014. Actual results may differ materially from the company’s expectations if known and unknown risks or uncertainties affect the business, or if estimates or assumptions prove inaccurate. The company cannot guarantee that any forward-looking statement will materialise and, accordingly, readers are cautioned not to place undue reliance on these forward-looking statements. The company disclaims any intention and assumes no obligation to update or revise any forward-looking statement even if new information becomes available as a result of future events or for any other reason.
Approval of the report The Afrimat board approved this integrated report and authorised its release on 24 June 2014.
Matie von Wielligh Andries van Heerden Chairman CEO
24 June 2014

3Afrimat integrated annual report 2014
Aggregates at a glance
Commercial quarries
Quarries, sand and gravel mines
located in seven of South Africa’s
provinces and in Namibia
Supplies the majority of
aggregates for the Concrete
Products and Readymix divisions
Industrial minerals
Produces dolomite, limestone
and silica
Business activities
1
Vaal Clinker

4 Afrimat integrated annual report 2014
Business activities
Business overview
Afrimat primarily engages in the mining, processing and supply of a broad range of aggregates and industrial minerals. In addition, we supply related concrete products and readymix.
We have over fi ve decades of experience. Our skills base is strengthened by a very stable employee force with consistently low staff turnover, which has resulted in a deep skills pool.
Footprint
Mpumalanga
Eastern Cape
Western Cape
Northern Cape
North West
Namibia
Gauteng
Free State
KwaZulu-Natal
GauauuteauG
Our operations stretch across urban and
rural Southern Africa, with our fl eet of mobile
crushers providing the fl exibility to operate
where we fi nd demand.Includes commercial quarries and operations of a
permanent nature in Contracting Services.
Business operations
Afrimat Limited
Mining & Aggregates Concrete Based Products
Concrete Products
Contracting Services
Industrial Minerals
ReadymixAggregates
Limpopo

5Afrimat integrated annual report 2014
Markets
Quality assurance
Contribution to revenue
Mining & Aggregates Concrete Based Products
71%
Commercial quarries: 23Sand and gravel mines: 8Dolomite mines: 2Limestone mine: 1
Silica mines: 2Contracting: mobile crushing, drilling and blasting
29%
Concrete brick and block factories: 9Readymix plants: 14
Core activity
Open cast mining and processing of industrial
minerals and aggregates products
Concrete brick and block manufacturing and
readymix batching
Products Aggregates: stone and sand
Metallurgical dolomite Metallurgical quartzite Agricultural lime Clinker Silica sand Fire retardants
Services Mobile crushing and screening
Drilling Blasting
Products Building blocks and bricks of different shapes, colours and sizes
Pavers of different shapes, colours and sizes
A variety of other precast products
Services Readymix concrete batched on demand and transported to customers by concrete mixer trucks
Readymix mortar
Building and construction Large-scale civil engineering and infrastructure projects
Road and rail Concrete product manufacturers
Readymix processors Metallurgical manufacturers Agriculture Foundries Mining Tile adhesive manufacturers
Large-scale civil engineering and infrastructure projects
Low-cost housing
Residential and commercial property
Quality-at-source processes by which quality control is ensured by constant monitoring and evaluation
Products carry the SABS mark
Supply the majority of aggregates used by Afrimat’s Concrete Products and Readymix divisions
Close to 90% of aggregates sourced from the group’s own quarries and sand mines
Products and services
Vertical integration

6 Afrimat integrated annual report 2014
Business activities
Set out below is the value added by the group and its employees during the year under review and how it was applied.
%2014
R %2013
R
Revenue 1 901 187 222 1 337 584 566 Cost of goods and services provided 1 210 829 749 847 952 717
Value added by operations 690 357 473 489 631 849 Non-operating income 16 186 531 10 811 018
Total value added 706 544 004 500 442 867
Applied as follows:To remunerate employees:– Salaries, wages, pensions, bonus and other benefits 54,5 384 985 694 56,9 284 659 163 To reward providers of capital:– To shareholders as dividends paid 6,4 44 647 748 6,0 30 352 504 – To lenders as finance charges 3,5 24 981 282 2,9 14 295 568 To the state:– Taxes 8,2 58 110 362 8,1 40 639 551 To replace assets:– Depreciation 13,3 93 920 432 11,1 55 449 750 To expand the group:– Retained earnings 14,1 99 898 486 15,0 75 046 331
100,0 706 544 004 100,0 500 442 867
Value added statementfor the year ended 28 February 2014
Value added (R’000) Distribution of value added
Employees
Reinvested
Replacement of assets
Providers of capital
Taxation
0
100 000
200 000
300 000
400 000
500 000
600 000
700 000
800 000
‘14‘13‘12‘11‘10
301
063
334
357
406
745 50
0 44
3
706
544

7Afrimat integrated annual report 2014Lyttelton mine
Industrial minerals at a glance
Infrasors
Acquired 50,7% stake in
March 2013 and incrementally
increased the shareholding
to 79,6%. Treasury shares account
for 12,0% and minorities account
for the remaining 8,4%
of Infrasors’ gross shares in issue
Strategiccontext
2

8 Afrimat integrated annual report 2014
Strategic context
Vision, mission and values
MissionTo operate opencast mines, add value through benefi ciation of mined
products, and provide contracting services to customers.
Vision
Healthy fi nances
Concern for the community and the environment
Being innovative and fl exible
Our vision is built on:
Well-managed operations
Responsible, honest and motivated personnel
Effective and reliable systems
Delighted stakeholders
To be the most respected construction materials and industrial minerals
supplier in Southern Africa.
Values To adhere to Afrimat values in all we do.
Trust
Firm belief in the reliability, truth, or ability
of people.
Integrity
Moral conduct, refl ected in transparent
honesty.
Accountability
The obligation of people or an organisation to
account for its activities, accept responsibility
for them and to disclose the results in a
transparent manner.
Teamwork
Working collaboratively in order to achieve
a goal.
Respect
Admiration elicited by people’s abilities,
qualities or achievements.
Customer satisfaction
Meeting or surpassing customer expectation.

Strategic milestones
Coming of age and stronger strategic management
Build a solid foundation
Narrow focus – building materials
Mainly coastal provinces
Formation of proper governance
Standing out
Growth in unique products (2011 onwards)
Glen Douglas acquisition (January 2011)
Clinker Group acquisition (March 2012)
Infrasors acquisition (March 2013)
2011 onwards
®
2007 – 2010
Geographic expansion
Smaller acquisitions
Well executed national positioning
Broad infrastructure focus
Afrimat black employees, via the Afrimat BEE trust, acquire 16,8% interest in Afrimat (now 21,7%)
0
Leading footprint established
9Afrimat integrated annual report 2014
2006
JSE listing
Founded in 2006 from well-established companies
Prima Klipbrekers (established 1963)
Lancaster Quarries (established 1965)
Malans Quarries (established 1963)
Denver (established 1996)

10 Afrimat integrated annual report 2014
Strategic context
Stakeholders
We recognise that developing and nurturing dialogue with our key stakeholders, and actively listening and responding to feedback, is a driver of business sustainability. The process of identifying and monitoring stakeholder relationships is reviewed annually by the board. Our internal open door culture and strong communication extends to all external stakeholders, and we pride ourselves on our timely, consistent and transparent communication.
Stakeholder What matters to them Tools of engagement Responsibility Our response
Shareholders Profitability ROI (share price and dividends)
Cash generation Corporate governance and compliance
Risk management Growth prospects Reputational issues
Annual and interim results announcements
SENS announcements Website publications Group results presentations
1:1 meetings Roadshows Annual general meeting Media releases Site visits
CEO assisted by the FD Feedback from results presentations and 1:1 meetings is relayed to and dealt with at board level
Lenders/providers of capital
Capital management Sustainability Profitability Cash generation Corporate governance and compliance
Risk management Growth prospects Reputational issues
Contractually required information flow
Annual and interim results announcements
Regular meetings
FD assisted by group accountant and financial managers
Feedback from meetings is relayed to and dealt with at board level
Employees Job security Sustainability Personal growth and development
Skills development Remuneration and incentives
Safety Health and wellness
Annual culture climate survey
Training sessions News updates Employment equity forums
Regular reinforcement of Code of Conduct and policies/procedures
General manager human resources assisted by all management
Investment in training and talent management
Dedicated skills development division
Skills Development and Employment Equity Consultative Committees established for each subsidiary
Ongoing health and safety programme
Customers Quality Service Value for money
Annual customer surveys conducted to determine service improvement opportunities
Contractual engagement Personal interaction with main customers
Product brochures
CEO, managing directors of subsidiaries and sales teams
Commitment to quality products and service excellence

11Afrimat integrated annual report 2014
Stakeholder What matters to them Tools of engagement Responsibility Our response
Trade unions Wage negotiations Bargaining council agreements
Conditions of employment
Engagement on safety issues
Engagement on health and wellness issues
Regular meetings at the relevant levels
General manager human resources assisted by all management
Ongoing focus on labour and employee relations
Consistency in industrial relations
Recognition agreements at industry level
Major contractors, suppliers and business partners
Consistent off-take Group payment record
Contract and service agreements
CEO and managing directors of subsidiaries
Regular business updates to suppliers
Government, local authorities and regulatory bodies
Compliance with Mining Licence requirements
Regulatory compliance B-BBEE status and black shareholding
Environmental compliance
Skills development Enterprise development Job creation
Lobbying with government departments
CEO and managing directors of subsidiaries assisted by corporate affairs and resources departments
Developing DMR required social and labour plans in conjunction with local municipalities
Raising awareness of local economic, social and infrastructure conditions and gaining approval for government funded projects
Focus on procurement from suppliers with BEE shareholding
Local communities
Environmental issues – dust, emission, water, traffic, noise, unsightly development
Economic upliftment Job creation Enterprise development Preferential procurement
Dialogue with local community interest groups
Managing directors of subsidiaries and branch operational managers assisted by general manager corporate affairs and resources department
Supplementing labour force from surrounding communities
Practicing a limited automation policy
Prioritising environmental management of operations

12 Afrimat integrated annual report 2014
Strategic context
Identifying principal risks and opportunities
The risks and opportunities that affect the group’s ability to create value in the immediate and longer term can be grouped into three categories: Macroeconomic – which are, to an extent, beyond the group’s control although the effects or this type of risk can be minimised Operational – which are managed proactively by implementing policies and process controls Strategic – which impact on the group’s ability to implement its strategy
Risk Stakeholders impacted by this risk Opportunity Risk mitigation
Macroeconomic
Market cycles/volatility
All stakeholders Ongoing diversification into the industrial minerals market, into unique products with scarcity value, and into new regions which are strategically positioned to capitalise on major project opportunities
Development of superior operational and marketing expertise
Ongoing business development to identify opportunities early
Aggressive business development focus on expansion and diversification opportunities
Careful cost control Pre-emptive anticipation and forecasting of market conditions
Proactive innovative solutions ahead of occurrence to maintain competitive advantage
Operational
Industrial action Employees, trade unions, shareholders and funders
Create more productive working environment
Strict adherence to legislation and bargaining arrangements
Open lines of communication with unions
Stakeholder engagement processes
Employee incentivisation and motivation programmes
Culture of employee development and well-being
Theft and fraud Shareholders and funders Create culture of ownership Strict internal controls Effective disciplinary procedures Whistleblowing hotline
Increasing complexity of legal compliance
Employees, customers, suppliers, government, local authorities, regulatory bodies and funders
Leverage of compliance skills as a key component in business combinations
Focused attention by dedicated team
Executive (top-down) endorsement of compliance
Key staff turnover Employees and shareholders Career path management delivers experienced senior management to support group expansion and succession
Active management of internal culture and climate
Ongoing training and development Appropriate incentivisation for retention
Active leadership mentoring and advancement
Succession planning
Strategic
Liquidity management
Shareholders and funders Lower cost of funding flows from liquidity management actions
Strict credit control and outstanding debt monitoring processes
Focused attention by senior management
Monthly cash forecasts

13Afrimat integrated annual report 2014
Governance structure
Ethical leadership
The board strives to ensure that the group conducts its business with integrity, leading by example. This commitment is formalised in a Code of Conduct (available at www.afrimat.co.za | ) which applies beyond the board to all employees of the group. The Code is designed to provide guidance as to ethical conduct in all areas, appropriate policies in respect of the safeguarding of assets and information, and the appropriate corrective measures to enforce these policies.
Further the strong value system embedded in the group culture is constantly reinforced by the CEO and supported by business unit heads and human resources management. Strict adherence to the provisions of the Code of Conduct is a condition of employment within Afrimat.
The Code sets out the group’s values and practices over and above requirements of formal governance codes and legal requirements such as the King III Report and the Companies Act.
Ethical conduct is an area with which the Social, Ethics & Sustainability Committee is tasked by the board. As part of its responsibility, the committee ensures that the company’s ethics performance is assessed, monitored, reported and disclosed. It reviews cases of confl icts of interest, misconduct or fraud, or any other unethical activity by employees or the company. Further the committee reviews the Code annually and recommends it to the board for approval.
Statement of compliance The board is committed to upholding the fundamental tenets of governance, which include discipline, independence, responsibility, fairness, social responsibility, transparency and accountability of directors to all stakeholders.
Board
Committees
Audit & Risk Committee
Remuneration & Nominations Committee
Social, Ethics & Sustainability Committee
EXCO
The board meets four times per year.
Andries J van Heerden (CEO)
Hendrik P Verreynne (FD)
Gert J Coffee
Francois du Toit
Loyiso Dotwana
Marthinus W von Wielligh (Chairman)
Phuti RE Tsukudu
Hendrik JE van Wyk
Number of independent directors
Number of meetings per year
Self-evaluation completed
Hendrik JE van Wyk (Chairman)Marthinus W von WiellighLoyiso Dotwana Phuti RE Tsukudu
Marthinus W von Wielligh (Chairman) Phuti RE TsukuduLoyiso DotwanaAndries J van Heerden
Loyiso Dotwana (Chairman)Phuti RE TsukuduAndries J van HeerdenGert J CoffeeMarthinus W von Wielligh
Andries J van Heerden (Chairman)Gert J CoffeeAnton GerberHendrik P VerreynneJan HP van Heerden
3/4 2/4 2/5 n/a
4 3 2 6
n/a
(for further information see page 46 | .)
(for further information see page 41 | .)
(for further information see page 42 | .)
(fo(fo fr furth

14 Afrimat integrated annual report 2014
Strategic context
Directorate
Executive directors
Andries J van Heerden (48)CEOB.Eng (Mech), MBA (University of Stellenbosch), Government Certifi cate of Competence
Andries has extensive experience in operational management, strategic positioning, marketing and fi nance. During 2001, he joined the Prima Klipbrekers group as a director and became managing director two years later. He left Prima in 2005 and formed a consortium which acquired the Lancaster group, of which he became chief executive. He was instrumental in 2006 in the formation and listing of Afrimat from the merger of Prima and Lancaster. Andries was a fi nalist in the 2008 Ernst & Young World Entrepreneur Awards in the category ‘Emerging Entrepreneur’. He also sits on the board of Infrasors Holdings Limited as a non-executive director.
Hendrik P Verreynne (57) FD B.Compt (Hons), CA(SA)
Hendrik, a chartered accountant, has extensive experience in fi nancial and information technology management, corporate governance and BEE. Prior to joining Afrimat in 2007 he was fi nancial director for Oceana Brands Limited. Previously he was a senior executive in fi nance for Woolworths and Borden Foods and fi nancial director of Sea Harvest Limited. He also sits on the board of Infrasors Holdings Limited as a non-executive director.
Gert J Coffee (63) Head of Operational Effi ciency B.Sc B.Eng. Mechanical (Industrial)
A registered professional engineer, Gert has spent the past 35 years in the civil construction and materials supply industries in various executive management capacities. He joined Afrimat in January 2010.
Loyiso Dotwana (50)B.Sc Civil Engineering (University of Cape Town)
Loyiso has worked as a civil engineer in design and project management for more than 20 years. He specialised in design and contract administration of township services, rural and urban roads and national roads. He has been involved in the conceptual and detailed design of bulk services for the Coega Industrial Development Zone in Port Elizabeth. Loyiso founded Illiso Consulting (Pty) Limited, one of South Africa’s largest black owned consulting engineering companies, of which he is currently a director and the major shareholder.
Non-executive directors
Francois du Toit (67)
Francois joined Prima Klipbrekers as managing director in 1967 and helped establish the Prima group 12 years later, where he remained as managing director until 2003 and then as Chairman until his retirement in 2009.
Independent non-executive directors
Marthinus (Matie) W von Wielligh (62)Chairman B.Sc (Mech. Eng.) (University of Pretoria), MBA (University of Stellenbosch), Stanford Executive Programme (Stanford University, USA)
Matie has almost 40 years’ professional experience in the mining industry. He has extensive engineering, operational and business experience and currently consults on business strategy, new business development, operational improvement, capital effi ciency feasibility studies and project management. Previously, at Iscor Mining and Kumba Resources he served in various management and senior management positions before becoming managing director of Sishen Iron Ore Company. Matie holds other directorships and is a non-executive Chairman of Vega Asset Management (Pty) Limited.
Phuti RE Tsukudu (60)M.Ed (University of Bristol), Postgraduate Diploma in Adult Education, B.A. (SW)
Phuti is an organisational development and management consultant and is currently managing director/senior consultant at Tsukudu Associates and a partner/senior consultant at CRG PPS. She has extensive experience in organisational development, human resources management and human resources development in the public and private sectors – over 25 years’ experience as an independent consultant and over 10 years as a community development practitioner working in the development and education arena. She continues to hold a number of board positions.
Hendrik (Hennie) JE van Wyk (70)B.Com, CA(SA)
Hennie qualifi ed as a chartered accountant in 1975 with Brink Roos & Du Toit, where he became partner three years later. In 1987, he was appointed lead partner in the Cape Town offi ce of Theron du Toit and in 1990 lead partner of Coopers & Lybrand at the time of the merger with Theron du Toit. In 1998, he became managing partner of PwC Inc. (Western Cape), a position that he held until his retirement.

15Afrimat integrated annual report 2014
Andries J van HeerdenCEO
Hendrik P VerreynneFD
Gert J Coffee
Executive directors
Loyiso Dotwana Francois du Toit
Non-executive directors
Hendrik (Hennie) JE van WykPhuti RE Tsukudu
Independent non-executive
directors
Marthinus (Matie) W von WiellighChairman

16 Afrimat integrated annual report 2014
Strategic context
Competitive strengths
Healthy cash fl ow
Strong balance sheet
Industry leading margins throughout
economic cycles
Good market intelligence and expertise
Ongoing business development
Proven successful acquisitions
Successful greenfi eld projects
Diverse product and services offering
Wide geographic distribution
Solid presence in growth markets
Commitment to protecting the
environment and sustainable
development
Flexible
Reliable quality
Superior reaction time
Well-maintained plant and equipment and
well-equipped workshop infrastructure
Vertical integration
The group’s competitive strengths
Stro
ng fi
nanc
ial position Operational com
petence
Active strategic positioning

17Afrimat integrated annual report 2014SA Block
Concrete Based Products at a glance
Concrete Products
Precast factories manufacturing
bricks, blocks and paving
Readymix
Concrete and mortar batching and
transported to site by mixer trucks
Business performance
3

18 Afrimat integrated annual report 2014
Business performance
Chairman’s review
How we continue to leadPost the 2008 global fi nancial implosion and knock-on effects on
our core markets in South Africa, we revised our strategy to
diversify into open pit mining, supplying markets such as industrial
minerals and worked to pre-empt and address market trends early.
Over the past fi ve years we have successfully forayed into the
robust industrial minerals market though three acquisitions, namely
Glen Douglas, the Clinker Group and most recently Infrasors in
which we own a controlling stake. During the year we upped our
interest in Infrasors from 50,7% to 79,6%. We were confi dent that
our management acumen and 50 years’ market experience would
drive successful turnarounds at these businesses and help optimise
the profi table assets. Their signifi cant contribution to Afrimat’s
strong performance for the year bears this out.
We also continued to leverage the strengths of our traditional
aggregates business to maintain momentum in anticipation of a
market uptick, which materialised in the year.
Further, we focused on cost control and introduced ongoing
effi ciency initiatives to improve productivity and production output
across the board.
Our successful acquisition strategy continued to form an important
component of our overall growth strategy. Our goals, with any
Matie von WiellighChairman
Our strategy, embarked on fi ve years
ago, of ‘delivering results through
diversifi cation’ and focus on the
fundamentals of productivity and
profi tability, achieved the envisaged
growth. As a result we maintained the
group’s growth trajectory in the year well
ahead of the industry and continued to
entrench our long-term sustainability.
Civil confi dence index
0
10
20
30
40
50
60
70
80
90
100
Q1 2
014
Q3 2
013
Q1 2
013
Q3 2
012
Q1 2
012
Q3 2
011
Q1 2
011
Q3 2
010
Q1 2
010
Q3 2
009
Q1 2
009
Q3 2
008
Q1 2
008
Q3 2
007
Q1 2
007
Q3 2
006
Q1 2
006
Q3 2
005
Q1 2
005
Q3 2
004
Q1 2
004
Q3 2
003
Q1 2
003
Q3 2
002
Q1 2
002
Q3 2
001
Q1 2
001
Q3 2
000
Q1 2
000
Q3 1
999
Q1 1
999
Q3 1
998
Q1 1
998
Q3 1
997
Q1 1
997
Source: Bureau of Economic Research, 2013 Q3
Building confi dence index
0
10
20
30
40
50
60
70
80
90
100
Mar
‘14
Sep
‘13
Mar
‘13
Mar
‘12
Mar
‘12
Sep
‘11
Mar
‘11
Sep
‘10
Mar
‘10
Sep
‘09
Mar
‘09
Sep
‘08
Mar
‘08
Sep
’07
Mar
‘07
Sep
‘06
Mar
‘06
Sep
‘05
Mar
‘05
Sep
‘04
Mar
‘04
Sep
‘03
Mar
‘03
Sep
‘02
Mar
‘02
Sep
‘01
Mar
‘01
Sep
‘00
Mar
‘00
Sep
‘99
Mar
‘99
Sep
‘98
Mar
‘98
Sep
‘97
Mar
‘97
Source: Bureau of Economic Research, 2013 Q3

19Afrimat integrated annual report 2014
Paved network condition: Summary 2013
0% 20% 40% 60% 80% 100%
Percentage of network
Auth
ority
Source: SABITA
Very poor (km) Poor (km) Fair (km) Good (km) Very good (km)
Northern Cape
Western Cape
North West
Mpumalanga
Limpopo
KwaZulu-Natal
Gauteng
Freestate
Eastern Cape
SANRAL
Provincial and SANRAL’s expenditures on roads trend (R’000)
0
5 000
10 000
15 000
20 000
25 000
30 000
35 000
40 000
2010 2011 2012 2013 2014 2015 20162009200820072006
Source: SABITA
Forecast Expenditure
acquisition is to enhance the group’s sustainability, diversify revenue streams, boost profi tability and entrench resilience. Target companies must operate in Afrimat’s area of expertise, namely open pit mining, contain products that Afrimat can market effectively and would signifi cantly strengthen the group.
The Afrimat WayWe believe our distinct approach to the fi ve pillars of business distinguishes us in the market, and has helped drive our credible performance and long-term sustainability. We call this ‘The Afrimat Way’.
Firstly, our people. We advocate leading by example from the top down, living our shared values in our daily business conduct and interactions, always maintaining high ethical and moral standards, while respecting all stakeholders and the environment. We continually strive to improve skill levels to maintain superior competence and encourage teamwork through an informal working environment in which collaboration, knowledge sharing and cross-skilling is rewarded.
With regard to marketing, we emphasise engaged relationships that engender client loyalty and enable us to translate new prospects into fi rm orders at maximised pricing and optimised product mix. Our business development team is focused on identifying marketing opportunities based on superior market intelligence.
Then there are our operations. We aim to optimise productivity through planning and forethought – continually refi ning plant design and process fl ow for maximum effi ciency – and excellent maintenance and care.
This carries through to fi nance, where we premise our performance on effective planning and budgeting. We aim to have effective systems for monitoring and control in place, and maintain strict focus on our key fi nancial deliverable of cash generation.
Finally, being a responsible corporate citizen, a JSE-listed company and a mining business, compliance is key to our success. We prioritise in-depth knowledge of legislation and requirements, ensure that we maintain a compliance strategy that is workable and monitor group-wide adherence.
Our trading environment and outlookAfrimat’s markets, both traditional and new, are indicating positive growth prospects with strong pipelines. Major growth drivers are expected to be the burgeoning renewable energy sector and our government accelerating infrastructure services spend. The focus is expected to shift from low-cost housing to service delivery.
The latest building and civils confi dence indices refl ect a signifi cant improvement during the year, albeit not yet back to pre-2010 levels, and correlate to an uptick in tendering activity. This aligns with projected statistics for completed building and construction works, which by 2019 stand above R380 billion worth of projects.
The South African national roads network continues to demand attention, with the latest studies showing around 70% of roads exceeding the maximum 25-year lifespan and deteriorating surface and safety conditions across the country. SANRAL’s and the provinces’ spend on roads is forecast to exceed R35 billion in 2016, which is higher than in any year since South Africa’s transition to democracy in 1994.
At least 430 000 low-cost housing units are forecast to be built between now and 2020 when government has committed to fi nally erase the backlog.
While we have already begun experiencing the benefi ts of this market recovery, with increased sales of aggregates and concrete-based products in the year, these should increase materially over the next fi ve years.
B-BBEE We have partially mitigated the risk to our BEE ownership given the expiry of Mega Oils’ seven-year ‘lock-in’ period in November 2013 by including Mr Loyiso Dotwana as a participant in the Afrimat BEE Trust: Share Purchase scheme. Afrimat has effectively addressed the threat to our mining rights and entrenched our sustainability in this regard.
Sustainability We are committed to delivering sustainable growth and wealth creation for shareholders while developing our people, protecting our environment and supporting communities. Since our operations

20 Afrimat integrated annual report 2014
Business performance
Chairman’s review (continued)
have a physical impact on the environment in the ordinary course of business activity, environmental management and effective stakeholder engagement in this regard are key priorities.
DirectorateIt was with great sadness that we bade a fi nal farewell to fellow director, Laurie Korsten, who passed away during the year. His invaluable contribution to Afrimat from inception will be deeply missed. The success of Afrimat is part of his legacy.
With regard to our board composition, we acknowledge the vacancy and we need to appoint an independent non-executive director to align our board with the recommendations of King III. This will be a priority when appointing new directors. We are also confi dent in our non-executive directors’ ability to act independently.
AppreciationI wish to thank Andries, the leadership team and all Afrimat employees for their unfl agging commitment and hours of hard work. Your consistent efforts are the cornerstone of our success and are much appreciated. My fellow directors’ contribution has been signifi cant and I thank you for that. Finally, a word of appreciation to our stakeholders whose support and demonstrated confi dence fuelled our inspiration to continue on our path of success.
Matie von WiellighChairman
24 June 2014
SA age of national road network
0
10
20
30
40
50
60
70
80
90
100
20022001200019991998 20072006200520042003 2008 20132012201120102009
Source: StanLib
>25 years 21 – 25 years 16 – 20 years 11 – 15 years 6 – 10 years 0 – 5 years
Pavement age trend
Natio
nal r
oad
netw
ork
leng
th (C
arria
gew
ay k
m)

21Afrimat integrated annual report 2014
CEO’s review
Andries van HeerdenCEOAC
When analysing our overall growth in profi ts over the past fi ve years and comparing it to the growth of the traditional business the result in itself was gratifying as it confi rmed the success of the conscious growth strategy. Our decision to diversify has resulted in a compound average growth rate of headline earnings per share in excess of 20% over the past fi ve years, well ahead of the industry.
Revenue and PAT for FY2014 were substantially higher by 42,1% and 57,0%, respectively. We maintained satisfactory gearing, especially given that we assumed Infrasors’ debt burden when we acquired a majority stake in the company. We escalated our shareholding in Infrasors to 79,6% during the year. Margins have improved, our cash fl ow remains robust, our balance sheet is strong and all fundamentals are healthy.
In addition, our sustainability markers have shown signifi cant improvement, with our lost-time injury frequency rate and other safety statistics refl ecting our efforts in regard of safe mining. We were pleased with the fact that we experienced only limited labour action at our operations during the year, notwithstanding a volatile labour scenario in the wider economy.
Financial resultsThe results of Infrasors were included in Afrimat’s results for the fi rst time with effect from 1 March 2013.
Revenue of R1,9 billion was up from R1,3 billion last year. PAT grew from R103,8 million to R163,0 million. Headline earnings increased by 41,4%, translating into HEPS of 109,0 cents compared
Return on net operating assets/liabilities (R’000) Return on shareholers’ funds (R’000)
0
5
10
15
20
25
30
‘14‘13‘12‘11‘10
26,0
1
18,9
5
18,1
4 20,6
8
19,6
5
0
2
4
6
8
10
12
14
16
18
20
‘14‘13‘12‘11‘10
12,6
3
12,2
3
12,8
1 14,4
2
18,5
5
We have continued reaping the rewards
of the consistent execution of our growth
strategy over the past seven years.
In brief, in the year under review our
business excelled across the board, with
our traditional businesses – specifi cally
aggregates – making a solid comeback.

22 Afrimat integrated annual report 2014
Business performance
CEO’s review (continued)
to 76,9 cents in the previous year. Net cash from operating activities grew 43,6% to bolster the group’s net cash position.
Gearing increased to 15,5% in light of the debt of Infrasors assumed by the group on acquisition of a controlling stake in that company. By year-end Infrasors’ debt burden reduced signifi cantly.
NAV per share was up from 530 cents to 579 cents.
Full details of our annual fi nancial results are set out in the annual fi nancial statements and accompanying notes.
Dividends In line with Afrimat tradition we declared dividends totalling 39 cents a share, signifi cantly higher than the 28 cents a share last year. We have maintained a consistent dividend policy since our listing in 2006.
Our operations in the yearThe group’s industrial minerals acquisitions contributed signifi cantly to the results and have in the last three years ensured Afrimat’s resilience during the down cycle in our original markets. Given this, we continued with the diversifi cation strategy and commissioned a major plant upgrade at Glen Douglas in the third quarter of the year. The increased capacity has resulted in higher output volumes of high demand products. We also began the environmental approvals process to build a kiln on the Glen Douglas site to further benefi ciate the minerals and boost profi ts. The process is protracted and we anticipate that, all going according to plan, we can start to realise benefi t from this initiative in the near future.
The Clinker Group remained a stellar performer. Management is addressing the life of mine issue and is actively seeking new sources to grow the resource base ahead of the current remaining seven-year time horizon.
In the Western Cape region a new quarry was commissioned near Durbanville, which is fully operational.
Integration of Infrasors into the group is progressing well. Our turnaround strategy is seeing the positive results of reduced costs and improved revenue. We recognise there is some way yet to go to capitalise on the full potential of Infrasors’ mines. We project that Marble Hall can revitalise to achieve profi tability in the short term and that Delf Sand should return to profi tability within the next year, subject thereto that the Cullinan mining licence is received. The group’s intention is to own all the Infrasors issued shares in due course.
In Afrimat’s traditional aggregates market we were pleased with a positive resurgence. Demand for aggregates is escalating and helping to drive improved volumes in our Mining & Aggregates segment. With all processing plants fully operational we are well positioned to continue meeting the increased demand from our customers. Further, Afrimat’s fl exible delivery proposition including
mobile plant means the group can take advantage of opportunities in limitless geographical reach across Africa, irrespective of the location of our fi xed quarries and mines.
The Mining & Aggregates segment delivered 86% of group contribution from operations at R195,2 million, up from R117,5 million in the previous year.
Concrete Based Products achieved a satisfactory increase in sales pricing. However, the business unit suffered restricted volumes and a decline in profi t as a result of a strike at its Gauteng operation.
Looking aheadWe anticipate that our original aggregates business can return to its former levels of performance in time, especially in light of the market recovery. Bolstered by our growing industrial minerals business, this bodes well for Afrimat’s continued growth.
Key growth drivers are expected to come from ongoing development of the industrial minerals market, continued roadworks at the behest of South African National Roads Agency Limited and the provinces and government unlocking infrastructure spend in the interest of service delivery.
Our focus in the year ahead remains on unlocking the value of recent acquisitions, effi ciency improvement initiatives, cost reduction and developing employees’ skill levels. We will also remain on the look-out for sustainable growth opportunities in and beyond South Africa with increasing focus on Africa.
The prevailing business environment is more positive than it has been in years and we project ongoing moderate growth. Within this context we will continue to methodically roll out our proven business formula focusing on ‘doing the right things the right way’.
Our competitive edge remains a fi rm fi nancial position and innovative strategic positioning from leveraging the market intelligence gathered by our business development team, led by Carl Malan, which are underpinned by our successful track record in greenfi eld projects and acquisitions. We also pride ourselves in respect of operational competence, reliable service delivery, quality products and superior reaction time.
We have proved that patient and unwavering focus are indeed a business virtue. When we balance this with fi rst-to-market resulting from the identifi cation of trends and opportunities, we believe we have the winning formula for continued growth.
Andries van HeerdenCEO
24 June 2014

23Afrimat integrated annual report 2014
Share performance at year-end
2014 2013 2012 2011 2010
Number of ordinary shares in issue 143 262 412 143 262 412 143 262 412 143 262 412 143 262 412 Less: Number of treasury shares 1 048 676 204 242 6 145 174 5 149 510 3 398 280
Net number of ordinary shares in issue 142 213 736 143 058 170 137 117 238 138 112 902 139 864 132
Weighted number of ordinary shares in issue 142 620 285 142 867 266 137 371 771 138 596 357 137 236 345 Headline earnings per share (cents) 109,0 76,9 62,6 53,3 51,3Price:earnings ratio 11,8 11,0 9,2 6,2 6,1 Market price per share at date of listing (7 November 2006 – issue price 500) (cents)Market price per share at year-end (cents) 1 289 844 575 330 313 Market capitalisation based on issued shares (Rand) 1 846 652 490 1 209 134 757 823 758 869 472 765 960 448 411 350 Market capitalisation based on issued shares less treasury shares (Rand) 1 833 135 057 1 207 410 955 788 424 119 455 772 577 437 774 733
750
937
1 125
1 312
1 500
28 F
ebru
ary
‘14
31 J
anua
ry ‘1
4
31 D
ecem
ber ‘
13
29 N
ovem
ber ‘
13
31 O
ctob
er ‘1
3
27 S
epte
mbe
r ‘13
30 A
ugus
t ‘13
31 J
uly
‘13
28 J
une
‘13
31 M
ay ‘1
3
30 A
pril
‘13
28 M
arch
‘13
28 F
ebru
ary
‘13
Share price (cents)

24 Afrimat integrated annual report 2014
Business performance
Operational reviews
Highlights FY2014 Improved market conditions across all regions Strong performance from industrial minerals division Infrasors included for the fi rst time New Durbanville quarry, in Western Cape, fully operational
Key distinguishing features Quality geological resources Operations are geographically widely spread Diverse customer base Wide product range complemented by ability to customise solutions High quality standards (including compliance with COLTO and SABS standards)
Review of 2014Financial performance
R’000
Audited February
2014
Audited February
2013 %
change
Revenue 1 346 029 846 388 59,0Contributions from operations 195 235 117 480 66,2Contributions from operations margin (%) 14,5 13,9Capital expenditure 99 039 58 930Headcount 1 390 1 094
The Mining & Aggregates segment generated excellent profi ts in light of improved market conditions and the fi rst-time inclusion in results of Infrasors for the full year. Increased mining costs were incurred in the KwaZulu-Natal region to ensure long-term compliance with Department of Mineral Resources requirements. The traditional business performed very well and this is expected to continue. The group’s industrial minerals operations performed strongly, with the Infrasors’ turnaround progressing as planned and yielding positive results.
All processing plants are fully operational and well-placed to supply market demand, which should assist in sustaining revenue going forward. Afrimat’s fl exible service delivery model supplemented by mobile equipment positions the group to take advantage of opportunities as and where they arise.
A major plant upgrade at the Glen Douglas dolomite mine was commissioned during the third quarter of the fi nancial year, which successfully increased production output of high demand products. Further, a new quarry was commissioned close to Durbanville and is now fully operational.
Clinker Group continues to produce stellar results. Management is actively addressing the life of mine restriction and is confi dent of viable opportunities.
The incorporation of Infrasors into Afrimat is progressing well. Lyttelton and Marble Hall operations are performing well while the Delf Sand operation is being impacted by high cost of transporting raw materials from Delf Cullinan due to its mineral resources being depleted. Various new initiatives implemented have resulted in improved production output and reduced costs.
Highlights FY2014 Demand for readymix products increasing countrywide
Key distinguishing features Wide product range Products carry the SABS seal of approval Products meet SARMA standards Flexible customised solutions for individual customer needs
Review of 2014Financial performance
R’000
Audited February
2014
Audited February
2013 %
change
Revenue 555 158 491 197 13,0Contributions from operations 30 409 37 291 (18,5)Contributions from operations margin (%) 5,5 7,6Capital expenditure 20 376 22 150Headcount 946 960
The Concrete Based Products segment achieved a satisfactory increase in sales pricing. However, a strike at the Gauteng operation, coupled with high cost increases, resulted in lower sales volumes and profi ts for the year.
The segment boasts a strong pipeline relating to government infrastructure and renewable energy. A shift is evident from low-cost housing to infrastructure and services spend.
The Gauteng operation returned to full production in the second half of the year following the industrial action and a renewed focus by management on labour relations is bearing fruit.
Mining & Aggregates Concrete Based Products (including Readymix)
Overall Momentum drivers across all segments
are renewable energy, road building and
maintenance by SANRAL and provinces,
as well as infrastructure and service
delivery projects from government.

25Afrimat integrated annual report 2014
Five-year review
2014R
2013R
2012R
Restated2011
R
Restated2010
R
Financial results and statusRevenue 1 901 187 222 1 337 584 566 996 137 470 854 495 775 778 015 852 Mining & Aggregates 1 346 029 103 846 387 589 704 509 731 581 878 020 487 386 941 Concrete Based Products 555 158 119 491 196 977 291 627 739 272 617 755 290 628 911
Revenue Mining & Aggregates 70,80% 63,28% 70,72% 68,10% 62,64% Concrete Based Products 29,20% 36,72% 29,28% 31,90% 37,36%
Contribution from operations 228 271 328 152 482 246 124 241 237 107 615 508 107 722 960 Mining & Aggregates 195 234 930 117 480 395 105 760 474 98 779 210 82 963 712 Concrete Based Products 30 408 618 37 290 564 21 326 908 10 809 986 24 083 054 Unsegmental 2 627 780 (2 288 713) (2 846 145) (1 973 688) 676 194
Operating profit 229 697 403 147 833 587 130 130 432 109 597 858 108 923 749 Mining & Aggregates 196 661 005 117 577 263 110 808 958 98 779 210 83 632 654 Concrete Based Products 30 408 618 37 290 564 22 505 102 13 392 336 24 083 054 Unsegmental 2 627 780 (7 034 240) (3 183 628) (2 573 688) 1 208 041
Profit after tax 162 965 395 103 777 230 90 917 042 76 762 649 72 912 631 Headline earnings 155 415 642 109 877 993 86 060 667 74 080 561 70 437 121 Net operating assets 883 238 015 752 379 393 629 379 859 604 096 567 574 859 415 Total assets 1 479 417 249 1 201 263 446 1 000 377 433 939 990 095 833 944 978 Total equity 837 963 474 761 852 233 671 906 281 605 565 234 557 772 359 Total liabilities 641 453 775 439 411 213 328 471 152 334 424 861 276 172 619 Net cash from operating activities 243 859 722 169 763 603 146 343 295 130 579 439 134 757 595
Number of ordinary shares in issue 143 262 412 143 262 412 143 262 412 143 262 412 143 262 412 Number of treasury shares (1 048 676) (204 242) (6 145 174) (5 149 510) (3 398 280)
Net number of ordinary shares in issue 142 213 736 143 058 170 137 117 238 138 112 902 139 864 132
Weighted number of ordinary shares in issue 142 620 285 142 867 266 137 371 771 138 596 357 137 236 345
Profitability ratiosContribution from operations margin Mining & Aggregates 14,50% 13,88% 15,01% 16,98% 17,02% Concrete Based Products 5,48% 7,59% 7,31% 3,97% 8,29%
Total 12,01% 11,40% 12,47% 12,59% 13,85%
Operating profit margin Mining & Aggregates 14,61% 13,89% 15,73% 16,98% 17,16% Concrete Based Products 5,48% 7,59% 7,72% 4,91% 8,29%
Total 12,08% 11,05% 13,06% 12,83% 14,00%

26 Afrimat integrated annual report 2014
Business performance
Five-year review (continued)
2014R
2013R
2012R
Restated2011
R
Restated2010
R
Earnings per ordinary share (cents) 108,3 72,1 65,7 55,0 53,1 Headline earnings per share (cents) 109,0 76,9 62,6 53,5 51,3Dividends declared (cents) Interim 11,0 8,0 6,0 6,0 6,0 Final 28,0 20,0 13,0 11,0 10,0
Total 39,0 28,0 19,0 17,0 16,0
PBIT return on net operating assets/liabilities 26,01% 19,65% 20,68% 18,14% 18,95%Return on shareholders’ funds 18,55% 14,42% 12,81% 12,23% 12,63%
Utilisation of assets ratiosRevenue: fixed assets ratio 2,86 2,66 2,32 2,12 2,02Revenue: net operating assets ratio 2,15 1,78 1,57 1,41 1,35Net asset value per share (cents) 579 530 487 436 399Tangible net asset value per share (cents) 470 422 404 353 316
Capital expenditures Mining & Aggregates 99 039 001 58 930 237 56 284 530 38 937 848 29 201 523 Concrete Based Products 20 376 026 22 150 386 14 174 863 5 098 952 8 105 819 Unallocated 1 910 943 1 853 830 1 472 850 1 940 040 779 208
121 325 970 82 934 453 71 932 243 45 976 840 38 086 550
Liquidity and solvency ratiosCurrent assets: current liabilities 1,30 1,59 2,04 1,74 1,66Debt/overdraft less cash: equity 15,53% 4,67% (4,88%) 5,24% 10,71%Total liabilities: shareholders’ funds 76,55% 57,68% 48,89% 55,23% 49,51%Dividend cover (based on headline earnings) 2,78 2,74 3,16 3,04 3,07 Interest cover 14,58 18,38 28,28 20,27 12,83
Productivity, efficiencies and consumptionNumber employees at year-end 2 381 2 085 1 605 1 630 1 440 Revenue per weighted number of employees 798 483 656 229 614 549 569 284 540 289
Depreciation 93 920 432 55 449 750 45 735 363 44 880 075 38 642 472 Amortisation of intangible assets 2 981 408 2 437 457 659 556 659 564 659 564
96 901 840 57 887 207 46 394 919 45 539 639 39 302 036
Electricity usage (Rands) 50 663 400 27 902 754 21 089 140 13 610 957 9 798 571 Fuel usage (Rands) 151 221 113 110 327 007 90 086 588 64 455 066 49 315 387 – Average fuel price (Western Cape) (Rand/litre) 12,29 10,82 9,57 7,59 6,73 Cement usage (Rands) 190 358 999 174 147 017 93 329 816 88 203 858 92 596 820 Disabling injuries frequency rate 1,41 2,15 2,86 2,47 3,66

27Afrimat integrated annual report 2014Glen Douglas
Industrial minerals at a glance
Glen Douglas
Acquired January 2011
Produces metallurgical dolomite,
aggregates and agricultural lime
products
Close proximity to steel industry
(end-user of metallurgical
dolomite)
Supplies southern parts of
Johannesburg and the Vaal area
Governance,sustainability and people
4

28 Afrimat integrated annual report 2014
Governance, sustainability and people
Corporate governance
The Afrimat board takes responsibility for the holistic application of the principles contained in King III, without diluting the group’s focus on sustainable performance. Where the board has deemed that recommended practices are not appropriate for Afrimat, we follow King III in explaining the reasons for our alternative approach.
Exceptions
Area of non-compliance Explanation of non-compliance
All members of the Audit & Risk Committee should be independent non-executive directors – presently only 75% is independent.
We acknowledge the recommendations of King III for a majority of independent non-executive directors on the board, and this will be taken into account with future appointments. However, in the interests of restricting costs the board will not remediate this until further board appointments are necessary. The current size and composition of the board is considered appropriate for the size of the company. In addition, the non-executive directors have demonstrated the ability to act independently.
All members of the Nominations Committee should be non-executive directors – presently one of the four members is an executive director of the company.
See above.
The Chairman of the board should chair the Nominations Committee and must not chair the Remuneration Committee, but may be a member of it.
The Chairman of Afrimat’s board is an independent non-executive director and is a high merit individual who objectively contributes a wide range of industry skills, knowledge and experience to the Remuneration & Nomination Committee. The fact that he is the chairman of the Remuneration Committee does not provide any conflict, as both the remuneration policy and remuneration of non-executive directors are approved by shareholders at the annual general meeting of the company. The fact that the chairman is an independent non-executive director also does not provide any conflict in terms of the remuneration of the executive directors and management.
The Chairman of the board should not be the Chairman of or member of the Audit & Risk Committee – Chairman of the board is presently a member.
A JSE governance guidance letter allows the board Chairman to be a member of the Audit & Risk Committee. In line with this and to address the shortage of independent non-executive directors, the Chairman of the board is a member of the Audit & Risk Committee. Hendrik JE van Wyk is the Chairman of the committee.
Companies should consider establishing a compliance function – presently no dedicated compliance officer.
Due to the size of the company no dedicated compliance officer is considered necessary. The CEO and FD drive compliance, supported by the relevant reporting and functional lines.
Remuneration of the three highest paid employees who are not directors should be disclosed per individual in the integrated annual report – presently not disclosed.
This is highly sensitive information in the competitive arena. Given the scarcity of skills this disclosure could lead to ‘headhunting’ of key personnel, which Afrimat will avoid at all costs in the interests of sustainability.
(The full King III register of compliance is available at www.afrimat.co.za | .)
Our boardSee our Governance Structure on page 13 | .
The Afrimat board is guided by a charter which is reviewed annually. The charter includes a delegation of authority, which states the matters to be dealt with by the board committees. A number of governance policies support and frame the delegation of authority, which are reviewed on an annual basis. The board approves all amendments. (Afrimat’s Board Charter and key governance policies are available at www.afrimat.co.za | .)
During the year non-executive director Dr Laurie Korsten sadly passed away. Laurie had been integrally involved in the
establishment of Afrimat, and served as a director and member of the Audit & Risk Committee since 2009. He will be deeply missed at the group.
Independent non-executive director Phuti RE Tsukudu was appointed to the Audit & Risk Committee in Dr Laurie Korsten’s stead.
Board committees Afrimat has an established Audit & Risk Committee, Remuneration & Nominations Committee and Social, Ethics & Sustainability Committee to assist the board in discharging its collective responsibility of corporate governance. EXCO further assists the

29Afrimat integrated annual report 2014
DirectorBoard
meetings Audit & Risk Committee
Remuneration & Nominations
Committee
Social, Ethics & Sustainability
Committee
Non-executive meetings
Loyiso Dotwana*> 4/4 4/4 3/3 2/2 4/4Francois du Toit* 4/4 1/1+ 4/4Andries J van Heerden (CEO) 4/4 4/4+ 3/3 2/2Hendrik JE van Wyk**# 4/4 4/4 4/4Hendrik P Verreynne (FD) 4/4 4/4+Marthinus W von Wielligh (Chairman)**~ 4/4 4/4 3/3 2/2 4/4Phuti RE Tsukudu** 4/4 3/3 2/2 4/4Laurie P Korsten* (deceased August 2013) 2/2 2/2 2/2Gert J Coffee 4/4 1/2
* Non-executive ** Independent non-executive # Audit & Risk Committee Chairman ~ Remuneration & Nominations Committee Chairman
> Social, Ethics & Sustainability Committee Chairman + Invitee
The group’s memorandum of incorporation provides for one-third of the non-executive directors to retire by rotation after a three-year term of offi ce. Accordingly, Hendrik JE van Wyk and Marthinus W von Wielligh will retire at the upcoming annual general meeting and being eligible, will stand for re-election.
Share dealings and conflicts of interestDirectors (including those of subsidiaries) are required to disclose their shareholdings, additional directorships and any potential confl icts of interest as well as any share dealings in the company’s securities to the internal Share Dealing Committee, consisting of the FD, company secretary and general manager human resources, for approval. Non-executive directors are required to authorise the Chairman’s share dealings prior to implementation. The company secretary, together with the sponsor and FD, ensures publication of share dealings on SENS.
Independent advice Access to the advice and services of the company secretary and to company records, information, documents and property is unrestricted. Non-executive directors also have unfettered access to the external auditors and to management at all time. All directors are entitled, at Afrimat’s expense, to seek independent professional advice on any matters concerning the affairs of the group.
Company secretary Pieter GS de Wit resigned as company secretary of Afrimat effective 7 November 2013, due to his appointment into an executive position within the group.
Mariëtte Swart, a chartered accountant, has been appointed by the board in his stead with effect from 7 November 2013.
Information Technology (‘IT’) governance IT governance is the responsibility of the Audit & Risk Committee. The committee is supported by the external auditors, the internal audit function and the IT infrastructure manager in assessing and reporting on the effectiveness of general IT and application system controls. The IT infrastructure manager performs annual adherence audits and reports to the Audit & Risk Committee on a quarterly basis.
Afrimat’s IT control framework forms part of the general internal controls framework of the business. The Audit & Risk Committee and FD, supported by the IT infrastructure manager and two senior business system managers are responsible for evaluating the security of computer systems and applications. To minimise risk, an information security management system is in place, comprising a disaster recovery capability for central fi le servers, fi re walls at major sites and data security measures. Further this team is responsible for devising the contingency plans for processing fi nancial information in the event of a system breakdown. Afrimat has an IT Governance Charter in place, further, augmented by a formal IT usage policy and disaster recovery plan (guided by the IT and business systems strategy). (Afrimat’s IT Governance Charter and policy documents are available at www.afrimat.co.za | .)
board in this regard in the context of day-to-day operations. All
committees have satisfi ed their responsibilities during the year in
compliance with their formal charters. (All Afrimat’s committee
charters are available at www.afrimat.co.za | .)
There is full disclosure from board committees to the board.
Committee chairmen provide the board with a verbal report on
recent committee activities at each board meeting, and the minutes
of committee meetings are available to the directors in support
thereof. In addition, the chairmen or a nominated committee
member attend the company’s annual general meeting to answer
any questions from stakeholders pertaining to the relevant matters
handled by their respective committees. Committee effectiveness evaluations are conducted annually. Findings and recommendations are presented to the board, which tables an action list to address any areas marked for improvement.
(See committee reports on page 41, 42 and 46 | .)
Board meetings The board meets at least four times a year with ad hoc meetings when necessary to review strategy, planning and fi nancial performance, resources, operations, risk, capital expenditure, standards of conduct, transformation, diversity, employment equity, human resources and environmental management.

30 Afrimat integrated annual report 2014
Governance, sustainability and people
Corporate governance (continued)
King III applicationIn terms of its board Afrimat complies with King III Chapter 2 as below:
Principle number Description Compliance
Chapter 2: Boards and directors
2.1 The board should act as the focal point for and custodian of corporate governance.
The board is the focal point and custodian of corporate governance at Afrimat. In accordance with the Board Charter, the board is committed to the highest standards of corporate governance.
2.2 The board should appreciate that strategy, risk, performance and sustainability are inseparable.
The board, in accordance with the Board Charter and all committee terms of reference reviewed in line with King III, is responsible for aligning the strategic objectives, vision and mission with performance and sustainability considerations. The group’s formalised risk management process takes into account the full range of risks including strategic and operational risk while considering performance and sustainability.
2.3 The board should provide effective leadership based on an ethical foundation.
The board provides effective leadership and is committed to the highest standards of ethical conduct.
2.4 The board should ensure that the company is and is seen to be a responsible corporate citizen.
See 2.1 above.
2.5 The board should ensure that the company’s ethics are managed effectively.
The Social, Ethics & Sustainability Committee is tasked with ensuring that the company’s ethics are managed effectively.
2.6 The board should ensure that the company has an effective and independent Audit Committee.
The board is satisfied that the Audit & Risk Committee is effective. The committee is chaired by an independent non-executive director. It further consists of two independent non-executive directors and one non-executive director. The board is satisfied that these directors act independently for the purposes of the committee. Afrimat acknowledges that in accordance with the King III Report all members of the committee should be independent non-executive directors, which will be borne in mind when considering future board and committee appointments. Presently membership of the committee is based on the skills and experience available on Afrimat’s board to ensure full efficacy and discharge of the committee’s responsibilities. All members are suitably qualified chartered accountants and/or experienced business leaders.
2.7 The board should be responsible for the governance of risk.
The board’s Audit & Risk Committee has conducted an evaluation of risk and is satisfied with the effective management of risk.
2.8 The board should be responsible for information technology (‘IT’) governance.
The board ensures that IT governance is an integral part of corporate governance and that it is assessed in line with the IT Governance Charter.
2.9 The board should ensure that the company complies with applicable laws and considers adherence to non-binding rules, codes and standards.
Compliance is fully integrated in the legislative, political and corporate governance risks identified in the half-yearly risk register. This ensures compliance risks are addressed with the same rigour as other categories of risk.
To ensure the best overall risk coverage, standardisation and discharging the accountability of risk owners, the implementation of all mitigation techniques is coordinated centrally.
The company received no material fines or penalties for non-compliance during the year.

31Afrimat integrated annual report 2014
Principle number Description Compliance
Chapter 2: Boards and directors
2.10 The board should ensure that there is an effective risk-based internal audit.
The board ensures that the internal audit function continues to report directly and effectively to the Audit & Risk Committee. The internal Audit Charter defines the scope of the internal audit function as assisting the board in assessing the group’s risk management and governance processes.
2.11 The board should appreciate that stakeholders’ perceptions affect the company’s reputation.
The board recognises the importance of developing and nurturing positive and stable relationships with key stakeholders as a key driver of business success. Refer Stakeholders, page 10 | .
2.12 The board should ensure the integrity of the company’s integrated annual report.
The board continues to ensure that the integrated annual report endeavours to provide a true view of the group’s commitment to financial, social and environmental value creation.
2.13 The board should report on the effectiveness of the company’s system of internal controls.
Internal audit provides a written assessment on the design, implementation and effectiveness of the company’s system of internal financial controls on an annual basis. Based on the results of this assessment, the Audit & Risk Committee is able to form an opinion on whether the internal financial controls form a sound basis for the preparation of reliable financial statements. The Audit & Risk Committee reports to the board and this is reported in the integrated annual report.
2.14 The board and its directors should act in the best interests of the company.
The board acknowledges its role as a trustee on behalf of the shareholders. In addition to the Code of Conduct, the members of the board are governed by a formal policy in respect of dealing in Afrimat shares.
2.15 The board should consider business rescue proceeding or other turnaround mechanisms as soon as the company is financially distressed as defined in the Act.
The board monitors the company’s solvency and liquidity. Business rescue has not been required.
2.16 The board should elect a Chairman of the board who is an independent non-executive director. The CEO of the company should not also fulfil the role of Chairman of the board.
The Chairman, Marthinus W von Wielligh, is an independent non-executive Chairman and the roles of CEO and Chairman are clearly defined and separated.
2.17 The board should appoint the CEO and establish a framework for the delegation of authority.
The board has appointed Andries J van Heerden as CEO and a delegation of authority framework is contained in the Board Charter and reviewed annually.
2.18 The board should comprise a balance of power, with a majority of non-executive directors. The majority of non-executive directors should be independent.
The board comprises a majority of non-executive directors. It comprises three independent non-executive directors, two non-executive directors and three executive directors.
The responsibilities of the Chairman and CEO, and those of other non-executive and executive directors, are clearly separated to ensure a balance of power and prevent any one director from exercising unfettered powers of decision-making. The Chairman provides leadership to the board in all deliberations ensuring independent input, and oversees its efficient operation. The CEO is responsible for proposing, updating, implementing and maintaining the strategic direction of Afrimat as well as ensuring appropriately supervised and controlled daily operations. In this regard, the CEO is assisted by the FD and another executive director.
The independent non-executive directors and non-executive directors are high merit individuals who objectively contribute a wide range of industry skills, knowledge and experience to the board’s decision-making process. These directors are not involved in the daily operations of the company.
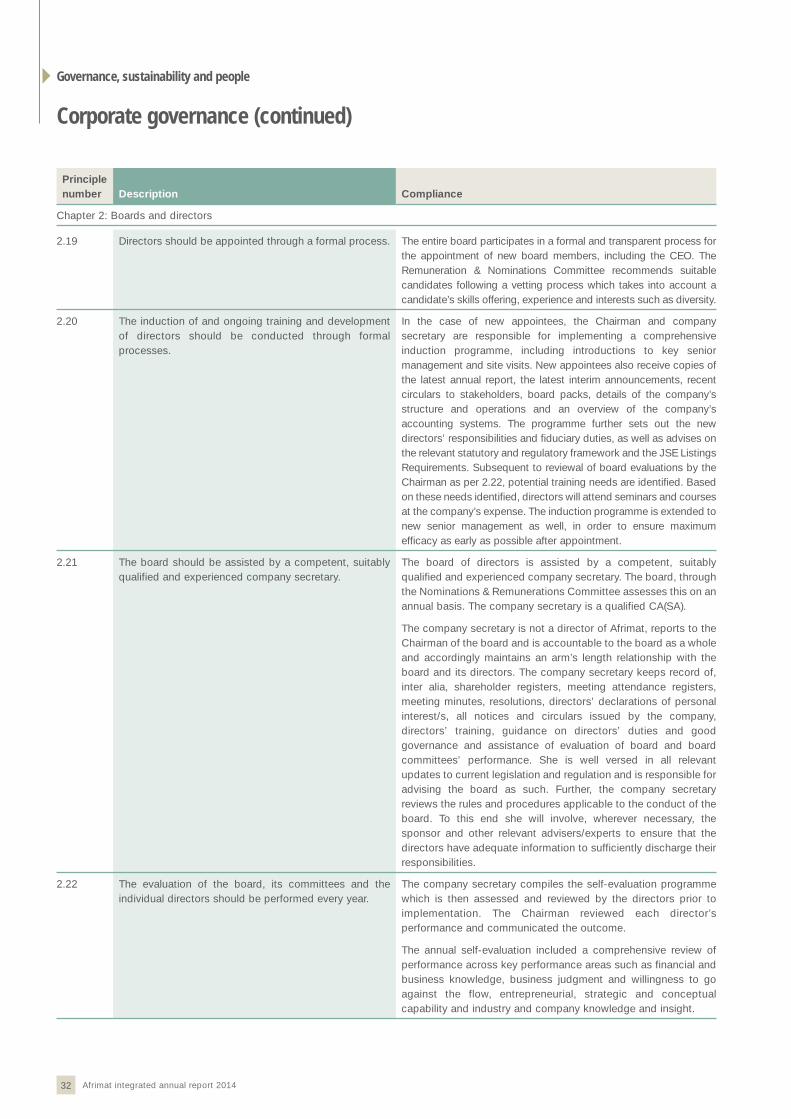
32 Afrimat integrated annual report 2014
Governance, sustainability and people
Corporate governance (continued)
Principle number Description Compliance
Chapter 2: Boards and directors
2.19 Directors should be appointed through a formal process. The entire board participates in a formal and transparent process for the appointment of new board members, including the CEO. The Remuneration & Nominations Committee recommends suitable candidates following a vetting process which takes into account a candidate’s skills offering, experience and interests such as diversity.
2.20 The induction of and ongoing training and development of directors should be conducted through formal processes.
In the case of new appointees, the Chairman and company secretary are responsible for implementing a comprehensive induction programme, including introductions to key senior management and site visits. New appointees also receive copies of the latest annual report, the latest interim announcements, recent circulars to stakeholders, board packs, details of the company’s structure and operations and an overview of the company’s accounting systems. The programme further sets out the new directors’ responsibilities and fiduciary duties, as well as advises on the relevant statutory and regulatory framework and the JSE Listings Requirements. Subsequent to reviewal of board evaluations by the Chairman as per 2.22, potential training needs are identified. Based on these needs identified, directors will attend seminars and courses at the company’s expense. The induction programme is extended to new senior management as well, in order to ensure maximum efficacy as early as possible after appointment.
2.21 The board should be assisted by a competent, suitably qualified and experienced company secretary.
The board of directors is assisted by a competent, suitably qualified and experienced company secretary. The board, through the Nominations & Remunerations Committee assesses this on an annual basis. The company secretary is a qualified CA(SA).
The company secretary is not a director of Afrimat, reports to the Chairman of the board and is accountable to the board as a whole and accordingly maintains an arm’s length relationship with the board and its directors. The company secretary keeps record of, inter alia, shareholder registers, meeting attendance registers, meeting minutes, resolutions, directors’ declarations of personal interest/s, all notices and circulars issued by the company, directors’ training, guidance on directors’ duties and good governance and assistance of evaluation of board and board committees’ performance. She is well versed in all relevant updates to current legislation and regulation and is responsible for advising the board as such. Further, the company secretary reviews the rules and procedures applicable to the conduct of the board. To this end she will involve, wherever necessary, the sponsor and other relevant advisers/experts to ensure that the directors have adequate information to sufficiently discharge their responsibilities.
2.22 The evaluation of the board, its committees and the individual directors should be performed every year.
The company secretary compiles the self-evaluation programme which is then assessed and reviewed by the directors prior to implementation. The Chairman reviewed each director’s performance and communicated the outcome.
The annual self-evaluation included a comprehensive review of performance across key performance areas such as financial and business knowledge, business judgment and willingness to go against the flow, entrepreneurial, strategic and conceptual capability and industry and company knowledge and insight.

33Afrimat integrated annual report 2014
Principle number Description Compliance
Chapter 2: Boards and directors
2.23 The board should delegate certain functions to well-structured committees but without abdicating its own responsibilities.
The board delegates certain functions without abdicating its own responsibilities to the following committees: Audit & Risk Committee; Remuneration & Nominations Committee; and Social, Ethics & Sustainability Committee.
2.24 A governance framework should be agreed between the group and its subsidiary boards.
Afrimat ensures sound corporate governance throughout the group, communicating policies on corporate governance and ethics to subsidiary boards and their financial managers. The FD and Audit & Risk Committee review application of and compliance with recommendations and legislation at subsidiary level.
2.25 Companies should remunerate directors and executives fairly and responsibly.
The group’s remuneration philosophy reflects Afrimat’s commitment to best practice. The Remuneration & Nominations Committee determines the remuneration policy on executive and senior management remuneration in line with the group’s remuneration philosophy. The total remuneration packages of the executive directors and senior management are subject to annual review as benchmarked against external market data, taking into account the size of the company, its market sector and business complexity. A detailed remuneration report is contained in the integrated annual report on page 41 | .
2.26 Companies should disclose the remuneration of each individual director and certain senior executives.
The remuneration of directors is disclosed in the integrated annual report on page 97 | . The executive directors are deemed to be the prescribed officers. Refer to page 28 for reason as to why the three highest employee salaries are not disclosed | .
2.27 Shareholders should approve the company’s remuneration policy.
Shareholders consider and endorse, by way of a non-binding advisory vote, the company’s remuneration policy at the annual general meeting.
(The full King III register of compliance is available at www.afrimat.co.za | .)

34 Afrimat integrated annual report 2014
Governance, sustainability and people
Risk management
Risk management and assuranceThe board, assisted by the Audit & Risk Committee, is ultimately responsible for the risk management process. The board is satisfi ed with the effectiveness of the process in the year under review.
Combined assurance modelA combined assurance model is applied to provide a coordinated approach to assurance activities. The assurance activities are conducted by board committees, external auditors, internal auditors, via self-audits by specialist staff, external consultants, industry bodies, DMR and government agencies.
External auditThe independent external auditor, Mazars Inc., as recommended by the Audit & Risk Committee and appointed by the shareholders, is responsible for reporting on whether the annual fi nancial statements are fairly presented in compliance with IFRS and the Companies Act. The preparation of the annual fi nancial statements remains the responsibility of the directors.
Risk processThe CEO and FD, supported by EXCO and the Audit & Risk Committee, are responsible for identifying, evaluating and managing key risk areas and performance indicators for Afrimat (crossing the fi nancial and non-fi nancial divide). Risk appetite and levels of tolerance are set out in the group’s risk policy, which is reviewed annually (available at www.afrimat.co.za | ). An ad hoc additional risk analysis is also conducted for major strategic decisions.
To ensure ongoing relevance, a formal risk assessment is conducted bi-annually and the necessary updates are made to the risk register. In addition, throughout the year changes in risk relative to the formal register are reported to the Audit & Risk Committee (and the board), together with an impact assessment and how the identifi ed risk will be managed.
Risks are classifi ed in the sub-categories of: Business strategy Economic Legislative, political and corporate governance Social Operational SHE Financial Human resources Market and competition behaviour IT
In assessing risk, Afrimat reviews performance in terms of profi t growth, return on new investments and debt levels against targets set during the annual budget process. In addition the group monitors profi tability, utilisation of assets, liquidity/solvency, and productivity levels on a monthly basis.
The group’s reputational risk is managed through strategic relationships and liaison with stakeholders. The CEO is the central point of contact assisted by investor and communications service providers. (For further detail on this and other risks, see Principal Risks on page 12 | .)
The board, assisted by the Audit & Risk Committee, is satisfi ed with the effectiveness of the risk management process.
External auditThe board, assisted by the Audit & Risk Committee, regularly meets
with the external auditor and formally evaluates their independence
annually. As a rule the board does not engage the external auditor
for any non-audit services, including tax compliance and assisting
with company secretarial duties. Where the external auditor is, as
an exception, appointed for non-audit services, the board ensures
that there is a strict separation of divisions in order to maintain
independence.
Internal auditThe group’s Internal Audit Charter has its own terms of reference
clearly defi ned and monitored by the Audit & Risk Committee,
which conducts an annual review thereof. (Afrimat’s Internal Charter
is available at www.afrimat.co.za | .) The in-house internal audit
function also adheres to the standards set by the Institute of
Internal Auditors in fulfi lling its key duties, including:
evaluating the company’s governance processes;
performing an objective assessment of the effectiveness of risk
management and the internal control framework;
systematically analysing and evaluating business processes and
associated controls; and
providing a source of information regarding instances of fraud,
corruption, unethical behaviour and irregularities.
Andre Smith is the chief audit executive and in this role reports
directly to the chairman of the Audit & Risk Committee and has
unhindered access to the board and group Chairman.
A risk-based internal audit programme was followed during the
year. The fi ndings were reviewed and remediated by management
where practical and follow-up audits were conducted to ensure
corrective action was implemented.
Internal control frameworkThe board is responsible for the group’s systems of internal control
and risk management (as above). The Audit & Risk Committee, FD
and internal audit assist in this regard. Together they evaluate the
adequacy and effectiveness of internal control systems and
processes, and monitor whether internal control recommendations
made by the FD, external auditors and internal auditors have been
implemented. The internal control framework together with the
required assurance is formally documented and reviewed by the
Audit & Risk Committee annually.
The systems are primarily designed to safeguard and maintain
accountability of the group’s assets. Further, these systems should
identify and curtail signifi cant fraud, potential liability, loss and
material misstatement while complying with applicable statutory
laws and regulations.
The systems are designed to manage rather than eliminate risk.
Absolute assurance cannot be provided. For instance, they provide
only reasonable assurance as to the integrity and reliability of the
annual fi nancial statements. Inherent limitations to the system’s
effectiveness exist due to the possibility of human error and the
circumvention or overriding of controls. Internal audit, based on the
fi eld work undertaken during the year, has provided reasonable
assurance on the adequacy of the internal controls tested and the
associated risk management process.

35Afrimat integrated annual report 2014
The importance of internal control systems and management of risks is clearly communicated to all employees so that they have a clear understanding of their roles and obligations in this regard.
Legal compliance Compliance is driven by the CEO, FD and senior management, supported by internal audit. The group has a legal compliance checklist in place which includes the Mining Charter. Further,
Afrimat voluntarily adheres to the Business Leadership South Africa Code of Good Corporate Citizenship.
EXCO and senior management make an annual declaration that all laws have been complied with, based on there being no reported instances of non-compliance. The effectiveness of the compliance framework is continuously monitored at board level.
Mining licence compliance
We are committed to conducting our mining operations in strict compliance with the mining licence conditions set by the DMR, Mine Health and Safety Act, and other relevant regulations. This compliance is driven by the general manager: sustainability for the Afrimat group and includes the following divisions: Health and Safety, Environment, Quality, Compliance and Skills Development (in line with the sub-sections of the Mining Charter).
Mining licence conditions set by the DMR are refl ected in the following documents for each mining operation and annual reports are submitted to the regional DMR offi ces: Mine Works Programme Social and labour plan EMP Mining Charter
The DMR performs random inspections and scheduled audits at the group’s quarries and all issues identifi ed are addressed by management.

36 Afrimat integrated annual report 2014
Governance, sustainability and people
Health and safety
Our employees work in an environment which poses potential health and safety risks. We proactively manage this risk to prevent health and safety incidents. We are committed to providing a safe and healthy working environment which is in strict compliance with the South African Occupational Health and Safety Act, Mine Health and Safety Act, and other relevant regulations and recognised standards and guidelines.
The DIFR reduced to 1,41 from 2,15
at the end of the previous year.
CEO
Health & Safety reporting framework
Group SHE managerpp gg
General manager: sustainabilitygg yy
Regional managergg gg
Regional Health & Safety manager/offi cergg yy gg
Employeespp yy
Responsibility for health and safety devolves down from the general manager: sustainability and group SHE manager to all levels of employees, and radiates up again with the CEO taking ultimate responsibility.
Regional managers assume full accountability for SHE management throughout their respective regions. They are responsible and accountable for the proper resource utilisation and day-to-day management. Regional H&S offi cers have a functional reporting relationship to the regional managers, and thereby to the group SHE manager.
The group SHE manager, Katarien Deysel, is responsible for devising new policies. These are communicated through company notice boards, management meetings and each operation’s monthly safety meeting. Responsibility for compliance rests at every level throughout the group down to each individual employee. The Health & Safety Policy was reviewed during the year by management and no changes were required. (A copy of our Health & Safety Policy is available at www.afrimat.co.za | .)
Health & Safety risk processHealth and safety risks are identifi ed through annual HIRAs at each site. HIRAs establish a rating of hazards according to the likelihood of occurrence.
Risks identifi ed in HIRAs are mitigated through: Engineering devices – guards, safety devices, personal protective equipment, etc.
Administration – Safe Operating Procedures describing the hazards and mitigation factors. These too are reviewed annually.
Training – on the Safe Operating Procedures to ensure employees are fully conversant with the relevant hazards and the purpose of the engineering devices installed.
In addition, Codes of Practice are in place for the mitigation of generic mining-related risks. Codes of Practice are mandatory documents that must be prepared and implemented on request of the Chief Inspector of Mines. These are reviewed as per prescription in their guidelines.
Afrimat’s Incident Management System guides reporting on all incidents resulting in property damage; having a negative impact on the environment; related to injuries being treated by fi rst aid only; related to lost-time injuries; and related to fatal injuries. Any reported incidents are set out in the following reports: Injury On Duty Report – lost-time injuries, used to report on the DIFR; near misses and property damage report; and fi rst aid and medical cases report.
The regional H&S offi cer responsible for the affected site is responsible for investigating the report further, reporting to the regional manager and then the group SHE manager.
During the year Afrimat achieved a DIFR of 1,41 (2013: 2,15), refl ecting a decrease in the number of reportable injuries, of which the majority were in any event of minor nature.
Afrimat is a member of independent associations ASPASA, which annually audits the quarries, and SARMA, which annually audits the readymix plants. The DMR also performs random inspections and scheduled audits at the group’s quarries. The Department of Labour performs random inspections at the group’s concrete product plants and workshops. Areas for improvement identifi ed during these audits/inspections are addressed by management where practical.
Health & Safety trainingDuring the year a range of health and safety training was conducted: SHE induction for new employees (and annual refresher for all existing employees)
First aid for expired certifi cates HIRA as per job specifi cations on each site Safe Operating Procedures as per job specifi cations on each site General fi re fi ghting for expired certifi cates Operators/drivers training for expired certifi cates and new operators/drivers
NOSAs Samtrac courses SHE representatives
Our employees’ well-beingWe have an occupational healthcare system for our employees that is geared towards total wellness and incorporates annual medical testing for all employees.
We conduct the following medicals: Annual medical: all staff exposed to occupational health risks at operational sites: quarries, sand mines, workshops, concrete product plants, readymix plants and administration staff who frequently visit the sites;

37Afrimat integrated annual report 2014
Entry medicals: all staff before entering Afrimat’s service in order
to establish whether the individual is fi t to perform the specifi c
work and to establish a medical baseline;
Exit medicals: all employees leaving Afrimat’s service in order to
establish an exit reference and baseline comparative; and
Follow-up medicals: identifi ed during annual and/or entry
medicals by the health professionals.
Voluntary HIV/AIDS counselling and testing is offered during annual
medical examinations and on an ongoing basis at all of Afrimat’s
onsite clinics. Our response to the HIV/AIDS pandemic is set out in a formal policy (Afrimat’s HIV Policy is available at www.afrimat.co.za | ). The policy strives to prevent discrimination against employees living with HIV/AIDS and encourages early detection and treatment. Awareness around HIV/AIDS issues is highlighted through the following channels: posters communicating information on HIV/AIDS and TB symptoms and awareness;
staff newsletters; and information leafl ets distributed prior to World AIDS Day.

38 Afrimat integrated annual report 2014
Governance, sustainability and people
Environmental responsibility
We operate in an industry (opencast mining) that has a signifi cant impact on the environment. Environmental management is therefore a critical part of the day-to-day management processes at Afrimat.
In recognition of the importance of this aspect of operations, in the previous year we appointed a dedicated environmental conservation offi cer (Louis de Wet) with the aim of furthering our commitment to containing our environmental impact.
It goes without saying that we comply with all environmental legislation. To support this, our quarries’ environmental performance is audited every second year by ASPASA and SARMA audits the readymix plants annually. The DMR also performs random inspections at the group’s quarries. Areas for improvement identifi ed during these audits/inspections are addressed by management.
We manage our environmental footprint with mandatory EMPs at all the mines, in the absence of which no mining activities will commence. These focus on: responsible mining; reducing emissions; reducing spillages; recycling; monitored water usage; and rehabilitation.
In terms of the EMPs, the group’s operations seek ways to monitor dust emissions, decrease noise pollution, fi nd safe and bunted storage for hazardous chemical substances, and recycle effectively.
The EMPs and Environmental HIRAs during the year were reviewed by management and external consultants/specialists and only minor changes were required, all of which were implemented.
Regional managergg gg
Regional H&S manager/offi cergg gg
Employeespp yy
Environmental conservation offi cer
Group SHE managerpp gg
General manager: sustainabilitygg yy
CEO
Environmental reporting framework
The group SHE manager is responsible for ensuring compliance with the site EMPs, assisted by the regional managers and the group environmental conservation offi cer. The regional managers assume responsibility for all sites in their respective regions and have full control of regional environmental resources.
Environmental training Training was identifi ed as the fi rst step in improving the mitigation of the risks identifi ed during the year. Programmes conducted for all employees during the year included SHE induction for new employees and revision for all existing employees.
Environmental initiativesDuring the year the following measures were implemented to conserve precious resources and decrease Afrimat’s carbon footprint: benchmarking of operational output and the use of electricity, fuel and explosives;
determination of the basic needs for optimum production leading to the establishment of a standard of consumption rate per machine;
ongoing monitoring of power factor corrector capacitors to ensure a decreasing trend in electricity usage;
sequential start-up of electrical motors at each start-up procedure;
a shift in production times to fall in non-peak consumption periods for electricity; and
used oil to be sold to accredited companies for recycling purposes.
The group has committed to undertaking formal carbon footprint assessments in the current fi nancial year. The initial assessments will be conducted internally.
Afrimat did not incur any fi nes for infringement of environmental legislation during the year.

39Afrimat integrated annual report 2014
Human capital
Not only do we consider our employees as key to our success but in many ways, we see them as an area of our business in which we have achieved considerable success. This is evident in our consistently low staff turnover resulting in a deepening skills pool. We have a strong value system which is deeply entrenched in the group and a pervasive culture of teamwork to create a climate of growth, including skills programmes, empowerment training, and active involvement by leadership in mentoring and advancing employees.
However, we realise that this is dynamic and requires ongoing attention from the stage of recruitment through to advancement. We need to identify, target and hire the ‘right people for the right job’, and then actively seek ways to add value to their lives through attractive career opportunities, market-related remuneration and an inclusive and enabling work environment.
We also recognise that we have a responsibility in the wider employment context. Accordingly we look to surrounding communities to supplement our project labour force and in this way create jobs, and practice a limited automation policy (particularly at our brick and block plants) aimed at preserving as many jobs as possible without impacting sustainability.
The general manager human resources, Anton Gerber, assisted by all management is responsible for our employee relations and overseeing initiatives in this regard.
We have identifi ed industrial action as a high risk (see Principal risks and opportunities on page 12 | ). We strictly comply with all applicable legislation and bargaining arrangements and in addition, have a strategic engagement process with unions and employees (see Our Stakeholders on page 10 | ). The Skills Development and Employment Equity Consultative Committees of each subsidiary communicate with the unions representing Afrimat’s employees. These include: Solidarity; National Union of Mineworkers; National Union of Metal Workers of South Africa; Building Wood and Allied Workers Union of South Africa; and United Association of South Africa.
Skills developmentCourses during the year included plant and equipment maintenance, blasting, project leadership, materials testing, computer literacy, Adult Basic Education and Training, H&S and sales.
2014 review: R15,7 million (2013: R11,0 million) committed to
skills development, bursaries, training, learnerships
and internships for the year
70,6% of expenditure was in respect of black
employees
Focused on training where available skills are
limited
Specifi ed operator training for all operators of
specialised equipment
Our skills development programme forms a cornerstone of our employee attraction and retention strategy. We believe that a trained, informed and skilled workforce will be personally satisfi ed and therefore retained, leading to a deepening skills pool and in turn driving higher productivity and profi tability. In the wider perspective, skills development boosts the skills pool in our sector generally by equipping employees with new technical, administrative and management skills.
Afrimat’s skills development division is responsible for identifying needs across the group and implementing and monitoring initiatives. Skills development needs are determined in terms of regular performance appraisals and the day-to-day interaction with employees.
During the year under review we specifi cally focused on lower skills levels, as we see these as integral to entrenching our positive culture of teamwork and empowerment.

40 Afrimat integrated annual report 2014
Governance, sustainability and people
Skills initiatives
Initiative Detail Target participants
Talent Management Programme
Targeted at the group’s top employees, which is a reward and an incentive in itself. The programme is aimed at managing their performance and retention through recognition, reward and motivation, and in so doing developing young talent for good succession planning. We ensure that these employees remain abreast of new technology and are equipped with appropriate skills for future promotion.
The group’s top 30 employees identified through a prescribed evaluation process.
Afrimat Management Development Programme
A three-year in-house programme, custom-designed for Afrimat as part of its strategy to create a sustainable team for the future.
Production managers, quarry foremen, concrete products production managers and foremen on readymix and concrete products plants.
Study assistance We provide study loans and support to our employees for tertiary qualifications relevant to their positions and/or potential advancement at the group.
Employees in production, administration, marketing, management and leadership.
Internships Afrimat is a workplace provider (providing practical workplace exposure within the candidate’s field of study) in partnership with the Mining Qualifications Authority – the mining sector SETA.
During the year 17 internships were in place. In the event that a suitable vacancy is available in the group then interns are considered for placement.
External persons who have completed their academic courses.
Learnerships The Afrimat Learnership Programme focuses on the recruitment of learners to be trained and developed as qualified artisans and for other technical occupations in the group.
During the year 34 artisan learnerships and nine other learnerships were in place. These learnership employees are considered for placement, in the event that a suitable vacancy is available in the group.
Employees and external persons with the required aptitude.
Human capital (continued)

41Afrimat integrated annual report 2014
Remuneration
The Remuneration & Nominations Committee assists the board in ensuring that group remuneration and recruitment is aligned with the overall business strategy, with the aim of enabling Afrimat to attract and retain personnel who will create long-term value for all stakeholders.
The committee is an independent and objective body which monitors and strengthens the credibility of the group’s executive remuneration system. It ensures that executive remuneration is linked, in part, to individual performance, the group’s performance and market conditions and benchmarks. The committee considers and makes recommendations to the board on remuneration packages and policies in this regard. It is therefore authorised by the board to seek any information required from any employee and may further obtain external legal and/or other independent professional advice if deemed necessary, at the expense of the group.
The manner in which the committee is structured and its responsibility demonstrates to all stakeholders that the remuneration of executives is set by independent, objective persons who have no personal interest in the outcome of their decisions and who will give due regard to the interests of all stakeholders and to the fi nancial and commercial health of the group in reaching their recommendations. Remuneration and benefi ts of executive directors are disclosed on page 97 of this report. Prescribed offi cers are defi ned as those who exercise general executive control over and management of the whole or signifi cant portion of the business and activities of the group, or who regularly participates to a material degree in such exercise of general executive control and management | .
The committee is further responsible for devising a general remuneration policy for the group, which is tabled annually at the annual general meeting for a non-binding advisory vote by shareholders.
Remuneration policy The group pays market-related salaries relevant to an individual’s position and the region/area in which he/she will be employed, taking into account his/her qualifi cations, experience and performance. This is benchmarked against Deloitte’s annual industry remuneration paper and the research of external consultants, Compensation Technologies, who are employed particularly for this purpose to ensure independence and integrity
of information. The administration of the group’s retirement and provident funds is outsourced to ABSA Bank Limited, which advises on market trends in retirement benefits.
The group’s executives are remunerated in terms of a remuneration package and incentivised with a short-term incentive bonus and long-term share appreciation rights scheme. The remuneration packages are structured on a ‘cost to company’ basis and include contributions to health care and retirement benefits. Annual increases to executive remuneration packages are adjusted for changes in the general cost of living. Performance incentives are calculated in terms of defined profit targets and key performance indicators (‘KPIs’), including risk management effi cacy. Details of the share appreciation rights scheme for executive directors and senior management are disclosed on pages 50, 82 and 83 of this report | . (Afrimat’s full remuneration policy is available at www.afrimat.co.za | .)
The board and committee member remuneration structure consists of a fi xed fee as set out in the table below:
Type of fee
Proposed annual fee
2014/15 R
Existing annual fee
2013/14 R
BoardChairman 500 000 467 000Board member 150 000 130 000
Audit & Risk CommitteeChairman 92 000 86 000Member 58 000 54 000
Remuneration & Nominations CommitteeChairman 50 000 46 000Member 32 000 30 000
Social, Ethics & Sustainability CommitteeChairman 50 000 46 000Member 32 000 30 000
No material payments that are ex gratia in nature have been paid during the year under review.

42 Afrimat integrated annual report 2014
Governance, sustainability and people
Social, ethics and sustainability
The Social, Ethics & Sustainability Committee’s responsibilities encompass monitoring and regulating the impacts of the group on its material stakeholders and environments. Although management is tasked with overseeing the day-to-day operational sustainability of their respective areas of business, and reporting thereon to the committee, the board retains ultimate responsibility for group sustainability.
The committee is chaired by non-executive director Loyiso Dotwana and further comprises CEO Andries J van Heerden, executive director Gert J Coffee, and independent non-executive board Chairman Marthinus W von Wielligh. Details of meeting attendance are on page 29 | .
Key indicators monitored by the committee include:
Indicator Standard or future goal
Transformation and B-BBEE ratings including: B-BBEE ownership Management control Employment equity Skills development and training Preferential procurement Enterprise development Socio-economic development
Level 4 B-BBEE rating for all operating subsidiaries achieved annually
Labour relations Maintain employee satisfaction (turnover rate; industrial action, etc)Effectively manage expectations and union relations to minimise labour unrest
Health and safety Zero DIFR
Environment including: Carbon footprint Water and forestry compliance and returns
Zero harm to environmentCompliance with mining licence EMPs
DMR compliance including: Mine Works Programme Social and labour plan EMP Mining Charter returns
All existing mining licences maintainedAll future mining licence applications predicated on group’s reliable track record of compliance
Mining rights/licence status including: New applications Conversion of old order mining rights NEMA/LUPO regulations
Business expansion not restricted by insufficient mining licences
Compliance with laws and regulations Full compliance with all laws and regulations
The full purpose of the committee is to regularly monitor the group’s activities with regard to any relevant legislation, other legal requirements or prevailing codes of best practice, in respect of the following: Social and economic development including the group’s standing in terms of the:
– 10 principles set out in the United Nations Global Compact Principles
– Organisation for Economic Co-operation and Development recommendations regarding corruption
– Employment Equity Act – B-BBEE Act Good corporate citizenship, including the group’s:
– promotion of equality, prevention of unfair discrimination, and reduction of corruption
– contribution to development of the communities in which our activities are predominantly conducted or within which our products or services are predominantly marketed
– record of sponsorship, donations and charitable giving Environment, health and public safety, including the impact of the group’s activities and its services
Consumer relationships, including the group’s advertising, public relations and compliance with consumer protection laws
Labour and employment, including the group’s:
– standing in terms of the International Labour Organisation
Protocol on decent work and working conditions
– employment relationships, and our contribution towards the
educational development of our employees
The committee draws these matters to the attention of the board and
reports on them to the shareholders at the annual general meeting.
Employment equity, B-BBEE, CSI and labour-related issues as
reviewed by the committee are reported on pages 39 and 43 | .
Management reports to the committee on matters relevant to its
deliberations to enable the members to fulfi l their responsibilities.
Mechanisms to encourage ethical behaviour such as the Code of
Conduct, corporate citizenship policy and whistle blowers hot line,
were confi rmed as adequate by the committee in the year.
The group fosters a culture of respect, with zero-tolerance of
discriminatory behaviour. No incidents of discrimination were
reported during the year. Afrimat fully complies with employment
laws and practices and is committed to the protection of human
rights.

43Afrimat integrated annual report 2014
Transformation
We are committed to integrating genuine transformation that permeates the organisation, and understand this to be critical for the sustainability of our business in South Africa. Each subsidiary has a dedicated BEE Committee which actions the plans and recommendations of the Social, Ethics & Sustainability Committee in this regard, and further proactively drives improvements in all B-BBEE categories.
OwnershipOur main BEE partners are our Afrimat BEE Trust, benefi ting black Afrimat employees, Mega Oils (Pty) Limited and Joe Kalo Investments (Pty) Limited – both 100% black-owned companies. Black ownership in the group totals 26,01% in line with Mining Charter requirements.
Afrimat BEE Trust: 21,71% Mega Oils (Pty) Limited 4,11% Joe Kalo Investment (Pty) Limited 0,19%
The group’s B-BBEE ratings are set out below:
Subsidiary name
2014 B-BBEE
rating level
Afrimat Aggregates (Trading) (Pty) Limited 3Ikapa Quarries (Pty) Limited 3Afrimat Readymix (Cape) (Pty) Limited 4Afrimat Aggregates (KZN) (Pty) Limited 4Afrimat Aggregates (Operations) (Pty) Limited 4Afrimat Aggregates (Eastern Cape) (Pty) Limited 4Afrimat Contracting International (Pty) Limited 4Afrimat Concrete Products (Pty) Limited 5Infrasors Holdings Limited 5Glen Douglas Dolomite (Pty) Limited 7
Management controlOur board includes two black directors, one of whom is female. All subsidiaries have at least 50% black directors on their respective boards of directors. To enhance and accelerate development of management skill, suitable candidates are identified to undergo management development training and black candidates are prioritised wherever viable (see Afrimat’s Management Development Programme on page 40 | ).
Employment equityA total of 81,2% (2013: 82,4%) of the group’s 2 381 employees are black.
A formal Employment Equity Policy is in place for all employees and potential candidates, which promotes equal opportunities by
encouraging good practice in the recruitment and selection process complying with the Employment Equity Act. (Afrimat’s Employment Equity Policy is available on www.afrimat.co.za | .) In recruitment and promotion, the governing principle is ‘from within the group’ and priority is given to the advancement of black employees.
Employment equity goals are communicated to employees via the various subsidiaries’ Skills Development and Employment Equity Consultative Committees.
We are also proactive in recognising and rewarding initiative, effort and merit. Attractive remuneration and incentive schemes are outlined in the remuneration policy to attract and retain employees over the short, medium and long term. (See Remuneration Report page 41 | .)
Skills development and training (See Human Capital on page 39 | .)
Preferential procurementA formal preferential procurement policy is in place which refl ects the group’s commitment to broadening its supplier base with empowered enterprises who can supply goods and services on a preferred basis. The preference is for suppliers with minimum Level 5 B-BBEE contribution and black shareholding greater than 25%.
Enterprise developmentOur group provides extensive management advice, administration services and working capital funding to BEE entrepreneurial enterprises, and also procures services from these enterprises.
These include: Joe Kalo Investments (Pty) Limited – investment business; Ikapa Quarries (Pty) Limited – mining services and vehicle rental business;
transport sub-contractor schemes; lorry owner/driver schemes; and sand mining businesses.
These enterprises are further assisted by settling monthly purchases earlier than the normal payment terms applicable to suppliers and granting credit facilities relating to fuel purchases and workshop services.
Socio-economic developmentOur CSI focus is on the empowerment of the communities surrounding our operations, with specific beneficiaries negotiated with local economic fora. The group targets 1% of PAT for contribution to these benefi ciaries. Benefi ciaries include schools, community upliftment organisations, health and HIV/AIDS programmes. CSI expenditures during FY2014 amounted to R4,5 million (2013: R2,0 million).

Afrimat Limited annual fi nancial statementsfor the year ended 28 February 2014
6
Ladysmith
The integrated annual report and
the annual fi nancial statements have
been prepared under the supervision
of the FD, Hendrik P Verreynne
B Compt. Hons CA(SA).
The annual fi nancial statements
have been audited in compliance
with the Companies Act No. 71
of 2008, as amended.
Publication date: 24 June 2014.
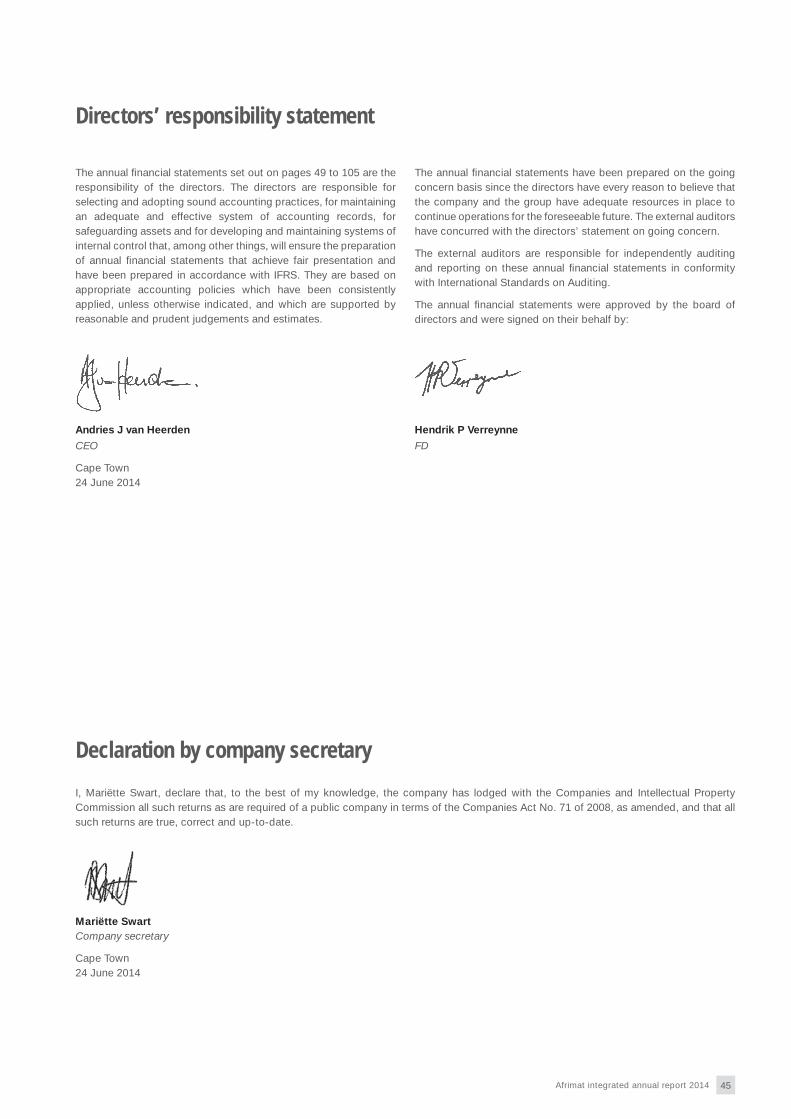
45Afrimat integrated annual report 2014
Directors’ responsibility statement
The annual financial statements set out on pages 49 to 105 are the responsibility of the directors. The directors are responsible for selecting and adopting sound accounting practices, for maintaining an adequate and effective system of accounting records, for safeguarding assets and for developing and maintaining systems of internal control that, among other things, will ensure the preparation of annual financial statements that achieve fair presentation and have been prepared in accordance with IFRS. They are based on appropriate accounting policies which have been consistently applied, unless otherwise indicated, and which are supported by reasonable and prudent judgements and estimates.
Declaration by company secretary
I, Mariëtte Swart, declare that, to the best of my knowledge, the company has lodged with the Companies and Intellectual Property Commission all such returns as are required of a public company in terms of the Companies Act No. 71 of 2008, as amended, and that all such returns are true, correct and up-to-date.
Mariëtte SwartCompany secretary
Cape Town24 June 2014
The annual financial statements have been prepared on the going concern basis since the directors have every reason to believe that the company and the group have adequate resources in place to continue operations for the foreseeable future. The external auditors have concurred with the directors’ statement on going concern.
The external auditors are responsible for independently auditing and reporting on these annual financial statements in conformity with International Standards on Auditing.
The annual financial statements were approved by the board of directors and were signed on their behalf by:
Andries J van Heerden Hendrik P Verreynne
CEO FD
Cape Town24 June 2014

46 Afrimat integrated annual report 2014
Annual fi nancial statements
Audit & Risk Committee report
The information below constitutes the report of the Audit & Risk
Committee in respect of the year under review.
CompositionThe committee is chaired by independent non-executive director
Hendrik JE van Wyk and further comprises independent non-
executive board Chairman Marthinus W von Wielligh, non-
executive director Loyiso Dotwana and independent non-executive
director Phuti RE Tsukudu. The board of directors is satisfied that
these directors act independently for the purposes of the
committee.
Afrimat acknowledges that in accordance with the King III Report all
members of the committee should be independent non-executive
directors, which will be borne in mind when considering future
board and committee appointments. Presently membership of
the committee is based on the skills and experience available
on Afrimat’s board to ensure full effi cacy and discharge of the
committee’s responsibilities. All members are suitably qualified
chartered accountants and/or experienced business leaders.
AttendanceThe committee met four times during the year and attendance is set
out in the table on page 29. The committee assists the board in
fulfilling its review and control responsibilities.
Role and responsibilitiesThe committee’s role and responsibilities include its statutory duties
as per the Companies Act, as well as the responsibilities assigned
to it by the board.
The Audit & Risk Committee of Infrasors report to this committee at
each meeting. Infrasors’ own Audit & Risk Committee comprises
three independent non-executive directors and consequently fulfi ls
its responsibilities independent of the committee. Afrimat’s
representatives on the board of Infrasors also attend the Infrasors
Audit & Risk Committee, ex offi cio.
The CEO, FD, CAE and representatives of the external auditors
attend committee meetings by invitation. The committee members
also have a confi dential meeting with the internal auditors once a
year.
CharterDuring the year the Audit & Risk Committee Charter was reviewed
by the committee and the board, in terms of King III requirements,
amongst others. It was deemed by the committee to be adequate
and effective.
Review of interim and integrated annual reportsThe committee reviewed the interim and integrated annual reports,
culminating in a recommendation to the board to adopt them. In
conducting its review the committee took appropriate steps to
ensure that the annual financial statements were prepared in
accordance with IFRS and in the manner required by the Companies
Act. The accounting policies were assessed for appropriateness in
relation to the current business environment and industry specific
requirements.
The committee advised and updated the board on issues ranging
from accounting standards to published financial information.
Audit procedures and internal controlsThe committee performed the following functions relating to audit procedures and internal controls: reviewed the internal control framework and procedures including accounting policies, legislative compliance, regulatory matters and governance;
approved the internal audit plan; considered and reviewed the internal audit charter for approval by the board;
confi rmed and reviewed the internal audit process and assessed the quality of the internal audit function;
reviewed the internal and external audit reports; reviewed the effectiveness of the system of internal control including IT internal controls and risk management, based on a written annual report received from the chief audit executive; and
reviewed legal matters that could have a signifi cant impact on the fi nancial statements.
The committee is satisfi ed with the effectiveness of the system of internal control.
The company’s internal audit department is an effective independent appraisal function and forms an integral part of the risk management system that provides assurance on the effectiveness of the company’s system of internal control. The internal audit department of the company is staffed by qualifi ed and experienced personnel and provide services to all companies in the group.
Risk managementDuring the year management reviewed the risk policy, which assists the committee in meeting its duty to ensure appropriate risk management processes are in place.
In addition the following risk assessment actions were taken by the committee: six-monthly reviews of the risk register with findings reported to the board;
confirmation that the risk policy is widely distributed throughout the group (and management provided assurance that risk management is integrated into the daily activities of the group); and
ensured that the combined assurance model was appropriate to address all the significant risks facing the group.
External auditorThe committee considered and recommended the following in respect of the external auditor: the appointment of external auditor for approval by shareholders at the annual general meeting;
the external audit plan; and the remuneration of the external auditor for approval to the board.
The principles for recommending the use of external auditor for non-audit purposes to the board were reconfi rmed. No non-audit services were provided by the external auditor during the year.
The committee also performed an annual assessment of the independence of the external auditor and confirms that it is satisfied therewith and with the independence of the respective audit partner.
It further assessed the performance of the external auditor and confi rms that it is satisfi ed therewith.

47Afrimat integrated annual report 2014
Finance functionAs per the JSE Listings Requirements, the committee considered and is satisfi ed with the appropriateness of the expertise and experience of Hendrik P Verreynne as FD. It further considered the expertise, experience and resources of the finance function as required by the King III Report and is satisfied with the expertise and experience of the group’s fi nancial staff.
SustainabilityThe committee reviewed the disclosure of sustainability issues in the integrated annual report and is satisfi ed that it does not conflict with the fi nancial information.
The committee has also reviewed a documented assessment by management of the going concern premise of the company. The committee is in agreement with management that the company will
remain a going concern going forward and conveyed this to the board.
Statutory dutiesThe committee is of the opinion that it has discharged its statutory duties in terms of its Charter and as ascribed to it by the Companies Act.
Hendrik JE van WykAudit & Risk Committee Chairman
24 June 2014

48 Afrimat integrated annual report 2014
Annual fi nancial statements
Independent auditor’s report
management, as well as evaluating the overall presentation of the fi nancial statements.
We believe that the audit evidence we have obtained is suffi cient and appropriate to provide a basis for our audit opinion.
OpinionIn our opinion, the consolidated and separate fi nancial statements present fairly, in all material respects, the consolidated and separate fi nancial position of Afrimat Limited at 28 February 2014, and its consolidated and separate fi nancial performance and cash fl ows for the year then ended in accordance with International Financial Reporting Standards, and the requirements of the Companies Act of South Africa.
Other reports required by the Companies Act As part of our audit of the consolidated and separate fi nancial statements for the year ended 28 February 2014, we have read the Directors’ Report, the Audit Committee’s Report and the Company Secretary’s Certifi cate for the purpose of identifying whether there are material inconsistencies between these reports and the audited consolidated and separate fi nancial statements. The reports are the responsibility of the respective preparers. Based on our reading of the reports we have not identifi ed material inconsistencies between these reports and the audited fi nancial statements. However, we have not audited these reports and accordingly do not express an opinion on them.
Mazars Inc.Registered AuditorDirector: Conrad Burger Registered AuditorChartered Accountant (SA)
24 June 2014Cape Town
To the shareholders of Afrimat LimitedWe have audited the consolidated and separate fi nancial statements of Afrimat Limited set out on pages 52 to 105, which comprise the statements of fi nancial position as at 28 February 2014, and the statements of comprehensive income, changes in equity and cash fl ows for the year then ended, and the notes, comprising a summary of signifi cant accounting policies and other explanatory information.
Directors’ responsibility for the financial statementsThe company’s directors are responsible for the preparation and fair presentation of these consolidated and separate fi nancial statements in accordance with International Financial Reporting Standards and the requirements of the Companies Act of South Africa, and for such internal control as the directors determine is necessary to enable the preparation of consolidated and separate fi nancial statements that are free from material misstatements, whether due to fraud or error.
Auditor’s responsibilityOur responsibility is to express an opinion on these consolidated and separate fi nancial statements based on our audit. We conducted our audit in accordance with International Standards on Auditing. Those standards require that we comply with ethical requirements and plan and perform the audit to obtain reasonable assurance about whether the consolidated and separate fi nancial statements are free from material misstatement.
An audit involves performing procedures to obtain audit evidence about the amounts and disclosures in the fi nancial statements. The procedures selected depend on the auditor’s judgement, including the assessment of the risks of material misstatement of the fi nancial statements, whether due to fraud or error. In making those risk assessments, the auditor considers internal control relevant to the entity’s preparation and fair presentation of the fi nancial statements in order to design audit procedures that are appropriate in the circumstances, but not for the purpose of expressing an opinion on the effectiveness of the entity’s internal control. An audit also includes evaluating the appropriateness of accounting policies used and the reasonableness of accounting estimates made by

49Afrimat integrated annual report 2014
Directors’ reportfor the year ended 28 February 2014
The directors of Afrimat present their report for the group or the year ended 28 February 2014.
Nature of businessAfrimat is a black empowered opencast mining company that supplies beneficiated materials and contracting services to the industrial minerals, building, construction, road building, railroad and mining sectors. It operates in the Western Cape, Eastern Cape, KwaZulu-Natal, Free State, Northern Cape, Gauteng, Limpopo and Mpumalanga as well as in Namibia.
Financial resultsThe annual financial statements and accompanying notes presented on pages 52 to 105 set out fully the group’s financial position, results of operations and cash flows for the year, and in the directors’ opinion require no further comment.
Headline earnings increased by 41,4%, translating into headline earnings per share of 109,0 cents (2013: 76,9 cents).
Operational reviewThe operations are reviewed in detail in the CEO’s report and operational reviews, (pages 21, 22 and 24), which form part of this integrated annual report.
Accounting policiesDetailed accounting policies are set out on pages 57 to 67 of the annual financial statements.
DividendA final dividend of 28 cents per share (2013: 20 cents per share), 23,8 cents a share for shareholders who are subject to dividend tax (2013: 17,0 cents a share for shareholders who are subject to dividend tax) was declared for the year on 14 May 2014. This is in line with the group’s dividend policy of 2,75 times cover.
The total dividend (interim and final) for the year amounts to 39 cents per share (2013: 28,0 cents per share).
Stated and issued share capitalThe total authorised ordinary stated capital at year-end was R10,0 million, consisting of 1 000 000 000 (2013: 1 000 000 000) no par value ordinary shares. There was no change to the authorised stated capital during the year.
DirectorsThe directors of the company at the date of the annual financial statements are set out below:Mr Gert J Coffee (executive director)Mr Loyiso Dotwana (non-executive director)Mr Francois du Toit (non-executive director)Mrs Phuti RE Tsukudu (independent non-executive director)Mr Andries J van Heerden (CEO)Mr Hendrik (Hennie) JE van Wyk (independent non-executive director)Mr Hendrik P Verreynne (FD)Mr Marthinus (Matie) W von Wielligh (independent non-executive Chairman)
Mr von Wielligh and Mr van Wyk will retire by rotation at the upcoming annual general meeting and being eligible, will stand for re-election.
Directors’ and officers’ interests in contractsNo material contract in which directors have an interest was entered into during the year other than the transactions detailed in note 34 to the annual financial statements.
Directors’ emoluments and employment contractsDetails of directors’ emoluments are set out in note 36 to the annual financial statements.

50 Afrimat integrated annual report 2014
Annual fi nancial statements
Directors’ report (continued)for the year ended 28 February 2014
Directors’ shareholding at 28 February 2014
Number of securities held
Direct Indirect
Director Beneficial BeneficialThrough
associates Total % held
2014Gert J Coffee 415 072 – – 415 072 0,29 Loyiso Dotwana – 1 963 176 – 1 963 176 1,37Francois du Toit – – 19 408 502 19 408 502 13,55 Laurie P Korsten – – – – – Phuti RE Tsukudu – – – – – Andries J van Heerden 4 975 026 – 1 717 573 6 692 599 4,67Hendrik JE van Wyk – – 112 000 112 000 0,08 Hendrik P Verreynne 445 650 – – 445 650 0,31 Marthinus W von Wielligh 520 000 80 000 – 600 000 0,42
6 355 748 2 043 176 21 238 075 29 636 999 20,69
2013Gert J Coffee 300 000 – – 300 000 0,21 Loyiso Dotwana – 2 079 843 – 2 079 843 1,45 Francois du Toit – – 19 408 502 19 408 502 13,55 Laurie P Korsten – – 6 450 000 6 450 000 4,50 Phuti RE Tsukudu – – – – – Andries J van Heerden 4 975 026 – 1 198 543 6 173 569 4,31 Hendrik JE van Wyk – – 112 000 112 000 0,08 Hendrik P Verreynne 253 863 – – 253 863 0,18 Marthinus W von Wielligh 520 000 80 000 – 600 000 0,42
6 048 889 2 159 843 27 169 045 35 377 777 24,70
The following share dealings by directors took place that are not reflected above:
Number of securities held
Direct Indirect
Beneficial BeneficialThrough
associates Total
Between year-end and the date of this report the following directors’ dealings took place:Andries J van Heerden– Receipt of shares as settlement of vested rights in the Afrimat
Share Appreciation Rights Scheme 456 659 – – 456 659 – Disposal of shares to settle tax liability relating to vested rights
in the Afrimat Share Appreciation Rights Scheme (182 664) – – (182 664)
Hendrik P Verreynne– Receipt of shares as settlement of vested rights in the Afrimat
Share Appreciation Rights Scheme 198 547 – – 198 547 – Disposal of shares to settle tax liability relating to vested rights
in the Afrimat Share Appreciation Rights Scheme (79 419) – – (79 419)
Save as detailed above there has been no change in directors’ interests since year-end to the date of this report.

51Afrimat integrated annual report 2014
Company secretaryMariëtte Swart is the company secretary. Her business and postal addresses, which are also the registered addresses of the company, are set out on the inside back cover of this integrated annual report.
AuditorMazars Inc. will continue in office as external auditor of the company in accordance with section 90 of the Companies Act No. 71 of 2008, as amended.
Interest in subsidiariesThe company’s interest in subsidiaries is presented in note 6 to the annual financial statements. The interest of the company in the profits and losses of the subsidiaries, after taxation and profits attributable to minority interests, is as follows:
2014R
2013R
Profit 168 162 228 123 990 250Losses (9 382 349) (8 710 276)
Special resolutionsThe following special resolutions were passed by shareholders of the company during the year (at the annual general meeting of shareholders held on 31 July 2013), and where necessary have been registered by the Companies and Intellectual Property Commission: special resolution providing general authority to repurchase shares; special resolution providing approval for fees payable to non-executive directors for the year ended 28 February 2014; and special resolution providing authority for the provision of financial assistance to group inter-related entities (in terms of section 45 of the Companies Act).
BorrowingsIn terms of the memorandum of incorporation the directors may exercise all the powers of the company to borrow money, as they consider appropriate.
Events after reporting dateNo material events occurred between the reporting date and the date of the integrated annual report.

52 Afrimat integrated annual report 2014
Annual fi nancial statements
Statements of fi nancial positionat 28 February 2014
Group Company
Notes2014
R2013
R2014
R2013
R
ASSETSNon-current assetsProperty, plant and equipment 2 662 306 609 503 614 678 3 522 160 2 976 279Investment property 3 3 040 000 – – –Intangible assets 4 21 407 107 21 698 345 – –Goodwill 5 134 493 535 132 706 771 – –Investments in subsidiaries 6 – – 627 626 486 546 528 389Investment in associate 7 201 362 77 257 147 147Other financial assets 8 134 222 992 115 397 881 107 869 147 101 655 733Deferred tax 10 5 047 929 3 008 993 2 058 298 2 357 840
960 719 534 776 503 925 741 076 238 653 518 388
Current assetsInventories 11 112 965 489 89 489 665 – –Loans to subsidiaries 6 – – 28 129 283 10 613 271Current tax receivable 6 162 579 5 220 020 – –Trade and other receivables 12 305 966 591 195 788 275 4 534 415 4 698 896Other financial assets 8 1 274 857 – 846 887 –Cash and cash equivalents 13 92 328 199 134 261 561 5 049 524 65 354 969
518 697 715 424 759 521 38 560 109 80 667 136
Total assets 1 479 417 249 1 201 263 446 779 636 347 734 185 524
EQUITY AND LIABILITIESEquityStated capital 14 323 176 094 347 660 405 316 666 887 342 223 012Share premium 15 – – – –Business combination adjustment 15 (105 788 129) (105 788 129) – –Treasury shares 16 (10 691 947) (1 490 499) – –
Net issued stated capital 206 696 018 240 381 777 316 666 887 342 223 012Other reserves 18 6 562 249 6 929 263 3 819 272 4 192 329Retained income 610 509 044 510 610 558 289 851 025 255 074 402
Attributable to equity holders of parent 823 767 311 757 921 598 610 337 184 601 489 743Non-controlling interests 19 14 196 163 3 930 635 – –
Total equity 837 963 474 761 852 233 610 337 184 601 489 743
LIABILITIESNon-current liabilitiesBorrowings long-term 20 94 605 884 58 678 648 8 442 566 25 308 132Provisions 21 55 860 235 33 724 698 – –Deferred tax 10 91 651 996 80 610 005 – –
242 118 115 173 013 351 8 442 566 25 308 132
Current liabilitiesLoans from subsidiaries 6 – – 132 167 583 62 352 185Borrowings short-term 20 76 431 659 62 005 657 16 874 569 16 872 090Current tax payable 5 709 786 3 288 967 694 335 –Trade and other payables 22 265 742 749 151 984 476 11 120 110 6 992 409Bank overdraft 13 51 451 466 49 118 762 – 21 170 965
399 335 660 266 397 862 160 856 597 107 387 649
Total liabilities 641 453 775 439 411 213 169 299 163 132 695 781
Total equity and liabilities 1 479 417 249 1 201 263 446 779 636 347 734 185 524

53Afrimat integrated annual report 2014
Statements of comprehensive incomefor the year ended 28 February 2014
Group Company
Notes2014
R2013
R2014
R2013
R
Revenue 23 1 901 187 222 1 337 584 566 64 739 418 44 703 244Cost of sales (1 440 138 347) (1 023 137 956) – –
Gross profit 461 048 875 314 446 610 64 739 418 44 703 244Operating expenses (230 091 730) (158 955 300) (61 661 347) (46 964 352)(Loss)/profit on disposal of plant, equipment and vehicles (2 685 817) (3 009 064) – –
Contribution/(loss) from operations 228 271 328 152 482 246 3 078 071 (2 261 108)Other income – – (392 085) –Other net gains/(losses) – net 24 1 426 075 96 868 – –Impairment of intangible assets 5 – (4 745 527) – –
Operating profit/(loss) 25 229 697 403 147 833 587 2 685 986 (2 261 108)Investment revenue 26 16 186 531 10 811 018 82 618 389 187 056 244Finance costs 27 (24 981 282) (14 295 568) (7 605 833) (9 674 762)Share of profit of associate 7 173 105 67 744 – –
Profit before taxation 221 075 757 144 416 781 77 698 542 175 120 374Taxation 28 (58 110 362) (40 639 551) (982 234) 524 889
Profit for the year 162 965 395 103 777 230 76 716 308 175 645 263
Other comprehensive incomeItems that may be subsequently reclassified to profit or lossNet change in fair value of available-for-sale financial assets 1 694 325 67 060 – – Income taxation effect (444 784) (11 756) – –Realised gains on disposal of available-for-sale financial assets (1 426 075) – – –Income taxation effect 399 301 – – –
Other comprehensive income for the year, net of taxation 222 767 55 304 – –
Total comprehensive income for the year 163 188 162 103 832 534 76 716 308 175 645 263
Profit attributable to:Owners of the parent 154 508 627 103 035 685 76 716 308 175 645 263Non-controlling interests 8 456 768 741 545 – –
162 965 395 103 777 230 76 716 308 175 645 263
Total comprehensive income attributable to:Owners of the parent 154 731 394 103 090 989 76 716 308 175 645 263Non-controlling interests 8 456 768 741 545 – –
163 188 162 103 832 534 76 716 308 175 645 263
Earnings per ordinary share (cents) 35 108,3 72,1 – –Diluted earnings per ordinary share (cents) 35 105,6 70,2 – –

54 Afrimat integrated annual report 2014
Annual fi nancial statements
Statements of changes in equityfor the year ended 28 February 2014
Sha
re
and
sta
ted
ca
pita
l R
Sha
rep
rem
ium R
Trea
sury
sh
ares R
Bus
ines
s co
mb
inat
ion
adju
stm
ent R
Oth
erre
serv
es R
Ret
aine
d
inco
me R
Non
-co
ntro
lling
inte
rest
s R
Tota
l eq
uity R
Gro
upB
alan
ce a
t 1
Mar
ch 2
012
1 43
4 62
435
2 14
9 77
3(2
0 55
8 86
7)(1
05 7
88 1
29)
5 49
4 80
243
5 56
4 22
73
609
851
671
906
281
Cha
nges
:C
onve
rsio
n to
no
par
val
ue s
hare
s35
2 14
9 77
3(3
52 1
49 7
73)
––
––
––
Mov
emen
ts in
non
-con
trol
ling
inte
rest
s–
––
––
–(3
2 66
1)(3
2 66
1)S
hare
-bas
ed p
aym
ents
(ref
er n
ote
17)
––
––
3 35
4 20
7–
–3
354
207
Pur
chas
e of
tre
asur
y sh
ares
(ref
er n
ote
16)
––
(6 5
68 8
67)
––
––
(6 5
68 8
67)
Set
tlem
ent
of e
mpl
oyee
Sha
re A
ppre
ciat
ion
Rig
hts
exer
cise
d an
d
rese
rve
tran
sfer
, net
of t
axat
ion
(10
168
112)
–5
049
945
–(1
975
050
)1
975
050
–(5
118
167
)Tr
easu
ry s
hare
s us
ed fo
r ac
quis
ition
s, n
et o
f tax
atio
n (re
fer
note
16)
4 24
4 12
0–
20 5
87 2
90–
––
–24
831
410
Pro
fit f
or t
he y
ear
––
––
–10
3 03
5 68
574
1 54
510
3 77
7 23
0O
ther
com
pre
hens
ive
inco
me
for
the
year
––
––
55 3
04–
–55
304
Net
cha
nge
in f
air
valu
e of
ava
ilab
le-f
or-s
ale
finan
cial
ass
ets
––
––
67 0
60–
–67
060
Inco
me
taxa
tion
effe
ct–
––
–(1
1 75
6)–
–(1
1 75
6)
Div
iden
ds
pai
d (r
efer
not
e 30
)–
––
––
(29
964
404)
(388
100
)(3
0 35
2 50
4)
Tota
l cha
nges
346
225
781
(352
149
773
)19
068
368
–1
434
461
75 0
46 3
3132
0 78
489
945
952
Bal
ance
at
28 F
ebru
ary
2013
347
660
405
–(1
490
499
)(1
05 7
88 1
29)
6 92
9 26
351
0 61
0 55
83
930
635
761
852
233
Cha
nges
:In
itial
non
-con
trol
ling
inte
rest
acq
uire
d (r
efer
not
e 31
)–
––
––
–31
742
958
31 7
42 9
58A
dd
ition
al n
on-c
ontr
ollin
g in
tere
st a
cqui
red
(ref
er n
ote
31)
––
––
–(2
5 98
6 44
2)(2
2 00
8 64
8)(4
7 99
5 09
0)In
fras
ors
trea
sury
sha
res
sold
to
BE
E in
vest
or (r
efer
not
e 8)
––
––
–2
811
605
1 97
8 39
54
790
000
Incr
ease
in e
ffect
ive
shar
ehol
din
g in
Infr
asor
s d
ue t
o:–
Ret
rieva
l of
shar
es f
rom
Infr
asor
s E
mp
ower
men
t Tr
ust
––
––
–9
010
383
(9 0
10 3
83)
––
Incr
ease
in s
hare
s he
ld in
tre
asur
y b
y In
fras
ors
––
––
–(4
68 2
71)
(340
912
)(8
09 1
83)
Sha
re-b
ased
pay
men
ts (r
efer
not
e 17
)–
––
–3
527
901
––
3 52
7 90
1P
urch
ase
of t
reas
ury
shar
es (r
efer
not
e 16
)–
–(2
6 65
9 47
7)–
––
–(2
6 65
9 47
7)S
ettle
men
t of
em
ploy
ee S
hare
App
reci
atio
n R
ight
s ex
erci
sed
and
re
serv
e tr
ansf
er, n
et o
f tax
atio
n(2
4 87
8 36
6)–
15 5
21 9
29–
(4 1
17 6
82)
4 11
7 68
2–
(9 3
56 4
37)
Trea
sury
sha
res
sold
to
BE
E in
vest
or,
net
of t
axat
ion
(refe
r no
te 8
)39
4 05
5–
1 93
6 10
0–
––
–2
330
155
Pro
fit f
or t
he y
ear
––
––
–15
4 50
8 62
78
456
768
162
965
395
Oth
er c
omp
rehe
nsiv
e in
com
e fo
r th
e ye
ar–
––
–22
2 76
7–
–22
2 76
7
Net
cha
nge
in f
air
valu
e of
ava
ilab
le-f
or-s
ale
finan
cial
ass
ets
––
––
268
250
––
268
250
Inco
me
taxa
tion
effe
ct–
––
–(4
5 48
3)–
–(4
5 48
3)
Div
iden
ds
pai
d (r
efer
not
e 30
)–
––
––
(44
095
098)
(552
650
)(4
4 64
7 74
8)
Tota
l cha
nges
(24
484
311)
–(9
201
448
)–
(367
014
)99
898
486
10 2
65 5
2876
111
241
Bal
ance
at
28 F
ebru
ary
2014
323
176
094
–(1
0 69
1 94
7)(1
05 7
88 1
29)
6 56
2 24
961
0 50
9 04
414
196
163
837
963
474
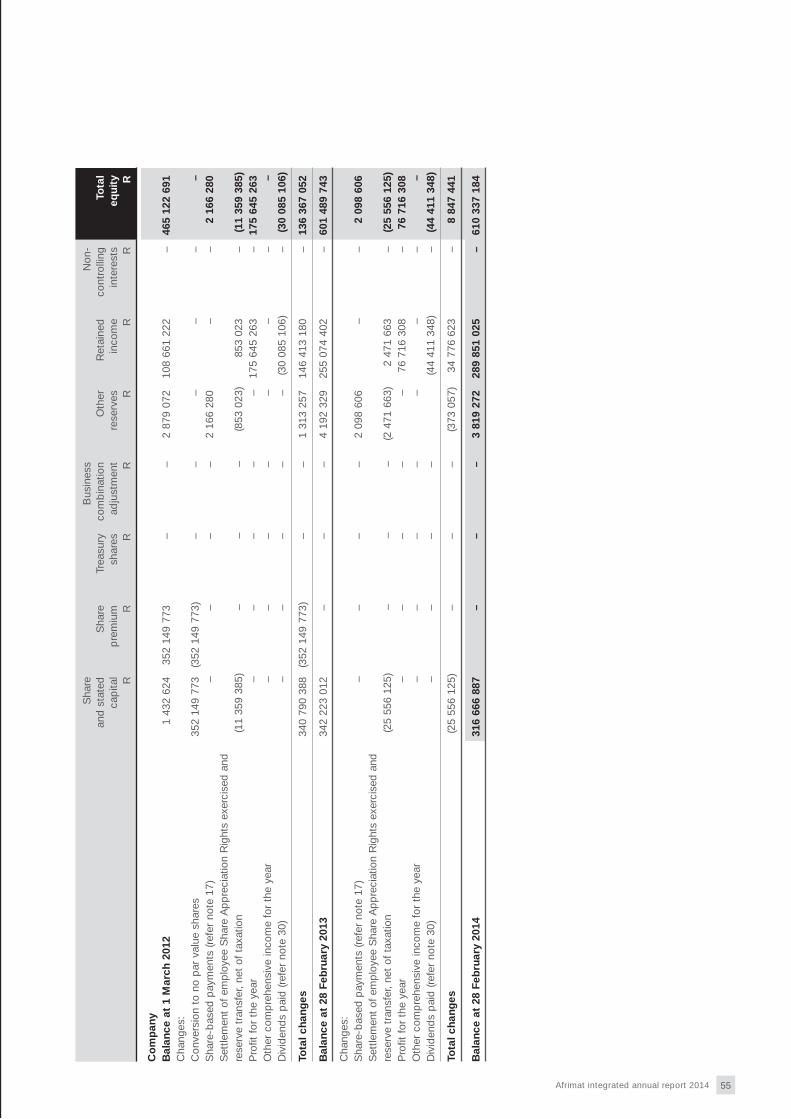
55Afrimat integrated annual report 2014
Sha
re
and
sta
ted
ca
pita
l R
Sha
rep
rem
ium R
Trea
sury
sh
ares R
Bus
ines
s co
mb
inat
ion
adju
stm
ent R
Oth
erre
serv
es R
Ret
aine
d
inco
me R
Non
-co
ntro
lling
inte
rest
s R
Tota
l eq
uity R
Co
mp
any
Bal
ance
at
1 M
arch
201
21
432
624
352
149
773
––
2 87
9 07
210
8 66
1 22
2–
465
122
691
Cha
nges
:C
onve
rsio
n to
no
par
val
ue s
hare
s35
2 14
9 77
3(3
52 1
49 7
73)
––
––
––
Sha
re-b
ased
pay
men
ts (r
efer
not
e 17
)–
––
–2
166
280
––
2 16
6 28
0S
ettle
men
t of
em
plo
yee
Sha
re A
pp
reci
atio
n R
ight
s ex
erci
sed
and
re
serv
e tr
ansf
er, n
et o
f ta
xatio
n(1
1 35
9 38
5)–
––
(853
023
)85
3 02
3–
(11
359
385)
Pro
fit f
or t
he y
ear
––
––
–17
5 64
5 26
3–
175
645
263
Oth
er c
omp
rehe
nsiv
e in
com
e fo
r th
e ye
ar–
––
––
––
–D
ivid
end
s p
aid
(ref
er n
ote
30)
––
––
–(3
0 08
5 10
6)–
(30
085
106)
Tota
l cha
nges
340
790
388
(352
149
773
)–
–1
313
257
146
413
180
–13
6 36
7 05
2
Bal
ance
at
28 F
ebru
ary
2013
342
223
012
––
–4
192
329
255
074
402
–60
1 48
9 74
3
Cha
nges
:S
hare
-bas
ed p
aym
ents
(ref
er n
ote
17)
––
––
2 09
8 60
6–
–2
098
606
Set
tlem
ent
of e
mp
loye
e S
hare
Ap
pre
ciat
ion
Rig
hts
exer
cise
d a
nd
rese
rve
tran
sfer
, net
of
taxa
tion
(25
556
125)
––
–(2
471
663
)2
471
663
–(2
5 55
6 12
5)P
rofit
for
the
yea
r–
––
––
76 7
16 3
08–
76 7
16 3
08O
ther
com
pre
hens
ive
inco
me
for
the
year
––
––
––
––
Div
iden
ds
pai
d (r
efer
not
e 30
)–
––
–(4
4 41
1 34
8)–
(44
411
348)
Tota
l cha
nges
(25
556
125)
––
–(3
73 0
57)
34 7
76 6
23–
8 84
7 44
1
Bal
ance
at
28 F
ebru
ary
2014
316
666
887
––
–3
819
272
289
851
025
–61
0 33
7 18
4

56 Afrimat integrated annual report 2014
Annual fi nancial statements
Statements of cash fl owsfor the year ended 28 February 2014
Group Company
Notes2014
R2013
R2014
R2013
R
Cash flows from operating activitiesCash generated from operations 29.1 310 705 566 216 420 626 (14 910 908) (9 136 042)Interest revenue 29.2 17 918 453 10 940 216 14 103 961 6 478 862Dividends received 7, 26 49 000 34 680 70 246 350 180 706 580Finance costs 29.3 (23 405 554) (12 852 845) (7 605 833) (9 674 762)Tax paid 29.4 (61 407 743) (44 779 074) 11 643 (240 882)
Net cash from operating activities 243 859 722 169 763 603 61 845 213 168 133 756
Cash flows from investing activitiesAcquisition of property, plant and equipment 2 (121 325 970) (82 934 453) (2 305 712) (1 853 830)Proceeds on sale of property, plant and equipment 29.5 16 894 085 7 345 537 191 390 –Acquisition of businesses 31 (69 942 474) (86 715 523) (81 098 095) (95 954 818)Consideration paid for shares held in treasury by Infrasors (809 183) – – –Purchase of financial assets (4 795 150) (31 858 422) (8 792 225) (31 475 025)Proceeds on sale of financial assets 13 521 548 96 868 – –
Net cash outflow from investing activities (166 457 144) (194 065 993) (92 004 642) (129 283 673)
Cash flows from financing activitiesPurchase of treasury shares 16 (26 659 477) (6 568 867) – –Proceeds from borrowings 51 996 977 94 854 199 – 52 570 616Repayment of borrowings (102 358 396) (62 897 937) (16 863 087) (10 390 394)Loans repaid by/(advanced to) subsidiaries – – 52 299 384 (30 249 164)Dividends paid 30 (44 647 748) (30 352 504) (44 411 348) (30 085 106)
Net cash outflow from financing activities (121 668 644) (4 965 109) (8 975 051) (18 154 048)
Net (decrease)/increase in cash and cash equivalents and bank overdrafts (44 266 066) (29 267 499) (39 134 480) 20 696 035Cash, cash equivalents and bank overdrafts at the beginning of the year 13 85 142 799 114 410 298 44 184 004 23 487 969
Cash, cash equivalents and bank overdrafts at the end of the year 13 40 876 733 85 142 799 5 049 524 44 184 004

57Afrimat integrated annual report 2014
Notes to the annual fi nancial statementsfor the year ended 28 February 2014
Presentation of annual fi nancial statementsThe annual fi nancial statements are prepared on a going-concern basis in compliance with the Companies Act of South Africa, the SAICA fi nancial reporting guides as issued by the Accounting Practices Committee, International Financial Reporting Standards (‘IFRS’) and interpretations issued by the International Financial Reporting Interpretation Committee (‘IFRIC’). The annual fi nancial statements have been prepared using a combination of the historical cost and fair value basis of accounting. The annual fi nancial statements are expressed in South African Rand (ZAR or R). Those categories to which the fair value basis of accounting has applied are indicated in the individual accounting policy notes below.
The preparation of fi nancial statements in conformity with IFRS requires the use of certain critical accounting estimates. It also requires management to exercise its judgement in the process of applying the group’s accounting policies. The areas involving a higher degree of judgement or complexity, or areas where assumptions and estimates are signifi cant to the consolidated fi nancial statements, are disclosed in note 1.22.
The principal accounting policies are set out below. These accounting policies are consistent with the previous year, unless otherwise stated.
1. Accounting policies 1.1 Business combination (a) Basis of consolidation Group fi nancial statements
The group fi nancial statements comprise the consolidated fi nancial statements of the company and its subsidiaries. The fi nancial statements of the subsidiaries are prepared for the same reporting period as the parent company, using consistent accounting policies.
Subsidiaries are all entities (including structured entities) over which the group has control. The group controls an entity when the group is exposed to, or has rights to, variable returns from its involvement with the entity and has the ability to affect those returns through its power over the entity. Subsidiaries are fully consolidated from the date on which control is transferred to the group. They are deconsolidated from the date that control ceases. A structured entity is an entity that has been designed so that voting or similar rights are not the dominant factor in deciding who controls the entity, such as when any voting rights relate to administrative tasks only and the relevant activities are directed by means of contractual arrangements.
The acquisition method of accounting is used to account for the acquisition of subsidiaries by the group. The cost of an acquisition is measured as the fair value of the assets given, equity instruments issued and liabilities incurred or assumed at the date of exchange. Acquisition-related costs are expensed as incurred. Identifi able assets acquired and liabilities and contingent liabilities assumed in a business combination are measured initially at their fair values at the acquisition date. The excess of the cost of acquisition over the fair value of the group’s share of the identifi able net assets acquired is recorded as goodwill.
Inter-company transactions, balances and unrealised gains on transactions between group companies are eliminated. Unrealised losses are also eliminated but considered an impairment indicator of the asset transferred. Accounting policies of subsidiaries have been changed where necessary to ensure consistency with the policies adopted by the group.
Company fi nancial statements
Investments in subsidiaries and associates are initially recognised at cost. The cost of an investment in subsidiaries and associates is the aggregate of the fair value, at the date of exchange, of assets given, liabilities incurred or assumed and equity instruments issued.
Investments in subsidiaries and associates are subsequently measured at cost less any accumulated impairment.
(b) Non-controlling interests Non-controlling shareholders’ interests included on the statement of fi nancial position represent the portion of profi t or loss
and net assets in subsidiaries not held by the group. Profi t attributable to non-controlling interests are presented separately in the statement of comprehensive income and within equity in the consolidated statement of fi nancial position.
The group treats transactions with non-controlling interests as transactions with equity owners of the group. For purchases from non-controlling interests, the difference between any consideration paid and the relevant share acquired of the carrying value of net assets of the subsidiary is recorded in the statement of changes in equity. Gains or losses on disposals to non-controlling interests are also recorded in equity.
(c) Associates Associates are all entities over which the group has signifi cant infl uence but not control, generally accompanying a
shareholding of between 20% and 50% of the voting rights. Investments in associates are accounted for using the equity method of accounting in the group fi nancial statements and are initially recognised at cost. The group’s investment in associates includes goodwill identifi ed on acquisition, net of any accumulated impairment loss. See note 1.12 for the impairment of non-fi nancial assets including goodwill.

58 Afrimat integrated annual report 2014
Annual fi nancial statements
Notes to the annual fi nancial statements (continued)for the year ended 28 February 2014
The group’s share of its associates’ post-acquisition profi ts or losses is recognised in the statement of comprehensive income, and its share of post-acquisition movements in other comprehensive income/reserves is recognised in other comprehensive income/reserves. The cumulative post-acquisition movements are adjusted against the carrying amount of the investment. When the group’s share of losses in an associate equals or exceeds its interest in the associate, including any other unsecured receivables, the group does not recognise further losses, unless it has incurred obligations or made payments on behalf of the associate.
Unrealised gains on transactions between the group and its associates are eliminated to the extent of the group’s interest in the associates. Unrealised losses are also eliminated unless the transaction provides evidence of an impairment of the asset transferred. Accounting policies of associates have been changed where necessary to ensure consistency with the policies adopted by the group.
(d) Share Trusts
The group consolidates the Afrimat BEE Trust and the Afrimat Share Incentive Trust.
1.2 Property, plant and equipment Property, plant and equipment is initially recognised at cost. The cost of property, plant and equipment includes amounts
incurred initially to acquire or construct an item of property, plant and equipment and amounts incurred subsequently to add to or replace part of the asset. If a replacement cost is recognised in the carrying amount of an item of property, plant and equipment, the carrying amount of the replaced part is derecognised. Day-to-day servicing costs, such as labour and consumables, are expensed in the statement of comprehensive income as repairs and maintenance.
The cost of an item of property, plant and equipment includes the initial estimate of the cost of dismantling and removing the asset and restoring the site on which it is located. When this initial estimate of costs is included in the cost of the item of property, plant and equipment, a corresponding provision is created for the obligation. The initial estimate of the expenditure required to settle the present obligation is determined using a current market-based discount rate.
Property, plant and equipment are subsequently measured at cost less accumulated depreciation and any accumulated impairment losses.
Depreciation is provided on all property, plant and equipment other than freehold land, to write down the cost, less residual value, on the straight-line basis over their useful lives as follows:
Land Indefi nite life Buildings 10 to 20 years Leasehold property 10 to 50 years Plant and machinery 5 to 20 years Motor vehicles 3 to 10 years Offi ce and computer equipment 3 to 5 years Dismantling costs 1 to 15 years
Where a part of an item of property, plant and equipment with a different useful life is signifi cant in relation to the cost of the item, that part is depreciated separately. The depreciation charge for each period is recognised as an expense in the statement of comprehensive income.
The residual values, useful lives and depreciation methods applied to property, plant and equipment are reviewed, and adjusted if necessary, on an annual basis. These changes are accounted for as a change in estimate.
An item of property, plant and equipment is derecognised upon disposal or when no future economic benefi ts are expected from its use or disposal. The gain or loss arising from the derecognition of an item of property, plant and equipment, is included in the statement of comprehensive income and is calculated as the difference between the net disposal proceeds, if any, and the carrying amount of the item at the date of derecognition.
The gain or loss arising from the derecognition of an item of property, plant and equipment is included in the statement of comprehensive income and is calculated as the difference between the net disposal proceeds, if any, and the carrying amount of the item at the date of derecognition.
1.3 Mining assets Mining assets are capitalised due to the future benefi ts in respect of acquiring mineral reserves and resources. Mining assets
acquired through business combinations are measured at cost less accumulated depreciation and any accumulated impairment losses.
The useful life of the mining assets, over which they are depreciated, equals the estimated useful life of the mine. Depreciation of the capitalised costs of mining assets start at the time when the mining activities commence on the acquired mining assets.
Mining assets 15 years

59Afrimat integrated annual report 2014
1.4 Investment property Investment properties are measured initially at cost, including transaction costs. The carrying amount includes the cost of an
existing investment property at the time the cost is incurred if the recognition criteria are met; and excludes the cost of day to day servicing of an investment property. Subsequent to initial recognition, investment properties are stated at fair value, which refl ects market conditions at the reporting date. Gains or losses arising from changes in the fair values of investment properties are included in the statement of comprehensive income in the period in which they arise.
Investment properties are derecognised when either they have been disposed of or when the investment property is permanently withdrawn from use and no further economic benefi t is expected from its disposal. The difference between the net disposal proceeds and the carrying value of the asset is recognised in the statement of comprehensive income in the period of derecognition.
Group policy is that investment property will be reviewed annually and re-assessed by independent consultants every three years.
Transfers are made to and from investment property only when there is a change in use. For a transfer of investment property to owner occupied property, the deemed cost for subsequent accounting is the fair value at the date of change in use. If the owner occupied property becomes an investment property, the group accounts for such property in accordance with the policy stated under property, plant and equipment up to the date of change in use, when it is revalued to fair value before being transferred to investment properties.
1.5 Intangible assets Intangible assets are initially recognised at cost.
Where an intangible asset is acquired in a business combination, the cost of that intangible asset is its fair value at the acquisition date.
Intangible assets are subsequently measured at cost less accumulated amortisation and any accumulated impairment losses.
For mining rights, amortisation is provided on the straight-line basis so to write down the cost of the mining rights, less their residual values, on the straight-line basis over their useful lives as follows:
Mining rights 20 to 30 years
Purchasing rights were acquired as part of the Clinker Group acquisition and relate to ash dumps to which the group has exclusive rights to utilise and process until the dumps are exhausted.
The amortisation on the purchasing right is determined on an annual basis by reference to raw materials consumed and is estimated to have a fi nite life, of between fi ve and 10 years. The amortisation charge is recognised as an operating expense in the statement of comprehensive income. The amortisation period and amortisation method applied to an intangible asset with a fi nite useful life is reviewed, and adjusted if necessary, on an annual basis. These charges are accounted for as a change in estimate.
Where the recoverable amount is less than the carrying amount of the assets or the cash-generating unit, an impairment loss is recognised in the statement of comprehensive income.
Intangible assets are derecognised upon disposal or when no future economic benefi ts are expected from its use or disposal. The gain or loss arising from the derecognition on an intangible asset is included in the statement of comprehensive income and is calculated as the difference between the net disposal proceeds, if any, and the carrying amount of the asset at the date of derecognition.
1.6 Goodwill Goodwill arises from business combinations and is initially measured at cost. Cost represents the excess of the purchase
consideration over the fair value of the group’s share of the identifi able assets, liabilities and contingent liabilities acquired at the date of the acquisition.
Subsequently, goodwill is carried at cost less any accumulated impairment.
Where the fair value of the group’s share of the identifi able assets, liabilities and contingent liabilities acquired in a business combination is greater than the cost of the combination, the difference is recognised in the statement of comprehensive income immediately.
Goodwill is reviewed for impairment annually, or more frequently if events or changes in circumstances indicate that the carrying amount may be impaired.
At the acquisition dates, goodwill is allocated to each of the cash-generating units expected to benefi t from a business combination. Impairment is determined by assessing the recoverable amount of the cash-generating unit to which goodwill relates. The recoverable amount is determined as the value in use of each cash-generating unit by estimating the expected future cash fl ows in each unit and choosing a suitable discount rate in order to calculate the present value of those cash fl ows.

60 Afrimat integrated annual report 2014
Annual fi nancial statements
Notes to the annual fi nancial statements (continued)for the year ended 28 February 2014
Where the recoverable amount of the cash-generating unit is less than the carrying amount of the unit, an impairment loss is recognised in the statement of comprehensive income beginning with the write off of the goodwill allocated to such cash-generating unit. Where the goodwill is insuffi cient to cover the amount of the impairment adjustment, the remaining assets in the cash-generating unit are impaired on a pro-rata basis.
An impairment loss recognised for goodwill is not subsequently reversed.
1.7 Financial instruments (a) Initial recognition Financial instruments carried on the statement of fi nancial position include cash and cash equivalents, other fi nancial assets,
trade and other receivables, trade and other payables, loans and borrowings.
The group classifi es fi nancial instruments, or their component parts, on initial recognition as a fi nancial asset, a fi nancial liability or an equity instrument in accordance with the substance of the contractual arrangement.
Financial assets and fi nancial liabilities are recognised on the group’s statement of fi nancial position when the group becomes party to the contractual provisions of the instrument.
Financial instruments are initially measured at fair value, including transaction costs, when the group becomes a party to the contractual arrangements. However, transaction costs in respect of fi nancial assets classifi ed as ‘fair value through profi t and loss’ are expensed. Financial assets and liabilities are offset and the net amount reported in the statement of fi nancial position when there is a current legally enforceable right to set off recognised amounts and there is an intention to realise the assets and settle the liabilities on a net basis. Subsequent to initial recognition, these instruments are measured as set out below.
(b) Financial assets The group classifi es its fi nancial assets in the following categories: at fair value through profi t or loss; available-for-sale; held-
to-maturity and loans and receivables. The classifi cation is dependent on the purpose for which the fi nancial assets were acquired.
Financial assets at fair value through profi t or loss
Financial assets are designated at fair value through profi t or loss when they are managed and their performance is evaluated on a fair value basis, in accordance with a documented risk management strategy. These include environmental insurance policies of which performance are evaluated alongside the group’s obligation to rehabilitate the environment after mining operations at the various mining sites are complete.
Assets in this category are classifi ed as current assets if expected to be settled within 12 months, otherwise they are classifi ed as non-current assets. The environmental policies of Infrasors are designated in this category and not classifi ed as available-for-sale, due to the difference in internal processes of monitoring the fair value of those policies. The designation applies to groups of fi nancial assets, fi nancial liabilities or combinations thereof that are managed, and their performance evaluated, on a fair value basis in accordance with a documented risk management or investment strategy, and where information on the groups of fi nancial instruments is reported to management on that basis.
Available-for-sale fi nancial assets
Available-for-sale fi nancial assets include equity instruments classifi ed as available-for-sale that are neither classifi ed as held for trading nor designated at fair value through profi t or loss. Available-for-sale fi nancial assets consist of investments within other fi nancial assets in the statement of fi nancial position. They are included in non-current assets unless management intends to dispose of the investment within 12 months of the reporting date.
Regular purchases and sales of fi nancial assets are recognised on the trade date – the date on which the group commits to purchase or sell the asset. Financial assets are initially recognised at fair value plus transaction costs. Financial assets are derecognised when the rights to receive cash fl ows from the investment have expired or have been transferred and the group has transferred substantially all risk and rewards of ownership. Available-for-sale fi nancial assets are subsequently carried at fair value with changes in fair value recognised in equity.
When securities classifi ed as available-for-sale are sold or impaired, the accumulated fair value adjustments recognised in equity are included in the statement of comprehensive income through a reclassifi cation adjustment. The fair values of quoted investments are based on current bid prices.
Held-to-maturity
Guaranteed endowment policy investments are measured at the amortised cost, which represents the present value of the guaranteed funds after the deduction of fees and fi nance costs.
Loans and receivables
Loans and receivables are non-derivative assets with fi xed or determinable payments that are not quoted in an active market. The are included in current assets, except for maturities greater than 12 months after reporting date.

61Afrimat integrated annual report 2014
Loans and receivables are carried at amortised cost using the effective interest method. Interest on loans and receivables are calculated using the effective interest method and recognised in the statement of comprehensive income.
Trade and other receivables
Trade and other receivables are classifi ed as loans and receivables and are subsequently measured at amortised cost using the effective interest method less any allowance for impairment. An allowance for estimated irrecoverable amounts is recognised in the statement of comprehensive income when there is objective evidence that the asset is impaired. Signifi cant fi nancial diffi culties of the debtor, probability that the debtor will enter bankruptcy or fi nancial reorganisation, and default or delinquency in payments are considered objective indicators that the trade receivables are impaired. The amount of the provision is the difference between the asset’s carrying amount and the present value of estimated future cash fl ows, discounted at the original effective interest rate. The carrying amount of the asset is reduced through the use of an allowance account, and the amount of the loss is recognised in the statement of comprehensive income within operating expenses. When a trade receivable is uncollectible, it is written off against the allowance account for trade receivables. Subsequent recoveries of amounts previously written off are credited against operating expenses in the statement of comprehensive income.
Cash and cash equivalents
Cash and cash equivalents are short-term, highly liquid investments that are readily convertible to known amounts of cash and are subject to insignifi cant risk in change in value; these are classifi ed as loans and receivables and are subsequently measured at amortised cost.
For purposes of the cash fl ow statements, cash and cash equivalents comprise cash and cash equivalent defi ned above, net of outstanding bank overdrafts.
Impairment of fi nancial assets
The group assesses at each reporting date whether there is objective evidence that a fi nancial asset or a group of fi nancial assets is impaired. In the case of equity securities classifi ed as available-for-sale, a signifi cant or prolonged decline in the fair value of the security below its cost is considered as an indicator that the securities are impaired. If any such evidence exists for available-for-sale fi nancial assets, the cumulative loss – measured as the difference between the acquisition cost and the current fair value, less any impairment loss on that fi nancial asset previously recognised in profi t or loss – is removed from equity and recognised in the statement of comprehensive income. Impairment losses recognised in the statement of comprehensive income on equity instruments are not reversed through the statement of comprehensive income. Impairment testing of trade receivables is disclosed under trade receivables.
(c) Financial liabilities Bank overdrafts and borrowings
Bank overdrafts and borrowings are classifi ed as fi nancial liabilities and are subsequently measured at amortised cost using the effective interest method. The amortised cost method results in the accrual of interest in each period by applying the effective interest rate implicit to the outstanding balance on the borrowings. Borrowings are reduced when repayments are made.
Trade and other payables
Trade and other payables are classifi ed as fi nancial liabilities and are subsequently measured at amortised cost using the effective interest method.
(d) Derecognition of financial assets and financial liabilities
Financial assets are derecognised when the right to receive cash fl ows from the asset has expired, the right to receive cash fl ows has been retained but an obligation to on-pay them in full without material delay has been assumed or the right to receive cash fl ows has been transferred together with substantially all the risks and rewards of ownership.
Financial liabilities are derecognised when the associated obligation has been discharged, cancelled or has expired.
1.8 Stated capital and equity An equity instrument is any contract that evidences a residual interest in the assets of an entity after deducting all of its liabilities.
Stated and share capital Ordinary shares are classifi ed as equity.
During the prior year, the ordinary shares were converted to no par value shares, resulting in the existing share capital and share premium being transferred to stated capital.
Incremental costs directly attributable to the issue of new ordinary shares or options are shown in equity as a deduction, net of tax, from the proceeds.
Treasury shares Where any group company purchases the company’s equity share capital (treasury shares), the consideration paid, including
any directly attributable incremental costs (net of income taxes) is deducted from equity attributable to the company’s equity holders until the shares are cancelled or reissued. Where such shares are subsequently reissued, any consideration received,

62 Afrimat integrated annual report 2014
Annual fi nancial statements
Notes to the annual fi nancial statements (continued)for the year ended 28 February 2014
net of any directly attributable incremental transaction costs and the related income tax effects, is included in equity attributable to the company’s equity holders.
1.9 Inventories Inventories are measured at lower of cost and net realisable value.
Net realisable value is the estimated selling price in the ordinary course of business less the estimated costs necessary to make the sale.
The cost of inventories comprises of all costs of purchase, cost of conversion and other costs incurred in bringing the inventories to their present location and condition.
The cost of the inventories is assigned using the fi rst-in, fi rst-out (‘FIFO’) formula. The same cost formula is used for all inventories having similar nature and use to the entity. The cost of consumable stores is determined on the weighted average basis.
When inventories are sold, the carrying amount of those inventories is recognised as an expense in the period in which the related revenue is recognised. The amount of any write-down of inventories to net realisable value and all losses of inventories are recognised as an expense in the period the write-down or loss occurs. The amount of any reversal of any write-down of inventories, arising from an increase in net realisable value, is recognised as a reduction in the amount of inventories recognised as an expense in the period in which the reversal occurs.
1.10 Tax Tax expense Current and deferred taxes are recognised as income or an expense and included in the statement of comprehensive income,
except to the extent that the tax arises from: a transaction or event which is recognised, in the same or a different period, directly in equity, or a business combination.
Current tax and deferred taxes are charged or credited to equity if the tax relates to items that are credited or charged, in the same or different period, directly to equity.
The current tax payable is based on taxable profi t. Taxable profi t differs from profi t reported in the statement of comprehensive income when there are items of income or expense that are taxable or deductible in other years and it also excludes items that are not taxable or deductible under existing tax legislation.
Current tax assets and liabilities Current tax for current and prior periods is, to the extent unpaid, recognised as a liability. If the amount already paid in respect
of current and prior periods exceeds the amount due for those periods, the excess is recognised as an asset.
Current tax assets and liabilities for the current and prior periods are measured at the amount expected to be recovered from or paid to the tax authorities, using the tax rates (tax laws) that have been enacted or substantively enacted by the reporting date.
Deferred tax assets and liabilities A deferred tax liability is recognised for all taxable temporary differences, except to the extent that the deferred tax liability arises
from: the initial recognition of goodwill; or the initial recognition of an asset or liability in a transaction which: – is not a business combination; and – at the time of the transaction, affects neither accounting profi t nor taxable profi t (tax loss).
A deferred tax liability is recognised for all taxable differences associated with investments in subsidiaries, branches and associates, and interest in joint ventures, except to the extent that both the following conditions are satisfi ed:
the parent, investor or venturer is able to control the timing of the reversal of the temporary difference; and it is probable that the temporary difference will not reverse in the foreseeable future.
A deferred tax asset is recognised for all deductible temporary differences to the extent that it is probable that taxable profi t will be available against which the deductible temporary difference can be utilised, unless the deferred tax asset from the initial recognition of an asset or liability in an transaction that:
at the time of transaction, affects neither accounting profi t nor taxable profi t (tax loss).
A deferred tax asset is recognised for all deductible temporary differences arising from investment in subsidiaries, branches and associates, and interests in joint ventures, to the extent that it is probable that:
the temporary difference will reverse in the foreseeable future; and taxable profi t will be available against which the unused tax losses can be utilised.
A deferred tax asset is recognised for the carry forward of unused tax losses to the extent that it is probable that future taxable profi t will be available against which the unused tax losses can be utilised.
Deferred tax assets and liabilities are measured at the tax rates that are expected to apply to the period when the asset is realised or the liability is settled, based on tax rates (and tax laws) that have been enacted or substantially enacted by the reporting date.

63Afrimat integrated annual report 2014
The measurement of deferred tax assets and liabilities refl ect the tax consequences that would follow from the manner in which
the group expects to recover or settle the carrying amounts of its assets and liabilities at the reporting date.
Deferred tax assets and liabilities are offset for presentation in the statement of fi nancial position where the company has a
legally enforceable right to do so and the income taxes relate to the same tax authority.
Therefore, deferred tax assets and deferred tax liabilities arising in the group fi nancial statements from different subsidiaries are not offset because there is no allowance in South African tax law that allows income tax from different entities to be offset.
1.11 Leases as lessee and instalment purchase agreements A lease is classifi ed as a fi nance lease if it transfers substantially all the risks and rewards incidental to ownership. All other
leases are considered to be operating leases.
Instalment purchase agreements are recognised as assets and liabilities in the statement of fi nancial position at amounts equal to the fair value of the fi nanced asset or, if lower, the present value of the minimum instalment payments. The corresponding
liability to the lessor is included in the statement of fi nancial position as borrowings.
The discount rate used in calculating the present value of the minimum instalment payments is the interest rate implicit in the instalment purchase agreement.
The instalment purchase payments are apportioned between the fi nance charge and reduction of the outstanding liability. The
fi nance charge is allocated to each period during the lease term so as to produce a constant periodic rate on the remaining
balance of the liability.
Assets held under instalment purchase agreements are depreciated over their expected useful lives on the same basis as owned
assets.
Operating lease payments are recognised as an expense on a straight-line basis over the lease term. The difference between
the amounts recognised as an expense and the contractual payments are recognised as an operating lease liability. This liability
is not discounted.
Contingent rentals are not accounted for on a straight-line basis, but are expensed in the statement of comprehensive income
in the period in which they occur.
Leases as lessor Amounts due from lessees under fi nance leases are recorded as receivables at the amount of the group’s net investment in the
leases. Finance lease income is allocated to accounting periods so as to refl ect a constant periodic rate of return on the group’s
net investment outstanding in respect of the leases.
Rental income from operating leases is recognised on a straight-line basis over the term of the relevant lease. Initial direct costs incurred in negotiating and arranging an operating lease are added to the carrying amount of the leased asset and recognised
on a straight-line basis over the lease term.
1.12 Impairment of non-financial assets The group assesses at each reporting date whether there is any indication that an asset may be impaired. If any such indication
exists, the group estimates the recoverable amount of the individual asset.
If it is not possible to estimate the recoverable amount of the individual asset, the recoverable amount of the cash-generating
unit to which the asset belongs is determined. The recoverable amount of an asset or cash-generating unit is the higher of its
fair value less costs to sell and its value in use.
In assessing value in use the estimated cash fl ows are discounted to their present value using a pre-tax discount rate that
refl ects the current market assessment of the time value of money and the risks specifi c to the asset or to the cash-generating
unit. If the recoverable amount of an asset is less than its carrying amount, the carrying amount of the asset is reduced to its
recoverable amount. That reduction is an impairment loss.
An impairment loss is recognised for cash-generating units if the recoverable amount of the unit is less than the carrying amount of the unit. The impairment loss is allocated to reduce the carrying amount of the assets of the unit in the following order:
fi rst to reduce the carrying amount of any goodwill allocated to the cash-generating unit; and and then to the other assets of the unit, pro-rata on the basis of the carrying amount of each asset in the unit.
Irrespective of whether there is any indication of impairment, the company also tests goodwill acquired in a business combination
for impairment annually by comparing its carrying amount with its recoverable amount. This impairment test is performed annually at the same time every year.
The accounting policy that deals with the impairment of goodwill are included in the respective accounting policy notes for those assets.

64 Afrimat integrated annual report 2014
Annual fi nancial statements
Notes to the annual fi nancial statements (continued)for the year ended 28 February 2014
1.13 Employee benefits Short-term employee benefi ts The cost of short-term employee benefi ts, (those expected to be wholly settled within 12 months after the end of the period in
which the employees render the related service, such as paid vacation leave and sick leave, bonuses, and non-monetary
benefi ts such as medical care), are recognised in the period in which the related service is rendered and are not discounted.
The expected cost of compensated absences is recognised as an expense as the employee renders service that increases their
entitlement or, in the case of non-accumulating absences, when the absence occurs.
The expected cost of profi t sharing and bonus payments is recognised as an expense when there is a legal constructive
obligation to make such payments as a result of past performance.
Share-based compensation The group operates an equity-settled, share-based compensation plan, under which the entity receives services from employees
as consideration for equity instruments (options) of the group. The fair value of the employee services received in exchange for
the grant of the options is recognised as an expense. The total amount to be expensed is determined by reference to the fair
value of the options granted: including any market performance conditions (for example, an entity’s share price); excluding the impact of any service and non-market performance vesting conditions (for example HEPS, profi tability, sales
growth targets and remaining an employee over a specifi ed time period); and including the impact of any non-vesting conditions.
Non-market vesting conditions are included in assumptions about the number of options that are expected to vest. The total
expense is recognised over the vesting period, which is the period over which all of the specifi ed vesting conditions are to be
satisfi ed. At the end of each reporting period, the entity revises its estimates of the number of options that are expected to vest
based on the non-market vesting conditions. It recognises the impact of the revision to original estimates, if any, in the statement
of comprehensive income, with a corresponding adjustment to equity. When the options are exercised, the company utilises
treasury shares. The market value of share options exercised by employees, net of any directly attributable transaction costs, are
debited to stated capital when the options are exercised. The fair value of the employee services received, measured by reference
to the equity instrument granted at grant date fair value, is recognised over the vesting period as an expense in the statement of
comprehensive income of the subsidiary, with a corresponding credit to reserves in the subsidiary equity.
Defi ned contribution plans Payments to defi ned contribution retirement benefi t plans are charged as an expense as they fall due.
1.14 Provisions Provisions are recognised when the group has a present obligation as a result of a past event and it is probable that an outfl ow
of resources embodying economic benefi ts will be required to settle the obligation, and a reliable estimate can be made of the
obligation.
The amount of a provision is the present value of the expenditure expected to be required to settle the obligation. Provisions are
reviewed annually to refl ect current best estimates of the expenditure required to settle the obligation.
1.15 Revenue Revenue from the sale of goods is recognised when the signifi cant risks and rewards of ownership are transferred to the buyer.
Revenue is measured at the fair value of the consideration received or receivable, which is represented by the invoiced amount
excluding value added tax, trade discounts and volume rebates.
Revenue arising from the rendering of services is recognised when the outcome of the transaction can be estimated reliably by
reference to the stage of completion of the transaction. Revenue is measured at the fair value of the consideration received or
receivable, excluding value added tax and trade discounts.
Dividends are recognised in profi t or loss when the company’s right to receive payment has been established. This normally
coincides with the date of declaration of the dividend.
Interest revenue is recognised in profi t or loss using the effective interest method.
Rental income due from operating leases is recognised on a straight-line basis over the term of the lease. Initial direct costs
incurred in negotiating and arranging and operating lease are added to the carrying amount of the leased asset and recognised
on a straight-line basis over the lease term.
1.16 Contribution from operations Contribution from operations include gross profi t and operational expenses. The group considers profi t/(loss) on disposal of
plant, equipment and vehicles as an operational income or expense.
65Afrimat integrated annual report 2014
1.17 Accounting for BEE transactions Where equity instruments are issued to a BEE party at less than fair value, these are accounted for as share-based payments in
terms of IFRS 2: Share-based Payments, IFRIC 8: Scope of IFRS 2 and SAICA Financial Reporting Guide 2: Accounting for Black Economic Empowerment (BEE) Transactions.
When equity instruments are issued to a BEE party at fair value, these are accounted for as equity. When the rights to these equity instruments have been allocated to the BEE parties, the equity instruments are derecognised and accounted for as loans and receivables.
1.18 Foreign currency transactions Translation of operations conducted in Namibia due to the fi xed exchange rate, do not result in translation gains or losses.
1.19 Borrowing costs The group capitalises borrowing costs directly attributable to the acquisition, construction or production of a qualifying asset as
part of the cost of that asset. All investment income earned on the temporary investment of specifi c borrowings pending their expenditure on qualifying assets is deducted from the borrowing costs eligible for capitalisation. Other borrowing costs are recognised as an expense in the period in which they are incurred.
1.20 Decommissioning and quarry rehabilitation Group companies are required to restore quarry and manufacturing sites at the end of their productive lives to a condition
acceptable to the relevant authorities.
The expected cost of any decommissioning programme, discounted to its net present value, has been capitalised at current date and amortised over the estimated remaining useful life of the related asset. The increase or decrease in the net present value of the expected cost is included in fi nance costs.
The expected increase or decrease in the cost of any rehabilitation programme, discounted to its net present value, is charged as an expense in the year in which the increase or decrease occur and is included in cost of sales. The increase or decrease in the net present value of the expected cost is included in fi nance costs.
1.21 Segment information The principal segments of the group have been identifi ed by business segment. The basis is representative of the internal structure
used for management reporting to the chief operating decision-maker. The chief operating decision-maker, who is responsible for allocating resources and assessing performance of the operating segments, has been identifi ed as the executive committee.
Segment revenue refl ects both sales to external parties and inter-group transactions across segments. Inter-group transactions across segments occur under terms that are no less favourable than those arranged with third parties. The segment result is presented as segment profi t before net fi nance costs and taxation.
Segment operating assets and liabilities are only those items that can be specifi cally identifi ed within a particular segment.
1.22 Significant accounting judgements and estimates The preparation of the group’s annual fi nancial statements requires management to make judgements, estimates and
assumptions that affect the reported amounts of revenues, expenses, assets and liabilities, and the disclosure of contingent liabilities at the reporting date. However, uncertainty about these assumptions and estimates could result in outcomes that could require a material adjustment to the carrying value of the asset or liability affected in the future.
The key assumptions concerning the future and other key sources of estimation uncertainty at the reporting date, that have a signifi cant risk of causing a material adjustment to the carrying amounts of assets and liabilities within the next fi nancial year, are discussed below.
Property, plant and equipment The group assigns useful lives and residual values to property, plant and equipment based on periodic studies of actual asset
lives and the intended use for those assets. Changes in circumstances such as technological advances, prospective economic utilisation and physical condition of the assets concerned could result in the actual useful lives or residual values differing from initial estimates. Where the group determines that the useful life of property, plant and equipment should be shortened or residual value reduced, it depreciates the net book value in excess of the residual value over the revised remaining useful life, thereby increasing depreciation expense. Any change in an asset’s life or residual value is refl ected in the group’s annual fi nancial statements when the change in estimate is determined. Consideration is given to whether subsequent expenditure is to be treated as maintenance or to be capitalised.
Trade and other receivables Impairment of trade and other receivables requires the consideration of the impairment indicators, namely signifi cant fi nancial
diffi culties of the debtor, probability that the debtor will enter bankruptcy or fi nancial reorganisation and default or delinquency in payments.

66 Afrimat integrated annual report 2014
Annual fi nancial statements
Notes to the annual fi nancial statements (continued)for the year ended 28 February 2014
Decommissioning and rehabilitation provisions Quantifying the future costs of these obligations is complex and requires various estimates to be made thereof, as well as
interpretations of and decisions regarding regulatory requirements, particularly with respect to the degree of rehabilitation required, with reference to the sensitivity of the environmental area surrounding the sites. Consequently, the guidelines issued for quantifying the future rehabilitation cost of a site, as issued by the Department of Mineral Resources, have been used to estimate future rehabilitation costs.
Impairment of goodwill Goodwill has been allocated to cash-generating units. The carrying value of goodwill is assessed using a discounted methodology
based on forecasts including assumptions on operating profi t, depreciation, working capital movements and capital expenditure. Refer note 5 for assumptions used.
Amortisation of intangible assets The best estimate of the useful life of mining rights is used in assessing the period over which the group amortises mining rights.
Where available, the life of mine (‘LOM’) is used to assign useful lives to mining rights. Hereby an independent expert in the fi eld is commissioned to evaluate each mine, to determine the mineral reserve and mineral resources, used to calculate the LOM, which includes the preparation of a Mineral Resources and Mineral Reserves Statement. This information contains laboratory test results and relevant information upon which the geologist base his assumptions.
The amortisation on purchasing rights is determined on an annual basis by reference to raw materials consumed.
Share-based payment expense calculation The group uses the Black Scholes valuation model to determine the fair value of the options granted. The signifi cant inputs into
the model are disclosed in note 17.
Provision for stock obsolescence The group recognised a provision for stock obsolescence based on the determination of excess stock on hand as well as
damaged and unusable items.
1.23 New and amended standards New and amended standards adopted by the group The group has adopted the following standards, amendments and interpretations that are effective for the current fi nancial year
and that are relevant to its operations:
IFRS 10: Consolidated Financial Statements The new standard establishes control as the only basis for consolidation of all entities, regardless of the nature of the investee.
It amends the defi nition of control to include three elements, namely power over an investee, exposure or rights to variable returns of the investee and the ability to use power over the investee to affect the investor’s returns. The new standard replaces a portion of IAS 27: Consolidated and Separate Financial Statements and SIC 12: Consolidation – Special Purpose Entities.
IFRS 12: Disclosure of Interests in Other Entities The objective of the new standard is to increase transparency in fi nancial reporting where the reporting entity has an interest in
subsidiaries, joint arrangements, associates or unconsolidated structured entities. The standard requires disclosure of information to enable users of fi nancial statements to evaluate the nature, risks and fi nancial effects associated with its interests in other entities.
IFRS 13: Fair Value Measurement The objective of the new standard is to reduce the complexity and improve the consistency of fair value measurements and is
part of the IASBs IFRS and US GAAP convergence project. The standard consolidates and clarifi es the requirements for measuring fair value and includes disclosure enhancements to assist users of fi nancial statements to better assess the valuation techniques and inputs used to measure fair value.
Amendments to IAS 1: Presentation of Financial Statements The amendments to IAS 1 require items that are recognised in other comprehensive income, that may in a future period be
reclassifi ed to profi t and loss, to be presented separately from those items that may never be reclassifi ed to profi t and loss.
Amendments to IAS 16: Property, Plant and Equipment The amendment clarifi es that spare parts and servicing equipment are classifi ed as property, plant and equipment rather than
inventory when they meet the defi nition of property, plant and equipment.
IFRIC 20: Stripping Costs in the Production Phase of a Surface Mine The objective of the new standard is to set out the accounting for overburden waste removal (stripping) costs in the production
phase of a mine. The interpretation may require mining entities reporting under IFRS to write off existing stripping assets to opening retained earnings if the assets cannot be attributed to an identifi able component of an ore body. An extensive exercise to determine the impact of IFRIC 20 on the surface mines within the group was performed during the year. Based on the results thereof, it has been concluded that there is no impact on the current treatment of stripping costs. Therefore the benefi ts derived from stripping are for current production and not for access to production beyond a 12-month future period. The group does not

67Afrimat integrated annual report 2014
have any predecessor stripping assets (stripping assets recognised prior to the effective date) and therefore the transitional adjustments of IFRIC 20 are not applicable.
There has been no material fi nancial effect on the results of the group as a result of the adoption of the abovementioned new standards and amendments.
The following new standards, amendments or interpretations to existing standards became effective during the year, but are not relevant to the group’s operations:
Amendments to IFRS 7: Financial Instruments – Disclosures. Offsetting Financial Assets and Financial Liabilities IFRS 11: Joint Arrangements. Rights and obligations of the arrangement, rather than its legal form Amendments to IAS 32: Financial Instruments – Presentation. Income tax relating to distributions to equity holders Amendments to IAS 28: Investments in Associates. Consequential amendments arising as a result of issuing IFRS 10, 11 and 12 Annual Improvements to IFRS
Standards, amendments and interpretations to existing standards that are not yet effective and have not been early adopted by the group
The following standards and amendments to existing standards have been published and are mandatory for the group’s accounting periods beginning on or after 1 March 2014 or later periods, but the group has not early adopted them. Only those expected to impact the group are included below:
IFRS 2 (Amended): Share-based Payment Defi nitions changed for vesting condition and service condition; defi nition added for performance condition and service
condition. The amendment become effective for the group for annual periods beginning on or after 1 March 2015. The group expects that its adoption will not have a material fi nancial impact on its annual fi nancial statements.
IFRS 9: Financial Instruments – Classifi cation and Measurement This new standard covers the classifi cation and measurement of fi nancial instruments and aims to enhance the ability of
investors and other users of fi nancial information to understand the accounting of fi nancial assets and reduce complexity. The standard is intended ultimately to replace IAS 39. It is expected that the new standard will become effective for the group for annual periods beginning on or after 1 March 2018, but has not yet been confi rmed. The group is still considering the expected impact of IFRS 9.
IAS 36 (Amended): Impairment of Assets The amendment brings the disclosures for impaired assets whose recoverable amount is fair value less cost to sell in line with
the disclosure requirements of IFRS 13: Fair Value Measurements. The amendment become effective for the group for annual periods beginning on or after 1 March 2014. The group expects that its adoption will not have a material fi nancial impact on its annual fi nancial statements, however it will impose additional disclosure requirements.
IFRIC 21 (Amended): Levies The interpretation covers the accounting for outfl ows imposed on entities by governments (including government agencies and
similar bodies) in accordance with laws and/or regulations. The amendment become effective for the group for annual periods beginning on or after 1 March 2014. The group is not currently subjected to signifi cant levies so the impact on the group is immaterial.
1.24 New and amended standards and interpretations not currently relevant to the group’s operations The group has not applied the following new and amended standards and interpretations that have been issued but are not yet
effective, nor relevant to the group’s operations:
Amendments to IFRS 10: Consolidated Financial Statements (effective 1 March 2014) Exemption from requirement to consolidate investment entities that must be fair valued in accordance with IAS 39 or IFRS 9
(if applicable) if it meets the requirements.
Amendments to IFRS 12: Disclosure of Interests in Other Entities (effective 1 March 2014) Disclosure requirements for investment entities that are fair valued.
Amendments to IAS 27: Consolidated and Separate Financial Statements (effective 1 March 2014) Requirement to account for the interests in investment entities at fair value in accordance with IAS 39 or IFRS 9 (if applicable) in
the separate fi nancial statements of the parent.

68 Afrimat integrated annual report 2014
Annual fi nancial statements
Notes to the annual fi nancial statements (continued)for the year ended 28 February 2014
Cost/valuation
2014R
Accumulated depreciation
2014R
Carryingvalue2014
R
Cost/valuation
2013R
Accumulateddepreciation
2013R
Carryingvalue2013
R
2. Property, plant and equipmentGroupLand and buildings 105 270 264 (29 777 210) 75 493 054 51 228 239 (7 060 870) 44 167 369Leasehold property 12 361 510 (3 159 225) 9 202 285 11 751 324 (2 558 281) 9 193 043Plant and machinery 563 004 200 (249 716 613) 313 287 587 442 459 906 (195 136 560) 247 323 346Motor vehicles 462 623 628 (255 949 537) 206 674 091 356 032 656 (161 319 156) 194 713 500Office and computer equipment 21 360 473 (18 359 315) 3 001 158 15 096 449 (11 802 905) 3 293 544Dismantling costs 15 144 756 (7 683 855) 7 460 901 11 114 305 (6 190 429) 4 923 876Mining assets 106 451 392 (59 263 859) 47 187 533 – – –
Total 1 286 216 223 (623 909 614) 662 306 609 887 682 879 (384 068 201) 503 614 678
CompanyMotor vehicles 1 778 893 (448 922) 1 329 971 950 000 (49 875) 900 125Office and computer equipment 7 970 532 (5 778 343) 2 192 189 6 441 222 (4 365 068) 2 076 154
Total 9 749 425 (6 227 265) 3 522 160 7 391 222 (4 414 943) 2 976 279
Analysis of movements in carrying value:
Openingcarrying
valueR
AdditionsR
Additionsthrough
businesscombinations*
R
Change in category#
RDisposals
RDepreciation
R
Closingcarrying
valueR
Group – 2014Land and buildings 44 167 369 4 121 564 28 000 000 – – (795 879) 75 493 054Leasehold property 9 193 043 610 187 – – – (600 945) 9 202 285Plant and machinery 247 323 346 63 559 082 42 746 953 – (2 704 980) (37 636 814) 313 287 587Motor vehicles 194 713 500 48 478 418 23 000 000 – (13 983 652) (45 534 175) 206 674 091Office and computer equipment 3 293 544 2 768 480 – – (45 570) (3 015 296) 3 001 158Dismantling costs 4 923 876 1 788 239 5 251 622 – (2 845 700) (1 657 136) 7 460 901Mining assets – – 51 867 720 – – (4 680 187) 47 187 533
Total 503 614 678 121 325 970 150 866 295 – (19 579 902) (93 920 432) 662 306 609
Group – 2013Land and buildings 39 944 966 74 453 5 258 214 – – (1 110 264) 44 167 369Leasehold property 8 369 861 1 368 014 – – – (544 832) 9 193 043Plant and machinery 231 610 477 31 875 573 48 517 093 (34 766 272) (1 717 391) (28 196 134) 247 323 346Motor vehicles 136 984 810 47 576 107 6 264 769 34 766 272 (8 637 139) (22 241 319) 194 713 500Office and computer equipment 3 286 861 1 575 670 538 763 – (71) (2 107 679) 3 293 544Dismantling costs 5 708 762 464 636 – – – (1 249 522) 4 923 876
Total 425 905 737 82 934 453 60 578 839 – (10 354 601) (55 449 750) 503 614 678

69Afrimat integrated annual report 2014
Openingcarrying
valueR
AdditionsR
Additionsthrough
businesscombinations*
R
Change in category#
RDisposals
RDepreciation
R
Closingcarrying
valueR
2. Property, plant and equipment (continued)Company – 2014Motor vehicles 900 125 755 082 – – (191 390) (133 846) 1 329 971Office and computer equipment 2 076 154 1 550 630 – – – (1 434 595) 2 192 189
Total 2 976 279 2 305 712 – – (191 390) (1 568 441) 3 522 160
Company – 2013Motor vehicles – 950 000 – – – (49 875) 900 125Office and computer equipment 2 555 376 903 830 – – – (1 383 052) 2 076 154
Total 2 555 376 1 853 830 – – – (1 432 927) 2 976 279
* Note 31.
# Certain assets were reclassified to ensure conformity with group policy and guidelines.
Certain property, plant and equipment has been encumbered as security for interest-bearing borrowings (note 20).
Group
2014R
2013R
Carrying value of assets pledged as security:Property, plant and equipment 259 038 232 142 841 183
Included in disposals are plant and equipment with a cost of R3 815 738 (2013: R3 510 529) and accumulated depreciation of R1 122 781 (2013: R2 359 639), which had no further economic value and have been removed from the register.
Depreciation expense of R88 694 491 (2013: R51 246 080) has been charged in ‘cost of sales’ and R5 225 941 (2013: R4 203 670) in ‘operating expenses’.
Land within the group was pledged to ABSA Bank Limited as security over the bond acquired on the initial bond amount issued of R64 861 708 (note 20).
Group
2014R
2013R
3. Investment propertyFair value of investment property 3 040 000 –
The property was valued by an independent registered professional valuer, Mr George Nel, as potential use being for agricultural purposes. He conducted a valuation of the investment property in February 2013. Management confirmed there to be no significant movements from the value as estimated in the prior year.
The group’s investment property is encumbered by means of a mortgage to the amount of R2 040 000 with ABSA Bank Limited.
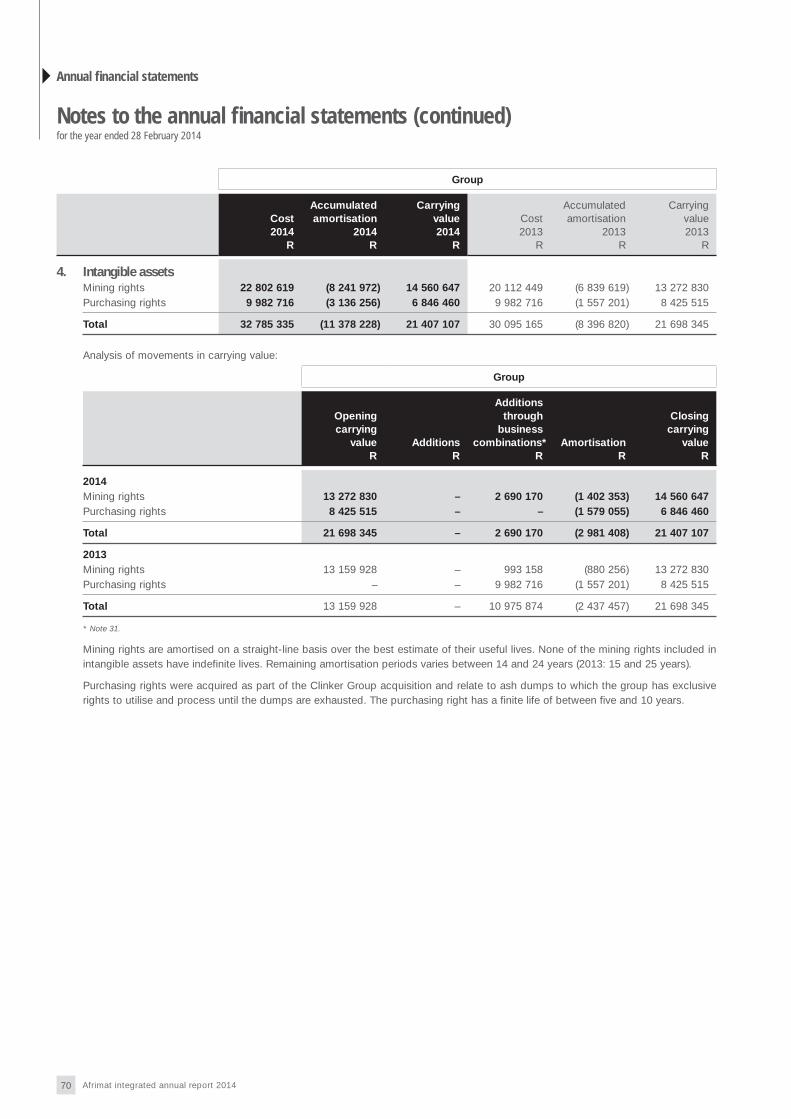
70 Afrimat integrated annual report 2014
Annual fi nancial statements
Notes to the annual fi nancial statements (continued)for the year ended 28 February 2014
Group
Cost2014
R
Accumulated amortisation
2014R
Carryingvalue2014
R
Cost2013
R
Accumulatedamortisation
2013R
Carrying value2013
R
4. Intangible assetsMining rights 22 802 619 (8 241 972) 14 560 647 20 112 449 (6 839 619) 13 272 830Purchasing rights 9 982 716 (3 136 256) 6 846 460 9 982 716 (1 557 201) 8 425 515
Total 32 785 335 (11 378 228) 21 407 107 30 095 165 (8 396 820) 21 698 345
Analysis of movements in carrying value:
Group
Openingcarrying
valueR
AdditionsR
Additionsthrough
businesscombinations*
RAmortisation
R
Closingcarrying
valueR
2014Mining rights 13 272 830 – 2 690 170 (1 402 353) 14 560 647Purchasing rights 8 425 515 – – (1 579 055) 6 846 460
Total 21 698 345 – 2 690 170 (2 981 408) 21 407 107
2013Mining rights 13 159 928 – 993 158 (880 256) 13 272 830Purchasing rights – – 9 982 716 (1 557 201) 8 425 515
Total 13 159 928 – 10 975 874 (2 437 457) 21 698 345
* Note 31.
Mining rights are amortised on a straight-line basis over the best estimate of their useful lives. None of the mining rights included in intangible assets have indefinite lives. Remaining amortisation periods varies between 14 and 24 years (2013: 15 and 25 years).
Purchasing rights were acquired as part of the Clinker Group acquisition and relate to ash dumps to which the group has exclusive rights to utilise and process until the dumps are exhausted. The purchasing right has a finite life of between five and 10 years.

71Afrimat integrated annual report 2014
Group
2014
R2013
R
5. GoodwillGross amount 141 148 064 139 361 300Accumulated impairment (6 654 529) (6 654 529)
Carrying value 134 493 535 132 706 771
Analysis of movements in carrying value:Carrying value – opening balance 132 706 771 101 194 917Additions through business combinations (refer note 31) 1 786 764 36 257 381Impairment of goodwill – (4 745 527)
Carrying value – closing balance 134 493 535 132 706 771
Goodwill acquired through business combinations has been allocated to cash-generating units as follows:Afrimat Concrete Products (Pty) Limited 20 468 422 20 468 422Afrimat Aggregates (KZN) (Pty) Limited 16 877 717 16 877 717Rodag Holdings (Pty) Limited 1 057 984 1 057 984Afrimat Aggregates (Operations) (Pty) Limited 122 216 122 216Malans Group 10 832 307 10 832 307Afrimat Aggregates (Eastern Cape) (Pty) Limited 39 266 892 39 266 892SA Block (Pty) Limited 10 152 067 10 152 067Clinker Supplies (Pty) Limited 26 105 314 26 105 314Scottburgh Group 1 300 000 1 300 000Sunshine Crushers (Pty) Limited 5 723 351 5 723 351Glen Douglas Dolomite (Pty) Limited 800 501 800 501Infrasors Holdings Limited 1 786 764 –
The group applied a discounted cash flow methodology to value goodwill. These cash flows were based on forecasts which included assumptions on operating profit, depreciation, working capital movements and capital expenditure. The assumptions are based on past experience. The discount rate applied to the cash flow projections was 19% (2013: 19%). The key assumptions used were growth rates of 5% to 10% (2013: 5% to 10%) over a period of 10 years. The period of 10 years was assumed due to the long-term nature of mining activities. The growth rates were based on industry experience. Management believe that any reasonable possible change in key assumptions on which the recoverable amount is based, would not cause the carrying amount to exceed the recoverable amount.
The recoverable amount has been determined using the value-in-use calculations. During the prior year an amount of R4 745 527 was identified as not recoverable and was subsequently written off as impaired, due to declining reserves and resources.

72 Afrimat integrated annual report 2014
Annual fi nancial statements
Notes to the annual fi nancial statements (continued)for the year ended 28 February 2014
Name of company
Nature of business
Total share
capitalR
%holding
2014
%holding
2013
Carryingamountshares
2014R
Carryingamountshares
2013R
Carryingamount
indeb-tedness
2014R
Carryingamountindeb-
tedness2013
R
6. Investments in subsidiaries Afrimat Share Incentive Trust Investment – – – – – (126 776) 678 727Afrimat BEE Trust Investment – – – – – – –Afrimat Empowerment Investments (Pty) Limited Investment 120 100,0 100,0 – – – –AFT Aggregates (Pty) Limited Aggregates 20 100,0 100,0 175 108 175 108 291 252 1 311 401
Boublok (Pty) Limited
Concrete Based
Products 100 100,0 100,0 888 831 888 831 2 151 138 942 565Capmat (Pty) Limited Aggregates 4 000 87,5 87,5 6 255 231 6 255 231 2 702 124 2 130 371
Afrimat Concrete Products (Pty) Limited
Concrete Based
Products 10 000 100,0 100,0 67 378 835 67 378 835 (12 212 190) 88 012Afrimat Aggregates (KZN) (Pty) Limited Aggregates 30 000 100,0 100,0 35 182 874 35 182 874 2 781 068 (2 699 664)
Afrimat Readymix (Cape) (Pty) Limited
Concrete Based
Products 200 100,0 100,0 5 267 084 5 267 084 325 199 (579 732)Afrimat Aggregates (Operations) (Pty) Limited Aggregates 100 100,0 100,0 106 220 430 106 220 430 (28 268 688) (2 527 026)Prima Quarries Namibia (Pty) Limited Aggregates 100 100,0 100,0 100 100 – –Rodag Holdings (Pty) Limited Property 4 100,0 100,0 3 829 110 3 829 110 4 089 218 3 865 667Rodag Properties (Pty) Limited Dormant 1 000 100,0 100,0 – – – –Tradeselect 5 (Pty) Limited Dormant 100 100,0 100,0 – – – –Maritzburg Quarries (Pty) Limited Aggregates 70 000 100,0 100,0 1 295 741 1 295 741 457 490 457 490Scottburgh Quarries (Pty) Limited Aggregates 100 100,0 100,0 8 020 000 8 020 000 108 108Afrimat Aggregates (Eastern Cape) (Pty) Limited Aggregates 600 100,0 100,0 53 181 208 53 181 208 (8 004 852) (361 215)Afrimat Aggregates (Trading) (Pty) Limited Aggregates 5 000 92,7 92,7 24 933 683 24 933 683 (19 606 340) (28 595 266)Community Quarries (Pty) Limited Aggregates 100 100,0 100,0 33 771 554 33 771 554 – –Olympic Sand (Pty) Limited Aggregates 1 000 100,0 100,0 1 204 580 1 204 580 – –Malric Properties (Pty) Limited Property 100 100,0 100,0 13 053 322 13 053 322 – –Propateez 66 (Pty) Limited Property 100 100,0 100,0 831 872 831 872 – –ASBE Community Empowerment (Pty) Limited Aggregates 900 100,0 100,0 – – (525) (1 000)Labonte 3 (Pty) Limited Property 1 000 50,0 50,0 149 494 149 494 546 218 933 287Jeffreys Bay Crushers (Pty) Limited Aggregates 200 100,0 100,0 200 200 (100) (100)Sunshine Crushers (Pty) Limited Aggregates 1 179 960 100,0 100,0 8 081 014 8 081 014 (2 872 565) (2 872 565)Afrimat Contracting International (Pty) Limited Contracting 100 100,0 100,0 3 180 001 3 180 001 (6 362 472) 34 108
SA Block (Pty) Limited
ConcreteBased
Products 200 100,0 100,0 120 805 535 120 805 535 (23 800 808) (24 396 758)Clinker Supplies (Pty) Limited Aggregates 100 000 100,0 100,0 24 210 000 24 210 000 409 192 171 535Meepo Ya Mmu Resources (Pty) Limited Aggregates 1 000 54,0 54,0 954 818 954 818 (36 788) (9 000)Glen Douglas Dolomite (Pty) Limited Aggregates 10 000 100,0 100,0 27 657 764 27 657 764 (30 875 479) (309 859)Infrasors Holdings Limited* Aggregates 185 521 091 79,6 – 81 098 097 – 14 376 276 –
627 626 486 546 528 389 (104 038 300) (51 738 914)
Analysis of current assets and liabilities:Current assetsLoans to subsidiaries 28 129 283 10 613 271
Current liabilitiesLoans from subsidiaries (132 167 583) (62 352 185)
(104 038 300) (51 738 914)
* Indirectly held subsidiaries include Delf Sand (Pty) Limited, Pienaarspoort Ontwikkeling (Pty) Limited, Delf Silica Coastal (Pty) Limited, Delf Cullinan (Pty) Limited, Delf Silica (Pty) Limited, Lyttelton Dolomite (Pty) Limited, Infrasors Environmental Rehabilitation Trust, Infabric (Pty) Limited, Infrasors Management Services (Pty) Limited, Infrasors Empowerment Trust and Prima Quarries Social Development Trust.

73Afrimat integrated annual report 2014
6. Investments in subsidiaries (continued)The carrying amounts of subsidiaries are shown net of impairment losses. The loans have no fixed terms of repayment and the majority bear interest at prime less 3,5%. Interest on the Infrasors Holdings Limited loan is calculated at prime plus 1,5% and the Afrimat Empowerment Investments (Pty) Limited bears interest at prime. The subsidiaries are incorporated in the Republic of South Africa except for Prima Quarries Namibia (Pty) Limited that is incorporated in Namibia.
Afrimat holds 79,6% of Infrasors, whilst treasury shares account for 12,0% and minorities account for the remaining 8,4% of the total issued Infrasors ordinary shares.
No impairment was made to any of the investments during current or prior year.
All subsidiaries are entities over which the group has control. The group is exposed to, or has rights to, variable returns from its involvement with the subsidiaries and has the ability to affect the returns through its power over the entities. Management has assessed the level of influence that the group has over Labonte 3 (Pty) Limited and determined that it has control over the board of directors and therefore controls the operations of the entity.
A notice of cession and pledge of 94 171 108 Infrasors shares by Afrimat in favour of ABSA Bank Limited was made on 6 May 2013. An entry in favour of ABSA Bank Limited has been made in Afrimat’s securities account held at FNB Securities (Pty) Limited as contemplated in terms of section 39 of the Financial Markets Act No. 19 of 2012, noting ABSA’s interest in the aforementioned shares. With effect from the date on which ABSA Bank Limited notifies FNB Securities (Pty) Limited in writing of an event of default that has occurred or has not been rectified as the case may be, FNB Securities (Pty) Limited shall on written instruction of ABSA Bank Limited, transfer the shares to ABSA Bank Limited or another party nominated by it.
The group consolidated the Afrimat Share Incentive Trust and Afrimat BEE Trust and its subsidiary Afrimat Empowerment Investments (Pty) Limited (‘AEI’), due to the group having power to control the financial and operating policies of the trusts. Refer to note 8 for explanation regarding the de-recognition of shares allocated to BEE participants.
Group Company
2014R
2013R
2014R
2013R
7. Investment in associateIkapa Quarries (Pty) Limited (49%) 201 362 77 257 147 147
Analysis of investment in associate:Opening balance 77 257 44 193 147 147 Share of net profit after taxation 173 105 67 744 – – Dividend received from associate (49 000) (34 680) – –
Closing balance 201 362 77 257 147 147
The group’s share of the results of its associate, which is unlisted, and the group’s share of its aggregated assets and liabilities, are as follows: Assets 3 310 026 718 917 – – Liabilities (3 111 720) (640 966) – – Revenues 7 730 732 2 678 493 – – Profit 173 105 67 744 – –
8. Other financial assetsNon-current assets:Available-for-sale 1 914 925 13 742 148 – – Loans and receivables 109 861 777 101 655 733 107 869 147 101 655 733 At fair value through profit or loss 17 583 654 – – – Held-to-maturity 4 862 636 – – –
134 222 992 115 397 881 107 869 147 101 655 733
Current assets:Available-for-sale – – – – Loans and receivables 1 274 857 – 846 887 – At fair value through profit or loss – – – – Held-to-maturity – – – –
1 274 857 – 846 887 –
Total other financial assets 135 497 849 115 397 881 108 716 034 101 655 733

74 Afrimat integrated annual report 2014
Annual fi nancial statements
Notes to the annual fi nancial statements (continued)for the year ended 28 February 2014
Group Company
2014R
2013R
2014R
2013R
8. Other financial assets (continued)Analysis of other financial assets:Available-for-saleListed shares at fair value Old Mutual PLC shares 107 813 83 440 – –
Environmental funds at fair value Green Horizons Environmental Rehabilitation Trust Fund 1 601 203 1 357 326 – – Liberty Life New Growth Rehabilitation Plan Trust 205 909 12 301 382 – –
1 807 112 13 658 708 – –
Total available-for-sale financial assets 1 914 925 13 742 148 – –
Loans and receivablesNon-current assets:Funding provided to Afrimat employees 103 926 034 101 655 733 – – Preference shares in Afrimat Empowerment Investments (Pty) Limited/Afrimat BEE Trust – – 103 926 034 101 655 733 BEE investor 5 935 743 – 3 943 113 –
Total non-current portion of loans and receivables 109 861 777 101 655 733 107 869 147 101 655 733
Current assets:BEE investor 1 274 857 – 846 887 –
Total current portion of loans and receivables 1 274 857 – 846 887 –
Total loans and receivables 111 136 634 101 655 733 108 716 034 101 655 733
In previous years Afrimat launched a broad-based BEE ownership initiative, whereby Afrimat’s black employees (‘participants’), via the Afrimat BEE Trust, acquired 16,8% of the issued share capital of the company (24 050 000 shares). Funding was provided by Afrimat to the Afrimat BEE Trust via a funding vehicle Afrimat Empowerment Investments (Pty) Limited (‘AEI’). AEI issued 1 000 preference shares to Afrimat Limited for a total subscription price of R64 205 000 as well as 1 000 preference shares for a total subscription price of R4 239 000, on behalf of participants. These preference shares are redeemable cumulative participating preference shares. Preference dividends are calculated at a rate of 70% of the prime interest rate.
During the prior year, Afrimat’s black employees, via the Afrimat BEE Trust, acquired a further 4,4% of the issued share capital of the company (6 392 575 shares). Funding was provided by Afrimat to the Afrimat BEE Trust via a funding vehicle AEI. AEI issued 1 000 preference shares to Afrimat Limited for a total subscription price of R31 506 000. These preference shares are redeemable cumulative participating preference shares. Preference dividends are calculated at a rate of 100% of the prime interest rate.
The company’s shares held by Afrimat Empowerment Investments (Pty) Limited/Afrimat BEE Trust serve as security for the preference shares. The preference shares are redeemable when the Afrimat shares are handed over to the participants via the Afrimat BEE Trust in terms of the scheme rules or the date when the preference shares are taken over by an external financier or the date when the preference shares are settled by the participants in cash.
For company shares that are allocated to BEE participants, it is deemed that the risk and rewards of ownership in these shares have passed to the employees. On group level, therefore the shares qualify for de-recognition and are treated as a loan to participants and not treasury shares.
The fair values of loans and receivables are considered to be equal to the carrying value.
On 21 February 2014, 190 000 treasury shares were sold to a BEE investor for a value of R12,74 per share. Loan funding to the value of R2 420 600 for the purchase of the shares were provided by one of the group’s subsidiaries, Afrimat Aggregates (Operations) (Pty) Limited. The loan will be subject to interest at Standard Bank Limited prime overdraft rate less 3 percentage points and is repayable over five years with the final repayment date on 20 February 2019.
On 24 January 2014, 4 790 000 shares held in treasury by Infrasors, were sold to a BEE investor for a value of R1,00 per share. Loan funding to the value of R4 790 000 for the purchase of the shares were provided by Afrimat. The loan will be subject to interest at Standard Bank Limited prime overdraft rate less 3 percentage points and is repayable over five years with the final repayment date on 23 January 2019.

75Afrimat integrated annual report 2014
Group Company
2014R
2013R
2014R
2013R
8. Other financial assets (continued)At fair value through profit or lossEnvironmental insurance policies 17 583 654 – – –
Total financial assets at fair value through profit or loss 17 583 654 – – –
Opening balance – – – – Additions through business combinations (refer note 31) 15 134 643 – – –Movement for the year 2 449 011 – – –
Insurance policy units purchased 1 300 800 – – – Insurance policy payout growth 1 411 212 – – – Policy costs (263 001) – – –
Closing balance 17 583 654 – – –
Environmental insurance policies are investments held in trust to be used to rehabilitate the environment after mining operations are completed at the Lyttelton, Marble Hall and Delf mining sites included in the Infrasors Group (refer note 21).
Changes in fair values of financial assets at fair value through profit or loss are recorded in ‘operating expenses’ in the statement of comprehensive income. The fair value of all equity securities is based on their current bid prices in an active market.
Group Company
2014R
2013R
2014R
2013R
Held-to-maturityGuaranteed endowment policy investment 4 862 636 – – –
Total financial assets held-to-maturity 4 862 636 – – –
Opening balance – – – –Additions through business combinations (refer note 31) 6 518 520 – – –Movement for the year (1 655 884) – – –
Settlement of Wesbank (Pty) Limited liability (5 016 000) – – – Insurance policy payout growth 3 360 116 – – –
Closing balance 4 862 636 – – –
The guaranteed endowment policy investment refers to a three-year guarantee policy for outstanding instalment purchase agreements on plant and equipment purchased in the Infrasors Group. The guaranteed payout at the end of the policy is R8 295 290, and is guaranteed to settle the outstanding instalment liability due.
The fair value of the financial assets were determined as follows: The fair value of available-for-sale financial assets and financial assets through profit or loss are based on the quoted market price. Fair value are determined annually at reporting date. None of these financial assets is either past due or impaired. Environmental funds were originally established to fund the cost of rehabilitation on closure of certain of the group’s quarries. The group since replaced the environmental fund held by Liberty Life with guarantees as per note 33. Due to the environmental fund being replaced before the termination of the original policy, the cumulative income up to date of replacement will not be repaid before the termination date of 25 February 2016.

76 Afrimat integrated annual report 2014
Annual fi nancial statements
Notes to the annual fi nancial statements (continued)for the year ended 28 February 2014
Group Company
2014R
2013R
2014R
2013R
9a. Financial instruments by category Assets as per statement of financial position Available-for-sale Other financial assets (refer note 8) 1 914 925 13 742 148 – –
1 914 925 13 742 148 – –
Loans and receivables at amortised cost Other financial assets (refer note 8) 111 136 634 101 655 733 108 716 034 101 655 733 Trade and other receivables excluding pre-payments and value-added taxation1 (refer note 12) 299 749 039 188 845 006 4 249 882 4 459 328 Cash and cash equivalents (refer note 13) 92 328 199 134 261 561 5 049 524 65 354 969 Loans to subsidiaries (refer note 6) – – 28 129 283 10 613 271
503 213 872 424 762 300 146 144 723 182 083 301
At fair value through profit or loss Other financial assets (refer note 8) 17 583 654 – – –
17 583 654 – – –
Held-to-maturity Other financial assets (refer note 8) 4 862 636 – – –
4 862 636 – – –
Total 527 575 087 438 504 448 146 144 723 182 083 301
1 Pre-payments and value-added taxation are excluded from the trade and other
receivables balance, as this analysis is required only for financial instruments.
The maximum exposure to credit risk at the reporting date is the carrying value of each class of loans and receivables mentioned above and at company level includes the exposure to omnibus securityship as per note 38(c), which is considered equal to the amounts mentioned above.
None of these financial assets is either past due or impaired.
Liabilities as per statement of financial position Financial liabilities at amortised cost Borrowings (refer note 20) 171 037 543 120 684 305 25 317 135 42 180 222 Loans from subsidiaries (refer note 6) – – 132 167 583 62 352 185 Trade and other payables excluding non-financial liabilities2 (refer note 22) 252 669 647 143 580 316 10 649 190 6 359 370
Bank overdraft (refer note 13) 51 451 466 49 118 762 – 21 170 965
Total 475 158 656 313 383 383 168 133 908 132 062 742
2 Taxes and other statutory liabilities are excluded from the trade and other
payables balance, as this analysis is required only for financial instruments.
9b. Credit quality of fully performing financial assetsTrade receivablesCustomers without external ratings Group 1 (New customers) 23 478 652 12 381 956 – – Group 2 (Existing customers – with no defaults in the past) 189 845 497 115 269 448 – – Group 3 (Existing customers – Some prior defaults, but fully recoverable) 16 915 649 16 973 745 – –
230 239 798 144 625 149 – –
None of the financial assets have been renegotiated in the current year.

77Afrimat integrated annual report 2014
Group Company
2014R
2013R
2014R
2013R
10. Deferred taxAccelerated capital allowances for tax purposes (98 839 800) (86 995 596) – –Provisions 15 198 981 10 823 330 2 336 820 380 655Tax losses available for set off against future taxable income 7 401 381 6 044 734 – 2 255 707Other deferred tax (10 364 629) (7 473 480) (278 522) (278 522)
(86 604 067) (77 601 012) 2 058 298 2 357 840
Analysis of movement in deferred tax balance:Opening balance (77 601 012) (64 948 448) 2 357 840 1 059 513Acquired through business combinations (refer note 31) (12 909 083) (9 370 318) – –Accelerated capital allowances for tax purposes (5 581 561) (4 811 243) – –Provisions 2 828 517 770 048 1 956 165 124 141Increase/(decrease) in tax losses available for set off against future taxable income 208 519 935 184 (2 255 707) 1 243 609Other 6 450 553 (176 235) – (69 423)
Closing balance (86 604 067) (77 601 012) 2 058 298 2 357 840
Non-current assets 5 047 929 3 008 993 2 058 298 2 357 840Non-current liabilities (91 651 996) (80 610 005) – –
(86 604 067) (77 601 012) 2 058 298 2 357 840
Analysis of movement in group deferred tax assets and liabilities during the year:
Provisions Tax losses Total
Deferred tax assetsAt 1 March 2012 9 111 633 5 109 550 14 221 183Acquired through business combinations (refer note 31) 941 649 28 000 969 649Charged to profit and loss 770 048 907 184 1 677 232
At 28 February 2013 10 823 330 6 044 734 16 868 064
Acquired through business combinations (refer note 31) 7 724 612 916 700 8 641 312Charged to profit and loss (3 348 961) 439 947 (2 909 014)
At 28 February 2014 15 198 981 7 401 381 22 600 362
Accelerated capital
allowancesOther
deferred tax Total
Deferred tax liabilitiesAt 1 March 2012 74 667 547 4 502 084 79 169 631Acquired through business combinations (refer note 31) 7 516 806 2 795 161 10 311 967Charged to profit and loss 4 799 487 176 235 4 975 722Charged to other comprehensive income 11 756 – 11 756
At 28 February 2013 86 995 596 7 473 480 94 469 076
Acquired through business combinations (refer note 31) 17 178 940 4 371 455 21 550 395Charged to profit and loss (5 380 219) (1 480 306) (6 860 525)Charged to other comprehensive income 45 483 – 45 483
At 28 February 2014 98 839 800 10 364 629 109 204 429
Deferred tax asset 22 600 362Deferred tax liabilities (109 204 429)
Total deferred tax liability (86 604 067)

78 Afrimat integrated annual report 2014
Annual fi nancial statements
Notes to the annual fi nancial statements (continued)for the year ended 28 February 2014
10. Deferred tax (continued)Deferred income tax assets are recognised for tax losses carried forward, to the extent that the realisation of the related tax benefit through future taxable profits is probable. The group has estimated income tax losses available, amounting to R46 124 039 (2013: R21 588 336). The group has estimated capital tax losses available, amounting to R38 655 725 (2013: RNil).
Included in the above tax losses were R19 690 536 (2013: RNil) and R38 655 725 (2013: RNil) relating to income and capital tax losses, respectively, which were not raised as deferred tax assets.
Management is of the opinion that it is probable, based on the new financial year budget, that future taxable profits will be available against which the unused tax losses can be utilised.
Group Company
2014R
2013R
2014R
2013R
11. InventoriesThe amounts attributable to the different categories are as follows:Raw materials, components 15 240 637 9 448 201 – –Finished goods 90 304 434 71 390 569 – –Production supplies 19 945 127 15 280 287 – –
125 490 198 96 119 057 – –Provision for stock obsolescence (12 524 709) (6 629 392) – –
112 965 489 89 489 665 – –
The carrying value of finished products, identified as slow-moving is R12 914 603 (2013: R2 079 028), after allowing for the provision of stock obsolescence.
Group Company
2014R
2013R
2014R
2013R
12. Trade and other receivablesTrade receivables 298 800 558 184 121 354 – Less: Provision for impairment of receivables (13 923 406) (10 156 013) – –
Trade receivables – net 284 877 152 173 965 341 – – Pre-payments 3 636 296 1 378 143 284 533 239 568 Deposits 1 639 048 1 061 491 – – Value-added taxation 2 581 256 5 565 126 – – Loans to related parties 863 627 1 141 717 321 331 272 331 Other receivables 12 369 212 12 676 457 3 928 551 4 186 997
305 966 591 195 788 275 4 534 415 4 698 896
Analysis of trade and other receivables:Trade and other receivables (refer note 9a) 299 749 039 188 845 006 4 249 882 4 459 328 Pre-payments and value-added taxation 6 217 552 6 943 269 284 533 239 568
305 966 591 195 788 275 4 534 415 4 698 896

79Afrimat integrated annual report 2014
12. Trade and other receivables (continued)The fair values of trade and other receivables are considered to be equal to the carrying value.
The carrying values of the trade and other receivables are all denominated in South African Rand.
Included in other receivables are loans to Joe Kalo Investments (Pty) Limited of R3 859 164 (2013: R4 047 018). These loans were made with respect to the group’s BEE shareholding in certain subsidiaries.
The loans to related parties are loans made by the group to the group’s associate, Ikapa Quarries (Pty) Limited. The receivables have no fixed repayment terms and bear interest at prime less 3,5%.
The trade receivables of SA Block (Pty) Limited to the amount of RNil (2013: R28 322 522) serve as security for the FirstRand Bank Limited medium term loan as per note 20.
As at 28 February 2014, the group had trade and other receivables of R54 637 354 (2013: R29 340 192) which were past due but not impaired. These relate to a number of reputable customers for whom there is no history of default, settlement agreements are in place or that management believes will in all probability pay.
Group Company
2014R
2013R
2014R
2013R
The age analysis of these trade and other receivables is as follows:Neither impaired nor past due 230 239 798 144 625 149 – – Not impaired but past due in– between 30 and 60 days 41 940 023 19 541 157 – – – between 60 and 90 days 5 631 286 4 487 986 – – – more than 90 days 7 066 045 5 311 049 – –
54 637 354 29 340 192 – –
284 877 152 173 965 341 – –
An impairment provision of R13 923 406 (2013: R10 156 013) was recognised against receivables. The ageing of the impairment portion of receivables, which is past due, is as follows:Between 30 and 60 days 613 674 97 083 – – Between 60 and 90 days 456 970 598 351 – – More than 90 days 12 852 762 9 460 579 – –
13 923 406 10 156 013 – –
Analysis of movements in the provision for impairment of trade receivables are as follows:Opening balance 10 156 013 11 242 609 – – Additional provision charged to profit and loss 5 465 003 2 785 570 – – Provisions reversed to profit and loss (637 933) (3 164 028) – – Receivables written off during the year as uncollectible (1 059 677) (708 138) – –
Closing balance 13 923 406 10 156 013 – –
The creation and release of provision for impaired receivables have been included in operating expenses in the statement of comprehensive income. Amounts charged to the provision account are generally written off when there is no expectation of recovering additional cash.
The other classes within trade and other receivables do not contain impaired assets.
The maximum exposure to credit risk at the reporting date is the carrying value of each class of receivable mentioned above.

80 Afrimat integrated annual report 2014
Annual fi nancial statements
Notes to the annual fi nancial statements (continued)for the year ended 28 February 2014
Group Company
2014R
2013R
2014R
2013R
13. Cash and cash equivalentsCash and cash equivalents consist of:Cash on hand 313 703 256 460 1 617 1 452Bank balances 64 474 271 37 089 136 3 013 852 97 115Short-term deposits 27 540 225 96 915 965 2 034 055 65 256 402Bank overdraft (51 451 466) (49 118 762) – (21 170 965)
40 876 733 85 142 799 5 049 524 44 184 004
Current assets 92 328 199 134 261 561 5 049 524 65 354 969Current liabilities (51 451 466) (49 118 762) – (21 170 965)
40 876 733 85 142 799 5 049 524 44 184 004
Favourable bank balances to the value of RNil (2013: R7 465 844) in SA Block (Pty) Limited, serve as security for the FirstRand Bank Ltd medium term loan as per note 20.
The fair values of cash and cash equivalents are considered to be equal to the carrying value.
Cessions of the Infrasors bank accounts to the value of R14 008 929 are provided as security to ABSA Bank Limited.
Group Company
2014R
2013R
2014R
2013R
14. Stated capitalAuthorised1 000 000 000 (2013: 1 000 000 000) ordinary shares with no par value – – – –
Issued143 262 412 (2013: 143 262 412) ordinary shares with no par value 347 660 405 1 434 624 342 223 012 1 432 624Share premium transferred upon conversion of shares to no par value shares (refer note 15) – 352 149 773 – 352 149 773Net effect of settlement of employee share options (24 878 366) (10 168 112) (25 556 125) (11 359 385)Treasury shares used for acquisitions – 4 244 120 – –Treasury shares sold to BEE investor, net of taxation 394 055 – – –
Stated capital 323 176 094 347 660 405 316 666 887 342 223 012
The ordinary shares of the company have been converted to no par value shares during the prior year.
Refer to explanation of capital structure included with note 15 on share premium.
The net effect of settlement of employee share options refer to the total shares issued to employees in terms of the Share Appreciation Rights Scheme including the shares ‘surrendered’ by employees in order to raise cash to pay the taxation owing.
All shares issued by the company were fully paid.

81Afrimat integrated annual report 2014
Group Company
2014R
2013R
2014R
2013R
15. Share premium and business combination adjustment Share premiumOpening balance – 352 149 773 – 352 149 773Transferred to stated capital upon conversion of ordinary shares to no par value shares (refer note 14) – (352 149 773) – (352 149 773)
Closing balance – – – –
Business combination adjustment (105 788 129) (105 788 129) – –
The group financial statements are issued in the name of Afrimat Limited but are, in fact, prepared as a continuation of the group financial statements of Prima Klipbrekers (Pty) Limited (‘Prima’). For purposes of these group consolidated results, Prima was identified as the acquirer in terms of IFRS 3. In arriving at the issued share capital of the group under this method, the amount of the issued share capital of Prima immediately before the business combination is added to the cost of the business combination in accordance with IFRS 3. This has resulted in an adjustment against the issued share capital of the group of R105 788 129. This amount is reflected separately on the statement of financial position. The issue and authorised equity structure in note 14 is that of Afrimat Limited.
Group Company
2014R
2013R
2014R
2013R
16. Treasury sharesNil (2013: 101 784) shares held by the Afrimat Share Incentive Trust – (624 890) – –1 048 676 (2013: 102 458) shares held by Afrimat Aggregates (Operations) (Pty) Limited, a subsidiary (10 691 947) (865 609) – –
(10 691 947) (1 490 499) – –
The company acquired Nil (2013: Nil) of its own shares through purchases on the JSE Limited in the Afrimat Share Incentive Trust and 2 808 578 (2013: 1 108 337) in Afrimat Aggregates (Operations) (Pty) Limited. The total amount paid to acquire the shares was R26 659 477 (2013: R6 568 867) and has been deducted from shareholders’ equity. The related weighted average share price at the time of purchase was R9,49 (2013: R5,93). In prior year, 5 932 306 shares were utilised for the acquisition of the Clinker Group valued at R25 805 535. This value excluded the tax effect of treasury shares utilised of R974 121. During the year, 1 774 144 (2013: 1 116 963) shares were utilised in terms of the Share Appreciation Rights Scheme for an amount of R15 521 929 (2013: R5 049 945). The shares are held as ‘treasury shares’. The group has the right to sell these shares at a later date.
On 21 February 2014, 190 000 treasury shares were sold to a BEE investor for a value of R12,74 per share (refer note 8).
Group Company
2014R
2013R
2014R
2013R
Analysis of movement in number of treasury shares:Opening balance 204 242 6 145 174 – –Utilised for part settlement of Clinker Group acquisition – (5 932 306) – –Utilised for settlement of employee Share Appreciation Rights exercised (1 774 144) (1 116 963) – –Sold to BEE investor (190 000) – – –Purchased during the year 2 808 578 1 108 337 – –
Closing balance 1 048 676 204 242 – –

82 Afrimat integrated annual report 2014
Annual fi nancial statements
Notes to the annual fi nancial statements (continued)for the year ended 28 February 2014
17. Share optionsShare options are granted to executive directors and to selected employees in the format of a Share Appreciation Rights Scheme. The exercise price of the granted options is equal to the previous business day’s volume weighted average price for the Afrimat shares, when the option is exercised. Options are conditional on the employee completing three year’s service (the vesting period). The options are exercisable starting three years from the grant date, subject to the group achieving its target growth in headline earnings per share over the period; the options have a contractual option term of four years after vesting. The group has no legal or constructive obligation to repurchase or settle the options in cash. When the options are exercised the participants will receive shares equal in value to the number of options exercised multiplied by the difference between the exercise price and the grant price.
Movements in the number of share options outstanding and their related weighted average exercise prices are as follows:
Average grantprice in cents
per share2014
Number ofoptions
2014
Average grantprice in cents
per share2013
Number ofoptions
2013
Opening balance 401 9 335 000 376 12 470 000 Granted 850 2 160 000 572 2 835 000 Forfeited – – 442 (490 000)Exercised 325 (3 870 000) 200 (3 150 000)Expired – – 740 (2 330 000)
Closing balance 567 7 625 000 401 9 335 000
None of the options outstanding are exercisable at 28 February 2014 (2013: Nil). During the year, 3 870 000 (2013: 3 150 000) options were exercised. These options were issued at a weighted average price of R3,25 (2013: R2,00) each. The related average share price at the time of exercise was R9,24 (2013: R6,35) per share.
Share options outstanding at the end of the year have the following expiry date and grant prices:
Number of options
Grant pricecents 2014 2013
2017 325 – 3 870 000 2018 340 2 750 000 2 750 000 2019 572 2 715 000 2 715 000 2020 850 2 160 000 –
7 625 000 9 335 000
The remaining number of shares that may be utilised for the purpose of share options are:
Number of shares
2014 2013
Opening balance 20 222 425 23 480 000Exercised 3 870 000 3 150 000Expired – 2 330 000Utilised (2 818 234) (9 227 575)Forfeited – 490 000
Closing balance 21 274 191 20 222 425

83Afrimat integrated annual report 2014
17. Share options (continued)Number of share options held by directors:
Opening balance Granted
Averagegrant price
in cents per share
Expirydates
Exercised/expired
Closingbalance
2014 Andries van Heerden 1 785 000 330 000 850 2020 (750 000) 1 365 000Hendrik Verreynne 995 000 200 000 850 2020 (500 000) 695 000Gert Coffee 750 000 150 000 850 2020 (300 000) 600 000
3 530 000 680 000 – – (1 550 000) 2 660 000
2013 Andries van Heerden 2 300 000 435 000 572 2019 (950 000) 1 785 000 Hendrik Verreynne 1 410 000 245 000 572 2019 (660 000) 995 000 Peter Corbin (deceased) 570 000 – – – (570 000) – Gert Coffee 550 000 200 000 572 2019 – 750 000
4 830 000 880 000 – – (2 180 000) 3 530 000
None of the outstanding options (2013: Nil) were exercisable at 28 February 2014.
The fair value of options granted during the year; using the Black Scholes valuation model, was R3 672 000 (2013: R4 167 450), and will be expensed over a three-year vesting period. The option expense for the year, in respect of current year and previous years’ options granted, was R3 527 901 (2013: R3 354 207).
Analysis of movement in remaining options:
Grant date11 May
20119 May 2012
8 May 2013 Total
Originally granted 3 100 000 2 835 000 2 160 000 8 095 000 Forfeited (350 000) (120 000) – (470 000)
Net outstanding 2 750 000 2 715 000 2 160 000 7 625 000
Grant price (cents) 340 572 850 –Fair value of option (cents) 117 147 170 –
The assumptions used in determining the fair value were as follows:
Grant date11 May
20119 May 2012
8 May 2013
Grant price (cents) 340 572 850 Expected option life 3 years 3 years 3 yearsExpected volatility 53,30 62,60 76,90 Expected likelihood 100,00% 100,00% 100,00%Expected employee attrition 5,00% 5,00% 5,00%Expected risk free rates 7,55% 6,44% 5,07%Expected dividend yields 5,00% 3,32% 3,29%
The share price volatility is measured at the standard deviation of expected share price returns based on the statistical analysis of monthly share prices over the current year.

84 Afrimat integrated annual report 2014
Annual fi nancial statements
Notes to the annual fi nancial statements (continued)for the year ended 28 February 2014
Available-for-sale reserve
R
Share-based payment
reserveR
Total other reserves
R
18. Other reservesGroupBalance at 1 March 2012 108 964 5 385 838 5 494 802 Share option expense for the year – 3 354 207 3 354 207Settlement of employee share options – (1 975 050) (1 975 050)Fair value adjustment 55 304 – 55 304
Total changes 55 304 1 379 157 1 434 461
Balance at 1 March 2013 164 268 6 764 995 6 929 263
Share option expense for the year – 3 527 901 3 527 901Settlement of employee share options – (4 117 682) (4 117 682)Fair value adjustment 222 767 – 222 767
Total changes 222 767 (589 781) (367 014)
Balance at 28 February 2014 387 035 6 175 214 6 562 249
CompanyBalance at 1 March 2012 – 2 879 072 2 879 072 Share option expense for the year – 2 166 280 2 166 280Settlement of employee share options – (853 023) (853 023)
Total changes – 1 313 257 1 313 257
Balance at 1 March 2013 – 4 192 329 4 192 329
Share option expense for the year – 2 098 606 2 098 606Settlement of employee share options – (2 471 663) (2 471 663)
Total changes – (373 057) (373 057)
Balance at 28 February 2014 – 3 819 272 3 819 272
Nature and purpose of reserves
(a) Available-for-sale reserve
This reserve records the changes in fair value of available-for-sale financial assets.
(b) Share-based payment reserve This reserve records the fair value of the vested portion of share options (determined at grant date) granted in terms of the group’s
share-based payment schemes. Refer to note 17 for further details on the relevant schemes.

85Afrimat integrated annual report 2014
Infrasors Holdings Limited
R
Other individually immaterial
subsidiaries R
Total non-controlling
interest R
19. Non-controlling interestsEffective non-controlling interest percentage 9,5% – –
Non-current assets 161 234 859 8 062 468 – Current assets 66 778 992 36 793 195 – Non-current liabilities (81 266 716) (1 956 670) – Current liabilities (61 884 790) (19 018 917) –
Net assets 84 862 345 23 880 076 –
Non-controlling interest within Infrasors 1 858 827 – 1 858 827
Carrying amount of non-controlling interest 7 890 507 4 446 829 12 337 336
Total non-controlling interest 9 749 334 4 446 829 14 196 163
Revenue 320 920 295 358 533 197 – Profit after taxation included in results 17 726 634 8 308 819 –
Reported by subsidiaries 4 907 046 8 308 819 – Reversal of depreciation and impairments by Afrimat on consolidated pre-acquisition adjustments 12 819 588 – –
Other comprehensive income – – –
Total comprehensive income 17 726 634 8 308 819 –
Profit after taxation, allocated to non-controlling interest 7 387 922 1 068 846 8 456 768 Other comprehensive income, allocated to non-controlling interest – – –
Cash flows from operating activities 14 764 439 (16 266 655) – Cash flows from investment activities (5 556 918) (104 038) – Cash flows from financial activities (13 035 134) 21 119 836 –
Net increase/(decrease) in cash and cash equivalents (3 827 613) 4 749 143 –
The company acquired 50,7% of Infrasors’ gross shares in issue, effective 1 March 2013. A further 28,9% was acquired during the year, resulting in a total shareholding of 79,6%. Treasury shares account for 12,0% while the minorities account for the remaining 8,4% of Infrasors’s gross shares in issue.
The effective percentage shareholding (excluding treasury shares) held by non-controlling interest at the end of the year amounted to 9,5%.
Group Company
2014R
2013R
2014R
2013R
20. BorrowingsNon-current liabilitiesMedium-term loans 56 866 232 25 308 132 8 442 566 25 308 132 Instalment purchase agreements 37 739 652 33 370 516 – –
94 605 884 58 678 648 8 442 566 25 308 132
Current liabilitiesMedium-term loans 27 132 654 17 296 671 16 874 569 16 872 090 Instalment purchase agreements 49 299 005 44 708 986 – –
76 431 659 62 005 657 16 874 569 16 872 090

86 Afrimat integrated annual report 2014
Annual fi nancial statements
Notes to the annual fi nancial statements (continued)for the year ended 28 February 2014
Group Company
2014R
2013R
2014R
2013R
20. Borrowings (continued)Medium-term loansAnalysis of movements in the Standard Bank of South Africa Limited medium-term loan were as follows:Opening balance 42 180 222 – 42 180 222 – Borrowings raised – 52 570 616 – 52 570 616 Repayments (16 863 087) (10 390 394) (16 863 087) (10 390 394)
Closing balance 25 317 135 42 180 222 25 317 135 42 180 222
Analysis of movements in the ABSA Bank Limited medium-term loan were as follows:Opening balance – – – – Borrowings raised – – – – Acquired through acquisitions (refer note 31) 64 966 536 – – – Repayments (7 683 756) – – –
Closing balance 57 282 780 – – –
Analysis of movements in the FirstRand Bank Limited medium-term loan were as follows:Opening balance 424 581 – – – Borrowings raised – – – – Acquired through acquisitions (refer note 31) – 424 581 – – Repayments (424 581) – – –
Closing balance – 424 581 – –
Analysis of movements in the Spec Sand CC medium-term loan were as follows:Opening balance – – – – Borrowings raised – – – – Acquired through acquisitions (refer note 31) 2 863 057 – – – Repayments (1 464 086) – – –
Closing balance 1 398 971 – – –
Analysis of movements in the Industrial Development Corporation of South Africa Limited medium-term loan were as follows:Opening balance – – – – Borrowings raised – – – – Acquired through acquisitions (refer note 31) 13 283 977 – – – Repayments (13 283 977) – – –
Closing balance – – – –
Total medium-term loans 83 998 886 42 604 803 25 317 135 42 180 222
Instalment purchase agreementsAnalysis of movements in instalment purchase agreements were as follows:Opening balance 78 079 502 81 589 470 – –Borrowings raised 51 996 977 42 283 584 – –Acquired through acquisitions (refer note 31) 19 601 087 6 713 991 – –Repayments (62 638 909) (52 507 543) – –
Closing balance 87 038 657 78 079 502 – –

87Afrimat integrated annual report 2014
Group Company
2014R
2013R
2014R
2013R
20. Borrowings (continued)Minimum payments due on instalment purchase agreements are as follows:– within one year 53 109 778 47 548 413 – –– in second to fifth year inclusive 40 151 683 36 069 563 – –
93 261 461 83 617 976 – –Less: future finance charges (6 222 804) (5 538 474) – –
Present value of minimum payments 87 038 657 78 079 502 – –
Analysis of present value of minimum payments due:– within one year 49 299 005 44 708 986 – –– in second to fifth year inclusive 37 739 652 33 370 516 – –
Total instalment purchase agreements 87 038 657 78 079 502 – –
Non-current liabilitiesAt amortised cost 94 605 884 58 678 648 8 442 566 25 308 132
Current liabilitiesAt amortised cost 76 431 659 62 005 657 16 874 569 16 872 090
171 037 543 120 684 305 25 317 135 42 180 222
During the prior year, the company negotiated an additional working capital finance facility of R50 000 000 with Standard Bank of South Africa Limited, through a medium-term loan. The purpose of this loan is to facilitate an increase in working capital. The loan is secured by a cession of trade receivables, bears interest at 3-month Jibar rate less 2,5% and is payable in varying quarterly instalments, starting at R5 331 016 on 28 September 2012, over a period of three years. The capital portion of the repayment being R4 166 667. The company may not cancel or prepay any portion of the medium-term loan before 30 September 2013. Thereafter, the company may, if it gives Standard Bank of South Africa Limited prior notice, cancel the whole or any part (being a minimum amount of R10 000 000) of the available facility.
A FirstRand Bank Limited, medium-term loan, secured by a cession of trade receivables and favourable bank balances of SA Block (Pty) Limited (refer note 12 and note 13 respectively), bearing interest at prime, and payable in monthly instalments of R214 335 over a period of two years, has been repaid during the current year.
Infrasors Holdings Limited renegotiated a working capital finance facility of R64 861 708 with ABSA Bank Limited during 2012. The facility was arranged to fund capital expenditure and working capital requirements to support growth and expansion of the Infrasors Group’s mining and operating activities. The loan is secured by a cession of property held in Delf Sand (Pty) Limited and Lyttelton Dolomite (Pty) Limited (refer note 2) as well as a cession of the Infrasors Group bank accounts (refer note 13), bears interest at an effective interest rate of prime plus 1,3% (2013: 1,1%) and is payable in varying bi-annual instalments, over a period of five years. The terms of the bond are fixed. The total instalments paid were R14 237 537 (2013: R14 248 740). Further to the abovementioned, ABSA Bank Limited has agreed to continue with the current Infrasors funding arrangements for a further 36-month period from 1 March 2014.
As a result of Infrasors’ reduced profitability during the prior year, covenants as stipulated by the existing funding agreement with ABSA were breached. ABSA agreed to continue with the current funding arrangements for both the borrowings of R57 282 780 and the overdraft facilities utilised to the amount of R8 053 583 at year-end. The classification of long-term and short-term borrowings is performed on the basis that the current terms of funding from ABSA will remain unchanged as stated above.
The loan agreement entered into with Spec Sand CC by one of the Infrasors subsidiaries is unsecured, bear interest at prime plus 2,0% and is payable over five years.
It is the group policy to purchase certain property, plant and equipment under instalment purchase agreements. The instalment purchase agreements are repayable in monthly instalments of R5 174 875 (2013: R4 574 333) including interest and capital.
Interest rates are linked to prime overdraft rate and varied between 7,0% and 10,5% (2013: 6,5% and 9,0%) during the year. There were no breaches in payments during the year. The instalment purchase agreements are secured over various items of property, plant and equipment as indicated in note 2.
Afrimat Aggregates (Operations) (Pty) Limited, a subsidiary, also provided a cession of R15 000 000 on its short-term insurance policy in favour of Standard Bank of South Africa Limited for borrowing facilities held.

88 Afrimat integrated annual report 2014
Annual fi nancial statements
Notes to the annual fi nancial statements (continued)for the year ended 28 February 2014
20. Borrowings (continued)The exposure of the group’s borrowings to interest rate changes and the contractual repricing dates at the reporting dates are as follows:
Group Company
2014R
2013R
2014R
2013R
At floating rates 171 037 543 120 684 305 25 317 135 42 180 222
The fair value of borrowings equals their carrying amount.
The carrying amounts of the group’s borrowings are all denominated in South African Rand.
The group has the following undrawn borrowing facilities with FirstRand Bank Limited, Standard Bank of South Africa Limited and ABSA Bank Limited:
Floating rate:– Expiring within one year 133 022 739 69 231 784 19 258 800 –
The Memorandum of Incorporation of Afrimat Limited and its subsidiary companies provide no limitation on the borrowing powers of the directors, accordingly the borrowings set out above comply with the Memorandum of Incorporation of the respective companies.
Group
Environmental rehabilitation
RDismantling
R
Total provisions
R
21. ProvisionsBalance at 1 March 2012 20 610 430 10 649 669 31 260 099 Discount unwinding 1 442 723 – 1 442 723Additions 557 240 464 636 1 021 876
Total changes 1 999 963 464 636 2 464 599
Balance at 1 March 2013 22 610 393 11 114 305 33 724 698
Acquired through business combinations (refer note 31) 19 650 641 7 096 562 26 747 203Discount unwinding 1 575 728 – 1 575 728Additions 1 552 502 952 952 2 505 454Reversed during year (4 673 790) (4 019 058) (8 692 848)
Total changes 18 105 081 4 030 456 22 135 537
Balance at 28 February 2014 40 715 474 15 144 761 55 860 235
Group policy is that environmental rehabilitation and dismantling estimates will be reviewed annually. All environmental rehabilitation and dismantling provisions at year-end have been reviewed by management and adjusted as appropriate for changes in legislation, technology and other circumstances. The expected timing of any outflows of these provisions will be on the closure of the respective mines. Estimates are based on costs that are reviewed regularly and adjusted as appropriate for new circumstances. Future cash flows are appropriately discounted. A discount rate of 7,0% (2013: 7,0%) was used.
The decommissioning and rehabilitation provisions are secured by guarantees issued to the Department of Mineral and Resources to the amount of R87 031 136 (2013: R41 628 845) (refer note 33). Funds to the amount of R17 583 654 have been invested in environmental insurance policies and R205 909 (2013: R12 301 382) in a Liberty Life New Growth Rehabilitation Plan Trust (refer note 8).

89Afrimat integrated annual report 2014
Group Company
2014R
2013R
2014R
2013R
22. Trade and other payablesTrade payables 174 394 255 77 612 974 821 188 69 193Amounts due to non-controlling shareholders 546 218 933 287 – –Taxes and other statutory liabilities 13 073 102 8 404 160 470 920 633 039Accrued expenses 59 941 066 49 916 774 9 075 153 6 216 218Other payables 17 788 108 15 117 281 752 849 73 959
265 742 749 151 984 476 11 120 110 6 992 409
Trade and other payables consist of purchases from suppliers at normal trade terms. Interest is paid on overdue accounts at an interest rate linked to the prime bank rate.
The fair values of trade and other payables, are considered to be equal to the carrying value due to their short-term nature.
The carrying values of trade and other payables, are all denominated in South African Rand.
The amounts due to non-controlling shareholders of a subsidiary, relate to those of Labonte 3 (Pty) Limited. The payables have no fixed repayment terms and bear interest at prime (2013: prime).
Group Company
2014R
2013R
2014R
2013R
23. RevenueSale of goods and services 1 893 129 271 1 332 274 610 64 739 418 44 703 244Interest received (trading) 8 057 951 5 309 956 – –
1 901 187 222 1 337 584 566 64 739 418 44 703 244
24. Other net gains/(losses) – netProfit on disposal of available-for-sale financial assets 1 426 075 96 868 – –
1 426 075 96 868 – –
25. Operating profitOperating profit for the year is stated after accounting for the following:Income from subsidiariesAdministration and management fees – – 64 739 418 44 703 244
Operating lease charges 60 861 363 58 390 252 956 590 871 838
Premises – Contractual amounts 5 406 286 6 404 731 895 398 836 271Equipment – Contractual amounts 52 335 508 48 795 637 61 192 35 567Lease rentals on operating lease – other – Contractual amounts 3 119 569 3 189 884 – –
Amortisation of intangible assets 2 981 408 2 437 457 – –Depreciation of property, plant and equipment 93 920 432 55 449 750 1 568 441 1 432 927Profit on disposal of available-for-sale financial assets (1 426 075) (96 868) – –Loss/(profit) on disposal of property, plant and equipment 2 685 817 3 009 064 – –Impairment of goodwill – 4 745 527 – –Increase in inventory provision for impairment 5 895 317 527 513 – –Audit fees – current year 4 370 221 2 294 183 897 261 718 492Employee costs 384 985 694 284 659 163 43 478 649 31 085 098
Defined contribution plan contributions 19 935 344 13 950 474 2 099 303 1 578 408 Share-based payment expense 3 527 901 3 354 207 2 098 606 2 166 280 Short-term employee expenses 361 522 449 267 354 482 39 280 740 27 340 410
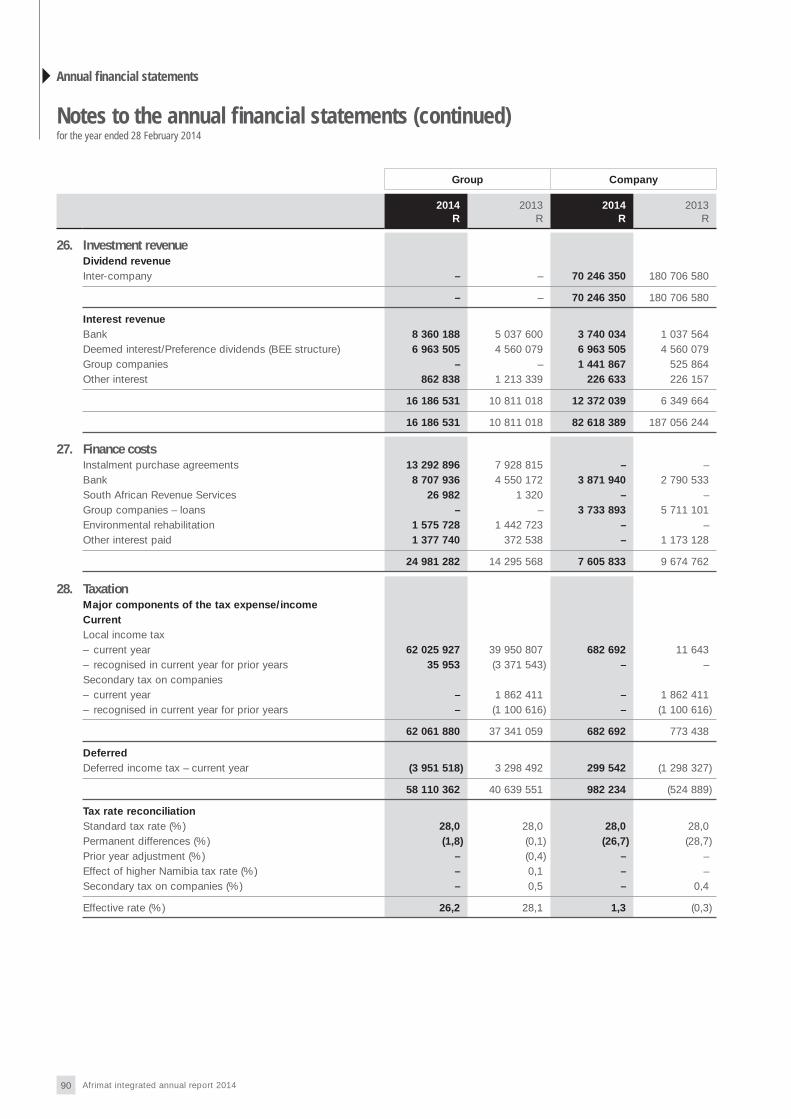
90 Afrimat integrated annual report 2014
Annual fi nancial statements
Notes to the annual fi nancial statements (continued)for the year ended 28 February 2014
Group Company
2014R
2013R
2014R
2013R
26. Investment revenueDividend revenueInter-company – – 70 246 350 180 706 580
– – 70 246 350 180 706 580
Interest revenueBank 8 360 188 5 037 600 3 740 034 1 037 564Deemed interest/Preference dividends (BEE structure) 6 963 505 4 560 079 6 963 505 4 560 079Group companies – – 1 441 867 525 864Other interest 862 838 1 213 339 226 633 226 157
16 186 531 10 811 018 12 372 039 6 349 664
16 186 531 10 811 018 82 618 389 187 056 244
27. Finance costsInstalment purchase agreements 13 292 896 7 928 815 – –Bank 8 707 936 4 550 172 3 871 940 2 790 533South African Revenue Services 26 982 1 320 – –Group companies – loans – – 3 733 893 5 711 101Environmental rehabilitation 1 575 728 1 442 723 – –Other interest paid 1 377 740 372 538 – 1 173 128
24 981 282 14 295 568 7 605 833 9 674 762
28. TaxationMajor components of the tax expense/incomeCurrentLocal income tax– current year 62 025 927 39 950 807 682 692 11 643– recognised in current year for prior years 35 953 (3 371 543) – –Secondary tax on companies– current year – 1 862 411 – 1 862 411– recognised in current year for prior years – (1 100 616) – (1 100 616)
62 061 880 37 341 059 682 692 773 438
DeferredDeferred income tax – current year (3 951 518) 3 298 492 299 542 (1 298 327)
58 110 362 40 639 551 982 234 (524 889)
Tax rate reconciliationStandard tax rate (%) 28,0 28,0 28,0 28,0 Permanent differences (%) (1,8) (0,1) (26,7) (28,7)Prior year adjustment (%) – (0,4) – –Effect of higher Namibia tax rate (%) – 0,1 – –Secondary tax on companies (%) – 0,5 – 0,4
Effective rate (%) 26,2 28,1 1,3 (0,3)

91Afrimat integrated annual report 2014
Group Company
2014R
2013R
2014R
2013R
29. Notes to the cash flow statements29.1 Cash generated from/(used in) operations
Profit/(loss) before taxation 221 075 757 144 416 781 77 698 542 175 120 374Adjustments for:Depreciation and amortisation 96 901 840 57 887 207 1 568 441 1 432 927Share of profit of associate (173 105) (67 744) – –Impairment of goodwill – 4 745 527 – –Loss on sale of property, plant and equipment 2 685 817 3 009 064 – –Profit on disposal of available-for-sale financial assets (1 426 075) (96 868) – –Dividend revenue – – (70 246 350) (180 706 580)Interest revenue (16 186 531) (10 811 018) (12 372 039) (6 349 664)Finance costs 24 981 282 14 295 568 7 605 833 9 674 762Net effect of settlement of employee share options (9 356 437) (5 118 167) (25 556 125) (11 359 383)Tax effect on treasury shares used for acquisitions – (974 121) – –Movements in provisions (6 187 394) 921 876 – –Share-based payment reserve 3 527 901 3 354 207 2 098 606 2 166 280Changes in working capital (excluding the effects of acquisition on consolidation):Inventories (6 617 054) (5 651 803) – –Trade and other receivables (71 585 528) (7 352 347) 164 481 291 582Trade and other payables 73 065 093 17 862 464 4 127 703 593 660
310 705 566 216 420 626 (14 910 908) (9 136 042)
29.2 Interest revenueInterest revenue (refer note 26) 16 186 531 10 811 018 12 372 039 6 349 664Adjustments for:Deemed interest not yet received 1 731 922 129 198 1 731 922 129 198
17 918 453 10 940 216 14 103 961 6 478 862
29.3 Finance costsAmount as per statement of comprehensive income (refer note 27) 24 981 282 14 295 568 7 605 833 9 674 762Adjustments for:Rehabilitation discount unwinding (1 575 728) (1 442 723) – –
23 405 554 12 852 845 7 605 833 9 674 762
29.4 Tax (paid)/refundedOpening balance as per statement of financial position 1 931 053 (6 935 428) – 532 556Current tax for the year recognised in statement of comprehensive income (refer note 28) (62 061 880) (37 341 059) (682 692) (773 438)Adjustment in respect of businesses acquired during the year (refer note 31) (733 677) 1 428 466 – –Current tax recognised on treasury shares sold to BEE investor, recognised in equity (90 446) – – –Closing balance in statement of financial position (452 793) (1 931 053) 694 335 –
(61 407 743) (44 779 074) 11 643 (240 882)
29.5 Proceeds on sale of property, plant and equipmentNet book amount (refer note 2) 19 579 902 10 354 601 191 390 –Loss on sale of property, plant and equipment (2 685 817) (3 009 064) – –
16 894 085 7 345 537 191 390 –

92 Afrimat integrated annual report 2014
Annual fi nancial statements
Notes to the annual fi nancial statements (continued)for the year ended 28 February 2014
Group Company
2014R
2013R
2014R
2013R
30. Dividends paidCurrent year interim dividend paid 15 758 865 11 460 993 15 758 865 11 460 993Previous year final dividend paid 28 652 483 18 624 113 28 652 483 18 624 113Dividends received on treasury shares (316 250) (120 702) – –Dividends paid by subsidiaries to non-controlling shareholders 552 650 388 100 – –
44 647 748 30 352 504 44 411 348 30 085 106
The company has made the following cash distributions to shareholders:Interim dividend paid – – 11,0 8,0Final dividend declared – – 28,0 20,0
Distributions paid (cents) – – 39,0 28,0
31. Acquisitions of businessesInfrasors Holdings LimitedThe company acquired 94 171 108 Infrasors shares, representing 50,7% of Infrasors’ gross shares in issue, from Hanchurch Asset Managers and certain retiring management of Infrasors, with effect from 1 March 2013 for a cash consideration of R33 103 003 (35 cents per share).
As a result of Afrimat’s holding in Infrasors surpassing 35% of the issued ordinary share capital of Infrasors, Afrimat is required, in terms of section 123 of the Companies Act, No. 71 of 2008, as amended, to extend a mandatory offer to the remaining Infrasors ordinary shareholders. As announced on SENS on 4 March 2013 and 7 June 2013, unconditional mandatory offers were made to the minority shareholders of Infrasors for Afrimat to purchase Infrasors shares held by them at 35 cents and 65 cents per ordinary share, respectively. As a result of the abovementioned mandatory offers, the company acquired a further 8 219 715 Infrasors ordinary shares.
Afrimat also acquired 9 928 927 ordinary shares on the open market, at prices ranging from 35 cents to 100 cents per ordinary share.
Afrimat made an offer on 16 January 2014 to RE: CM Calibre to acquire 35 445 839 ordinary shares at 100 cents per ordinary share and the transaction was concluded on 20 January 2014.
The 24 325 348 Infrasors ordinary shares held by the Infrasors Empowerment Trust (‘Trust’) were provided as security to the loan agreements between Infrasors and Hanchurch in order to facilitate a B-BBEE transaction. Hanchurch subordinated its loan in favour of Infrasors following a large drop in the market value of the Infrasors ordinary shares held by the Trust. Given the extent of exposure relative to the value of the underlying securities, and the inability to obtain restitution through any other means, Infrasors has decided as a last resort to exercise its rights according to the loan agreement and the subordination agreement. On 7 October 2013 Hanchurch agreed to cancel the loan to the borrower and agreed that Infrasors may re-posses and cancel the portion of shares held in pledge by Hanchurch, (refer to Infrasors SENS announcement dated 18 March 2014). These ordinary shares are held by Infrasors as treasury shares.
In total Afrimat now holds 79,6%, treasury shares account for 12,0% while the minorities account for the remaining 8,4% of the total issued Infrasors ordinary shares.

93Afrimat integrated annual report 2014
31. Acquisitions of businesses (continued)Amounts included in the group results are as follows:
Infrasors – Initial
acquisition
Infrasors– Additional
shares acquired
Infrasors– Total
Carrying amount/fair value of net assetsProperty, plant and equipment (150 866 295) – (150 866 295)Investment property (refer note 3) (3 040 000) – (3 040 000)Intangible assets (refer note 4) (2 690 170) – (2 690 170)Deferred tax (assets)/liabilities (refer note 10) 12 909 083 – 12 909 083Other financial assets (refer note 8) (21 653 163) – (21 653 163)Inventories (16 858 766) – (16 858 766)Trade and other receivables (38 592 788) – (38 592 788)Trade and other payables 40 692 984 – 40 692 984Tax (assets)/liabilities 733 677 – 733 677Borrowings (refer note 20) 100 714 657 – 100 714 657Provisions (refer note 21) 26 747 203 – 26 747 203Cash (11 155 621) – (11 155 621)
Fair value of assets acquired (63 059 199) – (63 059 199)Non-controlling interest within Infrasors 1 364 480 – 1 364 480Additional non-controlling interest acquired 30 378 478 (22 008 648) 8 369 830Premium paid on additional shares acquired in subsidiary after initial acquisition – (25 986 442) (25 986 442)
Net assets (31 316 241) (47 995 090) (79 311 331)
Goodwill (refer note 5) (1 786 764) – (1 786 764)
Purchase consideration settled in cash (33 103 005) (47 995 090) (81 098 095)
Net cash outflow on acquisitionPurchase consideration settled in cash (33 103 005) (47 995 090) (81 098 095)Cash acquired 11 155 621 – 11 155 621
(21 947 384) (47 995 090) (69 942 474)
Revenue included in results – – 320 920 295
Profit after taxation included in results– Reported by Infrasors – – 4 907 046– Reversal of depreciation and impairments by Afrimat on
consolidated pre-acquisition adjustments – – 12 819 588
– – 17 726 634
Gross trade and other receivables before provision for impairment (at acquisition) 39 207 888
Acquisition costs included in Afrimat’s operating expenses 922 662
The fair value of trade and other receivables is R38 592 788 and includes trade receivables of R34 172 142. An amount of R31 634 897 is reflected as neither impaired nor past due.
The property, plant and equipment was revalued as at 1 March 2013 based on the replacement value or market value of current assets.
Non-controlling interest was measured using the proportionate share of the acquired entity’s net identifiable assets. At acquisition, non-controlling interest was identified as the remaining 49,3% in Infrasors as well as the non-controlling interest of Infrasors in Delf Silica Coastal (Pty) Limited of 33,3%.
Goodwill recorded with the above Infrasors Group acquisition is primarily attributable to the profit generating ability of this business.
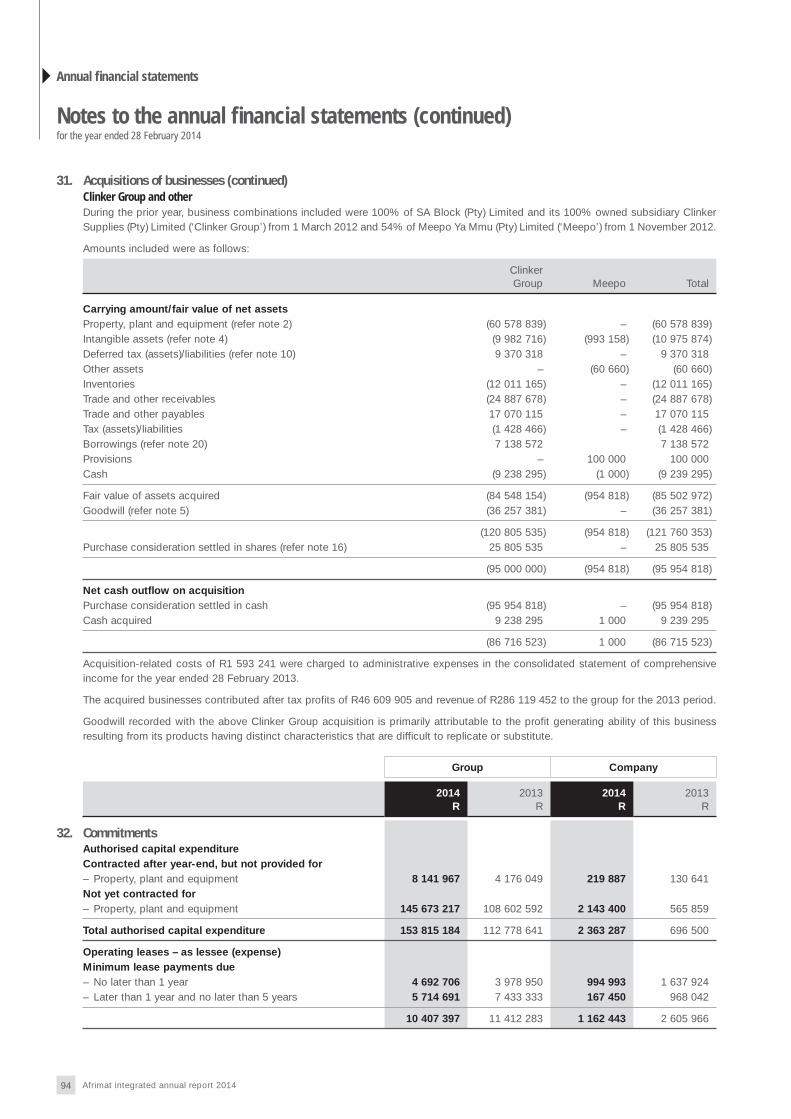
94 Afrimat integrated annual report 2014
Annual fi nancial statements
Notes to the annual fi nancial statements (continued)for the year ended 28 February 2014
31. Acquisitions of businesses (continued)Clinker Group and otherDuring the prior year, business combinations included were 100% of SA Block (Pty) Limited and its 100% owned subsidiary Clinker Supplies (Pty) Limited (‘Clinker Group’) from 1 March 2012 and 54% of Meepo Ya Mmu (Pty) Limited (‘Meepo’) from 1 November 2012.
Amounts included were as follows:
Clinker Group Meepo Total
Carrying amount/fair value of net assetsProperty, plant and equipment (refer note 2) (60 578 839) – (60 578 839)Intangible assets (refer note 4) (9 982 716) (993 158) (10 975 874)Deferred tax (assets)/liabilities (refer note 10) 9 370 318 – 9 370 318Other assets – (60 660) (60 660)Inventories (12 011 165) – (12 011 165)Trade and other receivables (24 887 678) – (24 887 678)Trade and other payables 17 070 115 – 17 070 115Tax (assets)/liabilities (1 428 466) – (1 428 466)Borrowings (refer note 20) 7 138 572 7 138 572Provisions – 100 000 100 000Cash (9 238 295) (1 000) (9 239 295)
Fair value of assets acquired (84 548 154) (954 818) (85 502 972)Goodwill (refer note 5) (36 257 381) – (36 257 381)
(120 805 535) (954 818) (121 760 353)Purchase consideration settled in shares (refer note 16) 25 805 535 – 25 805 535
(95 000 000) (954 818) (95 954 818)
Net cash outflow on acquisitionPurchase consideration settled in cash (95 954 818) – (95 954 818)Cash acquired 9 238 295 1 000 9 239 295
(86 716 523) 1 000 (86 715 523)
Acquisition-related costs of R1 593 241 were charged to administrative expenses in the consolidated statement of comprehensive income for the year ended 28 February 2013.
The acquired businesses contributed after tax profits of R46 609 905 and revenue of R286 119 452 to the group for the 2013 period.
Goodwill recorded with the above Clinker Group acquisition is primarily attributable to the profit generating ability of this business resulting from its products having distinct characteristics that are difficult to replicate or substitute.
Group Company
2014R
2013R
2014R
2013R
32. CommitmentsAuthorised capital expenditureContracted after year-end, but not provided for– Property, plant and equipment 8 141 967 4 176 049 219 887 130 641Not yet contracted for– Property, plant and equipment 145 673 217 108 602 592 2 143 400 565 859
Total authorised capital expenditure 153 815 184 112 778 641 2 363 287 696 500
Operating leases – as lessee (expense)Minimum lease payments due– No later than 1 year 4 692 706 3 978 950 994 993 1 637 924– Later than 1 year and no later than 5 years 5 714 691 7 433 333 167 450 968 042
10 407 397 11 412 283 1 162 443 2 605 966

95Afrimat integrated annual report 2014
32. Commitments (continued)Operating lease payments represent rentals payable by the group for quarries, other premises, motor vehicles and equipment. Certain leases carry standard escalation clauses in line with inflation. The lease terms are between 1 and 5 years, and the majority of lease agreements are renewable at the end of the lease period at market rate. All rental agreements exceeding 5 years have a notice period of 6 months and therefore not disclosed above. The lease expenditure charged to profit and loss during the year is disclosed in note 25.
Authorised capital expenditure to be funded from surplus cash and bank financing.
Group Company
2014R
2013R
2014R
2013R
Notarial bond commitments– No later than 1 year 14 122 353 – – –– Later than 1 year and no later than 5 years 55 509 565 – – –
Total notarial bond commitments 69 631 918 – – –
The notarial bond commitments relate to loans acquired by Infrasors Holdings Limited (refer note 20).
33. ContingenciesGuaranteesGuarantees to the value of R68 221 076 (2013: R50 683 922) were supplied by Standard Bank of South Africa Limited to various parties, including the Department of Mineral Resources and Eskom.
Guarantees to the value of R10 028 725 (2013: R6 141 927) were supplied by FirstRand Bank Limited to various parties, including the Department of Mineral Resources and Eskom.
Guarantees to the value of R25 162 897 by Lombards Insurance Group, R594 941 by ABSA Bank Limited and R2 703 000 by SIG Guarantee Acceptances (Pty) Limited to various parties, including the Department of Mineral Resources, Eskom, Chevron South Africa (Pty) Limited, were acquired as part of the Infrasors acquisition.
These guarantees are in respect of environmental rehabilitation and will only be payable in the event of default by the group.
On 25 June 2013 SARS issued an adjusted income tax assessment claiming R9 652 413 additional tax, R7 239 308 penalties and R2 432 117 interest, relating to the activities of a subsidiary of Infrasors for the tax years 2010, 2011 and 2012 based on the premise that the company is not a mining entity. The company has submitted an objection to SARS and is of the opinion that the activities are of a mining nature.
34. Related partiesSubsidiaries, associates and related trustsDuring the year under review, the company and its subsidiaries, in the ordinary course of business, entered into various sale and purchase transactions with related parties. Those transactions occurred under terms that are no less favourable than those arranged with third parties. For a list of the group’s subsidiaries, associates and related trusts, refer note 6.
Company
2014 2013
Loan balances owing (to)/by Subsidiaries (104 038 300) (51 738 914)Sales of goods to – gross values Subsidiaries 64 739 418 44 703 244 Dividends received Subsidiaries 70 246 350 180 706 580Interest paid to Subsidiaries (3 733 893) (5 711 101)Interest received from Subsidiaries 1 441 867 525 864
The company has provided an unlimited omnibus securityship to Standard Bank of South Africa Limited in respect of funding provided by the bank to its subsidiaries.

96 Afrimat integrated annual report 2014
Annual fi nancial statements
Notes to the annual fi nancial statements (continued)for the year ended 28 February 2014
34. Related parties (continued)DirectorsRemunerationDetails relating to executive and non-executive directors’ remuneration are disclosed in note 36.
Share options Share options have been granted to certain executive directors of Afrimat Limited and employees of its subsidiaries. These are more fully disclosed in note 17.
ShareholdingRefer to the analysis of shareholders on page 106 for a list of shareholders with a beneficial interest of 5,0% or more in the company.
AssociateDetails regarding the group’s associate are set out in notes 7 and 12. Transactions with the associate is entered into at the prevailing market rates.
Treasury sharesThe company acquired Nil (2013: Nil) of its own shares through purchases on the JSE Limited in The Afrimat Share Incentive Trust and 2 808 578 (2013: 1 108 337) in Afrimat Aggregates (Operations) (Pty) Limited. Refer note 16 for further disclosure.
Other related partiesRetirement fundsThe group provides retirement benefits for its permanent employees through various defined-contribution plans. The funds are registered under and governed by the Pension Funds Act, 1956, as amended. The latest valuation received from the fund administrators confirmed that the funds were in a sound financial position.
Group
2014 2013
35. Earnings per shareNumber of shares in issueTotal shares in issue 143 262 412 143 262 412Treasury shares (1 048 676) (204 242)
Net shares in issue 142 213 736 143 058 170
Net shares in issueMarch 143 223 396 141 797 976April 142 647 321 142 391 207May 143 186 264 142 333 152June 143 242 120 142 846 028July 143 237 620 143 031 625August 142 237 620 143 158 172September 142 237 620 143 158 172October 142 237 620 143 158 172November 142 328 186 143 158 172December 142 328 186 143 158 172January 142 323 736 143 158 172February 142 213 736 143 058 170
Weighted average number of net shares in issue 142 620 285 142 867 266
Adjusted for effect of future share-based compensation payments 3 702 749 3 880 639
Diluted weighted average number of shares 146 323 034 146 747 905
Profit attributable to ordinary shareholders 154 508 627 103 035 685Earnings per ordinary share (cents) 108,3 72,1Diluted earnings per ordinary share (cents) 105,6 70,2

97Afrimat integrated annual report 2014
Gross
2014Net of tax
2014Gross2013
Net of tax2013
35. Earnings per share (continued)Reconciliation of headline earningsProfit attributable to ordinary shareholders 154 508 627 103 035 685 Loss/(profit) on disposal of property, plant and equipment 2 685 817 1 933 789 3 009 064 2 166 526Realised gains on disposal of available-for-sale financial assets (refer note 24) (1 426 075) (1 026 774) (96 868) (69 745)Impairment of goodwill – – 4 745 527 4 745 527
Headline earnings 155 415 642 109 877 993 Headline earnings per share (‘HEPS’) (cents) 109,0 76,9 Diluted HEPS (cents) 106,2 74,9
Short-term benefits
Post-retirement benefits
Share-based
paymentsand other
Basic salary
R
Incentivebonus*
R
Travel allowance
R
Medicalaid
RPension
R
Otherallowances
RTotal
R
36. Directors’ emoluments2014Paid by companyExecutiveAndries J van Heerden 2 635 750 1 348 000 161 380 17 250 – 4 320 000 8 482 380Hendrik P Verreynne 1 886 487 585 750 38 153 – 207 513 2 880 000 5 597 903Gert J Coffee 1 390 428 459 351 312 834 10 872 – 1 728 000 3 901 485
5 912 665 2 393 101 512 367 28 122 207 513 8 928 000 17 981 768
Non-executiveMarthinus W von Wielligh 597 000 – – – – – 597 000Francois du Toit 170 000 – – – – – 170 000Loyiso Dotwana 260 000 – – – – – 260 000Hendrik JE van Wyk 216 000 – – – – 24 300 240 300Laurie P Korsten (deceased) 92 000 – – – – – 92 000Phuti RE Tsukudu 190 000 – – – – – 190 000
1 525 000 – – – – 24 300 1 549 300
Total 7 437 665 2 393 101 512 367 28 122 207 513 8 952 300 19 531 068
2013Paid by companyExecutiveAndries J van Heerden 2 503 046 415 294 167 417 15 954 – 3 370 000 6 471 711Hendrik P Verreynne 1 639 640 330 000 36 000 – 180 360 1 497 600 3 683 600Gert J Coffee 1 295 100 136 425 310 420 9 900 – 322 500 2 074 345
5 437 786 881 719 513 837 25 854 180 360 5 190 100 12 229 656
Non-executiveMarthinus W von Wielligh 563 000 – – – – – 563 000 Francois du Toit 145 000 – – – – – 145 000 Loyiso Dotwana 248 000 – – – – – 248 000 Hendrik JE van Wyk 205 000 – – – – – 205 000 Laurie P Korsten 175 000 – – – – – 175 000 Phuti RE Tsukudu 183 000 – – – – – 183 000
1 519 000 – – – – – 1 519 000
Total 6 956 786 881 719 513 837 25 854 180 360 5 190 100 13 748 656
* Incentives include those earned in current year but only received in the following year.

98 Afrimat integrated annual report 2014
Annual fi nancial statements
Notes to the annual fi nancial statements (continued)for the year ended 28 February 2014
36. Directors’ emoluments (continued)In terms of the Share Appreciation Rights Scheme: Grant 5 (2013: Grant 4), the rights have vested after the three-year vesting period, as the performance criteria have been met.
Directors fees, to the amount of R80 000 and R60 000 were paid by Infrasors to Afrimat in respect of Andries J van Heerden and Hendrik P Verreynne being members of the Infrasors board.
37. Events after the reporting periodNo event material to the understanding of these financial statements has occurred between the end of the financial year and the date of approval.
38. Financial risk managementThe group’s financial instruments consist mainly of cash and cash equivalents, trade and other receivables, other financial assets, trade and other payables, loans to/from subsidiaries and borrowings.
The group’s activities expose it to a variety of financial risks: market risk (including currency risk, fair value interest rate risk, cash flow interest rate risk and price risk), credit risk and liquidity risk. The group’s overall risk management programme focuses on the unpredictability of financial markets and seeks to minimise potential adverse effects on the group’s financial performance.
Risk management is carried out by a central treasury department (group treasury) under policies approved by the board of directors. Group treasury identifies, evaluates and hedges financial risks when beneficial with prior approval from the board. The board provides guidance on overall risk management, as well as on policies covering specific areas, such as foreign exchange risk, interest rate risk, credit risk, use of derivative financial instruments and non-derivative financial instruments, and investment of excess liquidity. The Audit & Risk Committee oversees how management monitors compliance with these risks and control policies.
There has been no change in the group’s objectives, policies and processes for managing its financial risks or the methods to measure them.
(a) Market riskMarket risk is the risk that the fair value of future cash flows of a financial instrument will fluctuate because of market prices. Market prices comprise two types of risk: equity price risk and interest rate risk. Financial instruments affected by market risk include trade and other receivables, borrowings, other financial assets, cash and cash equivalents.
(i) Equity price riskThe group is exposed to equity securities price risk because of investments held by the group and classified on the statement of financial position as available-for-sale investments, financial assets at fair value through profit or loss and held-to-maturity. The group is not exposed to commodity price risk.
The group’s investments in equity securities are publicly traded on the JSE Limited. R205 909 of the available-for-sale investments of R1 914 925 comprise an investment in a guaranteed fund with no negative price risk and limited positive exposure.
As part of the presentation of market risks, IFRS 7 also requires disclosures on how hypothetical changes in risk variables affect the price of financial instruments. Important risk variables are stock exchange prices or indices.
Equity investments classified as available-for-sale investments, will change due to movements in market prices of investments which will be charged directly to equity.
Post-taxation profit for the year would increase/decrease as a result of gains/losses on equity securities classified as at fair value through profit or loss.
(ii) Interest rate riskThe group’s interest rate risk arises from cash and cash equivalents and borrowings as set out in notes 13 and 20. Cash and cash equivalents invested and borrowings obtained at variable interest rates expose the group to cash flow interest rate risk.
The group’s policy is to invest cash and cash equivalents and to obtain borrowings at variable interest rates and not to make use of any interest rate derivatives,which expose the group to cash flow interest rate risk in South Africa.
Sensitivity analysisInterest rate risks are presented by way of sensitivity analyses in accordance with IFRS 7. These show the effects of changes in market interest rates on interest payments, interest income and expense, other income components and, if appropriate, shareholders’ equity.
The group measures sensitivity to interest rates as the effect of a change in the Reserve Bank repo rate on the profit after tax based on the group’s exposure at 28 February. The group regards a 200 basis points (2013: 200 basis points) change in the Reserve Bank repo rate as being reasonably possible at the reporting dates.

99Afrimat integrated annual report 2014
Movement in basis
points
Effect on profit after tax
R
38. Financial risk management (continued)(a) Market risk (continued)
(ii) Interest rate risk (continued)2014GroupCash and cash equivalents +200 1 329 526
-200 (1 329 526)Borrowings +200 (2 462 941)
-200 2 462 941Bank overdraft +200 (740 901)
-200 740 901
CompanyCash and cash equivalents +200 72 713
-200 (72 713)Loans to subsidiaries +200 405 062
-200 (405 062)Loans from subsidiaries +200 (1 903 213)
-200 1 903 213Borrowings +200 (364 567)
-200 364 567
2013GroupCash and cash equivalents +200 1 933 366
-200 (1 933 366)Borrowings +200 (1 737 854)
-200 1 737 854Bank overdraft +200 (707 310)
-200 707 310
CompanyCash and cash equivalents +200 941 112
-200 (941 112)Loans to subsidiaries +200 152 831
-200 (152 831)Loans from subsidiaries +200 (897 871)
-200 897 871Borrowings +200 (607 395)
-200 607 395Bank overdraft +200 (304 862)
-200 304 862
(b) Credit riskCredit risk refers to the risk that a counterparty will default on its contractual obligations resulting in financial loss to the group. Potential concentrations of credit risk consist principally of trade receivables and short-term cash deposits.
The group did not consider there to be any significant credit risk exposure which has not been adequately provided for.
(i) Trade receivablesTrade receivables are disclosed net of provision for impairment. Risk control assesses the credit quality of the customer, taking into account its financial position, past experience and other factors. Individual risk limits are set based on internal ratings. The utilisation of credit limits and adherence to payment terms are regularly monitored. Credit risk is limited due to the large number of customers comprising the group’s customer base and their dispersion across geographical areas, accordingly the group has limited concentrations of credit risk. Provision for impairment is considered adequate as most of the balance relates to customers that have a good track record with the company and limited bad debt write offs have been experienced in the past.
Limited security is obtained for trade receivables, and accordingly most of the balance as per the statement of financial position is exposed to credit risk.

100 Afrimat integrated annual report 2014
Annual fi nancial statements
Notes to the annual fi nancial statements (continued)for the year ended 28 February 2014
38. Financial risk management (continued)(b) Credit risk (continued)
(i) Trade receivables (continued)The group manages the ageing of trade receivables on a contractual basis. The ageing of trade receivable at 28 February was:
2014%
2013%
ContractualNeither impaired nor past due 80,8 83,1Between 30 and 60 days 14,7 11,2Between 60 and 90 days 2,0 2,6More than 90 days 2,5 3,1
Total 100,0 100,0
The group’s concentration of credit risk is limited to South Africa and Namibia.
(ii) Cash and cash equivalentsThe group invests surplus cash with F1+ and approved F1 national short-term rated financial institutions.
(iii) Financial guaranteesCredit risk arises in relation to financial guarantees given to certain parties.
Guarantees in respect of environmental rehabilitation costs payable only when the group is in default were supplied by Standard Bank of South Africa Limited, FirstRand Bank Limited and ABSA Bank Limited to various parties, including the Department of Mineral Resources as well as performance guarantees to Eskom.
(iv) Available-for-sale financial assetsThe maximum exposure to credit risk at the reporting date is the carrying value of the debt securities classified as available-for-sale.
None of these financial assets is either past due or impaired.
(c) Liquidity riskLiquidity risk is the risk that the group will not be able to meet its financial obligations as they fall due. The group’s approach to managing liquidity is to ensure, as far as possible, that it will always have sufficient liquidity to meet its liabilities, when due, under both normal and stressed conditions, without incurring unacceptable losses or risking damage to the group’s reputation.
The group monitors its cash flow requirements through monthly cash forecasts which includes the servicing of financial obligations, but excludes the potential impact of extreme circumstances that cannot reasonably be predicted. To assist, strict credit control and debt monitoring processes are applied.
Balances due within 12 months equal their carrying balances as the impact of discounting is not significant. The following table details the group’s undiscounted contractual maturities for its financial liabilities:
Carrying values
Total cash flows
Less than 1 year
Between 1and 5 years
Over 5years
GroupAt 28 February 2014Medium-term loans 83 998 886 92 050 267 44 415 620 47 634 647 – Instalment purchase agreements 87 038 657 93 261 461 53 109 778 40 151 683 – Trade and other payables 252 669 647 252 669 647 252 669 647 – – Bank overdraft 51 451 466 51 451 466 51 451 466 – –
475 158 656 489 432 841 401 646 511 87 786 330 –
At 28 February 2013Medium-term loans 42 604 803 46 446 897 19 784 371 26 662 526 – Instalment purchase agreements* 78 079 502 83 617 976 47 548 413 36 069 563 – Trade and other payables 143 580 316 143 580 316 143 580 316 – – Bank overdraft 49 118 762 49 118 762 49 118 762 – –
313 383 383 322 763 951 260 031 862 62 732 089 –
* The maturities were restated to better reflect the position in prior year. No adjustment was made to the total balance.

101Afrimat integrated annual report 2014
38. Financial risk management (continued)(c) Liquidity risk (continued)
Carrying values
Total cash flows
Less than 1 year
Between 1and 5 years
Over 5years
CompanyAt 28 February 2014Medium-term loans 25 317 135 26 662 526 18 093 309 8 569 217 – Loans from subsidiaries 132 167 583 132 167 583 132 167 583 – – Trade and other payables 10 649 190 10 649 190 10 649 190 – – Exposure to omnibus securityship 51 451 466 51 451 466 51 451 466 – –
219 585 374 220 930 765 212 361 548 8 569 217 –
At 28 February 2013Medium-term loans 42 180 222 46 022 316 19 359 790 26 662 526 – Loans from subsidiaries 62 352 185 62 352 185 62 352 185 – – Trade and other payables 6 359 370 6 359 370 6 359 370 – – Exposure to omnibus securityship 49 118 762 49 118 762 49 118 762 – –
160 010 539 163 852 633 137 190 107 26 662 526 –
(d) Capital risk managementThe group’s objectives when managing capital are to safeguard the group’s ability to continue as a going concern in order to provide returns for shareholders and benefits for other stakeholders and to maintain an optimal capital structure to reduce the cost of capital.
The directors meet regularly to review the capital structure. As part of this review the directors consider the availability of funding within the group to fund the group’s capital requirements. The directors also consider the cost of capital and the risks associated with each class of capital.
In order to maintain or adjust the capital structure, the group may adjust the amount of dividends paid to shareholders, return capital to shareholders, buy-back its own shares or reduce debt.
Management of Infrasors believes it has not met its capital management objectives for the year and as a result entered into negotiations with the main financiers, ABSA Bank Limited, to continue with the current funding arrangement in order to allow Infrasors to return to profitability. Management is of the opinion that the results for the future period would render adequate returns.
The group is required, by covenants provided to financiers, to maintain certain solvency and profitability ratios which are monitored monthly via management accounts and cash flow forecasts. The group monitors capital on the basis of the net debt:equity ratio. This ratio is calculated as net debt divided by total equity. Net debt is calculated as total borrowings less cash and cash equivalents as shown in the statement of financial position.
The group’s strategy is to maintain the net debt:equity ratio to below 25%. The net debt:equity ratios at 28 February were as follows:
Group Company
2014R
2013R
2014R
2013R
Total borrowings 171 037 543 120 684 305 25 317 135 42 180 222 Less: cash and cash equivalents (40 876 733) (85 142 799) (5 049 524) (44 184 004)
Net debt 130 160 810 35 541 506 20 267 611 (2 003 782)Total equity 837 963 474 761 852 233 610 337 184 601 489 743
Total capital 968 124 284 797 393 739 630 604 795 599 485 961
Net debt:equity ratio (%) 15,5 4,7 3,3 (0,3)
There were no changes in the group’s approach to capital maintenance during the year. Neither the company nor its subsidiaries are subject to externally imposed capital requirements.

102 Afrimat integrated annual report 2014
Annual fi nancial statements
Notes to the annual fi nancial statements (continued)for the year ended 28 February 2014
38. Financial risk management (continued)(e) Fair value estimation
The determination of the fair value of financial instruments measured as such in the statement of financial position is made using a fair value measurement hierarchy. The fair value hierarchy is identified in levels as follows:– Quoted prices (unadjusted) in active markets for identical assets or liabilities (level 1).– Inputs other than quoted prices included within level 1 that are observable for the asset or liability, either directly (that is, as
prices) or indirectly (that is, derived from prices) (level 2).– Inputs for the asset or liability that are not based on observable market data (that is, unobservable inputs) (level 3).
The following table presents the group’s assets and liabilities that are measured at fair value at 28 February:
Group
Level 1 Level 2 Level 3Total
balance
At 28 February 2014Assets Available-for-sale financial assets – Equity securities 107 813 – – 107 813– Environmental funds – 1 807 112 – 1 807 112
At fair value through profit or loss – Environmental insurance policies – 17 583 654 – 17 583 654
Total assets 107 813 19 390 766 – 19 498 579
At 28 February 2013AssetsAvailable-for-sale financial assets – Equity securities 83 440 – – 83 440 – Environmental funds – 13 658 708 – 13 658 708
Total assets 83 440 13 658 708 – 13 742 148
The fair value of financial instruments traded in active markets is based on quoted market prices at the reporting date. A market is regarded as active if quoted prices are readily and regularly available from an exchange, dealer, broker, industry group, pricing service, or regulatory agency, and those prices represent actual and regularly occurring market transactions on an arm’s length basis. The quoted market price used for financial assets held by the group is the current bid price. These instruments are included in level 1. Instruments included in level 1 comprise primarily equity investments classified as available-for-sale.
Environmental funds and environmental insurance policies consist of equity investments quoted in an active market. Their fair values are indirectly derived from prices quoted in Level 1, and therefore included in Level 2.
TransfersThe group recognises transfers between levels of the fair value hierarchy at the end of the reporting period during which the transfer has occurred. There were no transfers between level 1 and 2 of the fair value hierarchy during the period ended 28 February 2014.
Infrasors Environmental Rehabilitation Trust (‘IERT’)The IERT is classified under level 2 of the fair value hierarchy. The IERT receives, holds and invests funds contributed by the group for the rehabilitation or management of negative environmental impacts associated with mining and exploration activities. The contributions are aimed at providing for sufficient funds at date of estimated closure of mining activities to address the rehabilitation and environmental impacts.
Funds accumulated for a specific mine or exploration project can only be utilised for the rehabilitation and environmental impacts of that specific mine or project.
The trustees of the fund are appointed by the group and consist of sufficiently qualified employees capable of fulfilling their fiduciary duties.
The funds are invested by the in-house treasury department with reputable financial institutions in accordance with a strict mandate to ensure capital preservation and real growth.

103Afrimat integrated annual report 2014
38. Financial risk management (continued)(e) Fair value estimation (continued)
Valuation techniques used in the determination of fair values for the business combination within level 3 of the hierarchyThe fair value of Infrasors was calculated based on the remaining mineral reserves and resources together with current mining licences available in the subsidiary. The value of the acquisition was estimated as the net asset value of Infrasors as at 28 February 2013 with the exception of property, plant and equipment.
The valuation of the property, plant and equipment is classified within level 3 of the fair value hierarchy as there are no quoted market prices available in an active market for these assets. The value was calculated by the executive directors of Afrimat based on the market value and/or replacement value of these assets.
The fair value of the business combination based on the net asset value of Infrasors as at 28 February 2013, with the inclusion of the recalculated value for property, plant and equipment, was supported with a discounted cash flow model. The future cash flows used in this model were calculated based on the successful implementation of the turnaround strategies projected by Afrimat.
The significant unobservable inputs used in the model are capital expenditures, working capital changes, sales volumes and depreciation. Range of inputs included a 3% increase in sales tonnes, 7,3% increase in the average selling price per tonne and a 10% risk adjustment factor for weather and market over supply.

104 Afrimat integrated annual report 2014
Annual fi nancial statements
Segmental reportfor the year ended 28 February 2014
Change%
2014R
2013R
Mining & Aggregates*Segmental revenue 1 419 926 788 914 209 055Intersegmental (73 897 685) (67 821 466)
Revenue from external customers 59,0 1 346 029 103 846 387 589
Contribution from operations 66,2 195 234 930 117 480 395Contribution margin on external revenue (%) 14,5% 13,9%Operating profit 67,3 196 661 005 117 577 263Assets 44,3 887 806 882 615 210 850Segmental equity 551 898 885 446 490 402Liabilities 99,1 335 907 997 168 720 448
Depreciation and amortisation 81 875 712 47 162 958Capital expenditure (excluding inter-company acquisitions and acquisitions through business combinations) 99 039 001 58 930 237
* Industrial Minerals Contracting Services and Aggregates have been combined into a single operating segment as the segments have similar economic characteristics and are similar in
respect of the nature of the production processes and nature of the regulatory environment,
Change%
2014R
2013R
Concrete Based Products**Segmental revenue 564 686 215 502 219 206Intersegmental (9 528 096) (11 022 229)
Revenue from external customers 13,0 555 158 119 491 196 977
Contribution from operations (18,5) 30 408 618 37 290 564Contribution margin on external revenue (%) 5,5% 7,6%Operating profit (18,5) 30 408 618 37 290 564Assets 10,2 207 103 669 187 977 269Segmental equity 142 694 914 133 156 626Liabilities 17,5 64 408 755 54 820 643
Depreciation and amortisation 13 457 687 9 291 322Capital expenditure (excluding inter-company acquisitions and acquisitions through business combinations) 20 376 026 22 150 386
** Comprising Concrete Products and Readymix, The rationale for the change is that these two segments better reflect the business, Over the years the Readymix business has become
an integral part of Concrete Products and its contribution to the group results is insignificant,
Change%
2014R
2013R
Unsegmental and eliminationsSegmental revenue – –Intersegmental – –
Revenue from external customers – – –
Contribution from operations 214,8 2 627 780 (2 288 713)Contribution margin on external revenue (%) – – Operating profit 137,4 2 627 780 (7 034 240)Assets*** (3,4) 384 506 698 398 075 327Segmental equity 143 369 675 182 205 205Liabilities**** 11,7 241 137 023 215 870 122
Depreciation and amortisation 1 568 441 1 432 927Capital expenditure (excluding inter-company acquisitions and acquisitions through business combinations) 1 910 943 1 853 830
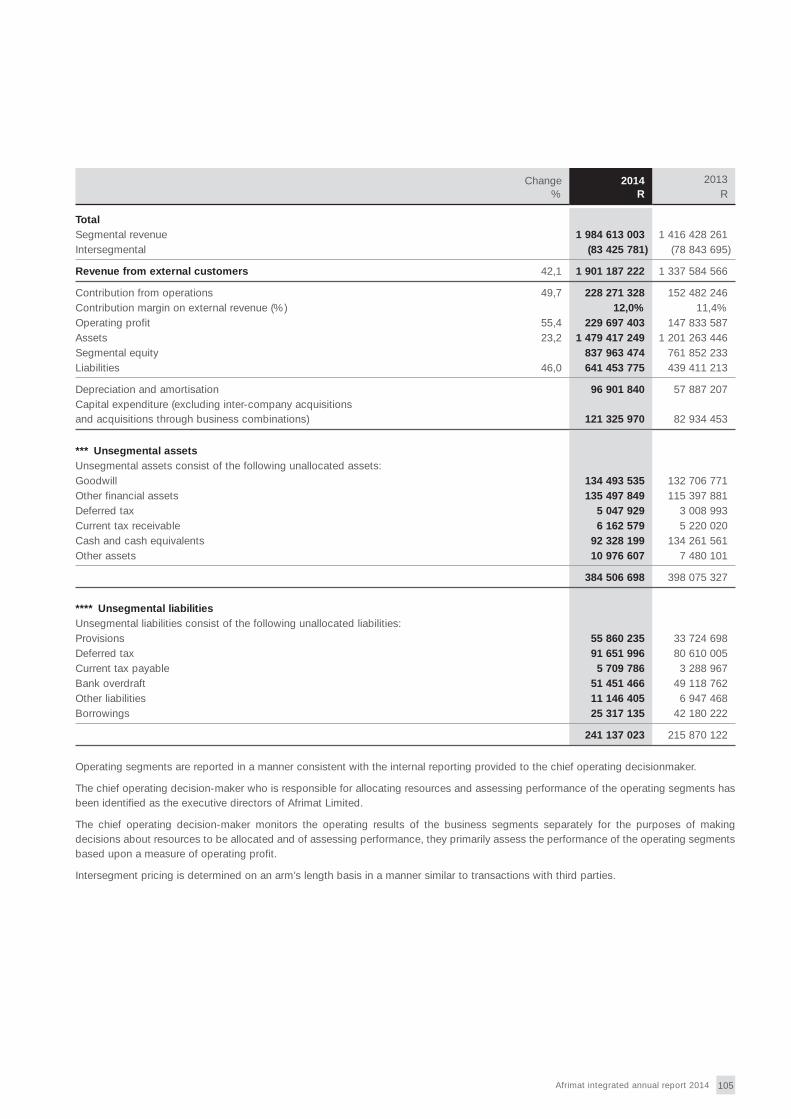
105Afrimat integrated annual report 2014
Change%
2014R
2013R
TotalSegmental revenue 1 984 613 003 1 416 428 261Intersegmental (83 425 781) (78 843 695)
Revenue from external customers 42,1 1 901 187 222 1 337 584 566
Contribution from operations 49,7 228 271 328 152 482 246Contribution margin on external revenue (%) 12,0% 11,4%Operating profit 55,4 229 697 403 147 833 587Assets 23,2 1 479 417 249 1 201 263 446Segmental equity 837 963 474 761 852 233Liabilities 46,0 641 453 775 439 411 213
Depreciation and amortisation 96 901 840 57 887 207Capital expenditure (excluding inter-company acquisitions and acquisitions through business combinations) 121 325 970 82 934 453
Operating segments are reported in a manner consistent with the internal reporting provided to the chief operating decisionmaker.
The chief operating decision-maker who is responsible for allocating resources and assessing performance of the operating segments has been identified as the executive directors of Afrimat Limited.
The chief operating decision-maker monitors the operating results of the business segments separately for the purposes of making decisions about resources to be allocated and of assessing performance, they primarily assess the performance of the operating segments based upon a measure of operating profit.
Intersegment pricing is determined on an arm’s length basis in a manner similar to transactions with third parties.
*** Unsegmental assetsUnsegmental assets consist of the following unallocated assets:Goodwill 134 493 535 132 706 771Other financial assets 135 497 849 115 397 881Deferred tax 5 047 929 3 008 993Current tax receivable 6 162 579 5 220 020Cash and cash equivalents 92 328 199 134 261 561Other assets 10 976 607 7 480 101
384 506 698 398 075 327
**** Unsegmental liabilitiesUnsegmental liabilities consist of the following unallocated liabilities:Provisions 55 860 235 33 724 698Deferred tax 91 651 996 80 610 005Current tax payable 5 709 786 3 288 967Bank overdraft 51 451 466 49 118 762Other liabilities 11 146 405 6 947 468Borrowings 25 317 135 42 180 222
241 137 023 215 870 122

106 Afrimat integrated annual report 2014
Annual fi nancial statements
Analysis of shareholdersas at 28 February 2014
Number ofshareholders %
Numberof shares %
Shareholding 1 – 1 000 shares 1 069 38,73 518 242 0,361 001 – 10 000 shares 1 272 46,09 5 039 767 3,5210 001 – 100 000 shares 312 11,30 9 546 671 6,66100 001 – 1 000 000 shares 86 3,12 29 020 589 20,261 000 000 shares and over 21 0,76 99 137 143 69,20
2 760 100,00 143 262 412 100,00
Analysis of holdingsNon-public shareholdingDirectors and their associates 7 0,25 29 636 999 20,69Treasury shares – Afrimat Share Incentive Trust – – – – – Afrimat Aggregates Operations (Pty) Limited 1 0,04 1 048 676 0,73Afrimat Empowerment Investments (Pty) Limited/Afrimat BEE Trust 1 0,04 31 100 809 21,71
9 0,33 61 786 484 43,13Public shareholding 2 751 99,67 81 475 928 56,87
2 760 100,00 143 262 412 100,0
Major, founder and BEE shareholders
Number of shares %
Number of BEE shares %
Founder shareholders – related partiesFrans du Toit Trust (Non-executive director) 19 408 502 13,55 – –Mr Andries J van Heerden (CEO) 4 975 026 3,47 – –Mrs Maryke E van Heerden 1 198 543 0,84 – –Amala Trust (CEO) 519 030 0,36 – –
Founder shareholders – not related partiesKorum Trust (TCB Jordaan) 9 910 000 6,92 – –JHM Korsten 853 739 0,60 – –LP Korsten (estate) 4 475 500 3,12 – –
Other major shareholdersOld Mutual Life Assurance Company SA 4 603 505 3,21 – –
BEE shareholdersMega Oils (Pty) Limited (33,3% Mr Loyiso Dotwana non-executive director) 5 889 529 4,11 5 889 529 4,11Afrimat Empowerment Investments (Pty) Limited/Afrimat BEE Trust 31 100 809 21,71 31 100 809 21,71Joe Kalo Investments (Pty) Limited 270 000 0,19 270 000 0,19
83 204 183 58,08 – 26,01Other 60 058 229 41,92 – –
143 262 412 100,00 37 260 338 26,01

107Afrimat integrated annual report 2014
Contracting Services at a glance
Drilling and blasting
Operates a fl eet of state-of-the-art
hydraulic drill rigs
Crushing and screening
Operates mobile crushers and
screens
Shareholder information
7
Ermelo

108 Afrimat integrated annual report 2014
Shareholder information
Notice of annual general meeting
Afrimat Limited(Registration number 2006/022534/06)
Share code: AFT
ISIN: ZAE000086302
(‘Afrimat’ or ‘the company’)
Notice is hereby given that the annual general meeting of Afrimat will be held at The Cedar Conference Room, Poplars Restaurant,
Racecourse Road, Durbanville, on Wednesday, 6 August 2014 at 14:00 for the purposes of:
considering and adopting the annual financial statements of the company for the year ended 28 February 2014;
re-electing directors;
re-electing the Audit & Risk Committee members;
appointing auditors;
considering and, if deemed fit, adopting, with or without modification, the special and ordinary resolutions set out below; and
transacting any other business as may be transacted at an annual general meeting.
For purposes of the holding of the general and annual general meetings, the Companies Act No. 71 of 2008, as amended, requires that a
record date be determined by the directors to establish those shareholders of the company that are entitled to attend and to vote at the
relevant general or annual general meeting.
Accordingly, for purposes of the annual general meeting of the company, the record date is hereby set at close of business on Friday,
1 August 2014 with the last day to trade in the shares of the company on the JSE Limited being Friday, 25 July 2014.
Special resolutionsSpecial resolution 1: General authority to repurchase company shares‘Resolved that the company and/or its subsidiaries be and is hereby authorised, by way of general authority, to acquire ordinary shares
issued by the company, in terms of section 16 of the company’s memorandum of incorporation and in terms of the Listings Requirements
of the JSE Limited (‘JSE’), being that:
any such acquisition of ordinary shares shall be implemented on the open market of the JSE;
any such acquisition is authorised by the company’s memorandum of incorporation;
this general authority shall only be valid until the company’s next annual general meeting, provided that it shall not extend beyond
15 months from the date of the passing of this special resolution;
an announcement will be published on SENS as soon as the company has acquired ordinary shares since the previous annual general
meeting constituting, on a cumulative basis, 3% (three percent) of the number of ordinary shares in issue prior to the acquisition, pursuant
to which the aforesaid 3% (three percent) threshold is reached, containing full details of such repurchases;
acquisitions in the aggregate in any one financial year may not exceed 10% (ten percent) of the company’s ordinary issued shares nor
may acquisitions in the aggregate, from the date of passing of this special resolution, exceed 10% (ten percent) of the company’s ordinary
issued shares at the date of passing of this special resolution;
in determining the price at which ordinary shares issued by the company are acquired by it in terms of this general authority, the maximum
premium at which such ordinary shares may be acquired will be 10% (ten percent) of the volume weighted average price at which such
ordinary shares are traded on the JSE, as determined over the five trading days immediately preceding the date of repurchase of such
ordinary shares by the company;
at any point in time, the company will only appoint one agent to effect any repurchase(s) on the company’s behalf;
the company will satisfy the solvency and liquidity test immediately after any repurchase; and
the company or its subsidiaries will not repurchase securities during a prohibited period in accordance with the JSE Listings
Requirements.’
Reason and effect of special resolution number 1The reason for the special resolution number 1 is to grant the company a general authority in terms of its memorandum of incorporation for
the acquisition by the company, or any of its subsidiaries, of shares issued by the company, or its holding company, which authority shall
be valid until the earlier of the next annual general meeting of the company or the variation or revocation of such general authority by special
resolution by any subsequent general meeting of the company, provided that the general authority shall not extend beyond fifteen (15)
months from the date of this annual general meeting. The passing and registration of this special resolution will have the effect of authorising
the company or any of its subsidiaries to acquire shares issued by the company or its holding company.
The following additional information, some of which may appear elsewhere in the integrated annual report of which this notice forms part,
is provided in terms of the JSE Listings Requirements for purposes of this general authority:
directors and management – see page 14 of the integrated annual report;
major beneficial shareholders – see page 106 of the integrated annual report;
directors’ interests in ordinary shares – see page 50 of the integrated annual report; and
share capital of the company – see page 49 of the integrated annual report.

109Afrimat integrated annual report 2014
Litigation statementThe directors, whose names appear under board of directors on page 14 of the integrated annual report of which this notice forms part, are not aware of any legal or arbitration proceedings, including proceedings that are pending or threatened, that may have or have had in the recent past, being at least the previous twelve (12) months, a material effect of the financial position of the company or its subsidiaries.
Directors’ responsibility statementThe directors, whose names appear under the board of directors on page 14 of the integrated annual report, collectively and individually, accept full responsibility for the accuracy of the information pertaining to this special resolution and certify that, to the best of their knowledge and belief, there are no facts that have been omitted which would make any statement false or misleading and that all reasonable enquiries to ascertain such facts have been made and that the special resolution contains all necessary information.
Material changesOther than the facts and developments reported on in this integrated annual report, there have been no material changes in the affairs or financial position of the company and its subsidiaries since the date of signature of the audit report and up to the date of this notice.
Statement by the board of directors of the companyPursuant to, and in terms of, the JSE Listings Requirements, the board of directors of the company hereby state that:(a) the intention of the directors of the company is to utilise the general authority to repurchase ordinary shares in the company if, at some
future date, the cash resources of the company are in excess of its requirements or there are other good reasons for doing so. In this regard, the directors will take account of, inter alia, an appropriate capitalisation structure for the company, the long-term cash needs of the company, and the interests of the company; and
(b) in determining the method by which the company intends to repurchase its securities, the maximum number of securities to be repurchased and the date on which such repurchase will take place, the directors of the company will ensure that:
the company and its subsidiaries will, after the repurchase, be able to pay their debts as they become due in the ordinary course of business for the next twelve (12) months after the date of notice of this annual general meeting;
the consolidated assets of the company and its subsidiaries fairly valued and recognised and measured in accordance with the accounting policies used in the latest audited fi nancial statements, will, after the repurchase, be in excess of the consolidated liabilities of the company and its subsidiaries for the next twelve (12) months after the date of this notice of the annual general meeting;
the issued stated capital and reserves of the company and its subsidiaries will, after the repurchase, be adequate for the ordinary business purposes of the company and its subsidiaries for the next twelve (12) months after the date of notice of this annual general meeting; and
the working capital available to the company and its subsidiaries will, after the repurchase, be suffi cient for the ordinary business requirements of the company and its subsidiaries for the next twelve (12) months after the date of this notice of annual general meeting.
Special resolution 2: Future non-executive directors’ remuneration ‘Resolved that the company be and is hereby authorised, by way of general authority, to make the following fixed annual fee payments to non-executive directors with effect from 1 March 2014:Chairman of the board R500 000Non-executive director R150 000Audit & Risk Committee Chairman R92 000Audit & Risk Committee member R58 000Remuneration & Nominations Committee Chairman R50 000Remuneration & Nominations Committee member R32 000Social & Ethics and Sustainability Committee Chairman R50 000Social & Ethics and Sustainability Committee member R32 000
as well as a daily rate of R11 000 for non-executive directors utilised on extraordinary duties.’
Special resolution 3: Provision of financial assistance to related or inter-related companies and others‘Resolved that in terms of and subject to the provisions of section 45 of the Companies Act, the shareholders of the company hereby approve, as a general authority (subject to the requirements of the company’s memorandum of incorporation and the Companies Act from time to time) and subject to compliance with section 45 of the Companies Act at any time and from time to time, the provision by the company of any direct or indirect financial assistance as contemplated in section 45 of the Companies Act, to a related or inter-related company, or to any one (1) or more related or inter-related companies on such terms and conditions as the board of directors of the company, or any one (1) or more persons authorised by the board of directors of the company from time to time for such purpose, may deem fit, in the form, nature and extent, and for the amounts that the board of directors of the company, or any one (1) or more persons authorised by the board of directors of the company from time to time for such purpose, may determine from time to time. To the extent which the Companies Act requires any other approval by the shareholders of the company pursuant to the provision of financial assistance, such approval is hereby granted. This general authority will be valid up to and including the day before the second anniversary of this special resolution being adopted or until superseded by another special resolution, whichever period is shorter.’

110 Afrimat integrated annual report 2014
Shareholder information
Notice of annual general meeting (continued)
Definition of financial assistance‘Financial assistance’ will have the meaning attributed to it in section 45(1) of the Companies Act; and ‘related’ and ‘inter-related’ will have the meanings so attributed in section 2 of the Companies Act. The reason for this special resolution is to obtain shareholder approval for financial assistance, when the need arises, to any related or inter-related companies in accordance with section 45 of the Companies Act. This special resolution will allow the company to continue to operate as it has in the past, providing fi nancial assistance to companies within the Afrimat group, on the basis of certain day-to-day operational decisions where the company previously was not required to obtain shareholders’ approval or consent. The passing of this special resolution will have the effect of the company having the necessary authority to provide fi nancial assistance to related or inter-related companies contemplated in this special resolution as and when required to do so and to confer the necessary authority on the board of directors of the company to authorise financial assistance to any one (1) or more related or inter-related companies, generally as the board of directors of the company may deem fit, on the terms and conditions, and for the amounts that the board of directors of the company may determine from time to time. The granting of the general authority would obviate the need to refer each instance of provision of financial assistance for shareholder approval in the circumstances contemplated in this special resolution. This general authority would assist the company with, inter alia, making financial assistance available as inter-company loans to subsidiaries of the company, or inter-related companies, as well as granting letters of support and guarantees in appropriate circumstances. This would avoid undue delays and attendant adverse financial impact on subsidiaries, or related or inter-related companies, as it would facilitate the expeditious conclusion of negotiations. If this special resolution is approved by the shareholders of the company, thereby conferring general authority on the board of directors of the company to authorise financial assistance as contemplated above, then the board of directors of the company shall not adopt any resolution to authorise such financial assistance as contemplated in this special resolution unless the board of directors of the company: is satisfied that immediately after providing such financial assistance, the company will satisfy the solvency and liquidity test as referred to in section 45(3)(b)(i) of the Companies Act;
is satisfied that the terms under which such financial assistance is proposed to be given are fair and reasonable to the company as contemplated in section 45(3)(b)(ii) of the Companies Act; and
has ensured that, to the extent which may be applicable, any conditions or restrictions in respect of the granting of financial assistance set out in the company’s memorandum of incorporation have been satisfied as contemplated in section 45(4) of the Companies Act.
Special resolution 4: Non-executive directors’ award of ordinary shares ‘Resolved that the company be and is hereby authorised, by way of general authority, to make the following grants of ordinary shares to non-executive directors:Mr Marthinus W von Wielligh (Chairman of the board) 300 000 sharesMr Hendrik JE van Wyk (Chairman of the Audit & Risk Committee) 100 000 shares.’
The reason for this special resolution number 4 is to reward the two non-executive directors for their personal contribution towards the company’s good performance over the past few years. These directors do not benefi t from any other Afrimat share initiative or appreciation rights scheme.
Ordinary resolutionsOrdinary resolution 1: Adoption of annual financial statements‘Resolved that the annual financial statements of the company for the year ended 28 February 2014 be and are hereby received and adopted.’
Ordinary resolution 2: Issue of shares or other equity securities for cash‘Resolved that the directors be authorised pursuant inter alia to the company’s memorandum of incorporation, until this authority lapses at the next annual general meeting of the company, unless it is then renewed at the next annual general meeting of the company provided that it shall not extend beyond 15 months, to allot and issue any equity securities (which shall include for the purpose of this ordinary resolution 2, the grant or issue of options or convertible securities that are convertible into an existing class of equity securities) for cash subject to the Listings Requirements of the JSE Limited (‘JSE’) on the following bases:(a) the allotment and issue of the equity securities must be made to persons qualifying as public shareholders as defined in the JSE
Listings Requirements and not to related parties;(b) the equity securities which are the subject of the issue for cash must be of a class already in issue, or where this is not the case, must
be limited to such shares or rights that are convertible into a class already in issue;(c) the number of equity securities issued for cash shall not in the aggregate in any one financial year exceed 15% (fifteen percent) of the
company’s issued ordinary shares. The number of ordinary shares which may be issued shall be based on the number of ordinary shares in issue at the date of such application less any ordinary shares issued during the current fi nancial year, provided that any ordinary shares to be issued pursuant to a rights issue (announced, irrevocable and fully underwritten) or acquisition (concluded up to the date of application including announcement of the final terms) may be included as though they were shares in issue at the date of application;
(d) the maximum discount at which equity securities may be issued is 10% (ten percent) of the weighted average traded price on the JSE of those equity securities over the 30 business days prior to the date that the price of the issue is determined or agreed by the directors of the company;
(e) after the company has issued equity securities for cash which represent, on a cumulative basis within a financial year, 5% (five percent) or more of the number of equity securities in issue prior to that issue, the company shall publish on SENS an announcement containing full details of the issue (including the number of equity securities issued, the average discount to the weighted average

111Afrimat integrated annual report 2014
traded price of the equity securities over the 30 business days prior to the date that the price of the issue is determined or agreed to by the directors and the effect of the issue on net asset value and earnings per share), or any other announcements that may be required in such regard in terms of the JSE Listings Requirements which may be applicable from time to time.’
In terms of the JSE Listings Requirements a 75% (seventy five percent) majority of the votes cast by shareholders present or represented by proxy at the annual general meeting must be cast in favour of ordinary resolution number 2 for it to be approved.
Ordinary resolution 3: Unissued ordinary shares‘Resolved that all the authorised but unissued ordinary shares of the company, be and are hereby placed at the disposal and under the control of the directors, and that the directors be and are hereby authorised to allot, issue and otherwise to dispose of all or any of such shares at their discretion, in terms of and subject to the provisions of the Companies Act No. 71 of 2008, as amended, and the Listings Requirements of the JSE Limited and subject to the proviso that the aggregate number of ordinary shares which may be allotted and issued in terms of this ordinary resolution number 3, shall be limited to 10% (ten percent) of the number of ordinary shares in issue from time to time.’
A majority of the votes cast by all shareholders present, or represented by proxy at the annual general meeting, will be required to approve this resolution.
Ordinary resolution 4: Re-election of director ‘Resolved that Mr Marthinus W von Wielligh be re-elected as a director of the company.’
A brief curriculum vitae in respect of Mr von Wielligh is set out on page 14 of the integrated annual report of which this notice forms part.
Ordinary resolution 5: Re-election of director ‘Resolved that Mr Hendrik JE van Wyk be re-elected as a director of the company.’
A brief curriculum vitae in respect of Mr van Wyk is set out on page 14 of the integrated annual report of which this notice forms part.
Ordinary resolution 6: Re-election of Audit & Risk Committee members ‘Resolved that the following directors be re-elected as members of the Audit & Risk Committee of the company: Mr Loyiso Dotwana (non-executive director); Mrs Phuti RE Tsukudu (independent non-executive director);Mr Hendrik JE van Wyk (independent non-executive director) (Chairman); andMr Marthinus W von Wielligh (independent non-executive director and Chairman of the board).’
Ordinary resolution 7: Appointment of auditor‘Resolved that the directors be and are hereby authorised to reappoint the auditor, Mazars Inc. and Conrad Burger as the individual registered auditor, for the ensuing financial year and are authorised to fix the remuneration of the auditor.’
Ordinary resolution 8: Remuneration policy‘Resolved that the company’s remuneration policy be approved as a non-binding advisory vote.’
As this is not a matter that is required to be resolved or approved by shareholders, no minimum voting threshold is required. Nevertheless, for record purposes, the minimum percentage of voting rights that is required for this resolution to be adopted as a non-binding advisory vote is 50% (fifty percent) of the voting rights plus 1 (one) vote to be cast on the resolution. (See Remuneration Policy on the company’s website www.afrimat.co.za).
Ordinary resolution 9: Signature of documentation‘Resolved that a director of the company or the company secretary be and is hereby authorised to sign all such documentation and do all such things as may be necessary for or incidental to the implementation of ordinary resolutions numbers 1 to 8 and special resolutions numbers 1 to 4 which are passed by the shareholders.’
Voting and proxiesA shareholder of the company entitled to attend and vote at the general meeting is entitled to appoint one or more proxies (who need not be a shareholder of the company) to attend, vote and speak in his/her stead. On a show of hands, every shareholder of the company present in person or represented by proxy shall have one vote only. On a poll, every shareholder of the company present in person or represented by proxy shall have one vote for every share held in the company by such shareholder.
Dematerialised shareholders who have elected own-name registration in the sub-register through a Central Securities Depository Participant (‘CSDP’) and who are unable to attend but wish to vote at the annual general meeting, should complete and return the attached form of proxy and lodge it with the transfer secretaries of the company.
Shareholders who have dematerialised their shares through a CSDP or broker rather than through own-name registration and who wish to attend the annual general meeting must instruct their CSDP or broker to issue them with the necessary authority to attend. If such shareholders are unable to attend, but wish to vote at the annual general meeting, they should timeously provide their CSDP or broker with their voting instructions in terms of the custody agreement entered into between that shareholder and his/her CSDP or broker.
112 Afrimat integrated annual report 2014
Shareholder information
Notice of annual general meeting (continued)
Forms of proxy may also be obtained on request from the company’s registered office. The completed forms of proxy must be deposited at, posted or faxed to the transfer secretaries at the address on the IBC, to be received by no later than 48 hours prior to the meeting. Any member who completes and lodges a form of proxy will nevertheless be entitled to attend and vote in person at the general meeting should the member subsequently decide to do so.
By order of the board
Mariëtte Swart Company secretary
24 June 2014
Registered office Transfer secretariesTyger Valley Office Park No. 2 Computershare Investor Services (Pty) LimitedCnr. Willie van Schoor Avenue and Old Oak Road (Registration number 2004/00364/07)Tyger Valley Ground Floor 70 Marshall Street7530 Johannesburg, 2001(PO Box 5278, Tyger Valley, 7536) (PO Box 61051, Marshalltown, 2107)Telephone: +27 21 917 8840 Telephone: +27 11 370 5000Facsimile: +27 21 914 1174 Facsimile: +27 11 688 520

113Afrimat integrated annual report 2014
Form of proxy
Afrimat Limited(Registration number 2006/022534/06)(‘Afrimat Limited’ or ‘the company’)Share code: AFTISIN: ZAE000086302
For use at the annual general meeting of the company to be held at The Cedar Conference Room, Poplars Restaurant, Racecourse Road, Durbanville, on Wednesday, 6 August 2014 at 14:00 and at any adjournment thereof.
For use by the holders of the company’s certificated ordinary shares (‘certified shareholder’) and/or dematerialised ordinary shares held through a Central Securities Depository Participant (‘CSDP’) or broker who have selected own-name registration (‘own-name dematerialised shareholders’). Additional forms of proxy are available from the transfer secretaries of the company.
Not for the use by holders of the company’s dematerialised ordinary shares who are not own-name dematerialised shareholders. Such shareholders must contact their CSDP or broker timeously if they wish to attend and vote at the annual general meeting and request that they be issued with the necessary authorisation to do so, or provide the CSDP or broker timeously with their voting instructions should they not wish to attend the annual general meeting in order for the CSDP or broker to vote thereat in accordance with their instructions.
I/We (Full name in block letters)
of (Address)
being a member/members of Afrimat Limited and holding ordinary shares in the company hereby appoint
1. of or failing him/her
2. of or failing him/her
3. the Chairman of the annual general meeting,
as my/our proxy to act for me/us and on my/our behalf at the annual general meeting which will be held for the purpose of considering and, if deemed fit, passing, with or without modification, the special and ordinary resolutions to be proposed thereat and at any adjournment thereof; and to vote for and/or against the ordinary resolutions and/or abstain from voting in respect of the Afrimat Limited ordinary shares registered in my/our name(s), in accordance with the following instructions:
For* Against* Abstain*
Special resolutions1. To give directors general authority to repurchase company shares
2. To give the company general authority to pay fixed fee annual payments to non-executive directors
3. To give the company general authority to provide financial assistance to related or inter-related companies and others
4. To award ordinary shares to non-executive directors
Ordinary resolutions
1. To adopt the 2014 annual financial statements
2. To issue unissued shares for cash
3. To place unissued shares under directors’ control
4. To re-elect Mr Marthinus W von Wielligh as a director of the company
5. To re-elect Mr Hendrik JE van Wyk as a director of the company
6. To re-elect the Audit & Risk Committee members of the company
Mr Loyiso Dotwana
Mrs Phuti RE Tsukudu
Mr Hendrik JE van Wyk
Mr Marthinus W von Wielligh
7. To authorise the directors to reappoint the auditor together with Conrad Burger as the individual registered auditor and to fix their remuneration
8. To approve the remuneration policy as a non-binding advisory vote
9. To authorise the directors or the company secretary to sign documentation
* Please indicate with an ‘X’ in the appropriate spaces above how you wish your votes to be cast. Unless otherwise instructed, my/our proxy may vote as he/she thinks fit.
Signed at (place) on date 2014
Member’s signature assisted by (if applicable)

114 Afrimat integrated annual report 2014
Shareholder information
Notes to form of proxy
1. This form proxy is to be completed only by those members who are: a. holding shares in a certificated form; or b. recorded in the sub-register in electronic form in their ‘own name’.
2. Members who have dematerialised their shares, other than ‘own-name’ dematerialised shareholders, and who wish to attend the annual general meeting must contact their Central Securities Depository Participant (‘CSDP’) or broker who will furnish them with the necessary authority to attend the annual general meeting, or they must instruct their CSDP or broker as to how they wish to vote in this regard. This must be done in terms of the agreement entered into between the members and their CSDP or broker.
3. Each member is entitled to appoint one or more proxies (who need not be a member(s) of the company) to attend, speak and, on a poll, vote in place of that member at the annual general meeting.
4. A member may insert the name of a proxy or the names of two alternative proxies of the member’s choice in the space provided, with or without deleting ‘the Chairman of the annual general meeting’. The person whose name stands first on the form of proxy and who is present at the annual general meeting will be entitled to act as proxy to the exclusion of those whose names follow.
5. A member’s instructions to the proxy must be indicated by the insertion of the relevant number of votes exercisable by that member in the appropriate box(es) provided. Failure to comply with the above will be deemed to authorise the Chairman of the annual general meeting, if the Chairman is the authorised proxy, to vote in favour of the ordinary resolutions at the annual general meeting, or any other proxy to vote or to abstain from voting at the annual general meeting as he/she deems fit, in respect of all the member’s votes exercisable thereat.
6. A member or his/her proxy is not obliged to vote in respect of all the ordinary shares held by such member or represented by such proxy, but the total number of votes for or against the ordinary resolutions and in respect of which any abstention is recorded may not exceed the total number of votes to which the member or his/her proxy is entitled.
7. Documentary evidence establishing the authority of a person signing this form of proxy in a representative capacity must be attached to this form of proxy, unless previously recorded by the company’s transfer office or waived by the Chairman of the annual general meeting.
8. The Chairman of the annual general meeting may reject or accept any form of proxy which is completed and/or received other than in accordance with these instructions, provided that he is satisfied as to the manner in which a member wishes to vote.
9. Any alterations or corrections to this form of proxy must be initialled by the signatory(ies).
10. The completion and lodging of this form of proxy will not preclude the relevant member from attending the annual general meeting and speaking and voting in person thereat to the exclusion of any proxy appointed in terms hereof, should such member wish to do so.
11. A minor must be assisted by his/her parent/guardian unless the relevant documents establishing his/her legal capacity are produced or have been registered by the company’s transfer secretaries.
12. Where there are joint holders of any shares, only that holder whose name appears first in the register in respect of such shares need sign this form of proxy.
13. Forms of proxy must be lodged with the transfer secretaries at the address given below by no later than 48 hours prior to the meeting:
Computershare Investor Services (Pty) Limited Ground Floor, 70 Marshall Street Johannesburg, 2001 (PO Box 61051, Marshalltown, 2107) Telephone: +27 11 370 5000 Facsimile: +27 11 688 5200

115Afrimat integrated annual report 2014
Notes

116 Afrimat integrated annual report 2014
Annual fi nancial statements
Notes

Shareholders’ diary
Editorial:
Financial year-end 28 February
Announcement of annual results 15 May 2014
Annual general meeting 6 August 2014
Annual report posted July 2014
Announcement of interim results November 2014
Contact details
Registered offi ceTyger Valley Office Park No. 2Corner Willie van Schoor Avenue and Old Oak RoadTyger Valley, 7530(PO Box 5278, Tyger Valley, 7536)Telephone: +27 21 917 8840Facsimile: +27 21 914 1174Email: [email protected]: www.afrimat.co.za
Company secretaryMariëtte SwartTyger Valley Office Park No. 2Corner Willie van Schoor Avenue and Old Oak RoadTyger Valley, 7530(PO Box 5278, Tyger Valley, 7536)Email: [email protected] Telephone: +27 21 917 8840Facsimile: +27 21 914 1174
AttorneysWebber Wentzel10 Fricker RoadIllovo, 2196(PO Box 61771, Marshalltown, 2107)Telephone: +27 11 530 5000Facsimile: + 27 11 530 5111
Transfer secretariesComputershare Investor Services (Pty) Limited(Registration number 2004/003647/07)Ground Floor, 70 Marshall StreetJohannesburg, 2001(PO Box 61051, Marshalltown, 2107)Telephone: +27 11 370 5000Facsimile: +27 11 688 5200
SponsorBridge Capital Advisors (Pty) Limited2nd Floor, 27 Fricker Road, Illovo, 2196(PO Box 651010, Benmore, 2010)Telephone: +27 11 268 6231Facsimile: +27 11 268 6538
AuditorMazars Inc.Mazars House, Rialto Road, Grand Moorings PrecinctCentury City, 7441(PO Box 134, Century City, 7446)Telephone: +27 21 818 5000Facsimile: +27 21 818 5001
Commercial bankersThe Standard Bank of South Africa LimitedCorporate and Investment Banking20th Floor, Main Tower, Standard Bank CentreHeerengracht, Cape Town, 8001(PO Box 40, Cape Town, 8000)Telephone: +27 11 401 2574Facsimile: +27 11 401 2550

Telephone: +27 21 917 8840
Facsimile: +27 21 914 1174
E-mail: [email protected]
Website: www.afrimat.co.za
Tyger Valley Offi ce Park No. 2
Cnr. Willie van Schoor Avenue
and Old Oak Road, Tyger Valley
(PO Box 5278, Tyger Valley, 7536)
Afrimat Limited