integra realty resources real estate trends & investment criteria viewpoint 2015
TRANSCRIPT
Integra Realty Resources
Real Estate Trends & Investment Criteria
Viewpoint2015
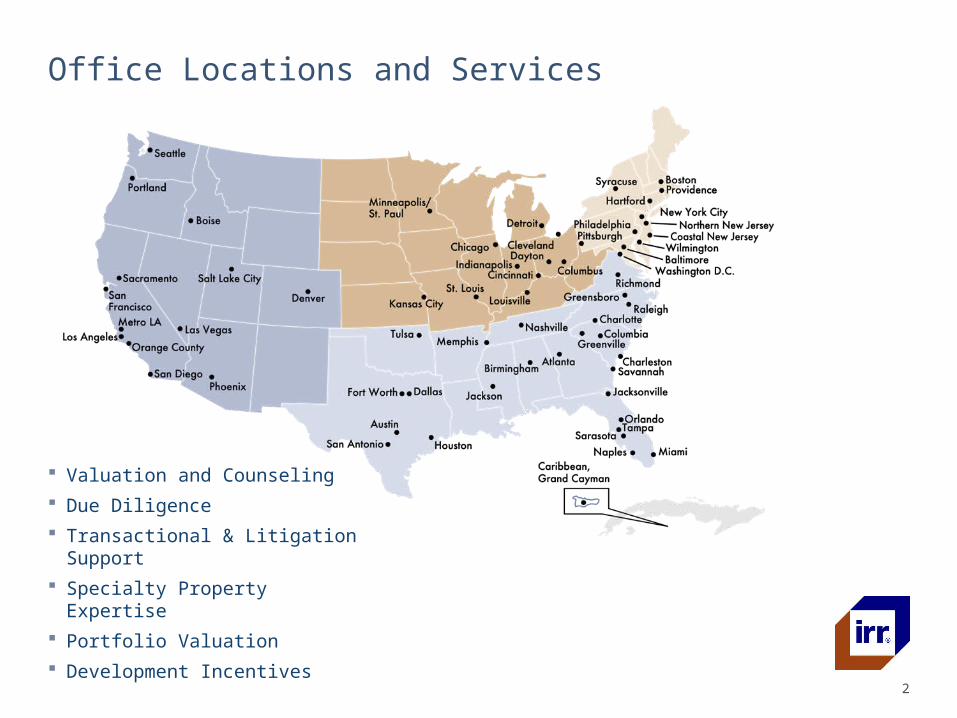
Office Locations and Services
2
Valuation and Counseling
Due Diligence
Transactional & Litigation Support
Specialty Property Expertise
Portfolio Valuation
Development Incentives
Office Properties
Office Properties
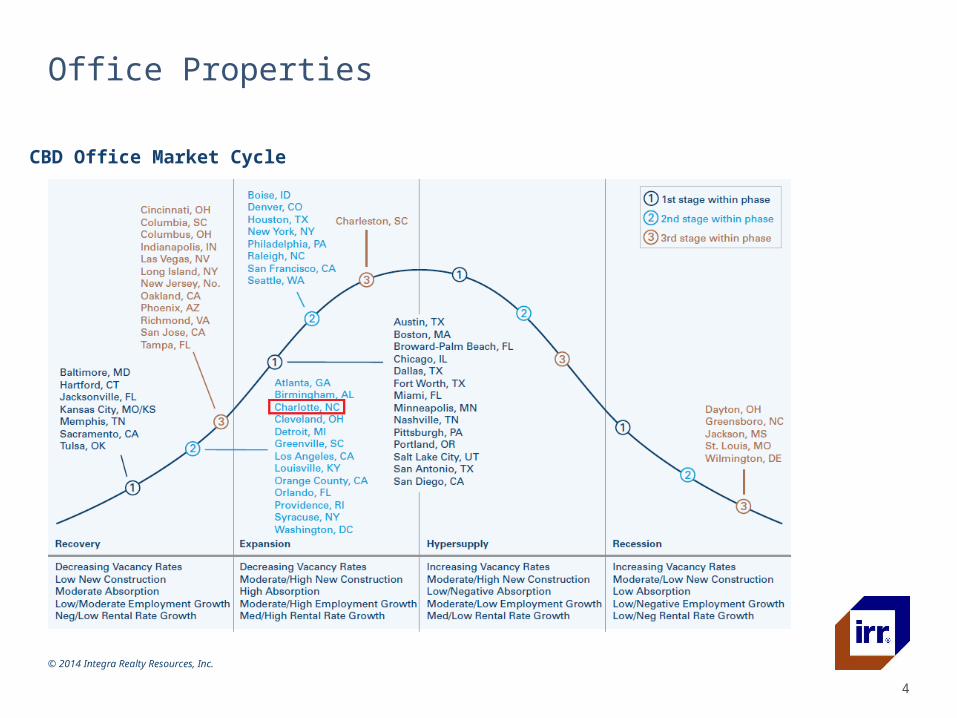
CBD Office Market Cycle
© 2014 Integra Realty Resources, Inc.
4
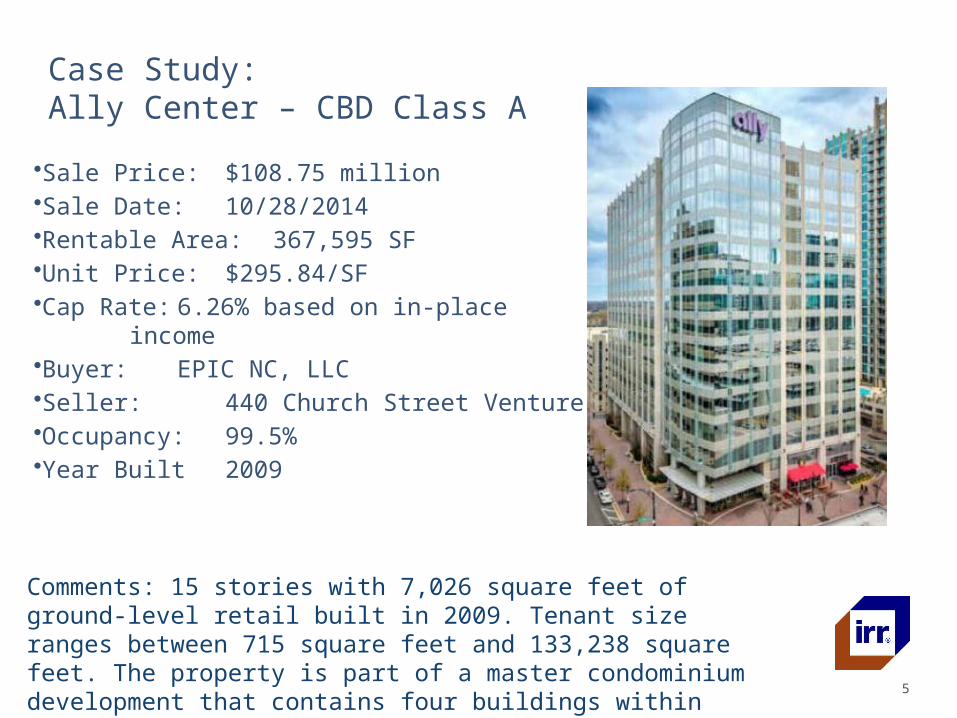
Case Study: Ally Center – CBD Class A
5
•Sale Price: $108.75 million•Sale Date: 10/28/2014•Rentable Area: 367,595 SF•Unit Price: $295.84/SF •Cap Rate: 6.26% based on in-place income•Buyer: EPIC NC, LLC•Seller: 440 Church Street Venture•Occupancy: 99.5% •Year Built 2009
Comments: 15 stories with 7,026 square feet of ground-level retail built in 2009. Tenant size ranges between 715 square feet and 133,238 square feet. The property is part of a master condominium development that contains four buildings within one larger parcel.
PICTURE
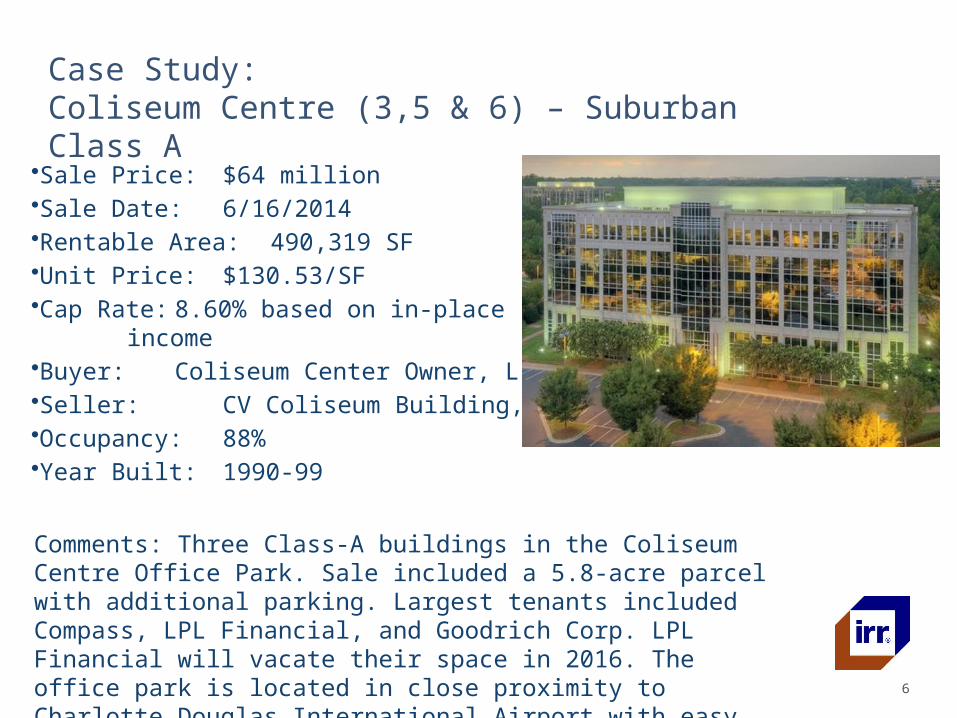
Case Study:Coliseum Centre (3,5 & 6) – Suburban Class A
6
•Sale Price: $64 million•Sale Date: 6/16/2014•Rentable Area: 490,319 SF•Unit Price: $130.53/SF •Cap Rate: 8.60% based on in-place
income •Buyer: Coliseum Center Owner, LLC•Seller: CV Coliseum Building, LLC•Occupancy: 88%•Year Built: 1990-99
Comments: Three Class-A buildings in the Coliseum Centre Office Park. Sale included a 5.8-acre parcel with additional parking. Largest tenants included Compass, LPL Financial, and Goodrich Corp. LPL Financial will vacate their space in 2016. The office park is located in close proximity to Charlotte Douglas International Airport with easy access to Interstates 77 and 85.
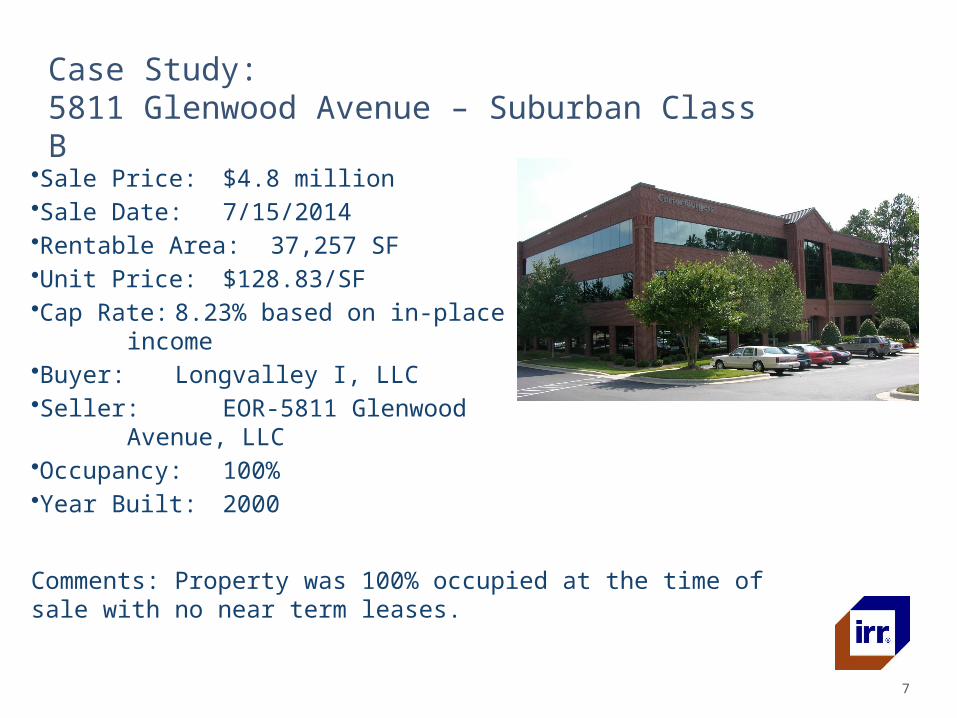
Case Study:5811 Glenwood Avenue – Suburban Class B
7
•Sale Price: $4.8 million •Sale Date: 7/15/2014•Rentable Area: 37,257 SF•Unit Price: $128.83/SF •Cap Rate: 8.23% based on in-place
income •Buyer: Longvalley I, LLC•Seller: EOR-5811 Glenwood
Avenue, LLC•Occupancy: 100% •Year Built: 2000
Comments: Property was 100% occupied at the time of sale with no near term leases.
Apartment Properties
Apartment Properties
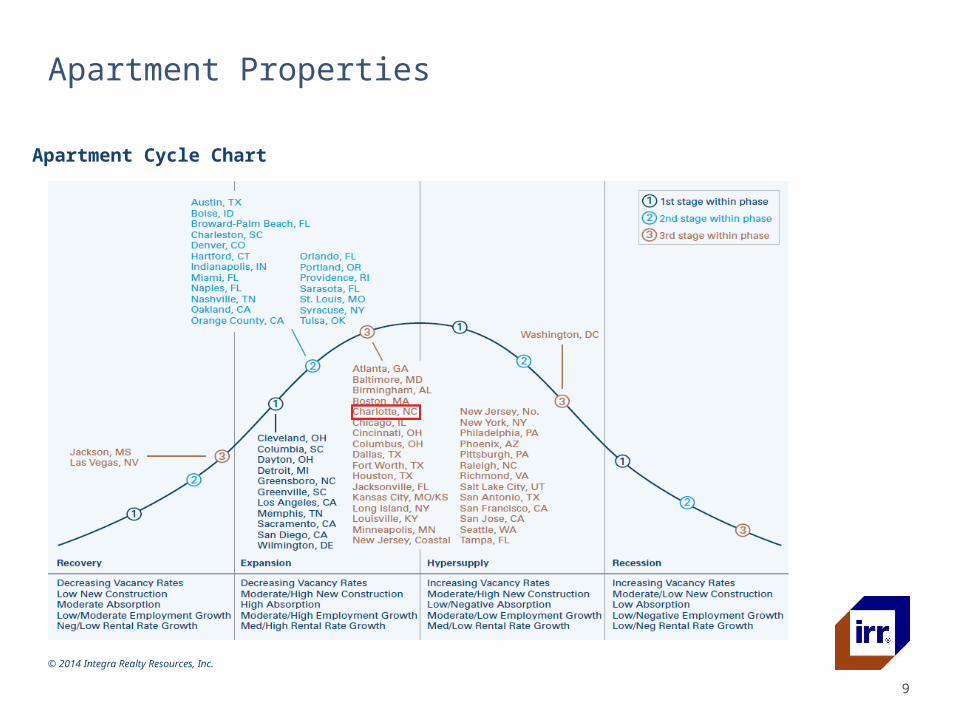
Apartment Cycle Chart
© 2014 Integra Realty Resources, Inc.
9
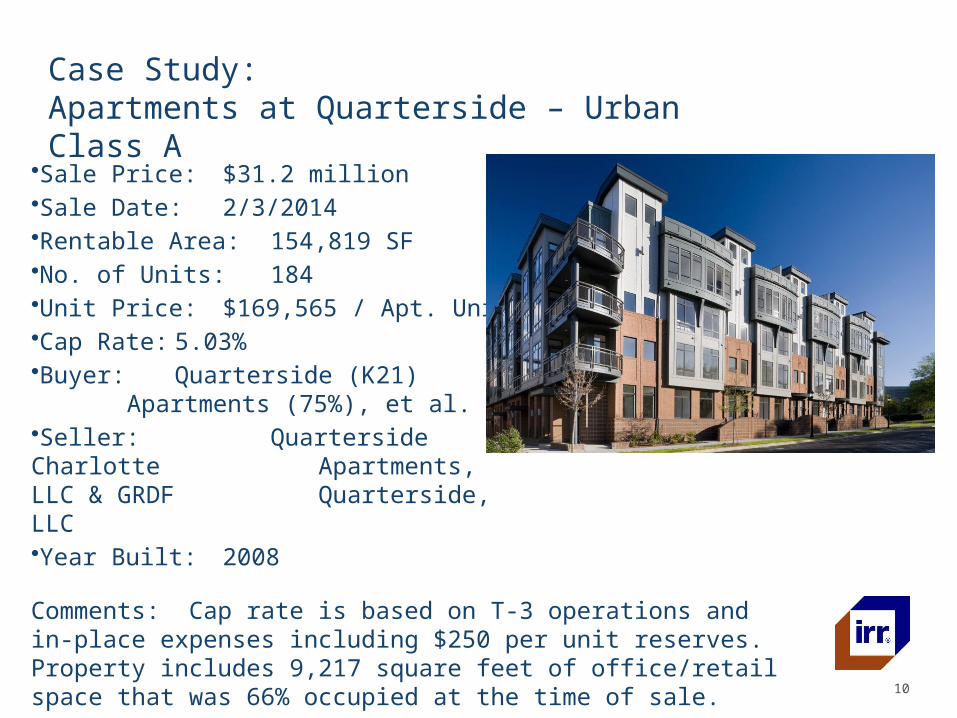
Case Study:Apartments at Quarterside – Urban Class A
10
Comments: Cap rate is based on T-3 operations and in-place expenses including $250 per unit reserves. Property includes 9,217 square feet of office/retail space that was 66% occupied at the time of sale.
•Sale Price: $31.2 million•Sale Date: 2/3/2014•Rentable Area: 154,819 SF •No. of Units: 184 •Unit Price: $169,565 / Apt. Unit•Cap Rate: 5.03% •Buyer: Quarterside (K21)
Apartments (75%), et al.•Seller: Quarterside Charlotte
Apartments, LLC & GRDF Quarterside, LLC
•Year Built: 2008
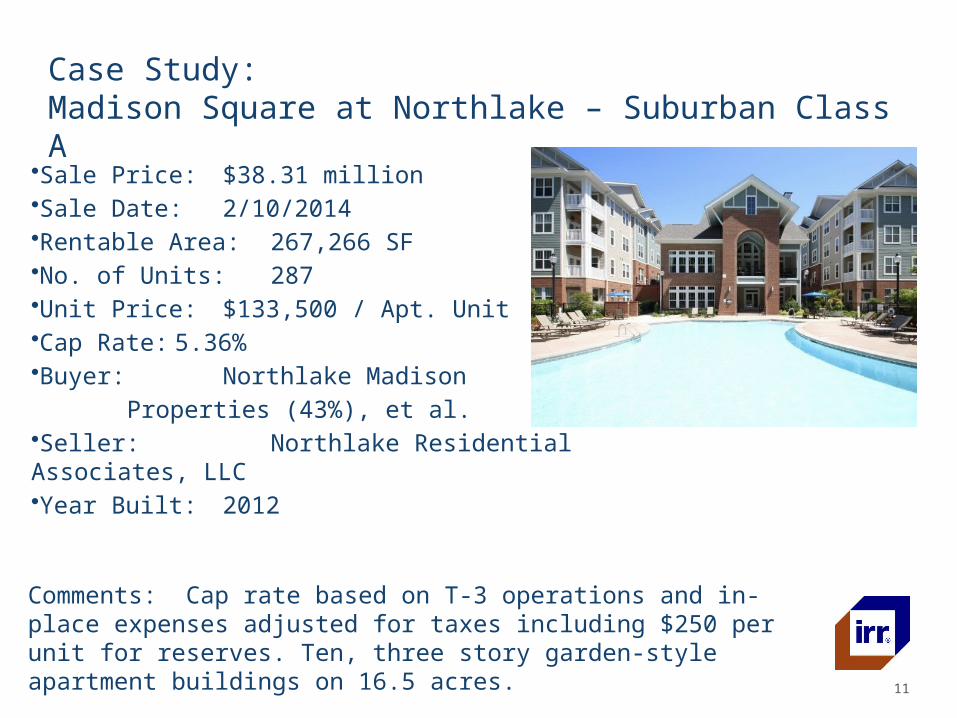
Case Study:Madison Square at Northlake – Suburban Class A
11
•Sale Price: $38.31 million•Sale Date: 2/10/2014•Rentable Area: 267,266 SF •No. of Units: 287•Unit Price: $133,500 / Apt. Unit•Cap Rate: 5.36% •Buyer: Northlake Madison
Properties (43%), et al.•Seller: Northlake Residential Associates, LLC•Year Built: 2012
Comments: Cap rate based on T-3 operations and in-place expenses adjusted for taxes including $250 per unit for reserves. Ten, three story garden-style apartment buildings on 16.5 acres.
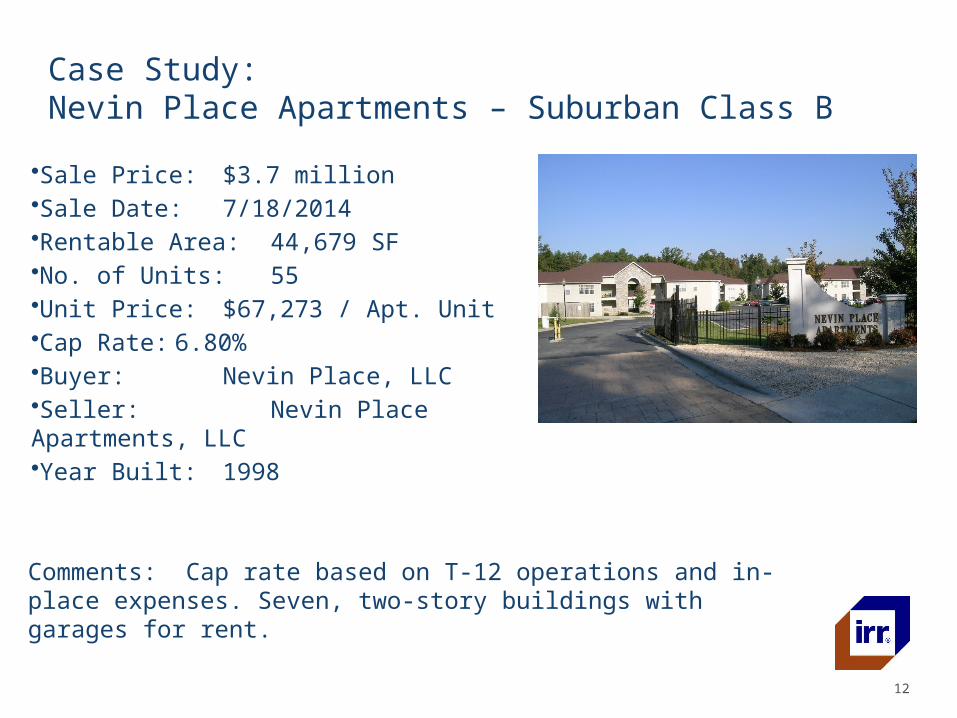
Case Study:Nevin Place Apartments – Suburban Class B
12
Comments: Cap rate based on T-12 operations and in-place expenses. Seven, two-story buildings with garages for rent.
•Sale Price: $3.7 million•Sale Date: 7/18/2014•Rentable Area: 44,679 SF •No. of Units: 55•Unit Price: $67,273 / Apt. Unit•Cap Rate: 6.80% •Buyer: Nevin Place, LLC•Seller: Nevin Place Apartments, LLC•Year Built: 1998
Retail Properties
Retail Properties
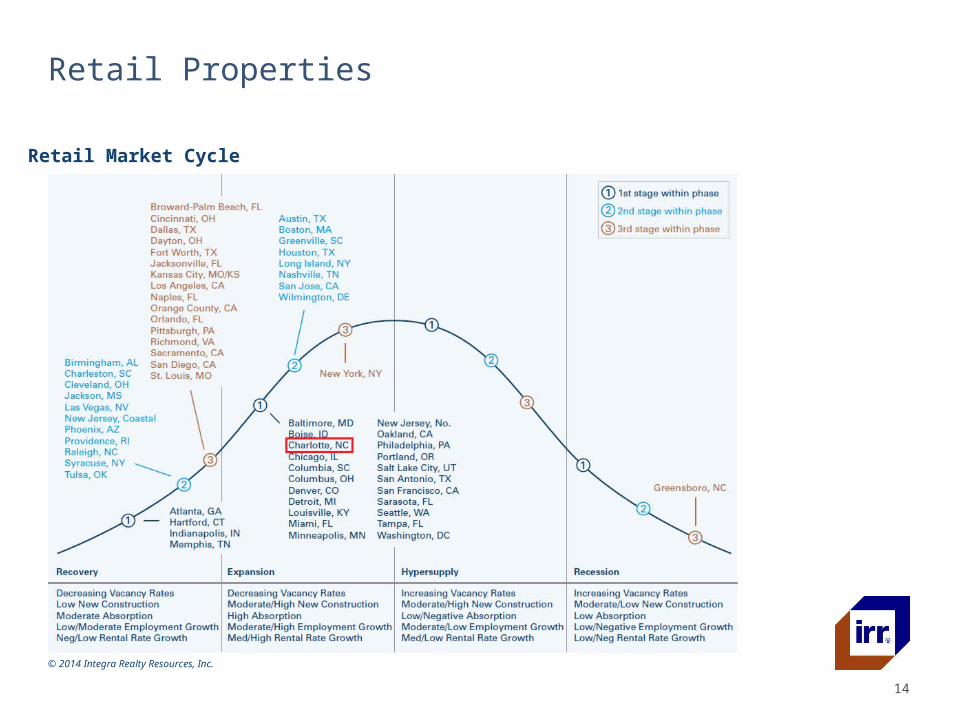
Retail Market Cycle
© 2014 Integra Realty Resources, Inc.
14
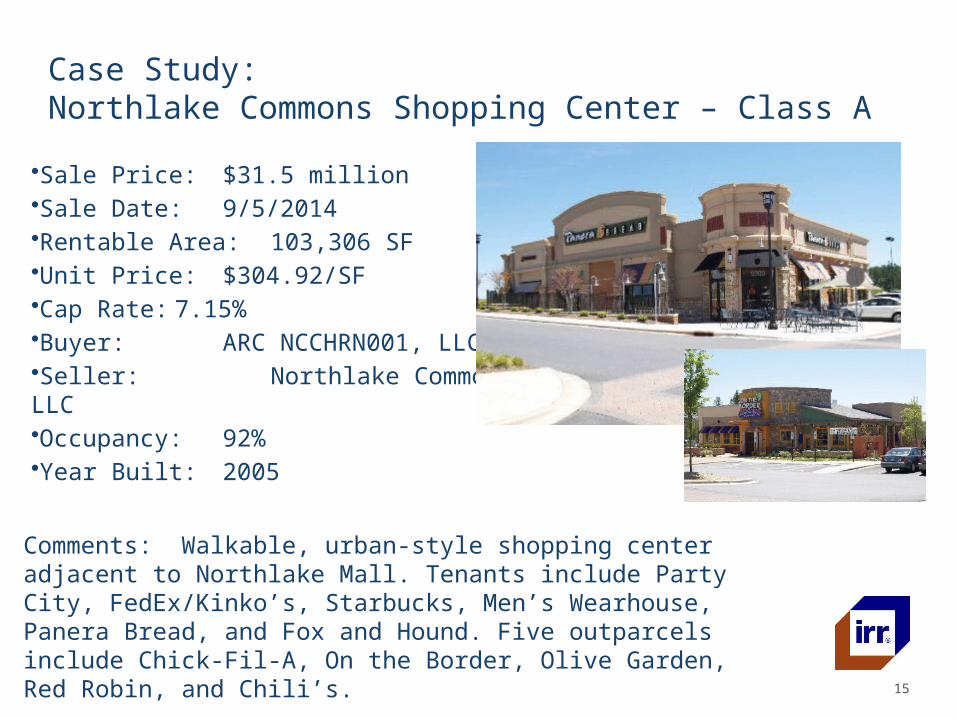
Case Study:Northlake Commons Shopping Center – Class A
15
Comments: Walkable, urban-style shopping center adjacent to Northlake Mall. Tenants include Party City, FedEx/Kinko’s, Starbucks, Men’s Wearhouse, Panera Bread, and Fox and Hound. Five outparcels include Chick-Fil-A, On the Border, Olive Garden, Red Robin, and Chili’s.
•Sale Price: $31.5 million •Sale Date: 9/5/2014•Rentable Area: 103,306 SF •Unit Price: $304.92/SF•Cap Rate: 7.15% •Buyer: ARC NCCHRN001, LLC•Seller: Northlake Commons, LLC•Occupancy: 92%•Year Built: 2005
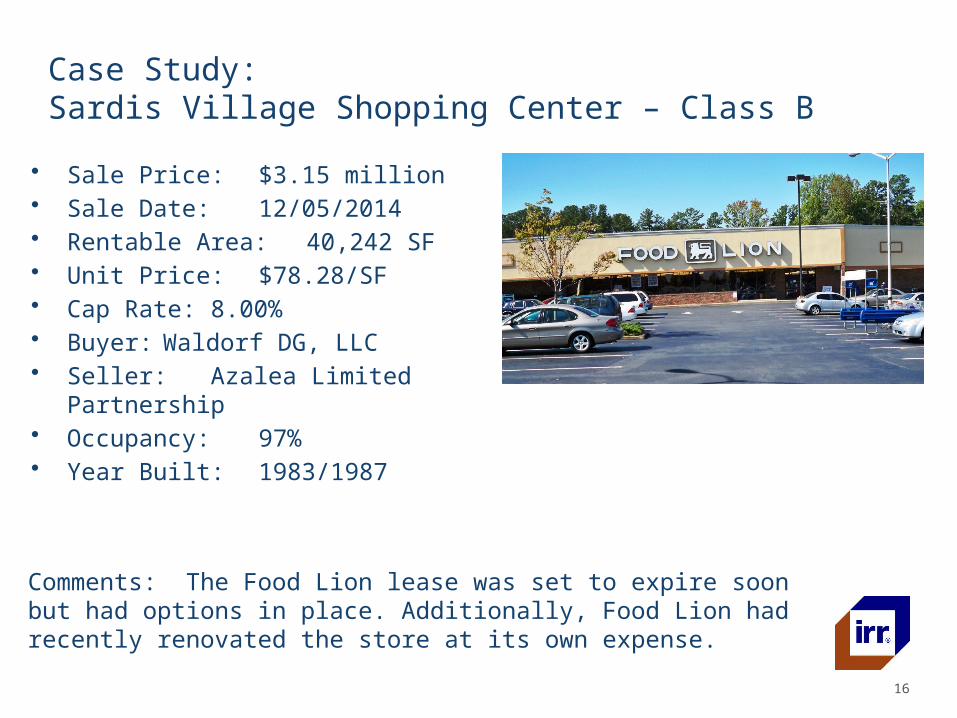
Case Study:Sardis Village Shopping Center – Class B
16
Comments: The Food Lion lease was set to expire soon but had options in place. Additionally, Food Lion had recently renovated the store at its own expense.
• Sale Price: $3.15 million• Sale Date: 12/05/2014• Rentable Area: 40,242 SF • Unit Price: $78.28/SF• Cap Rate: 8.00%• Buyer: Waldorf DG, LLC• Seller: Azalea Limited Partnership• Occupancy: 97%• Year Built: 1983/1987
Industrial Properties
Industrial Properties
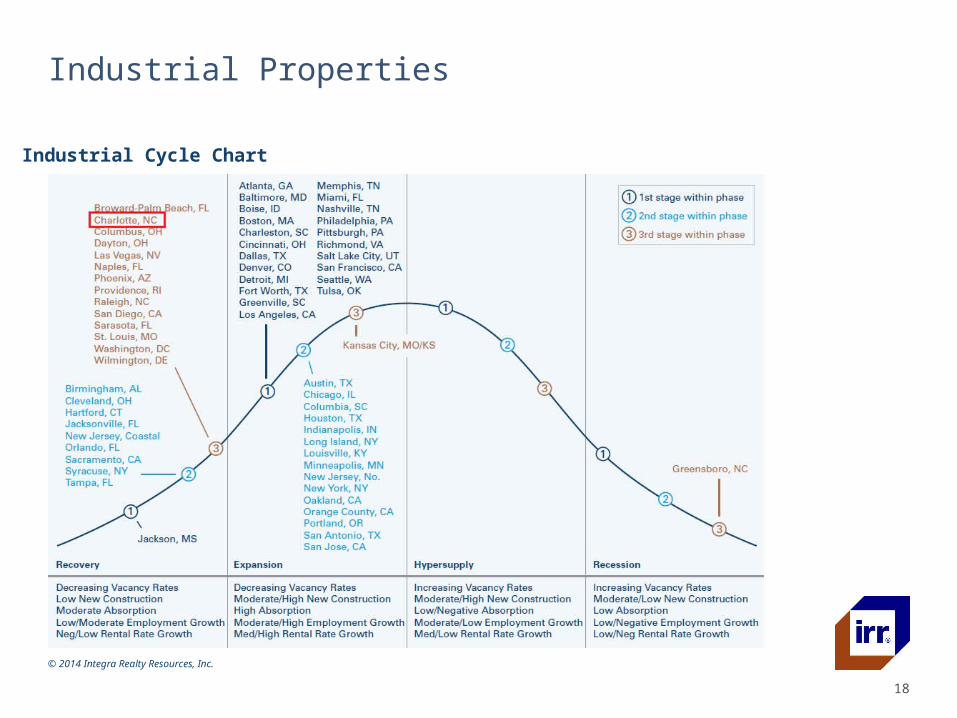
Industrial Cycle Chart
© 2014 Integra Realty Resources, Inc.
18
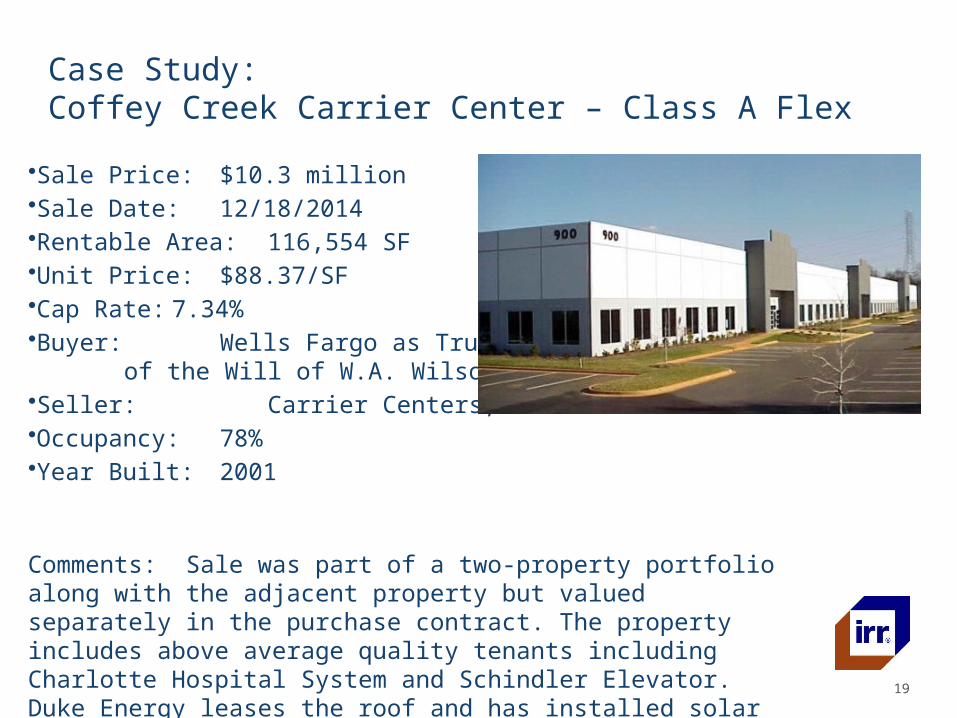
Case Study:Coffey Creek Carrier Center – Class A Flex
19
Comments: Sale was part of a two-property portfolio along with the adjacent property but valued separately in the purchase contract. The property includes above average quality tenants including Charlotte Hospital System and Schindler Elevator. Duke Energy leases the roof and has installed solar panels. 28 dock high and 4 drive-in doors, 40% office and 20’ clear height.
•Sale Price: $10.3 million•Sale Date: 12/18/2014•Rentable Area: 116,554 SF •Unit Price: $88.37/SF•Cap Rate: 7.34% •Buyer: Wells Fargo as Trustee
of the Will of W.A. Wilson•Seller: Carrier Centers, LLC•Occupancy: 78%•Year Built: 2001
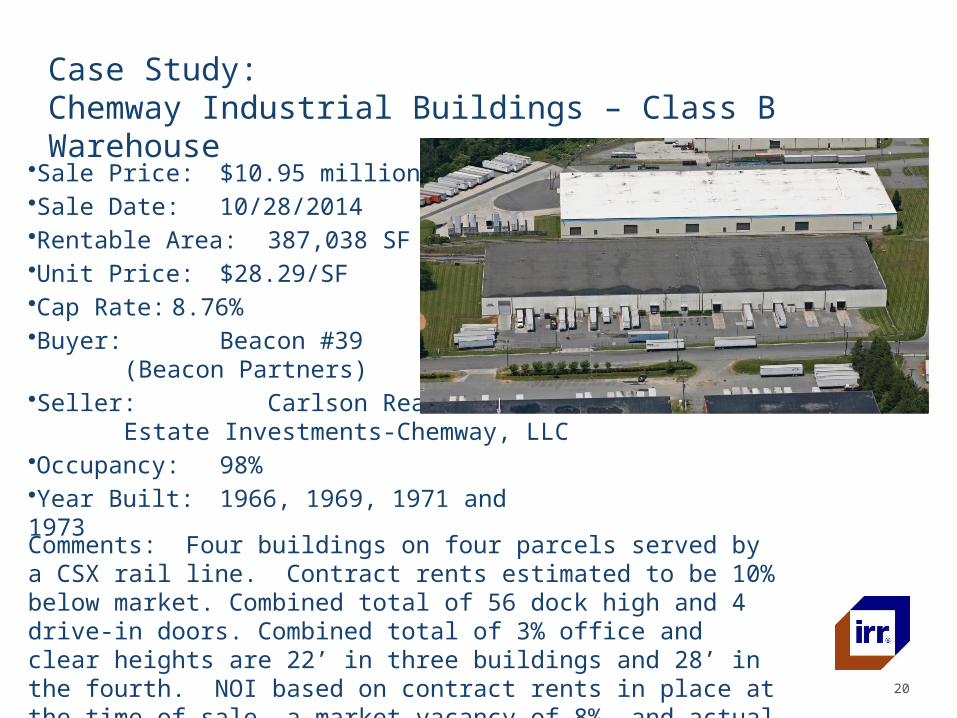
Case Study:Chemway Industrial Buildings – Class B Warehouse
20
Comments: Four buildings on four parcels served by a CSX rail line. Contract rents estimated to be 10% below market. Combined total of 56 dock high and 4 drive-in doors. Combined total of 3% office and clear heights are 22’ in three buildings and 28’ in the fourth. NOI based on contract rents in place at the time of sale, a market vacancy of 8%, and actual expense data for the property.
•Sale Price: $10.95 million •Sale Date: 10/28/2014•Rentable Area: 387,038 SF •Unit Price: $28.29/SF•Cap Rate: 8.76% •Buyer: Beacon #39
(Beacon Partners)•Seller: Carlson Real
Estate Investments-Chemway, LLC•Occupancy: 98%•Year Built: 1966, 1969, 1971 and 1973
IRR Forecast
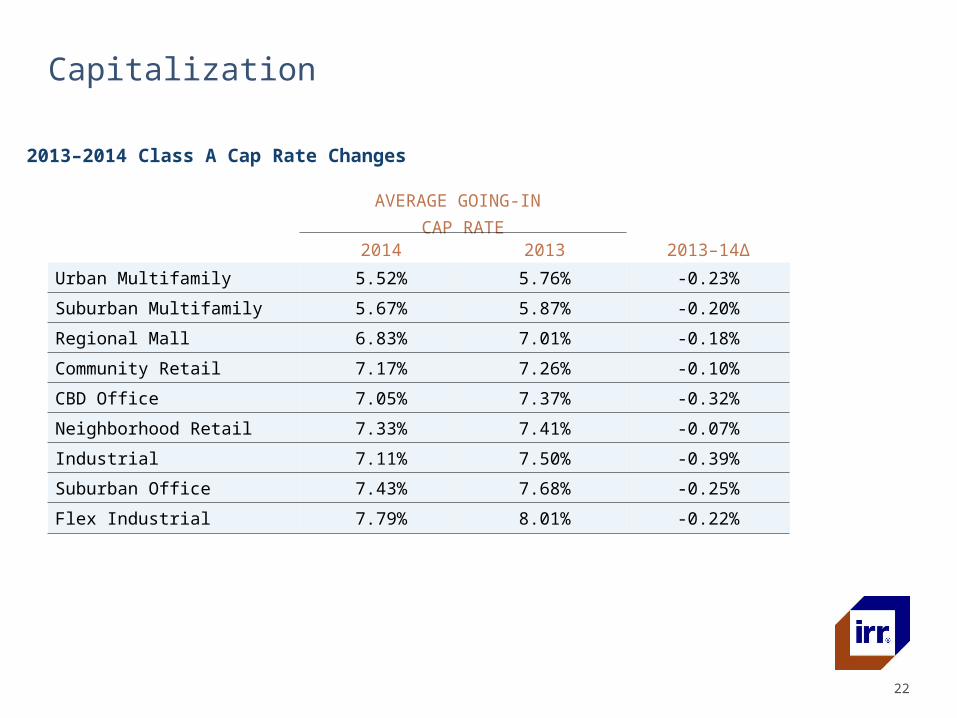
Capitalization
22
2013–2014 Class A Cap Rate Changes
AVERAGE GOING-IN CAP RATE
2014 2013 2013–14∆
Urban Multifamily 5.52% 5.76% -0.23%
Suburban Multifamily 5.67% 5.87% -0.20%
Regional Mall 6.83% 7.01% -0.18%
Community Retail 7.17% 7.26% -0.10%
CBD Office 7.05% 7.37% -0.32%
Neighborhood Retail 7.33% 7.41% -0.07%
Industrial 7.11% 7.50% -0.39%
Suburban Office 7.43% 7.68% -0.25%
Flex Industrial 7.79% 8.01% -0.22%
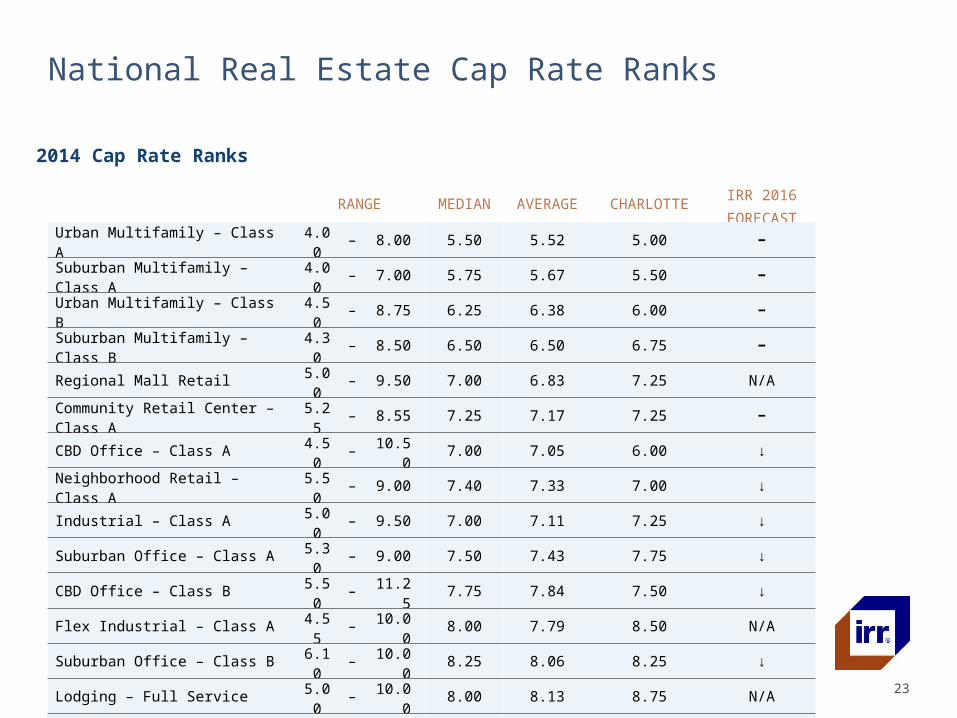
National Real Estate Cap Rate Ranks
23
2014 Cap Rate Ranks
© 2014 Integra Realty Resources, Inc.
RANGE MEDIAN AVERAGE CHARLOTTEIRR 2016
FORECAST
Urban Multifamily – Class A 4.00 – 8.00 5.50 5.52 5.00 −
Suburban Multifamily – Class A 4.00 – 7.00 5.75 5.67 5.50 −
Urban Multifamily – Class B 4.50 – 8.75 6.25 6.38 6.00 −
Suburban Multifamily – Class B 4.30 – 8.50 6.50 6.50 6.75 −
Regional Mall Retail 5.00 – 9.50 7.00 6.83 7.25 N/A
Community Retail Center – Class A 5.25 – 8.55 7.25 7.17 7.25 −
CBD Office – Class A 4.50 – 10.50 7.00 7.05 6.00 ↓
Neighborhood Retail – Class A 5.50 – 9.00 7.40 7.33 7.00 ↓
Industrial – Class A 5.00 – 9.50 7.00 7.11 7.25 ↓
Suburban Office – Class A 5.30 – 9.00 7.50 7.43 7.75 ↓
CBD Office – Class B 5.50 – 11.25 7.75 7.84 7.50 ↓
Flex Industrial – Class A 4.55 – 10.00 8.00 7.79 8.50 N/A
Suburban Office – Class B 6.10 – 10.00 8.25 8.06 8.25 ↓
Lodging – Full Service 5.00 – 10.00 8.00 8.13 8.75 N/A
Lodging – Limited Service 6.25 – 11.00 9.00 8.78 9.25 N/A
24
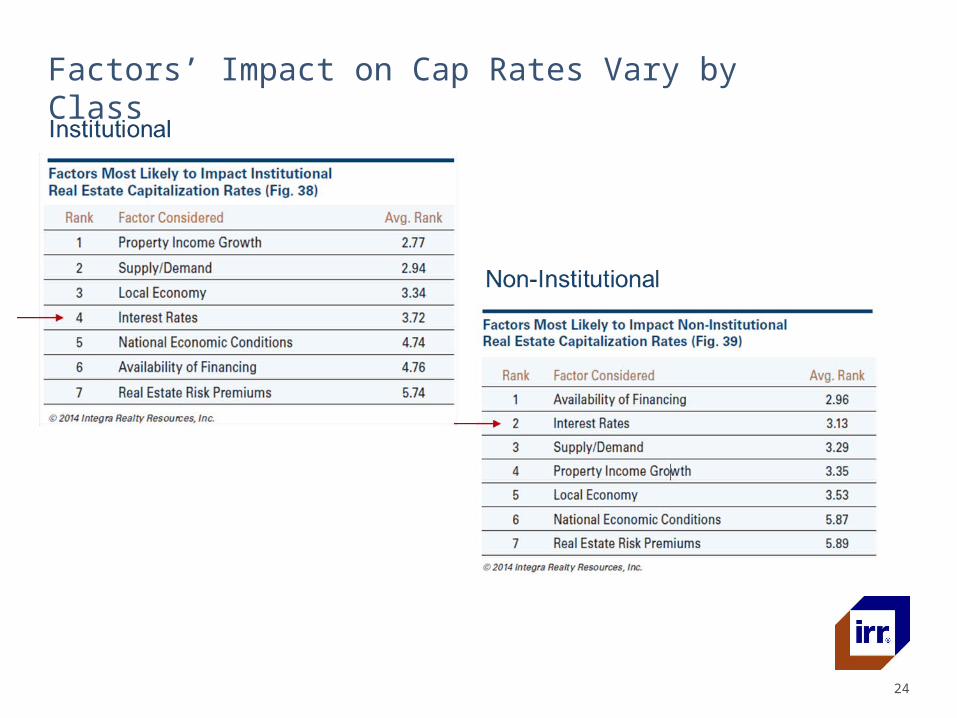
Factors’ Impact on Cap Rates Vary by Class