insurance market update - aon with falling premium rates have underscored the 2016 edition of the...
TRANSCRIPT

Risk. Reinsurance. Human Resources.
Insurance Market Update
20161H

2 Insurance Market Update 2016
3Insurance Market Update 2016
Heightened competition, buoyed by an abundance of global insurance capacity, coupled with falling premium rates have underscored the 2016 edition of the Insurance Market Update 1H. This drop has been compounded over multiple years of price reductions, with pricing now at levels not seen since before the global financial crisis.
This trend has been especially fruitful for clients in the Property market where average premium rate reductions have been double that seen by our global colleagues.
As a result the smart buyers are using this increased competitiveness as leverage to focus on ensuring the best level of cover in the market, and their total cost of insurable risk rather than a pure risk transfer price.
Mergers and acquisition (M&A) activity continues to be a significant trend as the supply line continues to reshape itself; including deals between Chubb and Ace, XL and Catlin, Berkshire Hathaway and IAG, and several other players in London.
However, the rationale behind this activity is changing which clients ultimately stand to benefit from, at least in the short term. Compared to the past, where deals were largely driven by a desire to benefit from synergies and cost reductions, the current wave appears more focused on building scale. With greater scale there is a bigger balance sheet and the ability to take on larger bets.
This means the capacity these insurers can generate is significantly higher than it’s ever been.
That said, it will be interesting to watch how insurers balance their needs to lift their returns on investment against the need to hang on to premium at any cost. Some swing back to a focus on synergies and cost savings may be required to make the acquisitions work.
While Directors’ & Officers’ rates remain competitive, a major player recently reduced capacity for ‘Side-C’ cover in a deliberate attempt to reset pricing in this part of the market. The big question now is whether other players will follow suit given the abundance of capacity in this space.
Cyber risks entered the top 10 risks for companies for the first time in Aon’s Global Risk Management Survey 2015, indicating that the threat is starting to grab attention in boardrooms across the country. However, we are still seeing the reported number of incidents responded to by the ASO outpacing the uptake of policies, suggesting it’s still an underrated threat.
Perhaps now we will see brokers and their clients increasingly working together to close that gap between the product offerings and potential exposures, leading to a growing uptake in cyber cover. We also hope to see more innovation around this emerging product.
Welcome
James Baum Managing Director & Chief Broking Officer, Pacific Aon Risk Solutions
Looking aheadA gap appears to be growing between the profitability of Australian and global insurers, particularly in the mid-market sector. This space is dominated by the likes of Suncorp, Insurance Australia Group, QBE and Allianz, which have all seen their earnings come under strain over the past 12 months following a sustained period of bad weather events, especially in North Queensland and Sydney.
As a result, there is pressure building in the Australian market for some change in pricing in the mid-market space.
While some insurers are talking about the need for rate increases, we would expect to first see a flattening in pricing in the first half of this year and then some marginal correction in pricing in the second half. In property we are already seeing some early signs that insurers are now looking to draw a line in the sand, with rates continuing to reduce but at a significantly slower rate.
The large corporate space is unlikely to be affected given the active competition from international insurers which aren’t experiencing the same profitability pressures.
We would expect more M&A activity to take place in 2016, possibly with some activity from Chinese insurers looking to expand into other markets.
While much of the industry’s recent focus has been on pricing cycles, we are seeing more conversations and enthusiasm around reinvesting in improved service offerings.
Aon would particularly like to see more innovation around insurers’ claims offering – that is, streamlining and refining their systems, technology and processes to suit policyholders’ needs at the time of loss. We look forward to moves to speed up payment to ease cash flow pressures after a major catastrophe or loss and an improved response around business interruption.

4 Insurance Market Update 2016
5Insurance Market Update 2016
Contents
Welcome 3
Property 6
General Liability 9
Professional Indemnity 11
Directors & Officers 13
Cyber 15
Financial Institutions 17
Workers’ Compensation and Work Health & Safety 19
Reinsurance 22
6 Insurance Market Update 2016
Property
Rates continue to fall but for how long?We continue to see a significant oversupply of capacity in the market, reflected by insurers sharpening their rates particularly over the last two years (see Fig 2). Locally, this has been further fuelled by the weakness of the Australian dollar.
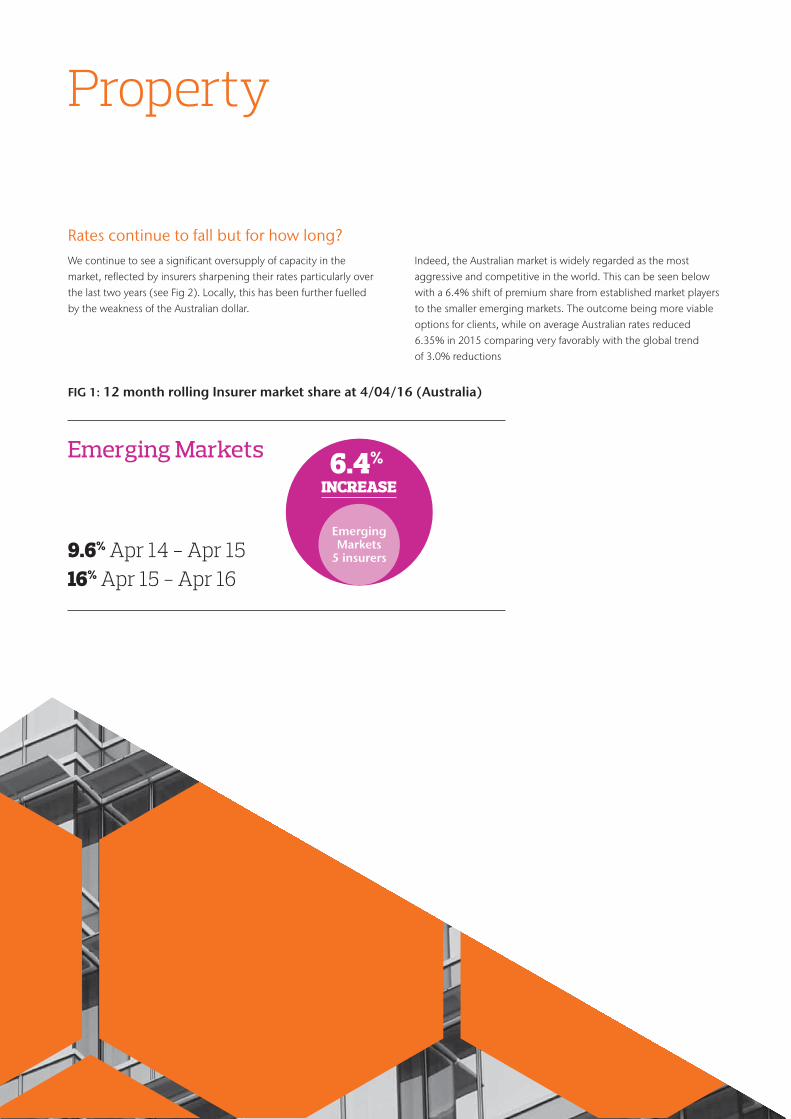
Indeed, the Australian market is widely regarded as the most aggressive and competitive in the world. This can be seen below with a 6.4% shift of premium share from established market players to the smaller emerging markets. The outcome being more viable options for clients, while on average Australian rates reduced 6.35% in 2015 comparing very favorably with the global trend of 3.0% reductions
FIG 1: 12 month rolling Insurer market share at 4/04/16 (Australia)
9.6% Apr 14 - Apr 1516% Apr 15 - Apr 16
Emerging Markets
Emerging Markets
5 insurers
6.4% INCREASE
7Insurance Market Update 2016
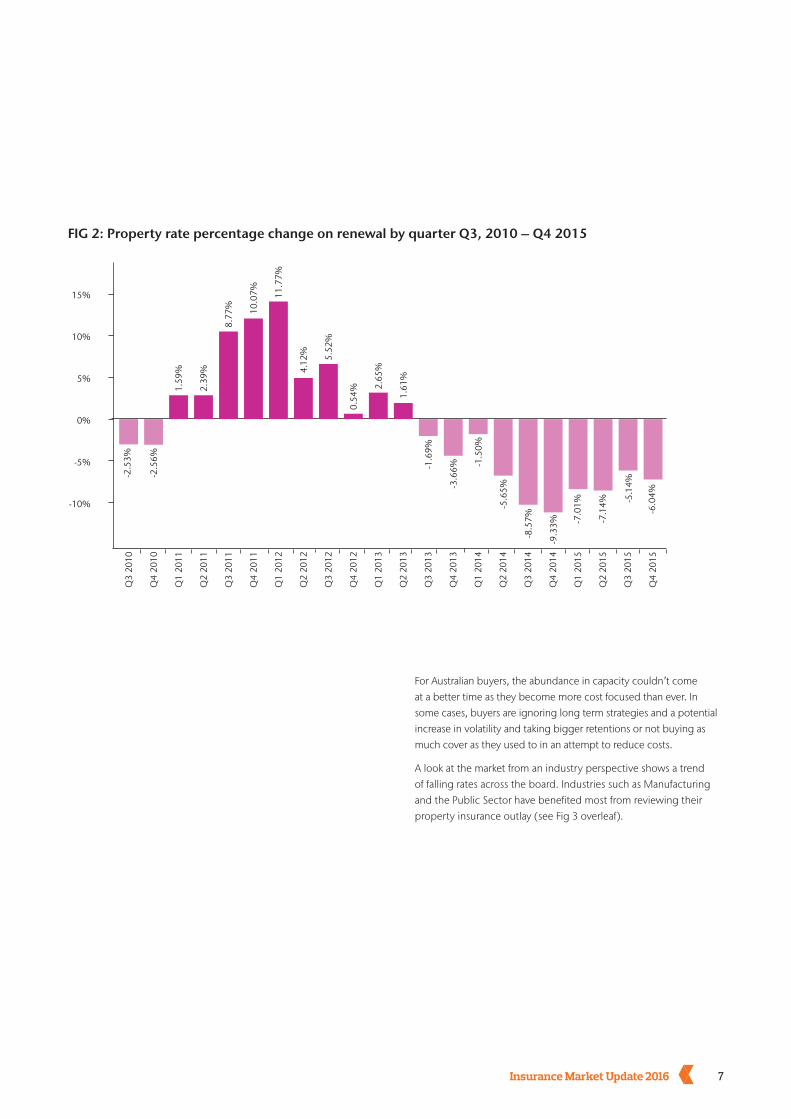
FIG 2: Property rate percentage change on renewal by quarter Q3, 2010 – Q4 2015
0%
5%
-5%
10%
15%
-10%
-2.5
3%
-2.5
6%
-1.6
9%
-3.6
6%
-1.5
0%
-5.6
5%
-8.5
7%
-9.3
3% -7.0
1%
-7.1
4%
-6.0
4%
1.59
%
8.77
% 10.0
7%
2.39
%
11.7
7%
4.12
% 5.52
%
0.54
% 2.65
%
1.61
%
Q3
2010
Q4
2010
Q1
2011
Q2
2011
Q3
2011
Q3
2012
Q4
2012
Q1
2013
Q2
2013
Q3
2013
Q4
2013
Q1
2014
Q2
2014
Q3
2014
Q4
2014
Q1
2015
Q2
2015
Q3
2015
Q4
2015
Q2
2012
Q1
2012
Q4
2011
-5.1
4%
For Australian buyers, the abundance in capacity couldn’t come at a better time as they become more cost focused than ever. In some cases, buyers are ignoring long term strategies and a potential increase in volatility and taking bigger retentions or not buying as much cover as they used to in an attempt to reduce costs.
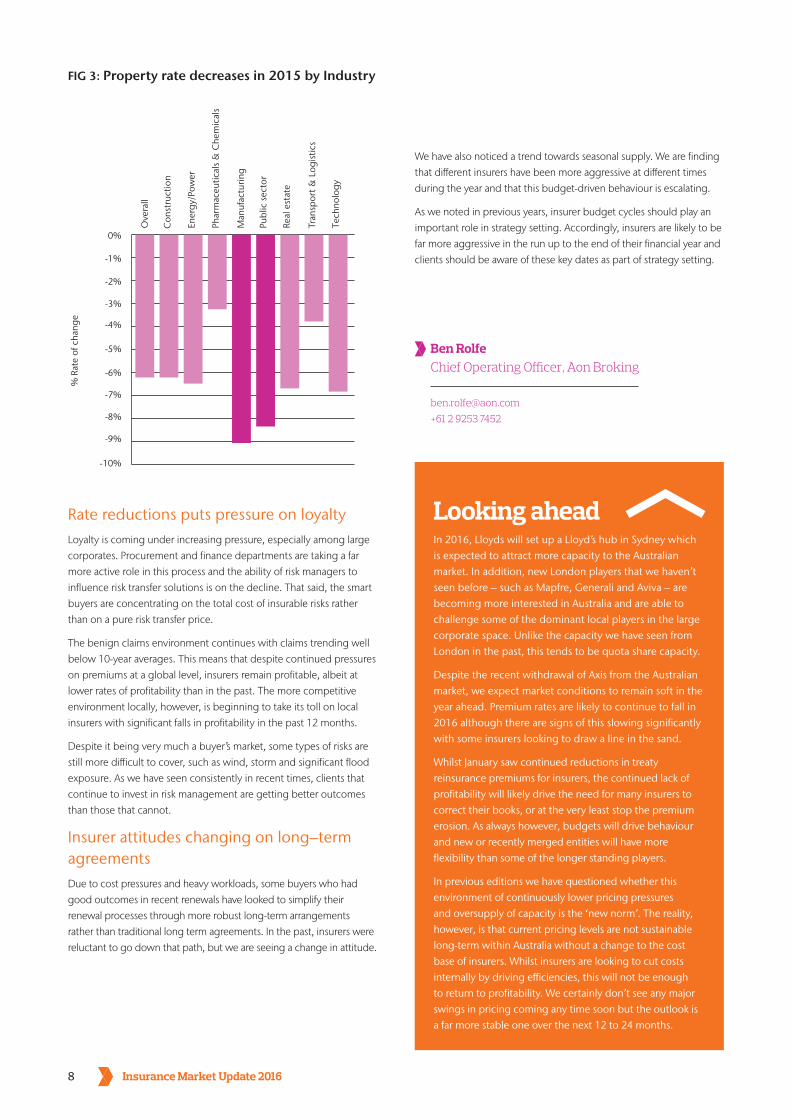
A look at the market from an industry perspective shows a trend of falling rates across the board. Industries such as Manufacturing and the Public Sector have benefited most from reviewing their property insurance outlay (see Fig 3 overleaf).
8 Insurance Market Update 2016
Rate reductions puts pressure on loyaltyLoyalty is coming under increasing pressure, especially among large corporates. Procurement and finance departments are taking a far more active role in this process and the ability of risk managers to influence risk transfer solutions is on the decline. That said, the smart buyers are concentrating on the total cost of insurable risks rather than on a pure risk transfer price.
The benign claims environment continues with claims trending well below 10-year averages. This means that despite continued pressures on premiums at a global level, insurers remain profitable, albeit at lower rates of profitability than in the past. The more competitive environment locally, however, is beginning to take its toll on local insurers with significant falls in profitability in the past 12 months.
Despite it being very much a buyer’s market, some types of risks are still more difficult to cover, such as wind, storm and significant flood exposure. As we have seen consistently in recent times, clients that continue to invest in risk management are getting better outcomes than those that cannot.
Insurer attitudes changing on long–term agreementsDue to cost pressures and heavy workloads, some buyers who had good outcomes in recent renewals have looked to simplify their renewal processes through more robust long-term arrangements rather than traditional long term agreements. In the past, insurers were reluctant to go down that path, but we are seeing a change in attitude.
We have also noticed a trend towards seasonal supply. We are finding that different insurers have been more aggressive at different times during the year and that this budget-driven behaviour is escalating.
As we noted in previous years, insurer budget cycles should play an important role in strategy setting. Accordingly, insurers are likely to be far more aggressive in the run up to the end of their financial year and clients should be aware of these key dates as part of strategy setting.
Looking aheadIn 2016, Lloyds will set up a Lloyd’s hub in Sydney which is expected to attract more capacity to the Australian market. In addition, new London players that we haven’t seen before – such as Mapfre, Generali and Aviva – are becoming more interested in Australia and are able to challenge some of the dominant local players in the large corporate space. Unlike the capacity we have seen from London in the past, this tends to be quota share capacity.
Despite the recent withdrawal of Axis from the Australian market, we expect market conditions to remain soft in the year ahead. Premium rates are likely to continue to fall in 2016 although there are signs of this slowing significantly with some insurers looking to draw a line in the sand.
Whilst January saw continued reductions in treaty reinsurance premiums for insurers, the continued lack of profitability will likely drive the need for many insurers to correct their books, or at the very least stop the premium erosion. As always however, budgets will drive behaviour and new or recently merged entities will have more flexibility than some of the longer standing players.
In previous editions we have questioned whether this environment of continuously lower pricing pressures and oversupply of capacity is the ‘new norm’. The reality, however, is that current pricing levels are not sustainable long-term within Australia without a change to the cost base of insurers. Whilst insurers are looking to cut costs internally by driving efficiencies, this will not be enough to return to profitability. We certainly don’t see any major swings in pricing coming any time soon but the outlook is a far more stable one over the next 12 to 24 months.
FIG 3: Property rate decreases in 2015 by Industry
Con
stru
ctio
n
Ener
gy/P
ower
Phar
mac
eutic
als
& C
hem
ical
s
Man
ufac
turin
g
Publ
ic s
ecto
r
Real
est
ate
Tran
spor
t & L
ogis
tics
Ove
rall
0%
-1%
-2%
-3%
-4%
-5%
-6%
-7%
-8%
-9%
-10%
% R
ate
of c
hang
e
Tech
nolo
gy
Ben RolfeChief Operating Officer, Aon Broking
[email protected] +61 2 9253 7452
9Insurance Market Update 2016
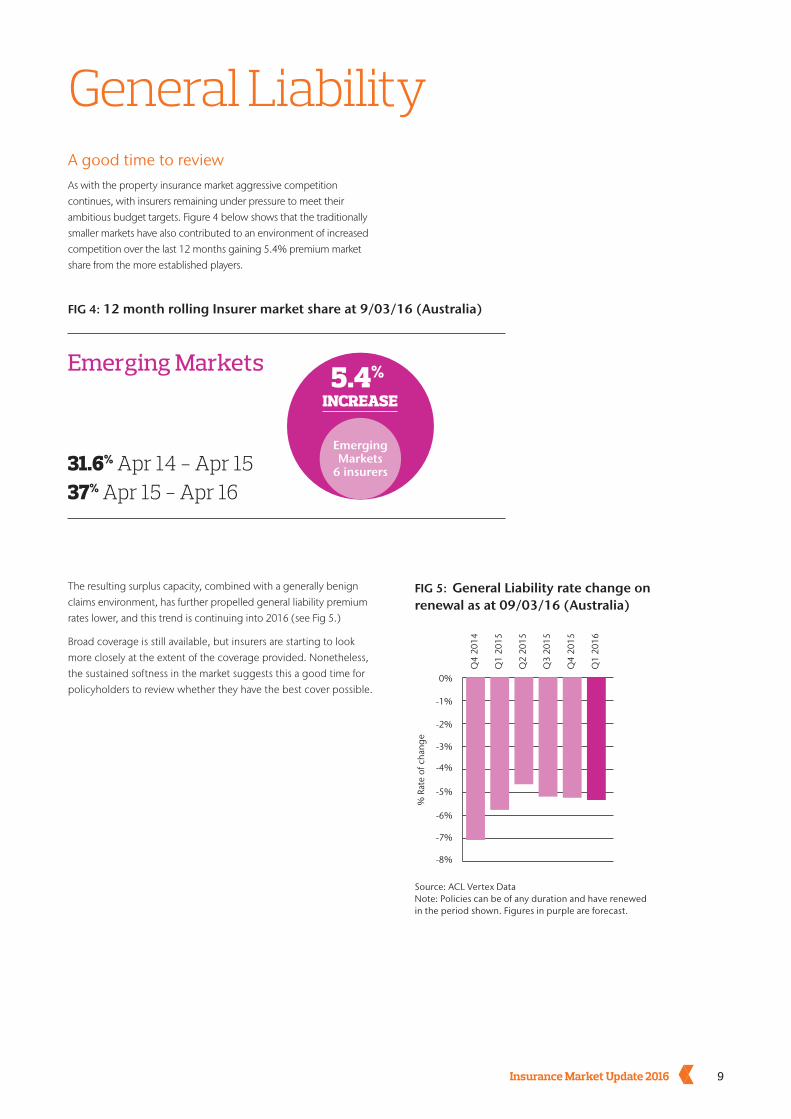
General LiabilityA good time to reviewAs with the property insurance market aggressive competition continues, with insurers remaining under pressure to meet their ambitious budget targets. Figure 4 below shows that the traditionally smaller markets have also contributed to an environment of increased competition over the last 12 months gaining 5.4% premium market share from the more established players.
The resulting surplus capacity, combined with a generally benign claims environment, has further propelled general liability premium rates lower, and this trend is continuing into 2016 (see Fig 5.)
Broad coverage is still available, but insurers are starting to look more closely at the extent of the coverage provided. Nonetheless, the sustained softness in the market suggests this a good time for policyholders to review whether they have the best cover possible.
FIG 4: 12 month rolling Insurer market share at 9/03/16 (Australia)
31.6% Apr 14 - Apr 1537% Apr 15 - Apr 16
FIG 5: General Liability rate change on renewal as at 09/03/16 (Australia)
0%
-1%
-2%
-3%
-4%
-5%
-6%
-7%
-8%
% R
ate
of c
hang
e
Q4
2014
Q1
2015
Q2
2015
Q3
2015
Q4
2015
Q1
2016
Source: ACL Vertex DataNote: Policies can be of any duration and have renewed in the period shown. Figures in purple are forecast.
Emerging Markets
6 insurers
5.4% INCREASE
Emerging Markets
10 Insurance Market Update 2016
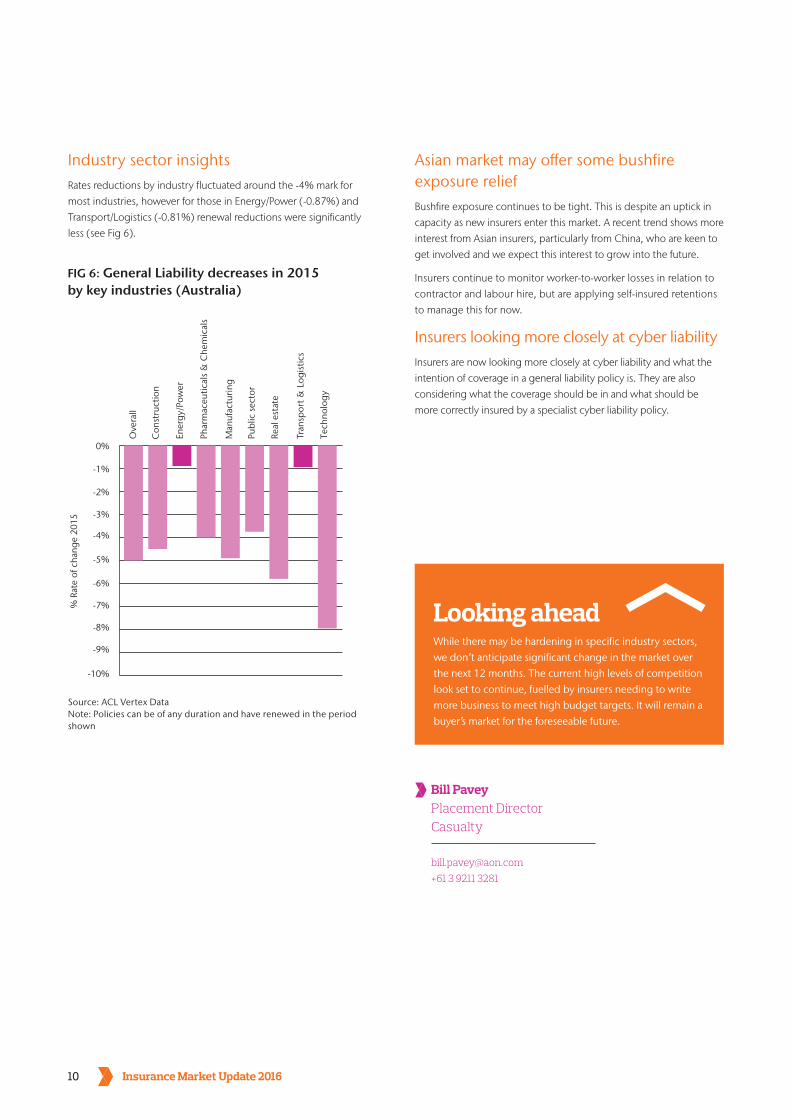
Industry sector insightsRates reductions by industry fluctuated around the -4% mark for most industries, however for those in Energy/Power (-0.87%) and Transport/Logistics (-0.81%) renewal reductions were significantly less (see Fig 6).
Asian market may offer some bushfire exposure reliefBushfire exposure continues to be tight. This is despite an uptick in capacity as new insurers enter this market. A recent trend shows more interest from Asian insurers, particularly from China, who are keen to get involved and we expect this interest to grow into the future.
Insurers continue to monitor worker-to-worker losses in relation to contractor and labour hire, but are applying self-insured retentions to manage this for now.
Insurers looking more closely at cyber liabilityInsurers are now looking more closely at cyber liability and what the intention of coverage in a general liability policy is. They are also considering what the coverage should be in and what should be more correctly insured by a specialist cyber liability policy.
Looking aheadWhile there may be hardening in specific industry sectors, we don’t anticipate significant change in the market over the next 12 months. The current high levels of competition look set to continue, fuelled by insurers needing to write more business to meet high budget targets. It will remain a buyer’s market for the foreseeable future.
Bill PaveyPlacement Director Casualty
[email protected] +61 3 9211 3281
FIG 6: General Liability decreases in 2015 by key industries (Australia)
Con
stru
ctio
n
Ener
gy/P
ower
Phar
mac
eutic
als
& C
hem
ical
s
Man
ufac
turin
g
Publ
ic s
ecto
r
Real
est
ate
Tran
spor
t & L
ogis
tics
Tech
nolo
gy
Ove
rall
0%
-1%
-2%
-3%
-4%
-5%
-6%
-7%
-8%
-9%
-10%
% R
ate
of c
hang
e 20
15
Source: ACL Vertex DataNote: Policies can be of any duration and have renewed in the period shown
11Insurance Market Update 2016
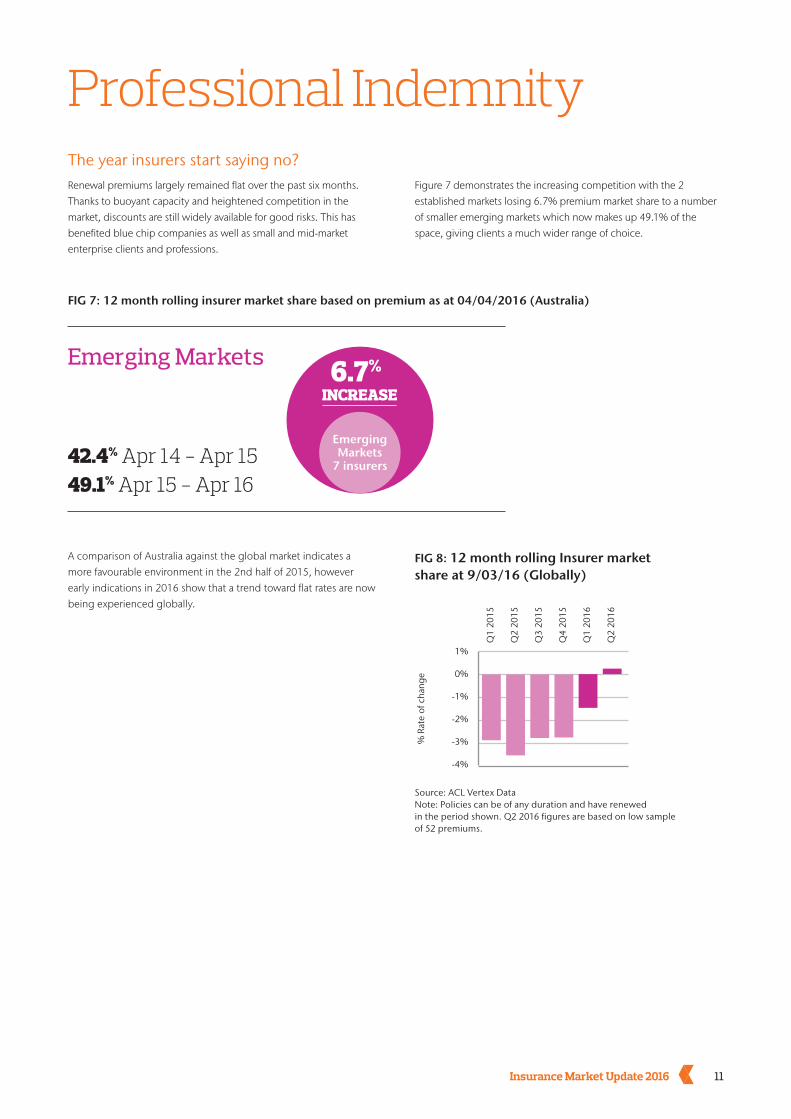
The year insurers start saying no?Renewal premiums largely remained flat over the past six months. Thanks to buoyant capacity and heightened competition in the market, discounts are still widely available for good risks. This has benefited blue chip companies as well as small and mid-market enterprise clients and professions.
Figure 7 demonstrates the increasing competition with the 2 established markets losing 6.7% premium market share to a number of smaller emerging markets which now makes up 49.1% of the space, giving clients a much wider range of choice.
Professional Indemnity
A comparison of Australia against the global market indicates a more favourable environment in the 2nd half of 2015, however early indications in 2016 show that a trend toward flat rates are now being experienced globally.
FIG 7: 12 month rolling insurer market share based on premium as at 04/04/2016 (Australia)
42.4% Apr 14 - Apr 1549.1% Apr 15 - Apr 16
FIG 8: 12 month rolling Insurer market share at 9/03/16 (Globally)
0%
-1%
1%
-2%
-3%
-4%
% R
ate
of c
hang
e
Q1
2015
Q2
2015
Q3
2015
Q4
2015
Q1
2016
Q2
2016
Source: ACL Vertex DataNote: Policies can be of any duration and have renewed in the period shown. Q2 2016 figures are based on low sample of 52 premiums.
Emerging Markets
7 insurers
6.7% INCREASE
Emerging Markets
12 Insurance Market Update 2016
Higher risk clients feeling the pinchWith many insurers suffering significant losses in the past, clients with higher risks or loss histories are finding it harder to get cover, as are professions like financial planning and Industries connected with mining.
As a result, insurers are seeking far more detailed information about clients’ operations and their potential exposures and this is likely to continue.
Infrastructure development in NSW has been a hot spot recently with a jump in the number of contractors looking for cover for various projects around the State.
Global claims on the rise Recent statistics suggest that claims are rising globally. In some cases, insurers have become increasingly reluctant to settle claims. With this in mind, policyholders with any concerns should engage early with their broker to understand potential issues and to put together an effective strategy on how to approach their insurers.
Clients and their insurers face the added expenses and difficulties of being included in law suits following claims irrespective of whether the client’s professional service or their insurances are exposed.
London insurers becoming cautious with capacityWith new insurers still trying to enter the market, capacity remains as high as ever. This competition is creating a best-practice environment with insurers being compelled to provide the best wordings they can to be able to compete.
One key development in the last 6 months (having settled some large losses recently) is London insurers are being more careful about accepting Australian business. Aware of the soft conditions in the market, they will question why any business is being sent to them and not been covered locally.
Looking aheadAll the signs in the Australian market point towards a continuation of flat renewals, with insurers keen to compete for desirable business. However, in a market of excess capacity and soft pricing, major insurers will be looking at their financial lines exposure to assess whether their budgets are realistic. In the next 12 months we will continue to provide commentary around the suggestion that 2016 may be the year that insurers start saying ‘no’ more.
Paul RidingPlacement Manager
[email protected] +61 2 9253 8266
13Insurance Market Update 2016
Directors & OfficersAll trends point to increased claims An abundance of capital in this segment of the market has accelerated competition over the past year. This has led to an average fall of 3.5 per cent in premium pricing in the second half of 2015. The rates applied by insurers to some isolated risks which are viewed as less attractive are rising, but at lower levels than in previous years.
Australia faces significant class action litigationIn recent years, Australia has become the most likely jurisdiction outside of the US in which a corporation will face significant class action litigation. In particular, most shareholder security class actions are settled before they reach the courts because the risks and costs of fighting them are so high. Litigation funders and class action lawyers have become increasingly strategic in their approach and are more likely to target the bigger end of town because of the larger potential payoffs. Shareholder security claims either relate to breach of continuous disclosure obligations or deceptive and misleading conduct or both combined.
In recent years, we’ve seen a large growth in the notifications of claims or regulatory investigations as the regulators become more active in response to criticisms that they don’t have enough bite behind their bark.
Regulators, such as the Australian Securities and Investments Commission (ASIC), have become more targeted in their approach and more successful in their outcomes.
As a result of the strict liability regime in Australia, directors can typically spend at least $1 million in providing their defence in serious workplace health and safety cases – an amount that is especially onerous for directors of small businesses who may not have done anything wrong.
$1 Million Typical directors spend
in providing their defence in workplace health &
safety cases
14 Insurance Market Update 2016
Will cyber claims find their way into the boardroom?Despite the possibility of mandatory breach reporting, Australian boards are still inert when it comes to cyber security with many not understanding the language or the potential risks. Far more needs to be done to educate them on the threat and solutions available. In addition, more diversity in the age of directors could improve the appreciation of these risks.
Claims pool concerns in ‘Side-C’ policies is creating insurer cautionIn late 2015, a major insurer in this space revised their Side C strategy around capacity and price and is now pushing for higher rates.
The profusion of capacity means that more flexible and broader D&O coverage is available for directors’ personal exposure.
However, insurers are viewing ‘Side C’ policies, which cover companies for securities claims and appear as shareholder class actions, more cautiously given that the value of potential claims in this area far often exceeds Australia’s D&O premium pool of around $215 million. Presently, there are six or seven open shareholder securities class actions underway and the potential claims of at least one is larger than the premium pool. In addition, another seven or eight class actions have been touted, but are yet to come to fruition.
$215 Million Australian Premium
Pool
Looking aheadLooking forward, we can expect some further easing on the capacity on Side C, possibly by 10–15 per cent. The market is still over supplied and we may well see additional capital coming in from both traditional sources and alternative providers such as pension funds.
Directors continue to feel the pressures of economic volatility and uncertainty, and this could push up the level of D&O claims in 2016, especially if there are redundancies or if directors are tardy in informing the market about changes.
Directors can also expect to experience more stakeholder activism with considerations like the “two strikes” rule and which has more to do with personal interests rather than criticism of directors’ remuneration. They can also anticipate further growth in regulatory actions.
Two additional key D&O insurers advised in Q1 that they were reducing their appetite in the area of ‘Side-C’.
Paul SmythPlacement Director Financial Services
[email protected] +61 3 9211 3123
15Insurance Market Update 2016
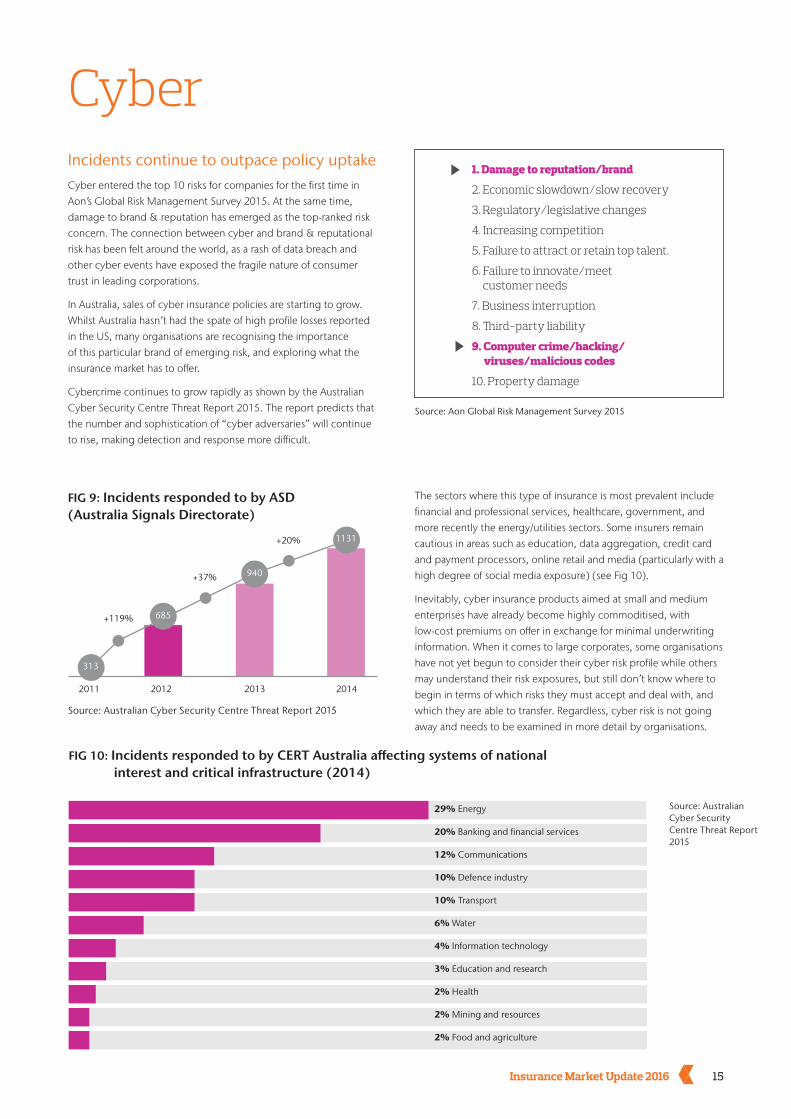
CyberIncidents continue to outpace policy uptakeCyber entered the top 10 risks for companies for the first time in Aon’s Global Risk Management Survey 2015. At the same time, damage to brand & reputation has emerged as the top-ranked risk concern. The connection between cyber and brand & reputational risk has been felt around the world, as a rash of data breach and other cyber events have exposed the fragile nature of consumer trust in leading corporations.
In Australia, sales of cyber insurance policies are starting to grow. Whilst Australia hasn’t had the spate of high profile losses reported in the US, many organisations are recognising the importance of this particular brand of emerging risk, and exploring what the insurance market has to offer.
Cybercrime continues to grow rapidly as shown by the Australian Cyber Security Centre Threat Report 2015. The report predicts that the number and sophistication of “cyber adversaries” will continue to rise, making detection and response more difficult.
Source: Aon Global Risk Management Survey 2015
1. Damage to reputation/brand
2. Economic slowdown/slow recovery
3. Regulatory/legislative changes
4. Increasing competition
5. Failure to attract or retain top talent.
6. Failure to innovate/meet customer needs
7. Business interruption
8. Third-party liability
9. Computer crime/hacking/ viruses/malicious codes
10. Property damage
The sectors where this type of insurance is most prevalent include financial and professional services, healthcare, government, and more recently the energy/utilities sectors. Some insurers remain cautious in areas such as education, data aggregation, credit card and payment processors, online retail and media (particularly with a high degree of social media exposure) (see Fig 10).
Inevitably, cyber insurance products aimed at small and medium enterprises have already become highly commoditised, with low-cost premiums on offer in exchange for minimal underwriting information. When it comes to large corporates, some organisations have not yet begun to consider their cyber risk profile while others may understand their risk exposures, but still don’t know where to begin in terms of which risks they must accept and deal with, and which they are able to transfer. Regardless, cyber risk is not going away and needs to be examined in more detail by organisations.
Source: Australian Cyber Security Centre Threat Report 2015
313
685
940
1131
2011 2012 2013 2014
+20%
+37%
+119%
FIG 9: Incidents responded to by ASD (Australia Signals Directorate)
Source: Australian Cyber Security Centre Threat Report 2015
29% Energy
20% Banking and financial services
12% Communications
10% Defence industry
10% Transport
6% Water
4% Information technology
3% Education and research
2% Health
2% Mining and resources
2% Food and agriculture
FIG 10: Incidents responded to by CERT Australia affecting systems of national interest and critical infrastructure (2014)
16 Insurance Market Update 2016
Pricing effectively proving difficultIn terms of pricing, underwriters are still struggling to price cyber risk effectively. Those markets with US counterparts baulk at the price points expected locally. That said, new buyers to the market are benefiting from the inevitable scenario whereby the local underwriters wish to build market share in this relatively new and growing class of business.
Renewal pricing has been flat without any significant reductions or increases. If anything, there is more focus in the market to maintain and hold those premiums and grow new premiums.
Significant capacity availableDespite a steady stream of global headlines and warnings about cyber risks, cyber insurance premium receipts in Australia are estimated to double to around $30million – $40million this year. However, that’s a small pool when compared to other categories of insurance. In addition, at $40million, that may not represent one medium-sized cyber event.
For the right risks, the Australian market can comfortably cope with offering capacity of $50 – $75million, before requiring offshore capacity (typically London). We see evidence that certain London markets want to be more prevalent here, either by backing local market participants, or, entering the market directly where they have the capacity to respond to a significant increase in demand.
There have been some claims, but insurers need to start seeing volume expand before they broaden the coverage in this largely untested market.
The quality insurers are, responsibly, focusing on securing quality consultants to be part of their response panels and on educating potential buyers on the value of this type of cover.
Stephen TrickeyDirector, Sales & Growth Strategies
[email protected] +61 2 9253 7577
Looking aheadCyber criminals are becoming more sophisticated and the experts expect the number and potential severity of attacks to increase. The government is taking this risk seriously, having now formed the Australian Cyber Security Centre. So too are regulators, such as the Australian Securities and Investments Commission (ASIC), to help companies improve their cyber resilience.
According to the Aon’s US Cyber Expert 2015 report, “In the US, the average large data breach is being met in the market by a drop in a publicly traded company’s share price by anywhere between 7.5 per cent and 15 per cent”. Aon US Cyber Team, 2015
Given the rise in class actions in Australia, often backed by litigation funders, and the continuous disclosure obligations of listed companies and their directors, the same pressures are likely to be felt here.
We also anticipate that the imminent passing of mandatory data breach laws will increase the number of incidents reported and heighten awareness about cyber risk detection and crisis management plans.
These trends are likely to move cyber insurance up the list of the top insurances requiring attention and place pressure on directors to make robust decisions. There is a growing feeling amongst certain boards of directors sense that “doing nothing” will have the effect of putting increased pressure on an organisation’s D&O insurance program as a “default”.
We also expect to see cyber insurance being required as part of contractual requirements, particularly in industries which are more exposed, such as IT, infrastructure or payment processes.
17Insurance Market Update 2016
There continues to be a large amount of global capacity in the financial institutions insurance market which is typically translating into cost-effective pricing for policyholders. Pricing levels have remained relatively stable with continued opportunities to leverage reductions, but this generally involves a remarketing exercise and potentially trading off continuity of coverage for a carrier with weaker claims paying willingness.
Broad coverage terms remain available, but require strong negotiation.We continue to advocate the merits in policyholders meeting carriers to articulate the key risk management and compliance procedures within their organisation. This can assist in differentiating the organisation from peers and positively influencing renewal outcomes.
Historically, financial institution clients looked to foster long-term relationships with their carriers, predominantly driven by a more volatile insurance market. Over the past two years however, we have seen pricing become a key decision influencer.
Impact of insurer mergers and withdrawals on capacityThe withdrawal of Axis Specialty from the Australian market at the beginning of October last year is of concern to many of their clients as some may find it more difficult to obtain cover elsewhere on a like-for-like basis. This is particularly prevalent in the financial planning and stockbroking space.
The London insurance market continues to be a good alternative to local carriers with an abundance of available capacity and broadly speaking, an aggressive appetite for Australian business.
Financial Institutions
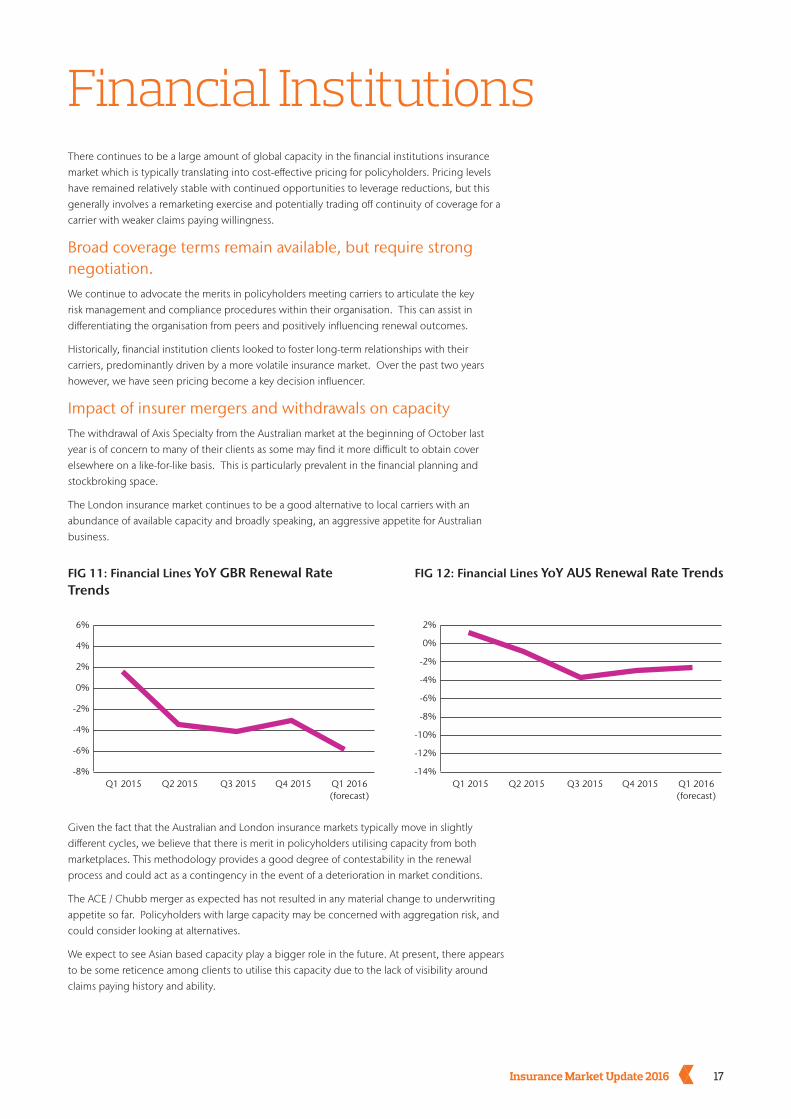
FIG 11: Financial Lines YoY GBR Renewal Rate Trends
FIG 12: Financial Lines YoY AUS Renewal Rate Trends
-8% -14%
-6% -12%
-4% -10%
-2%-8%
0%-6%
2%-4%
4% 0%
-2%
6% 2%
Q1 2015 Q1 2015Q2 2015 Q2 2015Q3 2015 Q3 2015Q4 2015 Q4 2015Q1 2016(forecast)
Q1 2016(forecast)
Given the fact that the Australian and London insurance markets typically move in slightly different cycles, we believe that there is merit in policyholders utilising capacity from both marketplaces. This methodology provides a good degree of contestability in the renewal process and could act as a contingency in the event of a deterioration in market conditions.
The ACE / Chubb merger as expected has not resulted in any material change to underwriting appetite so far. Policyholders with large capacity may be concerned with aggregation risk, and could consider looking at alternatives.
We expect to see Asian based capacity play a bigger role in the future. At present, there appears to be some reticence among clients to utilise this capacity due to the lack of visibility around claims paying history and ability.
18 Insurance Market Update 2016
Looking aheadCurrent benign market conditions should continue although there appears to be limited scope for premium reductions going forward.
With rates plateauing and little room to play on price, insurers need to differentiate themselves through innovation and product.
We will keep a watchful eye on further consolidation in the industry as any major changes might affect this market.
Eden Fletcher National Financial Lines Placement Manager
[email protected] +61 2 9253 7610
Impacts of a tighter regulatory environmentRegulators have focused on creating a more tightly regulated and less distressed financial system since the global financial crisis.
One outcome has been a rise in regulator-driven settlements. This has changed the nature of claims with claims being made without customer instigation.
As a result, policyholders continue to incur costs and expenses in dealing with regulatory inquiries, although these are, to some extent, recoverable under their insurance programs.
The government’s response to the Financial System Inquiry in October last year contained no surprises. That said, the inquiry’s emphasis on “consumer welfare” may translate into additional claims activity.
Cyber and privacy: assess your risk exposureCyber risks, network security and privacy are gaining high visibility at boardroom level. Prior to procuring cover, we encourage policyholders to analyse their key risk exposures in conjunction with our risk consultants. This allows policyholders to understand how such exposures are addressed under their existing insurance arrangements, to ensure that any additional insurance purchase is fit-for-purpose.
In the financial institutions sector, we are seeing a large uptake of breach response cover. Such cover provides policyholders with the ability to access experts such as lawyers, forensic accountants, information technology and public relations consultants etc. to deal with a breach as it occurs which can meaningful contribute to mitigating any resulting compensation claims from customers or clients.
19Insurance Market Update 2016
Workers’ Compensation and Work Health & Safety
National
Comcare
There has been no change in the status of the legislation awaiting scheduling in the Senate. Clients who would like to investigate the feasibility of self-insurance in the federal workers’ compensation scheme will need to meet the current eligibility criteria – the competition test, multi-state presence and size – until such time as this legislation is debated.
Work Health and Safety
In September, Michaelia Cash was appointed as the Minister for Employment as part of Prime Minister Malcolm Turnbull’s new cabinet. She will oversee Comcare, Safe Work Australia and the model WHS laws.
Australian Capital Territory
Workers’ Compensation
The ACT’s Red Tape Reduction Legislation Amendment Bill 2015 has passed Parliament, making technical changes to nearly 80 territory acts and regulations, including the Dangerous Substances Act 2004, Electricity Safety Act 1971, Workers Compensation Act 1951 and Work Health and Safety Act 2011.
This Bill has removed the requirement for ACT employers to notify their workers’ compensation insurer about employee numbers and wages paid every six months. It has been replaced with a provision whereby employers only need to notify their insurer if the total wages paid during the period of insurance increases by more than $500,000. The existing requirement to provide an annual estimate of wages at renewal of a policy and declaration of actual wages at the conclusion of the policy period remain in place.
In addition, workers’ compensation certificates of currency will be valid for up to 12 months. The ACT government expects these changes will remove the need for more than 70,000 administrative transactions annually.
Work Health and Safety
The Red Tape Reduction Legislation Amendment Bill 2015 also amended the WHS Act so that the government can choose to publicise a new Code of Practice on one of its websites instead of in a newspaper.
New South Wales
Workers’ Compensation
The NSW workers’ compensation system has gone through significant reform in 2015 with iCare (formerly WorkCover NSW) undergoing a restructure, introducing a new premium model from 30 June 2015 and relaxing some of the 2012 benefit reforms.
The premium model has been a highly contentious matter since its introduction with a large majority of employers forecasting increases despite positive claims performances in prior years. In response to the market feedback, iCare implemented a freeze on any processing from 30 June 2015 so it could consult with NSW agents on the validation of data, premium calculations and historical performance.
From 14 September 2015, NSW agents were able to commence printing premium notices/calculations for any employer with a policy renewal date on or after 30 June 2015. Aon notes that:
• Policy holders are still required to submit both actual and estimated remuneration in order for their premiums to be calculated. If this has not yet been done, premiums notices will not be forthcoming; and
• Due to the length of the abovementioned freeze, there will be a slight delay in issuing premium notices because of the backlog of policies which remain unprocessed since 30 June 2015.
Aon would like to engage with clients to help them understand the impact of the new premium model and more importantly, identify any opportunities for savings in 2015/16 and beyond.
Work Health and Safety
The State Insurance and Care Governance Act 2015 took effect on 1 September 2015. This law has seen the formation of a new entity, SafeWork NSW, which now has responsibility for WHS regulation.
20 Insurance Market Update 2016
Northern Territory
Workers’ Compensation
The second amendment bill, the Return to Work Legislation Amendment Bill 2015, was tabled in June 2015, passed in August 2015 and came into effect on 1 October 2015.
Employers are advised to familiarise themselves with its key changes which include:
• Defending a mental injury claim based on “reasonable administrative action” will be replaced with “management action”, which is defined in the legislation and will include any communication in connection with identified actions.
• Negotiated settlements with a qualifying period of 104 weeks, mandatory independent legal and financial advice funded by the employer on the request of the worker.
• Settlement of disputed claims (with the same protocol as negotiated settlements), with the settlement not be binding until six months has elapsed.
• Exclusion of journey claims that are not considered to be in the course of employment.
• Improving return to work outcomes through documentation of return to work plans on high risk cases and restrictions on the ability to dismiss injured workers.
While the changes will reduce the cost of claims to the scheme, it may be some time before they lead to lower premiums for employers.
Work Health and Safety
Another jurisdiction has proposed amending its mirror Work Health and Safety Act to reduce union-entry and HSR powers, despite acknowledging that there is “little if any” evidence of these powers being abused.
WorkSafe NT has called for employers and workers to comment on the proposed changes and a consultation regulatory impact statement (RIS) by 26 October 2015.
Queensland
Workers’ Compensation
The Workers’ Compensation and Rehabilitation and Other Legislation Amendment Act 2015 passed through Parliament on 17 September 2015. The Act implements the Queensland government’s election commitments to restore the rights of Queenslanders injured at work.
Employers are advised to familiarise themselves with its key changes which include removing:
• The current limitation on the entitlement to seek damages that requires a worker to have a degree of permanent impairment greater than 5 per cent to access common law for all injuries sustained on or after the Queensland State election (31 January 2015).
• The entitlement that employers have to obtain a copy of a prospective worker’s compensation claims history from the Workers’ Compensation Regulator.
Work Health and Safety
Workplace Health & Safety in Queensland has launched a new online tool which provides employers with information on the effectiveness of their WHS approach as well as insights into the performance of other similar employers.
The Heavy Vehicle National Law Amendment Bill 2015, which passed on 16 September 2015, allows the National Heavy Vehicle Regulator (NHVR) to start approving electronic work diaries (EWDs) and increases some penalties under the national law by more than 200 per cent.
Work Health and Safety laws in Queensland have changed as part of the election commitments made by the Queensland government in its “Improving safety for Queenslanders at work” policy. The government restored elements of the Work Health and Safety Act 2011 (WHS Act) that were changed following a review of the model WHS laws in 2012. Employers are encouraged to familiarise themselves with these amendments that commenced on 22 October 2015.
South Australia
Workers’ Compensation
Outstanding results have been achieved in South Australia following the introduction of significant legislation and service reforms. The financial position of the scheme has improved and a funding ratio of 114 per cent existed at the end of the 2014/2015 financial year. The current average levy rate paid by employers is now 1.95 per cent which is a reduction of 29 per cent on the prior period.
Along with legislative reform which has capped weekly compensation entitlement to a maximum of 104 weeks in most cases, the expanded use of mobile case managers is delivering improved return to work outcomes. These case managers are engaging in face-to-face meetings with employers, workers and treating medical providers to identify suitable duties which are used to formulate the return to work plan. The early intervention strategies are said to be achieving faster, safer and more sustainable return to work outcomes.
The employer transfer freeze remains in place while the benefits of legislation and service reform become embedded in the operations of the scheme.
21Insurance Market Update 2016
Tasmania
Workers’ Compensation
The WorkCover board engaged Finity Consulting to conduct a review of the impact of changes made to the Tasmanian Workers’ Rehabilitation and Compensation Act in 2009. It found they found that the:
• Increase in weekly compensation benefits had translated into a 4 per cent increase in claims costs across the scheme which is consistent with the original modelling.
• The impact of other changes was either negligible or could not be assessed due to insufficient data.
The Tasmanian government has also been in consultation with scheme participants to identify opportunities to reduce red tape. Submissions to this consultation process closed on 15 October and WorkSafe has released a paper detailing the areas for review and potential amendments. These include:
• Licencing provisions for both insurers and self-insurers, including the possible elimination of self-insurance as an option for employers.
• Changing accreditation provisions for medical and rehabilitation providers.
• Requirements for accredited Injury Management Programs, Return to Work Plans and Injury Management Plans.
• Abolition or amendment of the claims excess.
• Removing the requirement for employers with 50 or more workers to have a trained Return to Work Coordinator.
Victoria
Workers’ Compensation
1 September 2015 marked the 30th anniversary of the modern workers’ compensation scheme in Victoria. The scheme maintains a strong and robust financial position. Indeed, WorkSafe’s recently released 2014/15 annual report shows a net profit of $454 million. Significantly, performance from insurance operations, which reflects the underlying performance of the scheme, saw a profit of $211 million which, although below the target of $483 million, remains a positive result. Continuing strong performance in return to work rates are a key feature in the scheme.
Former long serving board member, Paul Barker, has been appointed chair of WorkSafe Victoria.
The Authorised Agent tender process is continuing and no announcements are expected until early 2016.
Work Health and Safety
Victorian employers are being encouraged to use an online self-assessment tool to determine how safe their workplaces really are, as part of a new WorkSafe Victoria awareness campaign.
WorkSafe Victoria has also updated its Injury Hotspots tool. Whereby you can select the industry you operate in and receive information on the most common injuries and safety solutions suggested.
The Victorian Heavy Vehicles Legislation Amendment Bill 2015 passed Parliament on 17 September. This Bill amends the State Road Safety Act 1986 to apply the fatigue-management provisions of Victoria’s Heavy Vehicle National Law Application Act 2013 to light buses (which seat more than 12 adults and have a gross mass of up to 4.5 tonnes) in the same way they apply to heavy buses and trucks.
This will allow police and other authorised officers to direct drivers of light buses to stop working and have a rest if they identify a breach of the national law’s fatigue-related rest and record-keeping requirements.
Western Australia
Workers’ Compensation
WorkCover WA published its annual report in September 2015. The key points are:
• Following government approval for drafting a bill to repeal and replace the Act, Phase 2 of the Legislative Review has now commenced. In 2015/16, a new project, New Act Implementation, will focus on the drafting, consulting and implementing the new Act.
• With the lowest standardised average premium rate in Australia and a strong funding ratio, workers and employers can be assured WA has a scheme that “works for them”. With three quarters of scheme costs supporting injured workers, the state has again achieved a return to work rate above the national average for workers returned to work within seven to nine months of injury.
• The average recommended premium rate has reduced by 30 per cent since 2006/07. High wages growth, improved occupational health and safety performance and strong rates of return for insurers over the past 10 years were the main drivers of these reductions.
The local market continues to soften and there is currently strong competition among insurers in WA for programs that are performing well. QBE has commenced offering the Contractor Waiver of Subrogation endorsement on select risks. This is commonly required by oil and gas contractors and allows QBE to compete with the CGU, GIO & Allianz for accounts where this endorsement is required.
Calum Brenan Placement Manager
[email protected] +61 3 9211 3090
22 Insurance Market Update 2016
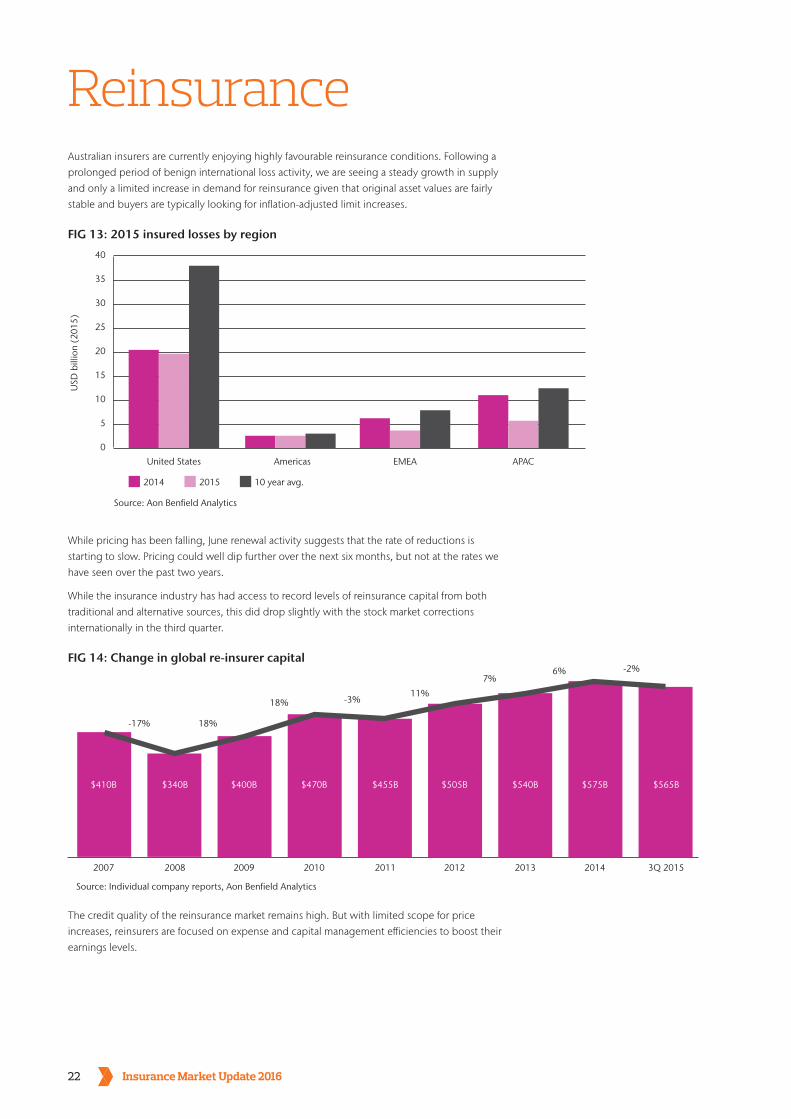
ReinsuranceAustralian insurers are currently enjoying highly favourable reinsurance conditions. Following a prolonged period of benign international loss activity, we are seeing a steady growth in supply and only a limited increase in demand for reinsurance given that original asset values are fairly stable and buyers are typically looking for inflation-adjusted limit increases.
FIG 13: 2015 insured losses by region
FIG 14: Change in global re-insurer capital
40
35
30
25
20
15
10
5
0
United States
2007
Source: Individual company reports, Aon Benfield Analytics
Source: Aon Benfield Analytics
2008 2009 2010 2011 2012 2013 2014 3Q 2015
2014
-17% 18%
18% -3%11%
7%6% -2%
10 year avg.2015
Americas EMEA APAC
USD
bill
ion
(201
5)
$410B $340B $400B $470B $455B $505B $540B $575B $565B
While pricing has been falling, June renewal activity suggests that the rate of reductions is starting to slow. Pricing could well dip further over the next six months, but not at the rates we have seen over the past two years.
While the insurance industry has had access to record levels of reinsurance capital from both traditional and alternative sources, this did drop slightly with the stock market corrections internationally in the third quarter.
The credit quality of the reinsurance market remains high. But with limited scope for price increases, reinsurers are focused on expense and capital management efficiencies to boost their earnings levels.
23Insurance Market Update 2016
John CarrollHead of Broking
[email protected]+61 2 9650 0460
Looking aheadLooking at January 1 renewals, we would expect a moderate price reduction to still come through, given that the current US wind season appears to be fairly benign.
More merger and acquisition activity can be expected, especially among the smaller or mid-tier reinsurers, as they strive to boost their scale.
While some reinsurers might decide not to write business in Australia because the pricing is too low, that would not be enough to change the downward trend on pricing as the capacity involved would be quite small. That said, a major adverse international event could certainly affect pricing.
Insurers have the widest selection of high quality reinsurance on offer at present. The issue for them is to weigh up the cost of reinsurance capital versus the cost of their own capital now.
In the past, insurers have viewed big purchases of reinsurance as being an expense rather than value creating. We are now seeing a growing appetite from reinsurers for more proportional reinsurance.
Our recommendation to clients is to examine how they can unlock the value proposition of this high quality and very cost efficient reinsurance capital.
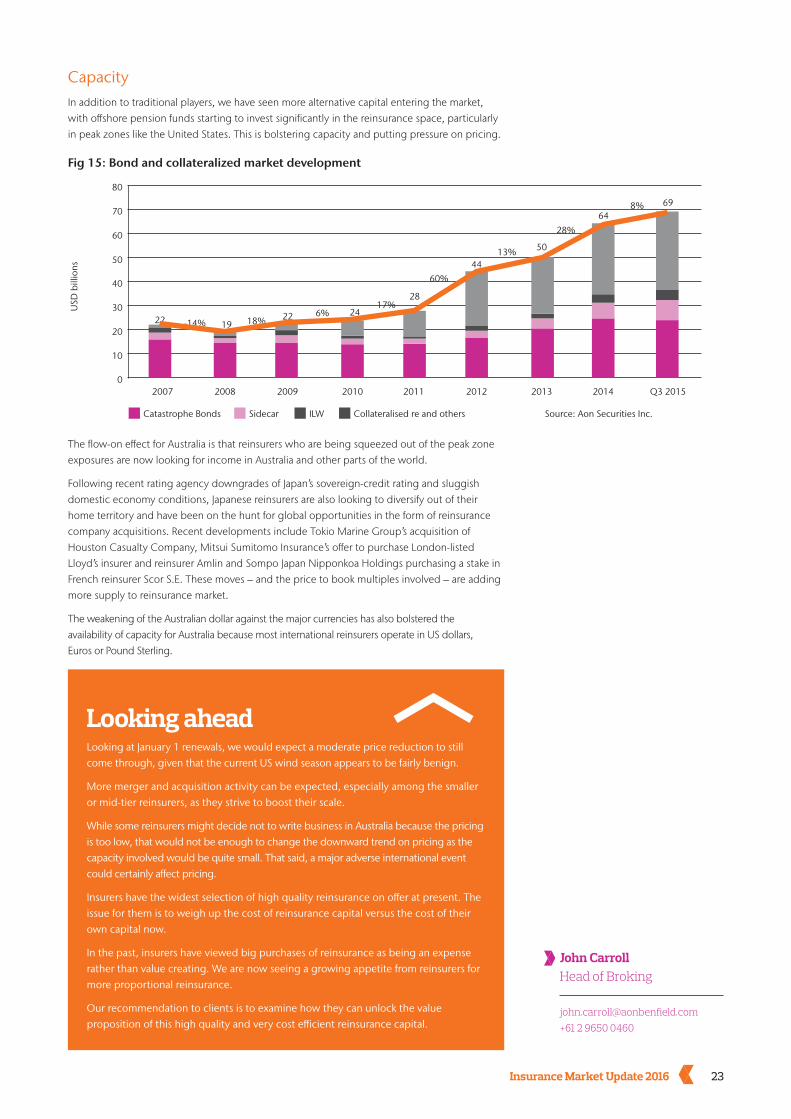
Fig 15: Bond and collateralized market development
0
10
20
30
40
50
60
70
80
2007 2008 2009 2010 2011 2012 2013 2014 Q3 2015
Source: Aon Securities Inc.Catastrophe Bonds
22 -14% 18%6%
17%
60%
13%
28%
8%
1922 24
28
44
50
6469
ILW Collateralised re and othersSidecar
USD
bill
ions
CapacityIn addition to traditional players, we have seen more alternative capital entering the market, with offshore pension funds starting to invest significantly in the reinsurance space, particularly in peak zones like the United States. This is bolstering capacity and putting pressure on pricing.
The flow-on effect for Australia is that reinsurers who are being squeezed out of the peak zone exposures are now looking for income in Australia and other parts of the world.
Following recent rating agency downgrades of Japan’s sovereign-credit rating and sluggish domestic economy conditions, Japanese reinsurers are also looking to diversify out of their home territory and have been on the hunt for global opportunities in the form of reinsurance company acquisitions. Recent developments include Tokio Marine Group’s acquisition of Houston Casualty Company, Mitsui Sumitomo Insurance’s offer to purchase London-listed Lloyd’s insurer and reinsurer Amlin and Sompo Japan Nipponkoa Holdings purchasing a stake in French reinsurer Scor S.E. These moves – and the price to book multiples involved – are adding more supply to reinsurance market.
The weakening of the Australian dollar against the major currencies has also bolstered the availability of capacity for Australia because most international reinsurers operate in US dollars, Euros or Pound Sterling.
24 Insurance Market Update 2016aon.com.auARS0190 0616
DisclaimerGeneral Advice Warning
This information may be regarded as general advice. That is, your personal objectives, needs or financial situations were not taken into account when preparing this information.
Accordingly, you should consider the appropriateness of any general advice we have given you, having regard to your own objectives, financial situation and needs, before acting on it. Where the information relates to a particular financial product, you should obtain and consider the relevant product disclosure statement before making any decision to purchase that financial product.
No Warranty
We make no representations or any warranty of any kind whatsoever (expresses or implied) regarding the content of this information or its suitability or fitness for any purpose.
Financial and Legal Advice Disclaimer
This information is intended to provide general insurance related information only. It is not intended to be comprehensive, nor does it, or should it (under any circumstances) be construed as constituting legal or financial advice. You should seek independent legal or other professional advice before acting or relying on any of the content of this information.
All references to reported past performance is not an indication of future performance.
Exclusion of Liability
You agree that we (Aon) will not be responsible for any loss, damage, costs or expense you or anyone else incurs in reliance on or use of any information contained in this information/presentation/report.
© 2016 Aon Corporation Australia Limited ABN 58 004 756 772
Picture: Aon Global Broking Centre,