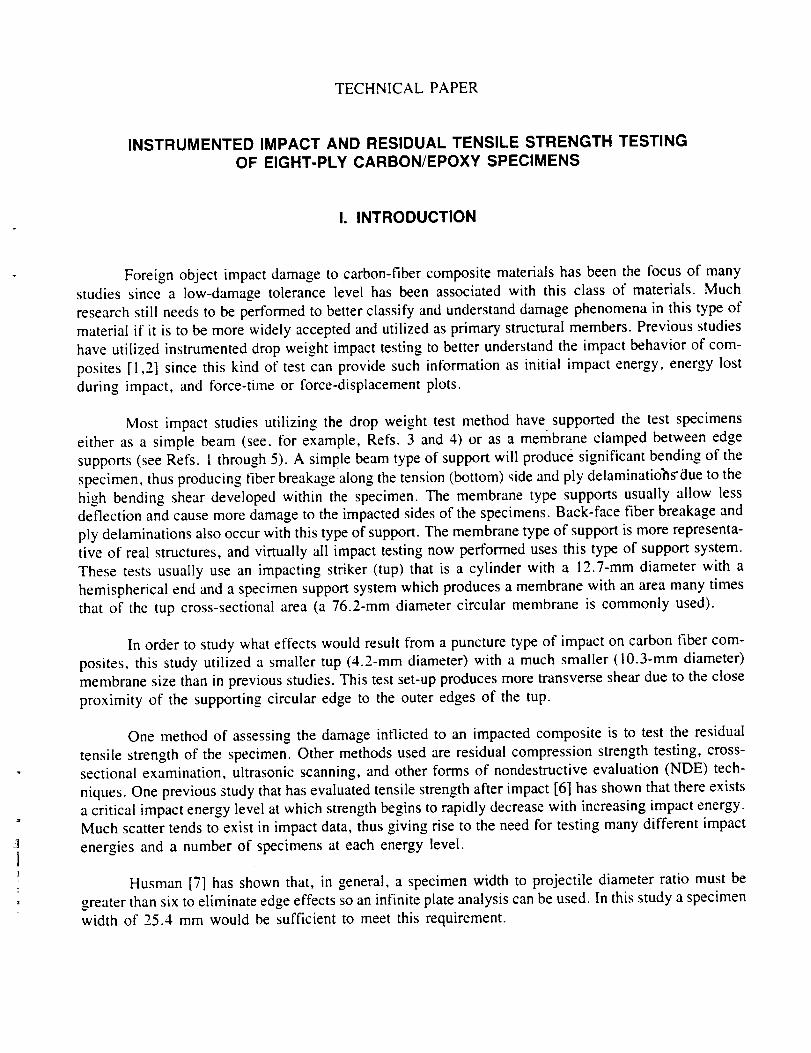
instrumented impact and - nasa · instrumented impact apparatus used ... most impact studies...
TRANSCRIPT
NASA- Technical
Paper2981 -_
January 1990
..... Instrumented
Residual Tensile Strength
Testing of Eight-Ply,--_,--7 _/_ -- _. - ....
= "_ _ _-'_: Carbon/Epoxy Specimens
R_S!OLIAL TENS L r STRcNGT_ reSTING OP
., EIGHT-PLy CARPON EOPOXY SPECIMENS (NASA)
43 p C_CL
Impact and
https://ntrs.nasa.gov/search.jsp?R=19900006691 2018-09-07T19:30:58+00:00Z

_ __ I_I m__R _ •
L_ • r
l
kI___ ___ ........ • i i • v _
m_
i
• E
m_
NASATechnical
Paper2981
1990
ru/ ANational Aeronautics andSpace Administration
Office of Management
Scientific and TechnicalInformation Division
Instrumented Impact and
Residual Tensile Strength
Testing of Eight-Ply
Carbon/Epoxy Specimens
A. T. Nettles
George C Marshall Space Flight Center
Marshall Space Flight Center, Alabama

ACKNOWLEDGMENTS
The author would Iike to acknowledge the technical support of Mr. Frank E. Ledbetter, without
whose knowledge of the employed equipment this project could not have been performed. Thanks are
also extended to Dr. Jerry Patterson and Dr. Dennis Tucker for their support throughout this study. This
final report was completed with the help of Andrew Hodge.
TABLE OF CONTENTS
I. INTRODUCTION ........ . ........................................................................
II. DESCRIPTION .........................................................................................
A. Materials and Test Methods .......................................................................
1. Material ..........................................................................................
2. Impact Testing ....................................................................................
3. Tensile Testing ..................................................................................
B. Impact Test Results and Discussion ..............................................................
!. Force-Time Plots From Impact Tests .........................................................
2. Maximum Force Versus Impact Energy Plots ...............................................
3. Absorbed Energy Data .........................................................................
4. Visual Surface Damage ........................................................................
5. Cross-Sectional Visual Examination .........................................................
C. Residual Strength Testing ..........................................................................
I. Residual Strength Versus Impact Energy Plots .............................................
2. Comparisons of Residual Strength Plots .....................................................
[II. CONCLUSIONS ........................................................................................
APPENDIX A - Maximum Force of Impact Versus Impact Energy Plots ..............................
APPENDIX B - Derivation of Relationship Between Load and Impact Energy .......................
APPENDIX C - Energy Lost During Impact Versus Energy of Impact .................................
APPENDIX D - Residual Tensile Strength Versus Energy of Impact ...................................
REFERENCES ..................................................................................................
Page
2
2
2
2
6
6
6
6
9
I0
I0
10
10
14
17
23
27
33
39
°,°
III
LIST OF ILLUSTRATIONS
Figure
1.
2.
3.
4.
5.
6.
7.
8.
9.
10.
11.
12.
13.
14.
15.
Title Page
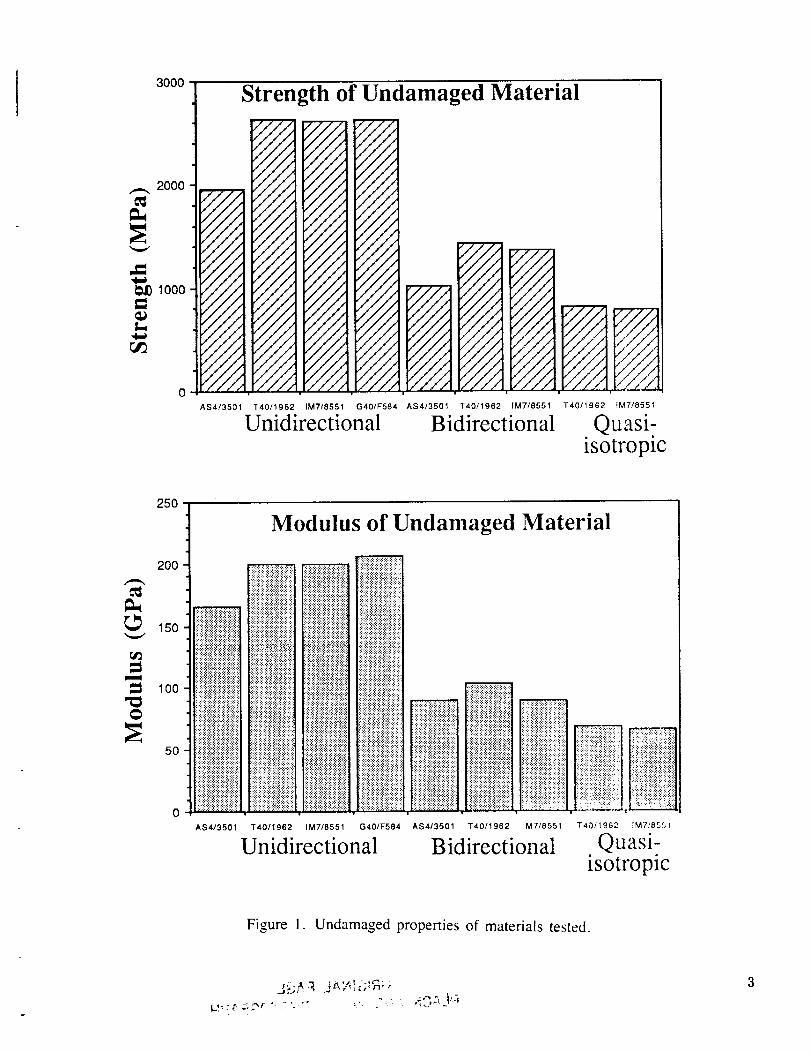
Undamaged properties of materials tested ....................................................... 3
Instrumented impact apparatus used .............................................................. 4
Method of clamping specimens .................................................................... 5
Side view of clamping mechanism ..................................................... 5
Instrumented impact output showing little damage ............................................. 7
Instrumented impact output showing large damage ..................................... 7
Damage mechanisms for unidirectional and bidirectional samples ........................... 8
Typical top surface damage to impacted specimens ............................................ 9
Typical back surface damage to impacted specimens .......................................... 9
Cross-sectional 16X magnified view of AS4/3501 bidirectional specimen
impacted at 0.80 J .., ................................................................................ !1
Cross-sectional 16X magnified view of AS4/3501 bidirectional specimen
impacted at 1.13 J ................................................................................... ! 1
Cross-sectional 16X magnified view of AS4/3501 bidirectional specimen
impacted at 1.32J ................................................................................... 12
Cross-sectional 16X magnified view of AS4/3501 bidirectional specimen
impacted at 1.76 J ................................................................................... 12
Residual strength versus impact energy for bidirectional samples ............................ 13
Residual strength versus impact energy for unidirectional samples .......................... 13
iv
TECHNICAL PAPER
INSTRUMENTED IMPACT AND RESIDUAL TENSILE STRENGTH TESTING
OF EIGHT-PLY CARBON/EPOXY SPECIMENS
I. INTRODUCTION
Foreign object impact damage to carbon-fiber composite materials has been the focus of many
studies since a low-damage tolerance level has been associated with this class of materials. Much
research still needs to be performed to better classify and understand damage phenomena in this type of
material if it is to be more widely accepted and utilized as primary structural members. Previous studies
have utilized instrumented drop weight impact testing to better understand the impact behavior of com-
posites [1,2] since this kind of test can provide such information as initial impact energy, energy lost
during impact, and force-time or force-displacement plots.
Most impact studies utilizing the drop weight test method have supported the test specimens
either as a simple beam (see, for example, Refs. 3 and 4) or as a membrane clamped between edge
supports (see Refs. 1 through 5). A simple beam type of support will produce significant bending of the
specimen, thus producing fiber breakage along the tension (bottom) side and ply delaminatio_s'due to the
high bending shear developed within the specimen. The membrane type supports usually allow lessdeflection and cause more damage to the impacted sides of the specimens. Back-face fiber breakage and
ply delaminations also occur with this type of support. The membrane type of support is more representa-tive of real structures, and virtually all impact testing now performed uses this type of support system.
These tests usually use an impacting striker (tup) that is a cylinder with a 12.7-ram diameter with a
hemispherical end and a specimen support system which produces a membrane with an area many times
that of the tup cross-sectional area (a 76.2-mm diameter circular membrane is commonly used).
In order to study what effects would result from a puncture type of impact on carbon fiber com-
posites, this study utilized a smaller tup (4.2-mm diameter) with a much smaller (lO.3-mm diameter)
membrane size than in previous studies. This test set-up produces more transverse shear due to the close
proximity of the supporting circular edge to the outer edges of the tup.
One method of assessing the damage inflicted to an impacted composite is to test the residual
tensile strength of the specimen. Other methods used are residual compression strength testing, cross-
sectional examination, ultrasonic scanning, and other forms of nondestructive evaluation (NDE) tech-
niques. One previous study that has evaluated tensile strength after impact [6] has shown that there exists
a critical impact energy level at which strength begins to rapidly decrease with increasing impact energy.
Much scatter tends to exist in impact data, thus giving rise to the need for testing many different impact
energies and a number of specimens at each energy level.
Husman [7] has shown that, in general, a specimen width to projectile diameter ratio must be
greater than six to eliminate edge effects so an infinite plate analysis can be used. In this study a specimen
width of 25.4 mm would be sufficient to meet this requirement.
Thecurrentresearchhadthefollowingobjectives:to examinethetrendof residualtensilestrengthversusimpactenergyfor apuncturetypeof damage,to seehowdifferentcarbonfiber compositesystemswould respondto this typeof damage,to examinethreedifferentmateriallay-upsfor comparisons,andto determinetheusefulnessof instrumentedimpacttestingfor interpretingthedamageinflicted uponthespecimen.
II. DESCRIPTION
A. Materials and Test Methods
1. Material. A total of tour different prepreg systems were used. Two of the prepregs were
AS4/3501 and IM7/8551, supplied by Hercules Incorporated, with the other two being G40/F584,
supplied by Hexcel, and T40/1962, supplied by Amoco Performance Products. All of the materials, with
the exception of the AS4/3501, were claimed to have superior impact resistance. Ultimate tensile
strength and modulus data for the material systems used are given in Figure i.
Three types of lay-up configurations were used; unidirectional (0)8, bidirectional (0/90)2s, and
quasi-isotropic (0, + 45,-45,90)s, all being of eight plies. Panels were formed and cured according to the
suppliers' recommendations. Measurements of the cured panels showed all had thicknesses between 10.4and II.9 ram.
Specimens of dimension 2.54 x 25.4 cm were cut from the panels along the direction of the outer
fibers (i.e., the outer fibers ran lengthwise down the strips). The specimens were then end tabbed for
tensile testing.
Due to a limited amount of material available for this study, only a unidirectional lay-up was used
for the G40/F584 and unidirectional and bidirectional lay-ups for the AS4/3501.
impact
!.5 kg
2. Impact Testing. Specimens were impacted using a TMI 43-21 drop weight instrumented
tester (Fig. 2) with data being acquired with a Dynatup 730 system. The impacting head weighed
and had a hemispherically ended tup with a diameter of 4.2 mm.
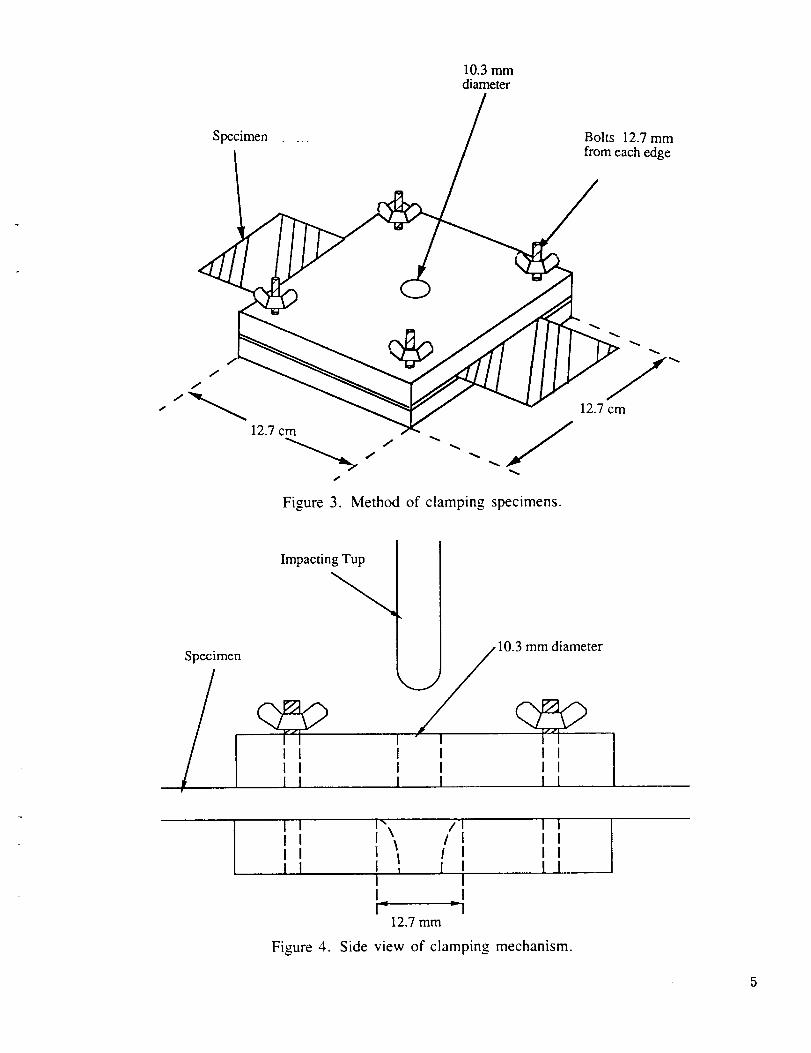
The specimens were clamped in place between two aluminum plates, as shown in Figure 3. A
hole of 10.3-ram diameter was present in the center of each plate to allow the tup to pass through. To
avoid having the edge of the bottom hole cutting the fibers upon impact, the hole was chamfered to 12.7
mm in diameter, as shown in Figure 4. A bubble level capable of measuring levelness in 360 ° was placed
on the top plate to assure an even clamp. The specimens were aligned so as to be impacted at their
centers. Impact energy was varied by changing the drop height, with at least three specimens being
impacted at each drop height.
3. Tensile Testing. Tensile testing was conducted on an Instron 1125 testing machine at a
crosshead speed of 2.54 mm/min. All impacted and some undamaged specimens of each type of material
were tested for tensile strength.
3000
Strength of Undamaged Material
,_,_2000
,.t=
OlD 1000
////J////////
////
////
////
////
////JI///A////A
"///A_///AFfiia
////////////////////
////
////
////
////
////
////
////
////
////
////
////
////////////////////
////
////I
////I
II/A
</A///A///A11111
JfJJl
///AJfJ_
- = = = =_JJ_
f f J f !
///A
_JJl
////
///.1"
////1
////1
.I///[
,,///.,,.1
////_
Y/A////i
,.. .// j
.////
,+"/.,"I
I//I
i///f///
_.- f / j
7"27
///
///
///
///
AS4/3501 T4011962 [M7/8551 G40/F584 AS4/3501 T40t1962 [M7/8551 T40/1962 iM7/8551
Unidirectional Bidirectional Quasi-isotropic
25O
c#3
Modulus of Undamaged Material
200 ................ ...,.,...,.,.....,...,. ,:,:.:.:.:.:.:.:.,.,:.:,:+:+:., ,..,.,.,.,.,.,.,.,.,.,., ,.,.,,,,-.w,,,,,,,,,,,,,,,,, ,., • ,,,,,,,,,,,,,,,,,,,:,,,• ....,,...,.....,.,.... :.:.:.:.:.:.:.:.:.:.:.:.:+:.:. :::::::::::::::::::::::::::::::
::__:_:_:_:_:_:_:_:_:_:_:_!i!::i::!::iii::i:,i::_ii_::i::!i_::i)i===========================:::::::::::::::::::::::::::::: i:i:i:i:i:i:i:i:i:i:i:i:i:i:!:!: ...............:?:i:_:_:i:_:_:_:_:_:_:_:i:_:i :::::::::::::::::::::::::::::::: ...............
,,.,..,.....,............,... :.:,:.:.:.:.:.:.:.:.:.:.:.:,:,:, • ........-........• .......:!:i:!:_:i:i'.."._:i'.!:)i:}:!:l :?!:!:!:!:!:!:!:!:!:!:!:!:!:! :i:i:i:i:i:i:i:i:i:i:i:i:i:i:i:i ? ! !!!!?!!!!!!!!
:,_:.:,:,:.:,:,:.:,:,:.:,:.:,l150 >:.:.:.:.:.:.:.:.:.:.:.:.:.:,:::.:::.,.::.::.:.::...::::::::::::::::::::::::::::::::i_ili_ili!i;i_i_!i!iiiii!iiiii!i!!i!!i;i;!i?iiiii!i!iii?iiiii :::::::::::::::::::::::::::::::..............................................._i_i_i_i_i_i_i_i_i_i_i_i_i_i_i2i!i_!!ii_!_!i!i!_!i!i!i!i!i!iiii
i!iii!iii!ii!!!!_!!!!!i!!!i!!_i_,i_i!_ili:_ii_i_iiiii!_!_!::!_i_!_::!_!!!!_!i!i?!::i::i_!::i!!::!_i::?::!!i::i::i::i!i::?_i::...................,..,.,.. .:.:.:.:,:.:,:,:.:,:,:,:,:,:,:.:
::::::::::::::::::::::::::::::::::::::::::::::::::i:::,i!iiii!!!::::ii!i::::i::ii::!i::::i:::::::::::::::::::::::::::::::::::::::::::::::::::::::::_:_:_:_:_:_:_:_:_:_:_:_:_:_:_:_:iiiiiiiiiii!iiiiiiiiiiiiiiiiii iiiii!!i!!!!.;,'ii!ili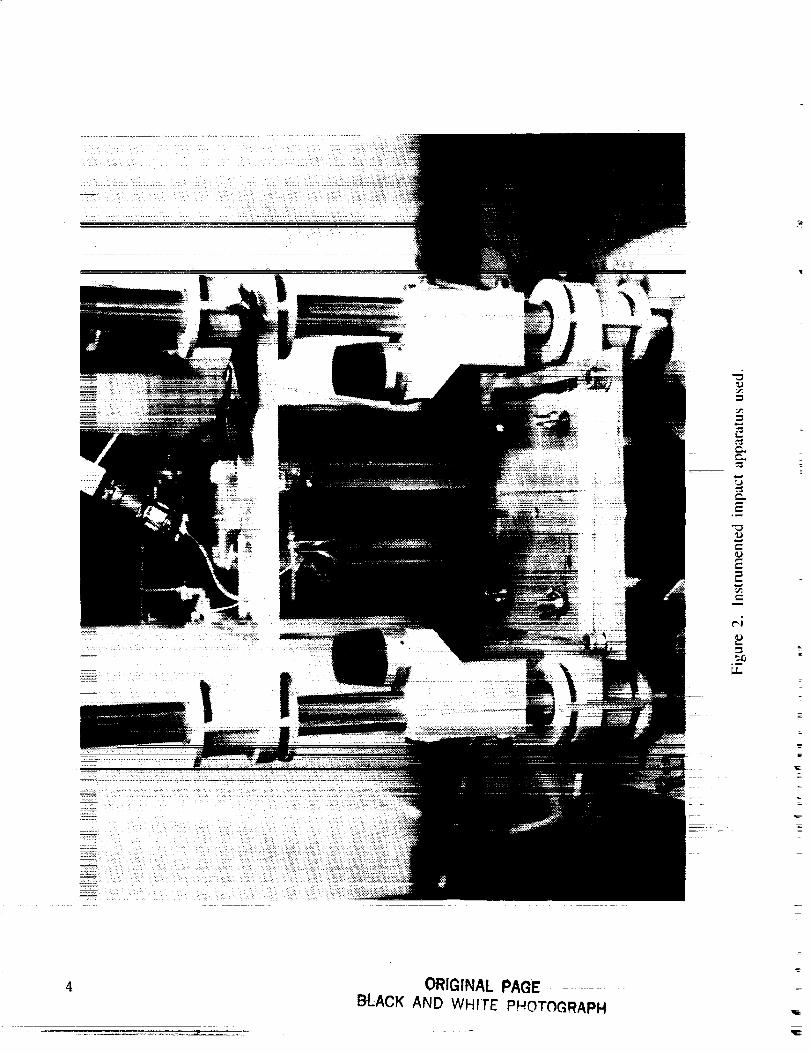
4 ORIGINAL PA(_E
BLACK AND WHITE PHOTOGRAPH
I0.3 mmdiameter
Specimen
(D
12.7 cm SJ
s
Figure 3. Method of clamping specimens.
Bolts 12.7 mm
from each edge
12.7 cm
Specimen
I I II I II 1 I
,,,..._1_ 10.3 mm diameter
I I II I II I I
I I I _"I I I \I I 1XII I I
?1 I I
II
/ I! I
z 1 III
=112.7 mm
I II III
Figure 4. Side view of clamping mechanism.
B. Impact Test Results and Discussion
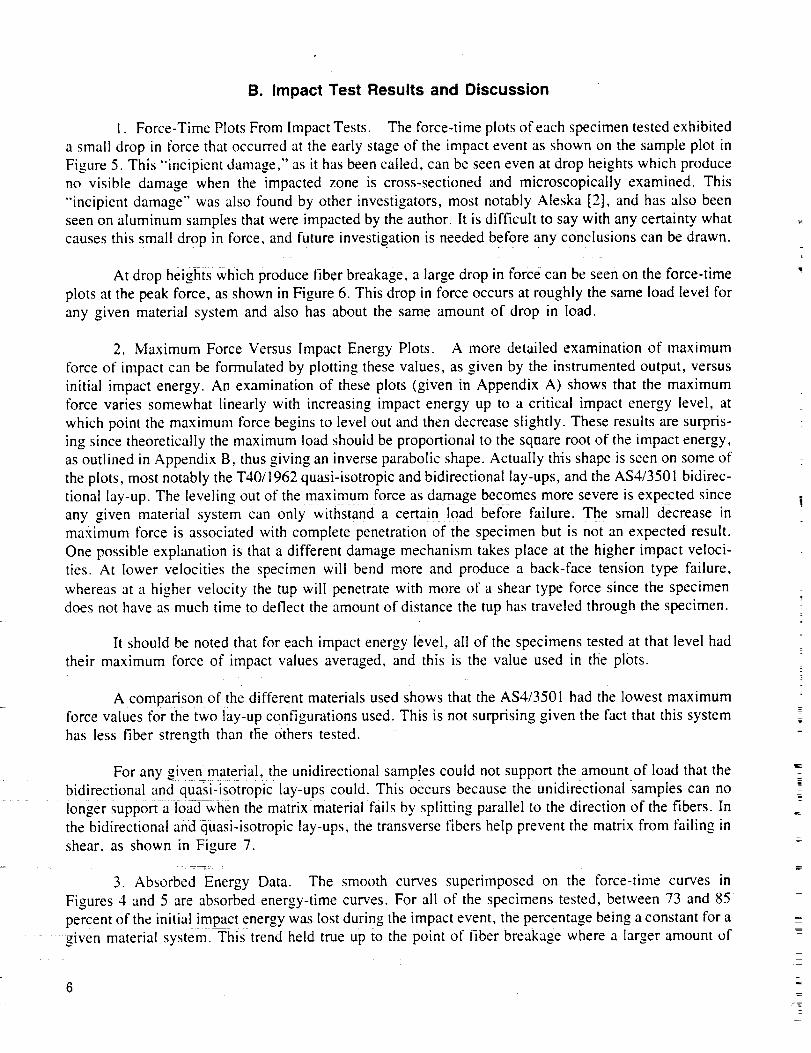
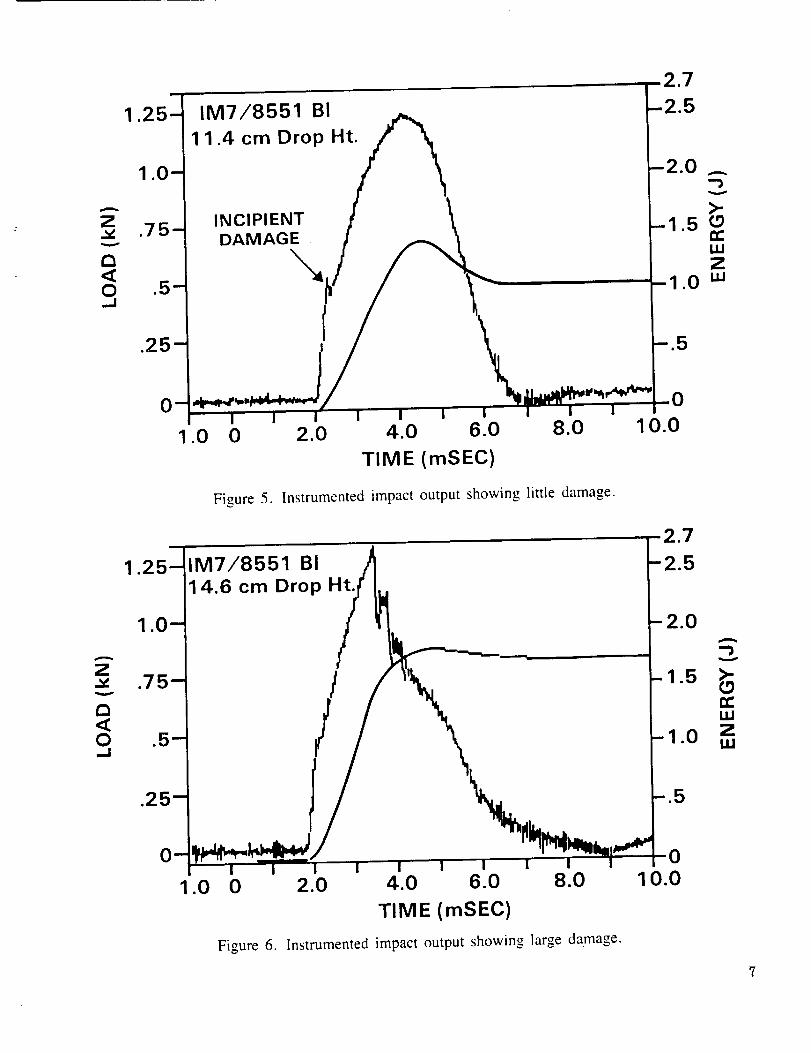
1. Force-Time Plots From Impact Tests. The force-time plots of each specimen tested exhibited
a small drop in force that occurred at the early stage of the impact event as shown on the sample plot in
Figure 5. This "'incipient damage," as it has been called, can be seen even at drop heights which produce
no visible damage when the impacted zone is cross-sectioned and microscopically examined. This
"'incipient damage" was also found by other investigators, most notably Aleska [2], and has also been
seen on aluminum samples that were impacted by the author. It is difficult to say with any certainty what
causes this small drop in force, and future investigation is needed before any conclusions can be drawn.
At drop heights Which produce fiber breakage, a large drop in force can be seen on the force-time
plots at the peak force, as shown in Figure 6. This drop in force occurs at roughly the same load level for
any given material system and also has about the same amount of drop in load.
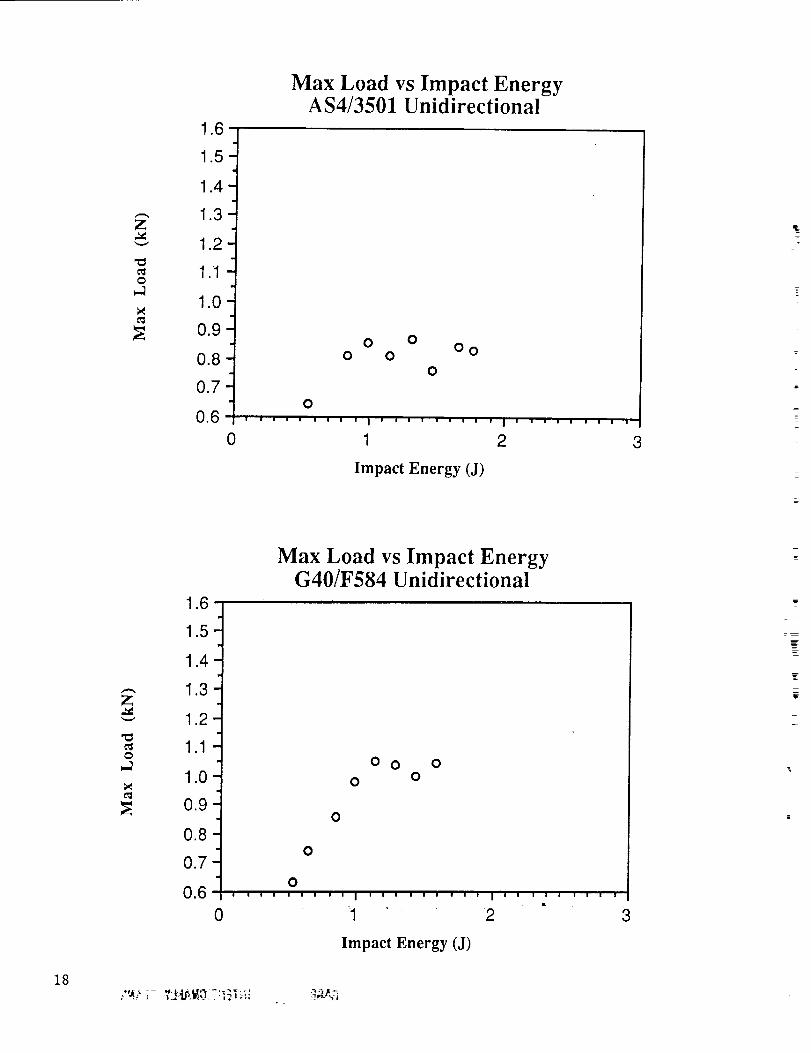
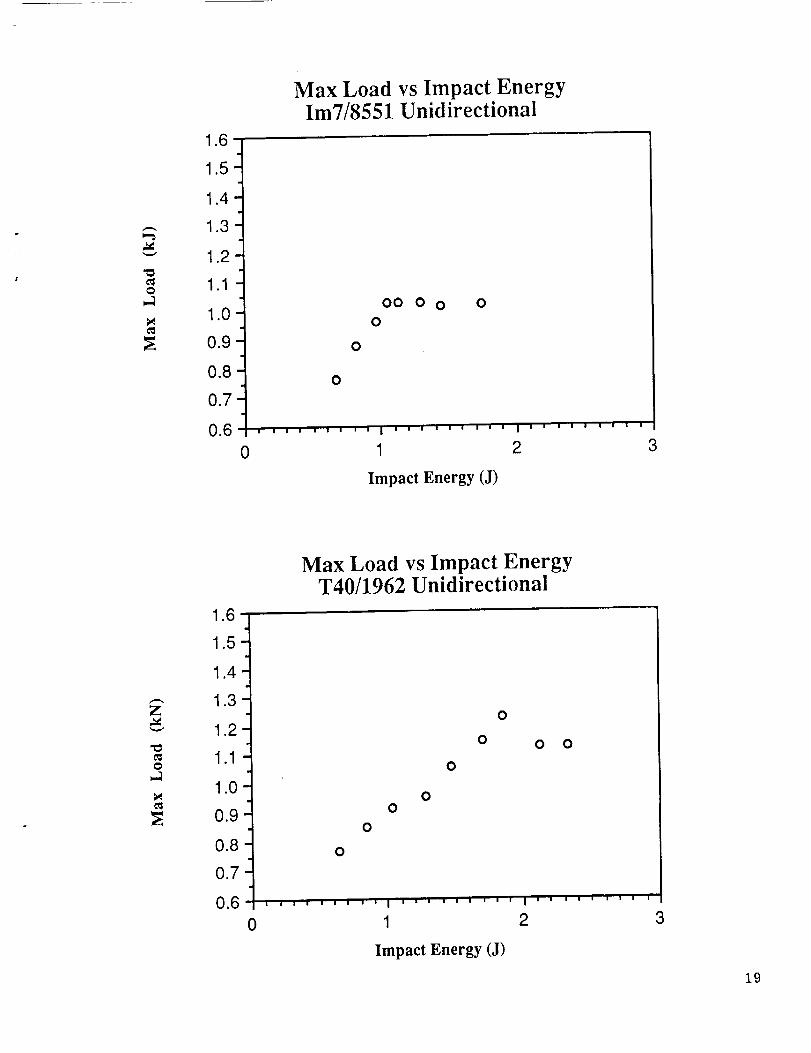
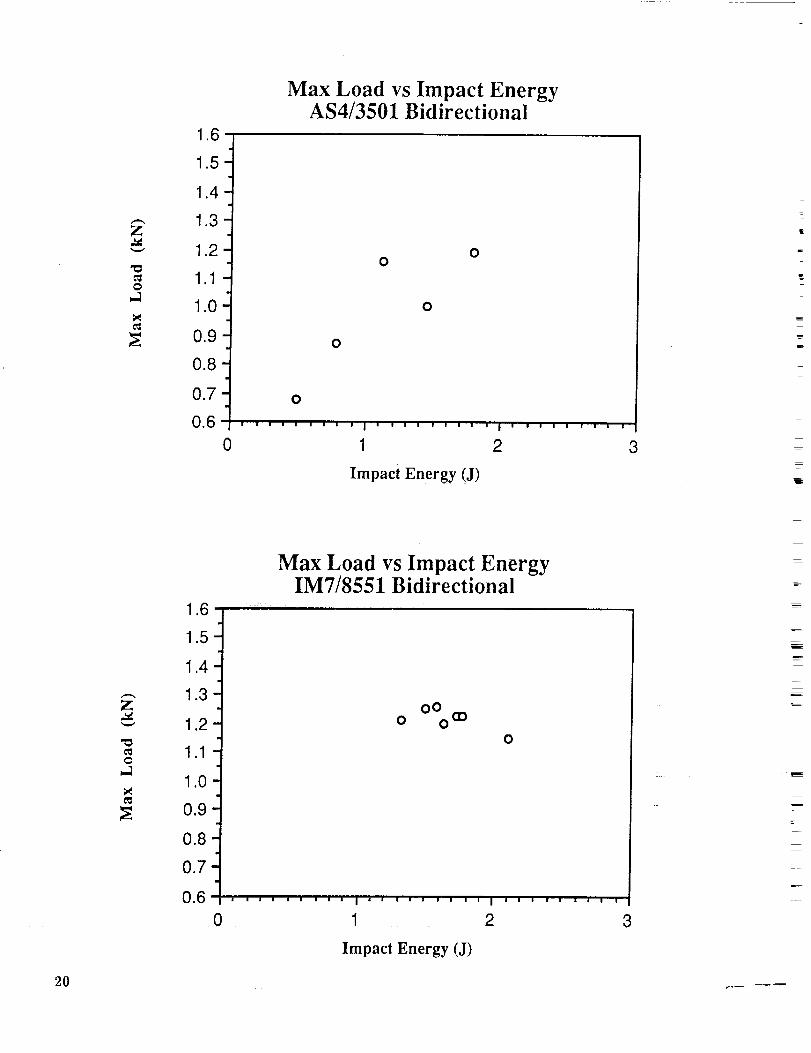
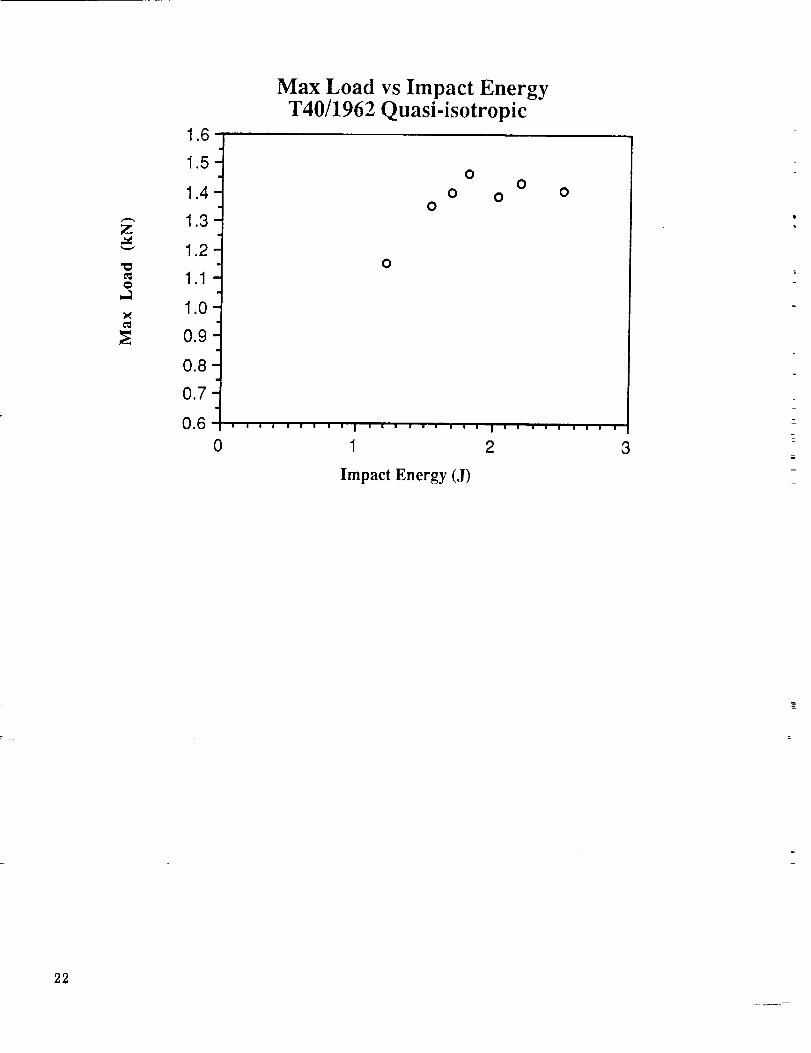
2. Maximum Force Versus Impact Energy Plots. A more detailed examination of maximum
force of impact can be formulated by plotting these values, as given by the instrumented output, versus
initial impact energy. An examination of these plots (given in Appendix A) shows that the maximum
force varies somewhat linearly with increasing impact energy up to a critical impact energy level, at
which point the maximum force begins to level out and then decrease slightly. These results are surpris-
ing since theoretically the maximum load should be proportional to the square root of the impact energy,
as outlined in Appendix B, thus giving an inverse parabolic shape. Actually this shape is seen on some of
the plots, most notably the T40/1962 quasi-isotropic and bidirectional lay-ups, and the AS4/3501 bidirec-
tional lay-up. The leveling out of the maximum force as damage becomes more severe is expected since
any given material system can only withstand a certain i0ad before failure. The small decrease in
maximum force is associated with complete penetration of the specimen but is not an expected result.
One possible explanation is that a different damage mechanism takes place at the higher impact veloci-
ties. At lower velocities the specimen will bend more and produce a back-face tension type failure,
whereas at a higher velocity the tup will penetrate with more of a shear type force since the specimen
does not have as much time to deflect the amount of distance the tup has traveled through the specimen.
It should be noted that for each impact energy level, all of the specimens tested at that level had
their maximum force of impact values averaged, and this is the value used in the plots.
A comparison of the different materials used shows that the AS4/3501 had the lowest maximum
force values for the two lay-up configurations used. This is not surprising given the fact that this system
has less fiber strength than the others tested.
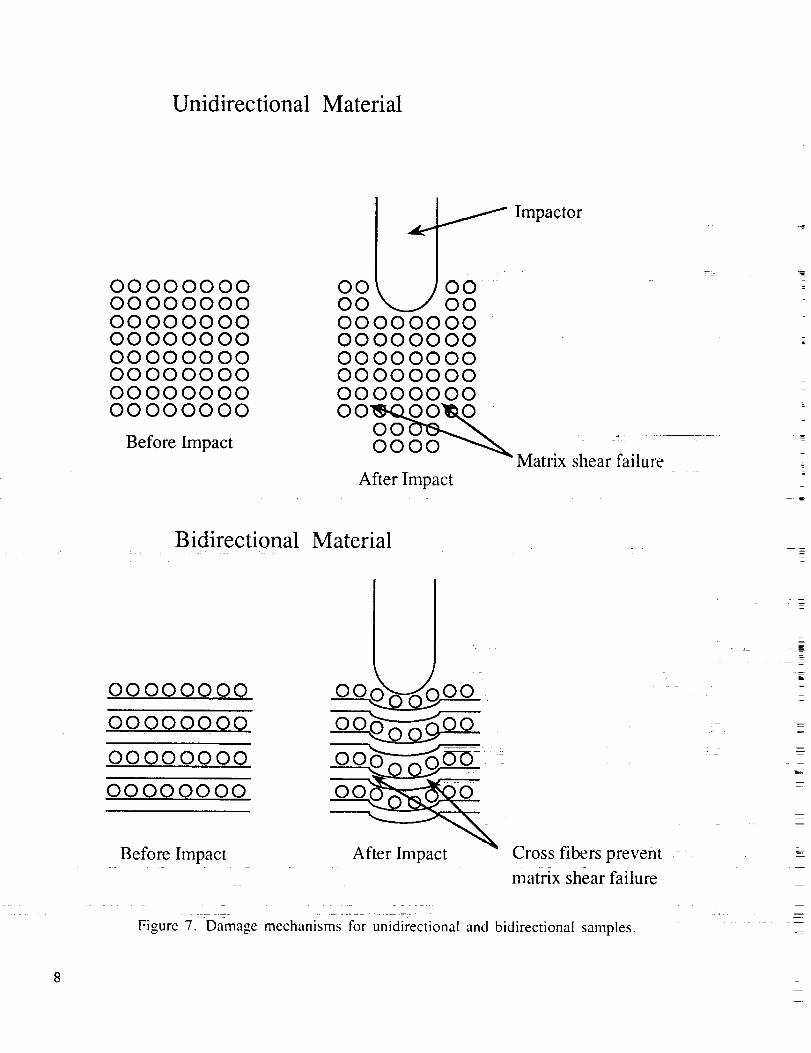
For any given material, the unidirectional samples could not support the amount of load that the
bidirectional and quasi-isotropic lay-ups could. This occurs because the unidirectional -samples can no
longer Support a load when the matrix material fails by splitting parallel to the direction of the fibers. In
the bidirectional and quasi-isotropic lay-ups, the transverse fibers help prevent the matrix from failing in
shear, as shown in Figure 7.
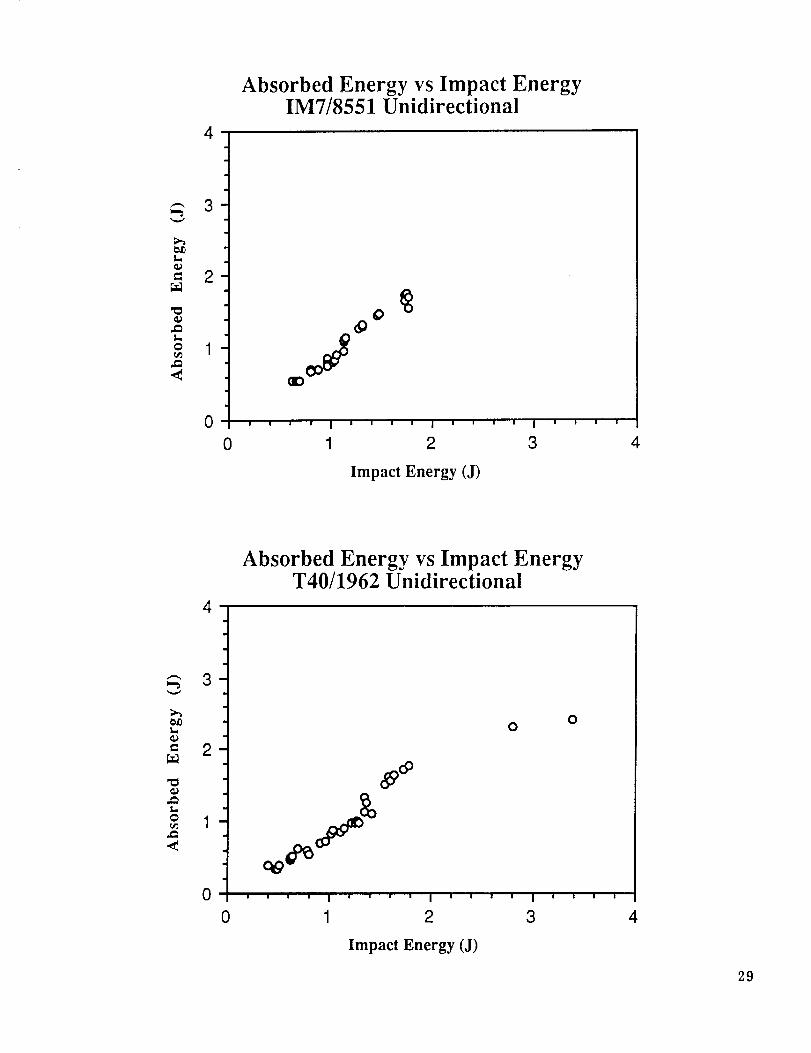
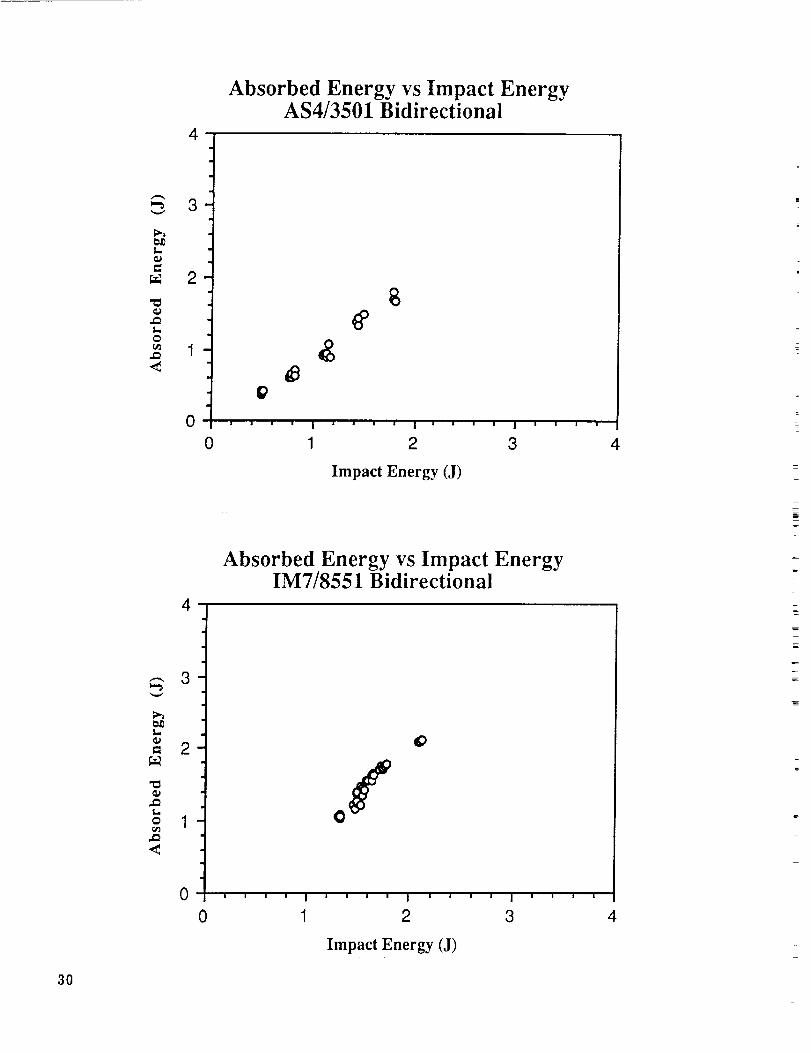
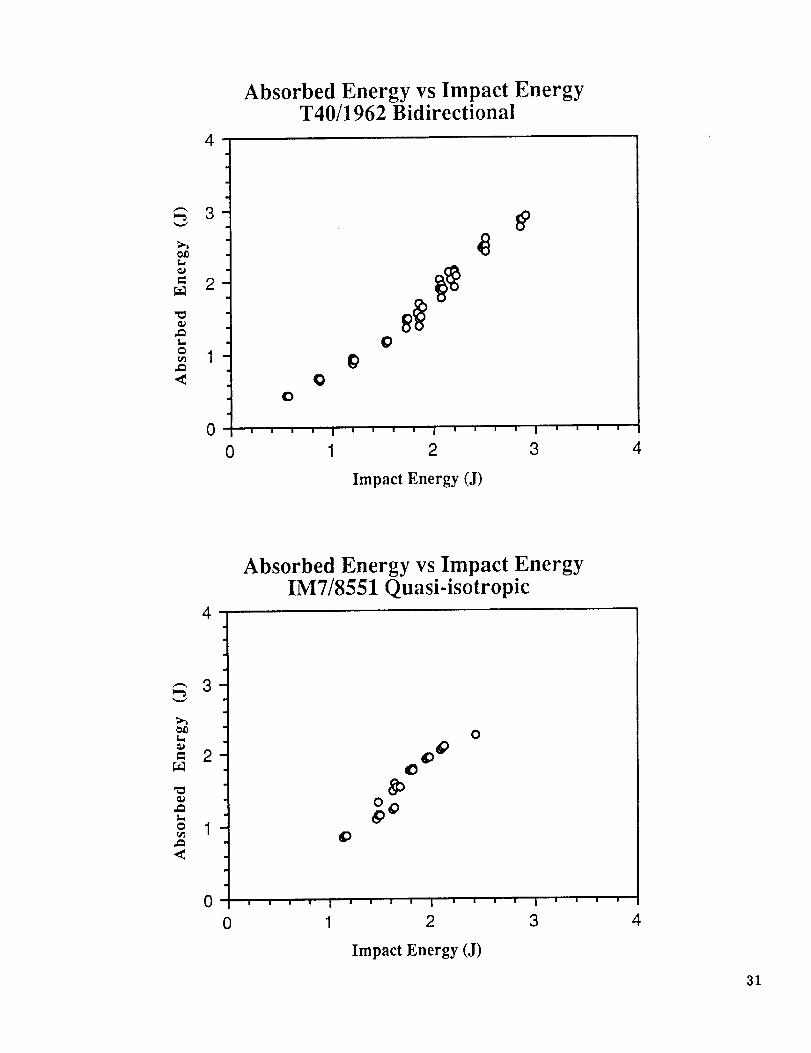
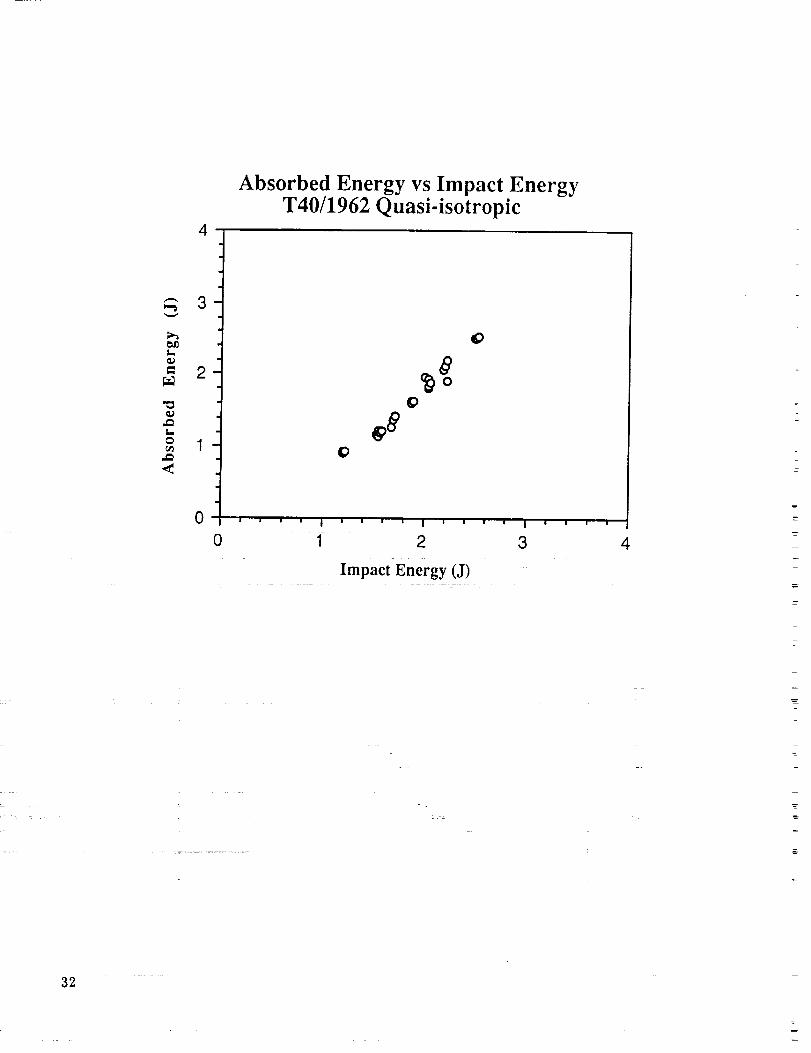
3. Absorbed Energy Data. The smooth curves superimposed on the force-time curves in
Figures 4 and 5 are absorbed energy-time curves. For all of the specimens tested, between 73 and 85
percent of the initial impact energy was lost during the impact event, the percentage being a constant for a
given material systeml This trend held true up to the point of fiber breakage where a larger amount of
=
6
Z-
,E-
=
AZ
r_<(O..J
1.25 IM7/8551 BI
11.4 cm Drop Ht.
INCIPIENTDAMAGE
\
A
ev-I.klZU.I
1.0 0 2.0 4.0 6.0 8.0
TIME (mSEC)
Figure 5. Instrumented impact output showing little damage.
10.0
Z.he
rn
0,..I
1.0_
IM7/8551 BI
14.6 crn Drop Ht.
1.0 0
5
Figure 6.
2.0 4.0 6.0 8.0
TIME (mSEC)
Instrumented impact output showing large damage.
010.0
Unidirectional Material
00000000
000000000000000000000000
Before
00000000000000000000000000000000
Impact
0000000000000000000000000000000000000000
ooo oo
After Impact
Matrix shear failure _-
Bidirectional Material
00000000
oo0oo0o0
00000000
00000000
Before Impact
00
After Impact Cross fibers prevefit
matrix shear failure
...... = = :r :
Figure 7. Damage mechanisms for unidirectional and bidirectional samples.
ORIGINAL PAGE
BLACK AND WHITE PHOTOGRAPH
energy was lost. Care must be taken not to interpret this data to mean that this loss of energy is in the
form of damage to the specimen. It is suspected that a substantial amount of energy is lost in the tbrm of
vibrational waves. These waves have been shown to be quite large in long slender objects impacted at
their ends and in thin plates impacted on the surface [8], both of which exist in this study.
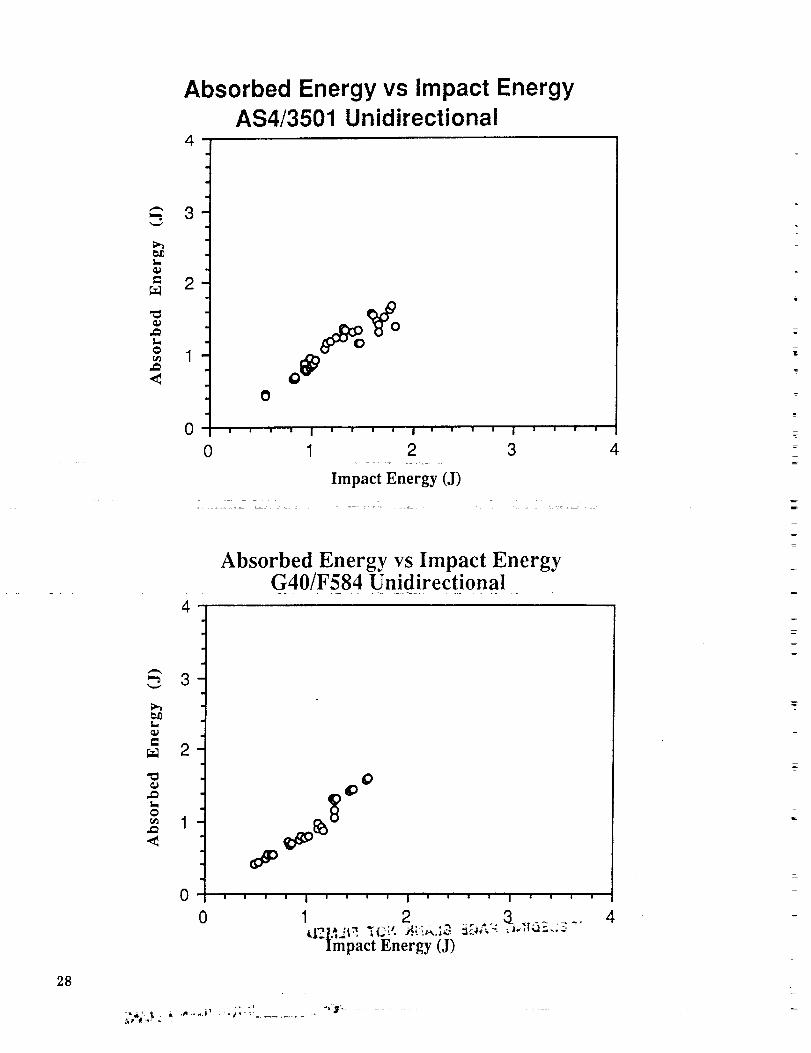
Plots of lost energy versus supplied energy were made tbr all of the materials tested and are
presented in Appendix C. The results show that a distinct linear region exists on all of the plots with the
slope being the percentage of energy lost. A deviation from this linearity occurs at the impact energy
level at which fiber damage first occurs, that also corresponds to the energy level at which tensile
strength begins to rapidly decrease which will be discussed later in this paper. This absorbed energy
behavior was also noted in another study [9]. These results imply that instrumented impact test data can
be used to predict, with good accuracy, the point at which damage can produce a rapid loss in tensile
strength, thus reducing the need for time consuming residual strength testing.
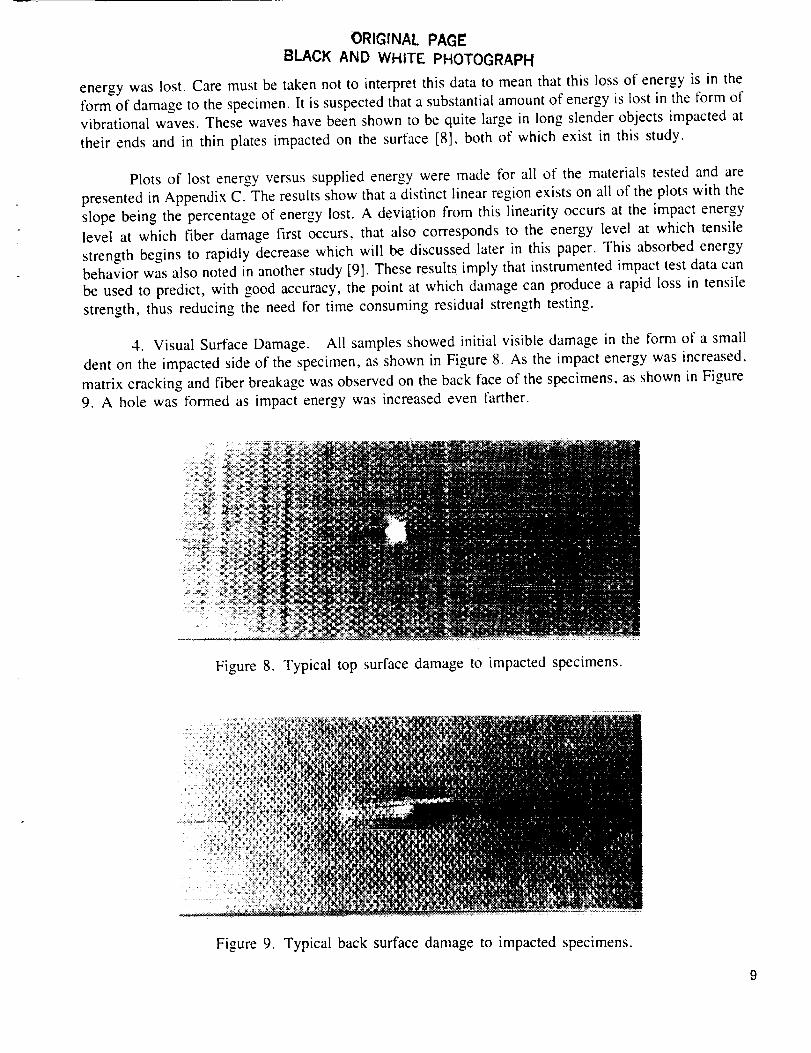
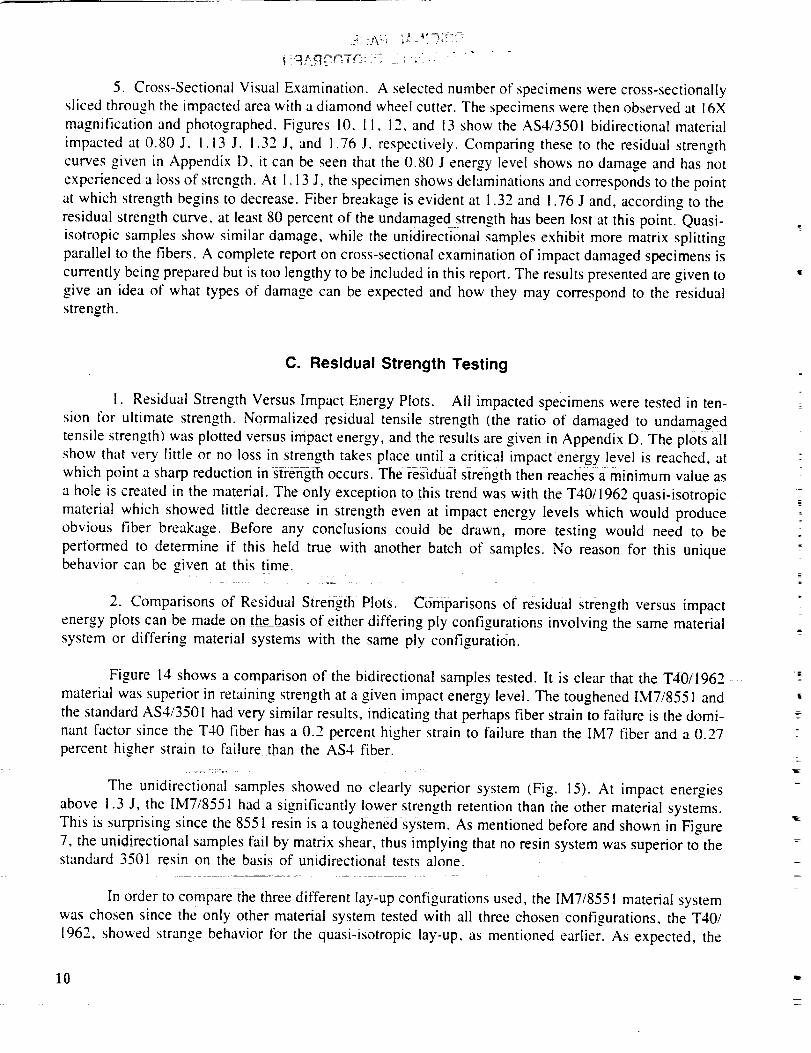
4. Visual Surface Damage. All samples showed initial visible damage in the form of a small
dent on the impacted side of the specimen, as shown in Figure 8. As the impact energy was increased,
matrix cracking and fiber breakage was observed on the back face of the specimens, as shown in Figure
9. A hole was formed as impact energy was increased even farther.
Figure 8. Typical top surface damage to impacted specimens.
:_%t_._$_! •._:_'_t:_:_,_'_------_" _ _,. _ _ . . . . .....
Figure 9. Typical back surface damage to impacted specimens.
9
'--_:_}t. _e e_e - ; .... --
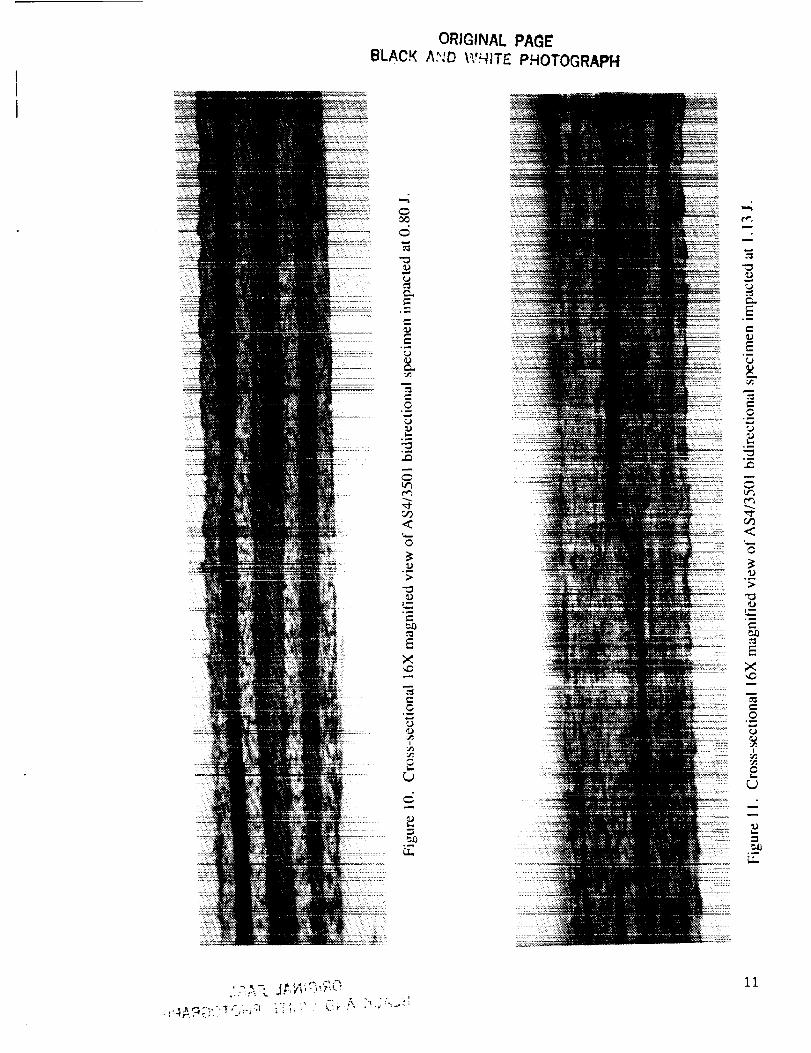
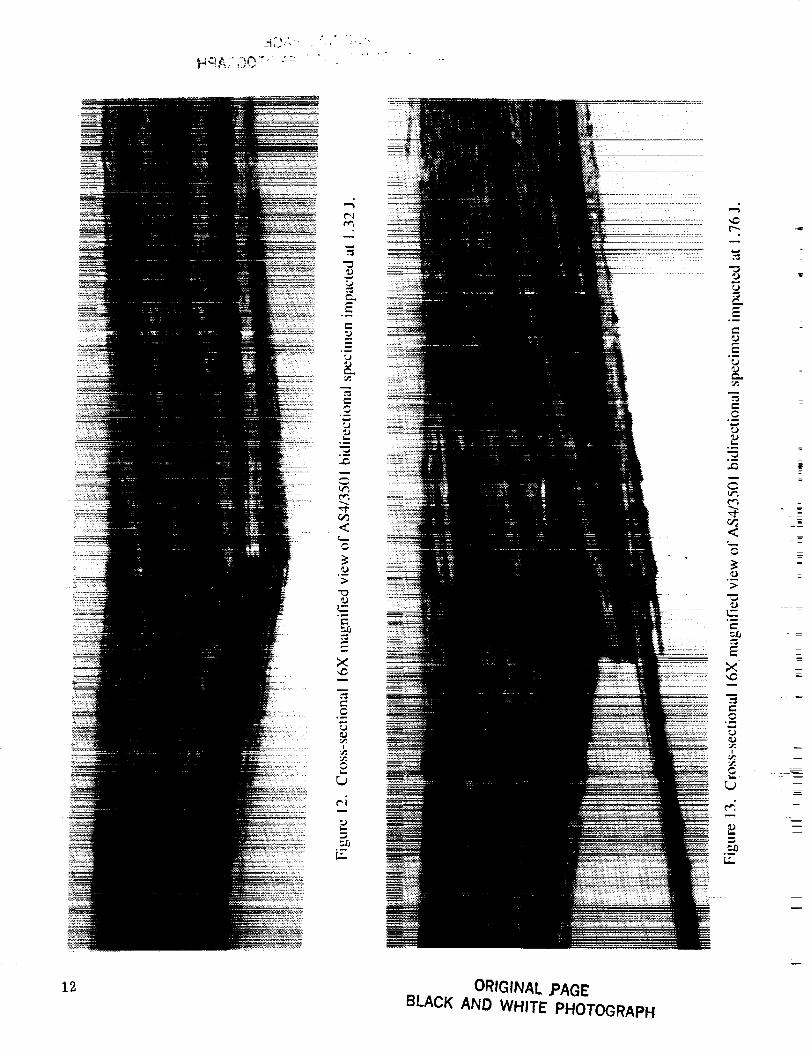
5. Cross-Sectional Visual Examination. A selected number of specimens were cross-sectionallysliced throu,,h= the impacted area with a diamond wheel cutter. The specimens were then observed at [6X
magnification and photographed. Figures 10, I1, 12, and [3 show the AS4/3501 bidirectional material
impacted at 0.80 J, I. 13 J, 1.32 J, and 1.76 J, respectively. Comparing these to the residual strength
curves given in Appendix D, it can be seen that the 0.80 J energy level shows no damage and has not
experienced a loss of strength. At 1.13 J, the specimen shows delaminations and corresponds to the point
at which strength begins to decrease. Fiber breakage is evident at !.32 and !.76 J and, according to the
residual strength curve, at least 80 percent of the undamagedstrength has been lost at this point. Quasi-
isotropic samples show similar damage, while the unidirectional samples exhibit more matrix splitting
parallel to the fibers. A complete report on cross-sectional examination of impact damaged specimens is
currently being prepared but is too lengthy to be included in this report. The results presented are given to
give an idea of what types of damage can be expected and how they may correspond to the residualstrength.
C. Residual Strength Testing
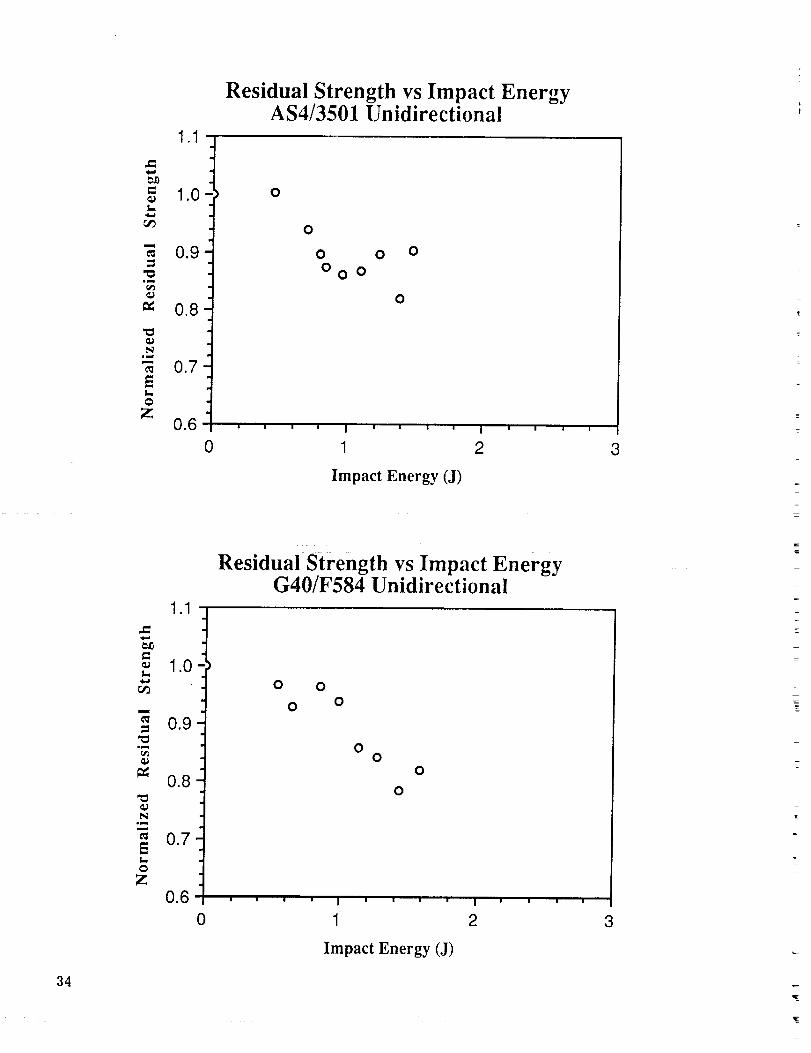
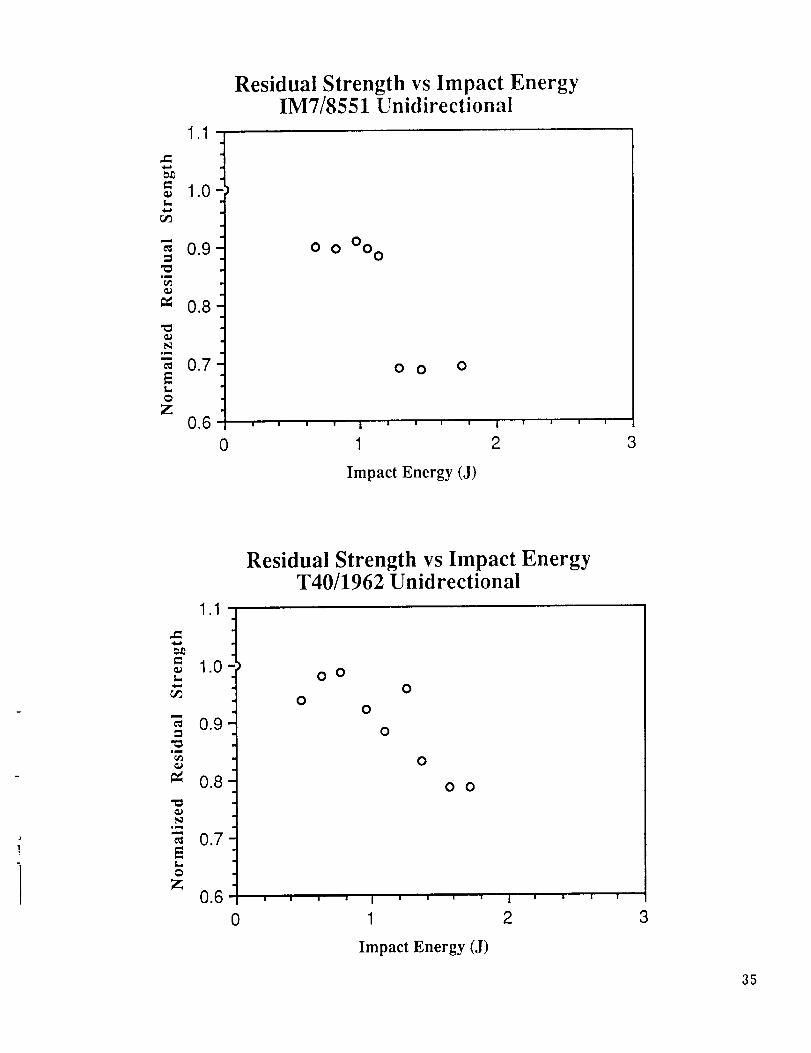
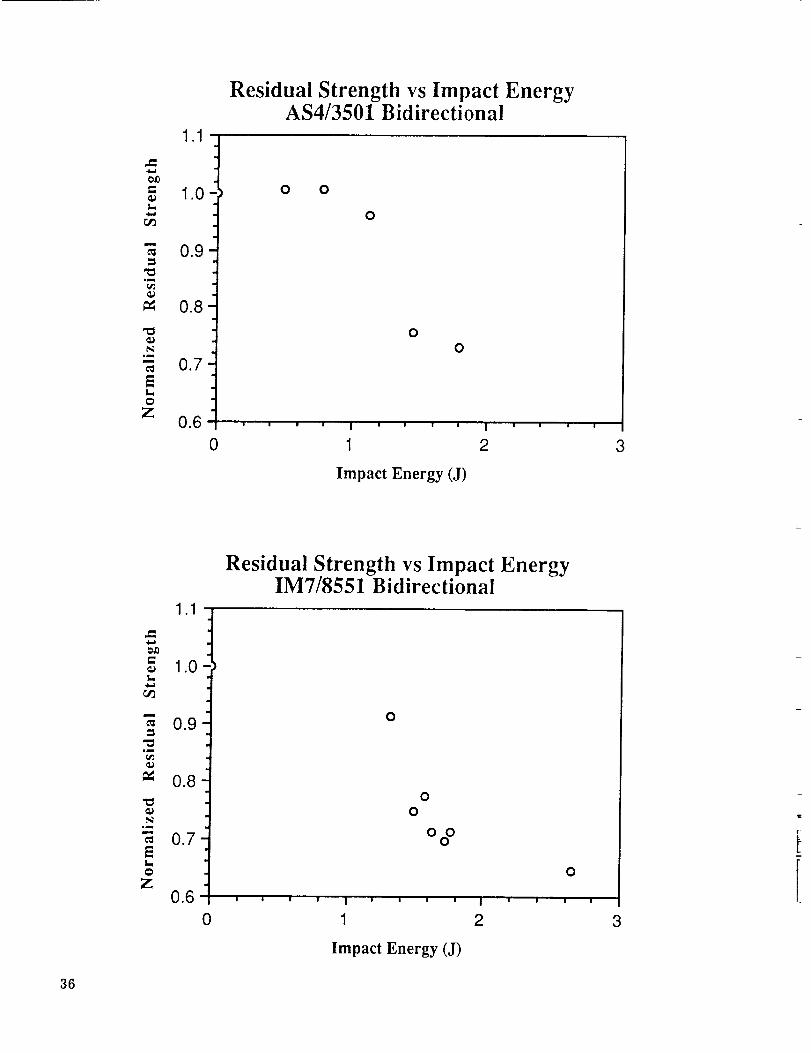
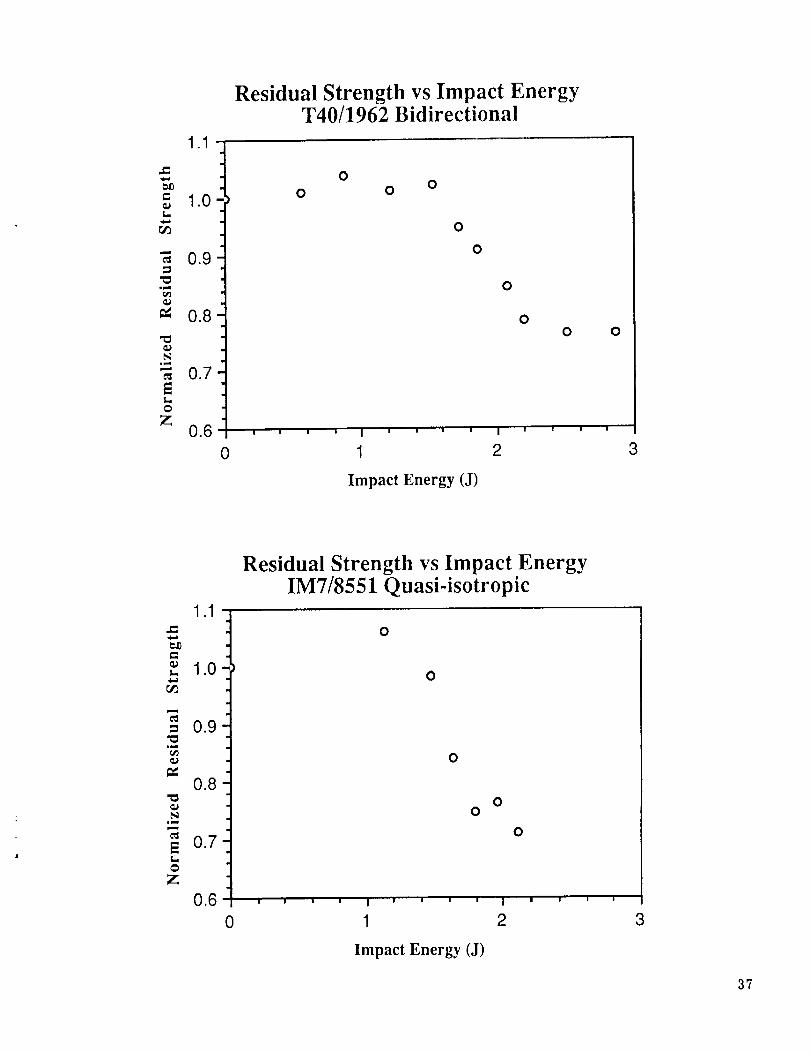
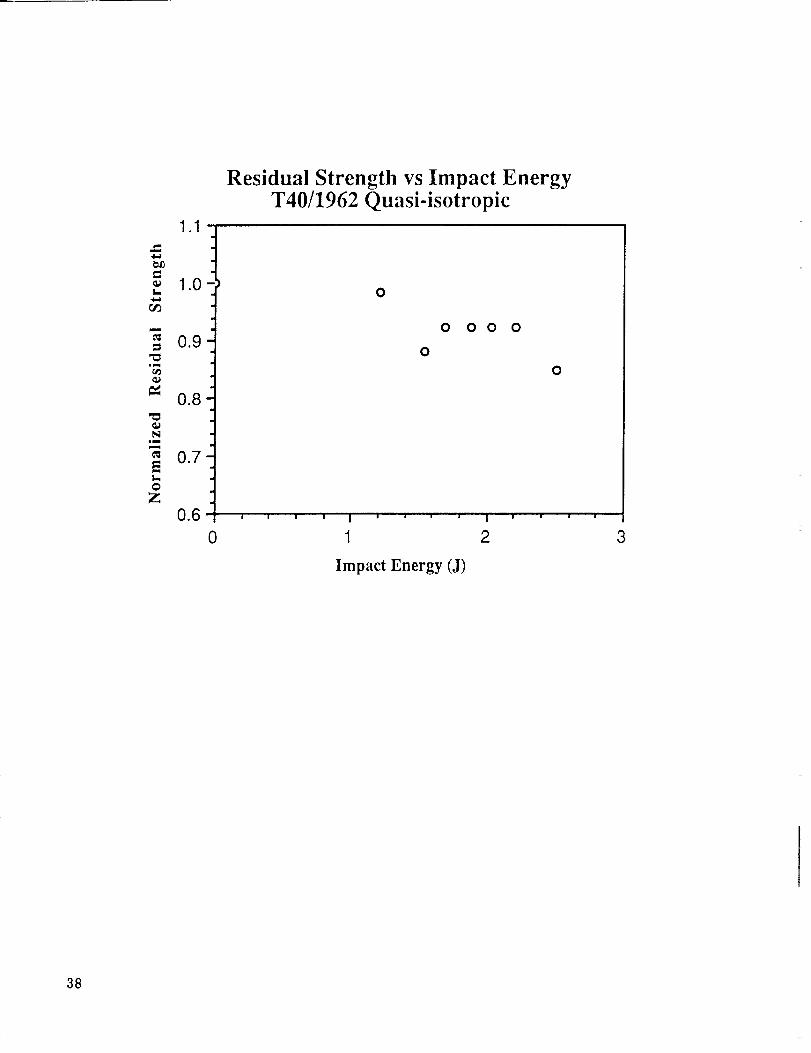
1. Residual Strength Versus Impact Energy Plots. All impacted specimens were tested in ten-
sion for ultimate strength. Normalized residual tensile strength (the ratio of damaged to undamaged
tensile strength) was plotted versus impact energy, and the results are given in Appendix D. The plots all
show that very little or no loss in strength takes place until a critical impactenergy level is reached, at
which point a sharp reduction in s{rength occurs. The residual strength then reaches a minimum value as
a hole is created in the material. The only exception to this trend was with the T40/1962 quasi-isotropic
material which showed little decrease in strength _ven at impact energy levels which would produce
obvious fiber breakage. Before any conclusions could be drawn, more testing would need to be
performed to determine if this held true with another batch of samples. No reason for this uniquebehavior can be given at this time.
2. Comparisons of ResidUal Stre_ih PlotS. CiSi_-parisons of residual Strength versus impact
energy plots can be made on the basis of either differing ply configurations involving the same material
system or differing material systems with the same ply configuration.
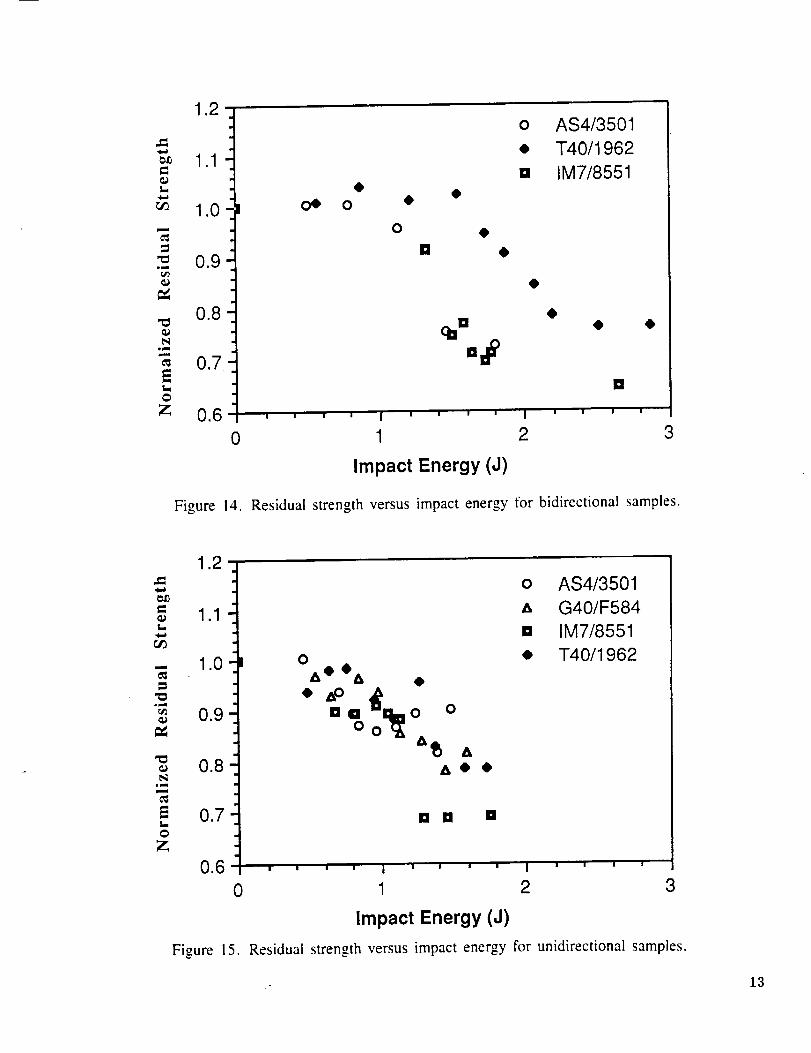
Figure 14 shows a comparison of the bidirectional samples tested. It is clear that the T40/1962
material was superior in retaining strength at a given impact energy level. The toughened IM7/8551 and
the standard AS4/3501 had very similar results, indicating that perhaps fiber strain to failure is the domi-
nant factor since the T40 fiber has a 0.2 percent higher straifi to failure than the IM7 fiber and a 0.27
percent higher strain to failure thafi_the AS4 fiber.
The unidirectional samples showed no clearly superior system (Fig. 15). At impact energies
above 1.3 J, the IM7/8551 had a significantly lower strength retention than the other material systems.
This is surprising since the 8551 resin is a toughened system. As mentioned before andshown in Figure
7, the unidirectional sampIes fail by matrix shear, thus implying that no resifi system was superior to thestandard 3501 resin on the basis of unidirectional tests alone.
In order to compare the three different lay-up configurations used, the IM7/8551 material system
was chosen since the only other material system tested with all three chosen configurations, the T40/
1962, showed strange behavior tbr the quasi-isotropic lay-up, as mentioned earlier. As expected, the
10
E=
r
ORIGINAL PAGE
BLACK A>'D tVHtTE PHOTOGRAPH
2
o.,
,%}
r-'O
.m
tt_c_
<O
>,
EXm
e,,
LL,
e.,_JE
V'%
<
X
¢)
p
11
12 ORIGINAL PAGE
BLACK AND WHITE PHOTOGRAPH
B
E
t-
J
Et-
z
1.2
1.1
1.0
0.9
0.8
0,7.
@oe o • •
o
[]
0
[]
AS4/3501
T40/1962
IM7/8551
[]
0.6 ' ' ' ' i ' ' ' ' i ' ' ' '
0 1 2 3
Figure 14.
Impact Energy (J)
Residual strength versus impact energy for bidirectional samples.
t-
t_o_I
Et-
O
1.2
1.1
1.0
0.9
0.8
0.7
0.6
0
Figure 15.
°,a • •A •
• oAI_ A
A•
o AS4/3501
A G40/F584
[] IM7/8551• T40/1962
[] [] []
1 2 3
Impact Energy (J)
Residual strength versus impact energy for unidirectional samples.
- 13
unidirectional samples showed the most strength reduction with the quasi-isotropic lay-up having the
most amount of strength retention for a given impact energy. This is probably due to the larger number of
fiber directions in the quasi-isotropic lay-up contributing to more freedom for cracks to change direction,
taking the path of least resistance, and thus blunting sooner.
These types of plots and comparisons can be of great use to the designing engineer in the material
screening process for parts that may be subjected to change.
III. CONCLUSIONS
It is difficult to predict the residual tensile strength of an impacted composite material. Large
amounts of scatter exist in the data, making a prediction from just one impact test impossible. A large
number of impact energy levels and a large number of samples at each energy level must be used if a
residual strength versus impact energy plot is to be of any use. This type of testing involves a largeamount of material and time.
Characteristic curve shapes of residuai strength versus impact energy plots were detected for all
but one of the material systems tested. All materials exhibited a range of impact energy levels, beginning
at zero, during which no loss of strength occurred, even though small amounts of damage could be
detected on some of these specimens. Furthermore, all of the materials showed a sharp decrease in
residual tensile strength at a critical energy level, which also coincided with the first signs of visible
damage. It is also at this critical energy level that a deviation from linearity was seen on absorbed energy
versus impact energy plots, thus providing a much easier method of finding this critical energy than by
residual tensile strength testing.
The thinness of the samples tested produced a very small energy range in which residual tensile
strengths were exhibiting a decrease in value, making an examination of this region difficult.
Fiber strain to failure appears to be the dominating factor in impact resistance for thin samples.
The T40/1962 matefiai couldwithstand higher impact energy levels and showed a larger retention of
strength at each impact energy level. The major difference between this material system and the others
tested is that the T40 fiber has a strain to failure 0.2 percent larger than the others tested. The unidirec-
tional samples, which sustained damage mostly in the form of matrix cracking, showed no significant
differences in impact damage at a given impact energy level. The thinness of the samples probably
accounts for this, and it is difficult to say if the toughened matrices actually perform better than the
untoughened 3501 matrix for Other specimen geometries.
Instrumented impact testing can provide useful data on a material system. Plots of absorbed
energy Versus impact energy can show the critical energy level at which point major tensile strength
reduction begins, thus eliminating the need for many residual strength tests.
Force-time plots Of the impact event can show the ultimate force the specimen can withstand
before fiber breakage takes place, given a certain specimen support geometry. This information could
prove very useful in design purposes since the types of impact a part may encounter can usually be
predicted.
|
z
=
14

This study was intended as an empirical approach and no mathematical models are attempted. It
shows how experimental data can be used to determine trends in material behavior alter a predescribed
type of damage. This type of study is to benefit the designing engineer by showing the response of
various material systems to a puncture type of impact.
Finally, compression strength after impact has been shown to be a much more critical parameter
than tension strength after impact, since matrix cracking and ply delaminations will greatly reduce the
compression strength of a composite material. However, residual tensile strength needs to be understood
as well since many parts are tension critical.
15

i
"2_
APPENDIX A
Maximum Force of Impact Versus Impact Energy Plots
PRECEDING PAGE BLANK NOT FILMED
17
_L_] [ INTI:NTi(_IAId:It BLANK
Z
1.6
1.5:
1.4-
1.3 -
1.2 -
1.1 -:
1.o-
0.9:
0.8"
0.7:
0.6
0
Max Load vs Impact EnergyAS4/3501 Unidirectional
O OO0
0 0
0
0
I l i i I I i I I | i i | I i | i I I | i I i I i i I I !
1 2
Impact Energy (J)
3
=
18
1.6
Max Load vs Impact EnergyG40/F584 Unidirectional
Z
,
1.5
1.4
1.3
1.2
1.1
1.0w
0.9
0.8m
0.7i
0.6
0
0 0 0
0 0
0
0
oI l l l l l l I ' I ' ' ' ' ' ' ' ' ' I ' ' ' ' ' ' ' , '
1 2
Impact Energy (J)
3
1.6
1.5 -
1.4-
1.3 -
1.2-1.1"
1.o-0.9:
o.8-
0.7:
0.6
0
Max Load vs Impact EnergyIm7/8551 Unidirectional
O
O0 0 0 0
0
0
I I I I l 1 I I I | I I I I I I I I I | I I I I I I I I I
1 2
Impact Energy (J)
3
Z
o
1.6
1.5 :
1.4-
1.3:
1.2-
1.1:
1.o-0.9-
0.8-0.7-
0.6
0
Max Load vs Impact EnergyT40/1962 Unidirectional
O
OO
O
O
O
O
O O
I I I I I I I I I I I I I I I I I I I I I I I | I I i | I
1 2 3
Impact Energy (J)
19
Z
1.6
1.5
1.4
1.3
1.2
1.1
1.0
0.9
0.8
0.7
0.6
Max Load vs Impact EnergyAS4/3501 Bidirectional
0
OO
O
O
O
! | | i ! I i i | i i I | I w ! I | i i | | ! i I | | | !
I 2
Impact Energy (J)
3
Z
1.6
1.5o
1.4
1.3
1.2
1.1
1.0=
0.9
0.8
0.7
0.6
0
Max Load vs Impact EnergyIM7/8551 Bidirectional
oOO3
0 0
0
i I I I I l ' l i I I l I i ! I I I i I ' I I i I i I I |
1 2
Impact Energy (J)
3
m
0 _ _

@
1.6 :
1.5-"
1.4-
1.3 -'
1.2-
1.1-
1.o"
0.9"
0.8-0.7-
0.6
0
Max Load vs Impact EnergyT40/1962 Bidirectional
O
0 0 00 0
0
0
0
0
l I I I I I I I I | I I I I I I I I I i I I I I I I I I •
1 2 3
Impact Energy (J)
1.6 "I
1.5I
1.4=
1.3Z -,-- 1.2
m
= 1.1
,4 1.0
0.9
0.8
0.7
0.6
0
Max Load vs Impact EnergyIM7/8551 Quasi-isotropic
O
O O
00 0
I i , , a , , . , I ' ' a , . . . a . i . , , . a , , a ,
I 2
Impact Energy (J)
3
21
Z
1.6
Max Load vs Impact EnergyT40/1962 Quasi-isotropic
1.5
1.4
1.3
1.2
1.1
1.0
0.9
0.8
0.7
0.6
0
0
00
0 0 0
0
! i i i i a i I i | I i ! I I l i i a i l i i a i i I i i
1 2
Impact Energy (J)
3
22
APPENDIX B
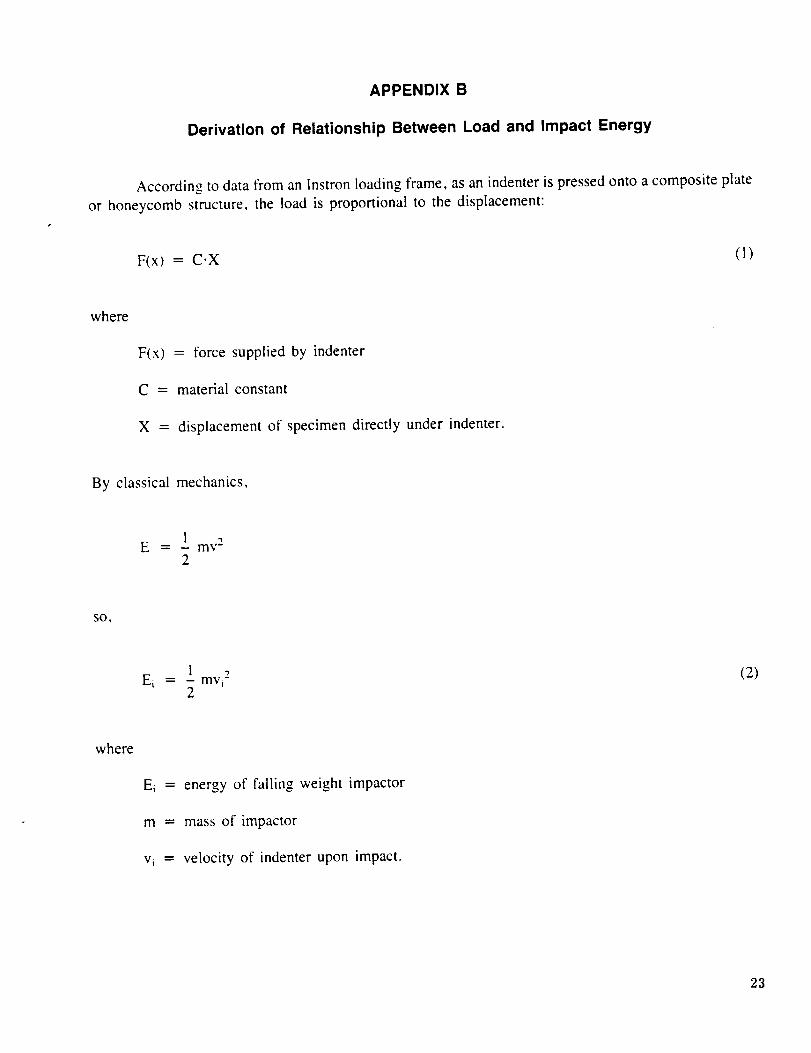
Derivation of Relationship Between Load and Impact Energy
According to data from an lnstron loading frame, as an indenter is pressed onto a composite plate
or honeycomb structure, the load is proportional to the displacement:
F(x) = C.X (I)
where
F(x) = force supplied by indenter
C = material constant
X = displacement of specimen directly under indenter.
By classical mechanics,
E = _l mY 22
SO,
i ..)
Ei = - mvi-2
(2)
where
Ei = energy of falling weight impactor
m = mass of impactor
v_ = velocity of indenter upon impact.
23
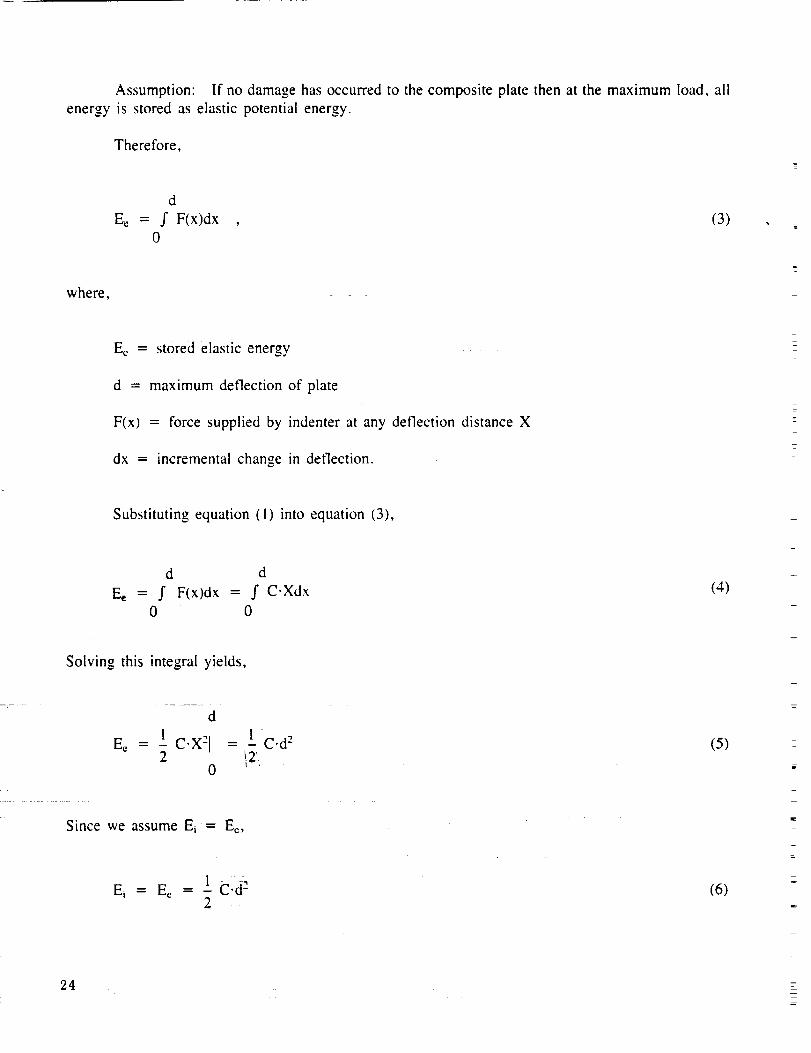
Assumption: If nodamagehasoccurredto thecompositeplatethenat the maximumload, allenergy is storedaselasticpotentialenergy.
Therefore,
where,
dEe = f F(x)dx
0
(3)
E¢ = stored elastic energy
d = maximum deflection of plate
=
F(x) = force supplied by indenter at any deflection distance X --
7
dx = incremental change in deflection.
Substituting equation (I) into equation (3), L
d d
Ee = f F(x)dx = f C.Xdx (4)
0 0
Solving this integral yields,
E_ (5)
d
= _1 C.X2 [2
0
1 C.d2
!2
Since we assume Ei = Ee,
Ei = E_ - 1C'd: (6)2
lr
=
g
24
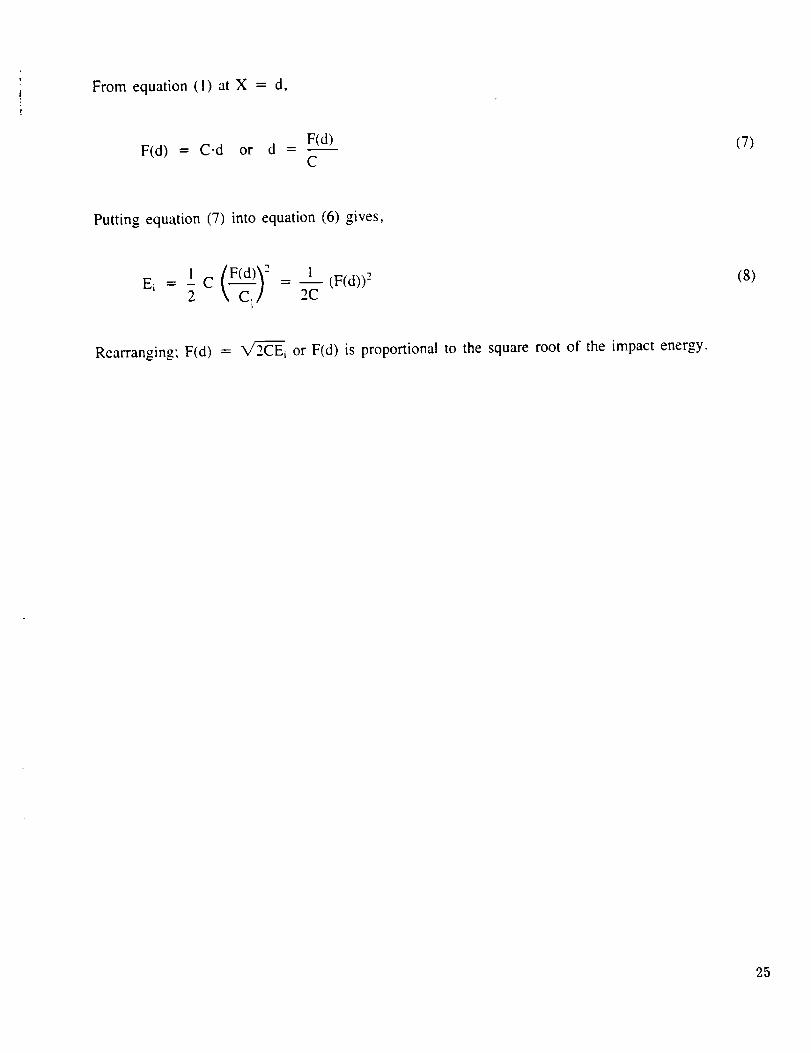
From equation(!) at X = d,
F(d)F(d) = C.d or d =
C(7)
Puttingequation(7) into equation(6) gives,
2 %,C_/ 2C
(8)
Rearranging; F(d) = _ or F(d) is proportional to the square root of the impact energy.
25

=
APPENDIX C
Energy Lost During Impact Versus Energy of Impact
PRECEDING PAGE BLANK NOT RLMIED
27
28
Absorbed Energy vs Impact EnergyAS4/3501 Unidirectional
4
3
t=,
= 2
t_
<
0
0
' ' ' ' I ' ' ' ' I ' ' ' ' I ' ' ' '
0 1 2 3
Impact Energy (J)
4
Absorbed Energy vs Impact EnergyG40/F584 Unidirectional
"_ 3
t_tD
2
<
0
0
@
' ' ' ' I ' ' ' ' I ' ' ' ' I ' ' ' '
1 2 3..._
Impact Energy (J)
4
4
4
Absorbed Energy vs Impact EnergyIM7/8551 Unidirectional
3v
L.¢D= 2
I.
= 1
<
0
0' ' ' ' I ' ' ' ' I ' ' ' ' I '
1 2 3
Impact Energy (J)
4
4
Absorbed Energy vs Impact EnergyT40/1962 Unidirectional
t..¢D
7.-
<
3
2
0 |
0
o O
1 2 3
Impact Energy (J)
4
29
4
Absorbed Energy vs Impact EnergyAS4/3501 Bidirectional
3O
3
2
<
0
4
t-- 3
t_.cD
2
L.
.<
0
0 1 2 3
Impact Energy (J)
Absorbed Energy vs Impact EnergyIM7/8551 Bidirectional
n
u
i ' ' ' ' I ' ' ' ' I ' ' ' ' I ' ' ' '
0 1 2 3
Impact Energy (J)
4
4
L
4
Absorbed Energy vs Impact EnergyT40/1962 Bidirectional
3
t..
= 2
i_.
.<
0
0
OQ
1 2 3
Impact Energy (J)
4
4
Absorbed Energy vs Impact EnergyIM7/8551 Quasi-isotropic
3
= 2
t..
O')
<
0
0
dO
o
' ' ' ' l ' ' i i i , i i l I l , , ,
I 2 3
Impact Energy (J)
4
31
4
Absorbed Energy vs Impact EnergyT40/1962 Quasi-isotropic
_" 3
L
= 2
t_
<
0
O
Q
' ' ' ' I ' ' ' ' I ' ' ' ' I ' ' ' '
0 1 2 3
Impact Energy (J)
4
32
APPENDIX D
Residual Tensile Strength Versus Energy of Impact
33
1.1
= 1.0f,,,,,
m
0.9
",_
_ O.8
_ 0.7
Z0.6
Residual Strength vs Impact EnergyAS4/350i Unidirectional
O
O
0 0 0
00 o
0
0
I i , , , I ' i i
1 2
Impact Energy (J)
3
Y
=
=
1.1
1.0
i
0.9
0.8
N
_ 07
Z0.6
34
Residual Strength vs Impact EnergyG40/F584 Unidirectional
0 0
0 0
00
0
0
i
0' ' ' ' I ' ' ' ' I ' ' '
1 2
Impact Energy (J)
3
=
1.1
_, 1.011
4,d
0.9
_ 0.8
0.7
Z0.6
Residual Strength vs Impact EnergyIM7/8551 Unidirectional
0 0 O0 0
0 0 0
0
i s l i i | i
1 2
Impact Energy (J)
3
1.1
1.0
m
0.9
_ 0.8
N,_
_ 0.7
Z0.6
Residual Strength vs Impact EnergyT40/1962 Unidrectional
O
O O
O
O
O
O
O O
0
i n u u i | u
1 2
Impact Energy (J)
!
3
35
1.1
= 1.0
m
0.9
(M
0.8
t_.m
0.7
t-OZ
0.6
Residual Strength vs Impact EnergyAS4/3501 Bidirectional
0 0
0
0O
" ' ' ' I ' ' ' ' I ' ' '
0 1 2
Impact Energy (J)
3
I.
(J?
N.m
EI.@Z:
1.1
1.0
0.9
0.8
0.7
0.6
Residual Strength vs Impact EnergyIM7/8551 Bidirectional
O
! ! ! !
0
O0
] I I I I
4
Impact Energy (J)
I
2
O
|
3
36
1.1
= 1.01.1
r,f3
0.9
a_
_ 0.8
No_
0.7
Z0.6
Residual Strength vs Impact EnergyT40/1962 Bidirectional
O
O OO
O
O
O
O
0
l m m m m m m m u m '
I 2
Impact Energy (J)
O O
3
_D
¢D
N
O
1.1
1.0
0.9
0.8
0.7
0.6
Residual Strength vs Impact EnergyIM7/8551 Quasi-isotropic
O
o
O
OO
O
0
| m l ! m
I
Impact Energy (J)
I |
2 3
37
1.1
1.0f.,
= 0.9
ew.1
0.8
Ne_
_ 07
t...
Z0.6
Residual Strength vs Impact EnergyT40/1962 Quasi-isotropic
O
O
0 0 0 0
0
0
' ' ' ' I ' ' ' ' I ' ' '
I 2
Impact Energy (J)
38
REFERENCES
I ,
,
.
.
,
,
,
.
9.
Winkel, J.D., and Adams, D,F.: "Instrumented Drop Weight Impact Testing of Cross-Ply and
Fabric Composites." Composites Vol. 16, October 1985, pp. 268-278.
Aleska, J.C." "Low Energy Impact Behavior of Composite Panels." Journal of Testing and Evalua-
tion Vol. 6, May 1978, pp. 202-210.
Broutman, L.J., and Rotem, A.: "Impacted Strength and Toughness of Fiber Composite Materials."
Foreign Object Impact Damage to Composites, ASTM STP 568, 1975, pp. !14-133.
Rotem, A.: "'Residual Flexural Strength of FRP Composite Specimens Subjected to Transverse
Impact Loading." SAMPE Journal Vol. 24, March/April 1988, pp. 19-25.
Cantweli, W.J., Curtis, P.T., and Morton, J." "An Assessment of the Impact Performance of DFRP
Reinforced With High-Strain Carbon Fibers." Composite Science and Technology Vol. 25 (2),
1986, pp. 133-148.
Caprino, G.: "'Residual Strength Prediction of Impacted CFRP Laminates." Journal of Composite
Materials Vol. 18, November 1984, pp. 508-518.
Husman, G.E., Whitney, J.M.. and Halpin, J.C." "Residual Strength Characterization of Laminated
Composites Subjected to Impact Loading." Foreign Object Impact Damage to Composites, ASTM
STP 568, 1975, pp. 92-113.
Goldsmith, W.: Impact. Edward Arnold, London, 1960.
Sjoblom, P.O., Hartness, J.T., and CordeIl, T.M " "On Low-Velocity Impact Testing of Composite
IVlaterials." Journal of Composite Materials Vol. 22, January 1988, pp. 30-52.
39
i_ Report Documentation Page
NASA TP-2981
4 T;tte and Subtiile
2. Government Accession No.I
Instrumented lnlpact and Residual Tensile Strength Te.,,iing
or" Eight-Ply Carbon/Epoxy Specimens
7. Author(s)
A.T. Nettles
9. Performing Organization Name and Address
George C. Marshall Space Flight Center
Marshall Space Flight Center, Alabama 35812
12. Sponsoring Agency Name and Address
National Aeronautics and Space Administration
Washington, D.C. 20546
! 3. Reclpient's Cat_;_g No.I
I5. Report DateI
' January 1990
6. Performing Organization Code
8. Performing Organization Report No.
10. Work Unit NO.
M-62311. Contract or Grant No :.
13. Type of Report and Period Covered
Technical Paper
14. Sponsoring Agency Code
15. Supplementary Notes
Prepared by Materials and Processes Laboratory, Science and Engineering Directorate.
"16. Abstract
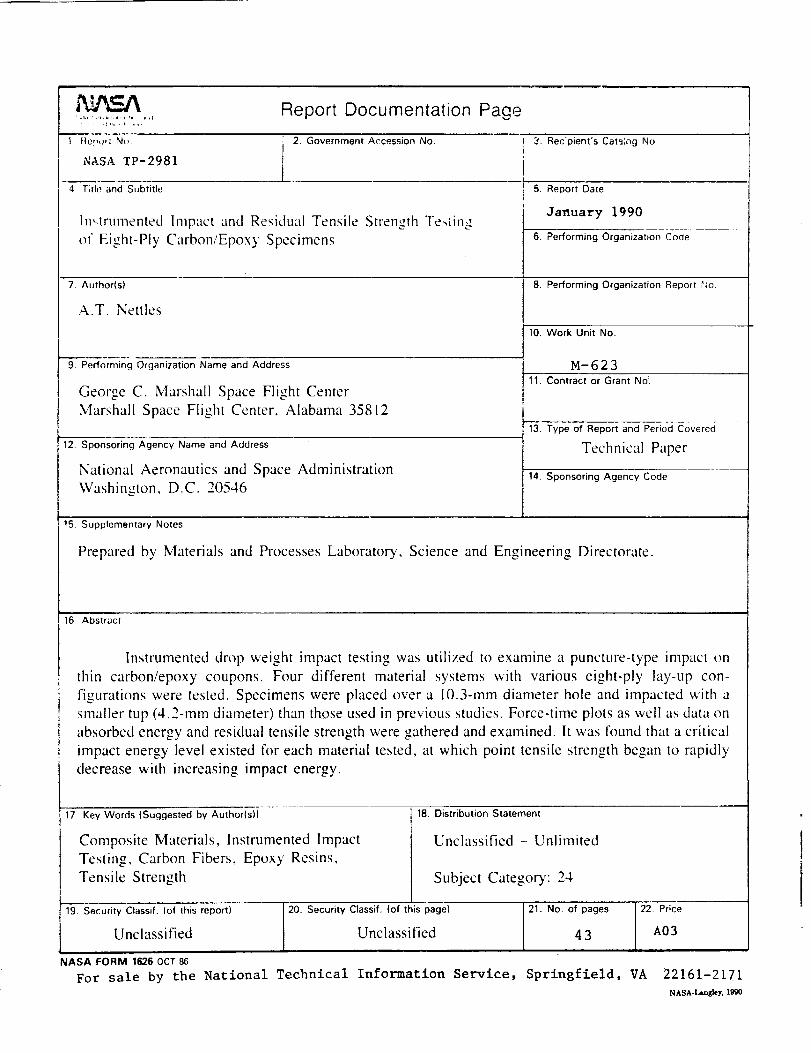
Instrumented drop weight impact testing was utilized to examine a puncture-type impact on
thin carbon/epoxy coupons. Four different material systems with various eight-ply lay-up con-
figurations were tested. Specimens were placed over a 10.3-mm diameter hole and impacted with a
smaller tup (4.2-mm diameter) than those used in previous studies. Force-time plots as well as data on
absorbed energy and residual tensile strength were gathered and examined. It was found that a critical
impact energy level existed for each material tested, at which point tensile strength began to rapidly
decrease with increasing impact energy.
17, Key Words (Suggested by Author(s))
Composite Materials, Instrumented Impact
Testing, Carbon Fibers, Epoxy Resins,
Tensile Strength
19.' Security' Classif. (of this report)
18. Distribution Statement
Unclassified - Unlimited
Subject Category: 24
20, Security Classif. (of this page)
Unclassified Unclassified
NASA FORM 1626 OCT 86
For sale by the National Technical Information Service,
21. No. of pages 22. Price
4 3 A03
Springfield, VA 22161-2171
NASA.LmnzIey , 1990