institutional investors and hedge fund activism · remains positive and significantly associated...
TRANSCRIPT

1
Institutional Investors and Hedge Fund Activism
Simi Kedia
Laura Starks
Xianjue Wang1
November 2016
Preliminary
Abstract
Due to their relatively small holdings in a target firm, hedge funds activists need the cooperation
of other investors, generally institutional owners who can have a significant impact on the success
of the activist’s campaign. We develop three measures of institutional ownership that reflects
likelihood of activist support. Over the 2004-2012 sample period, we find that the friendly
institutional owners are associated with higher stock returns (both short term and long term) and
higher operating performance of the target firm. Consistent with these investors being valuable to
activists, we find that ownership by activism-friendly institutions also significantly increases the
likelihood of being targeted by hedge fund activists. The paper is one of the first to document that
composition of institutional ownership has a significant impact on the likelihood of and value
created from hedge fund activism.
1 Simi Kedia is with Rutgers Business School and can be reached at [email protected]. Laura Starks is
with the McCombs Business School, UT Austin and can be reached at [email protected]. Xianjue Wang is
with Rutgers Business School and Southwestern University of Finance and Economics and can be reached at
[email protected]. We thank the seminar participants at Indian School of Business, Hyderabad for
helpful comments. We thank the Whitcomb Center for financial assistance.

2
1. Introduction
Hedge fund activists often claim that it is important to have large shareholders in the target
firm who are likely to support the activist through their votes and, perhaps more importantly,
their direct discussions with management and the board. Thus, the existence of such shareholders
helps accomplish the activist’s agenda. However, institutional investors vary in their responses to
hedge fund activism. Some institutions see hedge fund activism as effective in bringing about
change and hence are likely to be supportive. While other institutions are wary of the aggressive
tactics employed by some activists and believe that hedge fund activism may result in short term
price increase but is not sustainable.2
In this paper, we consider a firm’s composition of institutional ownership and whether these
owners are likely to be supportive of hedge fund activism. With over $15 trillion in assets, the
prime opportunity for support for hedge fund activists would come from the mutual fund
industry, which owns a substantial share of public equity. Consequently, we examine whether
mutual funds and other institutional investors provide support that has a significant impact on the
success of the activist’s campaign. If the ownership of the hedge fund’s target consists of
institutions that are supportive of the activist, there is more likelihood of additional pressure on
the target firm management to make the changes demanded by the activist. On the other hand, if
the institutional owners of the target firm are skeptical or antagonistic toward a hedge fund
activist (and supportive of management), the activist may find it difficult to bring about the
desired changes.
We develop three measures to capture the propensity of an institutional investor to
support the hedge fund activist. The first measure derives from the institutional investors’
2 “Activist Investors find Allies in Mutual, Pension Funds,” Reuters News, 9 April 2013. The article is available at
http://www.reuters.com/article/us-funds-activist-idUSBRE9380DU20130409

3
revealed preferences toward supporting the target firm’s management given their previous proxy
voting on that firm. When institutional investors are dissatisfied with a target firm they are more
likely to vote against management (or completely exit the firm by selling their shares). Those
dissatisfied institutional investors who continue to maintain their stake in the firm would thus be
expected to support an activist.
The second measure of institutions friendly to activists also derives from an institution’s
voting patterns, but in this case, rather than their previous voting on the target, we focus on the
institution’s voting against management of other firms who were previously activism targets. As
most institutions tend to vote with management, this measure captures the institution’s general
preferences regarding the involvement of activists in their portfolio firms. Such institutions have
revealed previous support for activists rather than management and presumably they would be
more open to an activist’s agenda with another firm.
The third measure designed to capture institutions who are more likely to support
activists is based on the institution’s investment behavior with regard to prior activism targets.
If the institution increased its ownership in prior targets subsequent to their being targeted, it
suggests that they have a positive view on the potential gains from the activism and hence would
be more likely to support activists in the future.
We first use these three measures of activism-friendly institutions to determine whether
their presence is associated with greater shareholder value from activism. We develop a sample
of 1,183 interventions by 217 hedge fund activists through hand collecting all 13D filings over
the 2004 to 2012 period and employing screens to identify whether hedge funds are the filers. To
determine whether investors expect the activism to pay off more in the presence of the friendly
institutions, we examine short term returns to the announcement of hedge fund activism, using

4
different trading day windows around the date of the 13D filing. We find that the average
cumulative abnormal returns (CARs) are significantly higher for the quartile of activism targets
with the highest pre-event activism-friendly institutional ownership relative to the quartile with
the lowest level of such shareholders. This result holds for all trading windows and for all three
measures of activism-friendly ownership. In multivariate regressions, we control for additional
variables including the pre-event ownership of other institutional investors and the activist along
with firm-level and case-specific variables. The level of pre-event activism-friendly ownership
remains positive and significantly associated with the announcement period returns to the
activism. The effect is economically significant as well. A one standard deviation increase in
the activism-friendly measure is associated with an increase in the [-2,+20] day CAR by 1.04%
to 1.41%, depending on the measure. Moreover, this effect is limited to the presence of the
activism-friendly shareholders. Other institutional ownership that is not classified as activism
friendly does not have significant coefficients in any of the specifications.
If investors expect the hedge fund activism to add value as implied by these short term
results, then we would expect any long term returns to the activism to be related to the activism-
friendly shareholders as well. Thus, we estimate buy and hold returns and four factor alphas for
calendar time portfolios, employing multiple horizons, i.e., 24, 36 and 60 months, and three
different benchmarks, i.e., the CRSP Value weighted index, the DGTW portfolios and the Fama-
French 48 industry classification. The results are consistent across all horizons, benchmarks and
for all three measures of activism-friendly ownership. Targets in quartiles with the highest
activism-friendly ownership have significantly higher buy and hold returns relative to targets in
the lowest quartile of activism-friendly ownership. Controlling for other institutional ownership,
firm and activism specific variables does not change the results – activism-friendly ownership is

5
positively associated with buy and hold returns while other institutional ownership has no
significant impact. A one standard deviation increase in the activism-friendly ownership is
associated with an increase in the 36-month buy and hold returns by 7.76% to 15.51%,
depending on the benchmarks and measure used. Results are similar though statistically weaker
with calendar time alphas.
Lastly, we examine the effect of activism-friendly ownership on the target’s post event
operating performance. Consistent with Chen, Harford and Li (2007) we estimate the abnormal
industry-adjusted return on assets (ROA) for the three and five year period following the
activism initiation. We find the operating performance to be significantly higher for targets in the
highest quartile of activism-friendly ownership relative to targets in the lowest quartile of these
investors. The results are robust to controls for other institutional ownership, firm and activism
specific controls. Once again the results are economically significant. A one standard deviation
increase in the activism-friendly measure is associated with an increase in abnormal industry-
adjusted three-year ROA by 2.12% to 3.26%, depending on the measure. In summary, we find
that targets with higher levels of pre event activism-friendly ownership have higher value created
from the activism, as captured by short term and long term stock returns as well as operating
performance.
Since we measure activism-friendly ownership in the quarter prior to the 13D filing, we
examine whether friendly institutions continue to maintain their presence in support of the
activist’s agenda after the 13D filing. Our results indicate that the friendly ownership is stable
four quarters prior and post the 13D filing.3
3 Further, these owners appear to remain friendly to the activists. Analysis of their voting in shareholder proposals in
the two years after targeting shows that whereas these institutions generally do not support shareholder proposals in
their proxy voting, they are significantly more likely to support the activist-sponsored proposals. Though this

6
An alternate interpretation of the results could be that friendly institutions are smart
investors and the higher returns we document in their presence arises not from their support of
the activist but rather their ability to pick the future targets or winners. To address this concern,
we form portfolios that go long the portfolio held by friendly institutions and short the portfolio
held by other institutions. Time series regressions of the monthly returns to the long/short
portfolio on the Fama-French-Carhart four-factor model shows that the alphas are negative and
significant. Friendly institutions are less likely than other institutions to select securities that earn
future abnormal returns. To further rule out the possibility that friendly institutions can pick
future activist targets, we examine whether friendly institutions increase or decrease their
holding of target firms in the quarters prior to 13D filing. We find that friendly institutions are
more likely to decrease their holdings of stocks that are later targeted. Further, long/short
portfolios based on target stocks in which they increase/decrease their holdings show no
evidence of positive and significant alpha. In summary, it is unlikely that the ability of friendly
institutions to pick future winners or future targets accounts for the results.
We next examine whether the presence of activism-friendly institutions increases the
likelihood that a firm will be targeted for hedge fund activism.4 In a matched sample, we find
that firms with higher levels of activism-friendly ownership in the pre-event quarter are more
likely to be targeted than control firms. Although other institutional ownership is also associated
with a higher likelihood of being targeted, the presence of activism-friendly institutional
ownership is significantly more likely than other institutional ownership to increase the
likelihood of being targeted.
evidence shows direct support of friendly institutions for the activist agenda, it should be interpreted with caution as
the sample of activist-sponsored proposals that are voted is very small. 4 Brav, Jiang, Partnoy, and Thomas (2008) examine firm characteristics that are more likely to be associated with
being targeted by hedge funds.

7
Hedge fund activism has been hailed by some as having the potential to solve the
monitoring and agency problems of widely held equity e.g., Bebchuk, Brav and Jiang (2015).
However, along with successful cases, there have been failures. That is, although average returns
are positive there still exist many instances in which hedge fund activism has been associated
with little or negative gains to shareholders. Our results point to a primary factor that helps
explain the cross-sectional variation in the value created from hedge fund activism, the presence
of activism-friendly owners. Thus, support from institutional shareholders appears to be crucial
to unlocking firm value through activism.
A large and growing literature characterizes institutions and their holdings, especially
considering investment horizon, turnover propensity and size of the stake, and shows that these
characteristics can impact institutional monitoring and corporate decision-making.5 We
contribute to this literature by characterizing institutions along a novel, but important, dimension,
their likelihood of supporting hedge fund activism. Moreover, this characterization of
institutional investors with respect to their support of hedge fund activism is different from other
characterizations of institutional investors used in the prior literature. The measure developed in
the paper can potentially be used to capture the fraction of the firm’s shareholder base that is
likely to join a conflict against management whether it occurs through activism or proxy voting.
This paper is also related to the growing literature on the performance impact of
shareholder activism. Although earlier papers tend to focus on institutional shareholder activism
and find little positive change, more recent papers examine hedge fund activism and find
significant short and long term returns (e.g., Brav, Jiang, Partnoy, and Thomas (2008), Clifford
5 See for e.g., Bushee (1998) and Chen, Harford and Li (2007)

8
(2008), and Bebchuk, Brav and Jiang (2015)).6 Further, studies have found other significant
effects on target firms from the hedge fund activism such as increased productivity.7 Whereas
existing literature has examined how performance varies by hedge fund characteristics and by
the nature of changes sought, there is yet little understanding of how institutional ownership and
its composition impacts the success of the activist’s campaign. Our paper fills this gap by
examining the composition of institutional ownership, with respect to the presence or not of
activism-friendly institutions, and how it impacts the success of the activism. Our paper is
complementary to that of Appel, Gormley and Keim (2016), who document the role of passive
mutual funds in supporting requests from hedge fund activists. We study a broader base of
activism-friendly institutions and target firms. Further we examine whether these institutions’
explicit or implicit support of the activist is positively associated with increases in value for
shareholders.8
The next section describes the data and the construction of activism-friendly measures.
Section 3 discusses the performance of firms after being targeted for activism, Section 4
examines friendly institution voting and stock picking ability, and Section 5 discusses the
likelihood of being targeted. Finally, Section 6 concludes.
6 See Gillan and Starks (2007) for a survey of the early literature on shareholder activism. The added returns from
activism by hedge funds are not universal for targeted firms. Greenwood and Schor (2009) document that targets
that are eventually acquired account for most of the returns from hedge fund activism (See also Boyson, Gantchev
and Shivdasani (2016), and Klein and Zur (2009)). 7 See Becht, Franks, Mayer and Rossi (2010), Boyson and Mooradian (2011) and Brav, Jiang and Kim (2015a). Also
see Brav, Jiang and Kim (2009), and Brav, Jiang and Kim (2015b) for surveys on recent studies on the impact of
hedge fund activism for target shareholders. 8 Appel, Gormley and Keim (2016) restrict their analysis to index funds and the target firms to those within the 500
bandwidth around the cutoff between the Russell 1000 and 2000 indexes.

9
2. Data Description
2.1 Sample
We construct a comprehensive list of hedge funds using five sources: 1) NIRI list of Top 200
Activist hedge funds, 2) The Altman Group list, 3) Conference Board Top 50 Activist Investors,
4) 13D Monitor and 5) Gantchev (2013).9 Using this list of hedge funds, we search the Securities
and Exchange Commission (SEC) EDGAR database for all 13D filings from 2000 to 2012 and
identify the activist filings by checking the name of the 13D filer against our list.10 This process
results in a preliminary sample of 2,156 activism cases initiated by 236 unique hedge fund
activists. We then exclude on-going cases, duplicative filings, and cases involving bankruptcy.
We also exclude cases in which the 13D holding of the hedge fund is less than 1% or greater
than 20% as these cases do not reflect typical activism and usually involve pre-activism major
financial transactions such as reorganization and initial public offering. We match the name of
the target firms with CRSP and Compustat and exclude targets that can be identified as ADRs,
closed-end funds, and certain types of financial firms.11 Finally, we require that data be available
to construct our measure of activism-friendly shareholders, described in the next section.12 This
process results in a final sample of 1,183 cases with 217 hedge fund activists over the 2004-
2012 period.13
9 The NIRI list is available at http://www.niri.org/Other-Content/Top200HedgeFunds.aspx). The Altman Group list
is available at http://www.niri.org/Other-Content/Exec-Alerts-PDFs/Hedge-Fund-Activists.aspx). 13DMonitor.com
tracks activism targets. Gantchev (2013) list the most frequent hedge fund activists from 2000 to 2007. 10 Schedule 13D is required to be filed within 10 days of the transaction that reaches the 5% ownership threshold.
The 13D lists the name of the target and filer, the number of shares and the purpose of the transaction. If the
intentions of the institution are “passive” they must file a 13G. There are 32,045 13D filings over this time period. 11 We exclude ADRs (first digit of shrcd from CRSP is 3), closed-end funds (shrcd 14), REITS (siccd 6798),
investment advice (siccd 6282) blank check entities (siccd 6770), and security brokers (siccd 6200). 12 We obtain the institutional holdings in the target firms from the Thomson Reuters 13F data. 13 Measure 3 of activism-friendly ownership requires four years of data prior to activism and therefore is first
available for targets in 2004. Measure 1 and 2 are constructed from voting patterns of institutions and are available
from 2007 onwards.

10
The distribution of the number of target firms in our sample each year is displayed in
Table 1. Hedge fund activism increases steadily between 2004 and 2007, but drops during the
financial crisis. This activity is consistent with trends reported in prior work (See Bebchuk, Brav,
and Jiang (2015) and Gantchev (2013)). The distribution of events by activists is positively
skewed with a mean per hedge fund of 5.45 cases and a median of 3 cases. Appendix Table 1
shows the distribution of activism cases for hedge funds that initiated at least 15 activism events
during the sample period.
From the initial 13D filings and any subsequent amendments we collect all requests for
change made by the activist. We then identify potential outcomes of the activism through 8-Ks
filed by the target firm, web search, and SDC Platinum Database. These requests are categorized
in Table 2 with the majority of the cases (610) having no specific requests. The remaining 573
cases have at least one request with the most common being merger related, which accounts for
about 39.6% of all cases, followed by governance-related requests, which account for 34% of the
cases.
We define the activist’s campaign as successful if at least one request is fulfilled, even if
it is not fulfilled in its original form, but an agreement is reached with the activist. (For example,
the activist could request that the target firm be acquired, but the final result is an agreement
between the activist and the target that allows the activist to nominate directors.) In our sample
the highest success rate among the different categories of requests are found in the governance
related requests, which have successful requests 62.56% of the time.
2.2 Measures of Activism-friendly Shareholders
As discussed earlier, institutional investors vary in their responses to hedge fund with
some believing that hedge fund activists can help increase firm value, and others disagreeing.
11
Further, institutional investors are not constant in their support, favoring some activist causes,
but not others. In this section, we develop measures to capture the propensity of an institution to
support hedge fund activism in general.
2.2.1 Dissatisfied Shareholders as Activism-Friendly Shareholders
The first measure for institutions likely to be activism friendly is based on how satisfied
the shareholders are with the target’s current management. If existing institutional owners of the
target firm are unhappy with the management, they are more likely to be supportive of the
changes being requested by the hedge fund activist. In fact, such institutions will at times even
request hedge fund intervention. For example, William Ackman, founder of hedge fund Pershing
Square, has stated, “Periodically, we are approached by large institutions who are disappointed
with the performance of companies they are invested in to see if we would be interested in
playing an active role in effectuating change.” Institutional investors are even reported to have an
informal term for this, R.F.A., or request for activist.14 Further, hedge funds will look for
dissatisfied shareholders in their intervention decision. For example, Eric Rosenfeld, founder of
Crescendo Partners, has remarked, “The requirement for us is to have disgruntled shareholders,
or shareholders that want change and will support us.”15
To construct a measure to capture firms that have these dissatisfied institutions as
shareholders, we use voting data, which requires us to focus on mutual funds due to voting data
limitations on other types of institutions. For a firm that was targeted in quarter q, the measure
SUFFER is the percentage ownership of all institutions in the prior quarter, i.e., q-1, that are
classified as dissatisfied or unhappy with management. An institution is classified as such if it
14 Available at http://www.bloombergview.com/articles/2014-03-19/activist-hedge-funds-are-making-friends 15 See https://www.youtube.com/watch?v=dfMaFCw10Yo

12
voted against the target firm management on proxies at least once in the prior three years. We
use Risk Metrics’ ISS Voting Analytics database to access mutual fund proxy voting records,
which begins in 2004. As we require voting history for three years to construct this measure, it is
limited to the 2007-2012 period and is available for 656 of the sample targets.
Table 3 provides summary statistics for the measures of activism-friendly institutional
ownership in the target firm as well as other measures of institutional ownership. The mean
ownership by institutions classified as SUFFER is 3.7% and the median is zero, thus, the targets
do not have large ownership by institutional investors who have previously voted against
management. Further, not surprisingly, the majority of the target firms have all of their
institutions voting with management, as is usually the case for proxy votes in general. However,
as measured by their voting behavior, in about one quarter of the targets there exists a significant
fraction of institutions that are unhappy with management.
2.2.2 Shareholders Voting against Management in Prior Activism Cases
The second measure designed to capture institutions likely to be activism friendly is
based on an institution’s support, or lack thereof, for other firms that have been targeted by
hedge funds in which the institution was a shareholder. An institution that favors activism, in
general, is more likely to have voted with an activist and against target management in prior
activism campaigns. In our definition, an institution is classified as being supportive of activism
if it voted against management in any firm targeted by activists in the prior three years. The
measure VOTER is the percentage of the firm held by activism-friendly institutions, as defined
above, in the quarter prior to the firm’s targeting.16 As we require three years of voting data for
this measure, it is also limited to the 2007-2012 period. For the 656 targets for which we can
16 For further details on the construction of this measure see Appendix A.

13
construct this measure, Table 3 shows that the mean value of VOTER is quite high at 19.4%,
with the median being of similar value. Comparing the SUFFER measure to the VOTER
measure shows that although the vast majority of the institutional ownership in the target firms
have not voted against management in the past, the ownership indicates a significant percentage
has the propensity to vote with activists given they have done so in their other portfolio holdings.
2.2.3 Increase in Ownership During Activist Campaigns
The third measure we employ to identify institutions with a higher propensity to support
activism is based on the institutions’ holding decisions in prior activism events for other firms.
That is, if the institution has tended to increase its ownership in prior targets, it is more likely to
support current activism campaigns. For this measure, an institution is regarded as being
supportive if it increased its ownership in another firm after that firm was targeted by hedge fund
activists.17 Specifically, if the proportion of targets, in the past three years, in which the
institution increases its ownership is in the top quartile, the institution is classified as being
supportive of activism. The variable OWNINC is the fractional ownership of the target firm by
all supportive institutions in the quarter prior to being targeted.18
The mean value of OWNINC is 8.5% as seen in Table 3. In other words, the average
ownership by institutions deemed friendly to activism in the quarter prior to the 13D filing is
8.5%. This is in comparison to 50.2%, the average ownership by all institutions, referred to as
TOTINT, in targeted firms in the quarter prior to being targeted. Activism-friendly ownership
by this measure is similar in magnitude to the average ownership by the activist hedge fund as
reported in the initial 13D filing and referred to as INITHOLD of 7.5 percentage.
17 If the institution’s average ownership in the five quarters after the event, including the event quarter, is positive
and greater than its average ownership in the four quarters prior to the event it is classified as being supportive. 18 For further details on the construction of this measure see Appendix A.

14
2.2.4 Other Measures of Institutional Ownership
There exist several characterizations of institutional ownership that have been used in the
prior literature. One common measure of investment style developed by Bushee (1998) is based
on portfolio turnover and size of holdings. Institutions with relatively high portfolio turnover
rates and diversified holdings are characterized as transient (TRA) investors; institutions with
relatively low portfolio turnover and diversified holdings are characterized as quasi-indexers
(QIX); and those with relatively low turnover rates and large investments are characterized as
dedicated (DED). 19 Table 3 provides the summary statistics for these measures of institutional
ownership in the target firms. The quasi-indexers have the largest percentage ownership at about
26%, with transient investors at 13% ownership and dedicated investors being almost 5%.
Finally, we measure the independent long term investors (ILTI) of Chen, Harford and Li
(2007). This variable is measured by finding for each of the target firms the percentage
ownership controlled by the top 5 institutional investors as in Hartzell and Starks (2003) and
separating them into two groups according to whether they are in the top 5 for the year before
targeting. As Table 3 indicates, the target firms have about 13% ownership by the ILTI investors.
Table 4 provides the correlations between our activism-friendly ownership measures and
the other institutional ownership measures. We find that the correlation between two of our
activism-friendly measures, OWNINC and VOTER, that is, between the ownership in our firms
by institutions that increased their ownership in other firms previously targeted and ownership by
institutions that voted in support of activists in other firms is higher than with the third measure
(SUFFER). Bushee’s measures capture the investment horizon of institutional investors and are
different from the measures developed here that capture an institution’s propensity to support
19 The classification of the institutions as TRA, QIX and DED are obtained from Brian Bushee’s website at
http://acct3.wharton.upenn.edu/faculty/bushee/

15
activism. As can been seen in Table 4, the highest correlation of our measures is with QIX, the
indexers. The correlations of all Bushee measures are the smallest with the SUFFER variable.
This is also not surprising as SUFFER is constructed based on institutional views on a specific
firm rather than general characteristics. We also examine the relation with the ILTI and find the
correlations of this measure with all three of the activism-friendly measures to be low.
The measures of activism support developed in this paper, however, capture a different
dimension of institutional preferences than that of investment horizon or trading frequency used
earlier in the literature.20 Our characterization of institutional preferences can be used more
generally to capture the likelihood of an institution questioning and opposing firm management.
Note, that an institution’s support for hedge fund activism may evolve over time. Funds that did
not initially support hedge funds, like some pension funds, have begun to support activism over
time. As our measure is based on behavior over the previous three years, it allows for an
institution’s stance on activism to change and evolve over time.
3. Performance of Target Firms
We use several performance criteria to study how the composition of institutional
ownership of the target firms has an impact on the hedge fund’s activist campaign. Does a
greater presence of institutions that support activism allow hedge fund activists to push for and
successfully obtain more meaningful changes from the target firm management? Do the hedge
funds’ changes result in increased value for the firm? We examine the role of the target’s
20 In untabulated results we use the Bushee measures, as well as the ILTI measure developed by Chen, Harford and
Li (2007) in target performance regressions. Most coefficients are insignificant. Sometimes there are negative
significant coefficients (mostly for operating performance) and sometimes there are positive significant coefficient
for some specifications of buy and hold returns. We discuss the role of quasi-indexers (QIX) later in the paper.

16
institutional composition on the shareholder returns generated from activism using different
performance criteria.
3.1 Requests
As discussed above, activists will often request the target firm to make specific changes
as part of their campaign. Whether or not the target complies with this request, is an intuitive
way to ascertain whether the activist was successful in its objectives. Therefore, we begin by
first examining the impact of activism-friendly ownership on the likelihood that the target agrees
to the hedge fund requests.
For the 48% of the sample for which requests are reported, we create four quartiles based
on the levels of activism-friendly institutional ownership as captured by the first measure
SUFFER. Table 5 reports the fraction of successful requests for each quartile. The first quartile,
Q1 with the lowest level of SUFFER has 56.5% successful requests while the fourth quartile, Q4
with the highest value of SUFFER has 68.3% of successful requests. Targets with greater
ownership by dissatisfied institutional shareholders (Q4) are more likely to grant the activist
request relative to targets in Q1, though the difference between Q4 and Q1 is significant only at
the 11% level (Test 1). Next, we test and find statistically significant evidence that the
likelihood of successful requests is not independent of the activism-friendly quartiles (Test 2).
Results are qualitatively similar when we use VOTER, the second measure. When we
use OWNINC, the third measure, to capture activism-friendly ownership, we find that the
success rate of requests in Q4 is significantly higher than the success rate in Q1. However, we
find that Test2, the test for the independence of the distribution is not significant. Overall, the
results suggest that targets with higher levels of activism-friendly institutional ownership are
more likely to comply with the requests made by the hedge fund activist.

17
It should be noted that although implementation of requests may be an intuitive measure
of the activist’s success, it also suffers from several shortcomings. In particular, in about half the
cases the activists do not make any reported specific request and consequently, the measure is
unavailable and success cannot be measured. As Mason Morfit, a Partner at ValueAct Capital
states, “a lot of cases go behind the scenes.”21 Further, in cases where requests are made, it is not
clear whether the request creates shareholder value for the target firms or not. While, we report
the success of activists in their requests, we next examine stock returns as they are more likely to
capture the value generated from hedge fund activism.
3.2 Short Term Returns Around the Announcement of Activism
In this section, we examine the short term performance of the target firm around the
announcement of the activism, defined as the 13D filing, by estimating cumulative abnormal
returns (CARs) using several different trading day windows. The CARS are calculated in excess
of the CRSP value weighted index.
We first examine differences within quartiles of targets formed on the basis of the level
of activism-friendly institutional ownership. As shown in Table 6, Panel A, the mean abnormal
returns over the [-2,+20] trading day window around the 13D filing is 1.5% for targets in Q1, the
lowest quartile by value of SUFFER. This is significantly smaller than the 6.4% seen for targets
in Q4, the highest quartile of SUFFER. A similar result is shown for the measures of activism-
friendly ownership and the other specifications based on median differences and the shorter
trading day window.
To understand what drives the differences in market reaction to the announcement of
activism, we run cross sectional regressions where the dependent variable is the CAR with the
21 See http://www.youtube.com/watch?v=jy1l3rOAKjY

18
variables of interest being the different measures of activism-friendly institutional ownership.
We also control for other firm characteristics and other institutional ownership and the hedge
fund activist’s ownership. The variable Nofrd_SUF is the percentage ownership by all
institutions, other than those classified as SUFFER and by the hedge fund activist, in the quarter
prior to being targeted. Similarly, Nofrd_VOTER (Nofrd_OWNINC) is the percentage
ownership by all institutions, other than those classified as VOTER (OWNINC) and by the
hedge fund activist, in the quarter prior to being targeted. We control for pre targeting ownership
by the hedge fund activist by including PRE13F, a dummy that takes the value of one if the
activist had greater than 1% ownership in the quarter prior to the 13D filing. We control for the
target firm performance prior to being targeted by including PRE12_STK the monthly
compounded stock return over the twelve month prior to the 13D filing. We also control for firm
size (SIZE) which is the natural log of total assets, and firm leverage (LEV) which is the ratio of
book value of debt to total assets. Lastly, we include controls for the kind of requests made by
the activist. Specifically, we include COMMONLY is a dummy for events with no request
made in 13D filings. CSREQ (MERGREQ) [GOVREQ] are dummies that take the value of one
when the activist makes requests related to capital structure (merger) [governance]. We also
include year and industry fixed effects.
We report the results in Table 7. The coefficients for SUFFER, VOTER and OWNINC
are positive and significant for most of the specifications. Further, there is economic significance
as well. For example, a one standard deviation increase in the value of OWNINC is associated
with a 1% increase in the [-2, +20] days CAR. In addition, while the CAR is significantly related
to the three measures of activism-friendly ownership, it is not related to the other institutional
ownership variables. The coefficient of Nofrd_SUF, or the corresponding variables for the other
19
measures, is not significant in any specification. We test for whether the effect of activism-
friendly institutional ownership differs from the effect of other institutional ownership. As can
be seen in the last row of Table 7, in most specifications there is significantly greater impact of
activism-friendly ownership on short term returns to hedge fund activism.
The announcement return is also not significantly related to the ownership by the hedge
fund activist prior to targeting, PRE13F. The coefficient of PRE12_STK is negative and
significant. Not surprisingly, the higher the stock market performance of the target in the year
prior to being targeted the lower is the perceived potential of further improvements by the
activist. Overall, the evidence suggests that targets with higher levels of activism-friendly
ownership prior to being targeted have higher announcement returns to activism, which would be
consistent with investors expecting such activism to have a higher probability of success.
3.3 Long Term Abnormal Performance
Although returns around announcements capture the market view of the potential value to
be created through the activism campaign, it is possible that the market’s expectations are not
borne out. Thus, we also examine longer term returns to the activism. We use two commonly
used measures of long term abnormal performance, buy and hold abnormal returns and alphas
from a four factor model applied to calendar time portfolios.22 We estimate these long term
returns over different holding periods.
4.3.1 Buy and Hold Abnormal returns (BHAR)
In line with prior analysis, we estimate buy and hold returns for different quartiles by the
level of activism-friendly institutional ownership over different holding periods. To study the
22 See Brav, Jiang, Partnoy and Thomas (2008), Bebchuk, Brav and Jiang (2015), Duchin and Schmidt (2013), and
Fu, Lin and Officer (2013) among others for estimation of long term returns.

20
role of activism-friendly ownership, we compare the post event performance of targets with high
friendly institutional ownership to targets with low friendly ownership. To estimate benchmark
adjusted buy and hold returns, we estimate the following
𝐵𝐻𝐴𝑅𝑖[1, 𝑇] = (∏(1 + 𝑅𝑖,𝑡
𝑇
𝑡=1
)) − (∏(1 + 𝑅𝑏,𝑡)
𝑇
𝑡=1
)
Where the event month is designated as zero and T represents the holding period i.e., 24, 36, and
60 months. 𝑅𝑖,𝑡 is the monthly CRSP return for stock i in month t and 𝑅𝑏,𝑡 is the montly return
to the benchmark in month t. We use several different benchmarks. The first benchmark is the
value weigted CRSP index and the corresponding buy and hold returns referred to as market
adjsuted BHAR.23 The second is the DGTW (size, book to market and momemtum)
benchmarks which have been obtained from Russ Wermers.24 The last benchmark is the
industry, as captured by the Fama French 48 industry of the target firm, and are referred to as
industry adjusted BHARs.
The market adjusted BHARs for the 36 month period for quartile Q4, with the highest
level of SUFFER is 25% and are significantly higher than 1.1% for quartile Q1, with the lowest
level of SUFFER (See Panel A, Appendix Table 2). The results are similar for all holding
periods, for all the three different benchmarks used and when quartiles are formed on the basis of
VOTER (Panel B) or OWNINC (Panel C).
23 We use “<=” instead of “=” to estimate long term returns. This reduces loss of observations from firms
disappearing due to post-event mergers, delisting, or other major events. This implies that long term returns may
capture shorter period. As our results are not sensitive to window choices any biases introduced are not likely large.
Also note that ideally we should use benchmark returns that excludes the target firm, but given the population of
stocks in any benchmark portfolio employed, we do not expect such an exclusion to influence our results. 24 The DGTW benchmarks are available http://www.smith.umd.edu/faculty/rwermers/ftpsite/Dgtw/coverpage.htm”
For further details see Daniel, Grinblatt, Titman, and Wermers (1997) and Wermers (2003). For DGTW
benchmarks, if the event month is in between January and June, we use benchmark assignments in June of the prior
year. If the event month is between July and Decemeber we use assignments in June of the same year. All stocks in
the benchmark are value weigthed.

21
Next, we control for factors, other than activism-friendly ownership, that are likely to
drive the differences in long term buy and hold returns. As in Table 7 we control for the non
actitivsm-friendly institutional ownership, the ownership by the hedge fund activist prior to the
13D filing, the presence and kind of requests made by the activist, firm charactertics and year
and industry dummies.
As seen in Table 8, Panel A the coefficient of SUFFER is positive and signficant in all
the specifications. For brevity, we have tabulated the results for the 36 month holding periods
for the three benchmarks. The results are also highly economically significant. A one standard
deviation increase in SUFFER is associated with an increase in the 36 month BHAR by 7.76% to
9.72% depending on the benchmark used. The results for the other holding periods (24 and 60
months) are qualitatively similar. The coefficient for other institutional ownerhsip, Nofrd_SUF
is not significant in any specification. We test and find that the effect of SUFFER is signficantly
higher than that of other institutional ownership as can be seen by the p value at the bottom of
Panel A. The coefficient of COMMONLY and GOVREQ are also positive and signficant in
many of the specifications. This suggests that governance related requests and activism
campaigns without any explicit requests are associated with the greatest increases in long term
returns for shareholders. The results for the other measures of activism-friendly ownership are
tabulated in Panel B for VOTER and Panel C for OWNINC and are qualitatively similar and
have somewhat higher economic significance.25 In sum, the evidence suggests that targets with
higher levels of activism-friendly institutional ownership earn higher benchmark-adjusted buy
and hold returns.
25 A one standard deviation increase in VOTER (OWNINC) is associated with an increase in 36 month BHARs by
11.52% to 14.36% (12.30% to 15.51%) depending on the benchmarks used.

22
3.3.2 Calendar Time Portfolio
We also estimate long term returns using calendar time portfolios. In each month of our
sample period, we form a portfolio of firms that were targeted by hedge funds activists in the
previous 12, 24, 36, 48, or 60 months and had the highest quartile of ownership by friendly
institutions in the quarter prior to the event. The portfolio is rebalanced monthly to add firms
that have been targeted recently and drop firms that reach the end of their holding period. We
use both equal weights and value weights to calculate portfolio returns, to what we refer to as the
high activism-friendly ownership portfolio. We form another portfolio of firms targeted by hedge
funds that have ownership in the lowest quartile of ownership by friendly institutions over
different holding period and monthly rebalancing as described above. We calculate monthly
equal and value weighted returns of this portfolio, referred to as the low activism-friendly
ownership portfolio.
The monthly returns for the high and low activism-friendly ownership portfolios are
regressed on monthly returns of the portfolio of risk factors – market excess return, small-minus-
big, high-minus-low, and up-minus-down. Specifically we estimate the Fama-French-Carhart
four factor model as follows:
𝑅𝑝,𝑡 − 𝑟𝑓,𝑡 = 𝑎𝑝 + 𝑏𝑝(𝑅𝑚,𝑡 − 𝑟𝑓,𝑡) + 𝑠𝑝𝑆𝑀𝐵𝑡 + ℎ𝑝𝐻𝑀𝐿𝑡 +𝑚𝑝𝑈𝑀𝐷𝑡 + 𝑒𝑝,𝑡
Appendix Table 3 reports the calendar time regression intercepts (alphas) shown in percentage
terms for each of the different portfolios and time frames.26 The long high activism-friendly and
26 As the number of portfolio firms vary dramatically in our sample period, we follow BBJ14 and use Weighted
Least Square estimation that uses the number of portfolio firms as the weights. We find that the results are similar if
we use an OLS estimation. We require each portfolio at any point in time to have at least 3 firms. This is lower
than the 10 required by BBJ14 as we are looking at targets with high and low activism support ownership in contrast
to all target firms by BBJ14. Rf is 3-month T-bill rate.

23
short low activism-friendly portfolio (High –Low) has a significant positive alpha per month for
most specifications with the results being stronger for equal weighted portfolios.
3.4 Operating Performance
If hedge fund activism creates shareholder value by bringing about change in the target
firm, then it should also be reflected in the firm’s operating performance. This section discusses
the impact of activism-friendly institutional ownership on the change in the target firms
operating performance after being targeted.
To capture operating performance we use Return on Assets (ROA), which is net income
over lagged total assets. As ROA is likely impacted by industry wide factors, we control for this
in line with Chen, Harford and Li (2007) and estimate abnormal ROA. This approach is
conducted in two steps. First we calcuate industry-adjusted ROA as the difference between the
ROA and the median ROA for all firms in the same Fama French 48 industry as the targeted
firm. Second, we regress the three year (or the relevant holding period) average industry
adjusted ROA on the corresponding value pre event year to control for possible impact of pre
event performance.27 The residual from this regression, referred to RROA, is the abnormal
change in industry-adjusted ROA after being targeted by the activist.
The average differences in abnormal ROA for the quartiles formed on the basis of
activism-friendly institutional ownership are tabulated in Appendix Table 4. The mean RROA
for the three years following the activism event is -2.5% for Q1 which has the lowest level of
SUFFER. The mean value for Q4, with the highest level of SUFFER is 3.8% and the difference
27 We estimate abnormal ROA for several holdings periods, specifically 1, 2, 3, 4 and five years. We report the
results for three and five year period for brevity. The results with other holding period are available on request and
give qualitatively similar results.

24
between the two is highly significant. The results are similar for different horizons and for
VOTER and OWNINC, the other measures of activsim friendly owenrship.
The abnormal ROA is industry adjsusted and also controls for the effect of pre event
performance. However, factors other than activism-friendly ownership could impact operating
perofrmance and in Table 9 we control for these. Like before we control for ownership by other
institutions and by the hedge fund activist in the pre event quarter. We control for the nature of
requests by the hedge fund activist if any and for firm level characteristics. We include year
fixed effects but not industry fixed effects as the return on assets is already industry adjusted.
The coefficient of SUFFER is positive and both statistically and economically significant
(See Table 9). A one standard deviation increase in SUFFER is associated with an increase in
three year abnormal industry adjsuted ROA of 2.21%. The coefficients of the other two measures
are also significant in all the specifications and have similar economic impact. The coefficient
for other insitutional ownership is positive but not significant when we use SUFFER as the
measure. For the other two measures, the coefficient of other institutional onwerhsip is negative
and becomes significant for OWNINC for one specification. High institutional ownership is not
generally associated with better post activism operating performance. It is only ownership by
acitivsm-friendly institutions that is associated with gains in operating performance. Not
surprisingly, leverage is positively related to abnormal performance.
4. Corollary Hypotheses
Three corollary hypotheses arise from our original hypothese. The first is that if the
activism-friendly institutions (as we classify them) actually support the activist then we should
observe that they remain invested in the target firm during the activism and that if the activists
submit shareholder proposals, they should have a tendency to vote in favor of those proposals.

25
The second corollary hypothesis is that the higher return we document should arise from the
activism-friendly institutions’ support of the activist rather than their being smart investors with
the ability to select the future targets in advance of the activism. The third corollary hypothesis
is that the higher return to activism-friendly ownership should be distinct from other institutional
attributes like indexing that have been shown to cause governance changes.
4.1 Support by Activism-Friendly Institutions
Since we employ the ownership level of activism-friendly institutions in the quarter prior
to being targeted to capture their role, we should also observe that these investors maintain their
holdings, that is, they should not sell their holdings in the quarters following the 13D filing.
Otherwise, the higher buy and hold returns or operating performance in the months following the
targeting should not be attributed to the presence of these activism-friendly institutions. We find
that the average holding period for institutions classifed as activism friendly in the target firm
after being targeted is more than 9 quarters.28 Thus, activism-friendly institutions appear to hold
the firm for an average of 2 years after the targetting. As a further analysis, we examine the
aggregate holdings of activism-friendly institutions around the 13D filing. Tthe aggregate
ownership by activism-friendly shareholders is relatively stable from four quarters prior to four
quarters post the 13D filing (See Appendix Table 5).
To test more direct support for the activists by activism-friendly institutions, we examine
shareholder proposals submitted by the activists in the target firm and examine the voting
28 The holding period for other institutions, not classified as activism friendly, in the target firms post event is on
average 7.6 quarters Note that since the last quarter to be included in the analysis is March 2013, this truncates the
reported holding period for firms targeted in the later years of our sample. The mean post holding period for
institutions classified as SUFFER is 10 quarters, for VOTER is 9.3 quarters and for OWNINC is 10.4 quarters. The
average pre-event holding period for institutions classified as SUFFER (VOTER) [OWNINC] is 27.5 (20.9) [21.5]
quarters while for other institutional owners it is 11.4 quarters. The institutions classified as activism friendly appear
to hold the target firms over a long period of time.

26
behavior on these proposals by the activism-friendly institutions as compared to other institutions
holding shares of the firm. Of the 656 targets that we can match to ISS data, 523 hold a meeting
over the two years following the 13D filing and 35 of these have at least one shareholder
proposal submitted by the activist. These activists often submit multiple proposals so that overall
there are 301 activist-sponsored proposals in these 35 cases.29
We find that the incidence of activist proposals increases with the presence of activism-
friendly ownership. In the first quartile of such ownership as measured by the SUFFER variable,
only 0.55% of all proposals are sponsored by the activist. The percentage of activism-sponsored
shareholder proposals increases to 3.01% for the fourth quartile of SUFFER ownership and the
difference is significant (see Appendix Table 6).30 This suggests more aggressive tactics by the
activist when activist-friendly ownership is high.
Next we examine the voting by instituitons on these proposals to examine if the friendly
institutions are indeed more likley to support the activist. Of the 301 activist sponsored proposals
we observe voting in only 10 proposals.31 Though this is a very small sample we still examine
voting by friendly institutions. This analysis conducted at the fund vote level, includes all
shareholder sponsored propsals for target firms in the two years after 13D filing. The dummy
variable Activist Sponsored identifies proposals sponsored by the activist. Friendly Institution is
a dummy that takes the value of one if the institution voting is classified as friendly. The
interaction of the two captures the vote of friendly institutions in activist sponsored proposals.
29 This number of proposals is relative to 184 proposals by other shareholders and 7,925 management-sponsored
proposals in the 523 target firms with voting data in ISS in the two years after the 13D filing. 30 The results displayed use pre 13D ownership of friendly institutions for the quartiles. The results are similar if
quartiles are based on pre meeting ownership by friendly institutions. The results are also significant for the
OWNINC at 1% level and for VOTER at the 11% level 31 This voting is seen in only 8 of the 35 target firms with activist-sponsored proposals. This is because some
proposals are not put to vote. The proposal data is from firm 10-Q and the voting data is from mutual fund N-PX
and there might be some discrepancy between them.

27
We also include all control variables included in prior tables along with proposal and year fixed
effects.
As seen in Table 10, the interaction of Friendly Institution and Activist Sponsored is
positive and significant while that of Friendly Institutions is negative and significant for all
measures of friendly institutions. This suggets that whereas friendly institutions do not support
shareholder proposals in general they are significantly more likely to support those sponsored by
the activist. The coefficient of activist sponsored proposals tends to be positive suggesting that
these on average receive support from other funds. Though these results are suggestive of the
support given by friendly institutions to activists, they should be interpreted with caution as they
are based on only 10 activist sponsored proposals.
4.2 Smart Investors
Another concern with the results is that the positive association between friendly
ownership and future abnormal stock returns could be driven by the stock picking ability of
friendly insitutions, i.e., they invest in firms that are likely to be targeted or firms that are likely
to outperform in the future, regardless of the support for activism agenda. To address these
issues, we perform the following three analyses.
4.2.1 Activism-Friendly Institutions vs. Other Institutions
In this section, we examine stock picking ability of friendly institutions relative to other
institutions. Specifically, we form portfolios based on all the holdings of both friendly and other
institutions in the 13F data. Each month, we long the value-weighted portfolio based on the
holdings of all friendly institutions, and short the value-weighted portfolio based on holdings of

28
all other institutions. The portfolios are rebalanced every quarter.32 We conduct time series
regression of month returns of long and short portfolios on Fama-French-Carhart four factors.
We use Weighted Least Square to adjust for the variation in number of securities in the portfolio.
If friendly institutions are able to consistently outperform other institutions, the alpha or the
regression intercept should be positive and significant. The estimation involves 108 months for
the OWNINC measure of friendly institution and 72 months for the other two measures.
As seen in Panel A of Table 11, the value-weighted alphas are negative and significant
for all the three measures of friendly institutions. The negative and significant alpha shows that
friendly institutions are less likely than other institutions to select securities that can earn future
abnormal returns. For robustness, we only use non-target firms to form the portfolios (“Non-
targets”). Finally, we also form the long (short) value-weighted portfolio for each institution-
month, and average across all friendly (non-friendly) institutions in that month (“Average value-
weighted”). Neither of the tests support the premise that friendly institutions are more likely to
select outperforming securities.
4.2.2 Activism-Friendly Institutions Holdings of Target Firms
The above tests only show the general selection ability of the institutions. However, since
the target firms represent a small fraction of the 13F space friendly institutions could still have
selective ability to pick the firms that are likely to be targets of hedge fund activists. If they are
better at selecting targets, then they are more likely to increase their holdings of these in the
quarters prior to the 13D filing to maximize their returns.
32 Note that the same portfolio firm may appear in both long portfolio and short portfolio. Also note that we only use
value-weighted portfolio because the amount of investment itself is also a choice of the institution, which should be
included as we examine the selection ability.

29
Based on the portfolio held by friendly institutions, we assign Up-targeted dummy the
value 1 for an institution-firm-quarter if the institution increases holding and the firm is targeted
in the next quarter and zero if there is holding increase but the firm is not targeted. Similarly, we
assign Down-targeted dummy the value 1 if the institution decreases holding and the firm is
targeted and 0 if there is decrease in holding but the firm is not targeted. We then conduct test of
proportions on the two dummies for the institution-firm-quarter observations.33
The results shown in Panel B of Table 11, show that when friendly institution increase
their holding in the firm, it is less likely to be targeted by a hedge fund activist in the next
qurater. As a robustness test, we also generated the up/down dummy based on the average
holding change in the past 4 quarters (Year Prior), and results show no evidence that friendly
institutions are able to forecast which firms will be targeted based on their holding decisions.
4.2.3 Returns based on Activism-Friendly Institutions Holdings of Target Firms
In the above section, we capture binary measures of increases and decreases in the target
holdings of activism-friendly institutions but do not consider the magnitudes. In this section, we
form value-weighted long (short) portfolio based on the increase (decrease) of friendly institution
holdings in target firms in the quarter prior to targeting. The portfolios are rebalanced each
quarter to add newly targeted firms and drop firms no longer held by an institution. Then we
conduct time series regression of monthly returns of long and short portfolios on Fama-French-
Carhart four factors. We use Weighted Least Square to adjust for the variation in number of
33
The number of institution-firm-quarter observations are 2,790,451 (3,108,193) [1,871,038] for OWNINC
(VOTER) [SUFFER] friendly institutions respectively. The number of observation varies by the number of
institutions identified as friendly (VOTER having the highest number of institutions), by the number of years the
friendly measure covers (OWNINC covers from 2004 to 2012, while the others cover from 2007 to 2012), and by
the portfolio size of each institution.

30
securities in the portfolio. If friendly institutions are able to pick the targets then the returns to
the above long short portfolio should be positive and significant.34
As can be seen in Panel C of Table 11, the alphas tend to be negative and insignificant.
For robustness, we measure increase/decrease using average holding change in the past 4
quarters prior to targeting (“Yearly average”). Finally, for robustness, we also first form
portfolio for each institution-month, then average across all institutions for each month
(“Average value-weighted”). The results are similar: the estimated alphas are never significant.
The results suggest that friendly institutions do not display any general ability to pick winners or
specific ability to pick targets of hedge fund activists.
4.3 Indexers
Appel, Gormley and Keim (2016) find that passive institutional investors influence firm’s
governance choices and increase in passive ownership is associated with an increase in long run
ROA. As many of the institutions classified as friendly by our measures are likely to be
indexers, in this section we examine if the higher returns from activism-friendly ownership are
distinct from those that might arise from passive ownership.
Appel, Gormley and Keim (2016) use mutual fund names to categorize them as indexers
and their ownership (S12) to capture passive ownership. They also use Bushee’s (1998)
classification of indexers, referred to as QIX, as an alternative measure to capture passive
ownership. We include ownership by institutions classified as QIX in the pre-event quarter to
control for their possible impact on long run returns from activism. As seen in the Table 12, the
34 Note that the same stock may appear in both the increase and the decrease portfolios, if some friendly institutions
increase holding and others decrease holding. Note that we focus on value-weighted portfolios in examination of
selection ability.
31
inclusion of pre-event ownership by institutions classified as QIX does not impact activism-
friendly results that continue to be significant. QIX by itself is not significant in explaining
value generated from hedge fund activism.35
The results complement those of Appel, Gormley and Keim (2016) in delineating the role
of passive ownership. As shown by Appel, Gormley and Keim (2016) passive ownership is
associated with governance changes even without the activist, and is likely to reduce the
likelihood of the firm being targeted by activists. Some of the passive owners however are
friendly to activists while many are not.36 Those among the indexers that are friendly to activists,
along with other friendly institutions that are not indexers, can help bring about change in firm’s
by another channel – supporting the activist’s agenda. In sum, the results suggest that the
success of the activist’s campaign depends on the institutions that are friendly and likely to
support the activist’s agenda.
4.4 Robustness Analysis
We have followed prior literature in controlling for firm specific characeristics and case
specific characteristics in our multivariate regressions for the different performance measures. In
robustness tests we control for the reputation of the hedge fund activist. An activist campaign
by a reputed hedge fund activist might lead to higher announcemnt period returns and more
35 Appel, Gormley and Keim (2016) also use another alternate measure to capture passive ownership. They use the
ownership of the three largest indexers, that is ownership by Barclays, State Street and Vanguard. These three
institutions are categorized as friendly for the entire sample period by two of our measures (VOTER and OWNINC)
and for majority of the cases by the third measure (SUFFER). Consequently, it is hard to control for passive
ownership that is not friendly. Alternatively, we examine whether the returns to friendly ownership that we
document is confined to these three institutions or due to the other institutions that are categorized as friendly. We
find that for two of the measures (SUFFER and VOTER) the result is due primarily to the other friendly institutions.
However, for the OWNINC measure these three institutions explain the result. This difference is likely because
OWNINC is based on institutions increasing their stake in prior targets, and the three institutions account for on
average 17% of OWNINC ownership. 36 About 65.9% of SUFFER, 68.9% of VOTER and 57.9% of OWNINC is categorized as QIX. Similarly, about
51.6%, 45% and 52% of the non- friendly ownership, based on the three measures respectively, is categorized as
QIX

32
effective changes in the firm. It should however not impact the pre event ownership by activism-
friendly institutions and its role. We proxy for the hedge fund activist’s reputation by the
average (–20,+20) day CAR on its prior target announcments. In untabulated results, we find
that the hedge fund activist’s reputation has a positive effect on the announcement returns
(CARs) but does not impact the results on activsim friendly ownership. Reputation of the
activist is not significant in explaining long term stock returns or operating performance of the
target and does not effect the results for activism-friendly ownership.
As there are few firms subject to activism every year, we have used a three year period to
capture the behavior of institutions and classify them as activism friendly. However, this leads to
a loss of data and therefore we also try using one and two years to develop our measures of
activism friendly. The results tend to be weaker, especially for the SUFFER variable.37
5. Presence of Activism-Friendly Institutions and the Search for Targets
The results so far show clearly that shareholder returns to hedge fund activism, short and
long term stock returns as well as operating performance, are increasing in the level of pre-event
activism-friendly ownership. The evidence also shows that other institutional ownership does
not have any significant association with post-activism returns. Given the impact of activism-
friendly institutions, we examine evidence regarding whether hedge fund activists consider
institutional ownership and its composition in their decision to target firms. We further examine
whether the presence of activism-friendly institutions from previous campaigns are associated
with higher returns to the activist, that is, whether the long-term performance from an activism
campaign is associated with a continued relationship between an activist and the institutions.
37 As SUFFER is based on voting in one firm, using one year of data limits the number of votes over which to
observe and classify the institutions.

33
5.1 Likelihood of Being Targeted and the Presence of Activism-Friendly Institutions
In this section, we examine a model for hedge fund activism to study whether pre event
activism-friendly ownership is associated with the likelihood of being targeted by an activist.
Because the likelihood of being targeted by hedge funds is low, and especially so after 2008, we
estimate the model using a matched sample. The target firms are matched to a set of control
firms by industry, asset size and book to market ratio. Specifically, for every firm that was
targeted, we select a matched firm that was in the same Fama-French 48 indsutry and with the
smallest total perectage difference in the value of total assets and the book to market ratio in the
year prior.
The main variables of interest are the measures of activism-friendly ownership in the
quarter prior to being targeted. If hedge fund activists recognize the role of activism-friendly
institutional ownership, targets with high pre event ownership by these institutions should be
more likely to be targeted. For each of the matched control firms we generate the required
variables of interest, i.e., OWNINC, VOTER and SUFFER, as described earlier. As before we
also include ownership by other institutions that are not classified as activism friendly and the
pre event ownership of the hedge fund activist. The dependent variable takes the value of one if
the firm was targeted. As this is a matched sample we estimate a conditional logit model.
The firm level controls in line are consistent with those in Brav, Jiang, Partnoy and
Thomas (2008): firm size (total assets), leverage (ratio of book value of long term debt to total
assets), the change in sales over the prior years, Tobin’s Q, Return on Assets, Dividend Yield,
the Herfindahl-Hirschman Index of sales,38 the ratio of R&D expenses to sales, and the number
of analysts following the firm.
38 The Herfindahl-Hirschman index of sales is across different business segments (HHI_SALES) with data from
COMPUSTAT Segment data. This measure captures the concentration or lack thereof of revenues in the different

34
The results, reported in Table 13, show that the coefficients for all of the measures of
activism-friendly ownership are positive and significant. We also find that the coefficient for the
other institutional ownership is also positive and significant. All institutional ownership increases
the likelihood of being targeted by hedge fund activists. We test for whether there is a greater
impact of activism-friendly institutions on the likelihood of being targeted and find for two of the
three measures that the effect of activism-friendly institutional ownership on the likelihood of
being targeted is signficantly higher than that of other institutional ownership. For the third
measure (VOTER) there is no difference in supportive and other institutional ownership.
VOTER captures institutions that have voted against any target management in the past three
years and therefore represent a large group of institutions. This may partially account for the lack
of difference with other institutional ownership. Not surprisingly, large firms and those with low
leverage have a lower likelihood of being targeted. Firms with high research and development
expenses are also more likely to be targeted.
For robustness, we also esimate the model in a sample that includes all Compustat firms
with the relevant data. The dependent variable takes the value of one if the firm was targeted by
the hedge fund in that year. The other variables are the same as in the previous analysis and we
also include year and industry fixed effects. The reuslts reported in Table 14 are qualitatively
similar to those in Table 13. The coefficients of all measures of activism-friendly institutional
ownership, as well as other institutional ownership, is positive and significant. For two of the
three measures, there is no significant difference between activism-friendly institutional
ownership and other institutional ownership in the propensity of getting targeted. Only, when
segments and controls for the complexity of target firm operations. Activists are thought to be equipped with
general skills and target firms with more general/diversified sales are more likely to be targeted. The control
variables included are consistent with Brav, Jiang, Partnoy and Thomas (2008).

35
ownership by activism-friendly institutions is captured by the SUFFER measure does it have a
higher effect on the likelihood of being targeted than other institutional ownership. In summary,
higher ownership by activism-friendly institutions in the pre event quarter significantly increases
the likelihood of being targeted by hedge fund activists.
5.2 Long-term Performance and a Continuing Relationship
Our results suggest that activists may not only consider activist-friendly institutions in the
selection of their targets, but that their returns may be higher if they can rely on the presence of
institutions who have supported them in the past. Thus, we examine the relationship between the
long-term returns and whether the activism-friendly institutions have been present in that
activist’s previous campaigns versus activism-friendly institutions newly present for the current
campaign. To do so for each target firm campaign we divide the activism-friendly institutional
ownership into two types: Overlapped ownership, for those activism-friendly institutions that
were also present and classified as activism-friendly in the previous case conducted by the
activist and New ownership of activism-friendly institutions that were not present in the
activist’s prior case. On average, overlapped friendly ownership (by the SUFFER measure) is
13.2% of all friendly ownership in the target firm; overlapped friendly ownership (by the
VOTER measure) is about 38.2% of all friendly ownership; and overlapped friendly ownership
(by the OWNINC measure) is about 49.4% of all friendly ownership.
Using these variables we conduct a regression analysis in which the dependent variable is
the 36-month market-adjusted BHARs and the primary variables of interest are the two types of
activism-friendly ownership along with other institutional ownership. We drop all cases that are
the first cases of the activist in the sample. The results, displayed in Table 15, show again that
higher returns are associated with ownership by activism-friendly institutions, but not with other
36
institutional investor ownership. We further find that the overlapped friendly ownership by
OWNINC and the VOTER measures are associated with higher returns. In addition, for the
VOTER measure we find that both overlapped and new activism-friendly institutional ownership
are associated with higher returns. However, se do not find significant results for prior
experience with SUFFER. This should not be surprising because SUFFER is a measure of
ownership by institutions that are unhappy with the current target and not a measure of
institutional characteristics that point to a generally activism-friendly attitude. For SUFFER it is
the new institutions that are unhappy with the current target rather than the overlapped
institutions that tend to be unhappy with many targets.
6. Conclusion
In this paper we study differences among institutional investors in their propensity to
support hedge fund activists and how this impacts the success and the value created from hedge
fund activism. We develop three different measures of activism-friendly institutional ownership.
Pre event ownership by these activism-friendly institutions is associated with significantly higher
short and long term stock returns, and operating performance of the target firm. These results are
robust to different horizons post targeting, to different benchmarks and to controls for other
institutional ownership, as well as to firm and activism-specific characteristics. We further find
that other institutions, not classified as activism friendly, are associated with no significant
impact on the post-event performance of the target. These results are consistent with a role for
the activism-friendly institutions in helping the hedge fund activist push for changes in the firm
and subsequent increases in target firm value.
If the presence of activism-friendly institutions facilitates the hedge fund activist in
implementing changes, then activists should be more likely to target firms that have higher

37
holdings by these institutions. Consistent with this hypothesis, we find that all institutional
ownership is associated with a higher likelihood of being targeted. For two of the three measures,
activism-friendly ownership is associated with a significantly greater likelihood than other
institutional ownership of being targeted. The results point to the importance of the type of
institution, especially with respect to whether they support hedge fund activism, in the likelihood
of firms being targeted and the value generated from hedge fund activism.

38
Appendix A: Construction of the Measure of Friendly Shareholders
Measure 2: VOTER
The second measure captures an institution’s general tendency in activism events to vote against
management. We capture this by examining the voting patterns of institutions in prior activism
targets. Specifically,
1. A 13D filing for firm i, in quarter q and year y is denoted as event (i, q, y). The measure,
referred to as VOTERi, is the percentage ownership by all activism-friendly institutions
in the prior quarter q-1.
2. An institution is regarded as being activism friendly based on its voting history in firms
targeted over the prior three years. In particular, if the institution voted against
management in any target from year y-3 to y-1 then it is classified as being friendly of
activism in year y. Note,
a. The voting data is at the mutual fund level. We aggregate it to the institution or
parent level. Specifically, if any of the mutual funds in the family votes against
management then the institution is regarded as having voted against management.
Withholding, abstaning and voting against are all considered as voting against
management.
b. To ensure that we are capturing voting on matters related to activism, we require
that the proposal voted is within two years of the activism event.
c. As 2004 is the first year of the voting data, and we require three prior years of
voting data to construct this variable, this variable is available for the 2007 to
2012 period.
Measure 3: OWNINC
The third measure captures an institution behavior, as manifest from changes in ownership in
prior target to gauge the likelihood of supporting activsm. Specifically,
1. A 13D filing for firm i, in quarter q and year y is denoted as event (i, q, y). The measure,
referred to as OWNINCi, is the percentage ownership by all activism-friendly institutions
in the prior quarter q-1.
2. An institutution is regarded as being supportive of activism if its average ownership in
the five quarters after the event (including the event quarter) is positive and greater than
its average ownerhsip in the four quarter prior to the event quarter. For every year, we
calculate the ratio of the number of activism targets in which the institution is regarded as
being supportive to the number of cases in which the institution was a shareholder in the
event quarter for that year. For e.g. if the institution was a shareholder in 7 target firms in
event quarter and increased its ownership, as described above, in 3 of those targets the
ratio is 3/7. This captures the fraction of targets in the year that it supported.
3. We then rank all institutions based on this annual ratio. We only inlcude institutions that
increase ownership in at least one target and held at least 25% of the cases in that year.

39
The instituions in the top quartile are classied as being supportive for year y. 39 Activism-
friendly institutions are institutions that were classified as being supportive of activism in
year y-4, y-3, and y-2. Note that we do not include year y-1, as we require institutional
ownership in four quarter after the event to construct this measure. In other words, if we
would have inlcuded year y-1 that would require data from year y (current year).
39 It is one of the past three years. We do the ranking in each year of the three years, and identify institutions as
friendly as long as they are of top quartile in at least one of the three years.

40
References:
Appel, Ian, Todd A. Gormley, and Donald B. Keim. "Standing on the shoulders of giants: The effect
of passive investors on activism." Working paper.
Bebchuk, Lucian A., Alon Brav, and Wei Jiang. “The long-term effects of hedge fund activism.”
National Bureau of Economic Research no. w21227 (2015).
Becht, Marco, Julian Franks, Colin Mayer, and Stefano Rossi. "Returns to shareholder activism:
Evidence from a clinical study of the Hermes UK Focus Fund." Review of Financial Studies 23.3
(2010): 3093-3129.
Boyson, Nicole M., Nickolay Gantchev, and Anil Shivdasani. "Activism Mergers." Working paper.
Boyson, Nicole M., and Robert M. Mooradian. "Corporate governance and hedge fund activism."
Review of Derivatives Research 14.2 (2011): 169-204.
Brav, Alon, Wei Jiang, Frank Partnoy, and Randall Thomas. "Hedge fund activism, corporate
governance, and firm performance." The Journal of Finance 63.4 (2008): 1729-1775.
Brav, Alon, Wei Jiang, and Hyunseob Kim. "Hedge fund activism: A review." Foundations and
Trends in Finance 4.3 (2009): 185-246.
Brav, Alon, Wei Jiang, and Hyunseob Kim. "The real effects of hedge fund activism: Productivity,
asset allocation, and labor outcomes." Review of Financial Studies 28.10 (2015a): 2723-2769.
Brav, Alon, Wei Jiang, and Hyunseob Kim. "Recent advances in research on hedge fund activism:
Value creation and identification." Annual Review of Financial Economics no.7 (2015b): 579-595.
Brav, Alon, Wei Jiang, and Xuan Tian. "Shareholder power and corporate innovation: Evidence from
hedge fund activism." Kelley School of Business Research Paper 2014-05 (2014).
Burns, Natasha, Simi Kedia, and Marc Lipson. "Institutional ownership and monitoring: Evidence
from financial misreporting." Journal of Corporate Finance 16.4 (2010): 443-455.
Bushee, B. J, 1998, The Influence of Institutional Investors on Myopic R&D Investment Behavior.
The Accounting Review 73, 305–333.
Chen, Xia, Jarrad Harford, and Kai Li. "Monitoring: Which institutions matter?" Journal of
Financial Economics 86.2 (2007): 279-305.
Cheng, C. S., Henry He Huang,Yinghua Li, and Jason Stanfield. "The effect of hedge fund activism
on corporate tax avoidance." The Accounting Review 87.5 (2012): 1493-1526.
Cheng, C. S., Henry He Huang, and Yinghua Li. "Hedge fund intervention and accounting
conservatism." Contemporary Accounting Research 32.1 (2015): 392-421.

41
Clifford, Christopher P. "Value creation or destruction? Hedge funds as shareholder
activists." Journal of Corporate Finance 14.4 (2008): 323-336.
Cronqvist, Henrik, and Rüdiger Fahlenbrach. "Large shareholders and corporate policies." Review of
Financial Studies 22.10 (2009): 3941-3976.
Davis, Gerald F., and E. Han Kim. "Business ties and proxy voting by mutual funds." Journal of
Financial Economics 85.2 (2007): 552-570.
Duchin, Ran, and Breno Schmidt. "Riding the merger wave: Uncertainty, reduced monitoring, and
bad acquisitions." Journal of Financial Economics 107.1 (2013): 69-88.
Fu, Fangjian, Leming Lin, and Micah S. Officer. "Acquisitions driven by stock overvaluation: Are
they good deals?" Journal of Financial Economics 109.1 (2013): 24-39.
Gantchev, Nickolay. "The costs of shareholder activism: Evidence from a sequential decision
model." Journal of Financial Economics 107.3 (2013): 610-631.
Gantchev, Nickolay, Oleg Gredil, and Chotibhak Jotikasthira. "Governance under the gun: Spillover
effects of hedge fund activism." Working paper.
Gantchev, Nickolay, and Chotibhak Jotikasthira. "Hedge fund activists: do they take cues from
institutional exit?" Working paper.
Gillan, Stuart, and Laura T. Starks. "The evolution of shareholder activism in the United States."
Working paper.
Gow, Ian D., Sa-Pyung Shin, and Suraj Srinivasan, 2014a "Activist directors: Determinants and
consequences." Working paper.
Gow, Ian D., Sa-Pyung Shin, and Suraj Srinivasan, 2014b "Consequences to Directors of
Shareholder Activism." Working paper.
Greenwood, Robin, and Michael Schor. "Investor activism and takeovers."Journal of Financial
Economics 92.3 (2009): 362-375.
Hartzell, Jay, and Laura Starks, “Institutional investors and executive compensation,” The Journal of
Finance 58.6 (2003): 2351-2374.
Klein, April, and Emanuel Zur. "Entrepreneurial shareholder activism: Hedge funds and other private
investors." The Journal of Finance 64.1 (2009): 187-229.
Klein, April, and Emanuel Zur. "The impact of hedge fund activism on the target firm's existing
bondholders." Review of Financial Studies 24.5 (2011): 1735-1771.
Levit, Doron. "Soft shareholder activism." Working paper.

42
Sunder, Jayanthi, Shyam V. Sunder, and Wan Wongsunwai. "Debtholder responses to shareholder
activism: Evidence from hedge fund interventions." Review of Financial Studies 27, no. 11 (2014):
3318-3342.
Wermers, Russ. "Is money really'smart'? New evidence on the relation between mutual fund flows,
manager behavior, and performance persistence." New Evidence on the Relation Between Mutual
Fund Flows, Manager Behavior, and Performance Persistence (May 2003) (2003).
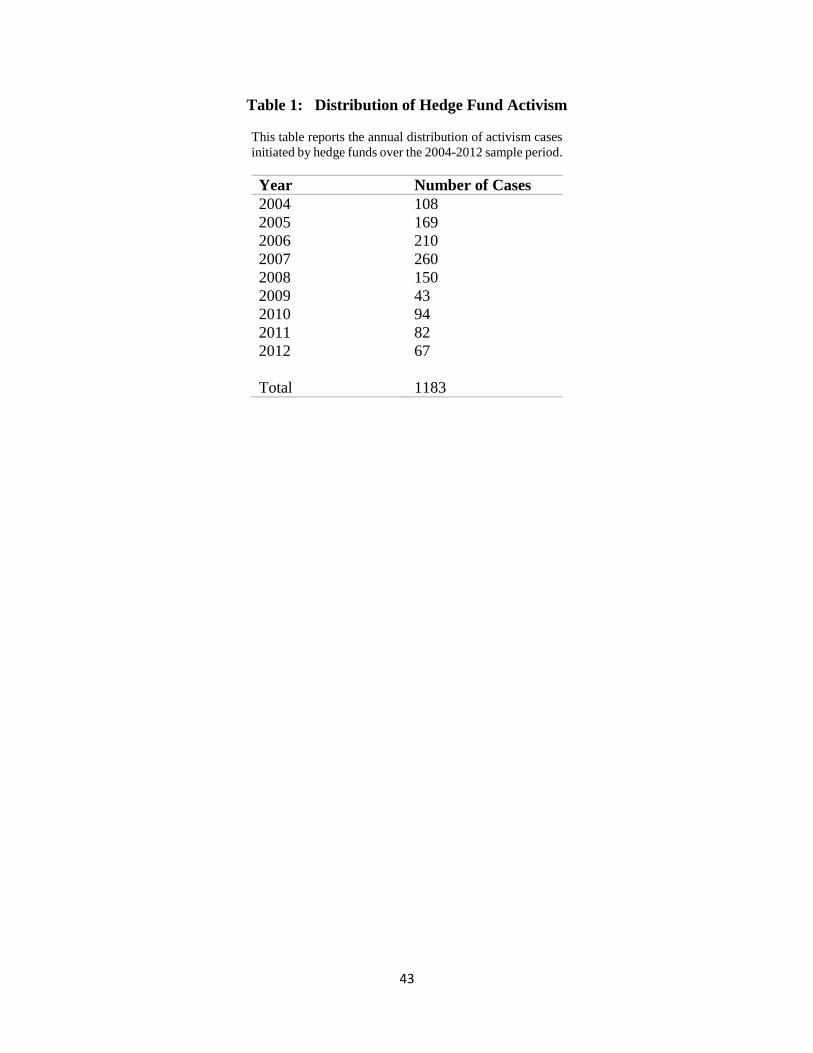
43
Table 1: Distribution of Hedge Fund Activism
This table reports the annual distribution of activism cases
initiated by hedge funds over the 2004-2012 sample period.
Year Number of Cases
2004 108
2005 169
2006 210
2007 260
2008 150
2009 43
2010 94
2011 82
2012 67
Total 1183

44
Table 2: Requests by Hedge Fund Activists
This table reports the frequency and success rates of requests made to target firm management by hedge fund
activists over the 2004-2012 sample period. The requests are categorized into three primary areas. Merger Related
requests include support for or against the sale of target firms, leveraged buyouts, going private, or spinoffs.
Governance Related requests include bylaw changes, board representation, CEO turnover, or executive
compensation. Capital Structure requests include requests related to debt or equity issuance, share buybacks, or
special dividends. The General/ No Request category includes requests with general investment improvements and
cases where no requests are made. Request is regarded as being successful if at least one of the requests made by
the activist is achieved or the activist reaches agreement with the management.
Type of Request Total
Number
Request
Success
Success
Percentage
Merger Related (MERGREQ) 227 116 51.10
Block Merger 68 33 48.53
Merger/Leveraged Buyout 145 72 49.66
Spinoff 51 24 47.06
Governance Related (GOVREQ) 195 122 62.56
Amend Bylaw 40 18 45.00
Board 170 115 67.65
CEO Compensation/Replacement 45 22 48.89
Capital Structure (CSREQ) 77 33 42.86
Dividend/Buyback/Other Capital
Structure 77 33 42.86
At Least One Request (OVERALL) 573 375 65.45
General/ No Request (COMMONLY) 610 - -

45
Table 3: Measures of Activism-Friendly Institutional Shareholders
This table reports summary statistics on the three measures of activism-friendly ownership. All
measures capture the fraction of the target firm owned by institutions that are classified as being
activism friendly in the quarter prior to the 13D filing. SUFFER is the percentage ownership by
all institutions that voted at least once against the management of the target firm in the prior three
years. VOTER is the percentage ownership by all institutions that voted at least once against
management in any firm targeted by activists in the prior three years. OWNINC is the percentage
ownership by institutions that increased their ownership in other activism targets in the past three
years, after the other firms were targeted. All the measures are in the quarter prior to being
targeted. VOTER and SUFFER measures are available over the period 2007 to 2012. All other
variables are measured over the period 2004 to 2012. TOTINT is the fraction of the target held
by all 13F institutions in the quarter prior to the 13D filing. INIHOLD is the fraction of the target
held by the activist hedge fund as captured in the 13D filing. TRA, QIX, DED are
characterizations of institutions from Bushee (1998), transient, quasi-indexers and dedicated
investors, respectively, available on his website. ILTI captures independent long term investors.
Mean Median 25%
Percentile
75th
Percentile
Standard
Deviation
Number
SUFFER 0.037 0 0 0.057 0.062 656
VOTER 0.194 0.196 0.074 0.295 0.132 656
OWNINC 0.085 0.072 0.021 0.133 0.073 1183
TOTINT 0.494 0.536 0.286 0.705 0.267 1183
INIHOLD 0.075 0.063 0.054 0.088 0.031 1183
TRA 0.133 0.115 0.043 0.198 0.111 1183
QIX 0.259 0.262 0.113 0.391 0.170 1183
DED 0.048 0.018 0 0.069 0.069 1183
ILTI 0.100 0.077 0.010 0.151 0.100 1183

46
Table 4: Correlations Between Measures of Institutional Ownership
The table displays pairwise correlations for different measures of institutional ownership. All measures
are as of the quarter prior to the 13D filing. SUFFER is the percentage ownership by all institutions that
voted at least once against the management of the target firm in the prior three years. VOTER is the
percentage ownership by all institutions that voted at least once against management in any firm targeted
by activists in the prior three years. OWNINC is the percentage ownership by institutions that increased
their ownership in activism targets in the past three years, after they were targeted. TOTINT is the total
13F institutional ownership in the quarter prior to being targeted. TRA, QIX, DED are characterizations
of institutions from Bushee’s website. ILTI captures independent long term investors.
OWNINC VOTER SUFFER TOTINT TRA QIX DED
VOTER 0.738 1
SUFFER 0.402 0.482 1
TOTINT 0.681 0.741 0.350 1
TRA 0.490 0.434 0.181 0.664 1
QIX 0.676 0.798 0.413 0.817 0.353 1
DED 0.163 0.210 0.099 0.399 0.081 0.194 1
ILTI 0.133 0.151 0.050 0.316 0.189 0.271 0.447

47
Table 5: Success of Activists’ Requests
The table reports the fraction of all requests that were successful across quartiles formed on the basis of activism-
friendly institutional ownership. In column 2, the measure of activism-friendly ownership is SUFFER, while in
column 3 and 4 it is VOTER and OWNINC respectively. Test1 reports the Chi square from a test that fraction of
successful requests in Q4 is different from that in Q1. Test2 reports the Chi square for a test that fraction of success
is independent of the activism-friendly quartiles.
Panel A: SUFFER Panel B: VOTER Panel C: OWNINC
Fraction
Successful
Total
Requests
Fraction
Successful
Total
Requests
Fraction
Successful
Total
Requests
Q1 0.565 168 0.529 70 0.587 104
Q2 0.827 52 0.642 81 0.667 141
Q3 0.630 46 0.727 88 0.623 162
Q4 0.683 60 0.632 87 0.717 166
Test1 2.551 1.717 4.887
P- value 0.110 0.190 0.027***
Test2 12.408 6.685 5.762
P-value 0.006*** 0.083* 0.124

48
Table 6: Short Term Stock Returns Around Announcement of 13D Filing
This table displays CARs for two different trading day windows for quartiles formed on the basis of
activism-friendly measures, with Q4 (Q1) being the quartile with the highest (lowest) value of the activism-
friendly measures. In Panel A (Panel B) [Panel C], the quartiles are formed on the basis of the activism-
friendly ownership measure SUFFER (VOTER) [OWNINC]. The CARs are calculated in excess of the
CRSP value-weighted index. The P-val (Ranksum) tests for whether mean (median) difference between
quartile 4 (Q4) and quartile 1(Q1) is different from zero. ***, ** and * indicate significance at the 1%, 5%,
and 10% levels.
CAR(-2,+2) CAR(-2,+20) Number
Panel A: SUFFER
Q1 0.020 0.015 349
Q2 0.022 0.018 98
Q3 0.027 0.025 98
Q4 0.039 0.064 99
Q4-Q1 0.019 0.049
P-val 0.088* 0.009***
Ranksum 0.062* 0.001***
Panel B: VOTER
Q1 0.012 -0.001 153
Q2 0.013 0.020 164
Q3 0.039 0.040 163
Q4 0.033 0.038 164
Q4-Q1 0.020 0.039
P-val 0.036** 0.022**
Ranksum 0.035** 0.001***
Panel C: OWNINC
Q1 0.018 0.020 243
Q2 0.027 0.042 292
Q3 0.027 0.029 295
Q4 0.040 0.044 295
Q4-Q1 0.021 0.024
P-val 0.006*** 0.063*
Ranksum 0.005*** 0.010***

49
Table 7: Multivariate Estimation for CARs
This table reports the estimation of a multi-variate regression in which the CAR around the 13D filing date is
the dependent variable using two different trading day windows. SUFFER, VOTER, and OWNINC are the three
measures of activism-friendly ownership. Nofrd_suf, (Nofrd_vot), and [Nofrd_own] is the 13F ownership of
institutions that are neither SUFFER (VOT) [OWNINC] nor the hedge fund activist of the event. PRE13F is a
dummy that is one if the activist had greater than 1% ownership in the quarter prior to 13D. PRE12_STK is the
monthly compounded stock return from m-12 to m-1, where m is the event month. SIZE is the natural log of the
target’s total assets, LEV is the ratio of book value of debt to total assets. COMMONLY is an indicator variable
for events with no request made in 13D filings. CSREQ (MERGREQ) [GOVREQ] are indicator variables that
take the value of one when the activist makes requests related to capital structure (merger) [governance]. All
regressions control for year and industry fixed effects. The p-values, based on standard errors adjusted for
heteroskedasticity, are in parentheses, and ***, ** and * indicate significance at the 1%, 5%, and 10% levels.
All continuous measures are winsorized at 1% and 99% levels.
Measure 1: SUFFER Measure 2: VOTER Measure 3: OWNINC
(-2,+2) (-2,+20) (-2,+2) (-2,+20) (-2,+2) (-2,+20)
SUFFER 0.004 0.175*
(0.956) (0.089)
VOTER 0.068* 0.107*
(0.079) (0.072)
OWNINC 0.105** 0.142*
(0.045) (0.086)
Nofrd_suf 0.032 0.034
(0.147) (0.342)
Nofrd_vot 0.008 0.001
(0.778) (0.991)
Nofrd_inc -0.003 0.003
(0.874) (0.932)
PRE13F -0.001 0.006 -0.002 0.005 0.000 0.003
(0.933) (0.665) (0.836) (0.725) (0.988) (0.760)
PRE12_STK -0.019** -0.030** -0.019** -0.032** -0.009 -0.026**
(0.028) (0.045) (0.027) (0.033) (0.142) (0.012)
SIZE 0.000 -0.004 -0.001 -0.004 -0.001 -0.005
(0.909) (0.392) (0.835) (0.368) (0.774) (0.177)
LEV -0.008 -0.085** -0.006 -0.079** 0.005 -0.008
(0.686) (0.017) (0.766) (0.026) (0.753) (0.761)
COMMONLY -0.018** -0.017 -0.017* -0.019 -0.020*** -0.024**
(0.048) (0.271) (0.059) (0.212) (0.002) (0.033)
CSREQ 0.001 0.009 0.001 0.009 0.001 0.001
(0.956) (0.726) (0.973) (0.720) (0.929) (0.978)
MERGREQ -0.004 0.011 -0.002 0.010 0.004 0.000
(0.712) (0.572) (0.851) (0.618) (0.629) (0.993)
GOVREQ -0.010 -0.002 -0.010 -0.003 0.002 0.009
(0.400) (0.925) (0.391) (0.870) (0.800) (0.549)
Observations 622 622 622 622 1,059 1,059
R-squared 0.190 0.150 0.192 0.150 0.192 0.127
Year, Ind FE Y, Y Y, Y Y, Y Y, Y Y, Y Y, Y
H0:
friendly<=nofrd
0.660 0.084* 0.110 0.095* 0.034** 0.072*

50
Table 8: Multivariate Analysis of BHARs
This table displays OLS estimation with 36 month BHARS that are market adjusted (column1), DGTW adjusted
(column2) and Fama French 48 industry adjusted (column 3). Panel A (B) [ C] displays the results with SUFFER
(VOTER) [OWNINC] as the measure for activism-friendly ownership. Nofrd_suf, (Nofrd_vot), and [Nofrd_inc]
is the 13F ownership of institutions that are neither SUFFER (VOTER) [OWNINC] nor the hedge fund activist
of the event. PRE13F is a dummy that is if the activist had greater than 1% ownership in the quarter prior to 13D.
PRE12_STK is the monthly compounded stock return from m-12 to m-1, where m is the event month. SIZE is
natural log of total assets, LEV is the ratio of book value of debt to total assets. COMMONLY is a dummy for
events with no request made in 13D filings. CSREQ (MERGREQ) [GOVREQ] are dummies that take the value
of one when the activist makes requests related to capital structure (merger) [governance]. All regressions control
for year and industry fixed effects. P-value based on standard errors adjusted for heteroskedasticity are in
parentheses, and ***, ** and * indicate significance at the 1%, 5%, and 10% levels. All continuous measures are
winsorized at 1% and 99% levels.
Panel A: SUFFER
BHAR
Market Adjusted
36 months
BHAR
DGTW Adjusted
36 months
BHAR
Industry Adjusted
36 months
SUFFER 1.251** 1.567*** 1.382**
(0.037) (0.008) (0.020)
Nofrd_suf -0.044 -0.030 -0.048
(0.796) (0.858) (0.778)
SIZE -0.003 0.004 -0.010
(0.902) (0.852) (0.673)
LEV -0.104 -0.138 -0.096
(0.583) (0.481) (0.604)
PRE12_STK 0.091 0.087 0.091
(0.181) (0.215) (0.193)
PRE13F -0.106 -0.146** -0.112
(0.123) (0.042) (0.101)
COMMONLY 0.196*** 0.208*** 0.177**
(0.009) (0.006) (0.018)
CSREQ 0.108 0.138 0.046
(0.439) (0.327) (0.730)
MERGREQ 0.040 0.037 0.024
(0.660) (0.675) (0.788)
GOVREQ 0.212** 0.235** 0.232**
(0.047) (0.031) (0.028)
Observations 621 565 621
R-squared 0.147 0.200 0.152
Year FE YES YES YES
Ind FE YES YES YES
H0:
SUF<=Nofrd_suf
0.013** 0.003*** 0.007***

51
Panel B: VOTER
BHAR,
Market
Adjusted
36 months
BHAR
DGTW Adjusted
36 months
BHAR
Industry Adjusted
36 months
VOTER 0.919*** 1.088*** 0.873***
(0.006) (0.001) (0.008)
Nofrd_VOTER -0.473** -0.518** -0.441**
(0.022) (0.015) (0.035)
SIZE -0.013 -0.007 -0.018
(0.580) (0.768) (0.447)
LEV -0.034 -0.057 -0.029
(0.856) (0.768) (0.877)
PRE12_STK 0.075 0.066 0.075
(0.263) (0.341) (0.281)
PRE13F -0.121* -0.164** -0.126*
(0.078) (0.022) (0.067)
COMMONLY 0.182** 0.192** 0.160**
(0.014) (0.010) (0.030)
CSREQ 0.110 0.135 0.049
(0.434) (0.345) (0.718)
MERGREQ 0.037 0.024 0.016
(0.678) (0.780) (0.857)
GOVREQ 0.199* 0.222** 0.219**
(0.062) (0.041) (0.039)
Observations 621 565 621
R-squared 0.156 0.211 0.158
Year FE YES YES YES
Ind FE YES YES YES
H0: VOT<=Nofrd_vot 0.000*** 0.000*** 0.001***
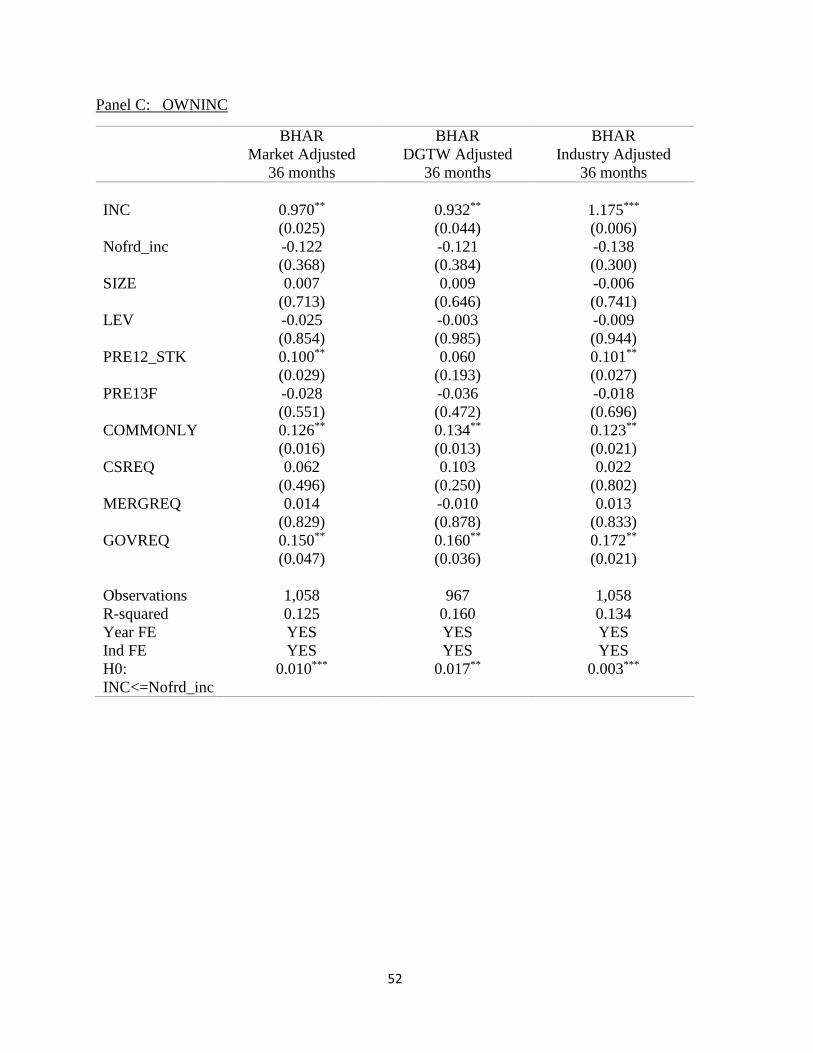
52
Panel C: OWNINC
BHAR
Market Adjusted
36 months
BHAR
DGTW Adjusted
36 months
BHAR
Industry Adjusted
36 months
INC 0.970** 0.932** 1.175***
(0.025) (0.044) (0.006)
Nofrd_inc -0.122 -0.121 -0.138
(0.368) (0.384) (0.300)
SIZE 0.007 0.009 -0.006
(0.713) (0.646) (0.741)
LEV -0.025 -0.003 -0.009
(0.854) (0.985) (0.944)
PRE12_STK 0.100** 0.060 0.101**
(0.029) (0.193) (0.027)
PRE13F -0.028 -0.036 -0.018
(0.551) (0.472) (0.696)
COMMONLY 0.126** 0.134** 0.123**
(0.016) (0.013) (0.021)
CSREQ 0.062 0.103 0.022
(0.496) (0.250) (0.802)
MERGREQ 0.014 -0.010 0.013
(0.829) (0.878) (0.833)
GOVREQ 0.150** 0.160** 0.172**
(0.047) (0.036) (0.021)
Observations 1,058 967 1,058
R-squared 0.125 0.160 0.134
Year FE YES YES YES
Ind FE YES YES YES
H0:
INC<=Nofrd_inc
0.010*** 0.017** 0.003***
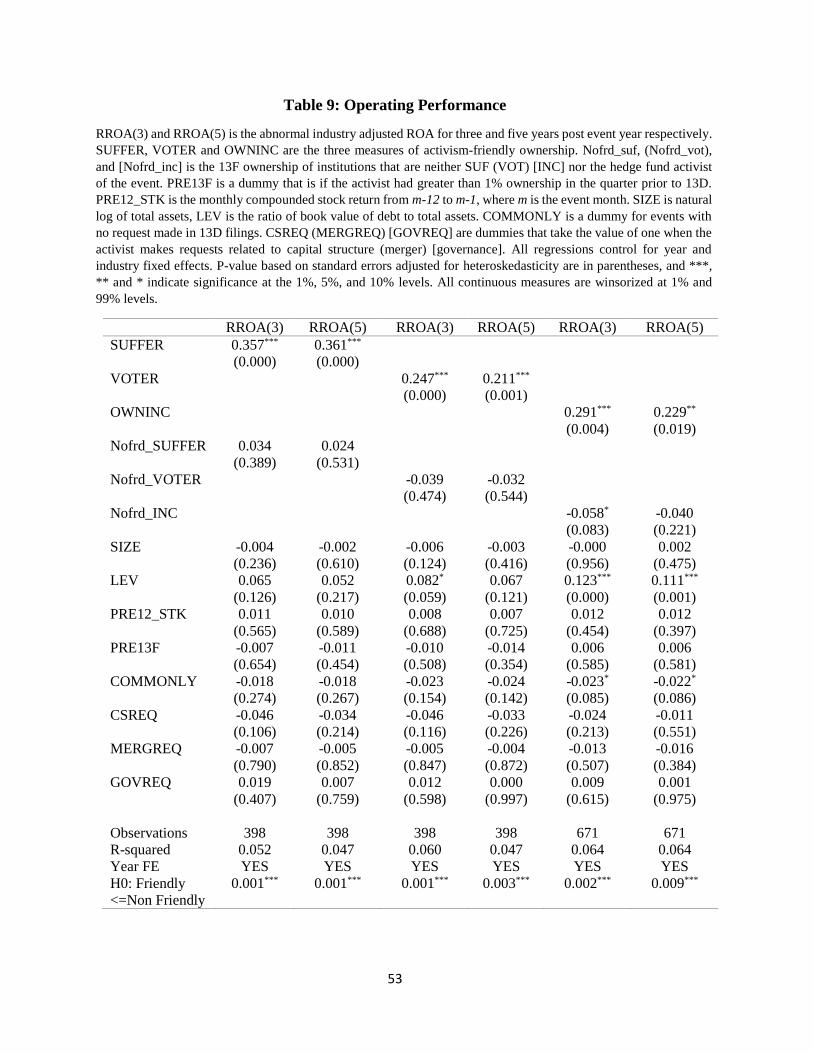
53
Table 9: Operating Performance
RROA(3) and RROA(5) is the abnormal industry adjusted ROA for three and five years post event year respectively.
SUFFER, VOTER and OWNINC are the three measures of activism-friendly ownership. Nofrd_suf, (Nofrd_vot),
and [Nofrd_inc] is the 13F ownership of institutions that are neither SUF (VOT) [INC] nor the hedge fund activist
of the event. PRE13F is a dummy that is if the activist had greater than 1% ownership in the quarter prior to 13D.
PRE12_STK is the monthly compounded stock return from m-12 to m-1, where m is the event month. SIZE is natural
log of total assets, LEV is the ratio of book value of debt to total assets. COMMONLY is a dummy for events with
no request made in 13D filings. CSREQ (MERGREQ) [GOVREQ] are dummies that take the value of one when the
activist makes requests related to capital structure (merger) [governance]. All regressions control for year and
industry fixed effects. P-value based on standard errors adjusted for heteroskedasticity are in parentheses, and ***,
** and * indicate significance at the 1%, 5%, and 10% levels. All continuous measures are winsorized at 1% and
99% levels.
RROA(3) RROA(5) RROA(3) RROA(5) RROA(3) RROA(5)
SUFFER 0.357*** 0.361***
(0.000) (0.000)
VOTER 0.247*** 0.211***
(0.000) (0.001)
OWNINC 0.291*** 0.229**
(0.004) (0.019)
Nofrd_SUFFER 0.034 0.024
(0.389) (0.531)
Nofrd_VOTER -0.039 -0.032
(0.474) (0.544)
Nofrd_INC -0.058* -0.040
(0.083) (0.221)
SIZE -0.004 -0.002 -0.006 -0.003 -0.000 0.002
(0.236) (0.610) (0.124) (0.416) (0.956) (0.475)
LEV 0.065 0.052 0.082* 0.067 0.123*** 0.111***
(0.126) (0.217) (0.059) (0.121) (0.000) (0.001)
PRE12_STK 0.011 0.010 0.008 0.007 0.012 0.012
(0.565) (0.589) (0.688) (0.725) (0.454) (0.397)
PRE13F -0.007 -0.011 -0.010 -0.014 0.006 0.006
(0.654) (0.454) (0.508) (0.354) (0.585) (0.581)
COMMONLY -0.018 -0.018 -0.023 -0.024 -0.023* -0.022*
(0.274) (0.267) (0.154) (0.142) (0.085) (0.086)
CSREQ -0.046 -0.034 -0.046 -0.033 -0.024 -0.011
(0.106) (0.214) (0.116) (0.226) (0.213) (0.551)
MERGREQ -0.007 -0.005 -0.005 -0.004 -0.013 -0.016
(0.790) (0.852) (0.847) (0.872) (0.507) (0.384)
GOVREQ 0.019 0.007 0.012 0.000 0.009 0.001
(0.407) (0.759) (0.598) (0.997) (0.615) (0.975)
Observations 398 398 398 398 671 671
R-squared 0.052 0.047 0.060 0.047 0.064 0.064
Year FE YES YES YES YES YES YES
H0: Friendly
<=Non Friendly
0.001*** 0.001*** 0.001*** 0.003*** 0.002*** 0.009***

54
Table 10: Voting Patterns in Shareholder-Sponsored Proposals
This table reports partial results of a logit regression in which the dependent variable is one if the fund votes
in favor of the proposal and zero otherwise. Activist Sponsored is an indicator variable that takes the value of
one if the proposal is sponsored by the hedge fund activist. Friendly Institution is an indicator variable that
takes the value of one if the fund is classified as activism-friendly based on the measure listed in the panel
heading. Control variables included but not displayed are SIZE, natural log of total assets; LEV, the ratio of
book value of debt to total assets; Change in sales, measured over lagged sales; Tobin Q, the sum of market
value of equity and book value of debt over the sum of book value of equity and book value of debt; ROA,
net income over lagged total assets; DIV, dividend scaled by book equity; HHI_SALES, the Herfindahl–
Hirschman Index of sales in different business segments; PRE13F, a dummy that takes the value of 1 if the
activist disclosed having more than 1% ownership in the quarter prior to the end. Also included are proposal
and year fixed effects. The sample includes all shareholder proposals in target firms in the two years after the
13D filing. The number in brackets shows p-values.
Panel A: SUFFER Panel B: VOTER Panel C: OWNINC
All
Shareholder
Proposals
Institution
Sponsored
Proposals
All
Shareholder
Proposals
Institution
Sponsored
Proposals
All
Shareholder
Proposals
Institution
Sponsored
Proposals
Activist x Friendly
Inst.
.504** 0.579*** .791*** 0.694*** 1.227*** 1.134***
(0.016) (0.007) (0.000) (0.001) (0.000) (0.000)
Friendly Institutions -.794*** -0.879*** -.801*** -0.712*** -1.066*** -0.973***
(0.000) (0.000) (0.000) (0.000) (0.000) (0.000)
Activist Sponsored -0.440 29.520*** -0.882*** 23.594** 2.071** 27.890***
(0.725) (0.005) (0.000) (0.022) (0.014) (0.010)
Observations 15,925 10,827 15,925 10,827 23,579 15,907
Pseudo R2 0.323 0.393 0.328 0.394 0.302 0.336

55
Table 11: Stock-Picking Ability of Activism-Friendly Institutions
Panel A: Return Performance of Activism-Friendly and Other Portfolios
This table reports alphas from monthly time series regression of Long Short portfolio on Fama-French-Carhart
four factor model. Each month we go long the value-weighted portfolio of Activism-Friendly institutions and go
short the value-weighted portfolio of other institutions. Non-targets refer to the portfolio which goes long the
value-weighted non-target portfolio of activism-friendly institutions and short the value-weighted non-target
portfolio of other institutions. Non-target portfolio consists of firms that were not targeted by hedge fund activists.
Average value-weighted refers to the long (short) value weighted portfolio for each institution month average
across all friendly (other) institutions in that month.
SUFFER VOTER OWNINC
Value-weighted Alpha -0.09% -0.09% -0.13%
P-Value 0.014** 0.006*** 0.000***
Non-targets Alpha -0.09% -0.09% -0.13%
P-Value 0.015** 0.006*** 0.000***
Average value-weighted Alpha -0.05% -0.00% -0.12%
P-Value 0.264 0.967 0.000***
Panel B: Change in Holdings Prior to 13D Filing
This table reports the average value of the Up-targeted and Down-targeted variables. The Up-targeted dummy
takes the value of one when the activism-friendly institution increases its holding of a stock in the quarter (average
of four quarters or year) prior to 13D filing and it is targeted by activists and zero if it increases its holdings and
the stock is not targeted. Similarly, the Down-targeted dummy takes the value of one when the activism-friendly
institution decreases its holding of a stock in the quarter (average of four quarters or year) prior to 13D filing and
it is targeted by activists and zero if it decreases its holdings and the stock is not targeted.
Quarter Prior to 13D Filing Year Prior to 13D Filing
SUFFER VOTER OWNINC SUFFER VOTER OWNINC
Up-targeted 0.54% 0.49% 0.54% 0.55% 0.51% 0.56%
Down-targeted 0.58% 0.52% 0.57% 0.56% 0.50% 0.54%
DIFF: Up%-down% -0.04% -0.03% -0.03% -0.01% 0.01% 0.01%
P-value (Z-statistic) 0.000*** 0.000*** 0.001*** 0.581 0.282 0.167
Panel C: Performance of Activism-Friendly Institutional Holdings of Target Firms
This table reports alphas from monthly time series regressions of the long-short portfolio on the Fama-French-
Carhart four factor model. Each month we go long (short) the value-weighted portfolio of target stocks that
experience an increase (decrease) in holdings in the quarter prior to the 13D filing by activism-friendly institutions
and go short the value-weighted portfolio of other institutions. The Yearly Average captures long/short
performance based on increase/decrease of activism-friendly institutions’ holdings of target stocks in the year
prior, or prior 4 quarters, to the 13D filing. Average Value Weighted forms the long/ short portfolios based on
average increase/decrease of target holding for all friendly institutions.
SUFFER VOTER OWNINC
Value weighted Alpha -0.16% -0.02% 0.16%
P- value 0.758 0.922 0.526
Yearly average Alpha -0.04% -0.07% 0.16%
P- value 0.935 0.788 0.580
Average value weighted Alpha 0.40% 0.26% -0.01%
P- value 0.368 0.234 0.937

56
Table 12: Activism-Friendly Ownership, Indexers and BHARs
This table reports a regression in which the dependent variable is the 36-month market-adjusted BHARs.
As before SUFFER (VOTER) [OWNINC] are measures for activism-friendly ownership and Nofrd_suf,
(Nofrd_vot), and [Nofrd_inc] is the 13F ownership of institutions that are neither SUFFER (VOTER)
[OWNINC] nor the hedge fund activist of the event. Other control variables -Size, Leverage, Pre12_STK,
Pre13F, Commonly, CSREQ, MERGREQ, and GOVREQ were included in the estimation but not
tabulated. QIX is the pre event ownership by institutions classed as QIX by Bushee’s measure. All
regressions control for year and industry fixed effects. P-value based on standard errors adjusted for
heteroskedasticity are in parentheses, and ***, ** and * indicate significance at the 1%, 5%, and 10%
levels. All continuous measures are winsorized at 1% and 99% levels.
36 Month Market Adjusted BHAR
Model 1 Model 2 Model 3
SUFFER 1.340*
(0.075)
Nofrd_suf 0.096
(0.671)
VOTER 1.295***
(0.007)
Nofrd_vot -0.215
(0.355)
OWNINC 1.072**
(0.038)
Nofrd_inc -0.079
(0.623)
QIX 0.035 -0.383 0.140
(0.921) (0.324) (0.573)
Observations 620 620 1,058
R-squared 0.141 0.150 0.116
Year FE YES YES YES
Industry FE YES YES YES

57
Table 13: Likelihood of Being Targeted – Matched Sample
The table reports the results of a logit regression in which the dependent variable is a dummy variable that takes
the value of one if the firm was a target of hedge fund activism. The control firms are industry, size and book to
market matched firms. OWNINC, VOTER and SUFFER are the three measures of activism-friendly ownership.
NOFRD_INC, (NOFRD_VOT), and [NOFRD_SUF] represent the ownership of institutions that are neither INC
(VOT) [SUF] nor the event’s hedge fund activist. SIZE is the natural log of total assets, LEV is the ratio of book
value of debt to total assets. Change in sales is measured over lagged sales. Tobin’s Q is the sum of market value
of equity and book value of debt over the sum of book value of equity and book value of debt. ROA is net income
over lagged total assets. DIV is dividend scaled by book equity. HHI_SALES is the Herfindahl–Hirschman Index
of sales in different business segments. PRE13F is a dummy that takes the value of 1 if the activist disclosed
having more than 1% ownership in the quarter prior to the end. P-values are in parentheses; standard errors are
adjusted for heteroskedasticity, and ***, ** and * indicate significance at the 1%, 5%, and 10% levels. All
continuous measures are winsorized at 1% and 99% levels.
Model 1 Model 2 Model 3
SUFFER 5.713***
(0.000)
VOTER 1.934**
(0.019)
OWNINC 5.383***
(0.000)
NOFRD_SUF 2.303***
(0.000)
NOFRD_VOT 2.939***
(0.000)
NOFRD_INC 2.580***
(0.000)
SIZE -3.405*** -3.293*** -3.199***
(0.000) (0.000) (0.000)
LEV 1.525*** 1.479*** 1.227***
(0.003) (0.004) (0.002)
Change in Sales -0.596* -0.639** -0.278
(0.058) (0.047) (0.160)
Tobin Q 0.522** 0.479** 0.144
(0.033) (0.042) (0.216)
ROA -0.651 -0.583 -0.732
(0.343) (0.396) (0.168)
DIV -1.557 -1.528 0.576
(0.381) (0.392) (0.666)
HHI_SALES -0.196 -0.162 0.206
(0.540) (0.614) (0.427)
R&D / Sales 3.285** 3.483*** 3.364***
(0.015) (0.009) (0.004)
Number of Analysts -0.011 -0.002 -0.018
(0.575) (0.933) (0.270)
PRE13F 0.301* 0.301** 0.280**
(0.051) (0.047) (0.021)
Observations 998 998 1,658
H0: friendly<=non-friendly 0.009** 0.822 0.026**
Pseudo-R2 0.208 0.204 0.199

58
Table 14: Likelihood of Being Targeted
This table reports logit regressions where the dependent variable that takes the value of one if the firm was a
hedge fund target in the year. The sample consists of all firms in Compustat. SUFFER, VOTER, OWNINC
are the three measures of activism-friendly ownership. NOFRD_INC, (NOFRD_VOT), and [NOFRD_SUF]
represent the ownership of institutions that are neither INC (VOT) [SUF] nor the event’s hedge fund activist.
SIZE is the natural log of total assets, LEV is the ratio of book value of debt to total assets. Change in sales
is measured over lagged sales. Tobin’s Q is the sum of market value of equity and book value of debt over
the sum of book value of equity and book value of debt. ROA is net income over lagged total assets. DIV is
dividend scaled by book equity. HHI_SALES is the Herfindahl–Hirschman Index of sales in different
business segments. PRE13F takes the value of 1 if the activist holds more than 1% in the quarter prior to the
filing. P-values are in parentheses; standard errors are adjusted for heteroskedasticity, ***, ** and * indicate
significance at the 1%, 5%, and 10% levels. All continuous measures are winsorized at 1% and 99% levels.
Model 1 Model 2 Model 3
SUFFER 8.413***
(0.000)
VOTER 1.416***
(0.001)
OWNINC 2.384***
(0.000)
NOFRD_SUF 1.407***
(0.000)
NOFRD_VOT 2.220***
(0.000)
NOFRD_INC 1.942***
(0.000)
SIZE -0.183*** -0.154*** -0.184***
(0.000) (0.000) (0.000)
LEV 0.460* 0.448 0.489**
(0.095) (0.102) (0.021)
Change in Sales -0.527*** -0.553*** -0.434***
(0.001) (0.001) (0.000)
Tobin’s Q -0.138*** -0.140*** -0.151***
(0.000) (0.000) (0.000)
ROA -0.506 -0.484 -0.415*
(0.107) (0.128) (0.077)
DIV -1.441 -1.492 -1.291
(0.193) (0.172) (0.124)
HHI_SALES -0.010 -0.033 0.055
(0.958) (0.865) (0.726)
R&D / Sales 0.025 0.033 0.326
(0.970) (0.961) (0.516)
Number of Analysts -0.013 -0.002 -0.015
(0.260) (0.884) (0.116)
PRE13F 0.189* 0.166* 0.137*
(0.059) (0.095) (0.074)
INTERCEPT -3.388*** -3.753*** -3.739***
(0.000) (0.000) (0.000)
Observations 25,254 25,254 39,697
Year, Ind FE Yes,Yes Yes,Yes Yes,Yes
Psuedo R2 0.098 0.089 0.080
H0: friendly<=other 0.000*** 0.896 0.276

59
Table 15: Performance and Relationship of
Activism-Friendly Institutions with the Activist
This table reports a regression in which the dependent variable is the 36-month market-adjusted BHARs.
Overlapped_OWNINC is ownership by activism-friendly owners that were also present and classified as
friendly (by the OWNINC measure) in the prior case conducted by the activist. New_Owninc is ownership
by friendly institutions that were not present in the prior case of the activist. Overlapped_voter and
Overlapped_Suffer are similarly defined. All cases that are the first cases of the activist in the sample have
been dropped. . Other control variables -Size, Leverage, Pre12_STK, Pre13F, Commonly, CSREQ,
MERGREQ, and GOVREQ were included in the estimation but not tabulated. All regressions control for
year and industry fixed effects. P-value based on standard errors adjusted for heteroskedasticity are in
parentheses, and ***, ** and * indicate significance at the 1%, 5%, and 10% levels. All continuous
measures are winsorized at 1% and 99% levels.
36 Month Market Adjusted BHAR
Model 1 Model 2 Model 3
Overlapped_SUFFER 0.765
(0.801)
New_ SUFFER 1.821**
(0.035)
Overlapped_VOTER 1.262**
(0.027)
New_ VOTER 1.007**
(0.024)
Overlapped_OWNINC 1.251*
(0.077)
New_ OWNINC 0.386
(0.532)
Nofrd_ SUFFER -0.154
(0.433)
Nofrd_ VOTER -0.736***
(0.005)
Nofrd_ OWNINC -0.179
(0.276)
Observations 424 424 660
R-squared 0.171 0.186 0.143
Year FE YES YES YES
Ind FE YES YES YES

60
Appendix Table 1: Distribution of Activism Cases by Hedge Funds
This table reports the activism frequency of hedge funds over the 2004-2012 sample period . The table
includes only hedge funds with at least 15 cases over the sample period.
Hedge Fund Number of
Cases
Percentage of
All Cases
Third Point LLC 70 5.92
Millenco LLC 58 4.90
Ramius LLC 47 3.97
VA Partners LLC 41 3.47
Icahn Carl C 37 3.13
Blum Capital Partners LP 20 1.69
SAC Capital Advisors LLC 20 1.69
Pirate Capital LLC 19 1.61
Prides Capital Partners, LLC 19 1.61
SCSF Equities, LLC 19 1.61
Steel Partners Holdings L.P. 19 1.61
Clinton Group INC 18 1.52
Elliot Associates, L.P. 18 1.52
Jana Partners LLC 17 1.44
Shamrock Activist Value Fund L P 17 1.44
Wynnefield Partners Small Cap Value LP 17 1.44
Orbimed Advisors LLC 16 1.35
Riley Investment Management LLC 16 1.35
Seidman Lawrence B 16 1.35
Fine Capital Partners, L.P. 15 1.27
Harbinger Capital Partners Master Fund I, LTD. 15 1.27
MMI Investments, L.P. 15 1.27

61
Appendix Table 2: Buy and Hold Abnormal Returns
This table displays benchmark adjusted buy and hold returns over different holding periods. For the market-adjusted returns the benchmark is the CRSP Value
Weighted Index, for DGTW the benchmarks are in accordance with DGTW and for Industry adjusted the benchmark is Fama French 48 industry returns. In Panel
A (Panel B) [Panel C], the quartiles are formed on the basis of the activism-friendly ownership measure SUFFER (VOTER) [OWNINC]. Q1 (Q4) is the quartile
with the lowest (highest) activism-friendly ownership. The P-val (Ranksum) tests for whether mean (median) difference between quartile 4 (Q4) and quartile
1(Q1) is different from zero. ***, ** and * indicate significance at the 1%, 5%, and 10% levels.
Market Adjusted DGTW Industry Adjusted
BHAR
24 months
BHAR
36 months
BHAR
60 months
BHAR
24 months
BHAR
36 months
BHAR
60 months
BHAR
24 months
BHAR
36 months
BHAR
60 months
Panel A: SUFFER
Q1 -0.020 0.011 0.079 -0.028 0.021 0.126 -0.031 -0.008 0.041
Q2 0.013 0.090 0.288 0.061 0.140 0.422 -0.029 0.025 0.220
Q3 0.147 0.211 0.338 0.237 0.335 0.551 0.119 0.194 0.302
Q4 0.153 0.250 0.386 0.225 0.367 0.577 0.134 0.254 0.389
Q4-Q1 0.173 0.239 0.307 0.253 0.346 0.451 0.165 0.262 0.348
P-val 0.022** 0.014** 0.024** 0.001*** 0.000*** 0.001*** 0.031** 0.007*** 0.008***
Ranksum 0.003*** 0.001*** 0.000*** 0.000*** 0.000*** 0.000*** 0.004*** 0.000*** 0.000***
Panel B: VOTER
Q1 -0.019 0.018 0.079 -0.068 0.006 0.098 -0.018 0.015 0.067
Q2 0.001 0.017 0.166 0.038 0.067 0.306 0.001 0.002 0.144
Q3 0.045 0.129 0.213 0.109 0.229 0.411 0.009 0.103 0.179
Q4 0.118 0.194 0.326 0.172 0.257 0.411 0.076 0.149 0.253
Q4-Q1 0.136 0.175 0.248 0.240 0.251 0.313 0.094 0.135 0.186
P-val 0.067* 0.069* 0.075* 0.002*** 0.012** 0.020** 0.215 0.163 0.166
Ranksum 0.001*** 0.000*** 0.000*** 0.000*** 0.000*** 0.000*** 0.010** 0.004***
0.001***
Panel C: OWNINC
Q1 -0.076 -0.099 -0.050 -0.022 -0.023 0.042 -0.071 -0.096 -0.059
Q2 -0.046 -0.024 0.067 -0.013 0.027 0.111 -0.053 -0.053 0.009
Q3 0.009 0.003 0.040 0.033 0.049 0.134 0.009 -0.007 0.017
Q4 0.088 0.156 0.261 0.133 0.221 0.378 0.061 0.133 0.213
Q4-Q1 0.164 0.254 0.311 0.155 0.244 0.336 0.132 0.228 0.272
P-val 0.004*** 0.000*** 0.002*** 0.009*** 0.001*** 0.001*** 0.019** 0.001*** 0.004***
Ranksum 0.000*** 0.000*** 0.000*** 0.000*** 0.000*** 0.000*** 0.000*** 0.000*** 0.000***

62
Appendix Table 3: Calendar Time Portfolios
Calendar Time Portfolios of High Activism-friendly and Low Activism-friendly targets are created over 12, 24,
36, 48 and 60 month horizons. The table reports alphas from weighted least square estimation of monthly returns
of the portfolio on the Fama French Carhart four factor model. For each month, the high activism-friendly
portfolio consists of all firms that were targeted by hedge fund activism in the past 12, 24, 36, 48, 60 months and
had SUFFER in the top quartile. For each month, the low activism-friendly portfolio consists of all firms that
were targeted by hedge fund activism in the past 12, 24, 36, 48, 60 months and had SUFFER in the bottom
quartile. Panel B (C) use VOTER (OWNINC) as measures of activism-friendly ownership.
Panel A: SUFFER
(1,12) (1,24) (1,36) (1,48) (1,60)
Equal Weighted
High Friendly 0.970* 1.246*** 1.147*** 1.042*** 1.112***
(0.070) (0.000) (0.001) (0.001) (0.0000
Low Friendly -1.749*** -1.119* -0.734 -0.617 -0.507
(0.001) (0.063) (0.170) (0.207) (0.270)
High – Low 2.469*** 2.239*** 1.818*** 1.585*** 1.545***
(0.000) (0.000) (0.001) (0.002) (0.002)
Value Weighted
High Friendly 1.131* 0.878* 0.802* 0.908** 0.817**
(0.081) (0.069) (0.075) (0.028) (0.024)
Low Friendly -0.577 -0.542 -0.307 -0.088 0.033
(0.1100 (0.142) (0.3920 (0.809) (0.925)
High – Low 1.608** 1.227** 0.966* 0.853 0.678
(0.019) (0.041) (0.082) (0.114) (0.183)
# of months 78 78 78 78 78

63
Panel B: VOTER
(1,12) (1,24) (1,36) (1,48) (1,60)
Equal Weighted
High Friendly 0.205 0.294 0.412 0.424 0.459*
(0.543) (0.380) (0.204) (0.152) (0.090)
Low Friendly -0.276 0.033 0.055 0.107 0.178
(0.682) (0.960) (0.926) (0.845) (0.734)
High – Low 0.576 0.287 0.362 0.306 0.257
(0.321) (0.655) (0.518) (0.556) (0.608)
Value Weighted
High Friendly 0.809* 0.551 0.549* 0.498* 0.570**
(0.082) (0.136) (0.086) (0.072) (0.032)
Low Friendly -0.809 -0.749 -0.504 -0.214 -0.115
(0.239) (0.172) (0.317) (0.655) (0.805)
High – Low 1.765** 1.378** 1.079* 0.699 0.630
(0.026) (0.025) (0.055) (0.197) (0.231)
Number of months 78 78 78 78 78
Panel C: OWNINC
(1,12) (1,24) (1,36) (1,48) (1,60)
Equally Weighted
High Friendly 0.264 0.417* 0.576** 0.436** 0.501**
(0.322) (0.085) (0.016) (0.042) (0.011)
Low Friendly -0.141 -0.066 -0.155 -0.101 -0.048
0.770 0.883 0.703 0.793 0.896
High – Low 0.494 0.483 0.726* 0.547 0.547
0.313 0.286 0.067 0.148 0.112
Value Weighted
High Friendly 0.703** 0.582** 0.492** 0.435** 0.476**
0.039 0.018 0.029 0.040 0.023
Low Friendly -0.520 -0.289 -0.283 -0.284 0.094
0.320 0.550 0.527 0.498 0.798
High – Low 1.278** 0.880 0.777* 0.716* 0.371
0.028 0.104 0.100 0.099 0.359
Number of months 113 113 113 113 113

64
Appendix Table 4: Operating Performance
RROA is the abnormal industry adjusted ROA for different holding periods. Column1, 2 and 3 report results
with holding period of 2, 3 and 5 years respectively. In Panel A (Panel B) [Panel C], the quartiles are formed on
the basis of the activism-friendly ownership measure SUFFER (VOTER) [OWNINC]. Q1 (Q4) is the quartile
with the lowest (highest) activism-friendly ownership. The P-val (Ranksum) tests for whether mean (median)
difference between quartile 4 (Q4) and quartile 1(Q1) is different from zero. ***, ** and * indicate significance
at the 1%, 5%, and 10% levels.
RROA(2 year) RROA(3 year) RROA(5 year) Number
Panel A: SUFFER
Q1 -0.025 -0.025 -0.021 182
Q2 -0.015 -0.001 -0.007 70
Q3 0.019 0.016 0.018 76
Q4 0.033 0.038 0.040 73
Q4-Q1 0.058 0.063 0.061
P-val 0.013** 0.005*** 0.007***
Ranksum 0.009*** 0.003*** 0.008***
Panel B: VOTER
Q1 -0.044 -0.039 -0.034 88
Q2 -0.045 -0.044 -0.040 89
Q3 0.018 0.020 0.016 110
Q4 0.033 0.037 0.038 114
Q4-Q1 0.077 0.076 0.073
P-val 0.001*** 0.000*** 0.001***
Ranksum 0.000*** 0.000*** 0.001***
Panel C: OWNINC
Q1 -0.027 -0.024 -0.028 141
Q2 -0.020 -0.018 -0.018 181
Q3 0.003 -0.002 -0.004 175
Q4 0.023 0.026 0.028 199
Q4-Q1 0.051 0.050 0.055
P-val 0.003*** 0.002*** 0.001***
Ranksum 0.001*** 0.000*** 0.000***

65
Appendix Table 5: Activism-Friendly Ownership around 13D filing
This table reports the total activism-friendly ownership in each quarter. Quarter 0 is the quarter
of the 13D filing. The other quarters are number relative to the event quarter. SUFFER, VOTER
and OWNINC are the three measures of activism-friendly ownership.
SUFFER VOTER OWNINC
Quarter -4 0.079 0.177 0.082
Quarter -3 0.078 0.179 0.083
Quarter -2 0.078 0.186 0.084
Quarter -1 0.081 0.192 0.084
Quarter 0 0.078 0.185 0.081
Quarter 1 0.075 0.177 0.079
Quarter 2 0.071 0.172 0.077
Quarter 3 0.070 0.165 0.076
Quarter 4 0.066 0.154 0.072
Appendix Table 6: Incidence of Activist Sponsored Proposals
The table reports the average fraction of all proposals in a shareholder meeting that are sponsored by the
activist. The quartiles are based on the measure of activism-friendly ownership in the top of the column.
The number in the brackets indicates the number of shareholder meetings. The sample includes all
shareholder meetings for the target firms in the two years after the 13D filing.
SUFFER VOTER OWNINC
Q1 0.55% (191) 0.60% (139) 0.17% (229)
Q2 1.14% (148) 1.01% (150) 0.77% (237)
Q3 1.47% (158) 2.22% (159) 1.11% (239)
Q4 3.01% (138) 1.79% (187) 1.98% (254)
Diff Q4 - Q1 2.46% 1.19% 1.81%
p-Value 0.004*** 0.112 0.002***