institutional equity research dabur india ltd (dabur...
TRANSCRIPT
INSTITUTIONAL EQUITY RESEARCH
Page | 1 | PHILLIPCAPITAL INDIA RESEARCH
Dabur India Ltd (DABUR IN)
Nepal border resolution is a key positive
INDIA | FMCG | Company Update
10 February 2016
Dabur’s recent price correction is largely due to supply issues for Real juices with the Nepal border blockade, and rising competitive pressures from Patanjali. With the Nepal border blockade issue resolved, Dabur said that the supply of fruit juices from its Nepal factory would resume soon. The resolution is a key positive, as it comes at the cusp of peak-season (summer) demand. The management believes it will not see a shortage of fruit-juice supply in the summer, which will help recoup lost sales. We have marginally upgraded our estimates for the foods segment for FY17 because of an earlier-than-expected resolution of supply issues. About rising competition from Patanjali, we believe that Dabur will in fact benefit (as it is well positioned to capitalise) from the subsequent surge in ayurvedic products. We maintain Buy with a target of Rs 285 (unchanged).
Juices overhang now past: Dabur’s foods segment (c.13% of revenues) is primarily driven by fruit juices. In Q3, the segment’s revenue fell 24% yoy on the Nepal border blockade. Dabur’s Nepal fruit juice plant produces its popular Real mixed fruit juice and some other variants. The onset of summer from February-March with demand peaking in April-May will mean that channel filling activity will happen by the end of Q4FY16 and beginning of Q1FY17. Q4FY16 and Q1FY17 numbers could beat expectations because trade channels are relatively light on inventory.
Patanjali concerns are overdone: Dabur competes with Patanjali in toothpaste, honey, chyawanprash, digestives, and hair care. While Patanjali has been successful in oral care, Dabur also has managed to deliver strong growth in the category (24%/28%/15% yoy in Q1/Q2/Q3). In chyawanprash and digestives, Dabur’s position is much stronger and it has a fairly long history of above-market growth. Patanjali’s success rate in hair care is questionable because the category is dominated by Indian brands with a longer history. The only major area of disruption that we see is honey – however, honey is a relatively small category for Dabur (we estimate ~Rs 3bn market size with Dabur’s share at 75%) and Patanjali’s impact in honey (if any) is unlikely to be significant.
Highest volume growth sensitivity to advertising spends: While its operating environment has been quite challenging, Dabur has maintained brand investments at relatively high levels. In the first nine months of FY16, its adverting spends were 15.3% vs. the last five-year average of 13.5%. With significantly higher sensitivity of volume growth to advertising spends, Dabur’s volume growth will bounce back over the next 12 months.
International business revival provides a fillip: Dabur’s international business is gaining traction with its Namaste business reviving. This provides more visibility on improving growth prospects. We estimate the international business to deliver a healthy 15% CAGR over FY16-18, higher than our estimate of the Indian FMCG sector’s CAGR of 12%.
Valuation and outlook: Dabur is currently trading at 29x FY17 earnings, a significant discount to its sector valuation of 35x. The discount is attributable to concerns of rising competition and impact of juices. As concerns will wane with improving operating performance, the stock is more likely to rerate over the medium term. We maintain our Buy recommendation on the stock with an unchanged price target of Rs 285 (30x FY18 earnings).
BUY (Maintain) CMP RS 244 TARGET RS 285 (+17%) COMPANY DATA
O/S SHARES (MN) : 1759
MARKET CAP (RSBN) : 437
MARKET CAP (USDBN) : 6.4
52 - WK HI/LO (RS) : 317 / 232
LIQUIDITY 3M (USDMN) : 5.2
PAR VALUE (RS) : 1
SHARE HOLDING PATTERN, %
Sep 15 Jun 15 Mar 15
PROMOTERS : 68.1 68.2 68.2
FII / NRI : 21.4 21.6 21.4
FI / MF : 4.4 4.6 4.7
NON PRO : 1.7 1.6 1.6
PUBLIC & OTHERS : 4.8 4.5 4.6
PRICE PERFORMANCE, %
1MTH 3MTH 1YR
ABS -7.6 -6.8 -4.8
REL TO BSE -4.0 1.2 10.1
PRICE VS. SENSEX
Key Financials
Rs mn FY16E FY17E FY18E
Net Sales 83,780 95,353 108,213
EBIDTA 15,307 17,658 20,264
Net Profit 12,674 14,537 16,431
EPS, Rs 7.2 8.3 9.4
PER, x 33.8 29.5 25.9
EV/EBIDTA, x 27.9 23.8 20.4
PBV, X 5.1 4.4 3.8
ROE, % 31.0 29.7 28.5
Debt/Equity (%) 17.9 15.0 12.7
Source: PhillipCapital India Research Est.
Naveen Kulkarni, CFA, FRM (+ 9122 6667 9947) [email protected] Jubil Jain (+ 9122 6667 9766) [email protected]
60
100
140
180
Apr-14 Oct-14 Apr-15 Oct-15
Dabur BSE Sensex
Page | 2 | PHILLIPCAPITAL INDIA RESEARCH
DABUR INDIA LTD COMPANY UPDATE
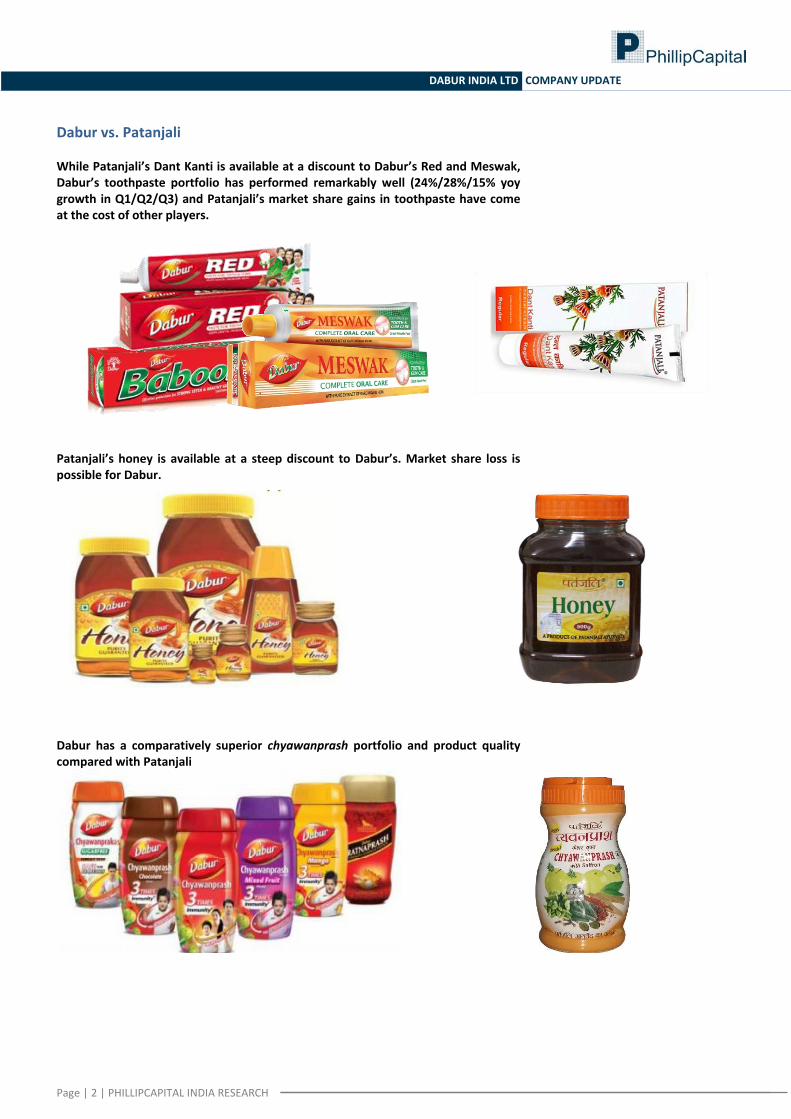
Dabur vs. Patanjali While Patanjali’s Dant Kanti is available at a discount to Dabur’s Red and Meswak, Dabur’s toothpaste portfolio has performed remarkably well (24%/28%/15% yoy growth in Q1/Q2/Q3) and Patanjali’s market share gains in toothpaste have come at the cost of other players. Patanjali’s honey is available at a steep discount to Dabur’s. Market share loss is possible for Dabur.
Dabur has a comparatively superior chyawanprash portfolio and product quality compared with Patanjali
Page | 3 | PHILLIPCAPITAL INDIA RESEARCH
DABUR INDIA LTD COMPANY UPDATE
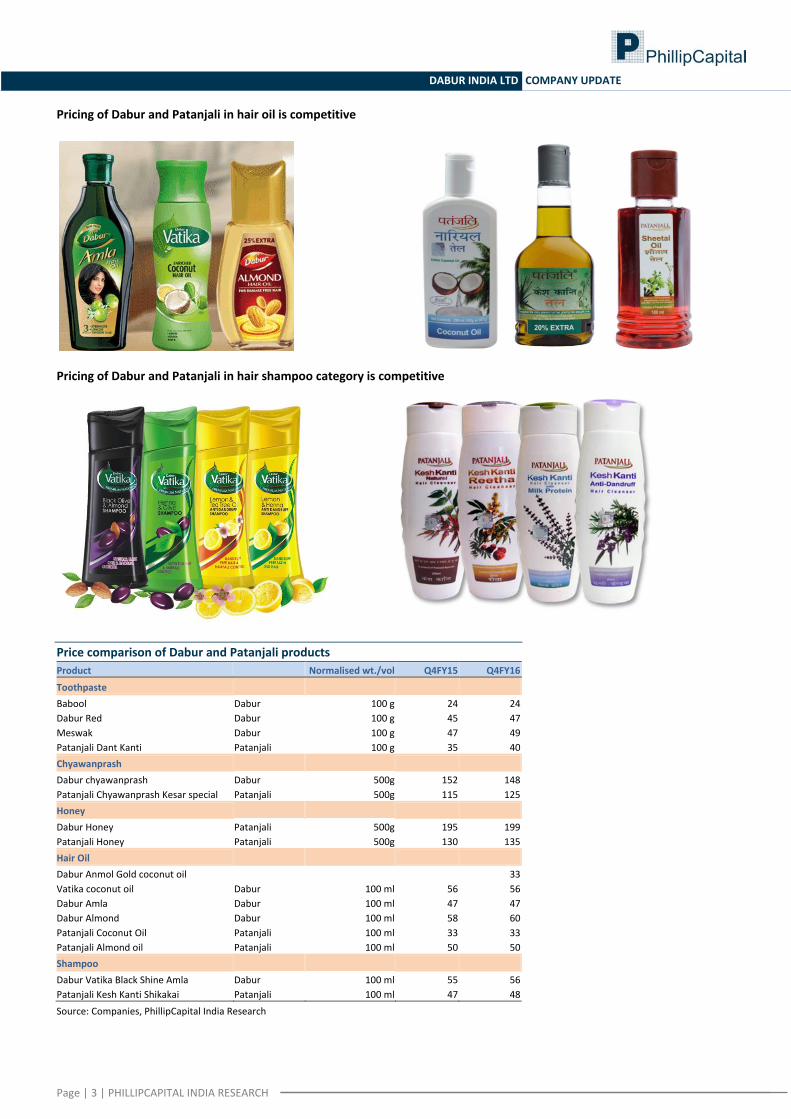
Pricing of Dabur and Patanjali in hair oil is competitive
Pricing of Dabur and Patanjali in hair shampoo category is competitive
Price comparison of Dabur and Patanjali products
Product Normalised wt./vol Q4FY15 Q4FY16
Toothpaste Babool Dabur 100 g 24 24
Dabur Red Dabur 100 g 45 47
Meswak Dabur 100 g 47 49
Patanjali Dant Kanti Patanjali 100 g 35 40
Chyawanprash
Dabur chyawanprash Dabur 500g 152 148
Patanjali Chyawanprash Kesar special Patanjali 500g 115 125
Honey
Dabur Honey Patanjali 500g 195 199
Patanjali Honey Patanjali 500g 130 135
Hair Oil
Dabur Anmol Gold coconut oil 33
Vatika coconut oil Dabur 100 ml 56 56
Dabur Amla Dabur 100 ml 47 47
Dabur Almond Dabur 100 ml 58 60
Patanjali Coconut Oil Patanjali 100 ml 33 33
Patanjali Almond oil Patanjali 100 ml 50 50
Shampoo
Dabur Vatika Black Shine Amla Dabur 100 ml 55 56
Patanjali Kesh Kanti Shikakai Patanjali 100 ml 47 48
Source: Companies, PhillipCapital India Research
Page | 4 | PHILLIPCAPITAL INDIA RESEARCH
DABUR INDIA LTD COMPANY UPDATE
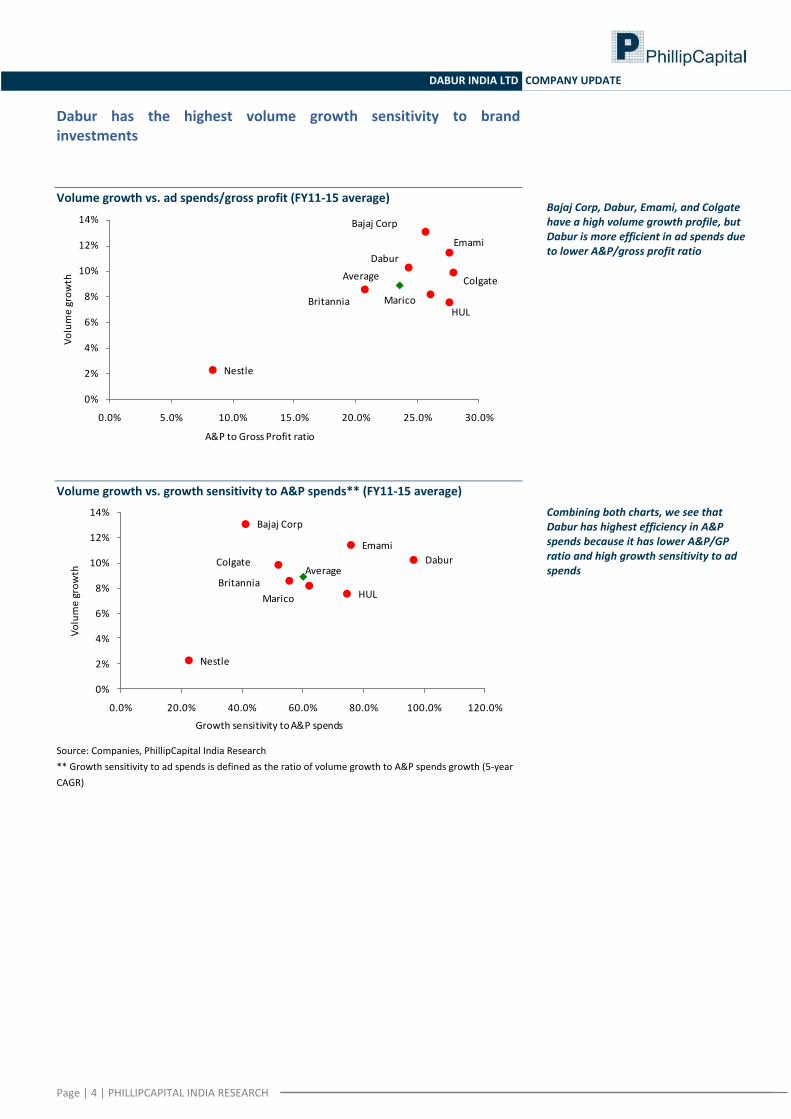
Dabur has the highest volume growth sensitivity to brand investments
Volume growth vs. ad spends/gross profit (FY11-15 average)
Volume growth vs. growth sensitivity to A&P spends** (FY11-15 average)
Source: Companies, PhillipCapital India Research
** Growth sensitivity to ad spends is defined as the ratio of volume growth to A&P spends growth (5-year
CAGR)
Bajaj Corp
Britannia
Colgate
Dabur
Emami
HULMarico
Nestle
Average
0%
2%
4%
6%
8%
10%
12%
14%
0.0% 5.0% 10.0% 15.0% 20.0% 25.0% 30.0%
Vo
lum
e g
row
th
A&P to Gross Profit ratio
Bajaj Corp
Britannia
Colgate Dabur
Emami
HULMarico
Nestle
Average
0%
2%
4%
6%
8%
10%
12%
14%
0.0% 20.0% 40.0% 60.0% 80.0% 100.0% 120.0%
Vo
lum
e g
row
th
Growth sensitivity to A&P spends
Bajaj Corp, Dabur, Emami, and Colgate have a high volume growth profile, but Dabur is more efficient in ad spends due to lower A&P/gross profit ratio
Combining both charts, we see that Dabur has highest efficiency in A&P spends because it has lower A&P/GP ratio and high growth sensitivity to ad spends
Page | 5 | PHILLIPCAPITAL INDIA RESEARCH
DABUR INDIA LTD COMPANY UPDATE
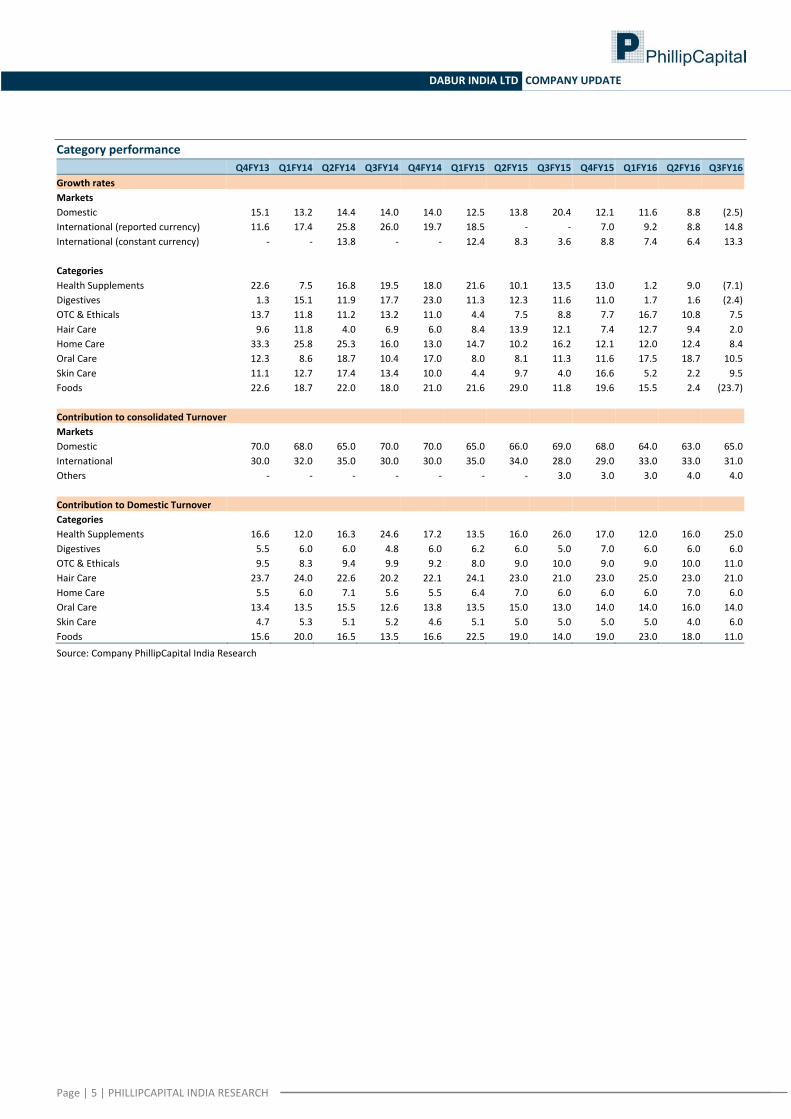
Category performance
Q4FY13 Q1FY14 Q2FY14 Q3FY14 Q4FY14 Q1FY15 Q2FY15 Q3FY15 Q4FY15 Q1FY16 Q2FY16 Q3FY16
Growth rates
Markets
Domestic 15.1 13.2 14.4 14.0 14.0 12.5 13.8 20.4 12.1 11.6 8.8 (2.5)
International (reported currency) 11.6 17.4 25.8 26.0 19.7 18.5 - - 7.0 9.2 8.8 14.8
International (constant currency) - - 13.8 - - 12.4 8.3 3.6 8.8 7.4 6.4 13.3
Categories
Health Supplements 22.6 7.5 16.8 19.5 18.0 21.6 10.1 13.5 13.0 1.2 9.0 (7.1)
Digestives 1.3 15.1 11.9 17.7 23.0 11.3 12.3 11.6 11.0 1.7 1.6 (2.4)
OTC & Ethicals 13.7 11.8 11.2 13.2 11.0 4.4 7.5 8.8 7.7 16.7 10.8 7.5
Hair Care 9.6 11.8 4.0 6.9 6.0 8.4 13.9 12.1 7.4 12.7 9.4 2.0
Home Care 33.3 25.8 25.3 16.0 13.0 14.7 10.2 16.2 12.1 12.0 12.4 8.4
Oral Care 12.3 8.6 18.7 10.4 17.0 8.0 8.1 11.3 11.6 17.5 18.7 10.5
Skin Care 11.1 12.7 17.4 13.4 10.0 4.4 9.7 4.0 16.6 5.2 2.2 9.5
Foods 22.6 18.7 22.0 18.0 21.0 21.6 29.0 11.8 19.6 15.5 2.4 (23.7)
Contribution to consolidated Turnover
Markets
Domestic 70.0 68.0 65.0 70.0 70.0 65.0 66.0 69.0 68.0 64.0 63.0 65.0
International 30.0 32.0 35.0 30.0 30.0 35.0 34.0 28.0 29.0 33.0 33.0 31.0
Others - - - - - - - 3.0 3.0 3.0 4.0 4.0
Contribution to Domestic Turnover
Categories
Health Supplements 16.6 12.0 16.3 24.6 17.2 13.5 16.0 26.0 17.0 12.0 16.0 25.0
Digestives 5.5 6.0 6.0 4.8 6.0 6.2 6.0 5.0 7.0 6.0 6.0 6.0
OTC & Ethicals 9.5 8.3 9.4 9.9 9.2 8.0 9.0 10.0 9.0 9.0 10.0 11.0
Hair Care 23.7 24.0 22.6 20.2 22.1 24.1 23.0 21.0 23.0 25.0 23.0 21.0
Home Care 5.5 6.0 7.1 5.6 5.5 6.4 7.0 6.0 6.0 6.0 7.0 6.0
Oral Care 13.4 13.5 15.5 12.6 13.8 13.5 15.0 13.0 14.0 14.0 16.0 14.0
Skin Care 4.7 5.3 5.1 5.2 4.6 5.1 5.0 5.0 5.0 5.0 4.0 6.0
Foods 15.6 20.0 16.5 13.5 16.6 22.5 19.0 14.0 19.0 23.0 18.0 11.0
Source: Company PhillipCapital India Research
Page | 6 | PHILLIPCAPITAL INDIA RESEARCH
DABUR INDIA LTD COMPANY UPDATE
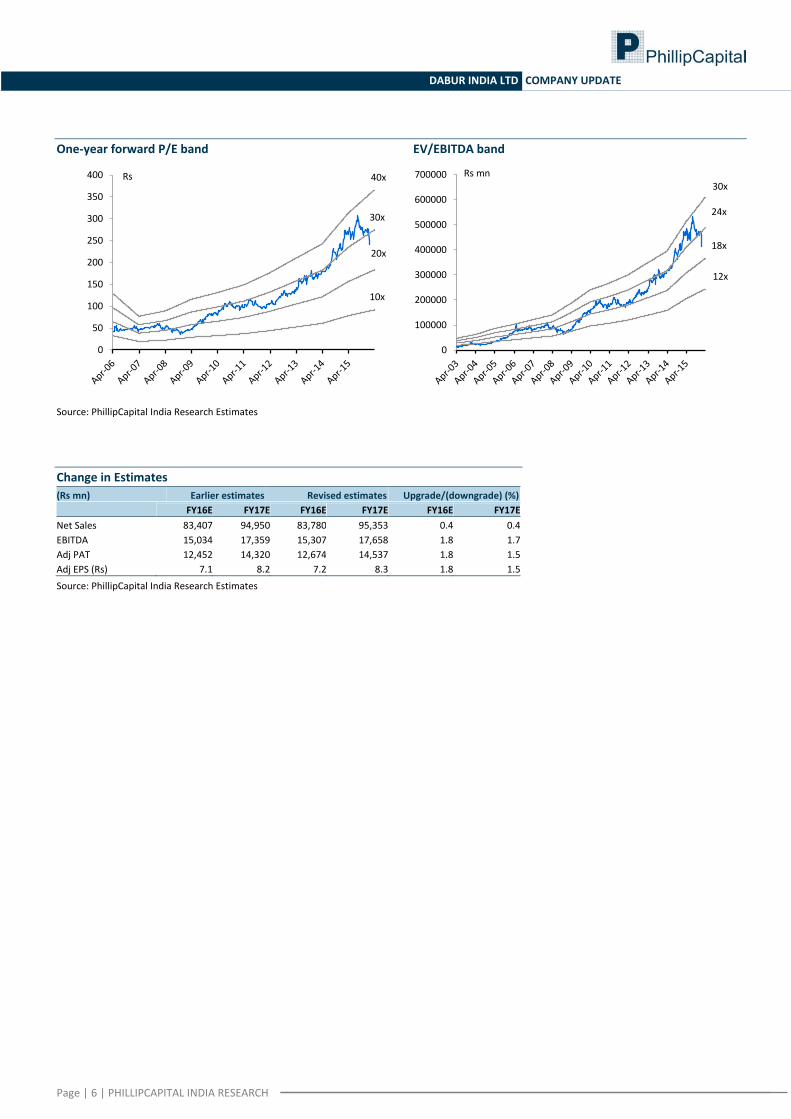
One-year forward P/E band EV/EBITDA band
Source: PhillipCapital India Research Estimates
Change in Estimates
(Rs mn) Earlier estimates Revised estimates Upgrade/(downgrade) (%)
FY16E FY17E FY16E FY17E FY16E FY17E
Net Sales 83,407 94,950 83,780 95,353 0.4 0.4
EBITDA 15,034 17,359 15,307 17,658 1.8 1.7
Adj PAT 12,452 14,320 12,674 14,537 1.8 1.5
Adj EPS (Rs) 7.1 8.2 7.2 8.3 1.8 1.5
Source: PhillipCapital India Research Estimates
10x
20x
30x
40x
0
50
100
150
200
250
300
350
400 Rs
12x
18x
24x
30x
0
100000
200000
300000
400000
500000
600000
700000 Rs mn

Page | 7 | PHILLIPCAPITAL INDIA RESEARCH
DABUR INDIA LTD COMPANY UPDATE
Financials
Income Statement Y/E Mar, Rs mn FY15 FY16E FY17E FY18E
Net sales 78,064 83,780 95,353 108,213
Growth, % 10.7 7.3 13.8 13.5
Other income 208 196 225 259
Total income 78,272 83,976 95,578 108,472
Raw material expenses -37,201 -37,272 -42,144 -47,692
Other Operating expenses -27,907 -31,397 -35,777 -40,516
EBITDA (Core) 13,164 15,307 17,658 20,264
Growth, % 13.5 16.3 15.4 14.8
Margin, % 16.9 18.3 18.5 18.7
Depreciation -1,150 -1,288 -1,394 -1,514
EBIT 12,014 14,019 16,264 18,750
Growth, % 13.1 16.7 16.0 15.3
Margin, % 15.4 16.7 17.1 17.3
Interest paid -401 -467 -469 -659
Other Non-Operating Income 1,581 2,121 2,397 2,708
Pre-tax profit 13,193 15,673 18,191 20,799
Tax provided -2,509 -2,986 -3,638 -4,368
Profit after tax 10,684 12,688 14,554 16,431
Net Profit 10,658 12,674 14,538 16,431
Growth, % 16.5 18.9 14.7 13.0
Net Profit (adjusted) 10,658 12,674 14,537 16,431
Unadj. shares (m) 1,757 1,757 1,757 1,744
Wtd avg shares (m) 1,757 1,757 1,757 1,744
Balance Sheet Y/E Mar, Rs mn FY15 FY16E FY17E FY18E
Cash & bank 2,760 8,831 16,249 18,832
Debtors 7,964 8,378 9,535 9,038
Inventory 9,733 10,172 11,081 12,044
Loans & advances 3,198 2,996 2,996 2,996
Total current assets 23,655 30,377 39,862 42,910
Investments 18,134 18,134 18,134 18,134
Gross fixed assets 25,409 27,912 30,012 32,212
Less: Depreciation -6,638 -7,926 -9,321 -10,835
Add: Capital WIP 503 0 0 0
Net fixed assets 19,274 19,986 20,691 21,377
Total assets 61,345 68,779 78,968 82,703
Current liabilities 19,417 19,507 21,615 16,608
Total current liabilities 19,417 19,507 21,615 16,608
Non-current liabilities 8,205 8,205 8,205 8,205
Total liabilities 27,622 27,712 29,820 24,813
Paid-up capital 1,757 1,757 1,757 1,757
Reserves & surplus 31,785 39,115 47,181 55,905
Shareholders’ equity 33,723 41,067 49,149 57,890
Total equity & liabilities 61,345 68,779 78,968 82,703
Source: Company, PhillipCapital India Research Estimates
Cash Flow Y/E Mar, Rs mn FY15 FY16E FY17E FY18E
Pre-tax profit 13,193 15,673 18,191 20,799
Depreciation 1,150 1,288 1,394 1,514
Chg in working capital -919 -561 41 -5,473
Total tax paid -2,527 -2,986 -3,638 -4,368
Other operating activities -936 -1,524 -1,656 0
Cash flow from operating activities 9,961 11,890 14,332 12,472
Capital expenditure -2,538 -2,000 -2,098 -2,200
Chg in investments -7,369 0 0 0
Cash flow from investing activities -9,907 -2,000 -2,098 -2,200
Free cash flow 55 9,890 12,234 10,272
Equity raised/(repaid) 1,212 700 800 900
Debt raised/(repaid) 254 0 0 0
Dividend (incl. tax) -4,609 -3,884 -5,828 -6,994
Cash flow from financing activities -3,147 -3,184 -5,028 -6,077
Net chg in cash -3,092 6,707 7,206 4,196
Valuation Ratios
FY15 FY16E FY17E FY18E
Per Share data
EPS (INR) 6.1 7.2 8.3 9.4
Growth, % 15.7 18.9 14.7 13.9
Book NAV/share (INR) 19.1 23.3 27.9 33.1
FDEPS (INR) 6.1 7.2 8.3 9.4
CEPS (INR) 6.7 7.9 9.1 10.3
CFPS (INR) 5.3 6.4 7.7 5.6
DPS (INR) 2.6 2.0 2.8 3.4
Return ratios Return on assets (%) 19.1 20.0 20.1 20.8
Return on equity (%) 31.8 31.0 29.7 28.5
Return on capital employed (%) 28.6 28.5 27.9 27.3
Turnover ratios Asset turnover (x) 4.2 4.1 4.4 4.3
Sales/Total assets (x) 1.4 1.3 1.3 1.3
Sales/Net FA (x) 4.2 4.3 4.7 5.1
Working capital/Sales (x) 0.0 0.0 0.0 0.1
Fixed capital/Sales (x) 0.6 - - -
Working capital days 6.9 8.9 7.6 25.2
Liquidity ratios
Current ratio (x) 1.2 1.6 1.8 2.6
Quick ratio (x) 0.7 1.0 1.3 1.9
Interest cover (x) 29.9 30.0 34.6 28.4
Dividend cover (x) 2.3 3.6
Total debt/Equity (%) 21.9 17.9 15.0 12.7
Net debt/Equity (%)
Valuation
PER (x) 40.2 33.8 29.5 25.9
Price/Book (x) 12.8 10.5 8.8 7.4
Yield (%) 1.1 0.8
EV/Net sales (x) 5.5 5.1 4.4 3.8
EV/EBITDA (x) 32.9 27.9 23.8 20.4
EV/EBIT (x) 36.1 30.5 25.8 22.1
Page | 8 | PHILLIPCAPITAL INDIA RESEARCH
DABUR INDIA LTD COMPANY UPDATE
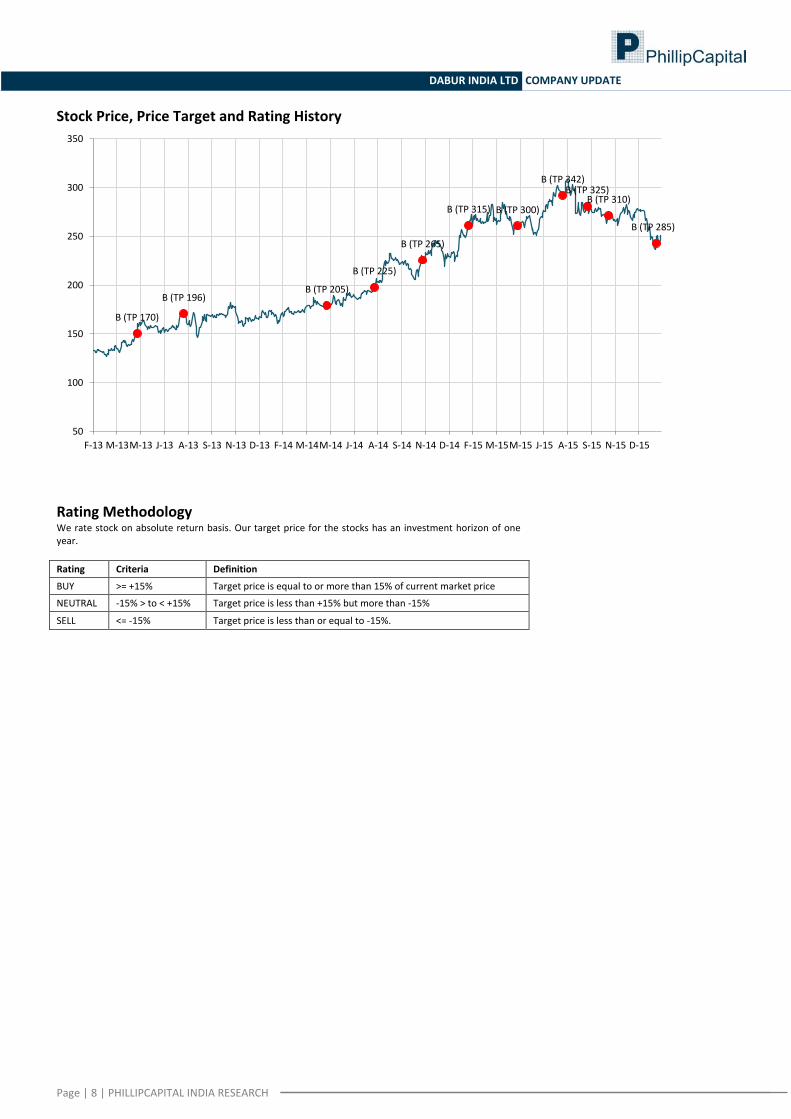
Stock Price, Price Target and Rating History
Rating Methodology We rate stock on absolute return basis. Our target price for the stocks has an investment horizon of one year.
Rating Criteria Definition
BUY >= +15% Target price is equal to or more than 15% of current market price
NEUTRAL -15% > to < +15% Target price is less than +15% but more than -15%
SELL <= -15% Target price is less than or equal to -15%.
B (TP 170)
B (TP 196) B (TP 205)
B (TP 225)
B (TP 265)
B (TP 315) B (TP 300)
B (TP 342) B (TP 325)
B (TP 310)
B (TP 285)
50
100
150
200
250
300
350
F-13 M-13 M-13 J-13 A-13 S-13 N-13 D-13 F-14 M-14 M-14 J-14 A-14 S-14 N-14 D-14 F-15 M-15 M-15 J-15 A-15 S-15 N-15 D-15
Page | 9 | PHILLIPCAPITAL INDIA RESEARCH
DABUR INDIA LTD COMPANY UPDATE
Contact Information (Regional Member Companies)
SINGAPORE
Phillip Securities Pte Ltd
250 North Bridge Road, #06-00 RafflesCityTower,
Singapore 179101
Tel : (65) 6533 6001 Fax: (65) 6535 3834
www.phillip.com.sg
MALAYSIA
Phillip Capital Management Sdn Bhd
B-3-6 Block B Level 3, Megan Avenue II,
No. 12, Jalan Yap Kwan Seng, 50450 Kuala Lumpur
Tel (60) 3 2162 8841 Fax (60) 3 2166 5099
www.poems.com.my
HONG KONG
Phillip Securities (HK) Ltd
11/F United Centre 95 Queensway Hong Kong
Tel (852) 2277 6600 Fax: (852) 2868 5307
www.phillip.com.hk
JAPAN
Phillip Securities Japan, Ltd
4-2 Nihonbashi Kabutocho, Chuo-ku
Tokyo 103-0026
Tel: (81) 3 3666 2101 Fax: (81) 3 3664 0141
www.phillip.co.jp
INDONESIA
PT Phillip Securities Indonesia
ANZTower Level 23B, Jl Jend Sudirman Kav 33A,
Jakarta 10220, Indonesia
Tel (62) 21 5790 0800 Fax: (62) 21 5790 0809
www.phillip.co.id
CHINA
Phillip Financial Advisory (Shanghai) Co. Ltd.
No 550 Yan An East Road, OceanTower Unit 2318
Shanghai 200 001
Tel (86) 21 5169 9200 Fax: (86) 21 6351 2940
www.phillip.com.cn
THAILAND
Phillip Securities (Thailand) Public Co. Ltd.
15th Floor, VorawatBuilding, 849 Silom Road,
Silom, Bangrak, Bangkok 10500 Thailand
Tel (66) 2 2268 0999 Fax: (66) 2 2268 0921
www.phillip.co.th
FRANCE
King & Shaxson Capital Ltd.
3rd Floor, 35 Rue de la Bienfaisance
75008 Paris France
Tel (33) 1 4563 3100 Fax : (33) 1 4563 6017
www.kingandshaxson.com
UNITED KINGDOM
King & Shaxson Ltd.
6th Floor, Candlewick House, 120 Cannon Street
London, EC4N 6AS
Tel (44) 20 7929 5300 Fax: (44) 20 7283 6835
www.kingandshaxson.com
UNITED STATES
Phillip Futures Inc.
141 W Jackson Blvd Ste 3050
The Chicago Board of TradeBuilding
Chicago, IL 60604 USA
Tel (1) 312 356 9000 Fax: (1) 312 356 9005
AUSTRALIA
PhillipCapital Australia
Level 37, 530 Collins Street
Melbourne, Victoria 3000, Australia
Tel: (61) 3 9629 8380 Fax: (61) 3 9614 8309
www.phillipcapital.com.au
SRI LANKA
Asha Phillip Securities Limited
Level 4, Millennium House, 46/58 Navam Mawatha,
Colombo 2, Sri Lanka
Tel: (94) 11 2429 100 Fax: (94) 11 2429 199
www.ashaphillip.net/home.htm
INDIA
PhillipCapital (India) Private Limited
No. 1, 18th Floor, Urmi Estate, 95 Ganpatrao Kadam Marg, Lower Parel West, Mumbai 400013
Tel: (9122) 2300 2999 Fax: (9122) 6667 9955 www.phillipcapital.in
Management(91 22) 2483 1919
Kinshuk Bharti Tiwari (Head – Institutional Equity) (91 22) 6667 9946
(91 22) 6667 9735
Research Infrastructure & IT Services Strategy
Dhawal Doshi (9122) 6667 9769 Vibhor Singhal (9122) 6667 9949 Naveen Kulkarni, CFA, FRM (9122) 6667 9947
Nitesh Sharma, CFA (9122) 6667 9965 Logistics, Transportation & Midcap Anindya Bhowmik (9122) 6667 9764
Agri Inputs Vikram Suryavanshi (9122) 6667 9951 Telecom
Gauri Anand (9122) 6667 9943 Media Naveen Kulkarni, CFA, FRM (9122) 6667 9947
Banking, NBFCs Manoj Behera (9122) 6667 9973 Manoj Behera (9122) 6667 9973
Manish Agarwalla (9122) 6667 9962 Metals Technicals
Pradeep Agrawal (9122) 6667 9953 Dhawal Doshi (9122) 6667 9769 Subodh Gupta, CMT (9122) 6667 9762
Paresh Jain (9122) 6667 9948 Yash Doshi (9122) 6667 9987 Production Manager
Consumer Midcap Ganesh Deorukhkar (9122) 6667 9966
Naveen Kulkarni, CFA, FRM (9122) 6667 9947 Amol Rao (9122) 6667 9952 Editor
Jubil Jain (9122) 6667 9766 Oil & Gas Roshan Sony 98199 72726
Cement Sabri Hazarika (9122) 6667 9756 Sr. Manager – Equities Support
Vaibhav Agarwal (9122) 6667 9967 Pharma & Speciality Chem Rosie Ferns (9122) 6667 9971
Economics Surya Patra (9122) 6667 9768
Anjali Verma (9122) 6667 9969 Mehul Sheth (9122) 6667 9996
Engineering, Capital Goods Mid-Caps & Database Manager
Jonas Bhutta (9122) 6667 9759 Deepak Agarwal (9122) 6667 9944
Hrishikesh Bhagat (9122) 6667 9986
Sales & Distribution Ashvin Patil (9122) 6667 9991 Sales Trader Zarine Damania (9122) 6667 9976
Shubhangi Agrawal (9122) 6667 9964 Dilesh Doshi (9122) 6667 9747
Kishor Binwal (9122) 6667 9989 Suniil Pandit (9122) 6667 9745
Bhavin Shah (9122) 6667 9974 Execution
Ashka Mehta Gulati (9122) 6667 9934 Mayur Shah (9122) 6667 9945
Corporate Communications
Vineet Bhatnagar (Managing Director)
Jignesh Shah (Head – Equity Derivatives)
Automobiles

Page | 10 | PHILLIPCAPITAL INDIA RESEARCH
DABUR INDIA LTD COMPANY UPDATE
Disclosures and Disclaimers PhillipCapital (India) Pvt. Ltd. has three independent equity research groups: Institutional Equities, Institutional Equity Derivatives, and Private Client Group. This report has been prepared by Institutional Equities Group. The views and opinions expressed in this document may, may not match, or may be contrary at times with the views, estimates, rating, and target price of the other equity research groups of PhillipCapital (India) Pvt. Ltd.
This report is issued by PhillipCapital (India) Pvt. Ltd., which is regulated by the SEBI. PhillipCapital (India) Pvt. Ltd. is a subsidiary of Phillip (Mauritius) Pvt. Ltd. References to "PCIPL" in this report shall mean PhillipCapital (India) Pvt. Ltd unless otherwise stated. This report is prepared and distributed by PCIPL for information purposes only, and neither the information contained herein, nor any opinion expressed should be construed or deemed to be construed as solicitation or as offering advice for the purposes of the purchase or sale of any security, investment, or derivatives. The information and opinions contained in the report were considered by PCIPL to be valid when published. The report also contains information provided to PCIPL by third parties. The source of such information will usually be disclosed in the report. Whilst PCIPL has taken all reasonable steps to ensure that this information is correct, PCIPL does not offer any warranty as to the accuracy or completeness of such information. Any person placing reliance on the report to undertake trading does so entirely at his or her own risk and PCIPL does not accept any liability as a result. Securities and Derivatives markets may be subject to rapid and unexpected price movements and past performance is not necessarily an indication of future performance.
This report does not regard the specific investment objectives, financial situation, and the particular needs of any specific person who may receive this report. Investors must undertake independent analysis with their own legal, tax, and financial advisors and reach their own conclusions regarding the appropriateness of investing in any securities or investment strategies discussed or recommended in this report and should understand that statements regarding future prospects may not be realised. Under no circumstances can it be used or considered as an offer to sell or as a solicitation of any offer to buy or sell the securities mentioned within it. The information contained in the research reports may have been taken from trade and statistical services and other sources, which PCIL believe is reliable. PhillipCapital (India) Pvt. Ltd. or any of its group/associate/affiliate companies do not guarantee that such information is accurate or complete and it should not be relied upon as such. Any opinions expressed reflect judgments at this date and are subject to change without notice.
Important: These disclosures and disclaimers must be read in conjunction with the research report of which it forms part. Receipt and use of the research report is subject to all aspects of these disclosures and disclaimers. Additional information about the issuers and securities discussed in this research report is available on request.
Certifications: The research analyst(s) who prepared this research report hereby certifies that the views expressed in this research report accurately reflect the research analyst’s personal views about all of the subject issuers and/or securities, that the analyst(s) have no known conflict of interest and no part of the research analyst’s compensation was, is, or will be, directly or indirectly, related to the specific views or recommendations contained in this research report.
Additional Disclosures of Interest: Unless specifically mentioned in Point No. 9 below: 1. The Research Analyst(s), PCIL, or its associates or relatives of the Research Analyst does not have any financial interest in the company(ies) covered in
this report. 2. The Research Analyst, PCIL or its associates or relatives of the Research Analyst affiliates collectively do not hold more than 1% of the securities of the
company (ies)covered in this report as of the end of the month immediately preceding the distribution of the research report. 3. The Research Analyst, his/her associate, his/her relative, and PCIL, do not have any other material conflict of interest at the time of publication of this
research report. 4. The Research Analyst, PCIL, and its associates have not received compensation for investment banking or merchant banking or brokerage services or for
any other products or services from the company(ies) covered in this report, in the past twelve months. 5. The Research Analyst, PCIL or its associates have not managed or co-managed in the previous twelve months, a private or public offering of securities for
the company (ies) covered in this report. 6. PCIL or its associates have not received compensation or other benefits from the company(ies) covered in this report or from any third party, in
connection with the research report. 7. The Research Analyst has not served as an Officer, Director, or employee of the company (ies) covered in the Research report. 8. The Research Analyst and PCIL has not been engaged in market making activity for the company(ies) covered in the Research report. 9. Details of PCIL, Research Analyst and its associates pertaining to the companies covered in the Research report:
Sr. no. Particulars Yes/No
1 Whether compensation has been received from the company(ies) covered in the Research report in the past 12 months for investment banking transaction by PCIL
No
2 Whether Research Analyst, PCIL or its associates or relatives of the Research Analyst affiliates collectively hold more than 1% of the company(ies) covered in the Research report
No
3 Whether compensation has been received by PCIL or its associates from the company(ies) covered in the Research report No
4 PCIL or its affiliates have managed or co-managed in the previous twelve months a private or public offering of securities for the company(ies) covered in the Research report
No
5 Research Analyst, his associate, PCIL or its associates have received compensation for investment banking or merchant banking or brokerage services or for any other products or services from the company(ies) covered in the Research report, in the last twelve months
No
Independence: PhillipCapital (India) Pvt. Ltd. has not had an investment banking relationship with, and has not received any compensation for investment banking services from, the subject issuers in the past twelve (12) months, and PhillipCapital (India) Pvt. Ltd does not anticipate receiving or intend to seek compensation for investment banking services from the subject issuers in the next three (3) months. PhillipCapital (India) Pvt. Ltd is not a market maker in the securities mentioned in this research report, although it, or its affiliates/employees, may have positions in, purchase or sell, or be materially interested in any of the securities covered in the report.
Suitability and Risks: This research report is for informational purposes only and is not tailored to the specific investment objectives, financial situation or particular requirements of any individual recipient hereof. Certain securities may give rise to substantial risks and may not be suitable for certain investors. Each investor must make its own determination as to the appropriateness of any securities referred to in this research report based upon the legal, tax and accounting considerations applicable to such investor and its own investment objectives or strategy, its financial situation and its investing experience. The value of any security may be positively or adversely affected by changes in foreign exchange or interest rates, as well as by other financial, economic, or political factors. Past performance is not necessarily indicative of future performance or results.
Page | 11 | PHILLIPCAPITAL INDIA RESEARCH
DABUR INDIA LTD COMPANY UPDATE
Sources, Completeness and Accuracy: The material herein is based upon information obtained from sources that PCIPL and the research analyst believe to be reliable, but neither PCIPL nor the research analyst represents or guarantees that the information contained herein is accurate or complete and it should not be relied upon as such. Opinions expressed herein are current opinions as of the date appearing on this material, and are subject to change without notice. Furthermore, PCIPL is under no obligation to update or keep the information current.Without limiting any of the foregoing, in no event shall PCIL, any of its affiliates/employees or any third party involved in, or related to computing or compiling the information have any liability for any damages of any kind including but not limited to any direct or consequential loss or damage, however arising, from the use of this document.
Copyright: The copyright in this research report belongs exclusively to PCIPL. All rights are reserved. Any unauthorised use or disclosure is prohibited. No reprinting or reproduction, in whole or in part, is permitted without the PCIPL’s prior consent, except that a recipient may reprint it for internal circulation only and only if it is reprinted in its entirety.
Caution: Risk of loss in trading/investment can be substantial and even more than the amount / margin given by you. The recipient should carefully consider whether trading/investment is appropriate for the recipient in light of the recipient’s experience, objectives, financial resources and other relevant circumstances. PCIPL and any of its employees, directors, associates, group entities, or affiliates shall not be liable for losses, if any, incurred by the recipient. The recipient is further cautioned that trading/investments in financial markets are subject to market risks and are advised to seek trading/investment advice before investing. There is no guarantee/assurance as to returns or profits or capital protection or appreciation. PCIPL and any of its employees, directors, associates, group entities, affiliates are not inducing the recipient for trading/investing in the financial market(s). Trading/Investment decision is the sole responsibility of the recipient.
For U.S. persons only: This research report is a product of PhillipCapital (India) Pvt Ltd., which is the employer of the research analyst(s) who has prepared the research report. The research analyst(s) preparing the research report is/are resident outside the United States (U.S.) and are not associated persons of any U.S.-regulated broker-dealer and therefore the analyst(s) is/are not subject to supervision by a U.S. broker-dealer, and is/are not required to satisfy the regulatory licensing requirements of FINRA or required to otherwise comply with U.S. rules or regulations regarding, among other things, communications with a subject company, public appearances, and trading securities held by a research analyst account.
This report is intended for distribution by PhillipCapital (India) Pvt Ltd. only to "Major Institutional Investors" as defined by Rule 15a-6(b)(4) of the U.S. Securities and Exchange Act, 1934 (the Exchange Act) and interpretations thereof by the U.S. Securities and Exchange Commission (SEC) in reliance on Rule 15a 6(a)(2). If the recipient of this report is not a Major Institutional Investor as specified above, then it should not act upon this report and return the same to the sender. Further, this report may not be copied, duplicated, and/or transmitted onward to any U.S. person, which is not a Major Institutional Investor.
In reliance on the exemption from registration provided by Rule 15a-6 of the Exchange Act and interpretations thereof by the SEC in order to conduct certain business with Major Institutional Investors, PhillipCapital (India) Pvt Ltd. has entered into an agreement with a U.S. registered broker-dealer, Marco Polo Securities Inc. ("Marco Polo"). Transactions in securities discussed in this research report should be effected through Marco Polo or another U.S. registered broker dealer PhillipCapital (India) Pvt. Ltd. Registered office: No. 1, 18th Floor, Urmi Estate, 95 GanpatraoKadamMarg, Lower Parel West, Mumbai 400013