institute of studies land, shelter, transport: the...
TRANSCRIPT
1
institute of community studies
LAND, SHELTER, LAND, SHELTER, TRANSPORT:TRANSPORT:
THE LATIN AMERICAN WAYTHE LATIN AMERICAN WAY
Peter HallPeter HallWorld Bank/World Bank/IPEAIPEA
Urban Research SymposiumUrban Research SymposiumBrasiliaBrasilia
April 4 2005April 4 2005
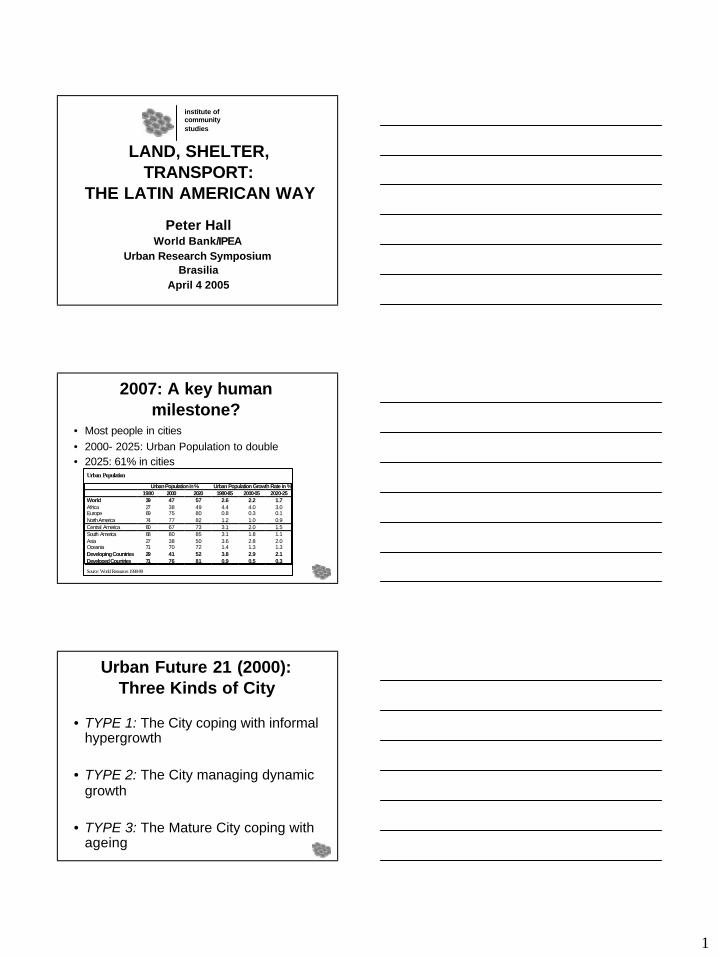
2007: A key human 2007: A key human milestone?milestone?
• Most people in cities• 2000- 2025: Urban Population to double• 2025: 61% in cities
Urban Population
Urban Population in % Urban Population Growth Rate in %1980 2000 2020 1980-85 2000-05 2020-25
World 39 47 57 2.6 2.2 1.7Africa 27 38 49 4.4 4.0 3.0Europe 69 75 80 0.8 0.3 0.1North America 74 77 82 1.2 1.0 0.9Central America 60 67 73 3.1 2.0 1.5South America 68 80 85 3.1 1.8 1.1Asia 27 38 50 3.6 2.8 2.0Oceania 71 70 72 1.4 1.3 1.3Developing Countries 29 41 52 3.8 2.9 2.1Developed Countries 71 76 81 0.9 0.5 0.3
Source: World Resources 1998-99
Urban Future 21 (2000):Urban Future 21 (2000):Three Kinds of CityThree Kinds of City
• TYPE 1: The City coping with informal hypergrowth
• TYPE 2: The City managing dynamic growth
• TYPE 3: The Mature City coping with ageing
2
Type 1: The City coping with Type 1: The City coping with informal hypergrowthinformal hypergrowth
• Sub-Saharan Africa, Indian subcontinent, Middle East, some poorer cities of Latin America and the Caribbean
• Rapid population growth• Economy depends on informal sector• Poverty: widespread• Large informal housing areas• Basic problems: environment, public heath
Governance: difficult
But: Grounds for optimism:But: Grounds for optimism:
• Technology: can transform life and work
• Cities: will democratize• Population growth: will slow• Economic growth: will continue
Build on informal sector; integrate into the mainstream
So: The SolutionSo: The Solution
• Lower birth rates – through education for women (Use IT)
• Formalise the informal economy:• Micro-credit, provide building materials
and food/water, and effective transportation
• Communal self-help neighbourhood projects
• Overcome bottlenecks in infrastructure
3
Type 2: The City managing Type 2: The City managing dynamic growthdynamic growth
• Middle-income rapidly-developing world• Much of East Asia, Latin America and the
Caribbean and the Middle East – also South Africa
• Population growth reducing• Prospect: ageing populations• Rapid economic growth – but new
challenges• Prosperity brings environmental problems
Then and NowThen and Now……
• 1905: London, Paris, Berlin, New York versus• 2005: São Paulo, Mexico City, Caracas, Bogotá• Housing: then formal slums (permanent
construction, subdivided, overcrowded)• Housing: now informal slums: self-built,
unserviced• Transport: then extensive Metro system, just
built• Transport: now rudimentary Metro network,
being extended
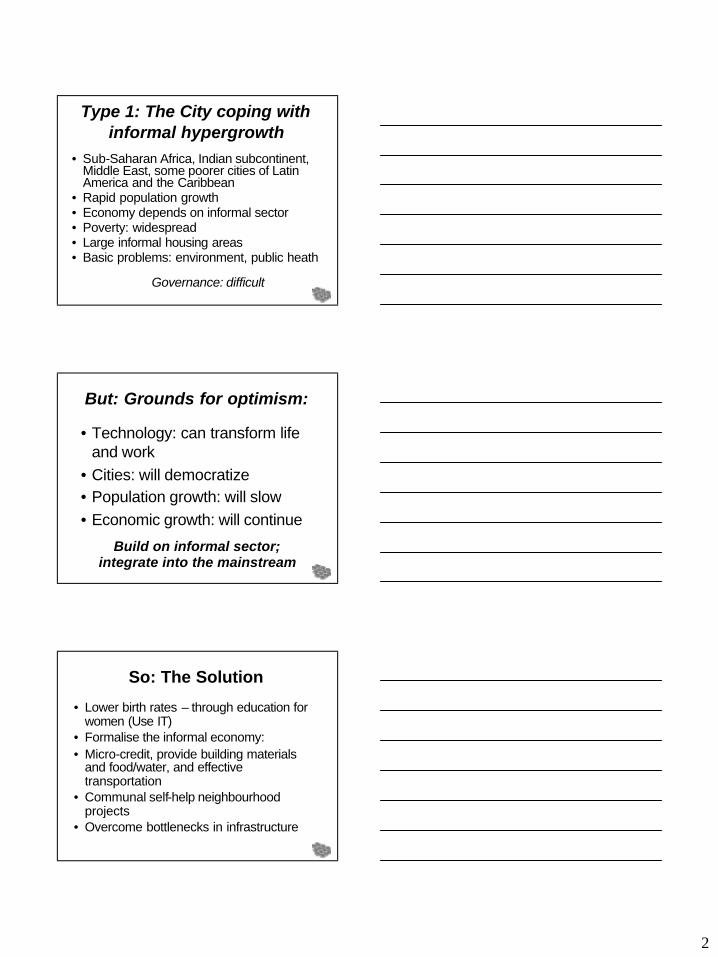
London 1905: East End slumLondon 1905: East End slum
4
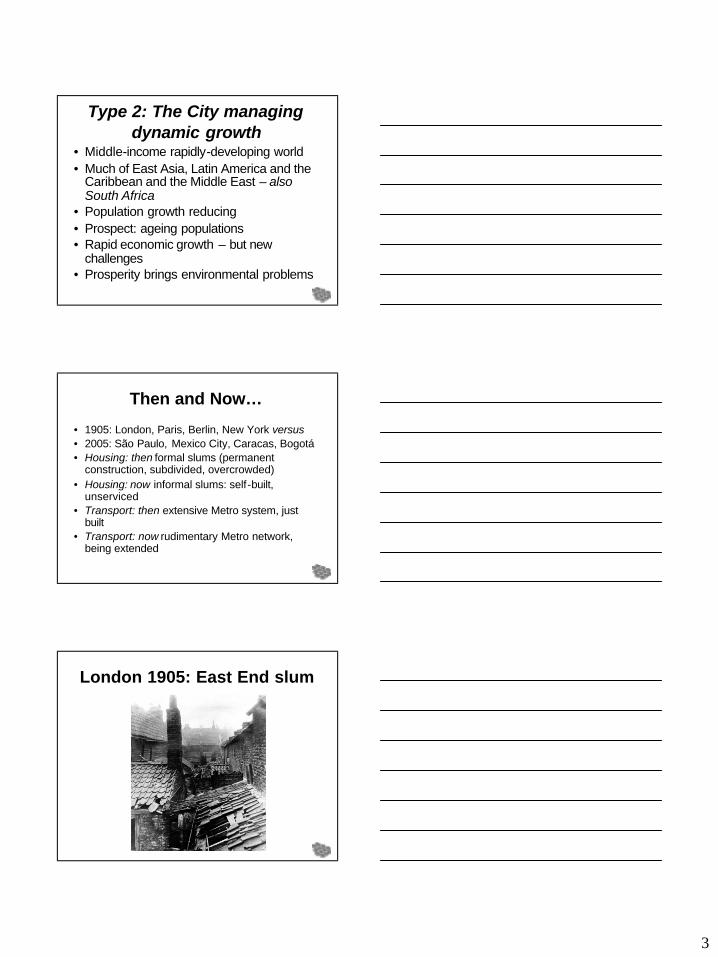
SSão Pauloão Paulo 2005:2005:Heliopolis, ParaisopolisHeliopolis, Paraisopolis
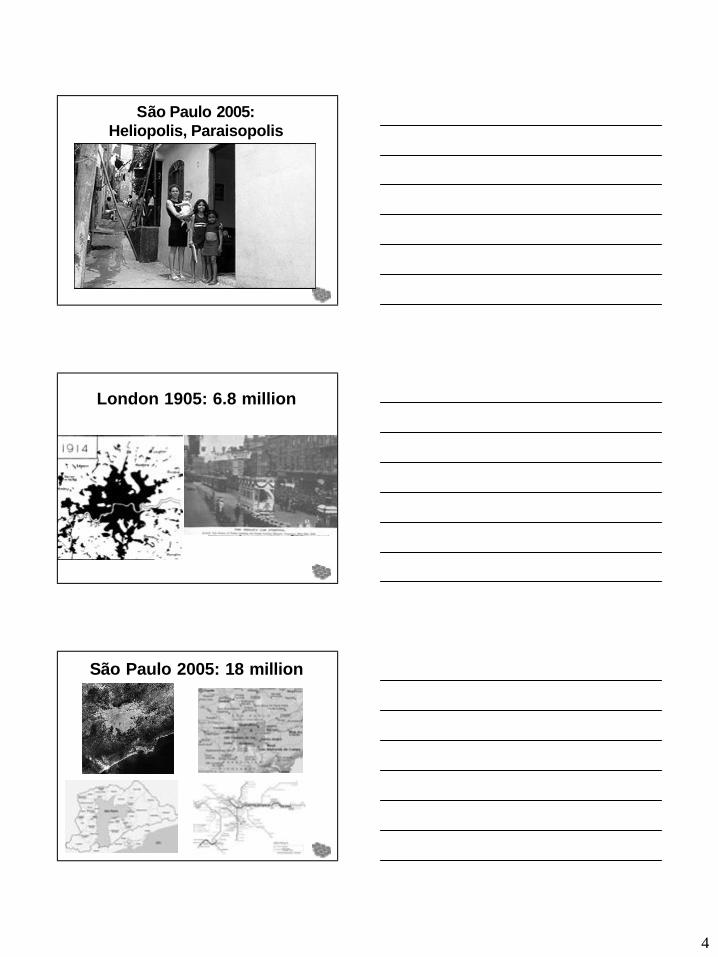
London 1905: 6.8 millionLondon 1905: 6.8 million
SSão Paulo 2005: 18 millionão Paulo 2005: 18 million
5
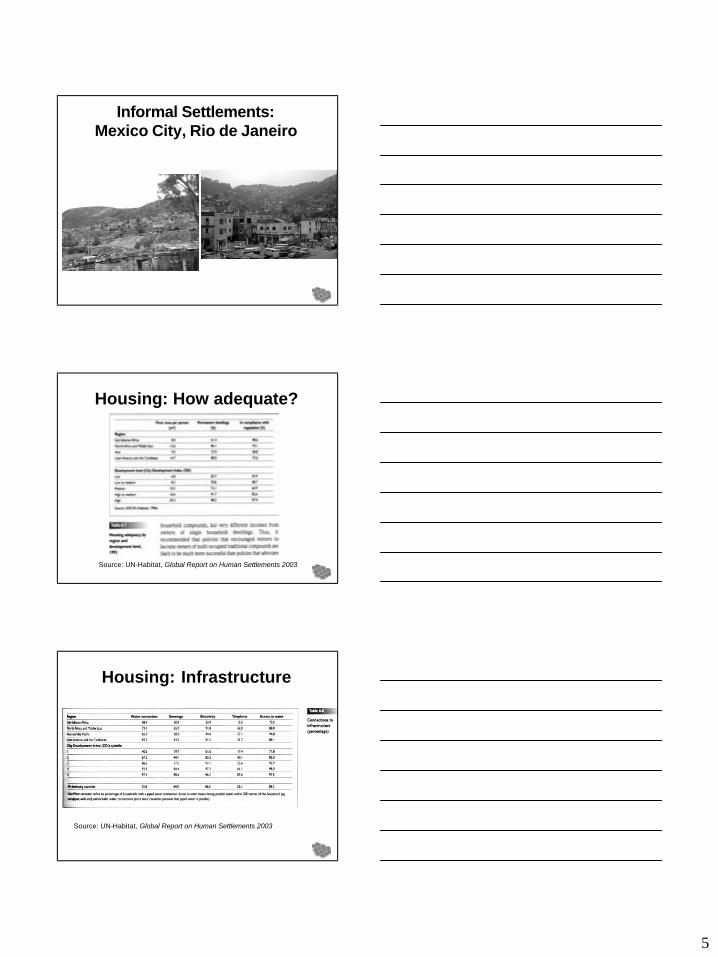
Informal Settlements:Informal Settlements:Mexico City, Rio de JaneiroMexico City, Rio de Janeiro
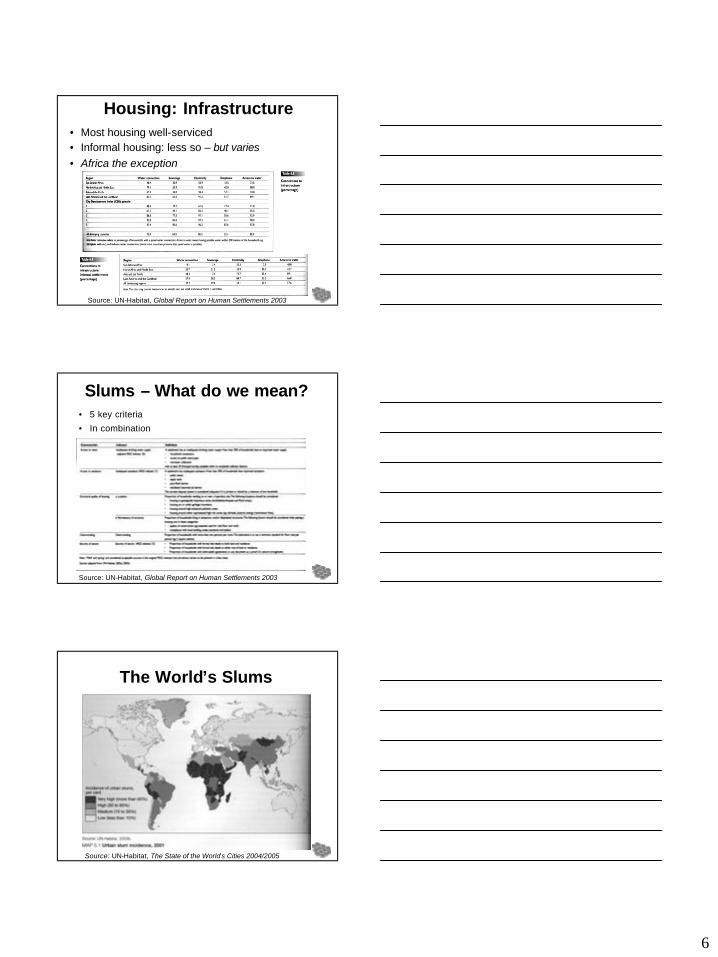
Housing: How adequate?Housing: How adequate?
Source: UN-Habitat, Global Report on Human Settlements 2003
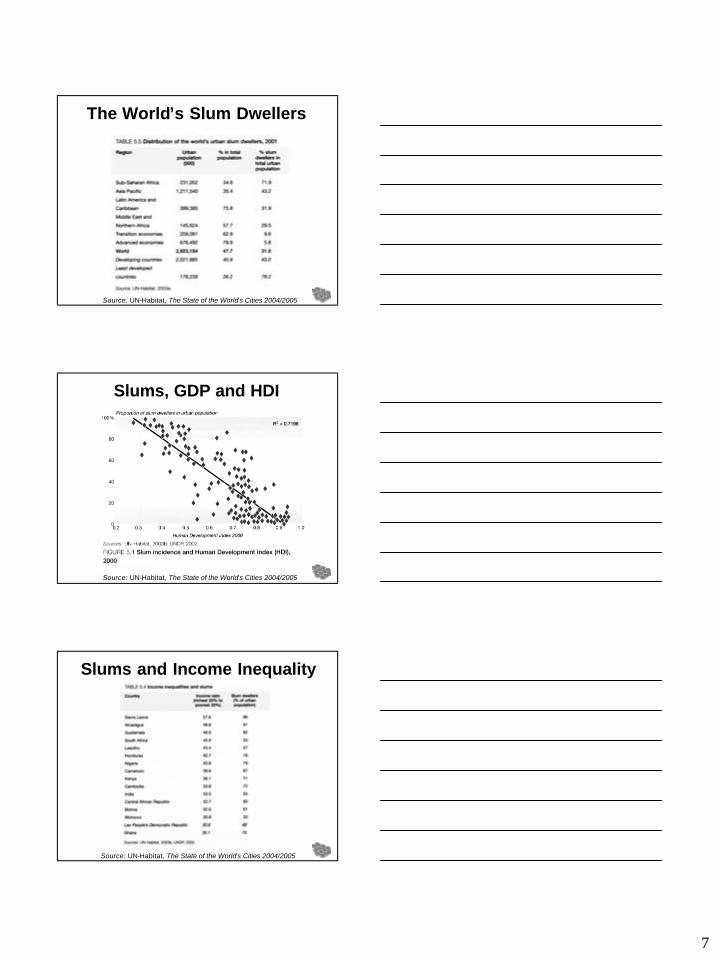
Housing: InfrastructureHousing: Infrastructure
Source: UN-Habitat, Global Report on Human Settlements 2003
6
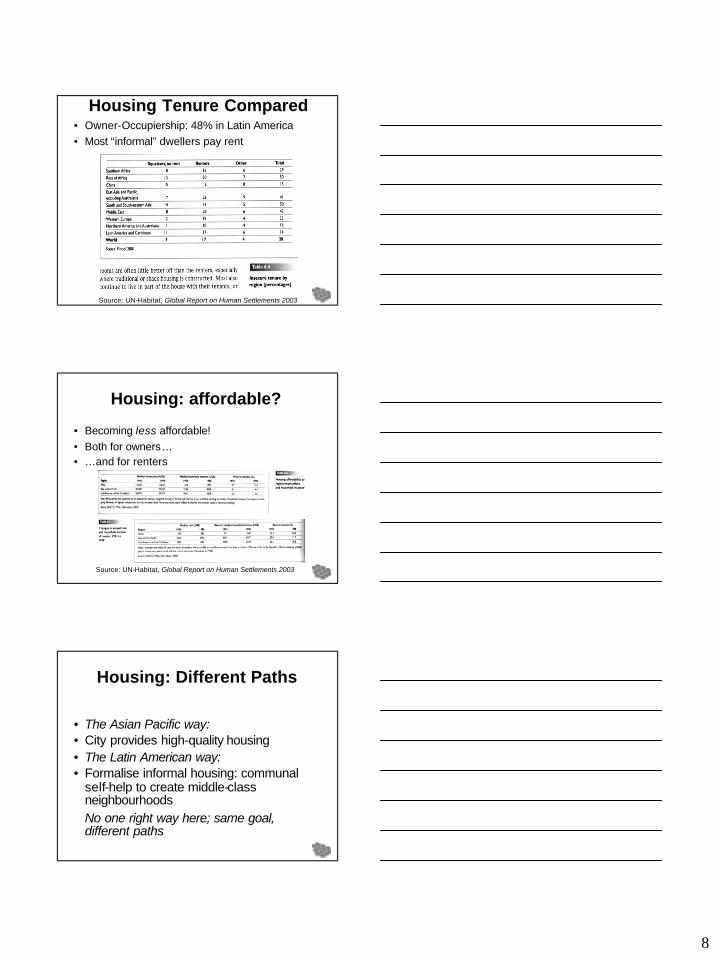
Housing: InfrastructureHousing: Infrastructure• Most housing well-serviced• Informal housing: less so – but varies• Africa the exception
Source: UN-Habitat, Global Report on Human Settlements 2003
Slums Slums –– What do we mean?What do we mean?• 5 key criteria
• In combination
Source: UN-Habitat, Global Report on Human Settlements 2003
The WorldThe World’’s Slumss Slums
Source: UN-Habitat, The State of the World’s Cities 2004/2005
7
The WorldThe World’’s Slum Dwellerss Slum Dwellers
Source: UN-Habitat, The State of the World’s Cities 2004/2005
Slums, GDP and HDISlums, GDP and HDI
Source: UN-Habitat, The State of the World’s Cities 2004/2005
Slums and Income InequalitySlums and Income Inequality
Source: UN-Habitat, The State of the World’s Cities 2004/2005
8
Housing Tenure ComparedHousing Tenure Compared• Owner-Occupiership: 48% in Latin America• Most “informal” dwellers pay rent
Source: UN-Habitat, Global Report on Human Settlements 2003
Housing: affordable?Housing: affordable?
• Becoming less affordable!• Both for owners…• …and for renters
Source: UN-Habitat, Global Report on Human Settlements 2003
Housing: Different PathsHousing: Different Paths
• The Asian Pacific way:• City provides high-quality housing • The Latin American way:• Formalise informal housing: communal
self-help to create middle-class neighbourhoodsNo one right way here; same goal, different paths
9
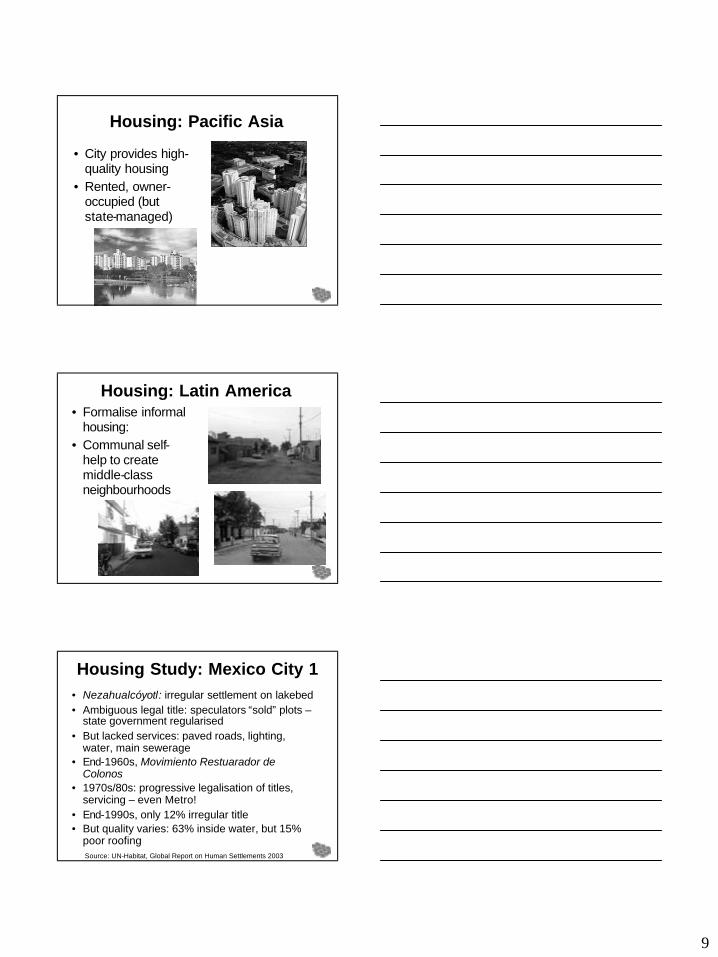
Housing: Pacific AsiaHousing: Pacific Asia
• City provides high-quality housing
• Rented, owner-occupied (but state-managed)
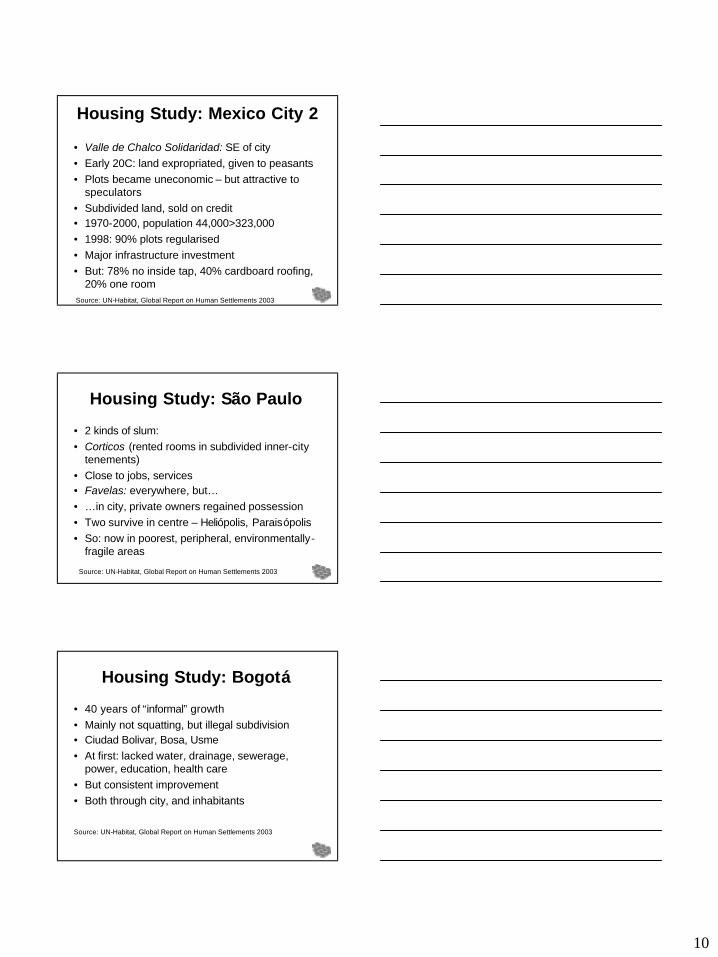
Housing: Latin AmericaHousing: Latin America• Formalise informal
housing:• Communal self-
help to create middle-class neighbourhoods
Housing Study: Mexico City 1Housing Study: Mexico City 1• Nezahualcóyotl: irregular settlement on lakebed• Ambiguous legal title: speculators “sold” plots –
state government regularised• But lacked services: paved roads, lighting,
water, main sewerage• End-1960s, Movimiento Restuarador de
Colonos• 1970s/80s: progressive legalisation of titles,
servicing – even Metro!• End-1990s, only 12% irregular title• But quality varies: 63% inside water, but 15%
poor roofingSource: UN-Habitat, Global Report on Human Settlements 2003
10
Housing Study: Mexico City 2Housing Study: Mexico City 2
• Valle de Chalco Solidaridad: SE of city• Early 20C: land expropriated, given to peasants• Plots became uneconomic – but attractive to
speculators• Subdivided land, sold on credit• 1970-2000, population 44,000>323,000• 1998: 90% plots regularised• Major infrastructure investment• But: 78% no inside tap, 40% cardboard roofing,
20% one roomSource: UN-Habitat, Global Report on Human Settlements 2003
Housing Study: SHousing Study: São Pauloão Paulo
• 2 kinds of slum:• Corticos (rented rooms in subdivided inner-city
tenements)• Close to jobs, services• Favelas: everywhere, but…• …in city, private owners regained possession• Two survive in centre – Heliópolis, Paraisópolis• So: now in poorest, peripheral, environmentally-
fragile areas
Source: UN-Habitat, Global Report on Human Settlements 2003
Housing Study: BogotHousing Study: Bogotáá
• 40 years of “informal” growth• Mainly not squatting, but illegal subdivision• Ciudad Bolivar, Bosa, Usme• At first: lacked water, drainage, sewerage,
power, education, health care• But consistent improvement• Both through city, and inhabitants
Source: UN-Habitat, Global Report on Human Settlements 2003
11
Housing: ConclusionsHousing: Conclusions
• Good news, bad news:• Informal settlements: get regularised• Inhabitants get legal title• Services provided: first basic (water, sewers,
paved streets, lighting)…• …then advanced (schools, libraries, Metro)• But: incomplete: still different standards• And: process ripples ever farther out• So a problem: access to jobs; commuting• Transport quality becomes crucial!
Transport: Same StoryTransport: Same Story
• Pacific Asian cities:• High-density development, top-quality
metros• Latin American cities:• Innovative bus systems• Singapore and Curitiba: two model cities,
look alike: integrated land use and transportation
• Again: Same Goal – Different Paths
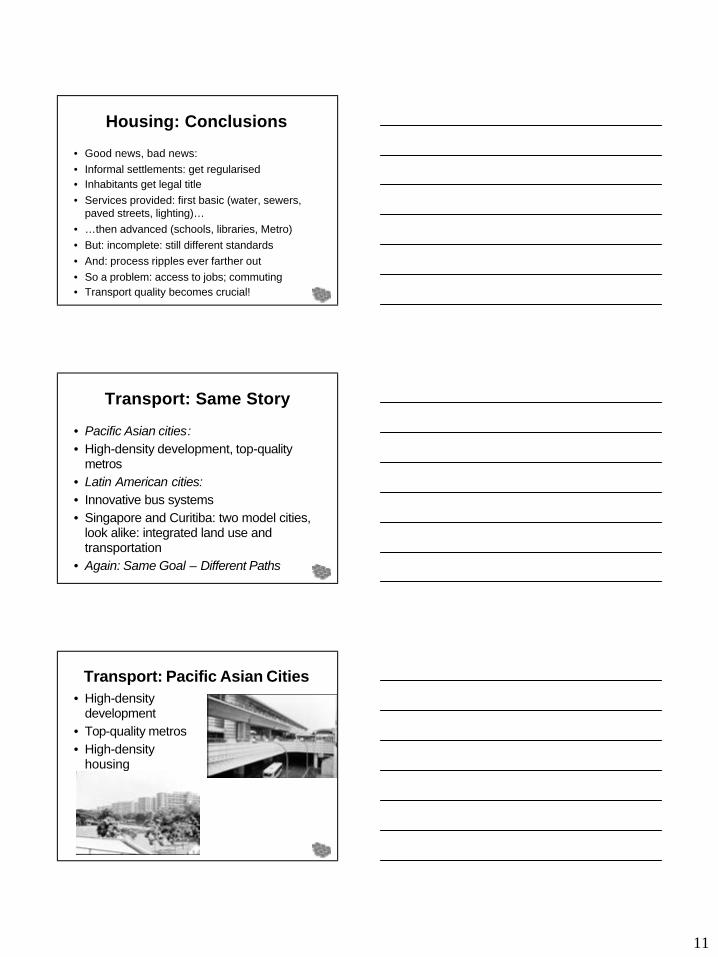
Transport: Pacific Asian CitiesTransport: Pacific Asian Cities• High-density
development• Top-quality metros• High-density
housing
12
The Latin American The Latin American Breakthrough: Busway CitiesBreakthrough: Busway Cities
• Metro systems less developed – especially 30 years ago (recent extensions)
• Money lacking• So, “make a virtue of necessity”• Curitiba: “Bus Metro”• Widely hailed, now imitated• Bogotá, São Paulo, etc• Brazilian engineers: took the lead• The key: integrated bus service/land use
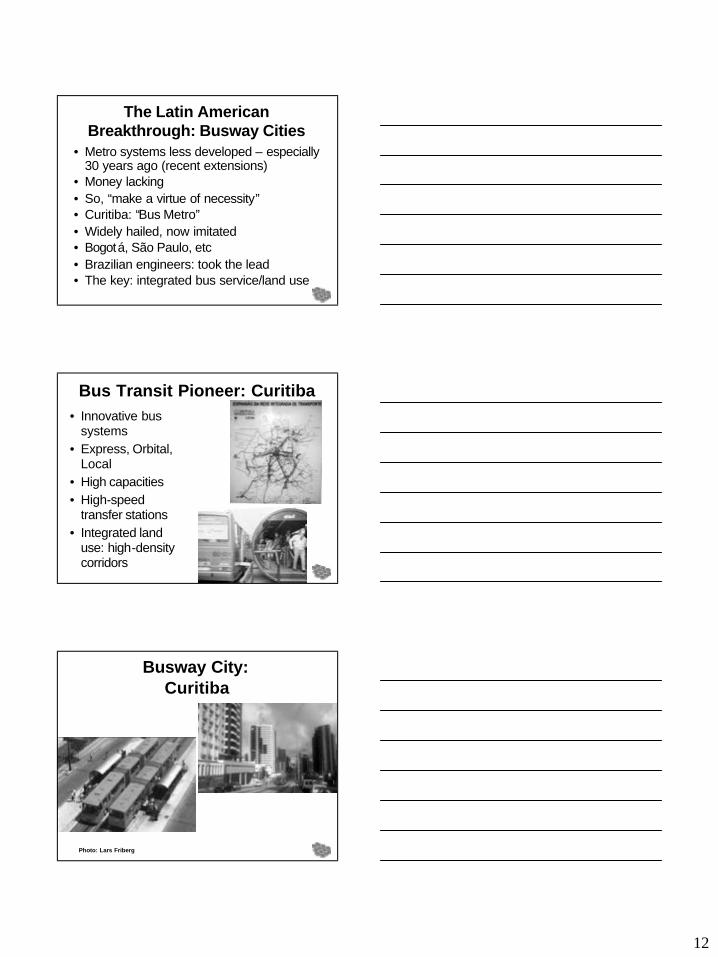
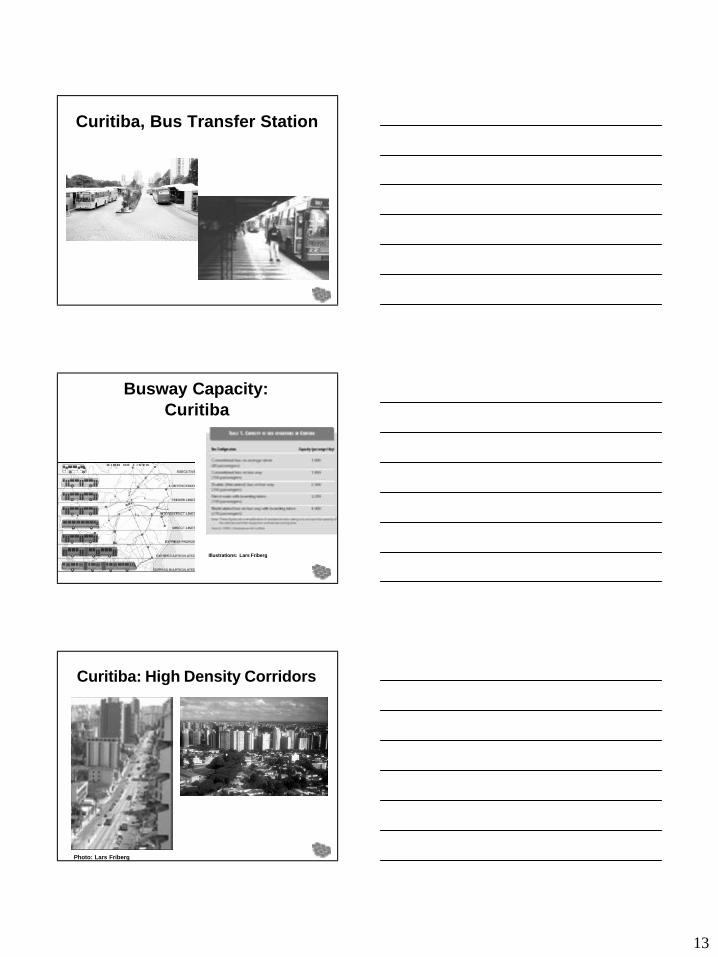
Bus Transit Pioneer: CuritibaBus Transit Pioneer: Curitiba• Innovative bus
systems• Express, Orbital,
Local• High capacities• High-speed
transfer stations• Integrated land
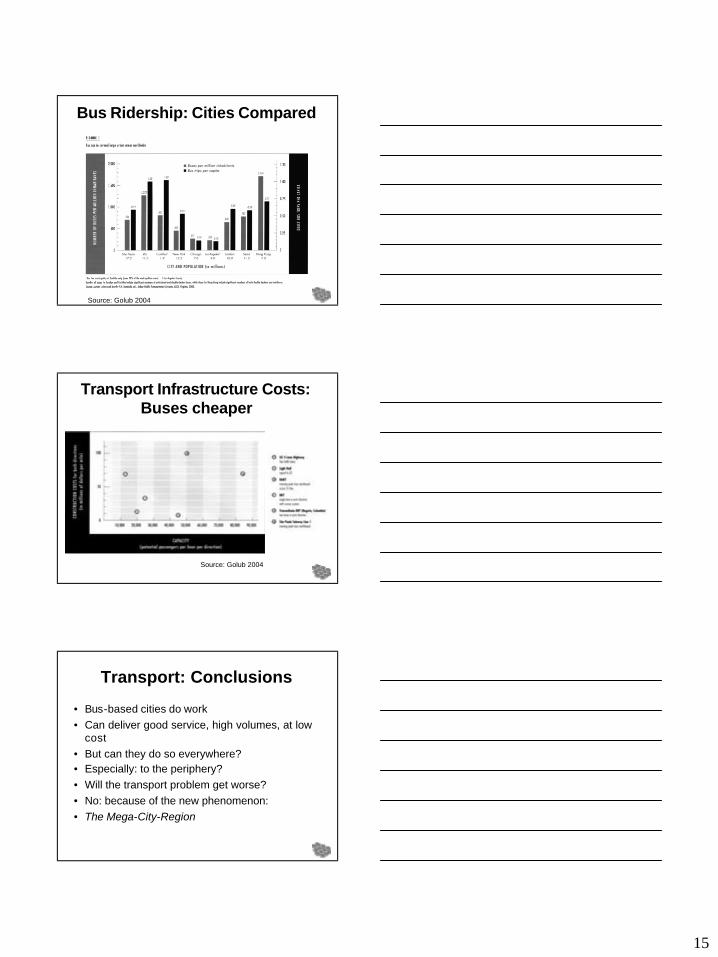
use: high-density corridors
Busway City:Busway City:CuritibaCuritiba
Photo: Lars Friberg
13
Curitiba, Bus Transfer StationCuritiba, Bus Transfer Station
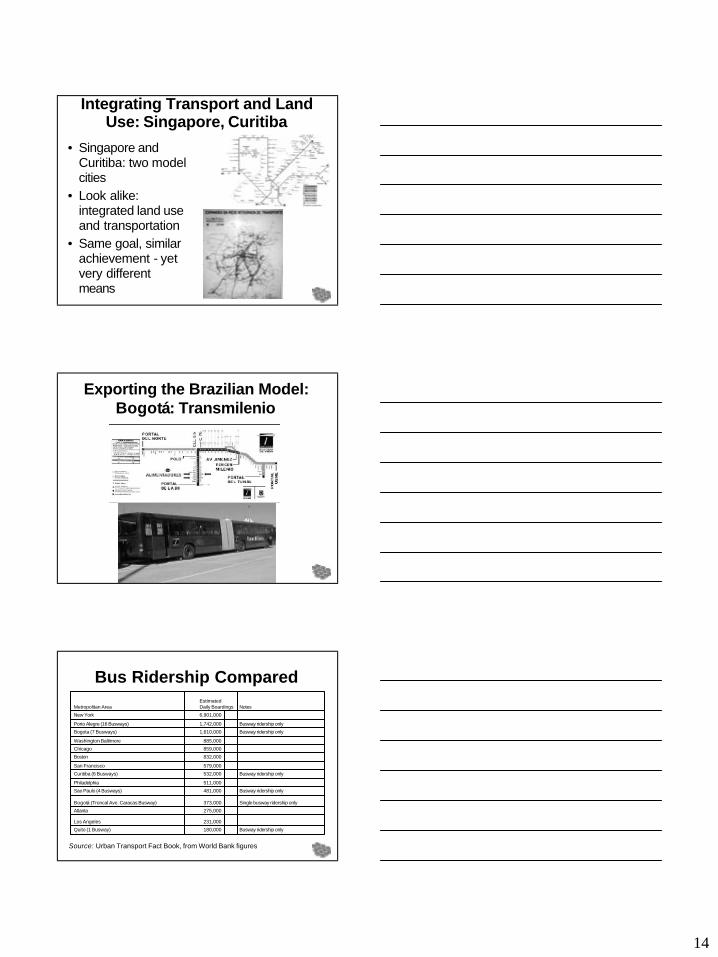
Busway Capacity:Busway Capacity:CuritibaCuritiba
Illustrations: Lars Friberg
Curitiba: High Density CorridorsCuritiba: High Density Corridors
Photo: Lars Friberg
14
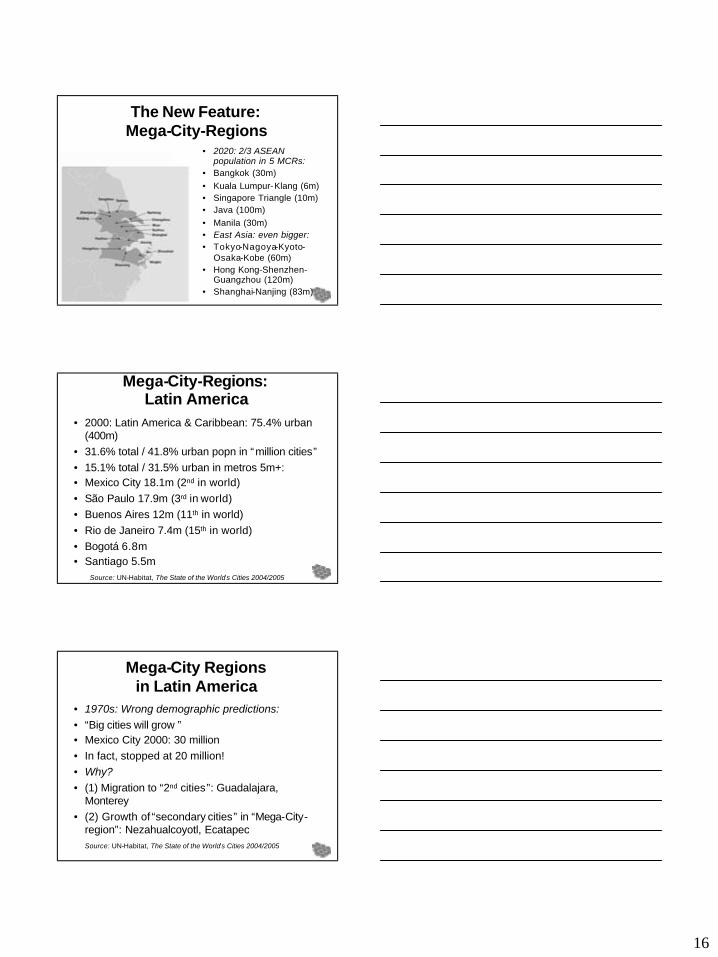
Integrating Transport and Land Integrating Transport and Land Use: Singapore, CuritibaUse: Singapore, Curitiba
• Singapore and Curitiba: two model cities
• Look alike: integrated land use and transportation
• Same goal, similar achievement - yet very different means
Exporting the Brazilian Model: Exporting the Brazilian Model: BogotBogotáá: Transmilenio: Transmilenio
Bus Ridership ComparedBus Ridership Compared
Busway ridership only180,000Quito (1 Busway)
231,000Los Angeles
275,000Atlanta
Single busway ridership only373,000Bogotá (Troncal Ave. Caracas Busway)
Busway ridership only481,000Sao Paulo (4 Busways)
511,000Philadelphia
Busway ridership only532,000Curitiba (6 Busways)
579,000San Francisco
832,000Boston
859,000Chicago
885,000Washington-Baltimore
Busway ridership only1,610,000Bogota (7 Busways)
Busway ridership only1,742,000Porto Alegre (16 Busways)
6,901,000New York
NotesEstimated Daily BoardingsMetropolitan Area
Source: Urban Transport Fact Book, from World Bank figures
15
Bus Ridership: Cities ComparedBus Ridership: Cities Compared
Source: Golub 2004
Transport Infrastructure Costs:Transport Infrastructure Costs:Buses cheaperBuses cheaper
Source: Golub 2004
Transport: ConclusionsTransport: Conclusions
• Bus-based cities do work• Can deliver good service, high volumes, at low
cost• But can they do so everywhere?• Especially: to the periphery?• Will the transport problem get worse?• No: because of the new phenomenon:• The Mega-City-Region
16
The New Feature:The New Feature:MegaMega--CityCity--RegionsRegions
• 2020: 2/3 ASEAN population in 5 MCRs:
• Bangkok (30m)• Kuala Lumpur-Klang (6m)• Singapore Triangle (10m)• Java (100m)• Manila (30m)• East Asia: even bigger:• Tokyo-Nagoya-Kyoto-
Osaka-Kobe (60m)• Hong Kong-Shenzhen-
Guangzhou (120m)• Shanghai-Nanjing (83m)
MegaMega--CityCity--Regions:Regions:Latin AmericaLatin America
• 2000: Latin America & Caribbean: 75.4% urban (400m)
• 31.6% total / 41.8% urban popn in “million cities”• 15.1% total / 31.5% urban in metros 5m+:• Mexico City 18.1m (2nd in world)• São Paulo 17.9m (3rd in world)• Buenos Aires 12m (11th in world)• Rio de Janeiro 7.4m (15th in world)• Bogotá 6.8m• Santiago 5.5m
Source: UN-Habitat, The State of the World’s Cities 2004/2005
MegaMega--City RegionsCity Regionsin Latin Americain Latin America
• 1970s: Wrong demographic predictions:• “Big cities will grow ”• Mexico City 2000: 30 million• In fact, stopped at 20 million!• Why?• (1) Migration to “2nd cities”: Guadalajara,
Monterey• (2) Growth of “secondary cities” in “Mega-City-
region”: Nezahualcoyotl, EcatapecSource: UN-Habitat, The State of the World’s Cities 2004/2005
17
MegaMega--CityCity--RegionsRegionsin Latin Americain Latin America
• Central city growth slows• Peripheral growth speeds up• “…significant shifts from city-centred to regional
forms of urbanization are currently taking place”• Emergence of multi-nodal, urban regional
systems• New sub-centres: independent social and
economic patterns, but functionally linked to big city (functional polycentricity)Source: UN-Habitat, The State of the World’s Cities 2004/2005
MegaMega--City RegionsCity Regionsin Latin Americain Latin America
• Decentralisation/Recentralisation (“Concentrated deconcentration”)
• Mexico City: more than half population outside Distrito Federal
• São Paulo: city 10m, metro 19.8m• Buenos Aires: 12m, but only 3.5m in Capital
Federal• Bogotá: population grew 40%, but travel
distances stayed same!
Source: UN-Habitat, The State of the World’s Cities 2004/2005
Mexico City: Latin American Mexico City: Latin American MegaMega--CityCity--RegionRegion
18
Mexico City: Latin American Mexico City: Latin American MegaMega--CityCity--RegionRegion
Source:Aguilar and Ward 2003
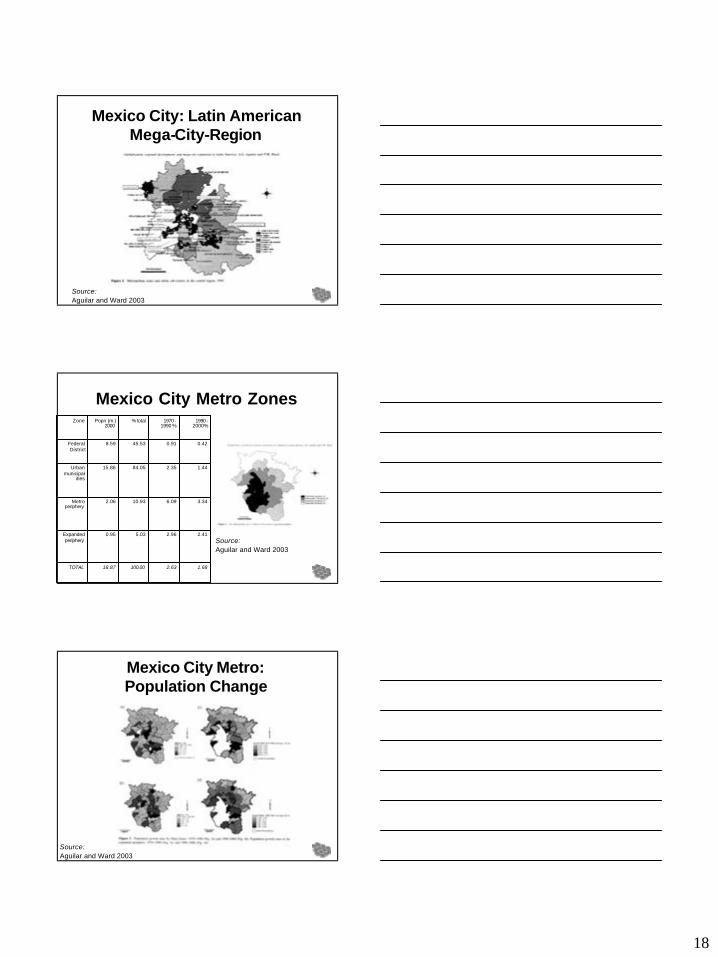
Mexico City Metro ZonesMexico City Metro Zones
1.682.63100.0018.87TOTAL
2.412.965.030.95Expanded periphery
3.346.0910.932.06Metro periphery
1.442.3584.0515.86Urban municipal-
ities
0.420.9145.538.59Federal District
1990 -2000%
1970 -1990 %
% totalPopn (m.) 2000
Zone
Source:Aguilar and Ward 2003
Mexico City Metro:Mexico City Metro:Population ChangePopulation Change
Source:Aguilar and Ward 2003
19
Mexico City Metro: SettlementsMexico City Metro: Settlements
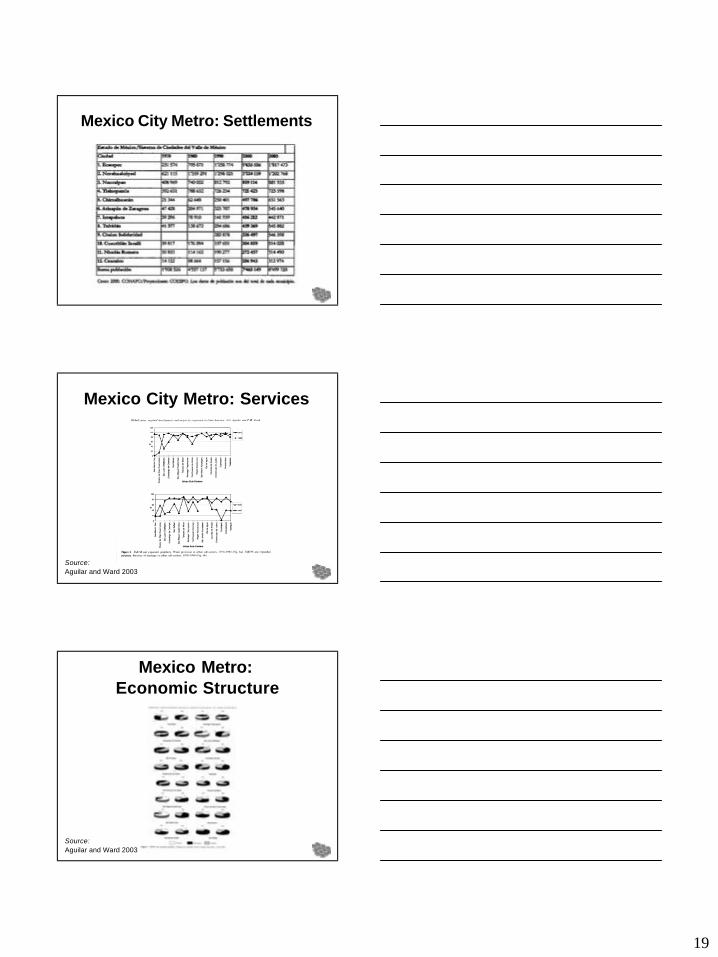
Mexico City Metro: ServicesMexico City Metro: Services
Source:Aguilar and Ward 2003
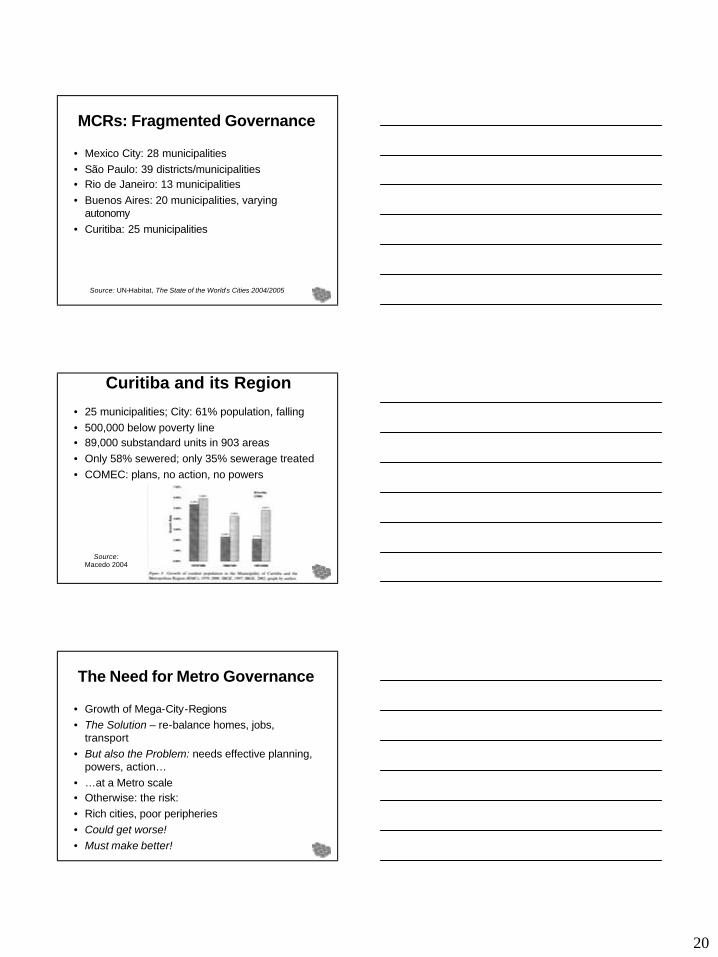
Mexico Metro:Mexico Metro:Economic StructureEconomic Structure
Source:Aguilar and Ward 2003
20
MCRs: Fragmented GovernanceMCRs: Fragmented Governance
• Mexico City: 28 municipalities• São Paulo: 39 districts/municipalities• Rio de Janeiro: 13 municipalities• Buenos Aires: 20 municipalities, varying
autonomy• Curitiba: 25 municipalities
Source: UN-Habitat, The State of the World’s Cities 2004/2005
Curitiba and its RegionCuritiba and its Region
• 25 municipalities; City: 61% population, falling• 500,000 below poverty line• 89,000 substandard units in 903 areas• Only 58% sewered; only 35% sewerage treated• COMEC: plans, no action, no powers
Source:Macedo 2004
The Need for Metro GovernanceThe Need for Metro Governance
• Growth of Mega-City-Regions• The Solution – re-balance homes, jobs,
transport• But also the Problem: needs effective planning,
powers, action…• …at a Metro scale• Otherwise: the risk:• Rich cities, poor peripheries• Could get worse!• Must make better!
21
In Conclusion:In Conclusion:A Research AgendaA Research Agenda
• Macro: Changing Metro structures: Homes, Jobs, Transport
• Increasing polycentricity? Limit commutes?• Micro: Impacts of Upgrading: Who stays? Who
moves? New arrivals?• Second-round effects? Densification?
Gentrification?• Transport: How to extend to periphery?• Governance: Kinds of structures? Co-exist with
existing units? Relate deregulation/privatisation?