institute of agricultural sciences in the tropics...
TRANSCRIPT
Institute of Agricultural Sciences in the Tropics
(Hans-Ruthenberg-Institute)
Field: Agroecology in the Tropics and Subtropics
PD. Dr. Anna C. Treydte
Estimating Grass Productivity under Different Clipping Frequencies and
Rainfall Amount: Implications for Rangeland Responses to Climate Change
A Dissertation
Submitted to the Faculty of Agricultural Sciences in fulfillment of the regulations
to acquire the academic degree “Doctor of Agricultural Sciences - doctor
scientiarum agriculturae” (Dr. sc. agr. /Ph.D. in Agricultural Sciences)
Presented by
Samuel Tuffa Kawo, M.Sc.
Born in Asella, Ethiopia
Stuttgart, 2017
i
This thesis was accepted as a doctoral Dissertation in fulfillment of the regulations to acquire the
doctoral degree “Doktor der Agrarwissenschaften/PhD” by the Faculty of Agricultural Sciences at
University of Hohenheim on 14.07.2017.
Date of the oral examination: July 31, 2017
Examination Committee
Chairperson of the oral examination Prof. Dr. Markus Rodehutscord
Supervisor and Reviewer PD Dr. Anna C. Treydte
Co-Reviewer PD Dr. Anja Linstädter
Additional examiner Prof. Dr. Regina Birner
Author’s Declaration
I, Samuel Tuffa Kawo, hereby declare that I have written this thesis entitled “Estimating Grass
Productivity under Different Clipping Frequencies and Rainfall Amount: Implications for
Rangeland Responses to Climate Change” independently as my original work as part of my
dissertation at the Faculty of Agricultural Sciences at the University of Hohenheim.
All authors in the quoted or mentioned publications in this manuscript have been accredited. No
piece of work by any person has been included without the author being cited, nor have I enlisted
the assistance of commercial promotion agencies. This thesis has not been presented at any other
board for achieving any other academic degree.
Stuttgart, 2017
Samuel Tuffa Kawo

ii
Dedication
I would like to dedicate this piece of work to the memorial of my beloved and unforgettable late
son, Wanufi, who was a joy to my soul during my field work but left us suddenly.
iii
Acknowledgements
Above all, I would like to thank God for providing me the blessings to complete this work.
I would like to express my deepest appreciation and gratitude to my supervisor, PD. Dr. Anna C.
Treydte, for continuous support, teaching, and encouragement. This thesis would not have been
achieved without her expertise guidance. She always found time to read the manuscripts and
returned faster with insightful comments than one could expect. (Thank you especially for your
time, endurance and efforts you have put into my work throughout the study period from afar. You
pushed me past my comfort zone, making me feel like everything is within reach and that was how
I have acquainted with new methods in my study. I cannot thank you enough for your assistance
beyond the academia, especially when I had to pass through the hardest time in my life.) I am also
indebted to Professor Emeritus Joachim Sauerborn, the former head of the Agroecology in Tropics
and Subtropics department, who officially facilitated my application to join his working group and
encouraged me during polishing the research proposal before I left for the field work.
This work could not have been accomplished had I not been supported by local government and
non-government offices as well as individuals who have been guiding and sharing their
experiences and resources. As such, I extend special thanks to Drs. Abule Ebro and Solomon Desta
who recommended me the approach in my experiment during the field work. Further, Drs. Abule
Ebro and Getnet Asefa wrote influential letters of recommendations that certainly helped in my
admission to “Excellence Scholarship” to participate in FSC’s Ph.D. Program, “Global Food
Security”. A special appreciation is expressed for Dr. Ayana Angassa, for his valuable advice,
reassuring and continuous encouragement for Ph.D. study applications. Equal words of thanks go
to Feed and Range research team (Bedasa Eba, Asfaw Ejo, Bikila Negasa and Gebeyehu Elias,
and Zerihun Yohannes) of Yabello Pastoral and Dryland Agriculture Research Centre (YPDARC)
for giving me the seeds of the study species. I am very grateful to all the research staffs that were
always around to give a hand when I was in need, esp. during unloading and setting up of the water
harvesting tanks as well as during transplanting the seedlings to pots and plots as they had to be
transplanted at the same time. Thank you for the very interesting time we had in Yabello,
particularly when my family was away as my wife was on a study leave. I apologize the 3F’s (the
fantastic food fighters) for I could not list your names here; it was great to “watch” the fight
sometimes, and that was why I did not like to make your name list public☺. Especial thanks go to
my field assistant, Abdella Hamid. I would like also to thank Wako Liban, Jarso Gollo (Borana
Zone Water Development and Mines Office), Girma Getachew, Daniel Churqa (Goal Ethiopia-
Boran Office) Desta Negewo, Siraj Kelil, Sisay Taye, Dhaba Wirtu, and Bultu Kusa (YPDARC,
Natural resource research team), Jatani Huqa and Kanu Boru (Yabello District Rural Road
iv
Construction Office) who lent me water harvesting tanks (for storing the 22,000 liters of water for
the experiments) and had waited until I finished my experiments while they themselves had a
pressing need for the water tanks. My especial thanks go to Feyisa Saboka, Mohamed Hamid and
Fiseha Tadesse, who organized the climate date of the study area, without which calculations to
arrive at the watering amount as treatment and the total volume (22,000 liters) of water to be stored
for the experiments would not have been possible. I would not have conducted the experiments
without their understanding and help. I am very much grateful to Drs. Alexandra Jorge, Abdena
Asebe (Forage Gene Bank at International Livestock Research Institute) for providing me the root
split of study species for free.
My heartfelt thanks go to my brother, Rev. Dawit, and my father, Tuffa Kawo (Abisho), for their
love and consistent encouragement throughout my life. Dave, your generosity, kindness, and
spiritual strength have enriched my life in numerous ways. I thank my wife, Addis, who had to go
without me for a long time, for her love, care, and support, and for always being there for me and
for playing a triple role of wife, mother and student; and to Obsinan, our son (born on Nov. 12,
2014), who endured without complaining our busy academic lives☺.
Numerous people have contributed to this dissertation with fruitful discussions, comments and
support along the way. Thanks to all of them, especially to Prof. Dr. Dana Hoag of Colorado State
University who organized a meeting and funded my travel to present my research proposal at the
East Africa Targeted Investment for Research Impact (EATIRI); I am grateful for also partially
funding my field work. Particular thanks to my officemates: Franziska Harich (Franzi) and Reza
Golbon, who were very important friends and ready to help. I would like to express my heartfelt
gratitude to all staff and colleagues in the department of Agroecology in the Tropics and Subtropics
(490f) for all such friendly support and cooperation during my study period, especially Eva
Schmidt, Marc Cotter, Inga Häuser, Professor Konrad Martin, Sabine Baumgartner, Regina Belz
and Despina Savvidou as well as the ex-staff members (Michael Yongha Bo, Baset Garboni,
Lenard Mounde, Hasan Yusuf). Thanks for providing me an intellectually stimulating and lovely
working environment. (Entschuldige, Sabine, dass ich dich nicht in die Kaffeepause begleiten
konnte; I will let you know if I would start drinking coffee – but, thank you very much for your
concern and invitation to take a recess while I was sitting in the office sometimes without respite).
Special thanks go to Dr. Frank Rasche, who helped me a lot by facilitating administrative issues
in the university when his intervention is needed. I am also thankful to the department secretary,
Frau Eva Shmidt, for her assistance in reserving me an accommodation at a lovely German family
(Harald, Martina, Lisa, Kai, and Inga) with whom I lived for three years; I am very grateful for
their extraordinary assistance. I am deeply thankful to all staff of Food Security Centre (FSC),
v
especially ex-staff (Dr. Detlef Virchow, Dr. Brigitte Kranz, Helene Stauss, Dr. Andrea Jost) and
the present staff (Dr. Jenny Kopsch-Xhema, Dr. Nicole Schönleber and Heinrich Hagel) for all
supports and cooperation especially in handling all the administrative matters related to my study
and for offering me stimulatory excursions and soft skill trainings and workshops throughout the
study period. I have made too many close friends at the university to name, but they know who
they are. I owe huge thanks to you all for being good friends. Many thanks go to my Ethiopian
friends at the university, especially Getu Bekele, Ashinie Gonfa, Bekele Megersa, Kebede Amenu,
and all Ethiopians for being good friends during my stay in the university. Jan Pfister was an
amazing extraordinary friend who was always close to Ethiopian students showing/telling how to
mix easily with the German culture. (Many thanks, Jan, for being a good friend☺.)
My Ph.D. program would not have been possible without financial support; the support of the
Food Security Center (FSC), which is supported by the German Academic Exchange Service
(DAAD) with funds of the Germany Federal Ministry for Economic Cooperation and
Development (BMZ), is gratefully acknowledged. I duly thank the Dr. Hermann Eiselen PhD
Research Grant from the Foundation Fiat Panis to undertake my field research. I also thank PD
Dr. Anja Linstädter for accepting to take over the co-reviewing of my PhD dissertation. My
heartfelt thanks go to Prof. Dr. Uta Dickhöfer for taking the role of co-reviewer during the
colloquium. I am also thankful to Professor Dr. Regina Birner for accepting to be the additional
examiner of my thesis defense and Professor Dr. Markus Rodehutscord, representative for Vice
dean and head of the committee. Furthermore, I express my deep appreciation to the Oromia
Agricultural Research Institute (OARI) for permitting me to pursue my Ph.D. study. I am
especially grateful to Dr. Aseffa Taa, Deputy Director General of OARI and my immediate boss,
for his encouragement and unreserved support in various ways during my study period. Especial
thanks go to Mr. Eshetu Teshome, the then director of YPDARC for allowing me to use the
center’s facility, particularly the laboratory as I had to dry the clipped samples immediately after
clipping. Mr. Abiyot Lelisa, head of the laboratory, deserves special thanks for his help in the
sample preparation and analysis and for taking care of my samples while I was away for other
reasons.
I am quite sure that there are lots of people who contributed to my achievement in one way or
another, but whom I failed to list their names. I apologize for missing your names in the
acknowledgments.
Samuel Tuffa Kawo
vi
Summary Resilience and sustainable use of rangelands depend on pre- and post-degradation management. A
sustainable rangeland use can be achieved by maintaining its productivity in the long run.
Herbivory and drought are the two main stressors reducing the primary production of rangelands
and, hence, related ecosystem functions and services as well as livestock production. In semiarid
rangelands, herbivore populations can be kept at its varying carrying capacity through encouraging
animal harvesting when forage production decreases to avoid rangeland degradation. Degraded
areas can also be restored through reseeding with appropriate local species to enhance rangeland
resilience, particularly given the current and projected impacts of climate change to cope with the
rapid disappearance of species and ecosystem services. However, it is unclear how grass species
currently used in the reseeding respond to combined effects of herbivory and drought and how
grazing cattle populations change under the current and the predicted increasing drought
frequency.
The Borana rangeland, Ethiopia, had been highly productive and an important forage resource for
livestock. However, its productivity has been reducing as a result of degradation, mainly caused
by recurrent drought, land use change, livestock overgrazing and bush encroachment. Reseeding
as a management strategy for the restoration of degraded rangelands and their ecosystem services
has been urgently recommended. This is particularly urgent as in the face of human population
increase a high demand for meat as a protein source is expected and mitigation strategies to capture
CO2 from the atmosphere in the face of climate change is needed. Rangeland restoration through
reseeding of palatable grass species can improve both structural and functional vegetation
characteristics, which will also enhance food security. The main rangeland ecosystem services
include, amongst others, provision of animal feeds (biomass and nutrients) and carbon (C) storage
to capture CO2 from the atmosphere. However, the post reseeding rangeland management is still
lacking knowledge on grass biomass allocation, nutrient and C storage under the influence of
herbivory and drought. In addition, the belowground biomass and C storage of grasses have been
rarely studied in grasslands, and in this study, we quantified these two variables under the two
major grass stressors, clipping and irrigation (simulated herbivory and rainfall regime,
respectively). This dissertation aimed at filling this knowledge gap of pre- and post-reseeding
rangeland management in order to inform policy makers for devising an appropriate strategy for a
sustainable use of rangeland resources. Responses of two dominant perennial grass species
(Cenchrus ciliaris and Chloris gayana) frequently used in reseeding to simulated herbivory and
rainfall regimes were assessed in pot and field plot experiments on young grasses. Further, we
addressed how herbivory influences biomass allocation, nutritive values and C storage in mature
tufts of these two native grasses under ambient rainfall conditions.
vii
The responses of biomass and C storage showed contrasting results across grass age as well as
species. Generally, the clipping/grazing strongly triggered the belowground biomass allocation
and enhanced C storage of C. ciliaris tufts while C. gayana tufts differed only slightly. In both
mature grasses, however, clipping highly reduced aboveground biomass and C storage. In contrast,
for the young grass seedlings, moderate and light clipping triggered regrowth and, hence, biomass
and C storage in both above- and belowground parts. Meanwhile, reduced irrigation showed the
same effect on biomass allocation and C storage in both study grasses. Lower irrigation highly
reduced biomass and C in both above- and belowground parts.
The results presented in this dissertation highlight that the effects of herbivory and rainfall
variability, as well as grass maturity, should be incorporated into the management of rangelands.
Our experiments established the first interactive effect of herbivory and rainfall on the biomass
allocation and C storage of mature and young grasses in the semiarid Borana rangelands, Ethiopia.
Knowledge of these interacting factors is deemed essential for policy makers to develop a sound
rangeland management policy that can enhance the C storage potential of degraded rangelands
under climate change and, hence, the mitigation and adaptation strategies through improved post
restoration of degraded areas.
We also modeled cattle population dynamics under a varying carrying capacity and stochastic
environmental conditions, which has never been done before in the semi-arid Borana rangeland
ecosystem. Modeling cattle population dynamics is essential for capturing changes in population
responses to climate change in a variable social and ecological environment at a large temporal
scale. We developed and evaluated a novel Boran cattle population trajectory model under
different drought frequency events, using differences in vital rates among age- and sex-classes as
well as a varying carrying capacity. Stochasticity was built into the model by allowing droughts to
occur randomly within model runs in Berkeley Madonna software, with different long-term
average drought frequencies characterizing the individual four model scenarios. The model result
indicated that reduction in rainfall, i.e., increasing drought frequency - as predicted for Borana -
leads to a high loss in cattle populations. The overall population size was highly sensitive to the
sale of juvenile as well as mature female cattle when drought hit the system. The stochastic
population modeling under varying carrying capacity in the face of increasing drought scenarios
indicated the livelihood challenges ahead for the pastoral community. Cattle populations must be
limited timely and grass productivity must be enhanced in a sustainable way in the face of climate
change. Therefore, this dissertation aimed at rangeland pre- and post-degradation management
suggestions by modeling cattle populations and through grass experiments, respectively.
Management should focus on lowering cattle herd crashes through increasing sale of mature males
that increases feed availability to females during drought years in the Borana Rangelands as well

viii
as enhancing the resilience capacity of rangelands through maintaining healthy conditions and
restoring degraded areas. Further, drought early-warning systems and market information must be
strengthened so that pre-planned selling can be realized for the fair and sustainable use of the
animal resource. Pastoralists would benefit from this approach as they could sell their animals
before drought wipes out their cattle in huge numbers.
ix
German Summary /Zusammenfassung/
Die Widerstandsfähigkeit und Nachhaltigkeit von Weideland hängt von dem Management vor und
nach Degradierungen ab. Eine nachhaltige Nutzung von Weideland impliziert den langfristigen
Erhalt der Produktivität. Beweidung und Dürren sind zwei der Haupt-Stressfaktoren, welche die
Primärproduktion von Weideland reduzieren und damit sowohl zugehörige Ökosystemfunktionen
und –dienstleistungen als auch die Tierproduktion beeinträchtigen. Semiaride Weideländer mit
variierender Tragfähigkeit können zur Weidetierhaltung genutzt werden, indem die Herdengröße
bei nachlassender Futterproduktion verringert wird. Eine Schädigung des Weidelandes kann so
vermieden werden. Bereits degradierte Flächen können durch das Wiederaussäen geeigneter
lokaler Arten wiederhergestellt werden um die Widerstandsfähigkeit des Weidelandes zu
verbessern. Angesichts der Folgen des derzeitigen und vorhergesagten Klimawandels ist dies von
besonderer Bedeutung um dem rasanten Verschwinden von Arten und Ökosystemdienstleistungen
entgegen zu wirken. Dennoch ist unklar wie die derzeit zur Aussaat verwendeten Grasarten auf
die kombinierten Effekte von Beweidung und Dürre reagieren und wie sich grasende Rinderherden
unter der derzeitigen Dürre und den vorhergesagten zunehmenden Trockenheitsperioden
verändern werden.
Das Borana Weideland in Äthiopien war einst eine hoch produktive und bedeutende Futterquelle
für Weidevieh. In Folge wiederkehrender Dürren, Landnutzungswandel, Überweidung und
Verbuschung hat diese Produktivität jedoch stetig abgenommen. Das Wiederaussäen geeigneter
lokaler Arten wurde als Managementmaßnahme dringend empfohlen, um das degradierte
Weideland und dessen Ökosystemdienstleistungen wieder aufzuwerten. Dies ist von besonderer
Wichtigkeit, da angesichts des Bevölkerungswachstums eine zunehmende Nachfrage nach Fleisch
als Proteinquelle erwartet wird und im Hinblick auf den Klimawandel schadensmindernde
Maßnahmen ergriffen werden müssen um CO2 aus der Atmosphäre zu filtern.
Weidelandrestaurierung durch Aussähen von schmackhaften Grasarten kann sowohl die
strukturellen als auch die funktionalen Vegetationseigenschaften verbessern, was zudem zu einer
Förderung der Ernährungssicherheit beiträgt. Zu den wichtigsten Ökosystemdienstleistungen von
Weideland gehören unter anderem die Bereitstellung von Tierfutter (Biomasse und Nährstoffe)
und die Kohlenstoffspeicherung (C) um CO2 aus der Atmosphäre zu filtern. Allerdings mangelt es
an Wissen über die Verteilung der Biomasse in den Gräsern, sowie deren Nährstoff- und
Kohlenstoffspeicherung unter dem Einfluss von Beweidung und Dürre nach der Aussaat. Hinzu
kommt, dass die unterirdische Biomasse- und Kohlenstoffspeicherung von Gräsern bisher kaum
untersucht wurde. In dieser Studie quantifizierten wir diese zwei Variablen unter den zwei Haupt-
Stressfaktoren für Gräser, Schnitt und Bewässerung (entsprechend eines simulierten Beweidungs-
x
und Niederschlagsregimes). Ziel dieser Dissertation war es, die Wissenslücken im Vor- und
Nachbehandlungsmanagement von Aussaaten auf Weideflächen zu schließen und
Entscheidungsträger darüber zu informieren wie angemessene Strategien für eine nachhaltige
Nutzung von Weideland entwickelt werden können. Die Reaktionen auf simulierte Beweidungs-
und Niederschlagsintensitäten von zwei dominanten mehrjährigen Grasarten (Cenchrus ciliaris
und Chloris gayana), welche oftmals bei den Aussaaten verwendet werden, wurden an jungen
Gräsern in Topf- und Feldversuchen untersucht. Zudem analysierten wir, wie sich die Beweidung
unter natürlichen Niederschlagsbedingungen auf die Verteilung von Biomasse, Nährwerten und
Kohlenstoffspeicherungen in ausgewachsenen Grasbüscheln dieser zwei einheimischen Grasarten
auswirkt. Die Ergebnisse zeigten gegensätzliche Reaktionen der Biomasse- und
Kohlenstoffspeicherung, abhängig von Alterskategorie und Grasart. Generell löste der Schnitt
bzw. die Beweidung eine starke Umverteilung auf die unterirdische Biomasse aus und förderte die
Kohlenstoffspeicherung von C. ciliaris Büscheln, während C. gayana Büschel nur geringfügige
Abweichungen zeigte. Bei beiden ausgewachsenen Gräsern reduzierte der Schnitt jedoch die
überirdische Biomasse und Kohlenstoffspeicherung stark. Im Gegensatz dazu förderte ein
moderater und leichter Schnitt bei jungen Gräsern erneutes Wachstum und damit auch die
Biomasse- und Kohlenstoffspeicherung sowohl in über- als auch unterirdischen Pflanzenteilen.
Derweil zeigte eine reduzierte Bewässerung den gleichen Effekt auf die Biomasseverteilung und
Kohlenstoffspeicherung in beiden untersuchten Grasarten. Geringere Bewässerung reduzierte die
Biomasse und den Kohlenstoff in unter- und oberirdischen Pflanzenteilen stark.
Die in dieser Dissertation präsentierten Ergebnisse unterstreichen, dass sowohl die Effekte von
Beweidung und variablem Niederschlag als auch das Grasalter im Management von Weideflächen
berücksichtigt werden sollte. Unsere Experimente sind der erste Nachweis der interaktiven Effekte
von Beweidung und Niederschlag auf die Verteilung von Biomasse und auf die
Kohlenstoffspeicherung in alten und jungen Gräsern der semiariden Borana Weideflächen in
Äthiopien. Das Wissen um diese interagierenden Faktoren gilt als essentiell für
Entscheidungsträger, um ausgewogene Managementstrategien für Weideländer zu entwickeln. So
kann das Potenzial zur Kohlenstoffspeicherung in degradierten Weideflächen in Zeiten des
Klimawandels verbessert und damit auch schadensmindernde Maßnahmen und
Anpassungsstrategien durch verbessertes Nachbehandlungsmanagement von degradierten Flächen
unterstützt werden.
Weiterhin modellierten wir die Dynamik von Rinderpopulationen unter variierenden
Tragfähigkeits-Kapazitäten und unter stochastischen Umweltbedingungen. Das Modellieren von
Dynamiken der Rinderpopulationen wurde noch nie zuvor für das semiaride Borana Weideland
xi
durchgeführt, ist jedoch essenziell um Änderungen von Populationsreaktionen auf den
Klimawandel in einer variablen sozialen und ökologischen Umwelt über ein größeres Zeitfenster
hinweg registrieren zu können. Wir entwickelten und evaluierten ein neuartiges Boran
Rinderpopulationen-Kurvenmodell unter verschiedenen Dürrefrequenz-Vorkommnissen, für
welches wir sowohl unterschiedliche Geburten- und Sterberaten innerhalb der Alters- und
Geschlechtsklassen als auch variierende Tragfähigkeits-Kapazitäten verwendeten. Die Stochastik
wurde berücksichtigt, indem Dürreereignisse zufällig in das Modell eingebunden wurden.
Verwendet wurde dafür die Berkeley Madonna Software. Dabei charakterisierten verschiedene
langfristige durchschnittliche Dürrefrequenzen die vier individuellen Modellszenarien. Das
Ergebnis des Modells deutet darauf hin, dass eine Reduzierung des Niederschlags, zum Beispiel
bei zunehmender Dürrefrequenz wie für Borana vorhergesagt, zu einem großen Verlust innerhalb
der Rinderpopulationen führt. Die gesamte Populationsgröße reagierte hochsensibel auf den
Verkauf sowohl von Jungtieren als auch von erwachsenen weiblichen Rindern, wenn ein
Dürreereignis im System stattfand. Das stochastische Populationsmodell mit verschiedenen
Tragfähigkeits-Kapazitäten weist angesichts zunehmender Dürreszenarien auf die zukünftigen
Herausforderungen für die Lebensgrundlage der auf die Weidewirtschaft angewiesenen
Gemeinschaften hin. Rinderherden müssen rechtzeitig verkleinert werden und die
Grasproduktivität angesichts des Klimawandels auf nachhaltige Weise gefördert werden. Aus
diesem Grund konzentrierte sich diese Dissertation auf Vorschläge zum Vor- und
Nachbehandlungsmanagement von degradierten Weideflächen durch Modellierung von
Rinderpopulationen und der Durchführung von Grasexperimenten.
Das Management sollte sich darauf konzentrieren, dem Kollaps von Rinderherden vorzubeugen,
indem der Verkauf von ausgewachsenen Stieren gesteigert wird. Dadurch werden Futterressourcen
für die weiblichen Tiere während Dürrejahren in den Borana Weideländern frei. Gleichzeitig muss
die Widerstandsfähigkeit der Weideflächen verbessert werden, indem gesunde Bedingungen
beibehalten und degradierte Gebiete restauriert werden. Weiterhin müssen Frühwarnsysteme für
Dürren und Marktinformationen gefördert werden, damit im Voraus geplante Verkäufe der
Tierressourcen auf faire und nachhaltige Weise realisiert werden können. Dieser Ansatz würde
zudem den Viehhaltern Vorteile durch den Verkauf der Tiere bringen, da ein großer Verlust von
Rindern in Folge von Dürren vermieden werden könnte.

xii
Table of Contents
AUTHOR’S DECLARATION ............................................................................................................................. I
DEDICATION ..................................................................................................................................................... II
ACKNOWLEDGEMENTS ................................................................................................................................ III
SUMMARY ........................................................................................................................................................ VI
GERMAN SUMMARY /ZUSAMMENFASSUNG/ ........................................................................................... IX
LIST OF ACRONYMS AND ABBREVIATIONS ........................................................................................... XIX
CHAPTER 1: GENERAL INTRODUCTION .................................................................................................... 1
1.1: AN OVERVIEW OF RANGELANDS ................................................................................................................................. 1 1.2: PRESENT CHALLENGES TO AFRICAN RANGELANDS .......................................................................................................... 2
1.2.1: Rangeland management options ............................................................................................................... 3 1.2.2: Study plant species ..................................................................................................................................... 5 1.2.3: Cattle population size in the face of climate change .................................................................................. 6
1.3: THE RESEARCH GAP AND SPECIFIC OBJECTIVES ............................................................................................................... 7 1.4: OUTLINE OF THE THESIS ............................................................................................................................................ 9
CHAPTER 2: CLIPPING AND IRRIGATION ENHANCE GRASS BIOMASS AND NUTRIENTS:
IMPLICATIONS FOR RANGELAND MANAGEMENT* ..............................................................................11
2.1: INTRODUCTION ..................................................................................................................................................... 12 2.2: MATERIALS AND METHODS ..................................................................................................................................... 14
2.2.1: Study area ................................................................................................................................................ 14 2.2.2: Experimental layout ................................................................................................................................. 14 2.2.3: Data collection .......................................................................................................................................... 16 2.2.4: Data analysis ............................................................................................................................................ 16
2.3: RESULTS .............................................................................................................................................................. 16 2.3.1: Aboveground biomass in mature tufts under clipping ............................................................................. 16 2.3.2: Aboveground biomass in newly established grasses under clipping ........................................................ 17 2.3.3: Biomass allocation in grasses under irrigation ......................................................................................... 18 2.3.4: The interactive effects of clipping and irrigation on biomass................................................................... 18 2.3.5: Nutritive values of mature tufts under clipping........................................................................................ 19
2.4: DISCUSSION ......................................................................................................................................................... 20 2.4.1: Aboveground biomass in mature tufts under clipping ............................................................................. 20 2.4.2: Aboveground biomass in newly established grasses under clipping ........................................................ 21 2.4.3: Biomass allocation in grasses under irrigation ......................................................................................... 21 2.4.4: Interactive effects of clipping and irrigation on biomass ......................................................................... 21 2.4.5: Nutritive values of mature tufts under clipping........................................................................................ 22
2.5: CONCLUSION ....................................................................................................................................................... 23
CHAPTER 3: EFFECTS OF CLIPPING AND IRRIGATION ON CARBON STORAGE IN GRASSES:
IMPLICATIONS FOR CO2 EMISSION MITIGATION IN THE RANGELANDS*.......................................25
3.1: INTRODUCTION ..................................................................................................................................................... 26 3.2: MATERIALS AND METHODS ..................................................................................................................................... 28
3.2.1: Study site .................................................................................................................................................. 28 3.2.2: The mature tufts clipping experimental design ........................................................................................ 28 3.2.3: The combined clipping and irrigation design ........................................................................................... 29 3.2.4: Above- and belowground biomass collections ......................................................................................... 30 3.2.5: Statistical Analysis .................................................................................................................................... 31
3.3: RESULTS .............................................................................................................................................................. 31 3.3.1: Responses of carbon to clipping frequency in mature grass tufts ............................................................ 31 3.3.2: Clipping and grass carbon storage in newly established grasses ............................................................. 32 3.3.3: Combined effects of clipping and irrigation ............................................................................................. 32 3.3.4: Responses of carbon to changes in irrigation amount ............................................................................. 33
xiii
3.4: DISCUSSION ......................................................................................................................................................... 34 3.4.1: Clipping and carbon storage in mature grass tufts .................................................................................. 34 3.4.2: Clipping and carbon storage in newly established grasses ...................................................................... 34 3.4.3: Responses of carbon to changes in irrigation amount ............................................................................. 35 3.4.4: Combined effects of clipping and irrigation ............................................................................................. 35
CHAPTER 4: MODELING BORAN CATTLE POPULATIONS UNDER CLIMATE CHANGE AND
VARYING CARRYING CAPACITY* ..............................................................................................................37
4.1: INTRODUCTION ..................................................................................................................................................... 38 4.1.1: The Boran cattle and their habitat ........................................................................................................... 38 4.1.2: Boran cattle adaptation to their environment and their current threat .................................................. 40 4.1.3: Carrying capacity of the Borana rangelands ............................................................................................ 40 4.1.4: The Boran cattle market ........................................................................................................................... 41 4.1.5: The importance of population growth models ......................................................................................... 42
4.2: METHODOLOGY .................................................................................................................................................... 43 4.2.1: Study area ................................................................................................................................................ 43 4.2.2: Climatic conditions ................................................................................................................................... 43 4.2.3: Population dynamics ................................................................................................................................ 44 4.2.4: Vital rates ................................................................................................................................................. 46 4.2.5: Drought as environmental disturbance .................................................................................................... 46 4.2.6: Model description ..................................................................................................................................... 48 4.2.7: Model calibration and validation ............................................................................................................. 52 4.2.8: Sensitivity analyses ................................................................................................................................... 54
4.3: RESULTS .............................................................................................................................................................. 55 4.3.1: Boran cattle population trajectories ........................................................................................................ 55 4.3.2: Sensitivity analysis .................................................................................................................................... 56
4.4: DISCUSSION ......................................................................................................................................................... 58 4.4.1: Boran cattle population trajectories ........................................................................................................ 58 4.4.2: Sensitivity analysis .................................................................................................................................... 59
4.5: CONCLUSIONS ...................................................................................................................................................... 61
CHAPTER 5: GENERAL DISCUSSION ..........................................................................................................63
5.1: GRASS BIOMASS ALLOCATION UNDER GRAZING AND DROUGHT PRESSURE ......................................................................... 63 5.2: NUTRIENT CONTENTS OF RANGELAND GRASSES UNDER GRAZING EFFECTS ......................................................................... 64 5.3: GRASS CARBON STORAGE UNDER HERBIVORY AND CLIMATE CHANGE ............................................................................... 65 5.4: BORAN CATTLE POPULATION DYNAMICS UNDER LIMITED RANGELAND RESOURCES .............................................................. 66 5.5: OVERALL RANGELAND ECOSYSTEM RESILIENCE ............................................................................................................ 67 5.6: STUDY LIMITATIONS AND CONCLUSION ...................................................................................................................... 68
REFERENCES ...................................................................................................................................................71
APPENDICES ....................................................................................................................................................94
APPENDIX A: CATTLE POPULATION TRAJECTORIES ............................................................................................................... 94 APPENDIX B: SENSITIVITY ANALYSES ................................................................................................................................ 97

xiv
List of tables
TABLE 1. PARAMETERS USED TO MODEL THE POPULATION DYNAMICS UNDER DROUGHT SCENARIOS. ......................... 44 TABLE 2. EQUATIONS USED IN CATTLE POPULATION MODELING AS REFERRED TO IN THE TEXT. .................................. 49
xv
List of figures
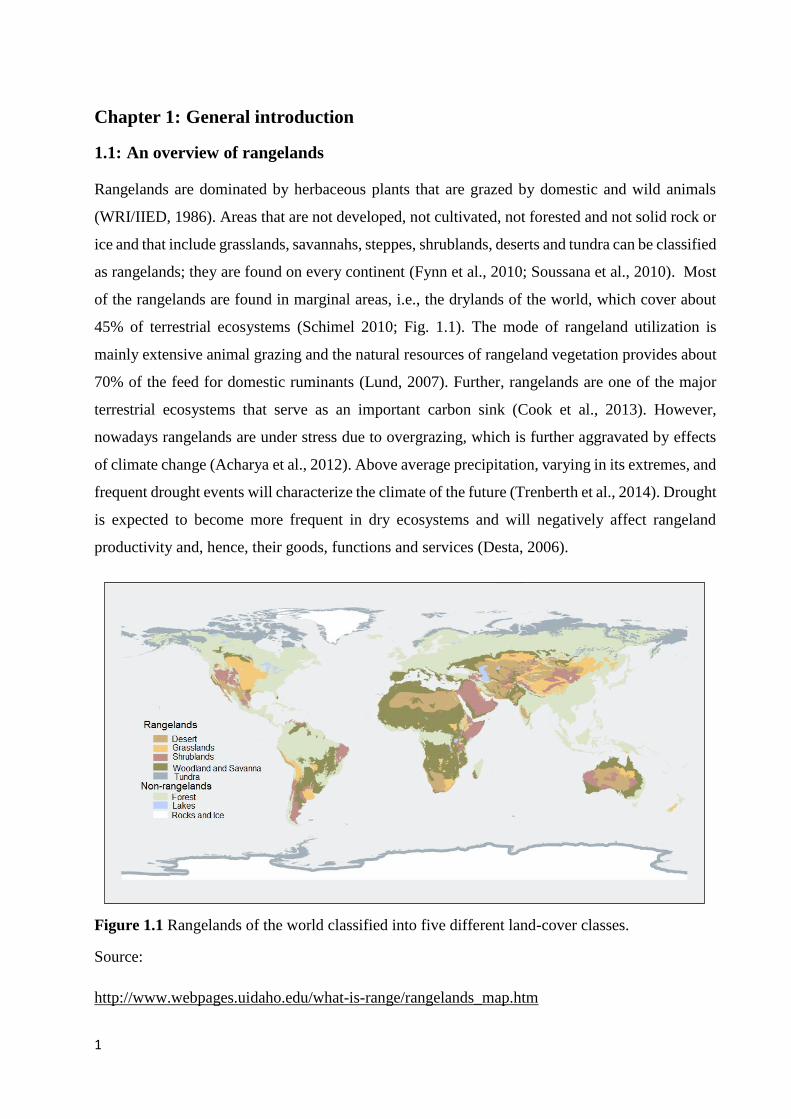
FIGURE 1.1 RANGELANDS OF THE WORLD CLASSIFIED INTO FIVE DIFFERENT LAND-COVER CLASSES. ............................ 1 FIGURE 1.2 SCHEMATIC REPRESENTATION OF CHARACTERISTICS OF THE PASTORAL ENVIRONMENT. ............................ 2 FIGURE 1.3 SCHEMATIC REPRESENTATION OF INTERACTIONS AMONG A RANGELAND’S BIOTIC AND ABIOTIC
COMPONENTS, THE PRINCIPLE WE USED IN CATTLE POPULATION MODELING. THE PLUS AND/OR MINUS SIGNS
STAND FOR POSITIVE AND NEGATIVE FEEDBACKS, RESPECTIVELY......................................................................... 4 FIGURE 1.4 GLOBAL DISTRIBUTION AND NATIVE HABITAT (MARGINAL AND SUITABLE) OF C. CILIARIS (A-C) AND C.
GAYANA (D-F) GRASS SPECIES ACROSS THE VARYING CONTINENTS IN 2005. ......................................................... 5 FIGURE 1.5 SCHEMATIC REPRESENTATION OF DIFFERENT AIMS AND METHODOLOGIES USED ALL TOGETHER IN THE
STUDY. ................................................................................................................................................................ 10 FIGURE 2.1 MEAN (± SE) OF ABOVEGROUND (WHITE BARS) AND BELOWGROUND (GRAY BARS) BIOMASS (AGB AND
BGB, RESPECTIVELY) ACROSS CLIPPING FREQUENCIES (FREQUENT = WEEKLY CLIPPED, MODERATE = BIWEEKLY
CLIPPED, NONE = UNCLIPPED/CONTROL, GRAZING = WEEKLY CLIPPED) OF (A) MATURE C. CILIARIS AND (B)
MATURE C. GAYANA TUFTS. DIFFERENT LETTERS DENOUNCE SIGNIFICANT DIFFERENCE ACROSS CLIPPING
FREQUENCIES. ..................................................................................................................................................... 17 FIGURE 2.2 MEAN (± SE) ABOVEGROUND (WHITE BARS) AND BELOWGROUND (GRAY BARS) BIOMASS (AGB AND BGB,
RESPECTIVELY) ACROSS CLIPPING FREQUENCIES (FREQUENT = WEEKLY CLIPPED, MODERATE = BIWEEKLY
CLIPPED, LIGHT = MONTHLY CLIPPED, NONE = UNCLIPPED/CONTROL) OF C. CILIARIS IN (A) THE POT EXPERIMENT
AND (B) THE FIELD PLOT EXPERIMENT. MEANS IN WHITE BARS FOLLOWED BY DIFFERENT UPPER CASE LETTERS
ARE SIGNIFICANTLY DIFFERENT. MEANS IN GRAY BARS FOLLOWED BY DIFFERENT LOWER CASE LETTERS ARE
SIGNIFICANTLY DIFFERENT ACROSS TREATMENTS. .............................................................................................. 17 FIGURE 2.3 MEAN (± SE) ABOVEGROUND (WHITE BARS) AND BELOWGROUND (GRAY BARS) BIOMASS (AGB AND BGB,
RESPECTIVELY) ACROSS IRRIGATION AMOUNTS (HIGHER = 5% ABOVE AVERAGE AMBIENT RAINFALL, MEAN =
AMBIENT AVERAGE ANNUAL RAINFALL, LOWER = 70% OF AVERAGE AMBIENT RAINFALL) OF (A) C. CILIARIS AND
(B) MEAN (± SE) AGB OF C. GAYANA IN THE POT EXPERIMENT. IN THE LATTER FIGURE, WE OMITTED THE BGB TO
AVOID THE AMBIGUITY OF PRESENTING THE SAME DATA TWICE SINCE WE PRESENT IT IN FIG. 2.4A AS AN
INTERACTIVE FACTOR. DIFFERENT LETTERS DENOUNCE SIGNIFICANT DIFFERENCE ACROSS TREATMENTS. ......... 18 FIGURE 2.4 (A) INTERACTIVE EFFECT OF CLIPPING (FREQUENT = WEEKLY CLIPPED, MODERATE = BIWEEKLY CLIPPED,
LIGHT = MONTHLY CLIPPED, NONE = UNCLIPPED/CONTROL) AND IRRIGATION (HIGHER = 5% ABOVE AVERAGE
AMBIENT RAINFALL, MEAN = AMBIENT AVERAGE ANNUAL RAINFALL, LOWER = 70% OF AVERAGE AMBIENT
RAINFALL) ON BELOWGROUND BIOMASS (BGB) OF C. GAYANA IN THE POT EXPERIMENT. BAR GRAPHS WITH
WHISKERS REPRESENT MEAN (± SE) BGB ACROSS CLIPPING FREQUENCIES AND IRRIGATION AMOUNTS. (B) MEAN
(± SE) ABOVEGROUND (WHITE BARS) AND BELOWGROUND (GRAY BARS) BIOMASS (AGB AND BGB,
RESPECTIVELY) OF C. GAYANA ACROSS CLIPPING FREQUENCIES IN THE FIELD PLOT EXPERIMENT. MEANS OF BARS
FOLLOWED BY DIFFERENT LETTERS ARE SIGNIFICANTLY DIFFERENT ................................................................... 19 FIGURE 2.5 PERCENTAGE (± SE) NUTRITIVE VALUES (NDF, ASH, CP, ADL, TIVOMD AND ADF; (A) – (F),
RESPECTIVELY) IN DRY MATTER OF C. GAYANA (WHITE BARS) AND C. CILIARIS (GRAY BARS) ACROSS CLIPPING
FREQUENCIES (FREQUENT = WEEKLY CLIPPED, MODERATE = BIWEEKLY CLIPPED, NONE = UNCLIPPED/CONTROL).
MEANS FOLLOWED BY DIFFERENT LETTERS ARE SIGNIFICANTLY DIFFERENT ACROSS TREATMENTS. CP = CRUDE
PROTEIN, ASH = ASH VALUE, NDF = NEUTRAL DETERGENT FIBER, ADL = ACID DETERGENT LIGNIN, TIVOMD =
TRUE IN-VITRO ORGANIC MATTER DIGESTIBILITY AND ADF = ACID DETERGENT FIBER ...................................... 20 FIGURE 3.1 (A) MEAN (± SE) OF ABOVE- (WHITE BARS) AND BELOWGROUND (GRAY BARS) C OF C. CILIARIS ACROSS
CLIPPING (FREQUENT = WEEKLY CLIPPED, MODERATE = BIWEEKLY CLIPPED, NONE = UNCLIPPED/CONTROL,
GRAZING = WEEKLY GRAZED). (B) MEAN (± SE) OF ABOVE- AND BELOWGROUND C OF C. GAYANA TUFTS
ACROSS CLIPPING FREQUENCIES (FREQUENT, MODERATE AND CONTROL). DIFFERENT LETTERS DENOUNCE
SIGNIFICANT DIFFERENCE ACROSS CLIPPING FREQUENCIES BY LSD TEST. .......................................................... 31 FIGURE 3.2 (A) MEAN (± SE) ABOVE- (WHITE BARS) AND BELOWGROUND (GRAY BARS) C OF C. CILIARIS ACROSS
CLIPPING FREQUENCIES (FREQUENT = WEEKLY CLIPPED, MODERATE = BIWEEKLY CLIPPED, LIGHT = MONTHLY
CLIPPED, NONE = UNCLIPPED/CONTROL) IN THE FIELD PLOTS EXPERIMENT. (B) MEAN (± SE) ABOVE- AND
BELOWGROUND C OF C. CILIARIS ACROSS CLIPPING FREQUENCIES (FREQUENT, MODERATE, LIGHT, AND
CONTROL) IN THE POT EXPERIMENT..................................................................................................................... 32 FIGURE 3.3 (A) INTERACTIVE EFFECT OF IRRIGATION (HIGHER = 5% ABOVE AVERAGE AMBIENT RAINFALL, MEAN =
AMBIENT AVERAGE ANNUAL RAINFALL, LOWER = 70% OF AVERAGE AMBIENT RAINFALL) AND CLIPPING
(FREQUENT = WEEKLY CLIPPED, MODERATE = BIWEEKLY CLIPPED, LIGHT = MONTHLY CLIPPED, NONE =
UNCLIPPED/CONTROL) ON BELOWGROUND C STORAGE OF CHLORIS GAYANA IN THE POT EXPERIMENT. BAR
GRAPHS WITH WHISKERS REPRESENT MEAN (± SE) OF BELOWGROUND C ACROSS CLIPPING FREQUENCIES AND
xvi
IRRIGATION AMOUNTS IN THE POT EXPERIMENT. MEANS IN THE SAME IRRIGATION AMOUNT FOLLOWED BY THE
SAME LOWERCASE LETTERS AND MEANS IN THE SAME CLIPPING FREQUENCY FOLLOWED BY THE SAME
UPPERCASE LETTERS ARE NOT SIGNIFICANTLY DIFFERENT BY TUKEY’S HSD TEST; (B) MEAN (± SE) ABOVE-
(WHITE BARS) AND BELOWGROUND (GRAY BARS) C OF C. GAYANA ACROSS CLIPPING FREQUENCIES (FREQUENT,
MODERATE, LIGHT, AND CONTROL) IN THE FIELD PLOT EXPERIMENT. ................................................................. 33 FIGURE 3.4 (A) MEAN (± SE) ABOVE- (WHITE BARS) AND BELOWGROUND (GRAY BARS) C OF C. CILIARIS ACROSS
IRRIGATION (HIGHER = 5% ABOVE AVERAGE AMBIENT RAINFALL, MEAN = AMBIENT AVERAGE ANNUAL
RAINFALL, LOWER = 70% OF AVERAGE AMBIENT RAINFALL), IN THE POT EXPERIMENT. (B) MEAN (± SE)
ABOVEGROUND C OF C. GAYANA AS AFFECTED BY IRRIGATION (HIGHER, AMBIENT, LOWER) IN THE POT
EXPERIMENT; WE OMITTED THE BELOWGROUND PART BECAUSE WE ALREADY PRESENTED IT IN THE INTERACTIVE
GRAPH, FIG. 3.3A. DIFFERENT LETTERS DENOUNCE SIGNIFICANT DIFFERENCE ACROSS TREATMENTS BY LSD
TEST. ................................................................................................................................................................... 33 FIGURE 4.1 CORE HABITAT (GREEN COLOR) OF THE BORAN CATTLE IN EAST AFRICA IN 2008. (FOR INTERPRETATION
OF THE REFERENCES TO COLOUR IN THIS FIGURE LEGEND, THE READER IS REFERRED TO THE WEB VERSION OF
THIS ARTICLE.) .................................................................................................................................................... 39 FIGURE 4.2 MEAN (± SE) MONTHLY PRECIPITATION (BAR GRAPH) AND TEMPERATURE (LINE GRAPH) FROM 1984 TO
2013 IN YABELLO DISTRICT, BORANA (YABELLO RESEARCH CENTRE WEATHER STATION AND NATIONAL
METEOROLOGICAL AGENCY). ............................................................................................................................. 43 FIGURE 4.3 ANNUAL RAINFALL (GRAY BARS) AND OBSERVED CATTLE POPULATION (BLACK LINE) IN THE BORANA
ZONE, SOUTHERN ETHIOPIA. ................................................................................................................................ 44 FIGURE 4.4 SCHEMATIC ILLUSTRATION OF BORAN CATTLE (B. INDICUS) POPULATION DYNAMICS IN THE BORANA
RANGELANDS. THIS HERD-GROWTH MODEL ILLUSTRATES HOW THE DROUGHT AND ANIMAL OFFTAKE, TOGETHER
WITH THE NUMBERS OF ANIMALS IN EACH SEX- AND AGE-COHORTS IN THE FOLLOWING YEAR IS DETERMINED BY
THE NUMBERS OF ANIMALS IN EACH COHORT IN THE CURRENT YEAR AND THEIR RATES OF PRODUCTION AND
SURVIVAL UNDER INFLUENCE OF RANDOM OCCURRENCE OF DROUGHT (D). WE OMITTED FROM THIS FLOW
CHART THE SLAUGHTERING RATE TO MINIMIZE THE NUMBER OF CONNECTIONS IN THE MODEL FOR
SIMPLIFICATION. THE FOLLOWING AGE- AND SEX-COHORTS ARE DISTINGUISHED: FC = FEMALE CALVES, FJ =
FEMALE JUVENILE, FA = ADULT FEMALE, FS = SENESCENT FEMALE, MC = MALE CALVES, MJ = MALE JUVENILE,
MA = ADULT MALE, AND MS = SENESCENT MALE, AS WELL AS THE INFANTS (INF); EACH PROCESS OF GROWTH
FROM ONE AGE-COHORT TO THE NEXT CORRESPONDS TO GROWTH OF FEMALE INFANTS, GROWTH OF FEMALE
CALVES, GROWTH OF FEMALE JUVENILE, FEMALE ADULT GROWING OLD; GROWTH OF MALE INFANTS, GROWTH
OF MALE CALVES, GROWTH OF MALE JUVENILE, AND MALE ADULT GROWING OLD; R = SEX RATIO; DEATH =
DEATH OF RESPECTIVE AGE-COHORT; SALE = SALE OF RESPECTIVE AGE-COHORT. ............................................. 46 FIGURE 4.5 THE YEAR INTERVALS BETWEEN RECURRENT DROUGHT EVENTS. FILLED CIRCLES INDICATE THE NUMBER
OF NON-DROUGHT YEARS BETWEEN CONSECUTIVE DROUGHT YEARS BASED ON 1965-2012 RAINFALL DATA. .... 48 FIGURE 4.6 SIMULATED AND OBSERVED NUMBERS OF CATTLE UNDER FOUR DIFFERENT SCENARIOS (1, 2, 3, AND 4)
OVER THE FIRST 12 YEARS OF MODEL SIMULATION. THE SOLID LINE REPRESENTS THE OPTIMAL FIT THROUGH
CALIBRATION OF THE SIMULATED POPULATION TRAJECTORY BASED ON 100 RUNS. THE DASHED LINE
REPRESENTS THE REAL POPULATION (OBSERVED). SCENARIO 1 = DROUGHT FREQUENCY HAPPENING RANDOMLY
ONCE EVERY 20 YEARS; SCENARIO 2 = DROUGHT FREQUENCY HAPPENING RANDOMLY ONCE EVERY 15 YEARS;
SCENARIO 3 = DROUGHT FREQUENCY HAPPENING RANDOMLY ONCE EVERY 10 YEARS; SCENARIO 4 = DROUGHT
FREQUENCY HAPPENING RANDOMLY ONCE EVERY 5 YEARS. ............................................................................... 53 FIGURE 4.7 MEAN INTERNAL VALIDITY VALUES AS INDICATOR OF MODEL REPEATABILITY. MEANS 1 AND 2 WERE
OBTAINED BY THE MONTE CARLO METHOD AFTER RUNNING THE MODEL 100 TIMES UNDER EACH SCENARIO. ... 54 FIGURE 4.8 MEAN CATTLE POPULATION TRAJECTORIES, WHICH WERE GENERATED THROUGH 100 TIMES MODEL RUNS
UNDER FOUR SCENARIOS (SCENARIO 1 = ONCE EVERY 20 YEARS, SCENARIO 2 = ONCE EVERY 15 YEARS,
SCENARIO 3 = ONCE EVERY 10 YEARS, AND SCENARIO 4 = ONCE EVERY 5 YEARS) WITH AN INITIAL POPULATION
SIZE OF 1.11 MIO THAT WERE SUBJECTED TO RANDOM DISTURBANCE. THE BLACK AND GRAY LINES REPRESENT
THE MEANS AND 95% CONFIDENCE INTERVALS, RESPECTIVELY, OF THE POPULATION SIZES AFTER 100 MODEL
RUNS. OVERALL POPULATION DECLINES WITH INCREASING DROUGHT FREQUENCY. ........................................... 55 FIGURE 4.9 RELATIVE SENSITIVITY OF POPULATION SIZES TO FEMALE SALE RATES: SFJ = SALE RATE OF JUVENILE
FEMALES, SFA = SALE RATE OF ADULT FEMALES, AND SFS = SALE RATE OF SENESCENT FEMALES. THE MODEL
REACTED TO THESE FEMALE SALE-RELATED PARAMETERS MOST STRONGLY – THE WEAKER RESPONSES TO OTHER
PARAMETERS ARE SHOWN IN APPENDIX B FIG. 1. ............................................................................................... 56 FIGURE 4.10 CATTLE POPULATION SENSITIVITY TO ALTERED SALE RATES FROM THE INITIAL VALUE (18%) OF
SENESCENT MALES BY +20%, +10%, -10%, AND -20% UNDER SCENARIO 4, I.E., A DROUGHT FREQUENCY OF
ONCE EVERY 5 YEARS. ......................................................................................................................................... 57

xvii
FIGURE 4.11 CATTLE POPULATION TRAJECTORIES WITH INCREASED SALE RATES (SMS) OF SENESCENT MALES (FROM
18% TO 36%) AND DECREASED DEATH RATE (DI) OF INFANTS (FROM 18% TO 9%) IN SCENARIOS 1 AND 4 WITH A
DROUGHT FREQUENCY OF ONCE IN EVERY 20 AND 5 YEARS, RESPECTIVELY. WE RAN THE MODEL 100 TIMES
OVER 100 YEARS AND AVERAGED THE POPULATION TRAJECTORY AS SHOWN. .................................................... 57 FIGURE 5.1 A COMBINATION OF VARYING TECHNIQUES USED IN OUR STUDY TO UNDERSTAND RANGELAND DYNAMICS
IN BORANA. ......................................................................................................................................................... 69
xviii
List of Appendix figures
APPENDIX A FIG. 1. POPULATION GROWTH INTERVAL ON AN ANNUAL INTEGRATION TIME STEP. ................................ 94 APPENDIX A FIG. 2 STOCHASTIC GROWTH RATE OF THE BORAN CATTLE POPULATION UNDER THE FOUR DROUGHT
SCENARIOS (SCENARIO 1 = ONCE EVERY 20 YEARS, SCENARIO 2 = ONCE EVERY 15 YEARS, SCENARIO 3 = ONCE
EVERY 10 YEARS, AND SCENARIO 4 = ONCE EVERY 5 YEARS). POPULATION GROWTH RATE WAS CALCULATED BY
THE EQUATION R = ((POPULATION AT TIME STEP T+DT) - (POPULATION AT TIME STEP T))/(POPULATION AT TIME
STEP T), FOR THE AVERAGE 100 TIME RUN MODEL OUTPUT UNDER THE FOUR SCENARIOS. .................................. 94 APPENDIX A FIG. 3. THE FIVE INDIVIDUAL RUNS AND THE MEAN OF 100 RUNS UNDER STOCHASTIC LOGISTIC GROWTH
MODEL OF SCENARIO 1. ....................................................................................................................................... 95 APPENDIX A FIG. 4. THE FIVE INDIVIDUAL RUNS AND THE MEAN OF 100 RUNS UNDER STOCHASTIC LOGISTIC GROWTH
MODEL OF SCENARIO 2. ....................................................................................................................................... 95 APPENDIX A FIG. 5. THE FIVE INDIVIDUAL RUNS AND THE MEAN OF 100 RUNS UNDER STOCHASTIC LOGISTIC GROWTH
MODEL OF SCENARIO 3. ....................................................................................................................................... 96 APPENDIX A FIG. 6. THE FIVE INDIVIDUAL RUNS AND THE MEAN OF 100 RUNS UNDER STOCHASTIC LOGISTIC GROWTH
MODEL OF SCENARIO 4. ....................................................................................................................................... 96
APPENDIX B FIG. 1 SENSITIVITY OF POPULATION SIZE TO MODEL PARAMETERS. THE MODEL REACTED MOST
STRONGLY TO FEMALE SALE RATES. DMC = MALE CALVES DEATH RATE, DMJ = JUVENILE MALE DEATH RATE,
DMA = ADULT MALE DEATH RATE, DMS = SENESCENT MALE DEATH RATE, DFC = FEMALE CALVES DEATH RATE,
DFJ = JUVENILE FEMALE DEATH RATE, DFA = ADULT FEMALE DEATH RATE, BM = BIRTH RATE FROM MATURE
COWS, K = POTENTIAL CARRYING CAPACITY, SMJ = JUVENILE MALE SALE RATE, SMA = ADULT MALE SALE RATE,
SMS = SENESCENT MALE SALE RATE, SFJ = JUVENILE FEMALE SALE RATE, DI = INFANT DEATH RATE, SFA = ADULT
FEMALE SALE RATE, BY = BIRTH RATE FROM YOUNG COWS, SFS = SENESCENT FEMALE SALE RATE, SL =
SLAUGHTER RATE. ............................................................................................................................................... 97 APPENDIX B FIG. 2 SENSITIVITY OF POPULATION SIZE TO MODEL PARAMETERS AFTER FEMALE SALE RATES WERE
REMOVED. THE MODEL REACTED MOST STRONGLY TO SENESCENT MALE DEATH RATES. .................................... 97
xix
List of acronyms and abbreviations
AGB Aboveground grass biomass
agC Aboveground grass carbon
ANOVA Analysis of variance
BGB Belowground grass biomass
bgC Belowground grass carbon
C Carbon
CDKN Climate and Development Knowledge Network
cm centimeter
CO2 Carbon dioxide
CSA Central Statistical Agency
FAO Food and Agriculture Organization (United Nations)
GLM General Linear Model
HLPE The High Level Panel of Experts
IIED International Institute for Environment and Development
ILCA International Livestock Center for Africa
ILRAD International Laboratory for Research on Animal Diseases
ILRI International Livestock Research Institute
IPCC Intergovernmental Panel on Climate Change
LSD Fisher's least significant difference
masl Meters above sea level
mio million
mm millimeter
Pers. Comm. Personal Communication
R2 coefficient of determination
REGLAP Regional learning and advocacy program for vulnerable dryland
communities
SAS Statistical Analysis System
SD standard deviation
SE standard error
TLU Tropical livestock unit
WRI World Resources Institute
YPDARC Yabello Pastoral and Dryland Agriculture Research Centre

1
Chapter 1: General introduction
1.1: An overview of rangelands
Rangelands are dominated by herbaceous plants that are grazed by domestic and wild animals
(WRI/IIED, 1986). Areas that are not developed, not cultivated, not forested and not solid rock or
ice and that include grasslands, savannahs, steppes, shrublands, deserts and tundra can be classified
as rangelands; they are found on every continent (Fynn et al., 2010; Soussana et al., 2010). Most
of the rangelands are found in marginal areas, i.e., the drylands of the world, which cover about
45% of terrestrial ecosystems (Schimel 2010; Fig. 1.1). The mode of rangeland utilization is
mainly extensive animal grazing and the natural resources of rangeland vegetation provides about
70% of the feed for domestic ruminants (Lund, 2007). Further, rangelands are one of the major
terrestrial ecosystems that serve as an important carbon sink (Cook et al., 2013). However,
nowadays rangelands are under stress due to overgrazing, which is further aggravated by effects
of climate change (Acharya et al., 2012). Above average precipitation, varying in its extremes, and
frequent drought events will characterize the climate of the future (Trenberth et al., 2014). Drought
is expected to become more frequent in dry ecosystems and will negatively affect rangeland
productivity and, hence, their goods, functions and services (Desta, 2006).
Figure 1.1 Rangelands of the world classified into five different land-cover classes.
Source:
http://www.webpages.uidaho.edu/what-is-range/rangelands_map.htm
2
1.2: Present challenges to African rangelands
The rangelands in Africa are located in drylands characterized by highly variable climatic
elements; their production system is mobile pastoralism, a strategy that has been developed over
centuries to cope with the prevalent highly variable climate and, thus, resources (Niamir-Fuller,
1999). In Eastern African drylands, specifically arid and semi-arid lands cover vast areas, which
account for more than 63% of the land cover of, e.g., Ethiopia, (Regional Learning and Advocacy
Programme (REGLAP) 2012).
Most grazing lands in arid and semiarid regions are highly fragile as they are located in marginal
lands that have low productivity due to low soil moisture and low and erratic rainfall (Parton et
al., 1994). Global climate change will likely enhance the problem of low rangeland productivity
(Fay et al., 2000). Changes in rainfall regime, rather than temperature or CO2, constitute the most
important component of climate change in semiarid areas, where water is the primary limiting
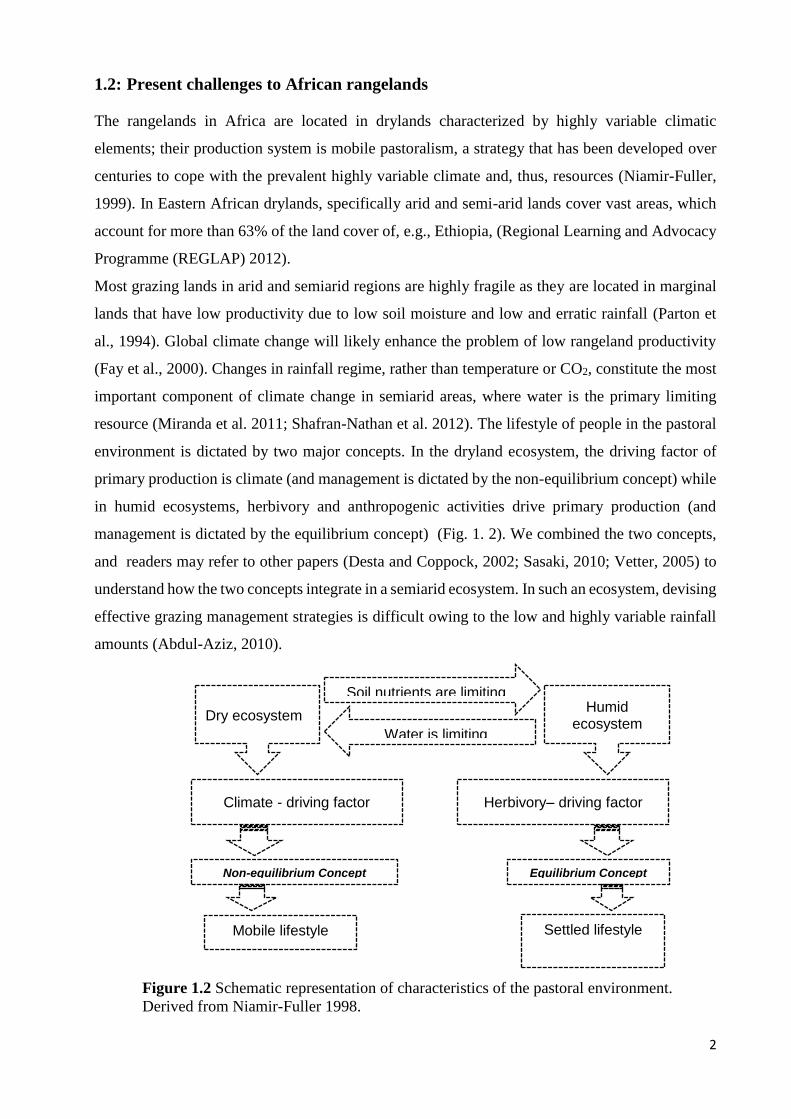
resource (Miranda et al. 2011; Shafran-Nathan et al. 2012). The lifestyle of people in the pastoral
environment is dictated by two major concepts. In the dryland ecosystem, the driving factor of
primary production is climate (and management is dictated by the non-equilibrium concept) while
in humid ecosystems, herbivory and anthropogenic activities drive primary production (and
management is dictated by the equilibrium concept) (Fig. 1. 2). We combined the two concepts,
and readers may refer to other papers (Desta and Coppock, 2002; Sasaki, 2010; Vetter, 2005) to
understand how the two concepts integrate in a semiarid ecosystem. In such an ecosystem, devising
effective grazing management strategies is difficult owing to the low and highly variable rainfall
amounts (Abdul-Aziz, 2010).
Figure 1.2 Schematic representation of characteristics of the pastoral environment.
Derived from Niamir-Fuller 1998.
Soil nutrients are limiting
Water is limiting
Settled lifestyle
Climate - driving factor
Non-equilibrium Concept Equilibrium Concept
Mobile lifestyle
Dry ecosystem Humid
ecosystem
Herbivory– driving factor
3
Global climate change is predicted to alter the growing season rainfall patterns, potentially
reducing total amounts of growing season precipitation and redistributing rainfall into fewer but
larger individual events (Fay et al., 2000). Such rainfall shifts may have considerable impact on
grass productivity. Climate change will result in multiple stresses for animals and plants, and yet,
it is unknown how these stresses may combine in rangeland systems over the coming decades
(HLPE, 2012). The productivity of rangeland ecosystems is predominantly affected by drought
and herbivory (Baruch and Jackson, 2005). However, currently there is little information available
on the impacts of climate change on the productivity of rangeland grasses per se. Grasslands
sequester and store a large amount of soil carbon, and this storage is primarily controlled by
herbivory and precipitation (Chimner and Welker, 2011). Increasing global demand for livestock
products (FAO, 2003) in combination with declining land area available for livestock grazing due
to changes in land use (Haile et al., 2010) has enhanced the pressure onto rangelands over the last
decades. Moreover, woody plant encroachment, lack and/or shortage of rain and ban of rangeland
burning were among the major factors that caused rangeland deterioration, particularly in the
Borana rangelands, southern Ethiopia (Gemedo-Dalle et al., 2006). Up to now, only few studies
have investigated how the combined effect of climate change and grazing pressure affects in
particular the herbaceous vegetation (Fynn and O’Connor, 2000; Pandey and Singh, 1992).
1.2.1: Rangeland management options
Rangeland degradation directly affects livestock production, which the livelihood of pastoralists
depends upon, resulting in food insecurity and ecological instability (Dalle et al., 2009). In Borana,
a shift in vegetation from grass to woody plants has severely affected cattle production over the
last decades (Dalle et al., 2006). Thus, alternate livestock species such as camels or goats, who can
browse on bushes and trees, might be better adapted to these bush-encroached rangelands under
pressure (Angassa, 2002; Solomon et al., 2007). As cattle have been referred to as the true
“economic engine” of the system, emphasizing on a sustainable productivity of cattle is a crucial
aspect (Coppock et al., 2014). The community-based conservation efforts of the typical Ethiopian
Boran cattle (Bos indicus) will require securing adequate grazing and water resources (Homann et
al., 2003). However, those grass species that are perceived by the pastoralists as highly palatable
and desirable, are currently decreasing in both quality and quantity in the Borana rangelands,
southern Ethiopia (Angassa, 2002; Solomon et al., 2007). A reason for this decline has been
claimed to be disturbances from overgrazing and climate change (Abule et al., 2007; Angassa,
2005; Angassa and Oba, 2010; Haile et al., 2010). While appropriate management of livestock
density in rangelands is essential for sustainable production and grassland ecosystem health
(Sternberg et al., 2000) the management of dryland ecosystems is mired in controversy due to the
4
complexity of the ecosystem, despite clear differences between the two management concepts
(Fig. 1.2). This region is categorized as non-equilibrium environment, though at times it
experiences equilibrium (Desta and Coppock, 2002), which makes the management of the Borana
rangelands highly complex. A better understanding of grass productivity and its controlling factors
in modern savanna ecosystems could be a key to understanding the productivity of savannas and
to predict responses to future climatic changes. Development of effective management strategies
for responding to climatic variability is often impeded by the lack of a system framework for
analyzing livestock stocking policies and management practices (Bank World, 2005; Kamara et
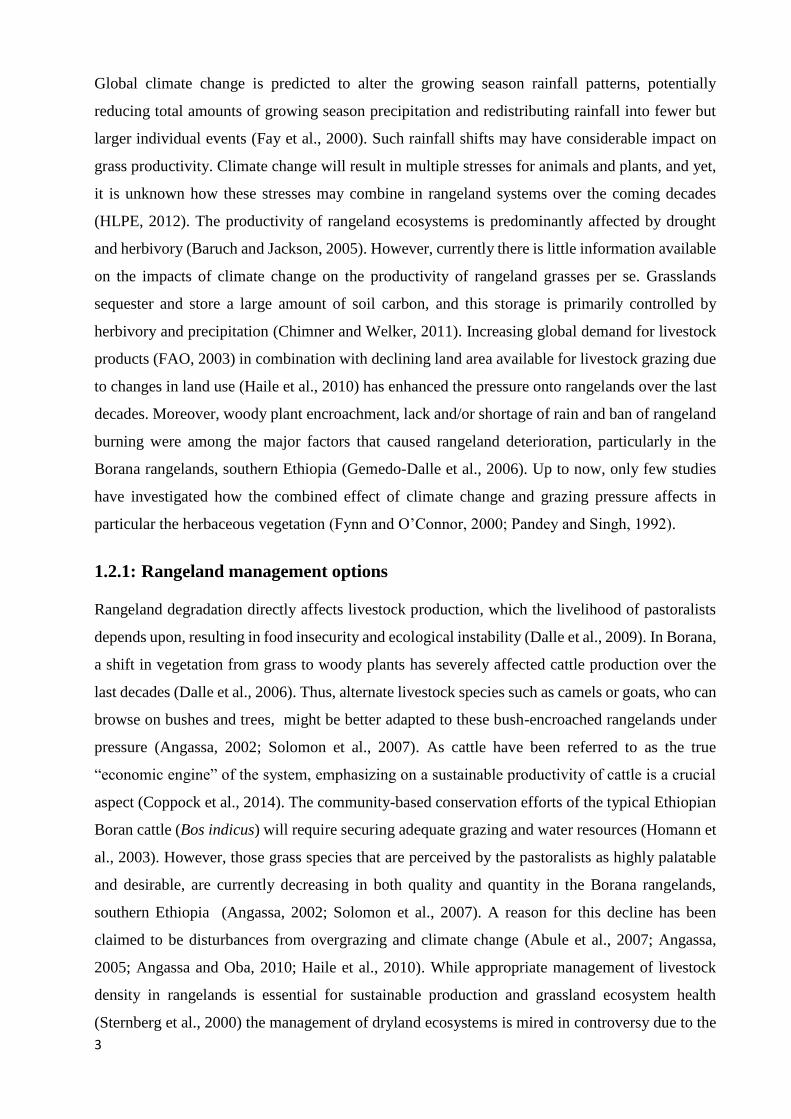
al., 2004). Further, effective decision making requires an understanding of the important biotic
and abiotic components of rangeland systems (Fig. 1.3), such as the response of rangeland
vegetation to herbivory and climatic change as well as cattle population dynamics. Previous
vegetation studies of the Borana rangelands focused mainly on taxonomic descriptions and
rangeland condition assessments and reseeding (Angassa and Baars, 2000; Dalle et al., 2009; Haile
et al., 2010; Oba and Kotile, 2001; Tebeje et al., 2014). Reseeding of degraded rangelands is a
potential management option in eastern African rangelands to enhance the resilience of rangelands.
Therefore, it is high time to understand how the native perennial grass individuals respond to
increased herbivory under higher drought frequency after reseeding. To bridge this knowledge
gap, we conducted clipping (simulated grazing) and irrigation (simulated rainfall variability)
experiments on two native grass species, which are commonly used for reseeding, i.e., Chloris
gayana Kunth and Cenchrus ciliaris L., in the Borana rangelands. We further modeled cattle
dynamics, combining the equilibrium and non-equilibrium concepts to understand possible future
population trajectories under varying environmental scenarios (Fig. 1.3).
Figure 1.3 Schematic representation of interactions among a rangeland’s biotic and abiotic
components, the principle we used in cattle population modeling. The plus and/or minus signs
stand for positive and negative feedbacks, respectively.
5
1.2.2: Study plant species
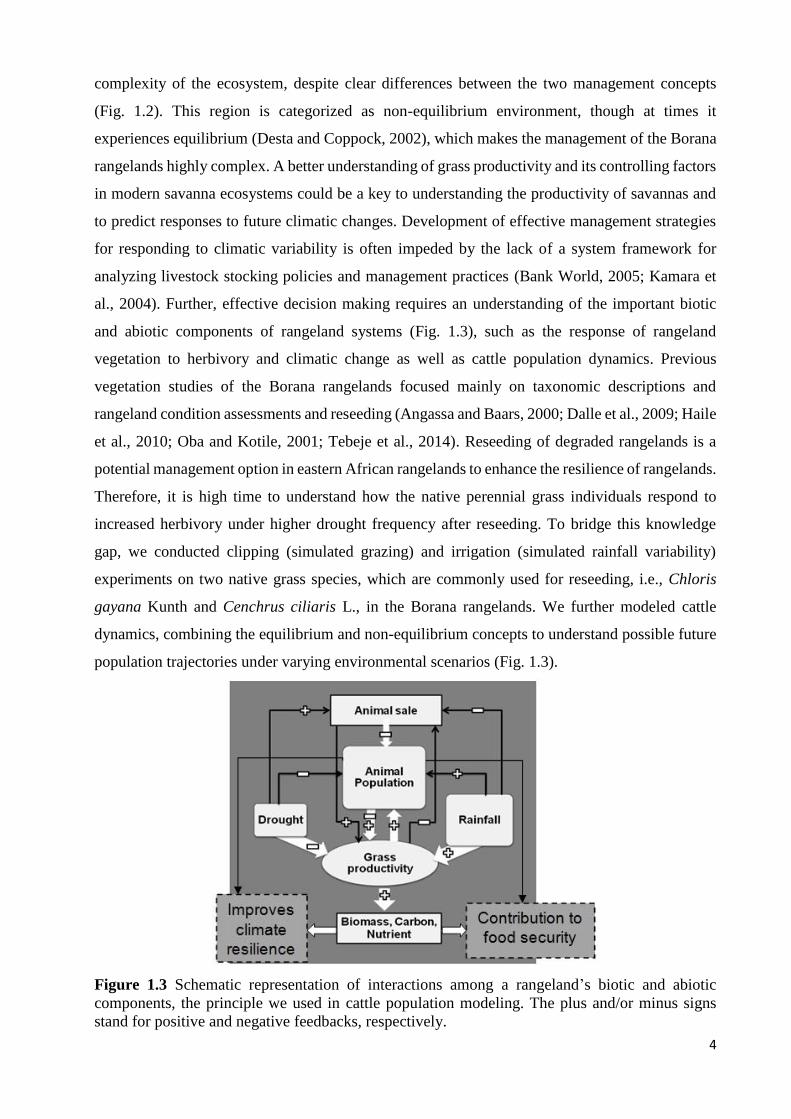
In Borana, particularly two grass species (C. ciliaris and C. gayana) are important for cattle
productivity as they are highly palatable, native to the study area. These two species further have
a vast global coverage (Fig. 1.4), highlighting their importance for rangeland management. Both
grass species have been recommended (Koech et al., 2015; Tebeje et al., 2014) and used for
reseeding degraded grazing lands to increase forage production and carbon (C) stocks (Conant et
al., 2001; Marshall et al., 2012). Cenchrus ciliaris is regarded as one of the native herbaceous
forage species that are nutritious all year round and at all growth stages and, thus, is recommended
for reseeding (Coppock, 1994). Likewise, C. gayana is also an important native perennial grass
species that has been used for rehabilitation of degraded Borana rangeland (Tebeje et al., 2014).
However, there is a lack of information as to the management options of the reseeded grass in the
face of climate change as well as their resilience against grazing, their shifts in nutrient and carbon
content under varying rainfall and grazing pressure.
Figure 1.4 Global distribution and native habitat (marginal and suitable) of C. ciliaris (a-c) and
C. gayana (d-f) grass species across the varying continents in 2005.
(Modified from http://www.tropicalforages.info/key/Forages/Media/Html/).
6
Studies regarding the influence of water limitation in grasslands of other parts of the world
indicated that water strongly limits annual productivity (Knapp et al. 2001; Knapp et al. 2008; Fig.
1.2). While experiments on altering rainfall regime have been widely conducted across many
countries (Knapp et al., 2008, 2006), most of these studies have been carried out in mesic
grasslands and experiments are missing in East African dry rangelands (Fidelis et al., 2013). These
types of studies, however, are critical for assessing the impact of climate change on the
provisioning of key ecosystem services (Weltzin et al., 2003) and increase the accuracy of
predictions of ecosystem responses to global climate change (Snyman, 2009). Grasslands are
important and tractable systems for examining these issues because they cover a large proportion
of terrestrial land mass, are rich and dynamic in biodiversity, are a globally important agricultural
resource, and are at risk from degradation and habitat conversion (Fay et al., 2011). Thus,
understanding how rainfall variability and grazing affects grass productivity is critical to forecast
changes in rangeland productivity and carbon storage potential under future climate scenarios.
Further, appropriate management of livestock populations in arid and semiarid rangelands through
local pastoralists in the face of climate change will strongly depend on this knowledge.
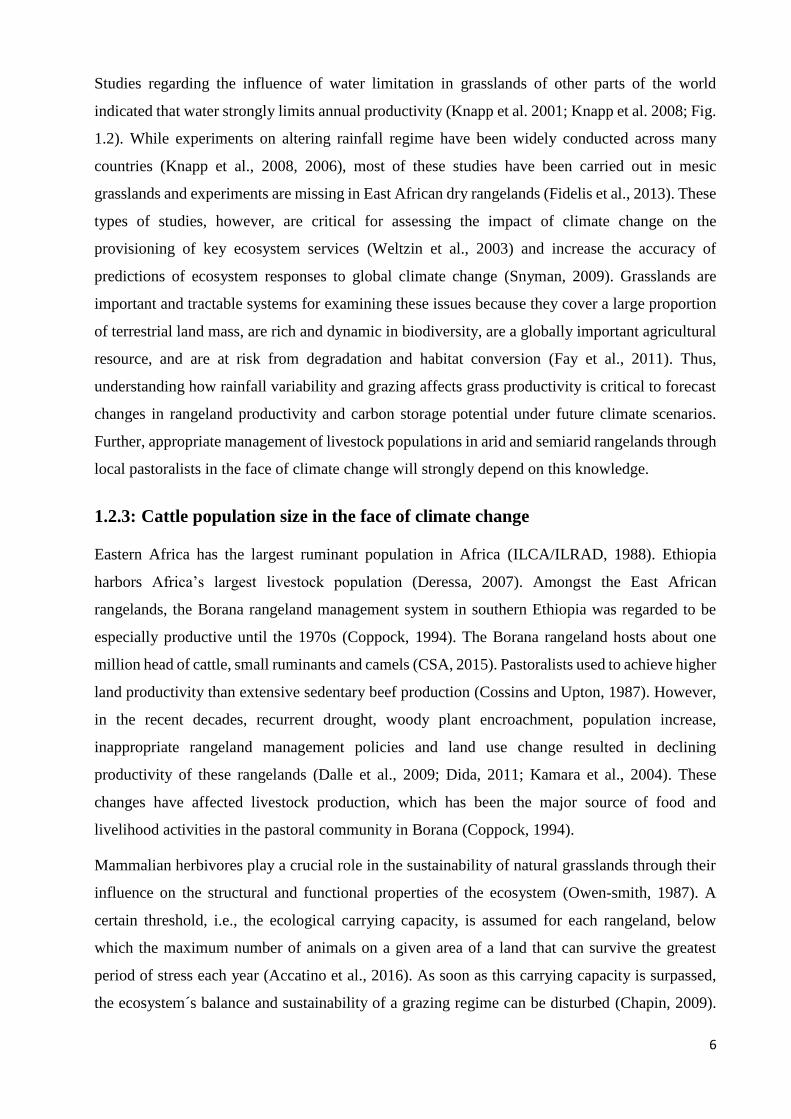
1.2.3: Cattle population size in the face of climate change
Eastern Africa has the largest ruminant population in Africa (ILCA/ILRAD, 1988). Ethiopia
harbors Africa’s largest livestock population (Deressa, 2007). Amongst the East African
rangelands, the Borana rangeland management system in southern Ethiopia was regarded to be
especially productive until the 1970s (Coppock, 1994). The Borana rangeland hosts about one
million head of cattle, small ruminants and camels (CSA, 2015). Pastoralists used to achieve higher
land productivity than extensive sedentary beef production (Cossins and Upton, 1987). However,
in the recent decades, recurrent drought, woody plant encroachment, population increase,
inappropriate rangeland management policies and land use change resulted in declining
productivity of these rangelands (Dalle et al., 2009; Dida, 2011; Kamara et al., 2004). These
changes have affected livestock production, which has been the major source of food and
livelihood activities in the pastoral community in Borana (Coppock, 1994).
Mammalian herbivores play a crucial role in the sustainability of natural grasslands through their
influence on the structural and functional properties of the ecosystem (Owen-smith, 1987). A
certain threshold, i.e., the ecological carrying capacity, is assumed for each rangeland, below
which the maximum number of animals on a given area of a land that can survive the greatest
period of stress each year (Accatino et al., 2016). As soon as this carrying capacity is surpassed,
the ecosystem´s balance and sustainability of a grazing regime can be disturbed (Chapin, 2009).
7
Carrying capacity of a rangeland is affected by rangeland vegetation productivity and quality (De
Leeuw and Tothill, 1990; Köchy et al., 2008; Tietjen and Jeltsch, 2007), and climate change affects
these two primary factors (Golodets et al., 2013). Quantifications of carrying capacities are
difficult under the non-equilibrium concept (Roe, 1997). Particularly in rangeland areas of scarce
and highly seasonal natural resources, capacities can highly vary across years (Roe, 1997; Treydte
et al., 2001). While the concept of a stable carrying capacity is of limited utility for African
conditions, the underlying principles on which it is based, are crucial for a sustained resource
management (De Leeuw and Tothill, 1990). Recent advances in pastoral studies have not solved
the stocking problem in African rangelands (Behnke and Kerven, 1994). The recommended
management practice is the maintenance of conservative stocking rates, the equilibrium concept,
which can be maintained in drier years, though considered as costly and inappropriate to
pastoralists in a variable ecosystem (Vetter, 2005). To give management options, modeling the
population sizes under different drought scenarios, combining the equilibrium and the non-
equilibrium concepts, is important (Fig. 1.2), which includes the concept of a varying carrying
capacity over time. In the semiarid rangelands such as the Borana rangelands no cattle population
modeling has been conducted to encompass the variability of environmental resource that is
dictated by rainfall, which would help exploring the economic outcomes of different stocking
strategies (Vetter, 2005). We attempted such cattle population modeling to understand future
trends and management options for the Boran cattle under climate change and varying carrying
capacity scenarios.
1.3: The research gap and specific objectives
Several studies have tried to quantify biomass and carbon in woody vegetation (Ahmedin et al.,
2013; Hasen-Yusuf et al., 2013; Montagnini and Nair, 2004). However, despite the apparent
importance of grasslands for carbon sequestration (FAO, 2010), only few studies have tried to
quantify the potential of grasslands under different grazing pressure, mainly in mesic grasslands,
while such studies are completely lacking for semiarid tropical rangelands (Kramberger et al.,
2014; McSherry and Ritchie, 2013; Piñeiro et al., 2010). Despite many studies on rangeland
productivity, few studies have been investigating the complex interaction between herbivory and
rainfall variability to acquire knowledge on the reaction and resilience of rangeland vegetation. As
a reduction in net primary production leads to declined soil carbon stocks (FAO, 2010) improving
forage production does not only improve the production of livestock system but also represents a
low-cost way of mitigating climate change (Woomer, 2003). Therefore, this research was
conducted to answer the following basic research questions:
8
• How do grass biomass, productivity and quality of two native grass species change
under varying environmental conditions (grazing pressure, rainfall regime)?
• How does the Carbon storage and within plant allocation of the two native grass species
change with increasing grazing frequency and decreasing rainfall amount?
• What are the main factors influencing cattle productivity in the Borana rangelands and
how would the cattle population and its management change in the face of climate
change?
The aim of this study was to experimentally determine the effects of herbivore pressure and
changing rainfall regime on rangeland grass production and carbon storage and to translate this
information to cattle population management.
Specific Objectives
1. To quantify how the nutrient quality (CP, ADF, NDF, ADL, TIVOMD) of the two study
grass species (C. ciliaris and C. gayana) changes with increasing herbivore pressure
2. To test the above- and belowground grass biomass allocation under different herbivore
pressure and rainfall amount.
3. To test the above- and belowground grass carbon storage under different herbivore pressure
and rainfall amount.
4. To model the Boran cattle population based on verified data under different drought
scenarios
Research Hypotheses
Our research hypotheses were
1. Under ambient average annual rainfall, we expect that there is an optimum clipping
frequency, which leads to more aboveground production than other clipping frequencies.
In contrast, belowground biomass will not be strongly affected by clipping treatment but
rather by watering amount
2. Increased clipping frequencies will reduce aboveground biomass but less so belowground
biomass and increase grass productivity (regrowth) under ambient rainfall regimes.
3. There is an optimum grazing frequency at ambient average annual rainfall that leads to
highest overall (above- and belowground) biomass and carbon storage of grasses.
4. High grazing frequencies reduce the overall grass biomass, particularly in drought
simulated condition.
5. In the face of climate change, the cattle population size reduces with increased drought
frequency if no appropriate management regime is applied, i.e., early harvesting before
drought hits the cattle population will be most beneficial focusing on males.
9
1.4: Outline of the thesis
This research focused on the experimental assessment of the rangeland grass biomass and carbon
storage and how the allocations of these within the plant were affected by grazing pressure and
rainfall variability. The main body of the research consists of controlled experiments of two native
grass species under the influence of two major stressors: herbivore pressure and rainfall shortage
(clipping and irrigation, respectively). These experiments were conducted on different spatial
scales and in differently controlled environments, i.e., on a pot level in the lath house, in a field
plot study and using moving cages in the field and observation techniques. The shift in response
of differently aged individual grasses to clipping and irrigation provides helpful insights into the
management of reseeded grassland for better biomass allocation and carbon storage in the face of
climate change and increased grazing pressure. In general, the research outcomes presented in
chapters 2 and 3 provide extensive answers for objectives 1, 2, and 3 of this study. For these, the
aim was to experimentally determine the response in biomass, nutrition and carbon (C) as a result
of grazing pressure and rainfall variability.
The study also used empirical data for stochastic models on the Boran cattle population dynamics
under different drought scenarios. Objective 4 is concerned with the modeling of the Boran cattle
population under drought frequencies based on empirical data collected from the Borana
rangelands.
As a whole, the chapters of this thesis present outcomes of grass-herbivore interaction as well as
the impacts of increased drought frequency on Boran cattle population size. Although each chapter
provides novel and imperative results, it is only the combination of each chapter that can help
understanding the effects of grazing and rainfall variability on the rangeland grass biomass,
nutrient and carbon storage as well as varying carrying capacity on population size in the face of
climate change. This information is necessary to develop a sound approach to rangeland
management principles, which link the rangeland productivity (quality and quantity as well as
carbon storage) to livestock population. Understanding such relationships among ecosystem
elements contributes to the global climate change mitigation and adaptation strategies through
enhancing the resilience of the rangeland ecosystem that leads to sustainable use of natural
resources (Fig. 1.5) and food security.
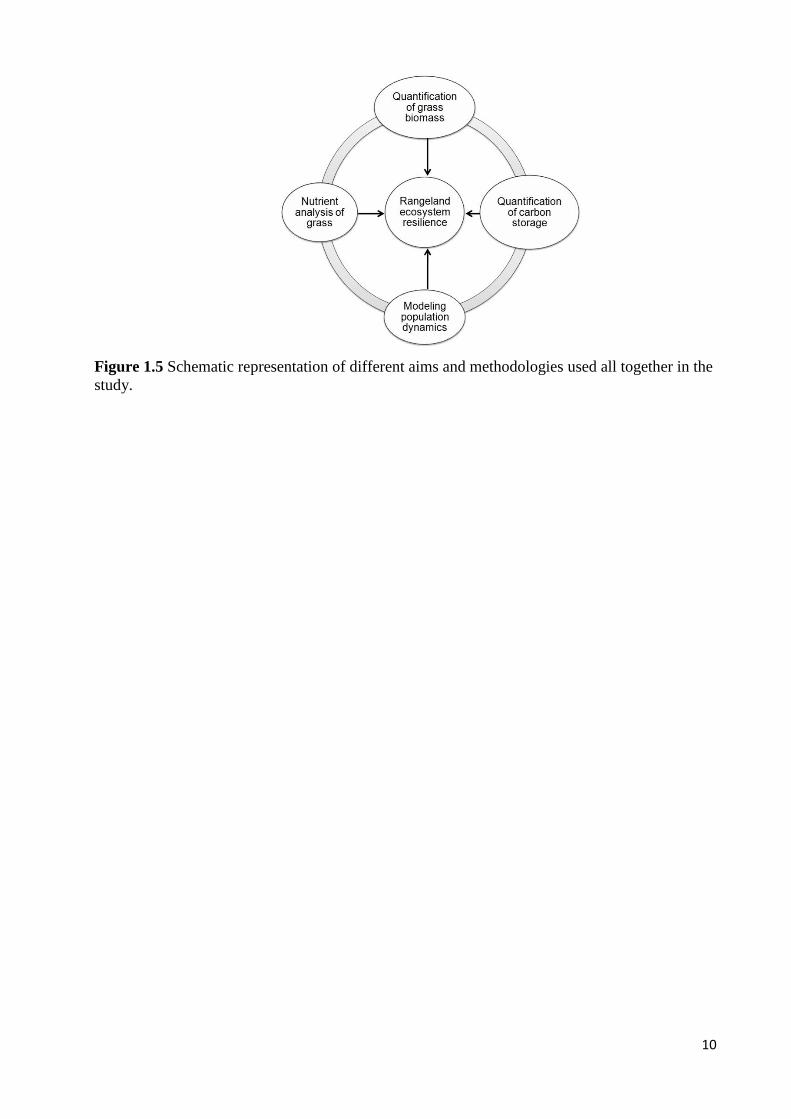
10
Figure 1.5 Schematic representation of different aims and methodologies used all together in the
study.
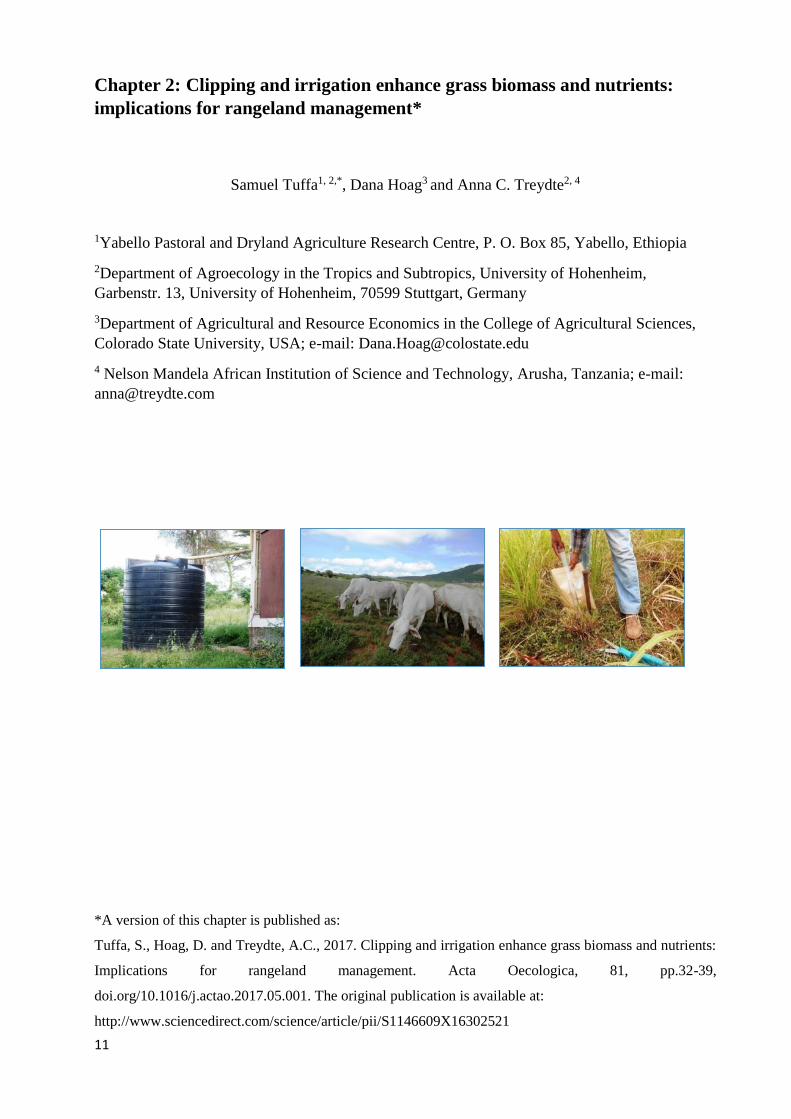
11
Chapter 2: Clipping and irrigation enhance grass biomass and nutrients:
implications for rangeland management*
Samuel Tuffa1, 2,*, Dana Hoag3 and Anna C. Treydte2, 4
1Yabello Pastoral and Dryland Agriculture Research Centre, P. O. Box 85, Yabello, Ethiopia
2Department of Agroecology in the Tropics and Subtropics, University of Hohenheim,
Garbenstr. 13, University of Hohenheim, 70599 Stuttgart, Germany
3Department of Agricultural and Resource Economics in the College of Agricultural Sciences,
Colorado State University, USA; e-mail: [email protected]
4 Nelson Mandela African Institution of Science and Technology, Arusha, Tanzania; e-mail:
*A version of this chapter is published as:
Tuffa, S., Hoag, D. and Treydte, A.C., 2017. Clipping and irrigation enhance grass biomass and nutrients:
Implications for rangeland management. Acta Oecologica, 81, pp.32-39,
doi.org/10.1016/j.actao.2017.05.001. The original publication is available at:
http://www.sciencedirect.com/science/article/pii/S1146609X16302521
12
Abstract
Increasing frequency of drought and high herbivore pressure significantly affect individual grass
functions in semiarid regions. Reseeding of degraded rangelands by native grass species has been
recommended as a tool for restoration semiarid rangelands. However, how grass species used for
reseeding respond to stressors has not been fully explored. We examined biomass allocation and
nutrient contents of Cenchrus ciliaris and Chloris gayana in the semiarid Borana rangelands,
Ethiopia. We tested clipped mature tufts of the same species for biomass allocation and nutritive
values. Further, shifts in rainfall and herbivory were simulated by three irrigation and four clipping
treatments, respectively, for newly established grasses in pot and field plot experiments.
Aboveground biomass (AGB) significantly declined by up to 75% under increased clipping in
mature tufts. In contrast, clipping significantly stimulated up to 152% higher AGB of newly
established grasses. Lower irrigation reduced the AGB by 24 and 42% in C. ciliaris and in C.
gayana, respectively. Clipping, further, significantly enhanced grass nutrients in grass tufts by up
to 82 and 105% in C. ciliaris and C. gayana, respectively. Hence, management should focus on
balancing this trade-off in mature grasses for nutritious rangeland production by clipping and
storing for later supplemental feeding when grass nutrients drop. Further, young pastures should
be moderately clipped/grazed for better establishment and biomass allocation.
Keywords: Borana rangelands, Crude protein, Ethiopia, Herbivory, Semiarid.
2.1: Introduction
Maintaining productivity of rangelands requires extensive knowledge on how vegetation responds
to the dominant environmental factors such as grazing and climate variability. Rangelands across
the world are facing increasing pressure due to overgrazing and climate change (Chimner and
Welker, 2011); drought and herbivory are the primary savanna stressors (Baruch and Jackson,
2005). Particularly in eastern Africa, drought and overgrazing have led to deteriorated rangelands
and a subsequent die-off of livestock populations after severe droughts (Catley et al., 2014).
Generally, climatic stresses account for about 63% of all stressors on land degradation in Africa
(Porto, 2014) while overgrazing causes 49% of soil degradation, mainly in semiarid and arid
regions of Africa (WRI et al., 1992). Hence, sound management of rangelands including reducing
livestock numbers (Abusuwar and Yahia, 2010; Zhang et al., 2015), letting the pasture vegetation
recover (Angassa and Oba, 2010), and reseeding with perennial grasses (Mganga et al., 2011;
Tebeje et al., 2014) is required. However, often, intensive management activities have been
neglected as little is known on the resilience of the existing grass species and which grass species
would be most suitable for reseeding (Mganga et al., 2013).
13
The effects of herbivory on biomass production have been controversial. Many findings indicated
that herbage dry matter yield decreases with increasing herbivory (Kramberger et al., 2014; Yan
et al., 2012) but Martin & Chambers (2001) claimed that clipping had no effect on total biomass.
Yan et al. (2012), observed that rotational, i.e., moderate grazing reduced aboveground biomass
and increased belowground biomass whereas Gao et al. (2008) observed a decrease of
belowground biomass with increasing grazing intensity. Further, responses of reseeded grasses to
grazing at different age class have rarely been compared under variable rainfall amount, which is
a dominant driver that governs primary productivity (Schönbach et al., 2012).
In semiarid rangelands, 90% of plant productivity occurs belowground but grass root responses to
clipping are not as well understood as shoot responses (Balogianni et al., 2014; Zhou et al., 2012)
due to the difficulty of estimating belowground net primary productivity (Gao et al., 2008). Yet,
to successfully manage rangelands under herbivore and climatic pressure, there is an urgent need
to understand resource allocation of grasses in response to such stress factors. Up till now, little
was known about how grazing and water availability interactively affect the native above- and
belowground productivity of grass species in reseeded semiarid rangelands.
In addition to forage biomass, the determination of plant nutrient contents is fundamental for
rangeland management (Arzani et al., 2012) as livestock production is limited by forage nutritional
value (Ren et al., 2016). Thus, improvement in grass quality and quantity through reseeding with
native, perennial grass species directly contributes to a sustainable cattle production (Homann et
al., 2004). Cattle have been shown to select for high-quality grass (de Vries and Schippers, 1994),
and under heavy grazing, it has been shown that dry matter digestibility has low values (Allison,
1985). In the Borana rangelands, not only grass quantity but also the quality of foraging sites
showed significant spatiotemporal heterogeneity (Abebe et al., 2012a, 2012b; Keba et al., 2013;
Teka et al., 2012). While it is known that grazing frequency greatly influences the nutritional value
of grasses (Georgiadis and McNaughton, 1990), and thus, cattle production (Takele et al., 2014)
empirical management recommendations are lacking particularly for Ethiopia’s reseeded
rangelands, which have paramount importance in protecting genetic erosion of the highly
productive Boran breed (Bos indicus) (Homann et al., 2003).
Our experiments were aimed at resembling the two main pressures, herbivory and changes in
rainfall regime, and their interactions in different intensities on two common rangeland grasses
(Cenchrus ciliaris and Chloris gayana) in Ethiopian rangelands (Jorge et al., 2008). These grasses
are widely used for reseeding (Tebeje et al., 2014) owing to their high digestibility and rapid
growth (Angassa, 2005; Keba et al., 2013).
We aimed at answering the following research questions:
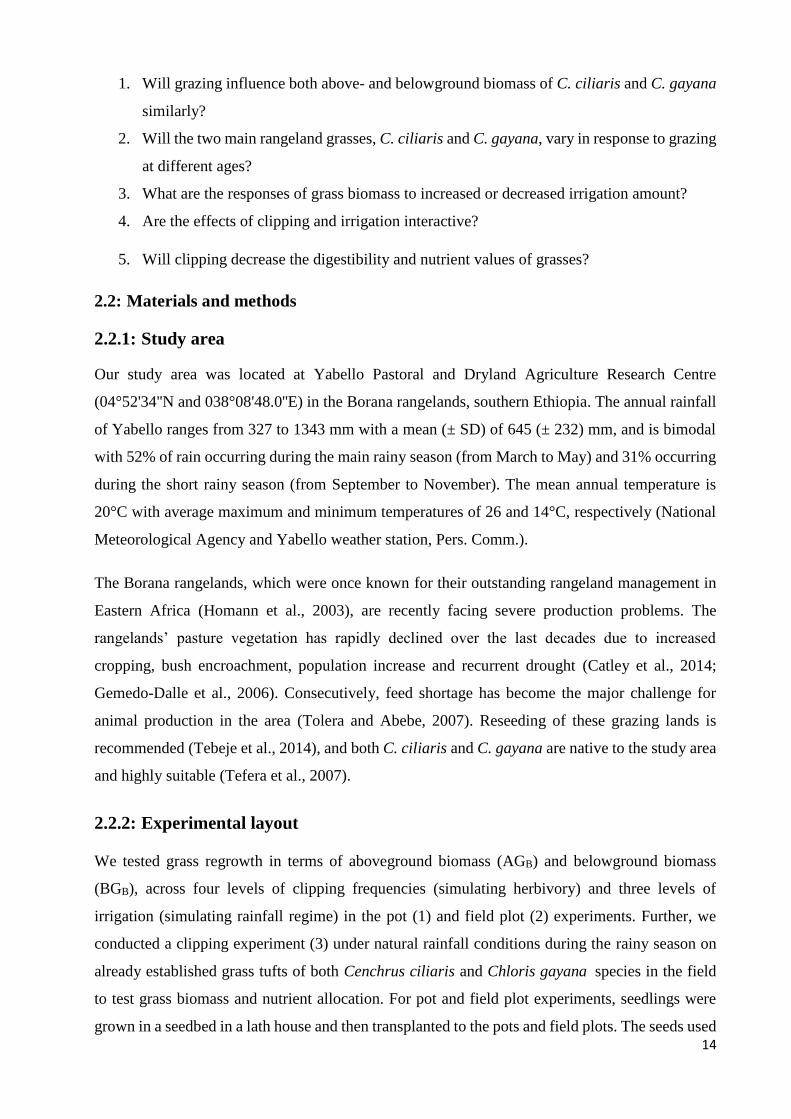
14
1. Will grazing influence both above- and belowground biomass of C. ciliaris and C. gayana
similarly?
2. Will the two main rangeland grasses, C. ciliaris and C. gayana, vary in response to grazing
at different ages?
3. What are the responses of grass biomass to increased or decreased irrigation amount?
4. Are the effects of clipping and irrigation interactive?
5. Will clipping decrease the digestibility and nutrient values of grasses?
2.2: Materials and methods
2.2.1: Study area
Our study area was located at Yabello Pastoral and Dryland Agriculture Research Centre
(04°52'34''N and 038°08'48.0''E) in the Borana rangelands, southern Ethiopia. The annual rainfall
of Yabello ranges from 327 to 1343 mm with a mean (± SD) of 645 (± 232) mm, and is bimodal
with 52% of rain occurring during the main rainy season (from March to May) and 31% occurring
during the short rainy season (from September to November). The mean annual temperature is
20°C with average maximum and minimum temperatures of 26 and 14°C, respectively (National
Meteorological Agency and Yabello weather station, Pers. Comm.).
The Borana rangelands, which were once known for their outstanding rangeland management in
Eastern Africa (Homann et al., 2003), are recently facing severe production problems. The
rangelands’ pasture vegetation has rapidly declined over the last decades due to increased
cropping, bush encroachment, population increase and recurrent drought (Catley et al., 2014;
Gemedo-Dalle et al., 2006). Consecutively, feed shortage has become the major challenge for
animal production in the area (Tolera and Abebe, 2007). Reseeding of these grazing lands is
recommended (Tebeje et al., 2014), and both C. ciliaris and C. gayana are native to the study area
and highly suitable (Tefera et al., 2007).
2.2.2: Experimental layout
We tested grass regrowth in terms of aboveground biomass (AGB) and belowground biomass
(BGB), across four levels of clipping frequencies (simulating herbivory) and three levels of
irrigation (simulating rainfall regime) in the pot (1) and field plot (2) experiments. Further, we
conducted a clipping experiment (3) under natural rainfall conditions during the rainy season on
already established grass tufts of both Cenchrus ciliaris and Chloris gayana species in the field
to test grass biomass and nutrient allocation. For pot and field plot experiments, seedlings were
grown in a seedbed in a lath house and then transplanted to the pots and field plots. The seeds used
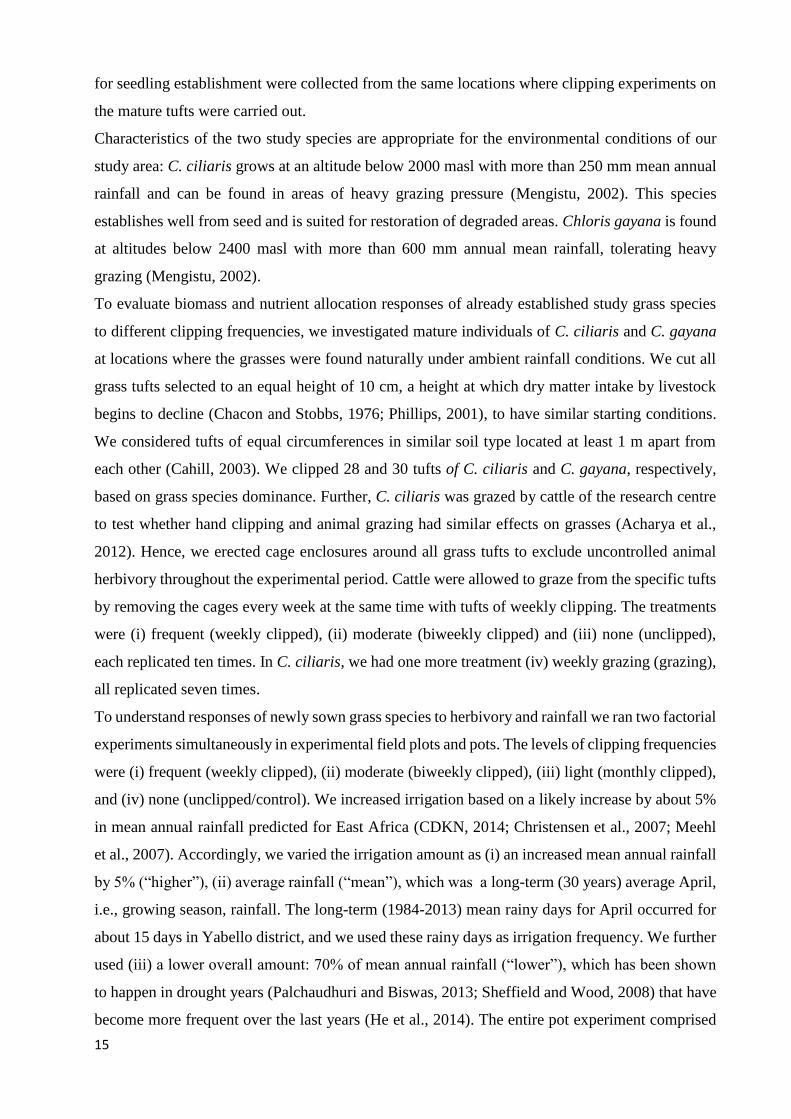
15
for seedling establishment were collected from the same locations where clipping experiments on
the mature tufts were carried out.
Characteristics of the two study species are appropriate for the environmental conditions of our
study area: C. ciliaris grows at an altitude below 2000 masl with more than 250 mm mean annual
rainfall and can be found in areas of heavy grazing pressure (Mengistu, 2002). This species
establishes well from seed and is suited for restoration of degraded areas. Chloris gayana is found
at altitudes below 2400 masl with more than 600 mm annual mean rainfall, tolerating heavy
grazing (Mengistu, 2002).
To evaluate biomass and nutrient allocation responses of already established study grass species
to different clipping frequencies, we investigated mature individuals of C. ciliaris and C. gayana
at locations where the grasses were found naturally under ambient rainfall conditions. We cut all
grass tufts selected to an equal height of 10 cm, a height at which dry matter intake by livestock
begins to decline (Chacon and Stobbs, 1976; Phillips, 2001), to have similar starting conditions.
We considered tufts of equal circumferences in similar soil type located at least 1 m apart from
each other (Cahill, 2003). We clipped 28 and 30 tufts of C. ciliaris and C. gayana, respectively,
based on grass species dominance. Further, C. ciliaris was grazed by cattle of the research centre
to test whether hand clipping and animal grazing had similar effects on grasses (Acharya et al.,
2012). Hence, we erected cage enclosures around all grass tufts to exclude uncontrolled animal
herbivory throughout the experimental period. Cattle were allowed to graze from the specific tufts
by removing the cages every week at the same time with tufts of weekly clipping. The treatments
were (i) frequent (weekly clipped), (ii) moderate (biweekly clipped) and (iii) none (unclipped),
each replicated ten times. In C. ciliaris, we had one more treatment (iv) weekly grazing (grazing),
all replicated seven times.
To understand responses of newly sown grass species to herbivory and rainfall we ran two factorial
experiments simultaneously in experimental field plots and pots. The levels of clipping frequencies
were (i) frequent (weekly clipped), (ii) moderate (biweekly clipped), (iii) light (monthly clipped),
and (iv) none (unclipped/control). We increased irrigation based on a likely increase by about 5%
in mean annual rainfall predicted for East Africa (CDKN, 2014; Christensen et al., 2007; Meehl
et al., 2007). Accordingly, we varied the irrigation amount as (i) an increased mean annual rainfall
by 5% (“higher”), (ii) average rainfall (“mean”), which was a long-term (30 years) average April,
i.e., growing season, rainfall. The long-term (1984-2013) mean rainy days for April occurred for
about 15 days in Yabello district, and we used these rainy days as irrigation frequency. We further
used (iii) a lower overall amount: 70% of mean annual rainfall (“lower”), which has been shown
to happen in drought years (Palchaudhuri and Biswas, 2013; Sheffield and Wood, 2008) that have
become more frequent over the last years (He et al., 2014). The entire pot experiment comprised
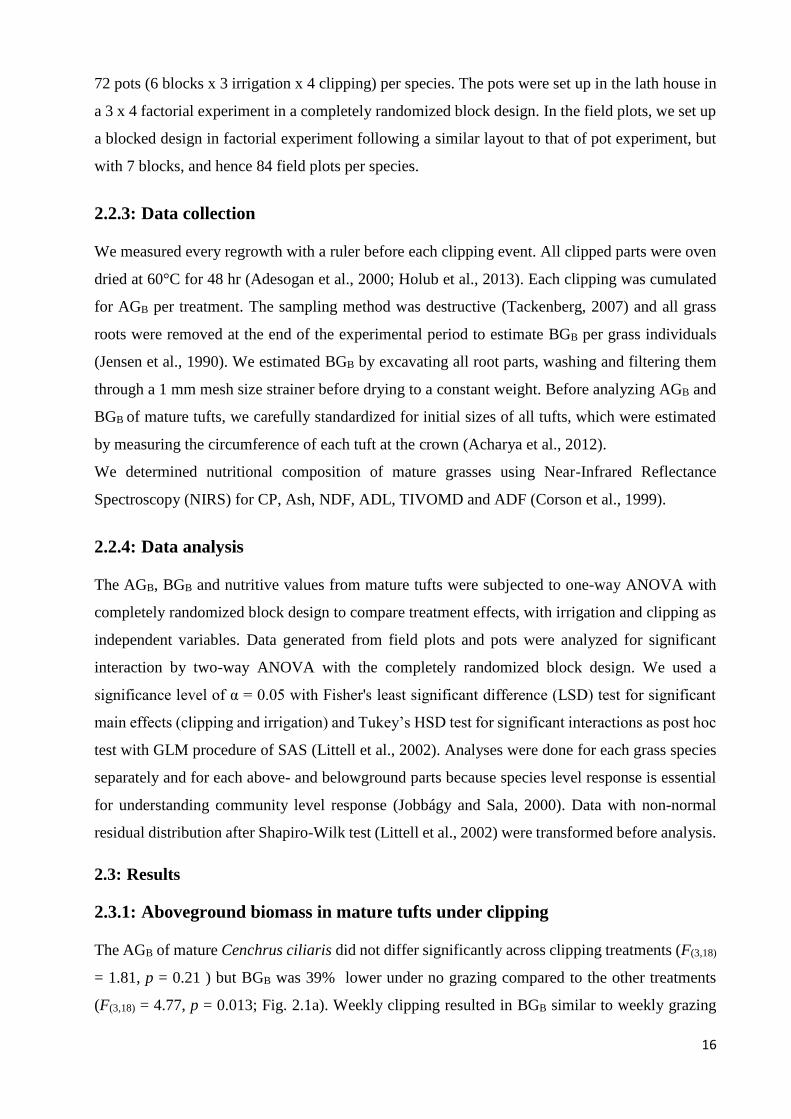
16
72 pots (6 blocks x 3 irrigation x 4 clipping) per species. The pots were set up in the lath house in
a 3 x 4 factorial experiment in a completely randomized block design. In the field plots, we set up
a blocked design in factorial experiment following a similar layout to that of pot experiment, but
with 7 blocks, and hence 84 field plots per species.
2.2.3: Data collection
We measured every regrowth with a ruler before each clipping event. All clipped parts were oven
dried at 60°C for 48 hr (Adesogan et al., 2000; Holub et al., 2013). Each clipping was cumulated
for AGB per treatment. The sampling method was destructive (Tackenberg, 2007) and all grass
roots were removed at the end of the experimental period to estimate BGB per grass individuals
(Jensen et al., 1990). We estimated BGB by excavating all root parts, washing and filtering them
through a 1 mm mesh size strainer before drying to a constant weight. Before analyzing AGB and
BGB of mature tufts, we carefully standardized for initial sizes of all tufts, which were estimated
by measuring the circumference of each tuft at the crown (Acharya et al., 2012).
We determined nutritional composition of mature grasses using Near-Infrared Reflectance
Spectroscopy (NIRS) for CP, Ash, NDF, ADL, TIVOMD and ADF (Corson et al., 1999).
2.2.4: Data analysis
The AGB, BGB and nutritive values from mature tufts were subjected to one-way ANOVA with
completely randomized block design to compare treatment effects, with irrigation and clipping as
independent variables. Data generated from field plots and pots were analyzed for significant
interaction by two-way ANOVA with the completely randomized block design. We used a
significance level of α = 0.05 with Fisher's least significant difference (LSD) test for significant
main effects (clipping and irrigation) and Tukey’s HSD test for significant interactions as post hoc
test with GLM procedure of SAS (Littell et al., 2002). Analyses were done for each grass species
separately and for each above- and belowground parts because species level response is essential
for understanding community level response (Jobbágy and Sala, 2000). Data with non-normal
residual distribution after Shapiro-Wilk test (Littell et al., 2002) were transformed before analysis.
2.3: Results
2.3.1: Aboveground biomass in mature tufts under clipping
The AGB of mature Cenchrus ciliaris did not differ significantly across clipping treatments (F(3,18)
= 1.81, p = 0.21 ) but BGB was 39% lower under no grazing compared to the other treatments
(F(3,18) = 4.77, p = 0.013; Fig. 2.1a). Weekly clipping resulted in BGB similar to weekly grazing
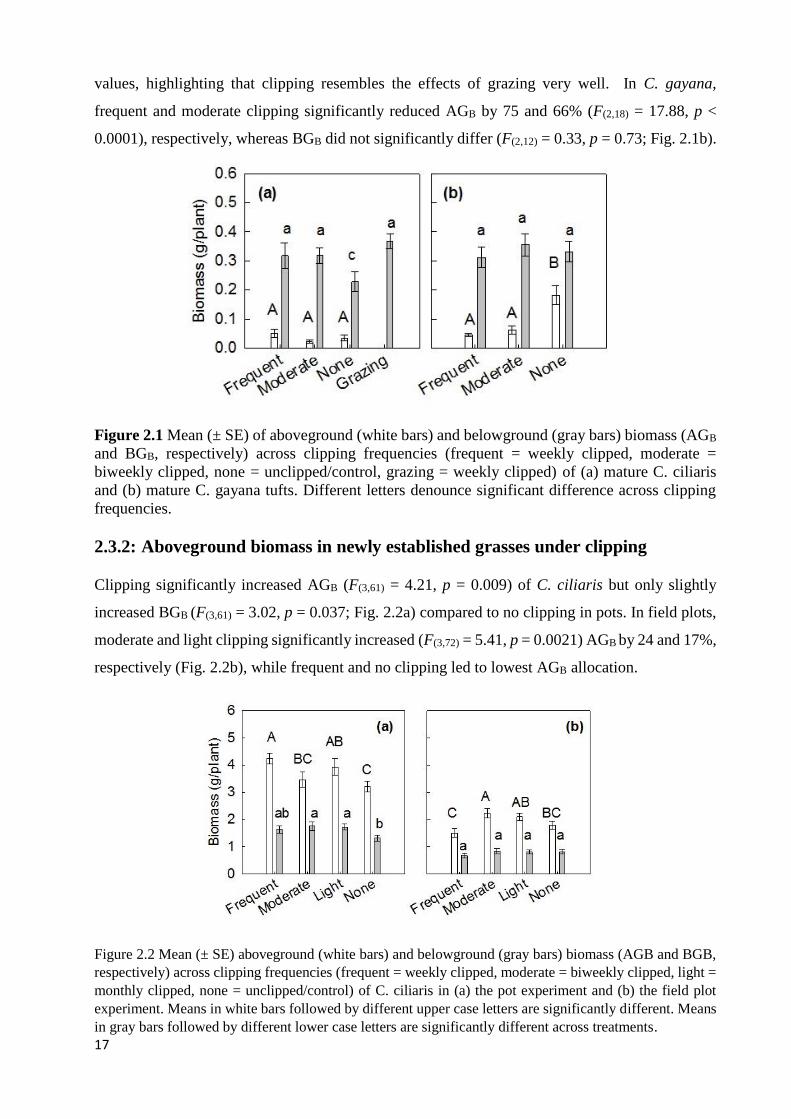
17
values, highlighting that clipping resembles the effects of grazing very well. In C. gayana,
frequent and moderate clipping significantly reduced AGB by 75 and 66% (F(2,18) = 17.88, p <
0.0001), respectively, whereas BGB did not significantly differ (F(2,12) = 0.33, p = 0.73; Fig. 2.1b).
Figure 2.1 Mean (± SE) of aboveground (white bars) and belowground (gray bars) biomass (AGB
and BGB, respectively) across clipping frequencies (frequent = weekly clipped, moderate =
biweekly clipped, none = unclipped/control, grazing = weekly clipped) of (a) mature C. ciliaris
and (b) mature C. gayana tufts. Different letters denounce significant difference across clipping
frequencies.
2.3.2: Aboveground biomass in newly established grasses under clipping
Clipping significantly increased AGB (F(3,61) = 4.21, p = 0.009) of C. ciliaris but only slightly
increased BGB (F(3,61) = 3.02, p = 0.037; Fig. 2.2a) compared to no clipping in pots. In field plots,
moderate and light clipping significantly increased (F(3,72) = 5.41, p = 0.0021) AGB by 24 and 17%,
respectively (Fig. 2.2b), while frequent and no clipping led to lowest AGB allocation.
Figure 2.2 Mean (± SE) aboveground (white bars) and belowground (gray bars) biomass (AGB and BGB,
respectively) across clipping frequencies (frequent = weekly clipped, moderate = biweekly clipped, light =
monthly clipped, none = unclipped/control) of C. ciliaris in (a) the pot experiment and (b) the field plot
experiment. Means in white bars followed by different upper case letters are significantly different. Means
in gray bars followed by different lower case letters are significantly different across treatments.
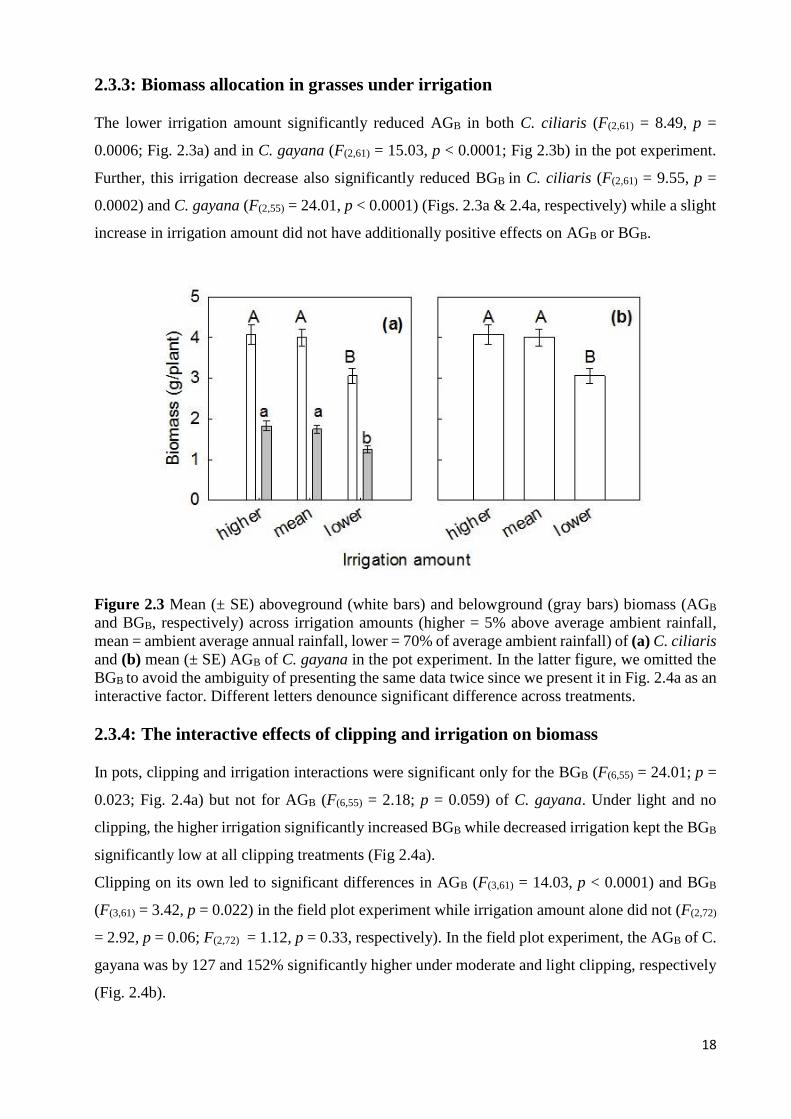
18
2.3.3: Biomass allocation in grasses under irrigation
The lower irrigation amount significantly reduced AGB in both C. ciliaris (F(2,61) = 8.49, p =
0.0006; Fig. 2.3a) and in C. gayana (F(2,61) = 15.03, p < 0.0001; Fig 2.3b) in the pot experiment.
Further, this irrigation decrease also significantly reduced BGB in C. ciliaris (F(2,61) = 9.55, p =
0.0002) and C. gayana (F(2,55) = 24.01, p < 0.0001) (Figs. 2.3a & 2.4a, respectively) while a slight
increase in irrigation amount did not have additionally positive effects on AGB or BGB.
Figure 2.3 Mean (± SE) aboveground (white bars) and belowground (gray bars) biomass (AGB
and BGB, respectively) across irrigation amounts (higher = 5% above average ambient rainfall,
mean = ambient average annual rainfall, lower = 70% of average ambient rainfall) of (a) C. ciliaris
and (b) mean (± SE) AGB of C. gayana in the pot experiment. In the latter figure, we omitted the
BGB to avoid the ambiguity of presenting the same data twice since we present it in Fig. 2.4a as an
interactive factor. Different letters denounce significant difference across treatments.
2.3.4: The interactive effects of clipping and irrigation on biomass
In pots, clipping and irrigation interactions were significant only for the BGB (F(6,55) = 24.01; p =
0.023; Fig. 2.4a) but not for AGB (F(6,55) = 2.18; p = 0.059) of C. gayana. Under light and no
clipping, the higher irrigation significantly increased BGB while decreased irrigation kept the BGB
significantly low at all clipping treatments (Fig 2.4a).
Clipping on its own led to significant differences in AGB (F(3,61) = 14.03, p < 0.0001) and BGB
(F(3,61) = 3.42, p = 0.022) in the field plot experiment while irrigation amount alone did not (F(2,72)
= 2.92, p = 0.06; F(2,72) = 1.12, p = 0.33, respectively). In the field plot experiment, the AGB of C.
gayana was by 127 and 152% significantly higher under moderate and light clipping, respectively
(Fig. 2.4b).

19
Figure 2.4 (a) Interactive effect of clipping (frequent = weekly clipped, moderate = biweekly
clipped, light = monthly clipped, none = unclipped/control) and irrigation (higher = 5% above
average ambient rainfall, mean = ambient average annual rainfall, lower = 70% of average ambient
rainfall) on belowground biomass (BGB) of C. gayana in the pot experiment. Bar graphs with
whiskers represent mean (± SE) BGB across clipping frequencies and irrigation amounts. (b) Mean
(± SE) aboveground (white bars) and belowground (gray bars) biomass (AGB and BGB,
respectively) of C. gayana across clipping frequencies in the field plot experiment. Means of bars
followed by different letters are significantly different
2.3.5: Nutritive values of mature tufts under clipping
The nutritive values of the two study species showed similar patterns across our treatments.
Clipping significantly increased CP, TIVOMD and ADF contents (Fig. 2.5c, e, & f, respectively)
while crude ash significantly decreased with increased clipping (Fig. 2.5b). The ADL significantly
decreased with increasing clipping frequencies in C. ciliaris (Fig 2.5d) but not in C. gayana.
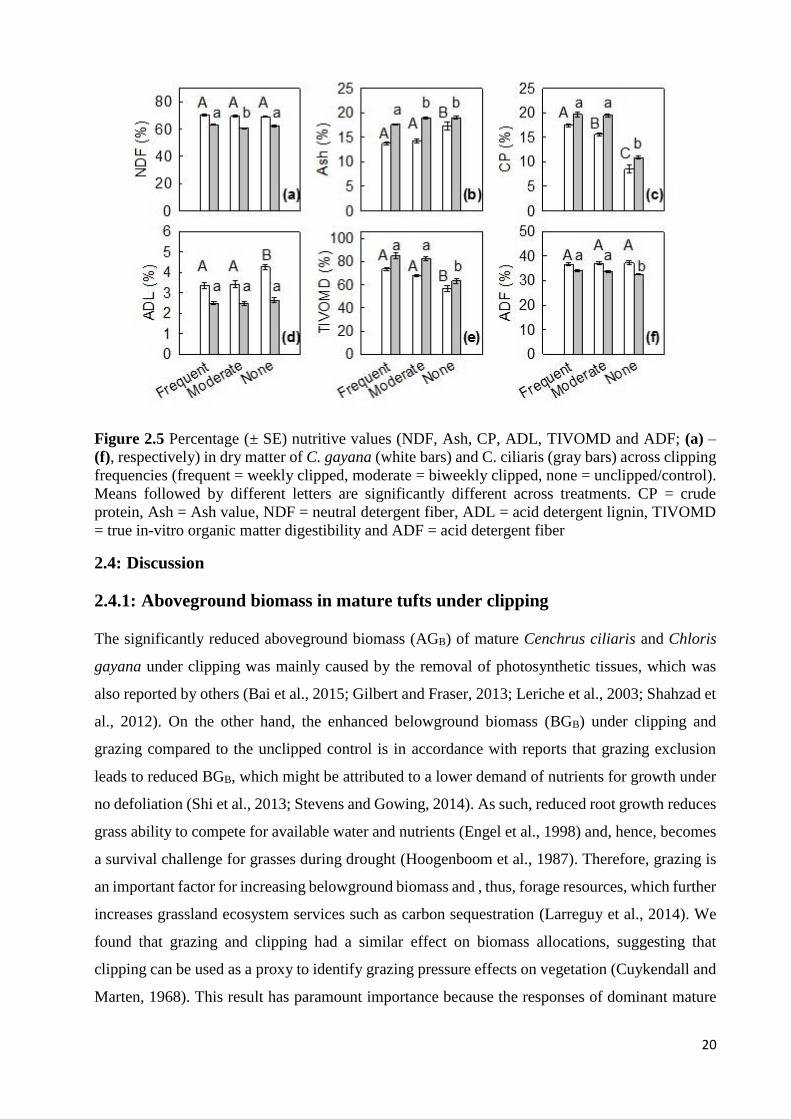
20
Figure 2.5 Percentage (± SE) nutritive values (NDF, Ash, CP, ADL, TIVOMD and ADF; (a) –
(f), respectively) in dry matter of C. gayana (white bars) and C. ciliaris (gray bars) across clipping
frequencies (frequent = weekly clipped, moderate = biweekly clipped, none = unclipped/control).
Means followed by different letters are significantly different across treatments. CP = crude
protein, Ash = Ash value, NDF = neutral detergent fiber, ADL = acid detergent lignin, TIVOMD
= true in-vitro organic matter digestibility and ADF = acid detergent fiber
2.4: Discussion
2.4.1: Aboveground biomass in mature tufts under clipping
The significantly reduced aboveground biomass (AGB) of mature Cenchrus ciliaris and Chloris
gayana under clipping was mainly caused by the removal of photosynthetic tissues, which was
also reported by others (Bai et al., 2015; Gilbert and Fraser, 2013; Leriche et al., 2003; Shahzad et
al., 2012). On the other hand, the enhanced belowground biomass (BGB) under clipping and
grazing compared to the unclipped control is in accordance with reports that grazing exclusion
leads to reduced BGB, which might be attributed to a lower demand of nutrients for growth under
no defoliation (Shi et al., 2013; Stevens and Gowing, 2014). As such, reduced root growth reduces
grass ability to compete for available water and nutrients (Engel et al., 1998) and, hence, becomes
a survival challenge for grasses during drought (Hoogenboom et al., 1987). Therefore, grazing is
an important factor for increasing belowground biomass and , thus, forage resources, which further
increases grassland ecosystem services such as carbon sequestration (Larreguy et al., 2014). We
found that grazing and clipping had a similar effect on biomass allocations, suggesting that
clipping can be used as a proxy to identify grazing pressure effects on vegetation (Cuykendall and
Marten, 1968). This result has paramount importance because the responses of dominant mature
21
grass species help to understand ecosystem resilience in the face of climate change (Nippert et al.,
2009).
2.4.2: Aboveground biomass in newly established grasses under clipping
The higher AGB under moderate clipping frequencies compared to non-clipping highlights that
controlled grazing can strongly enhance biomass in a newly established pasture. This might be
attributed to the fact that plants have the capacity to compensate or even overcompensate for
herbivory at low levels of grazing pressure (Mei et al., 2014; Veen et al., 2014).
The freshly reseeded grasses reacted more strongly with enhanced production to defoliation than
already established grasses, which might be due to the high photosynthetic capability of young
leaves (Nowak and Caldwell, 1984). In contrast experiments using Holcus lanatus and Lolium
perenne grasses showed that clipping stimulated older grasses more strongly than younger ones in
producing clonal propagation (Aarssen and Turkington, 1987), which might be species specific
artifact. Our findings have a paramount importance in the management of rangelands of different
ages in areas such as Borana rangelands, where our study a species have recently been
recommended for reseeding activities (Tebeje et al., 2014).
2.4.3: Biomass allocation in grasses under irrigation
The decreased irrigation reducing AGB and BGB of both grass species in our pot experiments
showed that rainfall plays an overriding role in dictating productivity of grasses in semiarid
environments. A 30% lower rainfall regime, a trend predicted for eastern Africa in the future
climate change scenarios (Sheffield and Wood, 2008), would, therefore, lead to a 31 and 40%
lower AGB and BGB, respectively, as water stress leads to reduced daily leaf extension (Busso and
Richards, 1993). This result implies that under drought conditions grazing seems less important
for grass productivity (Muthoni et al., 2014; Xu et al., 2013). Irrigation effects were not significant
for both grass species in the field plot experiment. This might be attributed to potential horizontal
and vertical seepages of water out of the field plots (Ochoa et al., 2009), which were not an artifact
in the pot experiments.
2.4.4: Interactive effects of clipping and irrigation on biomass
The significant interactions between clipping and irrigation for BGB suggested that low grazing
pressure can enhance BGB under mean or high rainfall, but not under low rainfall conditions, as
reported by others in ecosystems of the Sahel (Le Houerou, 1989). These changes might be
attributed to morphological, physiological and biochemical changes in moisture-stressed plants,
22
resulting from reduced CO2 assimilation rates due to low stomatal conductance (Anjum et al.,
2011). Further, a high BGB of C. gayana at high rainfall in unclipped compared to clipped
treatments indicated that under controlled grazing high rainfall can greatly enhance grass
productivity. This might be an opportunity for some east African regions, where higher rainfall is
predicted under the future climate change scenarios (Christensen et al., 2007). An increase in BGB
under clipping and irrigation combined at light and no clipping and a reduction under frequent and
moderate-clipping might be attributed to slow elongation and decreased production of new roots
(McInenly et al., 2010) as well as a reduced leaf extension rate due to water stress and biomass
removal (Busso and Richards, 1993). Future grazing management should consider resting times
of grazing areas for better biomass allocation and grass survival as BGB plays a significant role in
the long-term sustainability of rangelands (Engel et al., 1998; Hoogenboom et al., 1987). With our
experiments that combined above- and belowground biomass allocation as grass species responses
to herbivory are useful in order to understand grazing land ecosystem functions and resilience
(Bardgett and Wardle, 2003). Restoration of degraded rangelands with perennial grasses plays an
increasingly important role in rangeland sustainability (Christensen et al., 2005; Haddad et al.,
2015; Mapfumo et al., 2002). Particularly, lowlands (highly productive areas and fallback
pockets), which can potentially maintain the entire semiarid rangeland production system will
require sufficient grass supply (Scoones, 1995). This supply could be a combination of reseeded
and mature perennial grasses. While it has already been established that cropping of staple food is
unsustainable in rangeland systems (Angassa and Oba, 2008; Solomon et al., 2007), some still
support cultivation (Ng’ang’a et al., 2016), which is, under current and future climatic conditions,
prone to frequent crop failure (Tache and Oba, 2010; Tolera and Abebe, 2007). This current trend
of cultivating lowlands (Ng’ang’a et al., 2016) will lead to an extinction of important perennial
grasses (Angassa and Oba, 2010; Solomon et al., 2007) and will, consecutively, undermine the
resilience of rangelands (Elias et al., 2015).
2.4.5: Nutritive values of mature tufts under clipping
The main feed resource of Boran cattle (Bos indicus), which is the most important livestock species
in the region (Zander et al., 2009b), is a natural pasture that shows seasonal variability not only in
quantity but also in quality (Tolera and Abebe, 2007). In the Borana rangelands, grass species such
as C. ciliaris, which has been ranked first as preferred cattle forage species by pastoralists (Keba
et al., 2013), is decreasing at an alarming rate (Angassa, 2014). While it is possible to reserve
grass as standing hay in enclosures (Angassa and Oba, 2010) the quality of grasses drops
significantly during dry seasons (Abebe et al., 2012a, 2012b; Keba et al., 2013). However,
compared to other local grass species (such as Leptochloa fusca, Cynodon dactylon and Panicum
23
colunum), C. ciliaris C. gayana have higher nutritive values with low ash contents (Sultan et al.,
2011). Our results, which were within the range of the study species (Abebe et al., 2012b; Keba et
al., 2013), clearly indicated that clipping can significantly increase grass nutrient quality in both
C. gayana and C. ciliaris. Clipping decreased the ash content by 20 and 7% while it increased CP
content by 105 and 82% in C. gayana and C. ciliaris, respectively. Similar findings were reported
by other researchers for grazing and clipping in the same as well as other species (Georgiadis and
McNaughton, 1990; Leriche et al., 2003; Pavlů et al., 2006). Clipping also improved the true in
vitro organic matter digestibility (TIVOMD) by 31 and 34% in C. gayana and C. ciliaris,
respectively. Therefore, we recommend that grasses should be clipped and stored for dry season
or drought period supplementation, for instance, by the cut-and-carry principle or put-and-take
stocking during their growth periods (Allen et al., 2011; Mekuria, 2013) to fortify the deficient
forage. This can be done at an exclosure level, Kalo (Lind et al., 2016), which can provide
nutritious feed for calves and attenuated cattle during the dry season or drought.
Grasses should be cut while still growing for better nutritional quality rather than waiting until
maturity, the latter being a common practice in the Borana rangelands. Further, our two study grass
species not only occur in Borana but also in rangelands across the world; for instance, C. ciliaris
is the only cultivated grass in its area of origin and of potential application in other climate zones
while C. gayana is the most important cultivated tropical grass of today (Boonman, 1993; Marshall
et al., 2012). Hence, understanding their resilience towards drought and herbivore pressure has
global implications.
2.5: Conclusion
Our findings provide important information for local decision makers, which might enhance the
establishment and management of reseeded areas in the Borana rangelands. However, future
experiments should cover long-term studies to clarify the potential of those grass species that
proved to be promising within our study. The results from this study will greatly increase the
available information on above- and belowground production in C. ciliaris and C. gayana. Our
results very likely could be used to manage restored sites in other semiarid ecosystems reseeded
by grasses of the same species. We recommend that the traditional way of pastoralism, including
resting places that exclude grazing (Kalos), should be supported; and that new management
alternative such as reseeding should be further explored with other potential grasses to prove if
there are species-to-species differences between grasses used.

24
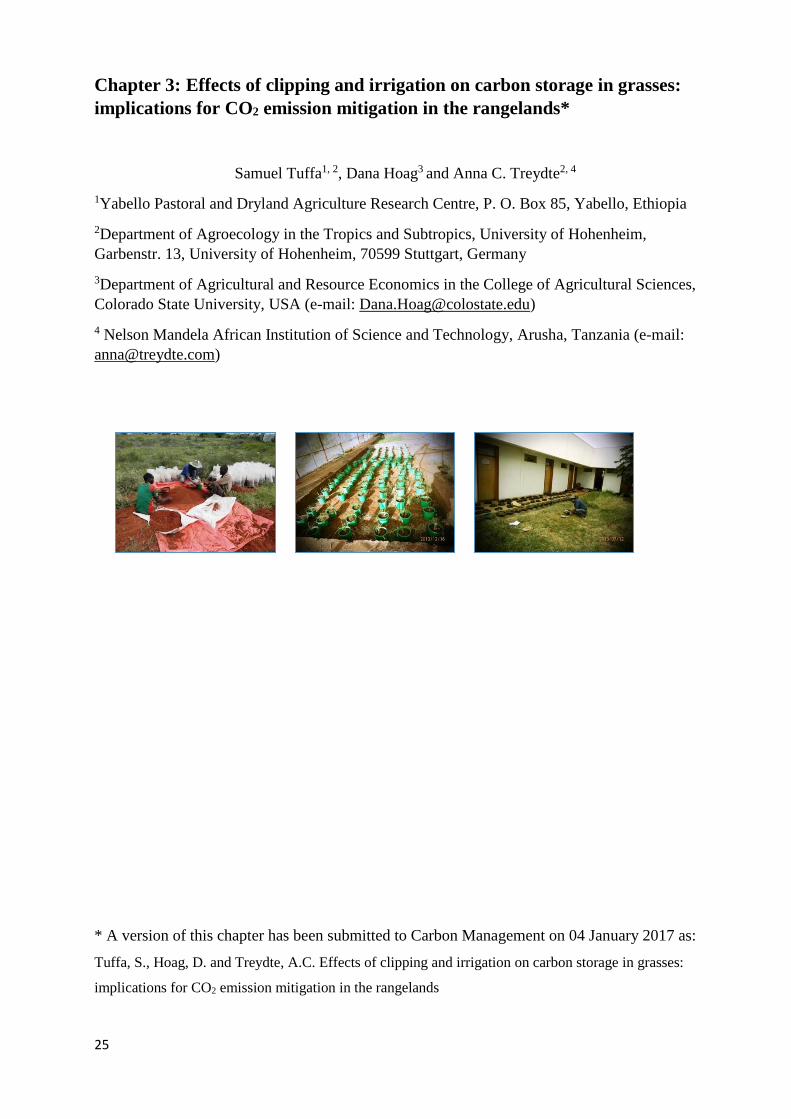
25
Chapter 3: Effects of clipping and irrigation on carbon storage in grasses:
implications for CO2 emission mitigation in the rangelands*
Samuel Tuffa1, 2, Dana Hoag3 and Anna C. Treydte2, 4
1Yabello Pastoral and Dryland Agriculture Research Centre, P. O. Box 85, Yabello, Ethiopia
2Department of Agroecology in the Tropics and Subtropics, University of Hohenheim,
Garbenstr. 13, University of Hohenheim, 70599 Stuttgart, Germany
3Department of Agricultural and Resource Economics in the College of Agricultural Sciences,
Colorado State University, USA (e-mail: [email protected])
4 Nelson Mandela African Institution of Science and Technology, Arusha, Tanzania (e-mail:
* A version of this chapter has been submitted to Carbon Management on 04 January 2017 as:
Tuffa, S., Hoag, D. and Treydte, A.C. Effects of clipping and irrigation on carbon storage in grasses:
implications for CO2 emission mitigation in the rangelands
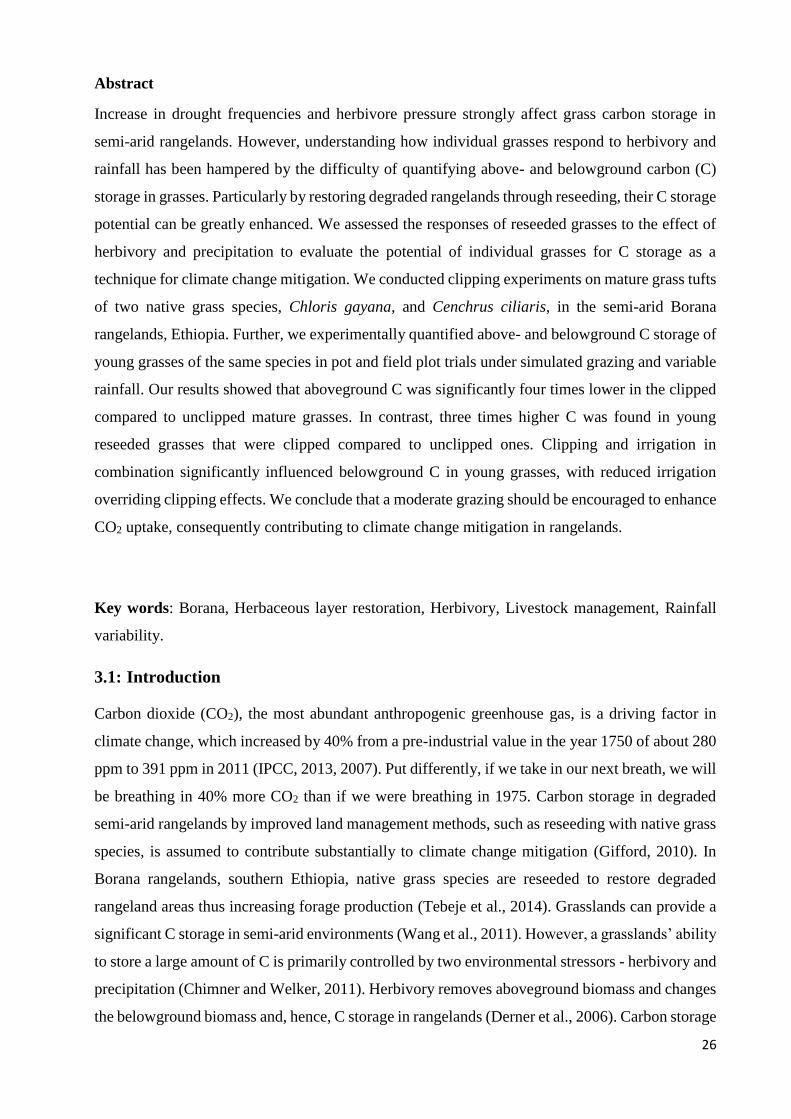
26
Abstract
Increase in drought frequencies and herbivore pressure strongly affect grass carbon storage in
semi-arid rangelands. However, understanding how individual grasses respond to herbivory and
rainfall has been hampered by the difficulty of quantifying above- and belowground carbon (C)
storage in grasses. Particularly by restoring degraded rangelands through reseeding, their C storage
potential can be greatly enhanced. We assessed the responses of reseeded grasses to the effect of
herbivory and precipitation to evaluate the potential of individual grasses for C storage as a
technique for climate change mitigation. We conducted clipping experiments on mature grass tufts
of two native grass species, Chloris gayana, and Cenchrus ciliaris, in the semi-arid Borana
rangelands, Ethiopia. Further, we experimentally quantified above- and belowground C storage of
young grasses of the same species in pot and field plot trials under simulated grazing and variable
rainfall. Our results showed that aboveground C was significantly four times lower in the clipped
compared to unclipped mature grasses. In contrast, three times higher C was found in young
reseeded grasses that were clipped compared to unclipped ones. Clipping and irrigation in
combination significantly influenced belowground C in young grasses, with reduced irrigation
overriding clipping effects. We conclude that a moderate grazing should be encouraged to enhance
CO2 uptake, consequently contributing to climate change mitigation in rangelands.
Key words: Borana, Herbaceous layer restoration, Herbivory, Livestock management, Rainfall
variability.
3.1: Introduction
Carbon dioxide (CO2), the most abundant anthropogenic greenhouse gas, is a driving factor in
climate change, which increased by 40% from a pre-industrial value in the year 1750 of about 280
ppm to 391 ppm in 2011 (IPCC, 2013, 2007). Put differently, if we take in our next breath, we will
be breathing in 40% more CO2 than if we were breathing in 1975. Carbon storage in degraded
semi-arid rangelands by improved land management methods, such as reseeding with native grass
species, is assumed to contribute substantially to climate change mitigation (Gifford, 2010). In
Borana rangelands, southern Ethiopia, native grass species are reseeded to restore degraded
rangeland areas thus increasing forage production (Tebeje et al., 2014). Grasslands can provide a
significant C storage in semi-arid environments (Wang et al., 2011). However, a grasslands’ ability
to store a large amount of C is primarily controlled by two environmental stressors - herbivory and
precipitation (Chimner and Welker, 2011). Herbivory removes aboveground biomass and changes
the belowground biomass and, hence, C storage in rangelands (Derner et al., 2006). Carbon storage
27
decreases and barely recovers under heavy grazing (Wang and Batkhishig, 2014); but moderate to
heavy grazing can also increase root biomass (Larreguy et al., 2014) and, hence, higher overall
plant C storage (Hafner et al., 2012) in the long run. Little is known about the regrowth response
of plants to herbivory (Falk et al., 2014) that influences the C storing capacity of grasses.
In the Borana rangelands, two perennial C4 grass species (Cenchrus ciliaris and Chloris gayana)
are particularly important because they are highly palatable, native species and are being used to
reseed degraded grazing land (Tebeje et al., 2014). Such managements can also increase C storage
which has paramount importance in the face of climate change (Thomey et al., 2014). With suitable
management practices, considerable increases in C storage or decreases in C losses and greenhouse
gas emissions can be achieved (Tennigkeit and Wilkes, 2008). However, the response of these
grasses to grazing frequency, under variable rainfall amount after reseeding remains unknown.
Hence, in this study, we aimed at estimating the carbon storage of the two native C4 grasses under
grazing and rainfall regime by simulated clipping and irrigation, respectively.
Roots are the major carbon source in the soil (Snyman and du Preez, 2005) and such a management
approach with an objective of forage production as a co-benefit may promote mitigation activities
(Milne et al., 2016). Few studies focused on the role of grasslands as a C storage in their
belowground biomass component (Frank et al., 2004).
Climate change will result in multiple stresses for plants and animals in the coming decades. Both
amounts of heavy precipitation and intensity of drought are likely to increase in the future due to
climate change (IPCC, 2013). Drought suppresses plant productivity (Xu et al., 2013) and will
diminish recovery potential of overgrazed rangelands (Busso and Richards, 1993). Large
uncertainties exist regarding the C storage factors under different climate regimes and management
systems of grasslands in general (Petri et al., 2010). Little is understood about the effects of
combinations of climate and herbivory-related stressors on the C storage of grasses (Campbell and
Stafford Smith, 2000). In this study, we focused on responses of grasses to the clipping and grazing
in allocating their carbon storage.
In southern Ethiopia, rainfall is predicted to be lower with future climate change (Funk et al.,
2014). Based on the annual rainfall data, rainfall strongly varies with above- and below-average
rainfall (Mwangi et al., 2014) and, hence, we resembled this variation in our irrigation treatments.
We combined rainfall variability and grazing pressure to acquire knowledge on C storage of
grasses, particularly in reseeded species. Information generated from such experiments will help
in designing appropriate management of newly reseeded grasslands that enhance their ecosystem
service such as C storage in the face of climate change.
The objectives of this study were to (i) quantify the effects of clipping on the C storage in mature
and young grasses, (ii) assess the interactive effects of grazing and rainfall variability on the two
28
native grass species in Borana rangelands of South Ethiopia. We addressed the following
questions/hypotheses:
1. How do clipping frequencies influence grass C storage in above- and belowground parts?
2. What are the responses of grass C to increased or decreased irrigation?
3. Are effects of clipping and irrigation interactive?
4. What are the implications for C storage, in the face of climate change, of the study grass species
in the Borana rangelands?
3.2: Materials and methods
3.2.1: Study site
Our experiments were conducted in the Borana zone, at the rangeland research station of Yabello
Pastoral and Dryland Agriculture Research Centre (N04°52', E038°08'; 1626 masl), southern
Ethiopia. The rainfall of Yabello ranges from 327 to 1343 mm per annum with mean annual rainfall
(± SD) of 645 (± 232) mm (National Meteorological Agency and Yabello weather station, Pers.
Comm.). It is bimodal with 52% of rain occurring during the main rainy season (from March to
May), and 31% occurring during the short rainy season (from September to November). The mean
annual temperature is 20°C with average maximum and minimum temperatures of 26°C and 14°C,
respectively (National Meteorological Agency and Yabello weather station, Pers. Comm.).
We conducted two separate experiments on two native grass species, C. ciliaris and C. gayana, in
the Borana rangelands. We ran the first experiment on already established mature tufts under
natural rainfall conditions during the main rainy season. For both species, we used different
clipping frequencies to simulate grazing pressure. Further, we applied clipping and irrigation on
newly established grasses in pots and field plots from November 2013 to February 2014, i.e.,
during the dry season.
3.2.2: The mature tufts clipping experimental design
In the first experiment, we selected in total 58 tufts of two mature grass species (C. ciliaris and C.
gayana) of similar size. The two sites were less than 500 m apart from each other and, hence,
environmental conditions were assumed to be similar. During tuft selection, we considered
independent, individual tufts within 5m distance from each other. In addition, circumferences of
all tufts were measured at their base prior to clipping and tufts of similar size were used and hence
differences in tuft sizes were ignored. Between April and June 2013, both species were subjected
29
to a completely randomized block design with different clipping frequencies, i.e., we erected 28
cages above C. ciliaris tufts in seven replications; we used three clipping frequencies to simulate
grazing pressure (weekly clipping = “frequent”, biweekly clipping = “moderate”, and no clipping
= “control”). Moreover, we measured the belowground biomass of tufts, in seven replications,
where cattle were allowed to graze on a weekly basis (= “grazing”), adjacent to the cages for
clipping frequencies, to record differences in response to grazing and clipping. Animals were taken
directly to the experimental site before they access other feed so that they graze on the dominant
tufts, i.e., C. ciliaris, without making any selection. We also observed that cattle preferred C.
ciliaris which had been already recognized as palatable (Keba et al., 2013). For the second species,
C. gayana, we used three clipping frequencies (frequent, moderate and control) with ten
replications each. For the latter species, we did not use cages because the area was completely
fenced off from any domestic and wild grazers; but grasses had been hand clipped for hay making
since 2008.
3.2.3: The combined clipping and irrigation design
For the second experiment of pots and field plots, we collected rainwater in plastic water storage
tanks during the rainy season and used it for dry season irrigation as a second factor, in addition
to clipping frequencies (frequent = weekly clipped, moderate = biweekly clipped, light = monthly
clipped, control = unclipped). We ran the pot and field plot experiments simultaneously during the
dry season, with the assumption that C stored in grasses is primarily controlled by two
environmental stressors - herbivory and precipitation (Chimner and Welker, 2011).
Irrigation resembled the condition of a typically wet April, the main growing season of our two
focus grass species (Angassa, 2005). The April average rainfall (158.8 mm) of 30 years (1984-
2013) was divided by the average number of rainy days (~15 days over 30 years) to get April
rainfall amount per event that we used to calculate volume of water that we added as average
rainfall (= “ambient”) treatment; we derived from the ambient treatment scenarios of a 5% rainfall
increase (= “higher”) and a 30% rainfall decrease (= “lower”) treatments. We calculated the
irrigation amount as, volume = water depth (daily April rainfall) x surface area (of field plot or
pot). The irrigation treatments were hand watered every other day throughout the experimental
period.
Before starting the experiments, grass seedlings of both species were raised on a seedbed in a lath
house and transplanted into pots and field plots. We transplanted one seedling of the same size per
pot and per field plot. In total, we transplanted 72 and 84 individual seedlings to pots and field
plots, respectively, per species. Seeds used in the seedling establishment for pot and field plot
experiments were collected in the previous years from the same site (i.e., within a radius of ½ km
30
around the study site of mature tufts). Hence, we assumed that the seeds used for pot and field
plot experiments were genetically similar to the mature tufts that we used during the rainy season
experiment.
In the field plots, we carefully drilled holes with 5 cm diameter using a motorized soil auger to a
depth of 10 cm for seedling transplanting without disturbing neighboring soil structure. In the pots
and field plots, both grass species were subjected to a factorial experiment with randomized
complete block design of four clipping frequencies (frequent, moderate, light and control) and
three irrigation amounts (higher, ambient, and lower). All experimental procedures were the same
for field plot and pot experiments except the number of blocks, which were 7 and 6, respectively.
The soils for pots experiment were collected from the same site where we conducted the field plot
experiments. Soils of each block for pot experiment were mixed and sieved before the experiment
to remove roots and other debris and mixed again to increase homogeneity within a block. Hence,
we assumed all belowground plant materials that we harvested at the end of the experiments were
from the present growth only.
3.2.4: Above- and belowground biomass collections
Before commencing the treatments, all grass tufts were clipped to have similar starting conditions
at a recommended height of 10 cm that mimics optimal grazing height (Bryan et al., 2000; Phillips,
2001), which was kept throughout the experiments. We oven dried the clippings at a recommended
temperature of 60°C for 48 hours before weighing (Adesogan et al., 2000). At the end of the
experiments, weights of the clippings were summed per clipping to obtain the total weight of
individual grasses.
We excavated all the 370 roots at the end of the experiments because excavation was suggested
for enabling total amount of root comparison (Atkinson and Dawson, 2001); i.e., we excavated
roots of the 58 mature tufts by digging a 100 cm wide hole to 100 cm depth; we also excavated
all 168 roots of both study grass species from the field plot experiment, by digging a 50 cm wide
hole to 50 cm depth. We collected all roots with soil and soaked in water, washed and strained
through small mesh sized sieve (1 mm) to remove fine roots from soils. We harvested, from the
pot experiment, the 144 roots by soaking the entire soil from the pots in water and washing through
a sieve. The washed roots were then oven dried at 60°C for 48 hrs (Adesogan et al., 2000).
Then, the C content of above- and belowground biomass of the study grass species was calculated
based on the comprehensive standard that the C content of most plant tissue is in the range of 45-
50% (Schlesinger, 1991). Therefore, the coefficient of 0.475 was used on average for calculating
C storage in above- and belowground biomass.
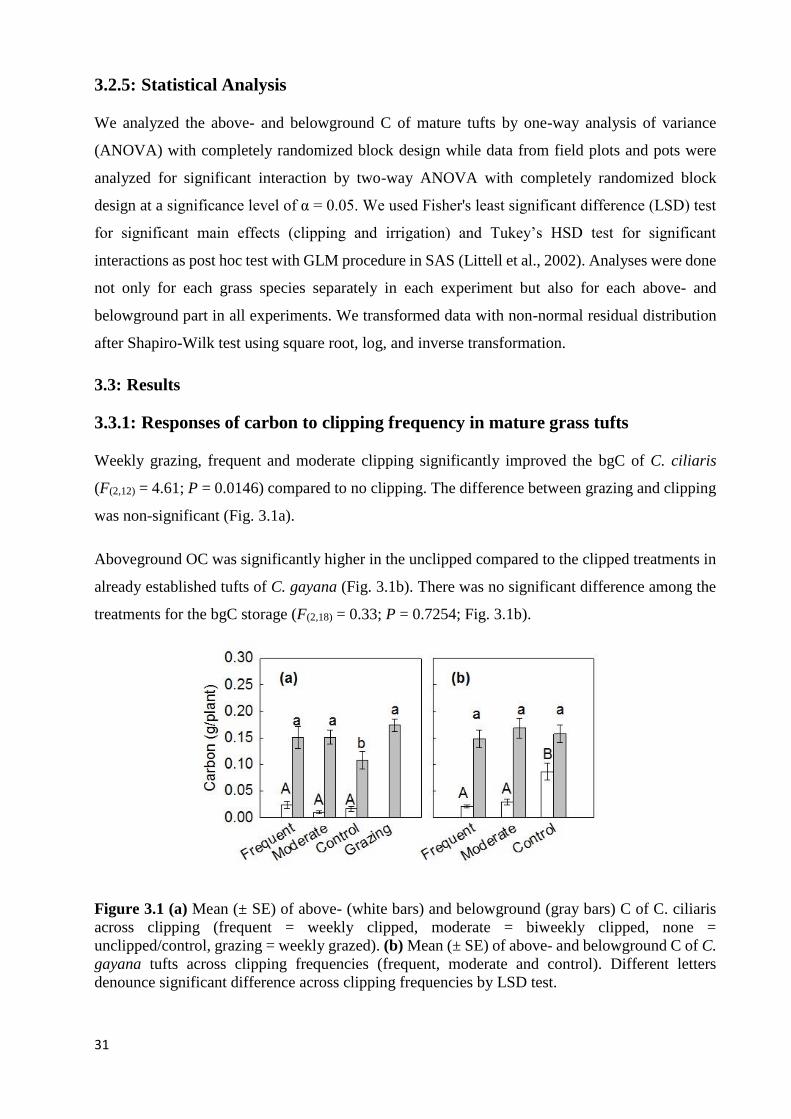
31
3.2.5: Statistical Analysis
We analyzed the above- and belowground C of mature tufts by one-way analysis of variance
(ANOVA) with completely randomized block design while data from field plots and pots were
analyzed for significant interaction by two-way ANOVA with completely randomized block
design at a significance level of α = 0.05. We used Fisher's least significant difference (LSD) test
for significant main effects (clipping and irrigation) and Tukey’s HSD test for significant
interactions as post hoc test with GLM procedure in SAS (Littell et al., 2002). Analyses were done
not only for each grass species separately in each experiment but also for each above- and
belowground part in all experiments. We transformed data with non-normal residual distribution
after Shapiro-Wilk test using square root, log, and inverse transformation.
3.3: Results
3.3.1: Responses of carbon to clipping frequency in mature grass tufts
Weekly grazing, frequent and moderate clipping significantly improved the bgC of C. ciliaris
(F(2,12) = 4.61; P = 0.0146) compared to no clipping. The difference between grazing and clipping
was non-significant (Fig. 3.1a).
Aboveground OC was significantly higher in the unclipped compared to the clipped treatments in
already established tufts of C. gayana (Fig. 3.1b). There was no significant difference among the
treatments for the bgC storage (F(2,18) = 0.33; P = 0.7254; Fig. 3.1b).
Figure 3.1 (a) Mean (± SE) of above- (white bars) and belowground (gray bars) C of C. ciliaris
across clipping (frequent = weekly clipped, moderate = biweekly clipped, none =
unclipped/control, grazing = weekly grazed). (b) Mean (± SE) of above- and belowground C of C.
gayana tufts across clipping frequencies (frequent, moderate and control). Different letters
denounce significant difference across clipping frequencies by LSD test.
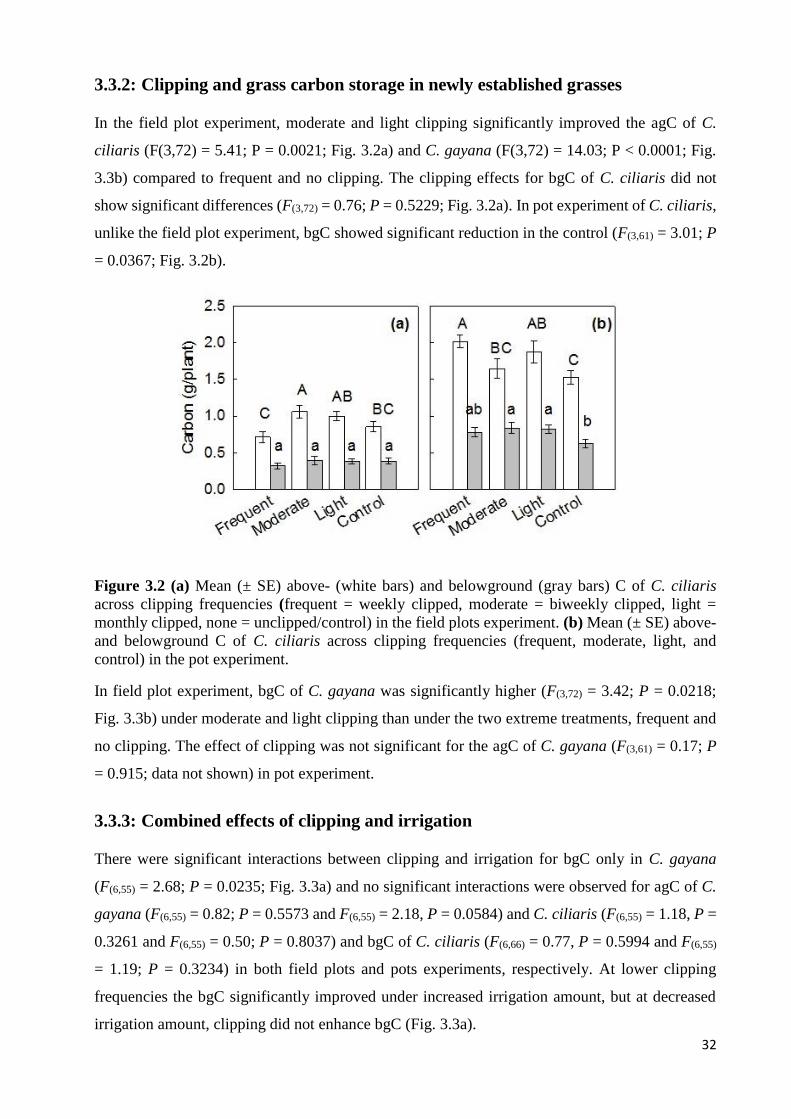
32
3.3.2: Clipping and grass carbon storage in newly established grasses
In the field plot experiment, moderate and light clipping significantly improved the agC of C.
ciliaris (F(3,72) = 5.41; P = 0.0021; Fig. 3.2a) and C. gayana (F(3,72) = 14.03; P < 0.0001; Fig.
3.3b) compared to frequent and no clipping. The clipping effects for bgC of C. ciliaris did not
show significant differences (F(3,72) = 0.76; P = 0.5229; Fig. 3.2a). In pot experiment of C. ciliaris,
unlike the field plot experiment, bgC showed significant reduction in the control (F(3,61) = 3.01; P
= 0.0367; Fig. 3.2b).
Figure 3.2 (a) Mean (± SE) above- (white bars) and belowground (gray bars) C of C. ciliaris
across clipping frequencies (frequent = weekly clipped, moderate = biweekly clipped, light =
monthly clipped, none = unclipped/control) in the field plots experiment. (b) Mean (± SE) above-
and belowground C of C. ciliaris across clipping frequencies (frequent, moderate, light, and
control) in the pot experiment.
In field plot experiment, bgC of C. gayana was significantly higher (F(3,72) = 3.42; P = 0.0218;
Fig. 3.3b) under moderate and light clipping than under the two extreme treatments, frequent and
no clipping. The effect of clipping was not significant for the agC of C. gayana (F(3,61) = 0.17; P
= 0.915; data not shown) in pot experiment.
3.3.3: Combined effects of clipping and irrigation
There were significant interactions between clipping and irrigation for bgC only in C. gayana
(F(6,55) = 2.68; P = 0.0235; Fig. 3.3a) and no significant interactions were observed for agC of C.
gayana (F(6,55) = 0.82; P = 0.5573 and F(6,55) = 2.18, P = 0.0584) and C. ciliaris (F(6,55) = 1.18, P =
0.3261 and F(6,55) = 0.50; P = 0.8037) and bgC of C. ciliaris (F(6,66) = 0.77, P = 0.5994 and F(6,55)
= 1.19; P = 0.3234) in both field plots and pots experiments, respectively. At lower clipping
frequencies the bgC significantly improved under increased irrigation amount, but at decreased
irrigation amount, clipping did not enhance bgC (Fig. 3.3a).
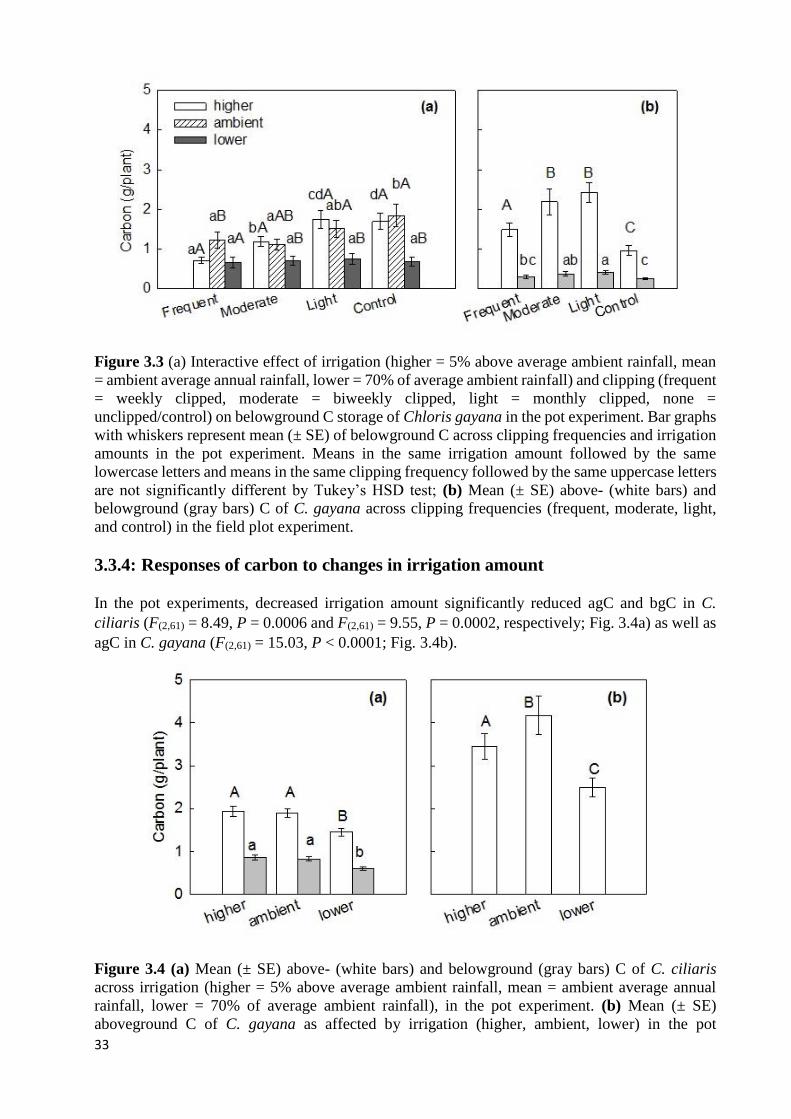
33
Figure 3.3 (a) Interactive effect of irrigation (higher = 5% above average ambient rainfall, mean
= ambient average annual rainfall, lower = 70% of average ambient rainfall) and clipping (frequent
= weekly clipped, moderate = biweekly clipped, light = monthly clipped, none =
unclipped/control) on belowground C storage of Chloris gayana in the pot experiment. Bar graphs
with whiskers represent mean (± SE) of belowground C across clipping frequencies and irrigation
amounts in the pot experiment. Means in the same irrigation amount followed by the same
lowercase letters and means in the same clipping frequency followed by the same uppercase letters
are not significantly different by Tukey’s HSD test; (b) Mean (± SE) above- (white bars) and
belowground (gray bars) C of C. gayana across clipping frequencies (frequent, moderate, light,
and control) in the field plot experiment.
3.3.4: Responses of carbon to changes in irrigation amount
In the pot experiments, decreased irrigation amount significantly reduced agC and bgC in C.
ciliaris (F(2,61) = 8.49, P = 0.0006 and F(2,61) = 9.55, P = 0.0002, respectively; Fig. 3.4a) as well as
agC in C. gayana (F(2,61) = 15.03, P < 0.0001; Fig. 3.4b).
Figure 3.4 (a) Mean (± SE) above- (white bars) and belowground (gray bars) C of C. ciliaris
across irrigation (higher = 5% above average ambient rainfall, mean = ambient average annual
rainfall, lower = 70% of average ambient rainfall), in the pot experiment. (b) Mean (± SE)
aboveground C of C. gayana as affected by irrigation (higher, ambient, lower) in the pot
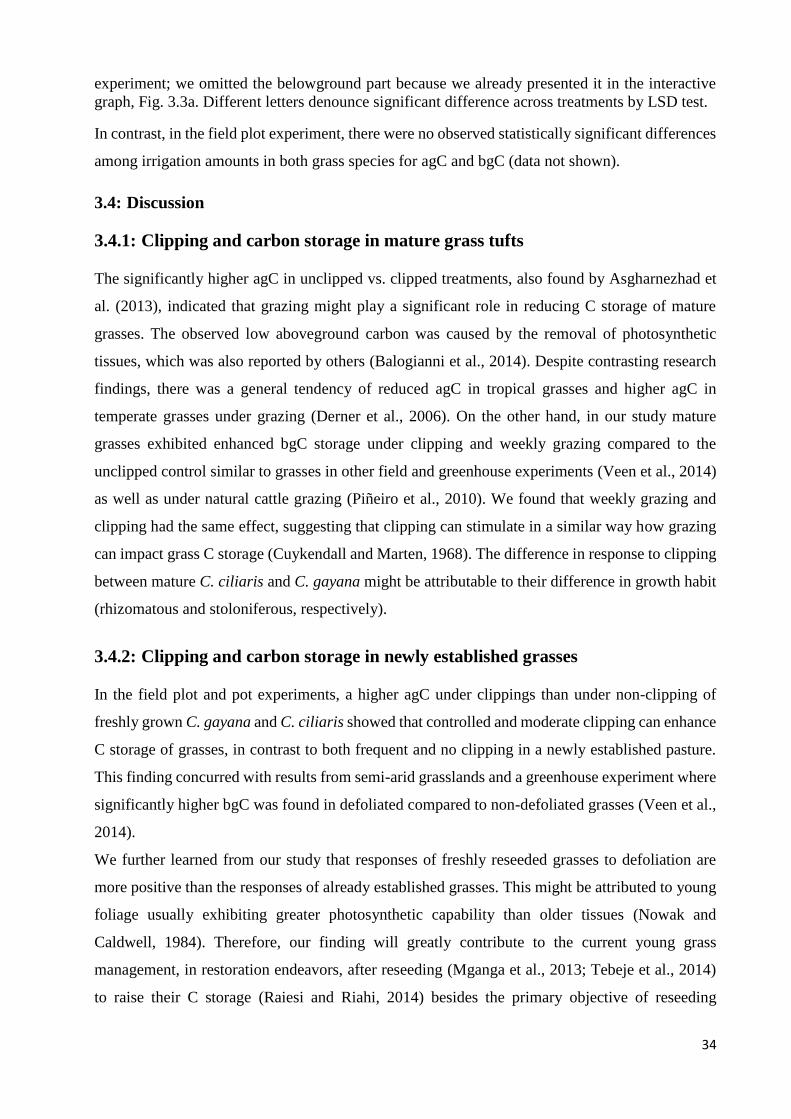
34
experiment; we omitted the belowground part because we already presented it in the interactive
graph, Fig. 3.3a. Different letters denounce significant difference across treatments by LSD test.
In contrast, in the field plot experiment, there were no observed statistically significant differences
among irrigation amounts in both grass species for agC and bgC (data not shown).
3.4: Discussion
3.4.1: Clipping and carbon storage in mature grass tufts
The significantly higher agC in unclipped vs. clipped treatments, also found by Asgharnezhad et
al. (2013), indicated that grazing might play a significant role in reducing C storage of mature
grasses. The observed low aboveground carbon was caused by the removal of photosynthetic
tissues, which was also reported by others (Balogianni et al., 2014). Despite contrasting research
findings, there was a general tendency of reduced agC in tropical grasses and higher agC in
temperate grasses under grazing (Derner et al., 2006). On the other hand, in our study mature
grasses exhibited enhanced bgC storage under clipping and weekly grazing compared to the
unclipped control similar to grasses in other field and greenhouse experiments (Veen et al., 2014)
as well as under natural cattle grazing (Piñeiro et al., 2010). We found that weekly grazing and
clipping had the same effect, suggesting that clipping can stimulate in a similar way how grazing
can impact grass C storage (Cuykendall and Marten, 1968). The difference in response to clipping
between mature C. ciliaris and C. gayana might be attributable to their difference in growth habit
(rhizomatous and stoloniferous, respectively).
3.4.2: Clipping and carbon storage in newly established grasses
In the field plot and pot experiments, a higher agC under clippings than under non-clipping of
freshly grown C. gayana and C. ciliaris showed that controlled and moderate clipping can enhance
C storage of grasses, in contrast to both frequent and no clipping in a newly established pasture.
This finding concurred with results from semi-arid grasslands and a greenhouse experiment where
significantly higher bgC was found in defoliated compared to non-defoliated grasses (Veen et al.,
2014).
We further learned from our study that responses of freshly reseeded grasses to defoliation are
more positive than the responses of already established grasses. This might be attributed to young
foliage usually exhibiting greater photosynthetic capability than older tissues (Nowak and
Caldwell, 1984). Therefore, our finding will greatly contribute to the current young grass
management, in restoration endeavors, after reseeding (Mganga et al., 2013; Tebeje et al., 2014)
to raise their C storage (Raiesi and Riahi, 2014) besides the primary objective of reseeding
35
activities, i.e., forage production, which primarily influences the selection of grass species used
for restoration purpose (Mganga et al., 2013).
3.4.3: Responses of carbon to changes in irrigation amount
Irrigation was not significant for both grass species in field plot experiments. This might be
attributed to horizontal and vertical seepage of water out of the field plots which was not an artifact
in the pot experiments. The lower irrigation values that reduced agC and bgC of both grass species
in the pot experiments showed that rainfall plays an overriding role in determining C storage of
grasses in semi-arid environments. The lower irrigation, a trend similar to the predicted drought
scenario for eastern Africa in the face of climate change (Sheffield and Wood, 2008), led to lower
C in grass shoots and roots in our study. This result implies that under drought conditions grazing
seems less important for C storage of grasses, as was also found by Habtemicael et al. (2014) and
Martin et al. (2014). The drought has been known to strongly constrain livestock production in the
Borana rangelands (Solomon et al., 2007). Reducing cattle numbers before drought strikes would
help grasses to easily recover in the following rainy season and would further prevent losing
animals due to starvation.
3.4.4: Combined effects of clipping and irrigation
The significant interactions between clipping and irrigation for bgC suggested that lower grazing
pressure can enhance bgC under average or above average rainfall, but not under low rainfall
conditions (Oba et al., 2000). Drought-induced morphological, physiological and biochemical
changes in plants result from reduced CO2 assimilation rates due to low stomatal conductance
(Anjum et al., 2011). Further, the significantly higher bgC at above average rainfall amounts in
the clipped compared to the unclipped C. gayana treatment indicated that under controlled grazing
a high rainfall amount will play a great role in enhancing the C storage of grasses. This might be
an opportunity for east African regions where higher rainfall is predicted under the future climate
change scenarios (Christensen et al., 2007).
Therefore, future grazing management should consider resting of grazing areas for better C storage
in the belowground parts of grasses, which plays a more relevant role than aboveground biomass
in mitigating climate change since more than 90% of organic C in grassland is primarily
contributed by roots (Piñeiro et al., 2010). Generally, all OC found in the soil mainly derives from
plant debris (Kuzyakov and Domanski, 2000) and plant roots are the primary contributors (Piñeiro
et al., 2010). Hence, a change of degraded lands to perennial grassland through restoration
activities, such as reseeding and better management afterwards, can greatly contribute to C storage
(Tennigkeit and Wilkes, 2008). This implies that grasslands are important C sinks since they can
36
reduce the unprecedented increase of CO2 in the atmosphere and thus mitigate climate change
effects (Acharya et al., 2012). The rate of rangeland recovery from degradation tends to
proportionally increase the grassland productivity, which implies that sound management practices
are essential to realizing fewer C losses (Paustian et al., 1997). The strategies for rangelands should
focus on managing the degraded areas by reseeding with perennial grasses (Mapfumo et al., 2002),
which are suitable for dry environments (Preger et al., 2010; Ruppert et al., 2015). Knowledge of
the major drivers of individual-level grass response is important (Zimmermann et al., 2015)
because species level response is essential for understanding community level response (Jobbágy
and Sala, 2000). Hence, information generated in our research is useful in order to understand
responses of grasses to grazing under variable rainfall. Further, the two grass species have global
distribution and hence their management would have widespread implications (Boonman, 1993;
Marshall et al., 2012). Generally, such local activities have a global impact in the face of climate
change in view of the fact that degraded areas are potential for carbon sink due to their worldwide
size (Nosetto et al., 2006).
We observed contrasting results in grass C storage between mature and young grasses. Such
variation might be attributed to the capability of young foliage to exhibit greater photosynthesis
and, thus, greater carbon storage than older tissues. Hence, rangeland management should be based
on the age of grasses for better C storage of grasses. Frequent grazing can significantly hamper
agC storage in mature C. ciliaris and C. gayana while light to moderate grazing can stimulate agC
and bgC in newly established pastures. Our findings have important implications for the
management of grasslands of different ages in areas such as Borana rangelands, where the grass
species tested are recommended for restoration of degraded rangelands. Our study showed that the
C storage of grasses was overridden by frequent grazing when rainfall was high. Hence, a resting
period is recommended for years with increased rainfall for better carbon storage of the study
species. Therefore, long-term practiced exclosures and reseeding of degraded areas should be
lightly and moderately clipped or grazed to enhance the overall C storage of the rangelands when
grasses are young. Such grazing management will improve rangelands as CO2 sinks and mitigate
climate change. Therefore, appropriate grazing management (moderate and light grazing) is
needed to foster the capacity of grasses to store more C after reseeding degraded rangelands.
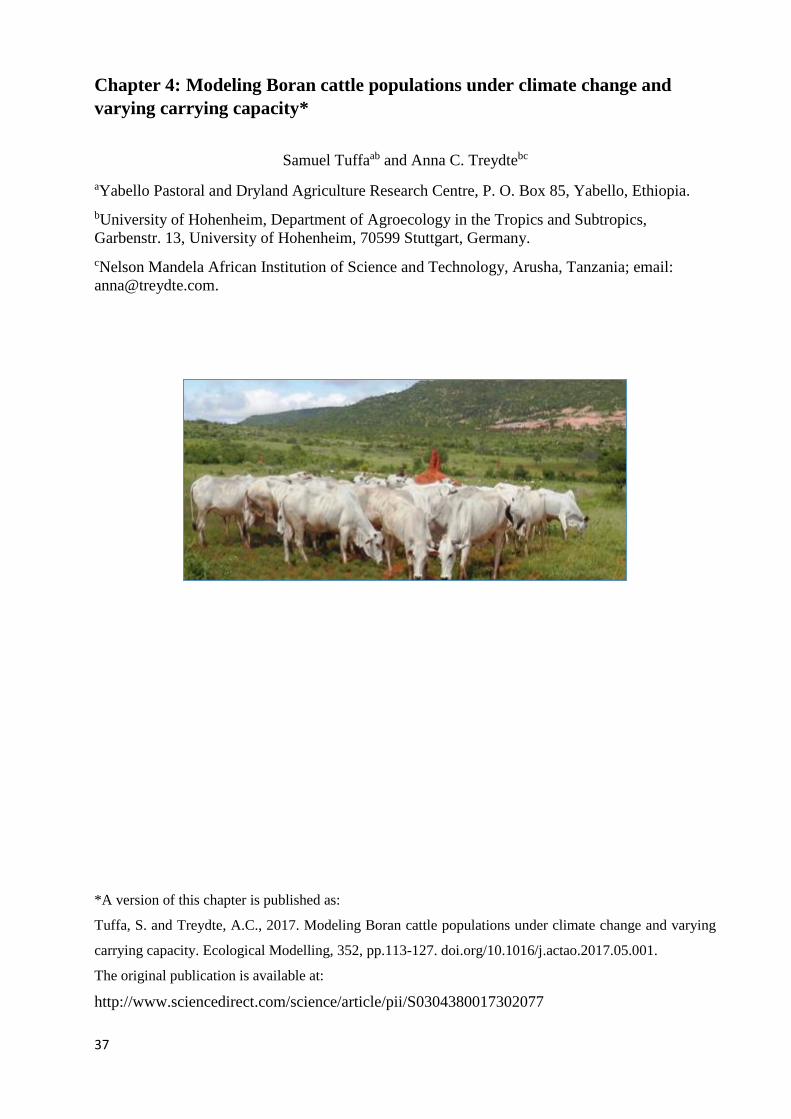
37
Chapter 4: Modeling Boran cattle populations under climate change and
varying carrying capacity*
Samuel Tuffaab and Anna C. Treydtebc
aYabello Pastoral and Dryland Agriculture Research Centre, P. O. Box 85, Yabello, Ethiopia.
bUniversity of Hohenheim, Department of Agroecology in the Tropics and Subtropics,
Garbenstr. 13, University of Hohenheim, 70599 Stuttgart, Germany.
cNelson Mandela African Institution of Science and Technology, Arusha, Tanzania; email:
*A version of this chapter is published as:
Tuffa, S. and Treydte, A.C., 2017. Modeling Boran cattle populations under climate change and varying
carrying capacity. Ecological Modelling, 352, pp.113-127. doi.org/10.1016/j.actao.2017.05.001.
The original publication is available at:
http://www.sciencedirect.com/science/article/pii/S0304380017302077
38
Abstract
Cattle populations in semiarid rangelands are currently facing severe threats due to erratic rainfall
and increasing drought frequencies, leading to poor vegetation quality and a consecutive cattle
population decline. However, little is known about how particular sex- and age-cohorts of cattle
respond to these environmental threats and on how sales influence population trajectories. In the
Borana rangelands, southern Ethiopia, much detailed information is available on the Boran cattle
(Bos indicus) population demographics, a special breed, which is highly adapted to semiarid
environmental conditions. We collected data on Boran cattle demographic and environmental
factors such as carrying capacity, market values, and herders´ management decisions. We
generated stochastic models and assessed the future development of cattle population trajectories
under four different drought scenarios. We analyzed changes in age- and sex-cohorts of cattle
populations by introducing different drought frequencies and their effect on vital rates, carrying
capacity, and sales. We calibrated the model on the basis of a 12-year data set of a neighboring
Boran cattle group. In our population model, the cattle numbers significantly declined after 18
years under the higher drought frequency scenarios (scenarios 3 and 4) while numbers remained
high over 100 years for the lower drought frequency scenarios 1 and 2. The sale of senescent and
adult females most strongly (77%) affected population trajectories, and model outcomes were most
sensitive to sale rates of senescent, adult, and juvenile females compared to vital rates and male
sale rates of the population. Management should focus on lowering herd crashes through
increasing sale of mature males, which increases feed availability to females during drought years
in the Ethiopian Rangelands. Drought early-warning systems and market information must be
strengthened so that pre-planned selling of cattle can be realized for a sustainable use of the animal
resource.
Keywords: drought scenario; demographic stochasticity; population trajectory; Ethiopia;
livestock; rangeland.
4.1: Introduction
4.1.1: The Boran cattle and their habitat
About 58% of sub-Saharan Africa’s cattle population is found in eastern Africa, the largest number
of which is within Ethiopia, with 56.7 million head of cattle (CSA, 2015; Otte and Chilonda, 2002).
Cattle production plays a significant role in Ethiopia’s economy, contributing to about 40% of the
annual agricultural output and 15% of the gross domestic product (Haile et al., 2011). The Boran
cattle, which are grouped under the East African shorthorn cattle known as zebu (Bos indicus),
inhabit the Borana plateau of southern Ethiopia, semiarid and arid lands of northern and rift valley
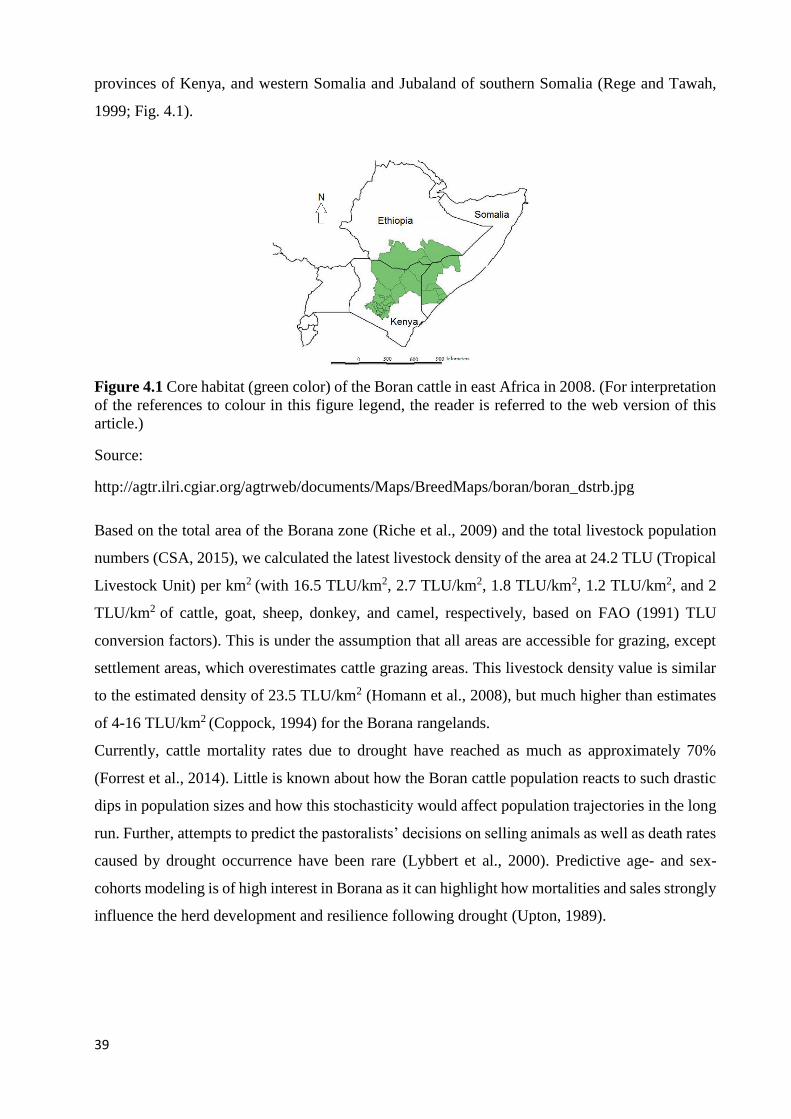
39
provinces of Kenya, and western Somalia and Jubaland of southern Somalia (Rege and Tawah,
1999; Fig. 4.1).
Figure 4.1 Core habitat (green color) of the Boran cattle in east Africa in 2008. (For interpretation
of the references to colour in this figure legend, the reader is referred to the web version of this
article.)
Source:
http://agtr.ilri.cgiar.org/agtrweb/documents/Maps/BreedMaps/boran/boran_dstrb.jpg
Based on the total area of the Borana zone (Riche et al., 2009) and the total livestock population
numbers (CSA, 2015), we calculated the latest livestock density of the area at 24.2 TLU (Tropical
Livestock Unit) per km2 (with 16.5 TLU/km2, 2.7 TLU/km2, 1.8 TLU/km2, 1.2 TLU/km2, and 2
TLU/km2 of cattle, goat, sheep, donkey, and camel, respectively, based on FAO (1991) TLU
conversion factors). This is under the assumption that all areas are accessible for grazing, except
settlement areas, which overestimates cattle grazing areas. This livestock density value is similar
to the estimated density of 23.5 TLU/km2 (Homann et al., 2008), but much higher than estimates
of 4-16 TLU/km2 (Coppock, 1994) for the Borana rangelands.
Currently, cattle mortality rates due to drought have reached as much as approximately 70%
(Forrest et al., 2014). Little is known about how the Boran cattle population reacts to such drastic
dips in population sizes and how this stochasticity would affect population trajectories in the long
run. Further, attempts to predict the pastoralists’ decisions on selling animals as well as death rates
caused by drought occurrence have been rare (Lybbert et al., 2000). Predictive age- and sex-
cohorts modeling is of high interest in Borana as it can highlight how mortalities and sales strongly
influence the herd development and resilience following drought (Upton, 1989).
40
4.1.2: Boran cattle adaptation to their environment and their current threat
The Boran cattle are more productive than other local cattle breeds, with quite high rates of
reproduction, milk yield, and low mortality rates (Cossins and Upton, 1988a). The Boran cattle
are adapted to the arid and semiarid environment of East Africa (Haile et al., 2011), particularly
the semiarid Borana rangelands (Homann et al., 2004). Local herders such as Borana pastoralists
strongly depend on these animals for their daily livelihoods (Coppock, 1994; Kamara et al., 2005;
Zander et al., 2009a; Zander and Drucker, 2008); hence, cattle are the most important livestock
species in the Borana pastoral system of Ethiopia and other semiarid regions (Forrest et al., 2014;
Kahi et al., 2006; Tolera and Abebe, 2007). Boran cattle strongly contribute to the food security
of the rural poor in areas where other agricultural land use systems would not be ecologically
sustainable. However, the total dependency on animals has recently come under threat due to
recurrent drought and human population pressure (Zander et al., 2009b) as well as increased
occupation and privatization of preferred grazing land (Coppock, 1994; Desta and Coppock,
2002). Consequently, Boran cattle have recently undergone drastic population crashes (Angassa
and Oba, 2007), which highlights the fragility and the lack of knowledge of their persistence within
an increasingly unpredictable environment due to climate change. Further, the Boran breed is
under threat from genetic erosion due to the admixture of other breeds that are used for restocking
after drought (Alemayehu et al., 2003). To keep the Boran breed as an essential aspect of a
sustainable animal production system, Zander et al. (2009b) suggested in-situ conservation that
must be initiated to maintain the traditional social structures and their livestock. However, little is
known about the resilience of Boran cattle and their population dynamics in the face of increasing
drought due to climate change (He et al., 2014). Our study wanted to shed light on the population
dynamics of this highly threatened but important breed in the Borana rangelands under different
drought scenarios.
4.1.3: Carrying capacity of the Borana rangelands
Estimation of carrying capacity is an important requirement for understanding the long-term
sustainability of rangelands and the survival probability of the livestock populations inhabiting the
area. The potential carrying capacity is usually determined by the availability (quantity and
quality) of feed and the stocking rate, which provides the maximum sustainable livestock yield
(Eltringham, 1979 cf Fritz & Duncan, 2004). In semiarid rangelands, such as the Borana system,
a fixed carrying capacity as predicted in a stable equilibrium model is unlikely (Gillson and
Hoffman, 2007) because this does not take the spatial heterogeneity and climate variability of
semiarid rangelands into consideration. Hence, equilibrium (density-dependent) models should be
41
replaced by non-equilibrium (density-independent) models as emphasized by rangeland
management today for most semiarid rangelands (Vetter, 2005). The latter employs opportunistic
management strategies and mobility rather than estimating a stable carrying capacity. In low-
rainfall years, primary productivity is limited and animals will compete for the little forage
available (Gillson and Hoffman, 2007). The population cannot persist indefinitely within a certain
environment without density dependence occurring (Godfray, 2009). Understanding stochastic
population dynamics requires an understanding of the relations between density-dependent
(demographic stochasticity) and density-independent (environmental stochasticity) factors.
In semiaid grazing systems, like Borana rangelands, environmental variability has a primary effect
on herbivore population dynamics (Illius and O’Connor, 2000). Mobility and resting of pasture
had been the main strategy used to manage risk and use the range resources communally and
efficiently (Flintan et al., 2011). However, Borana pastoral herd mobility has been weakened
(Homann et al., 2004), which has led to rangeland degradation (Nyangito et al., 2008). A
recommended stocking strategy under variable rainfall must be urgently provided, which can be
achieved by simulation modeling for the current system, assuming no possibility for mobility
(Vetter, 2005). In the Borana rangelands when stocking rates are high, the herd is most vulnerable
to drought-induced mortality (Desta and Coppock, 2002), which can impose even higher damage
to available key plant resource areas (Illius and O’Connor, 1999). The pattern of cattle mortality
has closely followed rainfall variability and drought-induced cattle mortality has been caused by
pre-drought cattle body condition as a result of feed scarcity (Angassa and Oba, 2007; Starfield,
1990).
In such an unstable system, stochastic models will help to predict scenarios in which rainfall
variability could impact population sizes (Otto and Day, 2007). While many population models
take carrying capacity into account, which limits population growth (Schärrer et al., 2014), few
studies have acknowledged the varying nature of a rangeland´s carrying capacity (Campbell et al.,
2006; Walker et al., 1987), depending on environmental factors and increasing herbivore
population pressure (Angassa and Beyene, 2003; Halley and Iwasa, 1998). Hence, there is an
urgent need to quantify and balance available resources and grazing pressure to minimize drought-
induced losses and consecutive rangeland degradation.
4.1.4: The Boran cattle market
The Boran cattle fetch a high price per kg at local markets (Solomon et al., 2003) and have a high
export value, particularly in Middle East countries (ILRI, 2008; Farmer, 2010). Such a high sale
rate affects the future performance of the herd because herd productivity is expressed as the sum
42
of all expected sales (Baptist, 1992). Boran pastoralists are not commercial producers but are rather
forced to sell animals at a low price due to poor body conditions in drought times (Tiki, 2013).
Although drought forces selling of animals due to feed shortages pastoralists hardly sell mature
cows during the non-drought years (Pavanello, 2010). It was shown that it is more efficient if
pastoralists plan marketing of male animals before a drought occurs so that feed availability to the
cows, which play a major role in herd growth (ILCA, 1985), will be guaranteed and a rush to sell
animals during drought periods is prevented (Pavanello, 2010; Tiki, 2013).
4.1.5: The importance of population growth models
Population growth models are useful planning tools for predicting future population structures and
off-takes under different policy options (Upton, 1989). Particularly, for livestock production
systems, models can support current and design future management decisions (Hastings, 1997,
Martin et al., 2014; Upton, 1986). Finding the appropriate level of model complexity is one of the
hardest problems in applying models to managing biological resources (Getz, 1988). Further, the
actual herd-growth process in semiarid areas is highly variable and is, therefore, difficult to
accurately predict (Upton, 1989). Models require detailed studies to analyze how population sizes
are influenced by the random recurrence of drought. In our herd growth model, we captured this
variability by introducing random disturbance as a result of drought events. We used a stochastic
model based on Berkeley Madonna (Macey et al., 2009) to understand the influence of
environmental and demographic stochasticity on a structured cattle population in the Borana
rangelands, southern Ethiopia.
Most population models assume that individuals in a population have equal demographic
characteristics (Lesnoff et al., 2012; Shabb et al., 2013) while many natural populations comprise
individuals with different vital parameters that differently respond to environmental factors such
as drought. So far, no model has been developed considering drought as a random factor
influencing the trajectories of this cattle breed over a continuous time scale. The objectives of this
study, therefore, were to (i) model Boran cattle population dynamics based on three major factors,
namely environmental constraints (i.e., varying carrying capacity), cattle population demography,
and sales, (ii) identify parameters that most strongly influence the population trajectory, based on
sensitivity analyses, and (iii) identify animal classes (age- and sex-cohorts), which should be
targeted during shocks to ensure long-term and sustainable productivity.
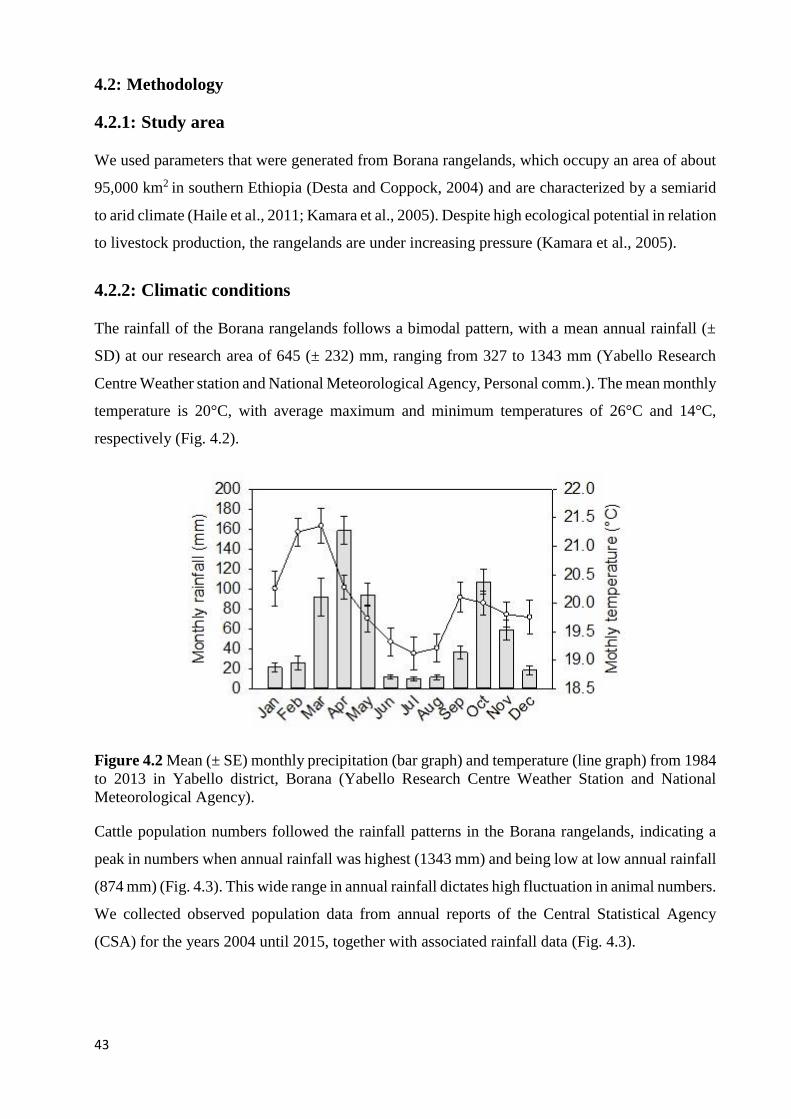
43
4.2: Methodology
4.2.1: Study area
We used parameters that were generated from Borana rangelands, which occupy an area of about
95,000 km2 in southern Ethiopia (Desta and Coppock, 2004) and are characterized by a semiarid
to arid climate (Haile et al., 2011; Kamara et al., 2005). Despite high ecological potential in relation
to livestock production, the rangelands are under increasing pressure (Kamara et al., 2005).
4.2.2: Climatic conditions
The rainfall of the Borana rangelands follows a bimodal pattern, with a mean annual rainfall (±
SD) at our research area of 645 (± 232) mm, ranging from 327 to 1343 mm (Yabello Research
Centre Weather station and National Meteorological Agency, Personal comm.). The mean monthly
temperature is 20°C, with average maximum and minimum temperatures of 26°C and 14°C,
respectively (Fig. 4.2).
Figure 4.2 Mean (± SE) monthly precipitation (bar graph) and temperature (line graph) from 1984
to 2013 in Yabello district, Borana (Yabello Research Centre Weather Station and National
Meteorological Agency).
Cattle population numbers followed the rainfall patterns in the Borana rangelands, indicating a
peak in numbers when annual rainfall was highest (1343 mm) and being low at low annual rainfall
(874 mm) (Fig. 4.3). This wide range in annual rainfall dictates high fluctuation in animal numbers.
We collected observed population data from annual reports of the Central Statistical Agency
(CSA) for the years 2004 until 2015, together with associated rainfall data (Fig. 4.3).
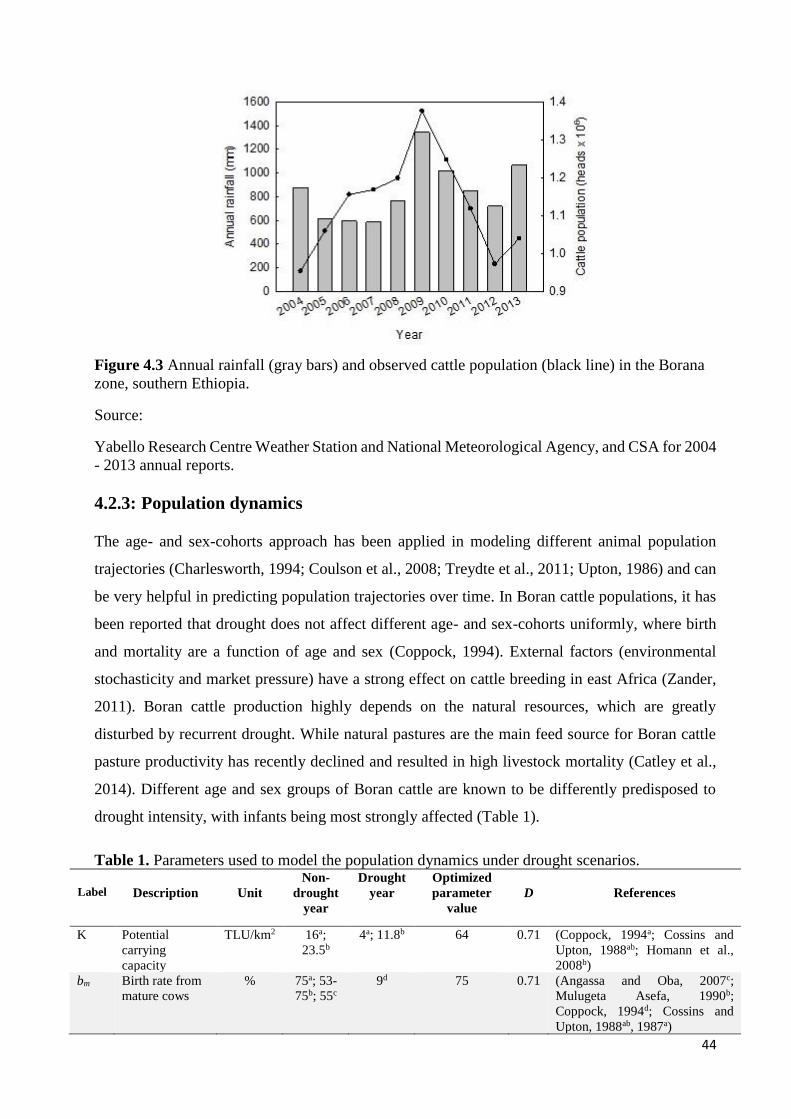
44
Figure 4.3 Annual rainfall (gray bars) and observed cattle population (black line) in the Borana
zone, southern Ethiopia.
Source:
Yabello Research Centre Weather Station and National Meteorological Agency, and CSA for 2004
- 2013 annual reports.
4.2.3: Population dynamics
The age- and sex-cohorts approach has been applied in modeling different animal population
trajectories (Charlesworth, 1994; Coulson et al., 2008; Treydte et al., 2011; Upton, 1986) and can
be very helpful in predicting population trajectories over time. In Boran cattle populations, it has
been reported that drought does not affect different age- and sex-cohorts uniformly, where birth
and mortality are a function of age and sex (Coppock, 1994). External factors (environmental
stochasticity and market pressure) have a strong effect on cattle breeding in east Africa (Zander,
2011). Boran cattle production highly depends on the natural resources, which are greatly
disturbed by recurrent drought. While natural pastures are the main feed source for Boran cattle
pasture productivity has recently declined and resulted in high livestock mortality (Catley et al.,
2014). Different age and sex groups of Boran cattle are known to be differently predisposed to
drought intensity, with infants being most strongly affected (Table 1).
Table 1. Parameters used to model the population dynamics under drought scenarios.
Label
Description
Unit
Non-
drought
year
Drought
year
Optimized
parameter
value
D
References
K Potential
carrying
capacity
TLU/km2 16a;
23.5b
4a; 11.8b 64 0.71 (Coppock, 1994a; Cossins and
Upton, 1988ab; Homann et al.,
2008b)
bm Birth rate from
mature cows
% 75a; 53-
75b; 55c
9d 75 0.71 (Angassa and Oba, 2007c;
Mulugeta Asefa, 1990b;
Coppock, 1994d; Cossins and
Upton, 1988ab, 1987a)
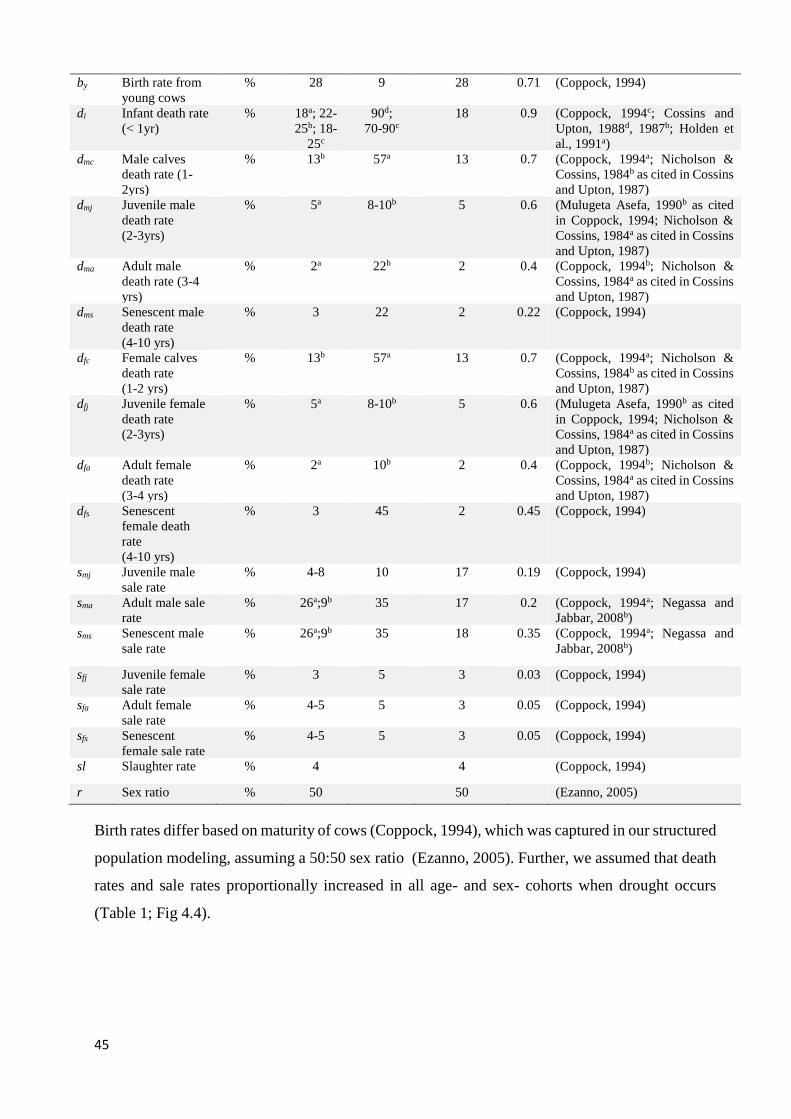
45
by Birth rate from
young cows
% 28 9 28 0.71 (Coppock, 1994)
di Infant death rate
(< 1yr)
% 18a; 22-
25b; 18-
25c
90d;
70-90c
18 0.9 (Coppock, 1994c; Cossins and
Upton, 1988d, 1987b; Holden et
al., 1991a)
dmc Male calves
death rate (1-
2yrs)
% 13b 57a 13 0.7 (Coppock, 1994a; Nicholson &
Cossins, 1984b as cited in Cossins
and Upton, 1987)
dmj Juvenile male
death rate
(2-3yrs)
% 5a 8-10b 5 0.6 (Mulugeta Asefa, 1990b as cited
in Coppock, 1994; Nicholson &
Cossins, 1984a as cited in Cossins
and Upton, 1987)
dma Adult male
death rate (3-4
yrs)
% 2a 22b 2 0.4 (Coppock, 1994b; Nicholson &
Cossins, 1984a as cited in Cossins
and Upton, 1987)
dms Senescent male
death rate
(4-10 yrs)
% 3 22 2 0.22 (Coppock, 1994)
dfc Female calves
death rate
(1-2 yrs)
% 13b 57a 13 0.7 (Coppock, 1994a; Nicholson &
Cossins, 1984b as cited in Cossins
and Upton, 1987)
dfj Juvenile female
death rate
(2-3yrs)
% 5a 8-10b 5 0.6 (Mulugeta Asefa, 1990b as cited
in Coppock, 1994; Nicholson &
Cossins, 1984a as cited in Cossins
and Upton, 1987)
dfa Adult female
death rate
(3-4 yrs)
% 2a 10b 2 0.4 (Coppock, 1994b; Nicholson &
Cossins, 1984a as cited in Cossins
and Upton, 1987)
dfs Senescent
female death
rate
(4-10 yrs)
% 3 45 2 0.45 (Coppock, 1994)
smj Juvenile male
sale rate
% 4-8 10 17 0.19 (Coppock, 1994)
sma Adult male sale
rate
% 26a;9b 35 17 0.2 (Coppock, 1994a; Negassa and
Jabbar, 2008b)
sms Senescent male
sale rate
% 26a;9b 35 18 0.35 (Coppock, 1994a; Negassa and
Jabbar, 2008b)
sfj Juvenile female
sale rate
% 3 5 3 0.03 (Coppock, 1994)
sfa Adult female
sale rate
% 4-5 5 3 0.05 (Coppock, 1994)
sfs Senescent
female sale rate
% 4-5 5 3 0.05 (Coppock, 1994)
sl Slaughter rate % 4
4
(Coppock, 1994)
r Sex ratio % 50
50
(Ezanno, 2005)
Birth rates differ based on maturity of cows (Coppock, 1994), which was captured in our structured
population modeling, assuming a 50:50 sex ratio (Ezanno, 2005). Further, we assumed that death
rates and sale rates proportionally increased in all age- and sex- cohorts when drought occurs
(Table 1; Fig 4.4).
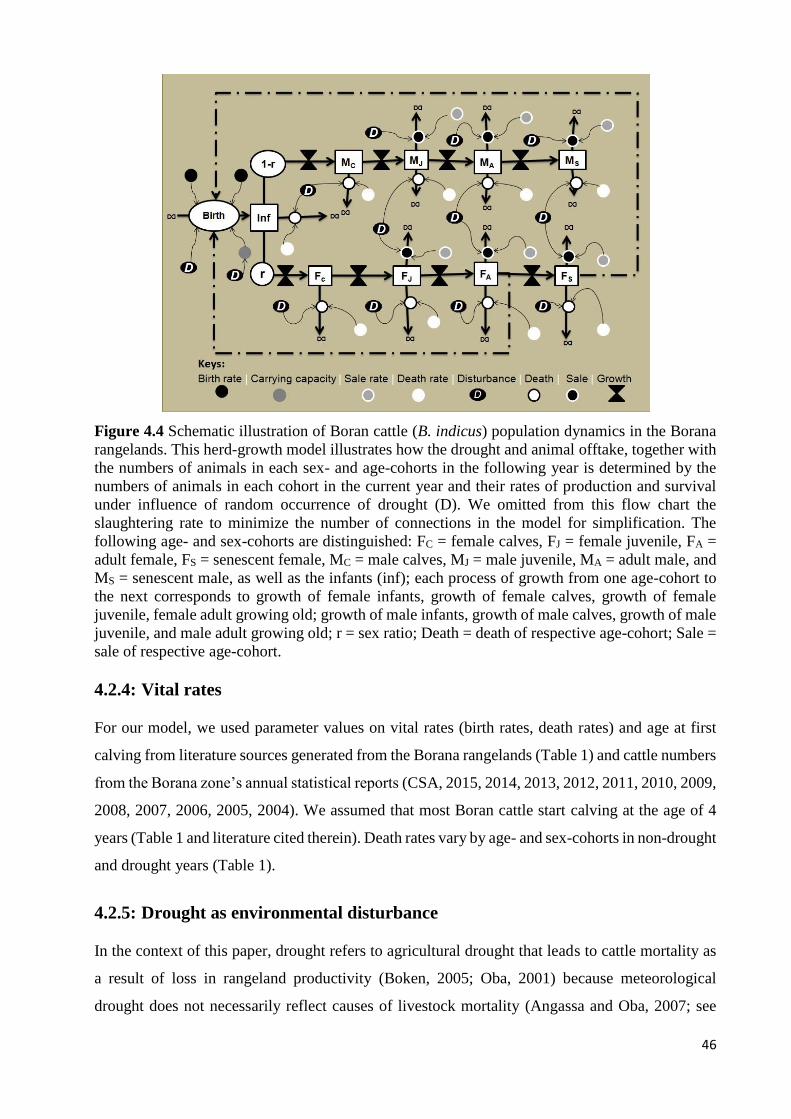
46
Figure 4.4 Schematic illustration of Boran cattle (B. indicus) population dynamics in the Borana
rangelands. This herd-growth model illustrates how the drought and animal offtake, together with
the numbers of animals in each sex- and age-cohorts in the following year is determined by the
numbers of animals in each cohort in the current year and their rates of production and survival
under influence of random occurrence of drought (D). We omitted from this flow chart the
slaughtering rate to minimize the number of connections in the model for simplification. The
following age- and sex-cohorts are distinguished: FC = female calves, FJ = female juvenile, FA =
adult female, FS = senescent female, MC = male calves, MJ = male juvenile, MA = adult male, and
MS = senescent male, as well as the infants (inf); each process of growth from one age-cohort to
the next corresponds to growth of female infants, growth of female calves, growth of female
juvenile, female adult growing old; growth of male infants, growth of male calves, growth of male
juvenile, and male adult growing old; r = sex ratio; Death = death of respective age-cohort; Sale =
sale of respective age-cohort.
4.2.4: Vital rates
For our model, we used parameter values on vital rates (birth rates, death rates) and age at first
calving from literature sources generated from the Borana rangelands (Table 1) and cattle numbers
from the Borana zone’s annual statistical reports (CSA, 2015, 2014, 2013, 2012, 2011, 2010, 2009,
2008, 2007, 2006, 2005, 2004). We assumed that most Boran cattle start calving at the age of 4
years (Table 1 and literature cited therein). Death rates vary by age- and sex-cohorts in non-drought
and drought years (Table 1).
4.2.5: Drought as environmental disturbance
In the context of this paper, drought refers to agricultural drought that leads to cattle mortality as
a result of loss in rangeland productivity (Boken, 2005; Oba, 2001) because meteorological
drought does not necessarily reflect causes of livestock mortality (Angassa and Oba, 2007; see
47
also Fig. 4.3). There should be at least two consecutive meteorological droughts for agricultural
drought to happen in the Borana rangelands (Coppock, 1994). Therefore, in our model, we
randomly injected the disturbance at different frequencies in a continuous time scale, i.e., as a
pulse in Berkeley Madonna, based on mean of drought frequency as random factors with standard
deviation. This pulse increases or decreases population size (during non-drought and drought
years, respectively), occurring randomly, initiated on a fixed time (5 years) when the first drought
hits the population (Macey et al., 2009). Drought affected population trajectories through various
model parameters (Table 2, equations 1.10, 1.19 - 1.27, and 1.29 - 1.34; Fig. 4.4) as such selling
events. We introduced each drought scenario separately as a normally distributed random factor
with mean μ and standard deviation SD, N(μ, SD), to the model in continuous time scale as a
pulse in Berkeley Madonna packages (Macey et al., 2009; Table 2, Equations 1.36-1.53) in such
a way that it creates boom-and-bust to population size (Desta and Coppock, 2002). The mean and
standard deviation, (μ,SD), of drought scenarios 1, 2, 3, and 4 were (20,15), (15,11.25), (10,7.50),
and (5,3.75), respectively. In each run, the first disturbance occurred at year 5 under all scenarios
so that results from each scenario run were comparable and hence 99 out of 100 runs had drought
occurring at a random interval (Macey et al., 2009) per each scenario. The disturbance to carrying
capacity was introduced as D_K = pulse(K*D,5,Random_factor) where K*D is the volume
reduced during drought events with an optimized value (calibrated value) of carrying capacity (K)
and disturbance (D) in Table 1; 5 is the first pulse at year 5; and Random_factor is the repeated
interval or drought frequency (Table 2, Equation 1.53). We ran our model under various scenarios,
altering the frequency of drought occurrence (Coppock, 1994; Homann et al., 2003; Solomon et
al., 2007).
In semiarid environments, drought is a common cause of herbivore mortality (Ellis and Swift,
1988). Our drought frequencies were based on the assumption that drought frequencies will
increase in the future due to climate change according to the trend for Ethiopia’s agricultural
drought years from 1965 to 2013 (Masih et al., 2014; Fig. 4.5).
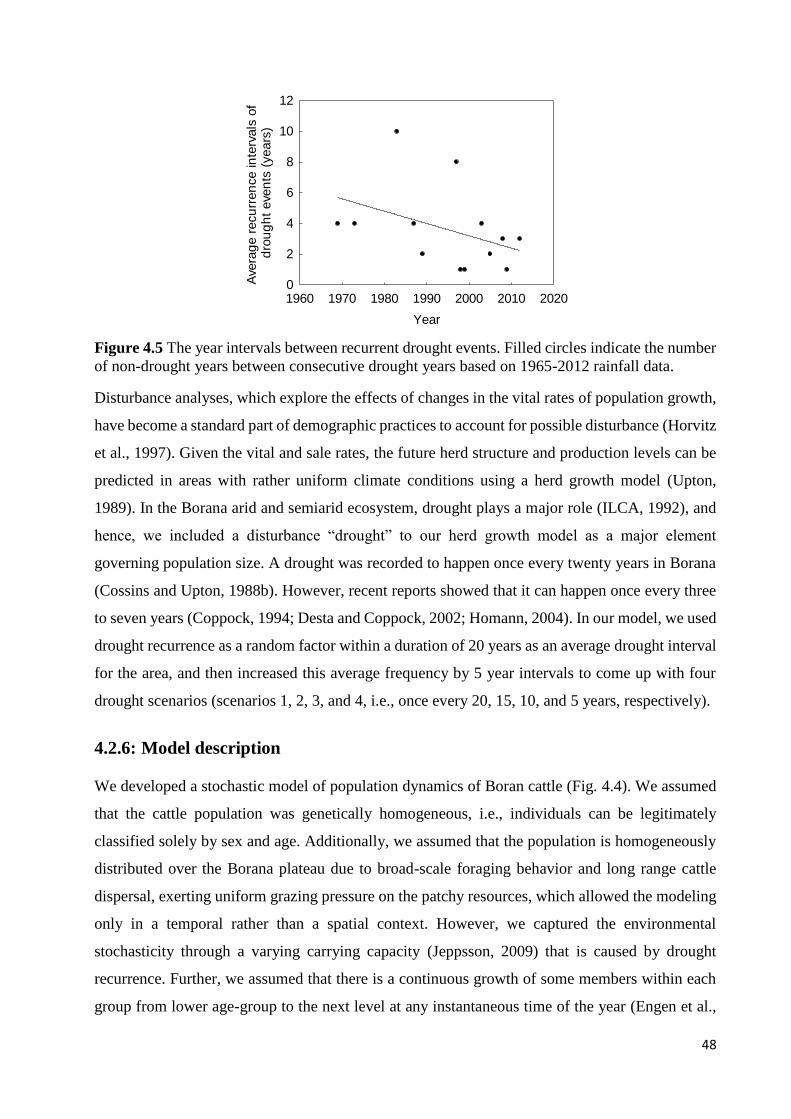
48
Year
1960 1970 1980 1990 2000 2010 2020
Ave
rag
e r
ecu
rren
ce in
terv
als
of
d
rou
gh
t eve
nts
(years
)
0
2
4
6
8
10
12
Figure 4.5 The year intervals between recurrent drought events. Filled circles indicate the number
of non-drought years between consecutive drought years based on 1965-2012 rainfall data.
Disturbance analyses, which explore the effects of changes in the vital rates of population growth,
have become a standard part of demographic practices to account for possible disturbance (Horvitz
et al., 1997). Given the vital and sale rates, the future herd structure and production levels can be
predicted in areas with rather uniform climate conditions using a herd growth model (Upton,
1989). In the Borana arid and semiarid ecosystem, drought plays a major role (ILCA, 1992), and
hence, we included a disturbance “drought” to our herd growth model as a major element
governing population size. A drought was recorded to happen once every twenty years in Borana
(Cossins and Upton, 1988b). However, recent reports showed that it can happen once every three
to seven years (Coppock, 1994; Desta and Coppock, 2002; Homann, 2004). In our model, we used
drought recurrence as a random factor within a duration of 20 years as an average drought interval
for the area, and then increased this average frequency by 5 year intervals to come up with four
drought scenarios (scenarios 1, 2, 3, and 4, i.e., once every 20, 15, 10, and 5 years, respectively).
4.2.6: Model description
We developed a stochastic model of population dynamics of Boran cattle (Fig. 4.4). We assumed
that the cattle population was genetically homogeneous, i.e., individuals can be legitimately
classified solely by sex and age. Additionally, we assumed that the population is homogeneously
distributed over the Borana plateau due to broad-scale foraging behavior and long range cattle
dispersal, exerting uniform grazing pressure on the patchy resources, which allowed the modeling
only in a temporal rather than a spatial context. However, we captured the environmental
stochasticity through a varying carrying capacity (Jeppsson, 2009) that is caused by drought
recurrence. Further, we assumed that there is a continuous growth of some members within each
group from lower age-group to the next level at any instantaneous time of the year (Engen et al.,
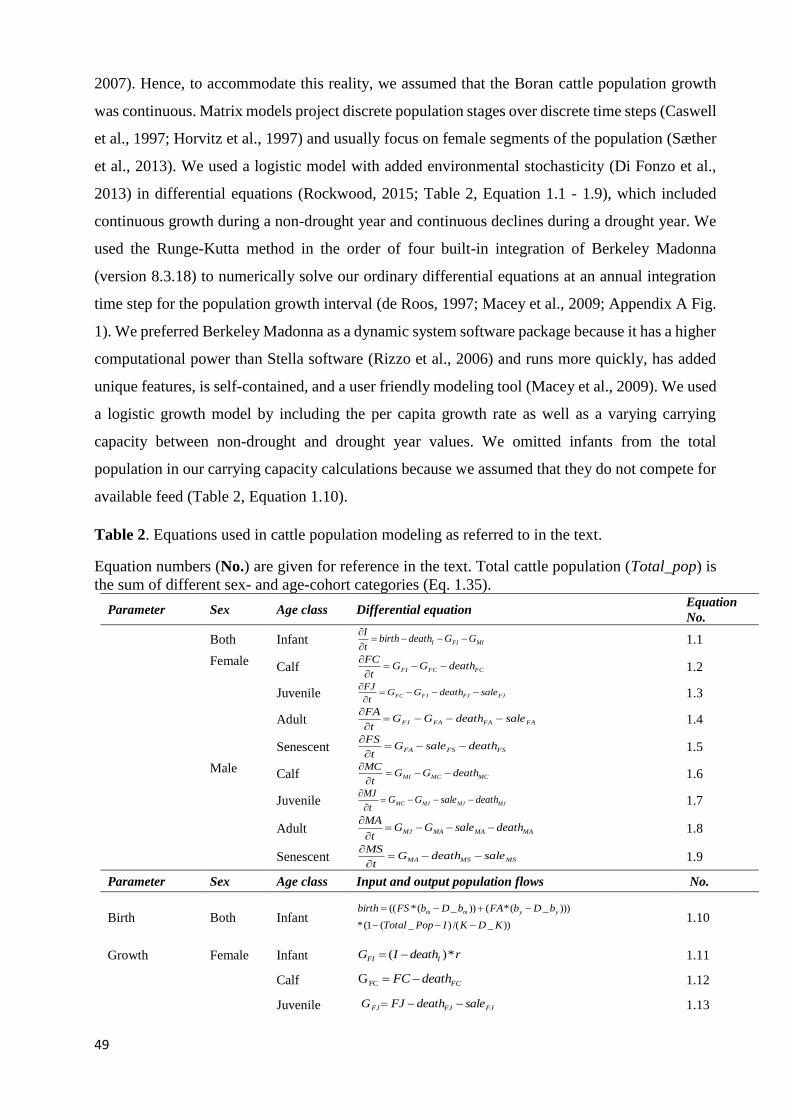
49
2007). Hence, to accommodate this reality, we assumed that the Boran cattle population growth
was continuous. Matrix models project discrete population stages over discrete time steps (Caswell
et al., 1997; Horvitz et al., 1997) and usually focus on female segments of the population (Sæther
et al., 2013). We used a logistic model with added environmental stochasticity (Di Fonzo et al.,
2013) in differential equations (Rockwood, 2015; Table 2, Equation 1.1 - 1.9), which included
continuous growth during a non-drought year and continuous declines during a drought year. We
used the Runge-Kutta method in the order of four built-in integration of Berkeley Madonna
(version 8.3.18) to numerically solve our ordinary differential equations at an annual integration
time step for the population growth interval (de Roos, 1997; Macey et al., 2009; Appendix A Fig.
1). We preferred Berkeley Madonna as a dynamic system software package because it has a higher
computational power than Stella software (Rizzo et al., 2006) and runs more quickly, has added
unique features, is self-contained, and a user friendly modeling tool (Macey et al., 2009). We used
a logistic growth model by including the per capita growth rate as well as a varying carrying
capacity between non-drought and drought year values. We omitted infants from the total
population in our carrying capacity calculations because we assumed that they do not compete for
available feed (Table 2, Equation 1.10).
Table 2. Equations used in cattle population modeling as referred to in the text.
Equation numbers (No.) are given for reference in the text. Total cattle population (Total_pop) is
the sum of different sex- and age-cohort categories (Eq. 1.35).
Parameter Sex Age class Differential equation Equation
No.
Both Infant MIFII GGdeathbirth
t
I
1.1
Female
Calf FCFCFI deathGGt
FC
1.2
Juvenile FJFJFJFC saledeathGG
t
FJ
1.3
Adult FAFAFAFJ saledeathGG
t
FA
1.4
Senescent FSFSFA deathsaleG
t
FS
1.5
Male Calf MCMCMI deathGG
t
MC
1.6
Juvenile MJMJMJMC deathsaleGG
t
MJ
1.7
Adult MAMAMAMJ deathsaleGG
t
MA
1.8
Senescent MSMSMA saledeathG
t
MS
1.9
Parameter Sex Age class Input and output population flows No.
Birth Both Infant ))_/()_(1(*
)))_(*())_(*((
KDKIPopTotal
bDbFAbDbFSbirth yymm
1.10
Growth Female Infant rdeathIG IFI *)( 1.11
Calf FCdeathFC FCG 1.12
Juvenile FJFJFJ saledeathFJG 1.13
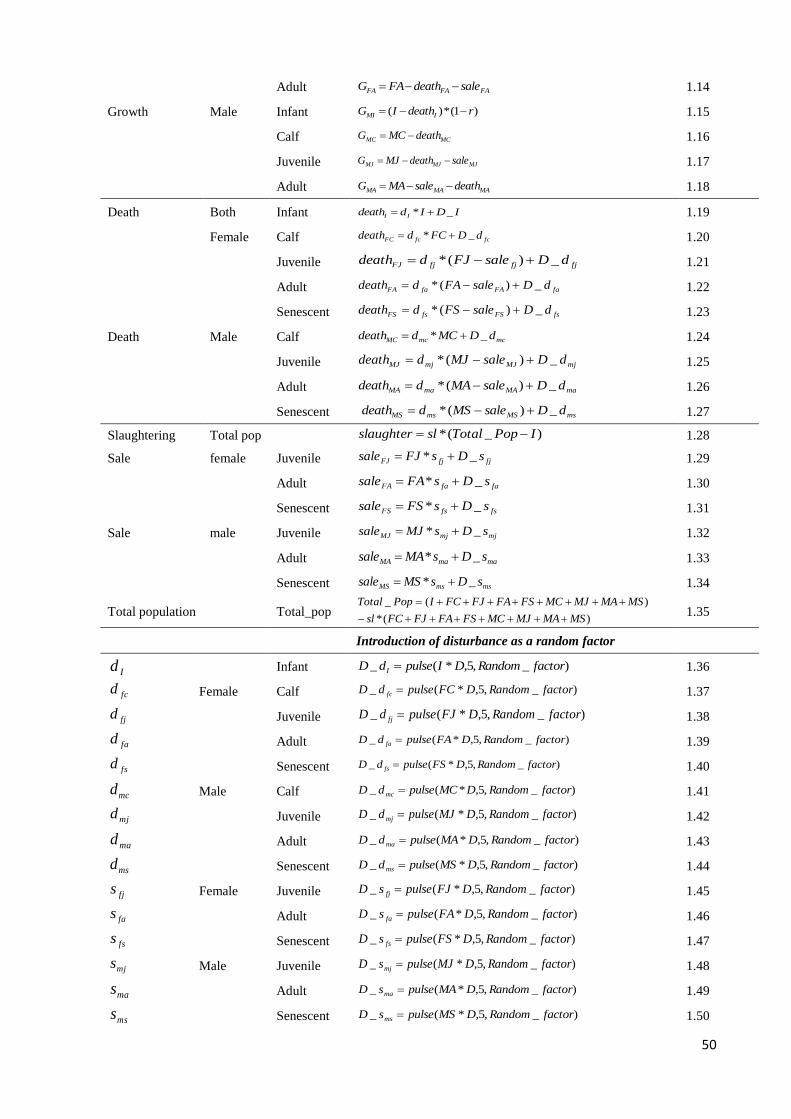
50
Adult FAFAFA saledeathFAG 1.14
Growth Male Infant )1(*)( rdeathIG IMI 1.15
Calf MCMC deathMCG 1.16
Juvenile MJMJMJ saledeathMJG 1.17
Adult MAMAMA deathsaleMAG 1.18
Death Both Infant IDIddeath II _* 1.19
Female Calf fcfcFC dDFCddeath _* 1.20
Juvenile fjfjfjFJ dDsaleFJddeath _)(* 1.21
Adult faFAfaFA dDsaleFAddeath _)(* 1.22
Senescent fsFSfsFS dDsaleFSddeath _)(* 1.23
Death Male Calf mcmcMC dDMCddeath _* 1.24
Juvenile mjMJmjMJ dDsaleMJddeath _)(* 1.25
Adult maMAmaMA dDsaleMAddeath _)(* 1.26
Senescent msMSmsMS dDsaleMSddeath _)(* 1.27
Slaughtering Total pop )_(* IPopTotalslslaughter 1.28
Sale female Juvenile fjfjFJ sDsFJsale _* 1.29
Adult fafaFA sDsFAsale _* 1.30
Senescent fsfsFS sDsFSsale _* 1.31
Sale male Juvenile mjmjMJ sDsMJsale _* 1.32
Adult mamaMA sDsMAsale _* 1.33
Senescent msmsMS sDsMSsale _* 1.34
Total population Total_pop )(*
)(_
MSMAMJMCFSFAFJFCsl
MSMAMJMCFSFAFJFCIPopTotal
1.35
Introduction of disturbance as a random factor
Id Infant )_,5,*(_ factorRandomDIpulsedD I 1.36
fcd Female Calf )_,5,*(_ factorRandomDFCpulsedD fc 1.37
fjd Juvenile )_,5,*(_ factorRandomDFJpulsedD fj 1.38
fad Adult )_,5,*(_ factorRandomDFApulsedD fa 1.39
fsd Senescent )_,5,*(_ factorRandomDFSpulsedD fs 1.40
mcd Male Calf )_,5,*(_ factorRandomDMCpulsedD mc 1.41
mjd Juvenile )_,5,*(_ factorRandomDMJpulsedD mj 1.42
mad Adult )_,5,*(_ factorRandomDMApulsedD ma 1.43
msd Senescent )_,5,*(_ factorRandomDMSpulsedD ms 1.44
fjs Female Juvenile )_,5,*(_ factorRandomDFJpulsesD fj 1.45
fas Adult )_,5,*(_ factorRandomDFApulsesD fa 1.46
fss Senescent )_,5,*(_ factorRandomDFSpulsesD fs 1.47
mjs Male Juvenile )_,5,*(_ factorRandomDMJpulsesD mj 1.48
mas Adult )_,5,*(_ factorRandomDMApulsesD ma 1.49
mss Senescent )_,5,*(_ factorRandomDMSpulsesD ms 1.50
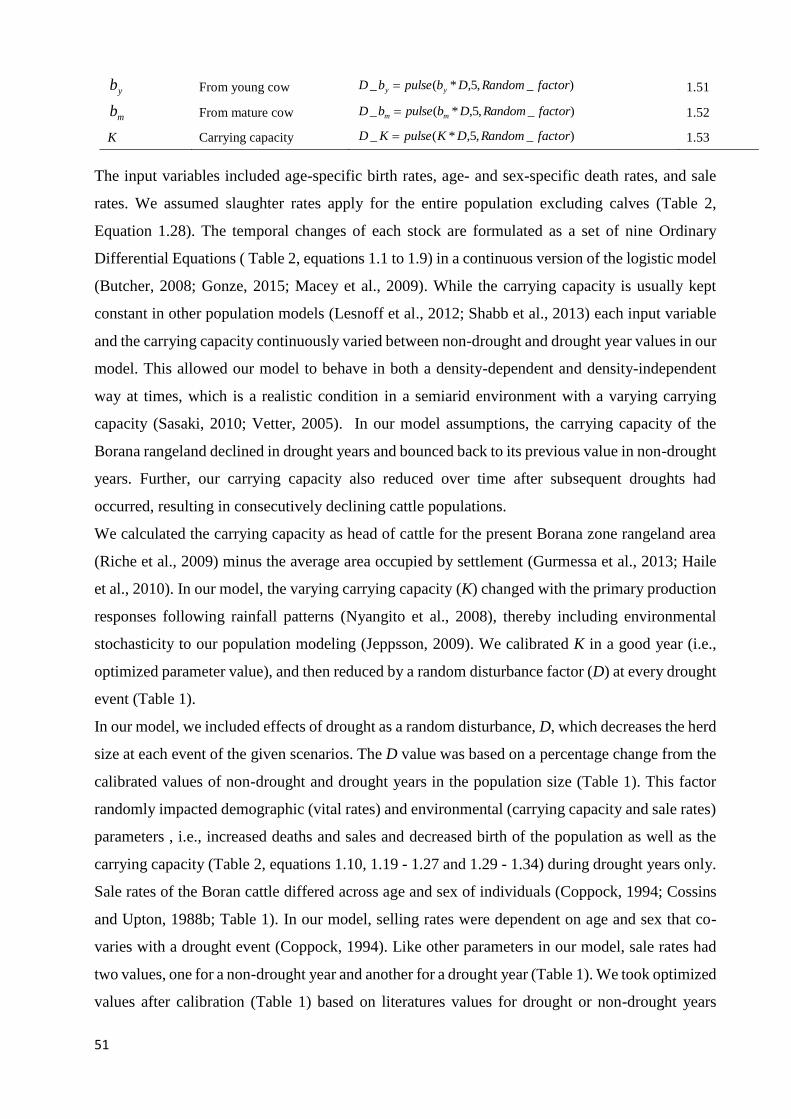
51
yb From young cow )_,5,*(_ factorRandomDbpulsebD yy 1.51
mb From mature cow )_,5,*(_ factorRandomDbpulsebD mm 1.52
K Carrying capacity )_,5,*(_ factorRandomDKpulseKD 1.53
The input variables included age-specific birth rates, age- and sex-specific death rates, and sale
rates. We assumed slaughter rates apply for the entire population excluding calves (Table 2,
Equation 1.28). The temporal changes of each stock are formulated as a set of nine Ordinary
Differential Equations ( Table 2, equations 1.1 to 1.9) in a continuous version of the logistic model
(Butcher, 2008; Gonze, 2015; Macey et al., 2009). While the carrying capacity is usually kept
constant in other population models (Lesnoff et al., 2012; Shabb et al., 2013) each input variable
and the carrying capacity continuously varied between non-drought and drought year values in our
model. This allowed our model to behave in both a density-dependent and density-independent
way at times, which is a realistic condition in a semiarid environment with a varying carrying
capacity (Sasaki, 2010; Vetter, 2005). In our model assumptions, the carrying capacity of the
Borana rangeland declined in drought years and bounced back to its previous value in non-drought
years. Further, our carrying capacity also reduced over time after subsequent droughts had
occurred, resulting in consecutively declining cattle populations.
We calculated the carrying capacity as head of cattle for the present Borana zone rangeland area
(Riche et al., 2009) minus the average area occupied by settlement (Gurmessa et al., 2013; Haile
et al., 2010). In our model, the varying carrying capacity (K) changed with the primary production
responses following rainfall patterns (Nyangito et al., 2008), thereby including environmental
stochasticity to our population modeling (Jeppsson, 2009). We calibrated K in a good year (i.e.,
optimized parameter value), and then reduced by a random disturbance factor (D) at every drought
event (Table 1).
In our model, we included effects of drought as a random disturbance, D, which decreases the herd
size at each event of the given scenarios. The D value was based on a percentage change from the
calibrated values of non-drought and drought years in the population size (Table 1). This factor
randomly impacted demographic (vital rates) and environmental (carrying capacity and sale rates)
parameters , i.e., increased deaths and sales and decreased birth of the population as well as the
carrying capacity (Table 2, equations 1.10, 1.19 - 1.27 and 1.29 - 1.34) during drought years only.
Sale rates of the Boran cattle differed across age and sex of individuals (Coppock, 1994; Cossins
and Upton, 1988b; Table 1). In our model, selling rates were dependent on age and sex that co-
varies with a drought event (Coppock, 1994). Like other parameters in our model, sale rates had
two values, one for a non-drought year and another for a drought year (Table 1). We took optimized
values after calibration (Table 1) based on literatures values for drought or non-drought years
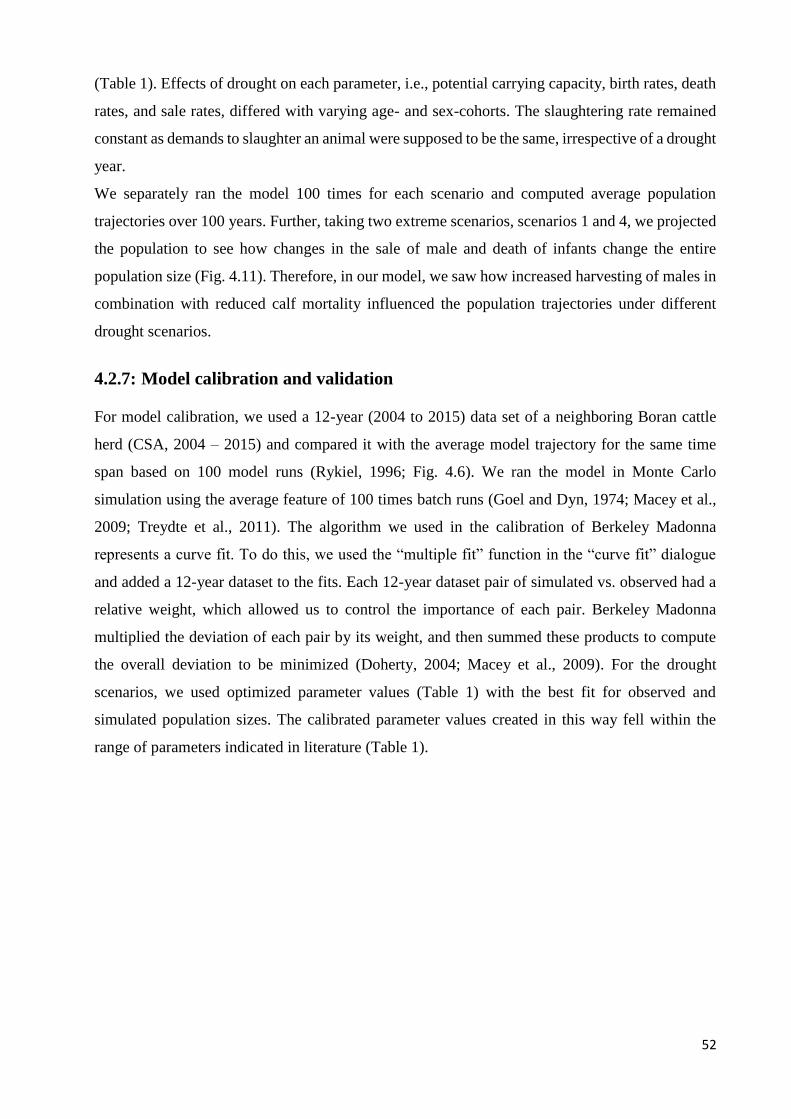
52
(Table 1). Effects of drought on each parameter, i.e., potential carrying capacity, birth rates, death
rates, and sale rates, differed with varying age- and sex-cohorts. The slaughtering rate remained
constant as demands to slaughter an animal were supposed to be the same, irrespective of a drought
year.
We separately ran the model 100 times for each scenario and computed average population
trajectories over 100 years. Further, taking two extreme scenarios, scenarios 1 and 4, we projected
the population to see how changes in the sale of male and death of infants change the entire
population size (Fig. 4.11). Therefore, in our model, we saw how increased harvesting of males in
combination with reduced calf mortality influenced the population trajectories under different
drought scenarios.
4.2.7: Model calibration and validation
For model calibration, we used a 12-year (2004 to 2015) data set of a neighboring Boran cattle
herd (CSA, 2004 – 2015) and compared it with the average model trajectory for the same time
span based on 100 model runs (Rykiel, 1996; Fig. 4.6). We ran the model in Monte Carlo
simulation using the average feature of 100 times batch runs (Goel and Dyn, 1974; Macey et al.,
2009; Treydte et al., 2011). The algorithm we used in the calibration of Berkeley Madonna
represents a curve fit. To do this, we used the “multiple fit” function in the “curve fit” dialogue
and added a 12-year dataset to the fits. Each 12-year dataset pair of simulated vs. observed had a
relative weight, which allowed us to control the importance of each pair. Berkeley Madonna
multiplied the deviation of each pair by its weight, and then summed these products to compute
the overall deviation to be minimized (Doherty, 2004; Macey et al., 2009). For the drought
scenarios, we used optimized parameter values (Table 1) with the best fit for observed and
simulated population sizes. The calibrated parameter values created in this way fell within the
range of parameters indicated in literature (Table 1).
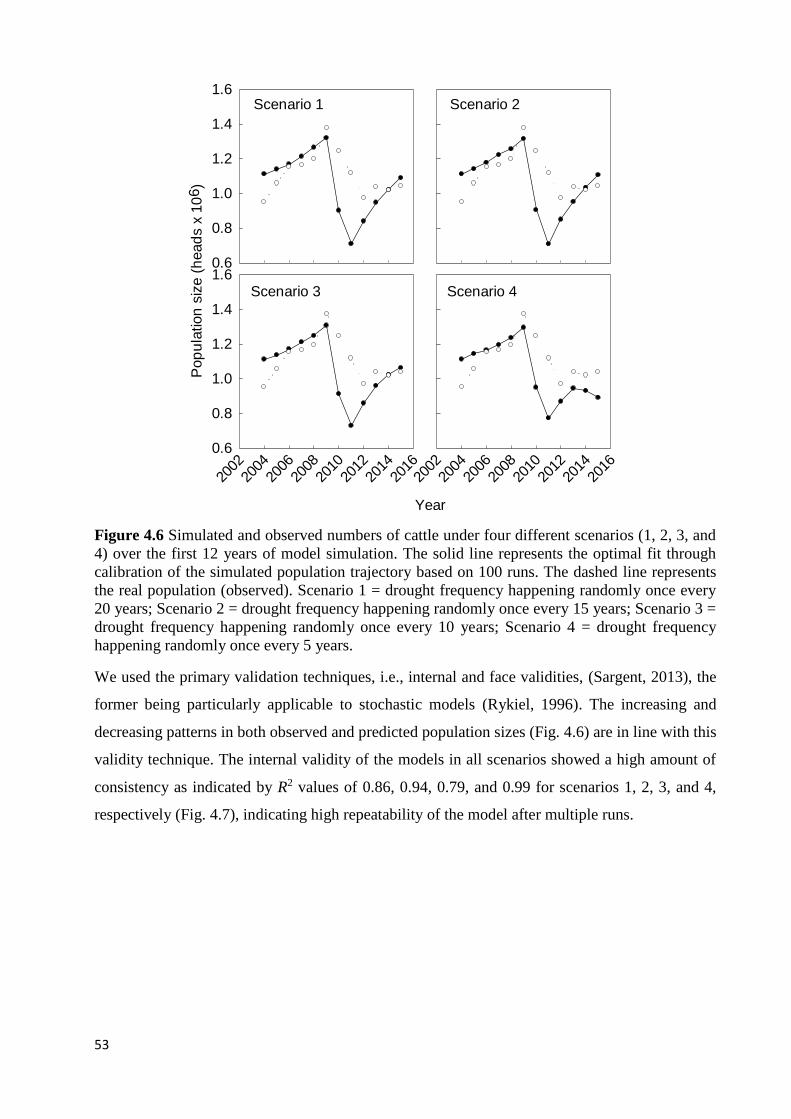
53
0.6
0.8
1.0
1.2
1.4
1.6
Year
2002
2004
2006
2008
2010
2012
2014
2016
Pop
ula
tion
siz
e (
head
s x
10
6)
0.6
0.8
1.0
1.2
1.4
1.6
2002
2004
2006
2008
2010
2012
2014
2016
Scenario 1 Scenario 2
Scenario 3 Scenario 4
Figure 4.6 Simulated and observed numbers of cattle under four different scenarios (1, 2, 3, and
4) over the first 12 years of model simulation. The solid line represents the optimal fit through
calibration of the simulated population trajectory based on 100 runs. The dashed line represents
the real population (observed). Scenario 1 = drought frequency happening randomly once every
20 years; Scenario 2 = drought frequency happening randomly once every 15 years; Scenario 3 =
drought frequency happening randomly once every 10 years; Scenario 4 = drought frequency
happening randomly once every 5 years.
We used the primary validation techniques, i.e., internal and face validities, (Sargent, 2013), the
former being particularly applicable to stochastic models (Rykiel, 1996). The increasing and
decreasing patterns in both observed and predicted population sizes (Fig. 4.6) are in line with this
validity technique. The internal validity of the models in all scenarios showed a high amount of
consistency as indicated by R2 values of 0.86, 0.94, 0.79, and 0.99 for scenarios 1, 2, 3, and 4,
respectively (Fig. 4.7), indicating high repeatability of the model after multiple runs.
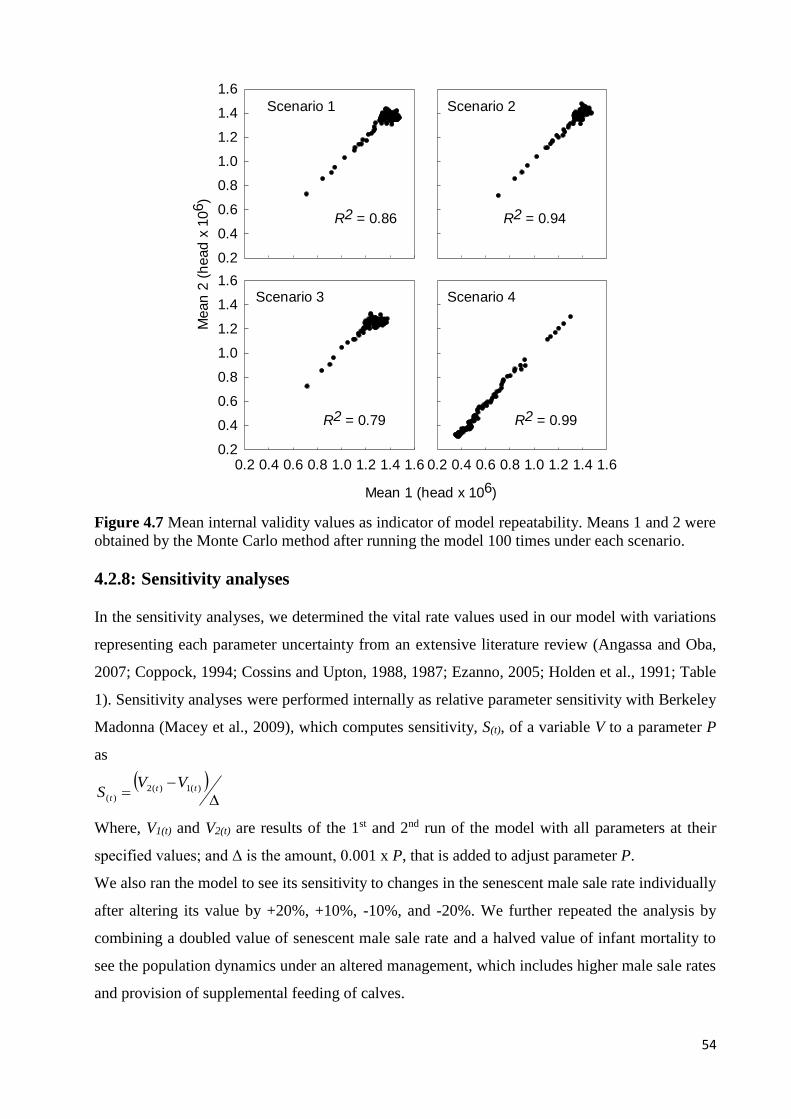
54
0.2
0.4
0.6
0.8
1.0
1.2
1.4
1.6
0.2 0.4 0.6 0.8 1.0 1.2 1.4 1.6
Mean 1 (head x 106)
0.2 0.4 0.6 0.8 1.0 1.2 1.4 1.6
Mean
2 (
head
x 1
06)
0.2
0.4
0.6
0.8
1.0
1.2
1.4
1.6
Scenario 1 Scenario 2
Scenario 3 Scenario 4
R2 = 0.86 R2 = 0.94
R2 = 0.79 R2 = 0.99
Figure 4.7 Mean internal validity values as indicator of model repeatability. Means 1 and 2 were
obtained by the Monte Carlo method after running the model 100 times under each scenario.
4.2.8: Sensitivity analyses
In the sensitivity analyses, we determined the vital rate values used in our model with variations
representing each parameter uncertainty from an extensive literature review (Angassa and Oba,
2007; Coppock, 1994; Cossins and Upton, 1988, 1987; Ezanno, 2005; Holden et al., 1991; Table
1). Sensitivity analyses were performed internally as relative parameter sensitivity with Berkeley
Madonna (Macey et al., 2009), which computes sensitivity, S(t), of a variable V to a parameter P
as
)(1)(2
)(tt
t
VVS
Where, V1(t) and V2(t) are results of the 1st and 2nd run of the model with all parameters at their
specified values; and Δ is the amount, 0.001 x P, that is added to adjust parameter P.
We also ran the model to see its sensitivity to changes in the senescent male sale rate individually
after altering its value by +20%, +10%, -10%, and -20%. We further repeated the analysis by
combining a doubled value of senescent male sale rate and a halved value of infant mortality to
see the population dynamics under an altered management, which includes higher male sale rates
and provision of supplemental feeding of calves.
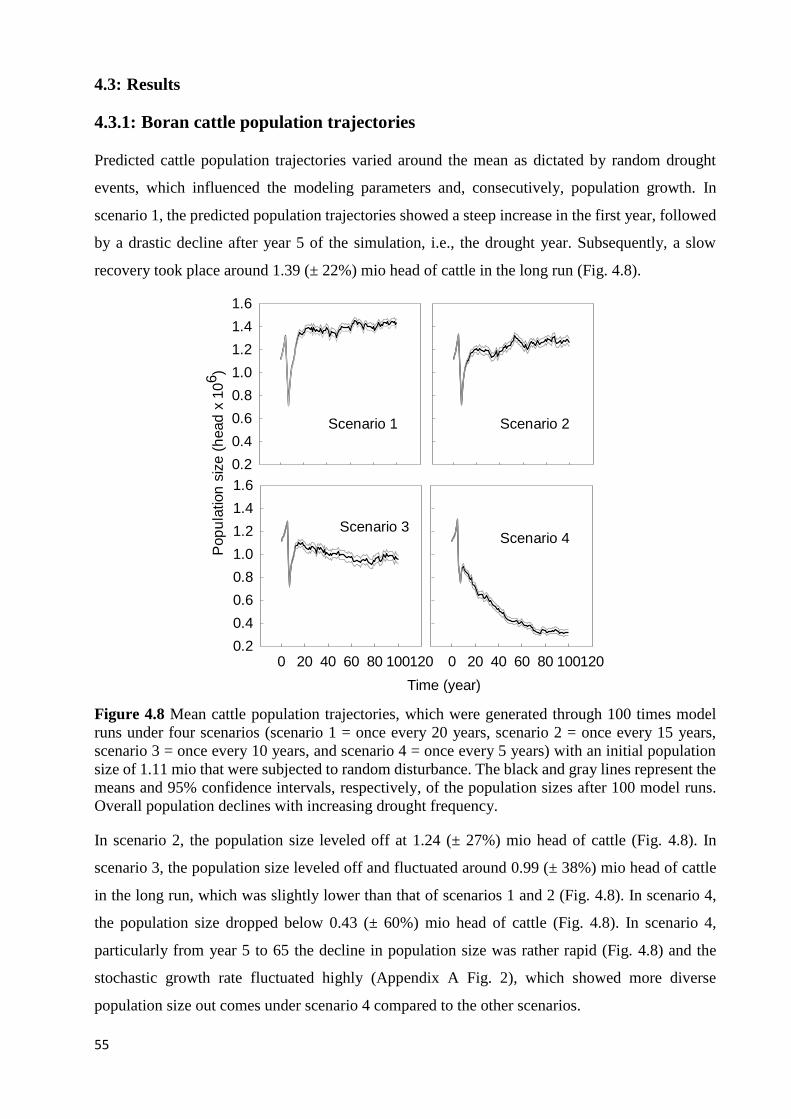
55
4.3: Results
4.3.1: Boran cattle population trajectories
Predicted cattle population trajectories varied around the mean as dictated by random drought
events, which influenced the modeling parameters and, consecutively, population growth. In
scenario 1, the predicted population trajectories showed a steep increase in the first year, followed
by a drastic decline after year 5 of the simulation, i.e., the drought year. Subsequently, a slow
recovery took place around 1.39 (± 22%) mio head of cattle in the long run (Fig. 4.8).
0.2
0.4
0.6
0.8
1.0
1.2
1.4
1.6
Time (year)
0 20 40 60 80 100120
Pop
ula
tion
siz
e (
head
x 1
06)
0.2
0.4
0.6
0.8
1.0
1.2
1.4
1.6
0 20 40 60 80 100120
Scenario 1 Scenario 2
Scenario 3Scenario 4
Figure 4.8 Mean cattle population trajectories, which were generated through 100 times model
runs under four scenarios (scenario 1 = once every 20 years, scenario 2 = once every 15 years,
scenario 3 = once every 10 years, and scenario 4 = once every 5 years) with an initial population
size of 1.11 mio that were subjected to random disturbance. The black and gray lines represent the
means and 95% confidence intervals, respectively, of the population sizes after 100 model runs.
Overall population declines with increasing drought frequency.
In scenario 2, the population size leveled off at 1.24 (± 27%) mio head of cattle (Fig. 4.8). In
scenario 3, the population size leveled off and fluctuated around 0.99 (± 38%) mio head of cattle
in the long run, which was slightly lower than that of scenarios 1 and 2 (Fig. 4.8). In scenario 4,
the population size dropped below 0.43 (± 60%) mio head of cattle (Fig. 4.8). In scenario 4,
particularly from year 5 to 65 the decline in population size was rather rapid (Fig. 4.8) and the
stochastic growth rate fluctuated highly (Appendix A Fig. 2), which showed more diverse
population size out comes under scenario 4 compared to the other scenarios.
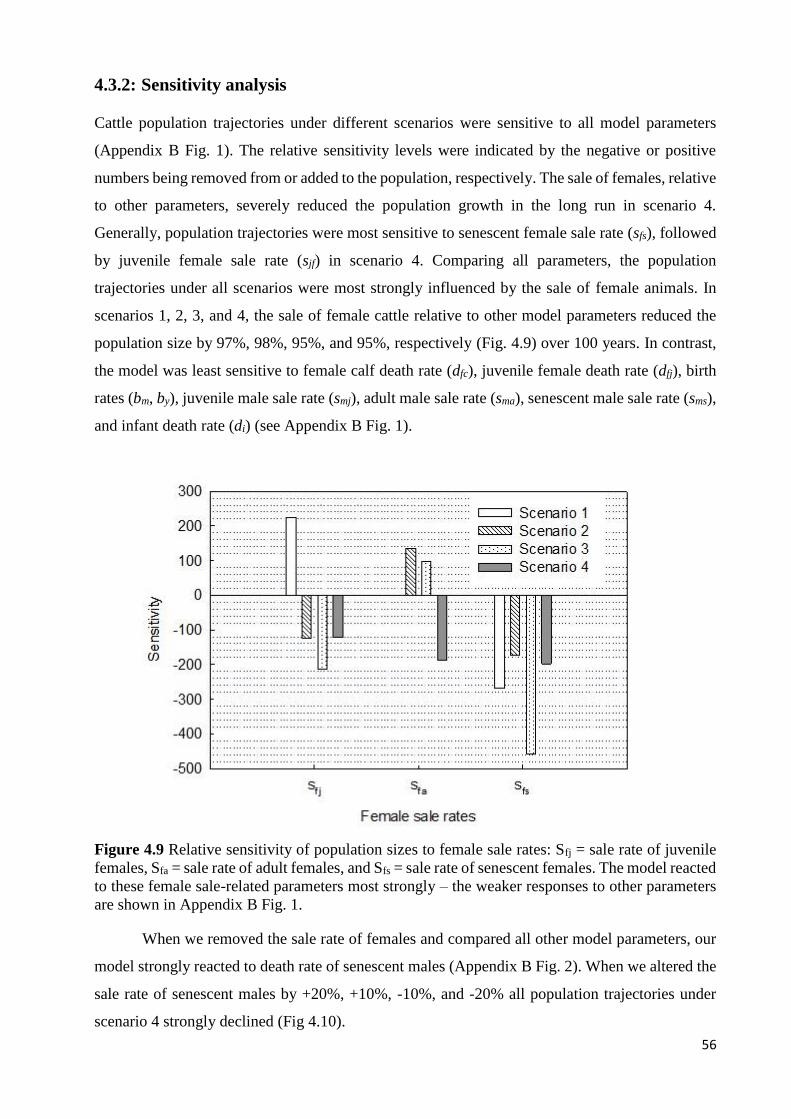
56
4.3.2: Sensitivity analysis
Cattle population trajectories under different scenarios were sensitive to all model parameters
(Appendix B Fig. 1). The relative sensitivity levels were indicated by the negative or positive
numbers being removed from or added to the population, respectively. The sale of females, relative
to other parameters, severely reduced the population growth in the long run in scenario 4.
Generally, population trajectories were most sensitive to senescent female sale rate (sfs), followed
by juvenile female sale rate (sjf) in scenario 4. Comparing all parameters, the population
trajectories under all scenarios were most strongly influenced by the sale of female animals. In
scenarios 1, 2, 3, and 4, the sale of female cattle relative to other model parameters reduced the
population size by 97%, 98%, 95%, and 95%, respectively (Fig. 4.9) over 100 years. In contrast,
the model was least sensitive to female calf death rate (dfc), juvenile female death rate (dfj), birth
rates (bm, by), juvenile male sale rate (smj), adult male sale rate (sma), senescent male sale rate (sms),
and infant death rate (di) (see Appendix B Fig. 1).
Figure 4.9 Relative sensitivity of population sizes to female sale rates: Sfj = sale rate of juvenile
females, Sfa = sale rate of adult females, and Sfs = sale rate of senescent females. The model reacted
to these female sale-related parameters most strongly – the weaker responses to other parameters
are shown in Appendix B Fig. 1.
When we removed the sale rate of females and compared all other model parameters, our
model strongly reacted to death rate of senescent males (Appendix B Fig. 2). When we altered the
sale rate of senescent males by +20%, +10%, -10%, and -20% all population trajectories under
scenario 4 strongly declined (Fig 4.10).
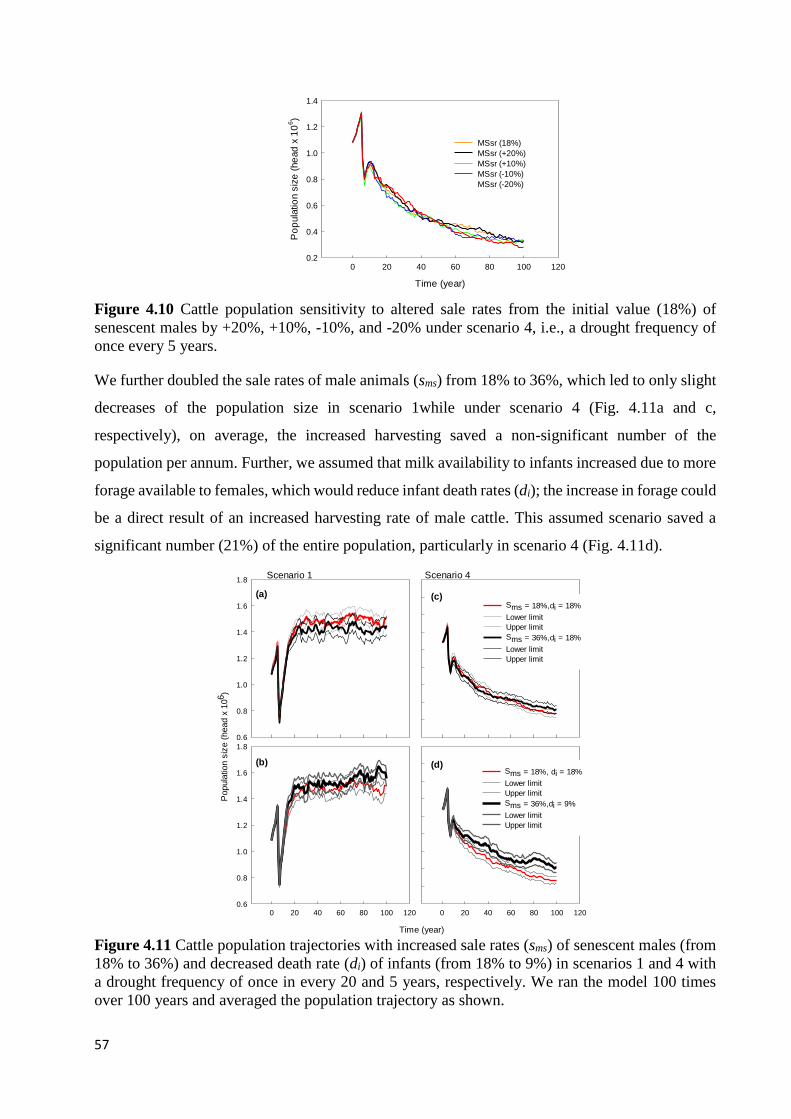
57
Time (year)
0 20 40 60 80 100 120
Po
pula
tio
n s
ize
(he
ad
x 1
06)
0.2
0.4
0.6
0.8
1.0
1.2
1.4
MSsr (18%)
MSsr (+20%)
MSsr (+10%)
MSsr (-10%)
MSsr (-20%)
Figure 4.10 Cattle population sensitivity to altered sale rates from the initial value (18%) of
senescent males by +20%, +10%, -10%, and -20% under scenario 4, i.e., a drought frequency of
once every 5 years.
We further doubled the sale rates of male animals (sms) from 18% to 36%, which led to only slight
decreases of the population size in scenario 1while under scenario 4 (Fig. 4.11a and c,
respectively), on average, the increased harvesting saved a non-significant number of the
population per annum. Further, we assumed that milk availability to infants increased due to more
forage available to females, which would reduce infant death rates (di); the increase in forage could
be a direct result of an increased harvesting rate of male cattle. This assumed scenario saved a
significant number (21%) of the entire population, particularly in scenario 4 (Fig. 4.11d).
Time (year)
0 20 40 60 80 100 1200 20 40 60 80 100 120
Popula
tion s
ize (
head x
106)
0.6
0.8
1.0
1.2
1.4
1.6
1.8
Sms = 18%, di = 18%
Lower limit
Upper limit
Sms = 36%,di = 9%
Lower limit
Upper limit
0.6
0.8
1.0
1.2
1.4
1.6
1.8
Sms = 18%,di = 18%
Lower limit
Upper limit
Sms = 36%,di = 18%
Lower limit
Upper limit
Scenario 1
(a)
(b) (d)
(c)
Scenario 4
Figure 4.11 Cattle population trajectories with increased sale rates (sms) of senescent males (from
18% to 36%) and decreased death rate (di) of infants (from 18% to 9%) in scenarios 1 and 4 with
a drought frequency of once in every 20 and 5 years, respectively. We ran the model 100 times
over 100 years and averaged the population trajectory as shown.
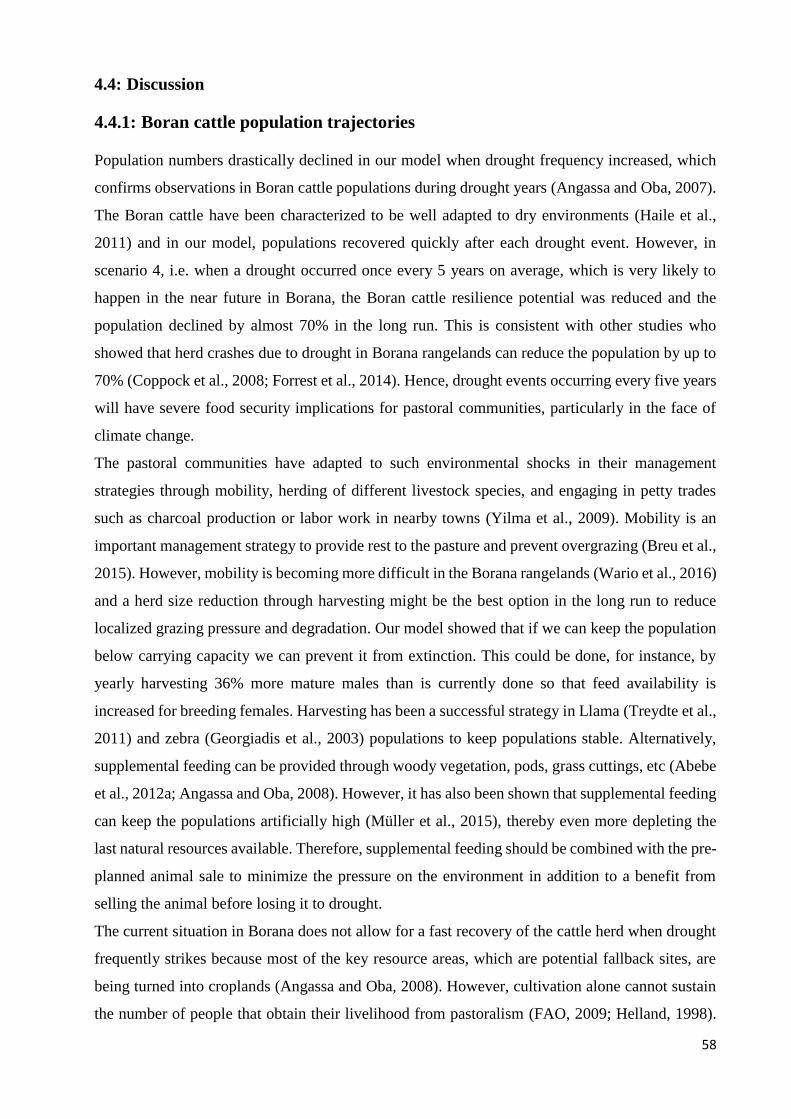
58
4.4: Discussion
4.4.1: Boran cattle population trajectories
Population numbers drastically declined in our model when drought frequency increased, which
confirms observations in Boran cattle populations during drought years (Angassa and Oba, 2007).
The Boran cattle have been characterized to be well adapted to dry environments (Haile et al.,
2011) and in our model, populations recovered quickly after each drought event. However, in
scenario 4, i.e. when a drought occurred once every 5 years on average, which is very likely to
happen in the near future in Borana, the Boran cattle resilience potential was reduced and the
population declined by almost 70% in the long run. This is consistent with other studies who
showed that herd crashes due to drought in Borana rangelands can reduce the population by up to
70% (Coppock et al., 2008; Forrest et al., 2014). Hence, drought events occurring every five years
will have severe food security implications for pastoral communities, particularly in the face of
climate change.
The pastoral communities have adapted to such environmental shocks in their management
strategies through mobility, herding of different livestock species, and engaging in petty trades
such as charcoal production or labor work in nearby towns (Yilma et al., 2009). Mobility is an
important management strategy to provide rest to the pasture and prevent overgrazing (Breu et al.,
2015). However, mobility is becoming more difficult in the Borana rangelands (Wario et al., 2016)
and a herd size reduction through harvesting might be the best option in the long run to reduce
localized grazing pressure and degradation. Our model showed that if we can keep the population
below carrying capacity we can prevent it from extinction. This could be done, for instance, by
yearly harvesting 36% more mature males than is currently done so that feed availability is
increased for breeding females. Harvesting has been a successful strategy in Llama (Treydte et al.,
2011) and zebra (Georgiadis et al., 2003) populations to keep populations stable. Alternatively,
supplemental feeding can be provided through woody vegetation, pods, grass cuttings, etc (Abebe
et al., 2012a; Angassa and Oba, 2008). However, it has also been shown that supplemental feeding
can keep the populations artificially high (Müller et al., 2015), thereby even more depleting the
last natural resources available. Therefore, supplemental feeding should be combined with the pre-
planned animal sale to minimize the pressure on the environment in addition to a benefit from
selling the animal before losing it to drought.
The current situation in Borana does not allow for a fast recovery of the cattle herd when drought
frequently strikes because most of the key resource areas, which are potential fallback sites, are
being turned into croplands (Angassa and Oba, 2008). However, cultivation alone cannot sustain
the number of people that obtain their livelihood from pastoralism (FAO, 2009; Helland, 1998).

59
Generally, reducing herd sizes will significantly reduce the numbers of cows that have to be sold
during drought (Birhanu et al., 2015) and decrease female death rates that is caused by feed
shortages. Our results agree with Evans et al. (2010) who claim that external factors such as
drought and markets strongly dictate the vital rates (births and death) in population dynamics.
Further, the major impact of a drought is not direct but it aggravates the effects of other factors
such as land use change, increasing human and livestock populations, raising the pressure on
remaining forage resources (IPCC, 2001). Therefore, a drastic herd crash under increased drought
scenarios highlights a need for appropriate rangeland management that contributes to adaptation
and mitigation of climate change for a sustainable rangeland system (FAO, 2009) through resting
and restoration of degraded areas. Appropriate management can be further augmented by an early
drought warning system (Henricksen and Durkin, 1986) that encourages pastoralists to take an
informed decision before the condition worsens in the face of environmental shocks.
4.4.2: Sensitivity analysis
The high influence of drought on external parameters (sale rates) in our model indicated that selling
female animals is a more important factor dictating the future Boran cattle population size than the
vital rates. This complements findings by Baptist (1992) who highlighted that the animal market
strongly affects the future performance of a herd. As animal populations are rarely homogenous
(Finkelstein and Cha, 2013) our model reflected the importance of harvesting males in an
appropriate time before drought hits.
Models often take only the female population into account, excluding the male segment in their
predictions (Cáceres and Cáceres-Saez, 2013). Our sex- and age-cohorts approach clearly showed
how parameters strongly influence single cohorts within a population with varying effects.
Berkeley Madonna has the advantage that the sensitivity of many parameters can be assessed at a
time in both age- and sex-cohorts (Macey et al., 2009). Such information can aid in prioritizing
the population group to be focused on in management so that the effect of drought can be
accordingly buffered. Other population models have highlighted the importance of categorizing
populations (Shabb et al., 2013) and using this as a tool to validate the projected population
trajectory outcomes (Sargent, 2013; Treydte et al., 2011). Such sensitivity analyses represent an
important tool for both calibration and validation techniques (Trucano et al., 2006) and show how
essential monitoring data are (Kleijnen, 1995). Our sensitivity analysis revealed which sex- and
age-specific cohort in a population most strongly affected the outcome of our model. This points
out that data on mature female survival in particular needs to be understood for better prediction
of future populations in the long run (Angassa and Oba, 2007). Often, there is a lack of such
detailed purpose-driven data for modeling (Fox et al., 2012). We were fortunate enough to work
60
with a very detailed dataset, highlighting how essential it is to monitor population structure and
dynamics, particularly for such a threatened cattle race as Boran (Zander and Drucker, 2008).
Other population models have found that female survival is a parameter to which population model
outcomes are most sensitive to (Treydte et al., 2011). We were surprised to find that calf mortality
played a minor role in our sensitivity analysis, in contrast to findings by Coppock (1994). This
might be attributed to the fact that calf mortality mitigation has already been a priority of cultural
Boran cattle management e.g., through the provision of long-term exclosures, which set aside
valuable grazing grounds for calves only in times of shortage (Dida, 2011).
In our modeling, we disregarded spatial variability, other grazing / browsing animals, and any
social aspect, i.e., how herders feel about higher selling rates mainly due to the limited availability
of demographic and long-term vegetation dynamics data. However, we still think that our model
is a crucial step to understanding cattle dynamics within the rangeland system very well. Our face
and internal validity techniques (Sargent, 2013) showed a good reproducibility of our model, as
depicted by high R2 values, and hence, provides some support that our model can be applied to the
cattle dynamics under different drought scenarios in the face of climate change. Reproducibility is
one of the most important attributes in evaluating a model (Taylor and Karlin, 1984). The need to
have a parallel data set across which model predictions can be tested in the calibration process is
also essential (Mayer and Butler, 1993). Our population simulations followed trends seen in an
actual neighboring Boran cattle population.
As our model was stochastic, every run produced different output numbers (Oakley and
Youngman, 2015; see also Appendix A Fig. 3-6). Such a model was found to be the most suitable
model for semiarid areas (Sæther et al., 2000), such as Borana rangelands, which are characterized
by both demographic and environmental stochasticity. The stochasticity helps to understand
general mechanisms causing climate-induced population dynamics, which are poorly understood
so far ( Otto and Day, 2007; van de Pol et al., 2010) and management has learned to take variability
into account (Coppock, 2016). Although, assessment of extinction risk is highly complex due to
interacting stochastic processes operating on both density-independent and density-dependent
components of population dynamics (Brook et al., 2008), cattle are the species with the highest
number of breeds reported as extinct, thus losing its unique adaptive attributes (FAO, 2007). With
this model, we were able to provide conservation recommendations to protect this important Boran
cattle from extinction, which is mainly attributed to feed shortage caused by recurrent drought
(Catley et al., 2014; Haile et al., 2011; Homann et al., 2003; Zander, 2011; Zander et al., 2009b).
Globally, drought managements are largely based on ineffective crisis management (Wilhite et al.,
2014, 2005). Likewise, in Borana rangeland drought management is highly vivid during a drought
crisis. Our model can aid in devising a proactive drought management for age- and sex- structured
61
Boran cattle population in the face of more prevalent drought (He et al., 2014). Such strategies can
enhance food security as they facilitate off take and prevent the build-up of herds and subsequent
die-off of animals during drought, which has been a common phenomenon in eastern African
rangelands.
4.5: Conclusions
The drought frequency has generally increased in Africa over the last 60 years (Spinoni et al.,
2014) and predicting how livestock population trends vary under such increased drought frequency
is a major challenge in ecology (Oppel et al., 2014). Currently, the Boran cattle are facing high
herd crashes during drought events through increased mortality and an unplanned animal sale
during drought. Our model outcome can help preventing these crashes by highlighting the
importance of targeting animal cohorts in time before a drought crisis. We addressed this challenge
in our model using random disturbance on population development under various drought
scenarios. We incorporated drought as a randomly occurring disturbance in a dynamic cattle
population model because cattle are highly vulnerable to drought (McCabe, 1987; Yilma et al.,
2009). Our model output showed that an expected increasing drought frequency will strongly
suppress the dynamics of Boran cattle population, leading to food insecurity in the long-run. Using
differential equations, we tried to disentangle the mechanisms that cause drought-induced cattle
population dynamics over a continuous time scale. Modeling stochastic demography and
environment are of great importance in understanding cattle populations and determining herd
sizes to fit the spatiotemporal variability of semiarid rangeland resources.
We recommend that there should be a market channel that encourages pastoralists to sell their
animals before they lose body condition, and, hence, to fetch a better price. Cattle sale should be
encouraged as it reduces grazing pressure on the rangelands; further, it should be pre-planned and
should target males rather than females. In addition, drought early warning systems and market
information must be strengthened in drought prone pastoral areas so that the advice of pre-planned
selling can be realized. Further, rangelands should be managed to enhance resilience after drought
through marrying scientific and indigenous knowledge.

62
63
Chapter 5: General Discussion
5.1: Grass biomass allocation under grazing and drought pressure
In our experiment, clipping highly reduced aboveground biomass of mature study grasses
(Cenchrus ciliaris and Chloris gayana), which is consistent with similar observations in Kenya
(Ngatia et al., 2015), South Africa (Mbatha and Ward, 2010) and China (Cui et al., 2005) as well
as in Germany (Rose et al., 2013; Schmitt et al., 2013) and the Netherlands (Veen et al., 2014) for
various grass species. This suggests that a resting period determines the quantity of the standing
aboveground biomass (Pandey and Singh, 1992), and this seems to be irrespective of climatic
conditions as it can be observed across the globe (Asner et al., 2004). Clipping/grazing further
highly enhanced the belowground biomass (Chapter 2, Fig. 2.1), boosting the ability of grass to
compete for water and nutrients (Engel et al., 1998). The enhanced belowground biomass due to
herbivory was also observed in Spain (Garcia-Pausas et al., 2011), Argentina (Larreguy et al.,
2014; Pucheta et al., 2004) and the Netherlands (Veen et al., 2014). This might be attributed to the
reallocation of resources away from the site of damage and into storage organs after herbivory,
which reduces the chance of resources being lost to herbivores (Gómez et al., 2010).
In contrast to mature grasses, the aboveground biomass in newly established study grasses was
higher under moderate clipping compared to the control (Chapter 2, Figs. 2.2 & 2.4b), which
concurs with studies from the Netherlands (Veen et al., 2014), USA (Frank et al., 2002) and in
Mediterranean rangelands (Herrero-Jáuregui et al., 2016). The enhanced aboveground biomass
might be attributed to greater photosynthetic capacity in younger leaves after clipping compared
to the unclipped control (Nowak and Caldwell, 1984) and the overcompensation phenomenon
(McNaughton, 1983). Clipping further stimulated the belowground biomass of newly established
grasses, which concurs with many studies (Helland, 1998; Piñeiro et al., 2010; Pucheta et al., 2004;
Smoliak et al., 1972; Veen et al., 2014). Grass roots play a significant role in grass survival
(Hoogenboom et al., 1987), particularly in the face of increasing drought frequency due to climate
change, which threatens the food security of the dryland regions of the world (Angassa and Oba,
2008; Keshavarz et al., 2017; Scoones, 1992). Hence, understanding differences in grass responses
to herbivory can aid in devising appropriate management for rangelands of different ages. For
instance, in Ethiopia (Tebeje et al., 2014) and Kenya (Koech et al., 2015) the selected study species
have been recommended for reseeding in the frame of restoration at degraded rangeland sites.
Hence, our results may increase knowledge and thus, rates of restoration of degraded areas (James
et al., 2013; James and Carrick, 2016; Kakinuma et al., 2014). Restoration activities such as
reseeding will enhance rangeland ecosystem resilience, which in turn improves the long-term food
security of pastoral communities (Bedunah and Angerer, 2012).
64
Reduced irrigation amounts (long-term simulated drought) highly reduced both above- and
belowground grass biomass of the two selected study species (Chapter 2, Fig. 2.3), which might
be due to reduced non-structural carbohydrates (Chen et al., 2013), reduced CO2 assimilation rate
as a result of reduced leaf size and productivity (Farooq et al., 2009). Understanding grass
responses to drought, a phenomenon that is expected to become more frequent, has paramount
importance since drought is a major growth limiting factor in terrestrial ecosystems (Naudts et al.,
2013) and further limits grass growth in the face of climate change (Fay et al., 2003, 2000).
Therefore, grazing management should be adjusted based on known rainfall amounts in semiarid
areas of Africa, particularly in terms of stocking rates (Kori et al., 2012). As the livelihood of the
pastoralists in East Africa is mainly based on pastoralism that depends on an environment with
patchy resources due to unpredictable climatic patterns that demand mobility (Flintan, 2012) and
de-stocking in drought years as important rangeland management decision (Holechek et al., 1999)
an adaptive management regime is crucial.
In our study, the combined effect of lower irrigation and more frequent clipping highly reduced
the belowground biomass (Chapter 2, Fig. 2.4a), which might be attributable to reduced regrowth
and leaf extension rate (Busso and Richards, 1993; Muthoni et al., 2014). Consequently, in newly
established grasses, moderate and light clipping enhanced biomass allocation and, hence, should
be considered as a post-reseeding rangeland management tool in restoration. Generally, areas with
already established grasses should rest to replenish their aboveground grass biomass allocation
while moderate grazing should be encouraged to stimulate its belowground biomass. Therefore,
our results help in devising appropriate development strategies for better biomass yield in pastoral
areas both for older rangelands and newly restored areas. A management that enhances
belowground biomass should be encouraged since generally 92% of biomass is found
belowground (Fan et al., 2009) and it plays an important role in the sustainability of rangelands
(Acosta-Gallo et al., 2011).
5.2: Nutrient contents of rangeland grasses under grazing effects
Animal productivity in rangelands strongly depends on forage nutritive quality (Hussain and
Durrani, 2009). The highly increased nutritive values due to clipping (chapter 2, Fig. 2.5) indicate
that it is possible to boost the nutritive values of grasses through moderate grazing. Hence, grasses
with enhanced nutrients can be used as a supplement to fortify rangeland grasses, for instance, to
enrich protein ingestion during the dry season or drought period in areas where natural pasture is
the main source of feed such as Borana rangelands (Tolera and Abebe, 2007). Low lignin and high
protein contents are used as reliable criteria for forage quality (Sullivan, 1962). Herbaceous plants
are deficient in protein when their nitrogen concentration is less than about 2.5% (Whitehead,
65
2000). In our experiment, both study grass species were poor in protein when mature as depicted
in the nitrogen levels in unclipped grasses (1.73 % and 1.36% in C. ciliaris and C. gayana,
respectively). However, clipping highly enhanced the crude protein content by up to 105% and 82
% in Cenchrus ciliaris and Chloris gayana, respectively. Further, clipping highly reduced the
lignin content of the study grasses. Hence, this treatment contributed strongly to enhancing the
forage quality of important rangeland grasses. In Borana rangelands, such improvement in quantity
and quality of the perennial species can lead to conservation of the Boran cattle (Bos indicus)
(Homann et al., 2004), which are threatened due to declining feed availability.
5.3: Grass carbon storage under herbivory and climate change
The response of carbon (C) followed the same pattern as that of grass biomass. Clipping highly
reduced the aboveground C storage of the mature grass tufts (Chapter 3, Fig. 3.1), which agrees
with results from Iran (Asgharnezhad et al. 2013). Conversely, grazing increased belowground C
storage of mature grasses, which might be attributed to the reallocation of resources away from
the site of herbivory as tolerance strategy (Babst et al., 2005; Gómez et al., 2010; Wise and
Abrahamson, 2007). This implies that aboveground biomass management of rangelands has a
critical impact on the belowground C storage and thus on long-term CO2 emission mitigation
(Gifford, 2010).
In newly established grasses, the light and moderate grazing stimulated the above- and
belowground C storage of both study grass species (Chapter 3, Fig. 3.2) similar to studies by Veen
et al., (2014). This stimulation might be attributable to greater photosynthetic capacity of younger
grasses rather than older tissues (Nowak and Caldwell, 1984). In contrast, reduced irrigation
highly reduced the above- and belowground C storage (Chapter 3, Fig. 3.4). our results suggest for
C. gayana that under controlled clipping/grazing the predicted increase in rainfall in east Africa
(Christensen et al., 2007) enhances the C storage of grasses. However, overgrazing might
negatively override the positive effects of increased rainfall. Rangelands have been acknowledged
to be a main sink for C as all soil organic C is primarily from plant origin (Kuzyakov and
Domanski, 2000). Grasses have a potential to store C but are influenced by the available herbivore
and rainfall and, hence, consecutive storage in soil will increase the overall C sink in the long-run
(Wang et al., 2011).
Vast parts of global rangelands, potential C sinks, have already been degraded. Because of their
vast area, a small change in soil C stocks across rangeland ecosystems would have a large impact
on CO2 accounts (Fynn et al., 2010). Overgrazing leads to rangeland degradation (Davies et al.,
2010) as already observed in east Africa (Helland, 2001) and many parts of the world (Fernandez-
Gimenez and Le Febre, 2006). Rangeland degradation further leads to a disappearance of
66
important native perennial grass species (Mganga et al., 2015). Restoring such degraded
rangelands with perennial grasses can improve ecosystem goods and services (e.g. animal feed and
C storage) as well as food security (Kimiti et al., 2017; Zimmermann et al., 2015). This can only
be realized if there is a policy that encourages appropriate grazing management as manifested in
our and other studies (Klein et al., 2007). A business as usual or a revert to the old rangeland
management with mobile pastoralism seems difficult given the current situation (Helland, 2001).
Hence, a new rangeland management approach, such as restoration through reseeding and post-
reseeding management, should be the way forward under current and future scenarios for a
sustainable use of rangeland resources (Costantini et al., 2016). As such, restored sites need a close
technical follow up, for instance by appropriate pre- and post-reseeding management, i.e., assuring
resting of older grasslands and timely reseeding until pastoralists adopt themselves to this new
rangeland management approach so that the restored sites would not revert to pre-restoration state
(Wairore et al., 2015).
5.4: Boran cattle population dynamics under limited rangeland resources
Responses of large herbivore populations to environmental constraints are strongly age- and sex-
dependent (Gaillard et al., 2000). Hence, taking stochasticity into consideration across sex- and
age-categories is a good approach for modeling population dynamics of large herbivores (Gaillard
et al., 1998; Sæther, 1997). In our model, we included age-and sex cohort specific responses to
carrying capacity variations. We further introduced drought as a random factor in our Boran cattle
population model (Chapter 4), which caused the population size to continuously fluctuate. The
environmental stochasticity and demographic stochasticity resembled actual trends in Boran cattle
population trajectories under temporal variation. In semiarid environments droughts can cause
livestock herd crashes (Ellis and Swift, 1988; Illius and O’Connor, 1999), which was reflected by
our model, particularly under increased drought frequencies (Chapter 4, Fig. 4.8). To minimize the
chance of a cattle population crash, the current drought management policy should be improved
(Angassa and Oba, 2007), particularly in view of more common droughts predicted for the future
(He et al., 2014). Further, in such a stochastic environment as a semiarid environment management
should allow flexibility (mobility) and avoid reaching the carrying capacity through selling since
a fixed carrying capacity is inappropriate (Campbell et al., 2006; Illius and O’Connor, 2000, 1999;
Walker et al., 1987). Our model indicated that a pre-planned male cattle selling rather than females
could minimize the herd crash during drought owing to removal of pressure from the rangeland
that makes more feed available to females that results in more milk, which reduces the death rate
of calves, a group most affected by drought (Coppock, 1994). Our models fitted the patterns of a
real population over 12-years (Chapter 4, Fig. 4.6) and showed robustness, particularly under
67
increased drought frequencies (Chapter 4, Fig. 4.7). Consequently, we suggest that the drought
management should focus on coupling the meteorological and early warning systems with market
information so that the pastoral communities can pre-plan their animal sales and invest in other
assets before the drought hits their cattle population. The results of this study can be used by policy
makers to develop an appropriate strategy that helps the pastoral community to be proactive in
coping with drought by reducing its impacts on cattle population.
5.5: Overall rangeland ecosystem resilience
Nowadays, at least 10-20% of the worldwide drylands and 70% of sub-Saharan rangelands are
severely degraded (Millennium Ecosystem Assessment, 2005a). Hence, the capacity of rangelands
to support the ever increasing human population is under challenge, particularly in the face of
climate change. The human populations of rangelands are currently facing increasing instability,
food insecurity, decreasing income, increasing poverty and a decline in adherence to social norms,
mainly due to environmental degradation that has led to reduced resilience capacity of the system.
Rangeland ecosystem resilience reduces when biodiversity declines (Millennium Ecosystem
Assessment, 2005b) but shocks to the system (overgrazing and drought) can be buffered through
restoring degraded sites by reseeding perennial grass species that have adapted to the dryland
system. Further, improving post-restoration management through moderate grazing enhances
grass resilience. As degraded ecosystem seem to recover slowly on a global scale (Moreno-Mateos
et al., 2017) the resilience of degraded rangelands might also increase slightly. Restoration with
perennial grasses enhances the sustainable utilization of rangeland by enhancing its productivity,
which will be able to support important local cattle breeds that depend on rangeland feed resources.
Management of rangeland is inextricably linked to different components of the rangeland
ecosystem and can only be carried out practically in view of integrated biotic (herbivore, plant,
and microorganism), abiotic (climate, soil nutrient) and anthropogenic (land management and
herbivory) components.
Modeling such complex systems generally requires an understanding of relationships between the
main grass stressors, herbivory and rainfall variability. The intention of a dynamic population
modeling in our study was to give policy advice on strategies to improve herd management in the
face of increasing drought. A comprehensive system of range use would include pastoralists
adjusting their overall livestock numbers in relation to available biomass so that production and
productivity of the rangeland and its livestock improve. Such strategies can enhance food security
as they facilitate off take and prevent the build-up of herds and subsequent die-off of animals
during drought, which has been a common phenomenon in eastern African rangelands (Angassa
and Oba, 2007; Coppock, 1994; Scoones, 1992).
68
5.6: Study limitations and conclusion
We conducted our experiment on individual grass species under controlled irrigation and clipping
with seeded grasses as well as mature tufts of the same grass species. Although such detailed
experiments have been rare (Fidelis et al., 2013) they give a detailed understanding of how grasses
of the same age respond to different treatments in the same environment. However, we are not
sure whether the same result would be obtained in a natural environment, taking into account long-
term vegetation dynamics under other potential factors such as pastoralist movement patterns or
fire dynamics. Therefore, we recommend that similar experiments be repeated in the field on
various grass species and over a longer time period. Such long-term experiments will also help to
understand how much C is actually stored by the system in the long run as this process takes
several years (Downs and Sala, 2009).
Further, in our modeling of the cattle population, we ignored other livestock and wild animal
species in the area, mainly due to the lack of data. Hence, for the sake of simplicity, we assumed
all grasses were consumed by cattle alone. However, the inclusion of other livestock species in
future models could be helpful for a better understanding of the livestock population dynamics and
its future trends in the face of climate change. In Borana zone, cattle are the dominant livestock
species with about 41% the total livestock species in the zone (CSA, 2015). However, in some
areas, browsing livestock species have become more popular, particularly in bush-encroached
rangelands (Desta, 2013). Hence, including a higher variety of species will give advice on
management options not only for the Boran cattle, the main sources of livelihoods in Ethiopian
rangelands, but also other common livestock species such as camel, goat, sheep and donkey
(Megersa et al., 2014).
In addition to livestock, the Borana rangelands harbor different species of wild animals. The
common herbivorous wild animals in the Borana rangelands include Grevy's zebra (Hippotigris
grevy), Burchell's zebra (H. quagga), gazelle (Gazella spp), warthog (Phacochoerus aethiopicus),
lesser kudu (Tragelaphus imberbis), bushbuck (T. scriptus), Gunther's dik-dik (Madoqua
guenthen), North African crested porcupine (Hystrix cristata), gerenuk (Litocranius wallen), oryx
(Oryx gazella), Cape hare (Lepus capensis) and giraffe (Giraffa camelopardalis) (Coppock, 1994).
In our modeling, we disregarded these wild animal populations as well as the negative relationship
between rangeland components (such as bush encroachment and land use change) and carrying
capacity due to the limited availability of demographic and long-term vegetation dynamics data.
This could be a further step, including socio-economic and political issues such as access
control/new movement barriers or the intention of the Ethiopian government to settle pastoralists
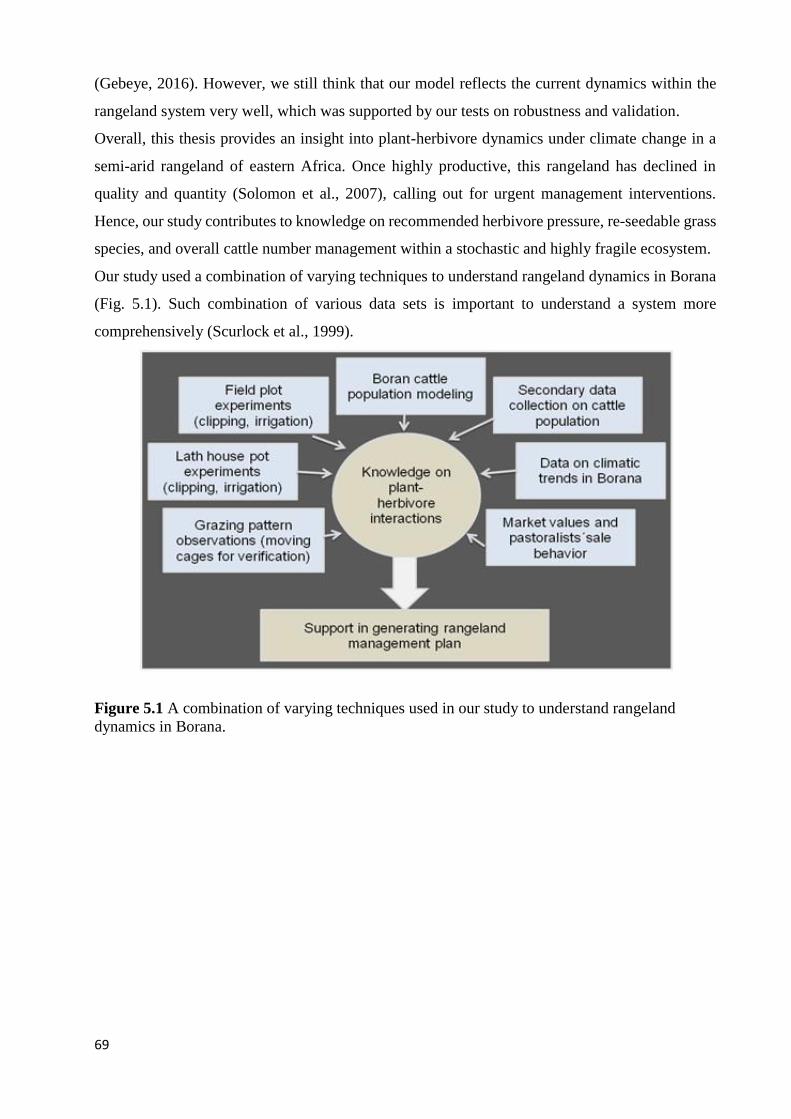
69
(Gebeye, 2016). However, we still think that our model reflects the current dynamics within the
rangeland system very well, which was supported by our tests on robustness and validation.
Overall, this thesis provides an insight into plant-herbivore dynamics under climate change in a
semi-arid rangeland of eastern Africa. Once highly productive, this rangeland has declined in
quality and quantity (Solomon et al., 2007), calling out for urgent management interventions.
Hence, our study contributes to knowledge on recommended herbivore pressure, re-seedable grass
species, and overall cattle number management within a stochastic and highly fragile ecosystem.
Our study used a combination of varying techniques to understand rangeland dynamics in Borana
(Fig. 5.1). Such combination of various data sets is important to understand a system more
comprehensively (Scurlock et al., 1999).
Figure 5.1 A combination of varying techniques used in our study to understand rangeland
dynamics in Borana.

70
71
References
Aarssen, L.W., Turkington, R., 1987. Responses to defoliation in Holcus lanatus , Lolium perenne
, and Trifolium repens from three different-aged pastures. Can. J. Bot. 65, 1364–1370.
doi:10.1139/b87-188
Abdul-Aziz, J.K., 2010. Modelling the Influence of Rainfall Variability and Different Grazing
Systems on the Spatiotemporal Dynamics and Productivity of Cape Town Productivity of
Semiarid Town Productivity of Semiarid Rangelands. A PhD Thesis, Univ. Cape T. Univ.
Cape T.
Abebe, A., Eik, L.O., Holand, Ø., Ådnøy, T., Tolera, A., 2012a. Pastoralists’ perceptions of feed
scarcity and livestock poisoning in southern rangelands, Ethiopia. Trop. Anim. Health Prod.
44, 149–157. doi:10.1007/s11250-011-9902-5
Abebe, A., Tolera, A., Holand, Ø., Ådnøy, T., Eik, L.O., 2012b. SEASONAL VARIATION IN
NUTRITIVE VALUE OF SOME BROWSE AND GRASS SPECIES IN BORANA
RANGELAND, SOUTHERN ETHIOPIA 15, 261–271.
Abule, E., Snyman, H.A., Smit, G.N., 2007. Rangeland evaluation in the middle Awash valley of
Ethiopia: I. Herbaceous vegetation cover. J. Arid Environ. 70, 253–271.
doi:10.1016/j.jaridenv.2006.12.008
Abusuwar, A.O., Yahia, E.H.O., 2010. Pastoralist and seasonality : their effects on range
productivity and carrying capacity in a semi-arid rangeland of Sudan ( Southeast Darfur State
). Agric. Biol. J. NORTH Am.
Accatino, F., Ward, D., Wiegand, K., De Michele, C., 2016. Carrying capacity in arid rangelands
during droughts: the role of temporal and spatial thresholds. Animal 1–9.
doi:10.1017/S1751731116001531
Acharya, B.S., Rasmussen, J., Eriksen, J., 2012. Grassland carbon sequestration and emissions
following cultivation in a mixed crop rotation. Agric. Ecosyst. Environ. 153, 33–39.
doi:10.1016/j.agee.2012.03.001
Acosta-Gallo, B., Casado, M. a., Montalvo, J., Pineda, F.D., 2011. Allometric patterns of below-
ground biomass in Mediterranean grasslands. Plant Biosyst. 3504, 1–12.
doi:10.1080/11263504.2011.578836
Adesogan, A.T., Givens, D.I., Owen, E., 2000. Measuring Chemical Composition and Nutritive
Value in Forages, in: Mannetje, L. ‘t, Jones, R.M. (Eds.), Field and Laboratory Methods for
Grassland and Animal Production Research. the University Press, Cambridge, London, UK,
pp. 263–278. doi:10.1007/s13398-014-0173-7.2
Ahmedin, A.M., Bam, S., Siraj, K.T., Raju, A.J.S., 2013. Assessment of biomass and carbon
sequestration potentials of standing Pongamia pinnata in Andhra University , Visakhapatnam
, India. Biosci. Discov. 4, 143–148.
Alemayehu, N., Gebru, G., Ayalew, W., 2002. Genetic Dilution of the Ethiopian Boran cattle, in:
Challenges and Opportunities of Livestock Marketing in Ethiopia, Proceedings of the 10th
Annual Conference of the Ethiopian Society of Animal Production (ESAP) , Ethiopia. pp.
377–381.
Allen, V.G., Batello, C., Berretta, E.J., Hodgson, J., Kothmann, M., Li, X., McIvor, J., Milne, J.,
Morris, C., Peeters, A., Sanderson, M., 2011. An international terminology for grazing lands
and grazing animals. Grass Forage Sci. 66, 2–28. doi:10.1111/j.1365-2494.2010.00780.x
72
Allison, C.D., 1985. Factors affecting forage intake by range ruminants: a review. J. Range Manag.
38, 305–311.
Angassa, A., 2014. Effects of grazing intensity and bush encroachment on herbaceous species and
rangeland condition in southern Ethiopia. L. Degrad. Dev. 25, 438–451. doi:10.1002/ldr.2160
Angassa, A., 2005. The ecological impact of bush encroachment on the yield of grasses in Borana
rangeland ecosystem. Afr. J. Ecol. 43, 14–20. doi:10.1111/j.1365-2028.2005.00429.x
Angassa, A., 2002. The effect of clearing bushes and shrubs on range condition in Borana,
Ethiopia. Trop. Grasslands 36, 69–76.
Angassa, A., Baars, R.M.T., 2000. Ecological condition of encroached and non-encroached
rangelands in Borana, Ethiopia. Afr. J. Ecol. 38, 321–328. doi:10.1046/j.1365-
2028.2000.00250.x
Angassa, A., Oba, G., 2010. Effects of grazing pressure, age of enclosures and seasonality on bush
cover dynamics and vegetation composition in southern Ethiopia. J. Arid Environ. 74, 111–
120. doi:10.1016/j.jaridenv.2009.07.015
Angassa, A., Oba, G., 2008. Herder perceptions on impacts of range enclosures, crop farming, fire
ban and bush encroachment on the rangelands of Borana, Southern Ethiopia. Hum. Ecol. 36,
201–215. doi:10.1007/s10745-007-9156-z
Angassa, A., Oba, G., 2007. Relating long-term rainfall variability to cattle population dynamics
in communal rangelands and a government ranch in southern Ethiopia. Agric. Syst. 94, 715–
725. doi:10.1016/j.agsy.2007.02.012
Angassa, a, Beyene, F., 2003. Current range condition in southern Ethiopia in relation to
traditional management strategies: The perceptions of Borana pastoralists. Trop. Grasslands
37, 53–59.
Anjum, S., Xie, X., Wang, L., 2011. Morphological, physiological and biochemical responses of
plants to drought stress. African J. Agric. Res. 6, 2026–2032. doi:10.5897/AJAR10.027
Arzani, H., Sour, A., Motamedi, J., 2012. Potential of Near -Infrared Reflectance Spectroscopy (
NIRS ) to Predict Nutrient Composition of Bromus tomentellus. J. Rangel. Sci. 2, 635–641.
Asgharnezhad, L., Akbarlou, M., Karkaj, E.S., 2013. Influences of Grazing and Enclosure on
Carbon Sequestration Puccenilia Distans ( Jacq .) Parl . and soil Carbon Sequestration ( Case
study : Gomishan wetlands ). Int. J. Agron. Plant Prod. 4, 1936–1941.
Asner, G.P., Elmore, A.J., Olander, L.P., Martin, R.E., Harris, A.T., 2004. Grazing Systems,
Ecosystem Responses, and Global Change. Annu. Rev. Environ. Resour. 29, 261–299.
doi:10.1146/annurev.energy.29.062403.102142
Atkinson, D., Dawson, L.A., 2001. Root growth: Methods of measurement, in: Smith, K.A.,
Mullins, C.E. (Eds.), Soil and Environmental Analysis: Physical Methods. pp. 435–498.
doi:10.1017/CBO9781107415324.004
Babst, B.A., Ferrieri, R.A., Gray, D.W., Lerdau, M., Schlyer, D.J., Schueller, M., Thorpe, M.R.,
Orians, C.M., 2005. Jasmonic acid induces rapid changes in carbon transport and partitioning
in Populus. New Phytol. 167, 63–72.
Bai, W., Fang, Y., Zhou, M., Xie, T., Li, L., Zhang, W.H., 2015. Heavily intensified grazing
reduces root production in an Inner Mongolia temperate steppe. Agric. Ecosyst. Environ. 200,
143–150. doi:10.1016/j.agee.2014.11.015
Balogianni, V.G., Wilson, S.D., Vaness, B.M., MacDougall, A.S., Pinno, B.D., 2014. Different
73
Root and Shoot Responses to Mowing and Fertility in Native and Invaded Grassland. Rangel.
Ecol. Manag. 67, 39–45. doi:10.2111/REM-D-13-00080.1
Bank World, 2005. Integrating the Indigenous Knowledge of Borana Pastoralists into Rangeland
Management Strategies in Southern Ethiopia. Development.
Baptist, R., 1992. Derivation of steady-state herd productivity. Agric. Syst. 39, 253–272.
doi:http://dx.doi.org/10.1016/0308-521X(92)90099-A
Bardgett, R.D., Wardle, D.A., 2003. Herbivore-mediated linkages between aboveground and
belowground communities. Ecology 84, 2258–2268. doi:10.1890/02-0274
Baruch, Z., Jackson, R.B., 2005. Responses of tropical native and invader C4 grasses to water
stress, clipping and increased atmospheric CO2 concentration. Oecologia 145, 522–532.
doi:10.1007/s00442-005-0153-x
Bedunah, D.J., Angerer, J.P., 2012. Rangeland Degradation, Poverty, and Conflict: How Can
Rangeland Scientists Contribute to Effective Responses and Solutions? Rangel. Ecol. Manag.
65, 606–612. doi:10.2111/REM-D-11-00155.1
Behnke, R.H., Kerven, C., 1994. Redesigning for risk : tracking and buffering environmental
variability in Africa ’ s rangelands. Nat. Resour. Perspect.
Birhanu, Z., Berhanu, N., Ambelu, A., 2015. Rapid Appraisal of Resilience to the Effects of
Recurrent Droughts in Borana Zone , Southern Ethiopia.
Boken, V.K., 2005. Agricultural Drought and Its Monitoring and Prediction: Some Concepts, in:
Boken, V.K., Cracknell, A.P., Heathcote, R.L. (Eds.), Monitoring and Predicting Agricultural
Drought: A Global Study. OXFORD UNIVERSITY PRESS. doi:10.2136/vzj2006.0134br
Boonman, G., 1993. East Africa’s grasses and fodders: Their ecology and husbandry, Vol. 29. ed.
Springer Science & Business Media.
Breu, T., Höggel, F.U., Rueff, H., 2015. Sustainable livestock production? Industrial agriculture
versus pastoralism. CDE Policy Brief, No. 7. Bern, Switzerland: CDE.
Brook, B.W., Sodhi, N.S., Bradshaw, C.J.A., 2008. Synergies among extinction drivers under
global change. Trends Ecol. Evol. 23, 453–460. doi:10.1016/j.tree.2008.03.011
Bryan, W.B., Prigge, E.C., Lasat, M., Pasha, T., Flaherty, D.J., Lozier, J., 2000. Productivity of
Kentucky Bluegrass Pasture Grazed at Three Heights and Two Intensities. Agron. J. 92, 30–
35.
Busso, C.A., Richards, J.H., 1993. Leaf extension rate in two tussock grasses: Effects of water
stress and clipping. Acta Oecologica 14, 3–15.
Butcher, J.., 2008. Numerical Methods for Ordinary Differential Equations, 2nd ed, Numerical
Methods for Partial Differential Equations. John Wiley & Sons Ltd. doi:10.1007/978-0-
85729-148-6
Cáceres, M.O., Cáceres-Saez, I., 2013. Calculating effective growth rate from a random Leslie
model: Application to incidental mortality analysis. Ecol. Modell. 251, 312–322.
doi:10.1016/j.ecolmodel.2012.12.021
Cahill, J.F., 2003. Lack of relationship between below-ground competition and allocation to roots
in 10 grassland species. J. Ecol. 91, 532–540. doi:10.1046/j.1365-2745.2003.00792.x
Campbell, B.D., Stafford Smith, D.M., 2000. A synthesis of recent global change research on
pasture and rangeland production: Reduced uncertainties and their management implications.
74
Agric. Ecosyst. Environ. 82, 39–55. doi:10.1016/S0167-8809(00)00215-2
Campbell, B.M., Gordon, I.J., Luckert, M.K., Petheram, L., Vetter, S., 2006. In search of optimal
stocking regimes in semi-arid grazing lands: One size does not fit all. Ecol. Econ. 60, 75–85.
doi:10.1016/j.ecolecon.2006.05.010
Caswell, H., Nisbet, R.M., Roos, A.M. de, Tuljapurkar, S., 1997. Structured-Population Models:
Many Methods, a Few Basic Concepts, in: Tuljapurkar, S., Caswell, H. (Eds.), Structured-
Population Models in Marine, Terrestrial, and Freshwater Systems. Springer Science, p. 643.
doi:10.1007/978-1-4615-5973-3
Catley, A., Admassu, B., Bekele, G., Abebe, D., 2014. Livestock mortality in pastoralist herds in
Ethiopia and implications for drought response. Disasters 38, 500–516.
doi:10.1111/disa.12060
CDKN, 2014. The IPCC’s Fifth Assessment Report: What is in it for Africa? Executive Summary.
doi:http://cdkn.org/wp-
content/uploads/2014/04/J1731_CDKN_FifthAssesmentReport_WEB.pdf
Chacon, E., Stobbs, T., 1976. Influence of progressive defoliation of a grass sward on the eating
behaviour of cattle. Aust. J. Agric. Res. 27, 709. doi:10.1071/AR9760709
Chapin, F.S., 2009. Managing ecosystems sustainably: The key role of resilience., in: Principles
of Ecosystem Stewardship: Resilience-Based Natural Resource Management in a Changing
World. Springer New York, pp. 29–53. doi:10.1007/978-0-387-73033-2
Charlesworth, B., 1994. Evolution in age-structured populations, 2nd ed. Cambridge University
press.
Chen, L.P., Zhao, N.X., Zhang, L.H., Gao, Y.B., 2013. Responses of two dominant plant species
to drought stress and defoliation in the Inner Mongolia Steppe of China. Plant Ecol. 214, 221–
229. doi:10.1007/s11258-012-0161-y
Chimner, R. a, Welker, J.M., 2011. Influence of grazing and precipitation on ecosystem carbon
cycling in a mixed-grass prairie. Pastor. Res. Policy Pract. 1, 20. doi:10.1186/2041-7136-1-
20
Christensen, J.H., Hewitson, B., Busuioc, A., Chen, A., Gao, X., Held, I., Jones, R., Kolli, R.K.,
Kwon, W.-T., Laprise, R., Rueda, V.M., Mearns, L., Menéndez, C.G., Räisänen, J., Rinke,
A., Sarr, A., Whetton, P., 2007. Regional climate projections, in: Solomon, S., Qin, D.,
Manning, M., Chen, Z., Marquis, M., Averyt, K.B., Tignor, M., Miller, H.L. (Eds.), Climate
Change 2007: The Physical Science Basis. Contribution of Working Group I to the Fourth
Assessment Report of the Intergovernmental Panel on Climate Change. Cambridge
University Press, Cambridge, United Kingdom and New York, NY, USA.
Christensen, L., BurnSilver, S., Coughenour, M., 2005. Integrated Assessment of the Dynamics,
Stability and Resilience of the Inner Mongolian Grazing Ecosystems. Nomad. People. 9, 131–
145. doi:10.3167/082279405781826100
Conant, R.T., Paustian, K., Elliott, E.T., 2001. Grassland Management and Conversion Into
Grassland: Effects on Soil Carbon. Ecol. Appl. 11, 343–355.
Cook, S., Ma, Z., Brain, R., 2013. Rangeland Carbon Sequestration. ENVS Fac. Publ. Paper 868.,
1–4.
Coppock, D., Tezera, S., Eba, B., Doyo, J., Tadele, D., Teshome, D., Husein, N., Guru, M., 2014.
Sustainable Pastoralism in Ethiopia: Preliminary Results from Participatory Community
Assessments on the North-central Borana Plateau. Res. Brief RB-16-2014, n.p.
75
Coppock, D.L., 2016. Pastoral System Dynamics and Environmental Change on E thiopia’s North-
Central Borana Plateau - Influences of Livestock Development and Policy. End Desertif.
Springer Berlin Heidelberg. 327–362.
Coppock, D.L., 1994. The Borana Plateau of Southern Ethiopia : Synthesis of pastoral research ,
development and change, 1980-91. ILCA (International Livestock Centre for Africa). Addis
Ababa, Ethiopia. 393pp. Addis Ababa, Ethiopia.
Coppock, D.L., Gebru, G., Mesele, S., Desta, S., 2008. Are drought related crashes in pastoral
cattle herd predictable.pdf, in: Multifunctional Grasslands in a Changing World (in 2
Volumes)-Proceedings of the XXI International Grassland Congress and VIII International
Rangeland Congress. p. 1090.
Corson, D.C., Waghorn, G.C., Ulyatt, M.J., Lee, J., 1999. NIRS : Forage analysis and livestock
feeding. Proc. New Zeal. Grassl. Assoc. 61, 127–132.
Cossins, N.J., Upton, M., 1988a. Options for improvement of the Borana Pastoral System. Agric.
Syst. 27, 251–278. doi:10.1016/0308-521X(88)90035-2
Cossins, N.J., Upton, M., 1988b. The Impact of Climatic Variation on the Borana Pastoral System.
Agric. Syst. 27, 117–135. doi:10.1016/0308-521X(88)90035-2
Cossins, N.J., Upton, M., 1987. The Borana pastoral system of Southern Ethiopia. Agric. Syst. 25,
199–218. doi:10.1016/0308-521X(87)90020-5
Costantini, E.A.C., Branquinho, C., Nunes, A., Schwilch, G., Stavi, I., Valdecantos, A., Zucca, C.,
2016. Soil indicators to assess the effectiveness of restoration strategies in dryland
ecosystems. Solid Earth 7, 397–414. doi:10.5194/se-7-397-2016
Coulson, T., Ezard, T.H.G., Pelletier, F., Tavecchia, G., Stenseth, N.C., Childs, D.Z., Pilkington,
J.G., Pemberton, J.M., Kruuk, L.E.B., Clutton-Brock, T.H., Crawley, M.J., 2008. Estimating
the functional form for the density dependence from life history data 89, 1661–1674.
doi:10.1890/07-1099.1
CSA, 2015. Federal Democratic Republic of Ethiopia Central Statistical Agency. Agricultural
sample survey report on livestock and livestock characteristics. STATISTICAL BULLETIN
578. Addis Ababa, Ethiopia.
CSA, 2014. Federal Democratic Republic of Ethiopia Central Statistical Agency. Agricultural
sample survey report on livestock and livestock characteristics. STATISTICAL BULLETIN
532. Addis Ababa, Ethiopia.
CSA, 2013. Federal Democratic Republic of Ethiopia Central Statistical Agency. Agricultural
sample survey report on livestock and livestock characteristics. STATISTICAL BULLETIN
570. Addis Ababa, Ethiopia.
CSA, 2012. Federal Democratic Republic of Ethiopia Central Statistical Agency. Agricultural
sample survey report on livestock and livestock characteristics. STATISTICAL BULLETIN
532. Addis Ababa, Ethiopia.
CSA, 2011. Federal Democratic Republic of Ethiopia Central Statistical Agency. Agricultural
sample survey report on livestock and livestock characteristics. STATISTICAL BULLETIN
505. Addis Ababa, Ethiopia.
CSA, 2010. Federal Democratic Republic of Ethiopia Central Statistical Agency. Agricultural
sample survey report on livestock and livestock characteristics. STATISTICAL BULLETIN
468. Addis Ababa, Ethiopia.
76
CSA, 2009. Federal Democratic Republic of Ethiopia Central Statistical Agency. Agricultural
sample survey report on livestock and livestock characteristics. STATISTICAL BULLETIN
446. Addis Ababa, Ethiopia.
CSA, 2008. Federal Democratic Republic of Ethiopia Central Statistical Agency. Agricultural
sample survey report on livestock and livestock characteristics. STATISTICAL BULLETIN
417. Addis Ababa, Ethiopia.
CSA, 2007. Federal Democratic Republic of Ethiopia Central Statistical Agency. Agricultural
sample survey report on livestock and livestock characteristics. STATISTICAL BULLETIN
388. Addis Ababa, Ethiopia.
CSA, 2006. Federal Democratic Republic of Ethiopia Central Statistical Agency. Agricultural
sample survey report on livestock and livestock characteristics. STATISTICAL BULLETIN
364. Addis Ababa, Ethiopia.
CSA, 2005. Federal Democratic Republic of Ethiopia Central Statistical Agency. Agricultural
sample survey report on livestock and livestock characteristics. STATISTICAL BULLETIN
331. Addis Ababa, Ethiopia.
CSA, 2004. Federal Democratic Republic of Ethiopia Central Statistical Agency. Agricultural
sample survey report on livestock and livestock characteristics. STATISTICAL BULLETIN
302. Addis Ababa, Ethiopia.
Cui, X., Wang, Y., Niu, H., Wu, J., Wang, S., Schnug, E., Rogasik, J., Fleckenstein, J., Tang, Y.,
2005. Effect of long-term grazing on soil organic carbon content in semiarid steppes in Inner
Mongolia. Ecol. Res. 20, 519–527. doi:10.1007/s11284-005-0063-8
Cuykendall, C.H., Marten, G.C., 1968. Defoliation by Sheep-Grazing Versus Mower-Clipping for
Evaluation of Pasture. Agron. J. 60, 404–408.
Dalle, G., Maass, B., Isselstein, J., 2009. Rangeland condition and trend in the semi-arid Borana
lowlands, southern Oromia, Ethiopia. African J. Range Forage Sci. 23, 49–58.
doi:10.2989/10220110609485886
Dalle, G., Maass, B.L., Isselstein, J., 2006. Encroachment of woody plants and its impact on
pastoral livestock production in the Borana lowlands, southern Oromia, Ethiopia. Afr. J. Ecol.
44, 237–246. doi:10.1111/j.1365-2028.2006.00638.x
Davies, J., Niamir-Fuller, M., Kerven, K., Bauer, K., 2010. Extensive livestock production in
transition: the future of sustainable pastoralism.
De Leeuw, P.N., Tothill, J.C., 1990. the Concept of Rangeland Carrying Capacity. L. Degrad.
Rehabil. 1–19. doi:0951 1911
de Roos, A.M., 1997. A Gentle Introduction to Physiologically Structured Population Models, in:
Tuljapurkar, S., Caswell, H. (Eds.), Structured-Population Models in Marine, Terrestrial, and
Freshwater Systems. Chapman & Hali, pp. 119–204. doi:10.1007/978-1-4615-5973-3
de Vries, M.F.W., Schippers, P., 1994. Foraging in a landscape mosaic: selection for energy and
minerals in free-ranging cattle. Oecologia 100, 107–117. doi:10.1007/BF00317137
Deressa, T.T., 2007. Measuring the Economic Impact of Climate Change on Ethiopian
Agriculture: Ricardian Approach, Social Science Research Network.
doi:10.2139/ssrn.1012474
Derner, J.D., Boutton, T.W., Briske, D.D., 2006. Grazing and ecosystem carbon storage in the
North American Great Plains. Plant Soil 280, 77–90. doi:10.1007/s11104-005-2554-3
77
Desta, S., 2013. Transitions in pastoral practices and livelihoods under changing climate: The case
of Borana pastoralists in Southern Ethiopia, Climate Change Vulnerability and Risk
Assessment of Agriculture and Food Security in Ethiopia: Which Way Forward? Working
Paper No. 59 CGIAR. doi:10.1016/S1574
Desta, S., 2006. Pastoralism and development in Ethiopia. Econ. Focus 9, 12–20.
Desta, S., Coppock, D.L., 2004. Pastoralism under pressure: Tracking system change in Southern
Ethiopia. Hum. Ecol. 32, 465–486. doi:10.1023/B:HUEC.0000043516.56037.6b
Desta, S., Coppock, D.L., 2002. Cattle population dynamics in the southern Ethiopian. J. Range
Manag. 55, 439–451.
Di Fonzo, M., Collen, B., Mace, G.M., 2013. A new method for identifying rapid decline dynamics
in wild vertebrate populations. Ecol. Evol. 3, 2378–2391. doi:10.1002/ece3.596
Dida, B., 2011. Range Enclosures in Southern Oromia, Ethiopia: An Innovative Response or
Erosion in Common Property Resource Tenure? Research Update, in: The International
Conference on the Future of Pastoralism. pp. 21–23. doi:10.1017/CBO9781107415324.004
Doherty, J., 2004. PEST: Model independent parameter estimation. Fifth edition of user manual,
Watermark Numerical Computing. doi:10.1016/B978-0-08-098288-5.00031-2
Downs, M., Sala, O.E., 2009. Grasslands, in: Levin, S.A. (Ed.), The Princeton Guide to Ecology.
Princeton University Press.
Elias, M., Hensel, O., Richter, U., Hülsebusch, C., Kaufmann, B., Wasonga, O., 2015. Land
Conversion Dynamics in the Borana Rangelands of Southern Ethiopia: An Integrated
Assessment Using Remote Sensing Techniques and Field Survey Data, Environments.
doi:10.3390/environments2010001
Ellis, J., Swift, D., 1988. The Dominant Paradigm: Pastoral Degradation of Equilibria1
Ecosystems. J. Range Manag. 41, 450–459. doi:10.2307/3899515
Engel, R.K., Nichols, J.T., Dodd, J.L., Brummer, J.E., 1998. Root and shoot responses of sand
bluestem to defoliation. J. Range Manag. 51, 42–46. doi:10.2307/4003562
Engen, S., Lande, R., Sæther, B.E., Festa-Bianchet, M., 2007. Using reproductive value to estimate
key parameters in density-independent age-structured populations. J. Theor. Biol. 244, 308–
317. doi:10.1016/j.jtbi.2006.08.009
Evans, M.E.K., Holsinger, K.E., Menges, E.S., 2010. Fire, vital rates, and population viability: a
hierarchical Bayesian analysis of the endangered Florida scrub mint. Ecol. Monogr. 80, 627–
649.
Ezanno, P., 2005. Dynamics of a tropical cattle herd in a variable environment: A modelling
approach in order to identify the target period and animals on which concentrating
management efforts to improve productivity. Ecol. Modell. 188, 470–482. doi:DOI:
10.1016/j.ecolmodel.2005.02.016
Falk, J.M., Schmidt, N.M., Ström, L., 2014. Effects of simulated increased grazing on carbon
allocation patterns in a high arctic mire. Biogeochemistry 119, 229–244. doi:10.1007/s10533-
014-9962-5
Fan, J.W., Wang, K., Harris, W., Zhong, H.P., Hu, Z.M., Han, B., Zhang, W.Y., Wang, J.B., 2009.
Allocation of vegetation biomass across a climate-related gradient in the grasslands of Inner
Mongolia. J. Arid Environ. 73, 521–528. doi:10.1016/j.jaridenv.2008.12.004
FAO, 2010. Challenges and opportunities for carbon sequestration in grassland systems A
78
technical report on grassland management and climate change mitigation. Rome.
FAO, 2009. Review of evidence on drylands pastoral systems and climate change: implications
and opportunities for mitigation and adaptation. Land and water discussion paper 8.
FAO, 2007. The state of the world’s animal genetic resources for food and agriculture, edited by
Dafydd Pilling & Barbara Rischkowsky. Rome.
FAO, 2003. World agriculture : towards 2015 / 2030 World agriculture : towards 2015 / 2030,
Organization. doi:10.1016/S0264-8377(03)00047-4
FAO, 1991. Guidelines: land evaluation for extensive grazing, Soils Bulletin 58. Food and
Agriculture Organization of the United Nations, Rome, Italy.
Farmer, E., 2010. End Market Analysis of Ethiopian Livestock and Meat. A Desk Study Micro
report 164.
Farooq, M., Wahid, A., Basra, N.K.D.F.S.M. a, Fujita, N.K.D., Plant, S.M. a B., 2009. Plant
drought stress : effects , mechanisms and management To cite this version : Review article.
Agron. Sustain. Dev. Springer Verlag 29, 185–212. doi:10.1051/agro:2008021
Fay, P.A., Blair, J.M., Smith, M.D., Nippert, J.B., Carlisle, J.D., Knapp, A.K., 2011. Relative
effects of precipitation variability and warming on tallgrass prairie ecosystem function.
Biogeosciences 8, 3053–3068. doi:10.5194/bg-8-3053-2011
Fay, P.A., Carlisle, J.D., Knapp, A.K., Blair, J.M., Collins, S.L., 2003. Productivity responses to
altered rainfall patterns in a C 4-dominated grassland. Oecologia 137, 245–251.
doi:10.1007/s00442-003-1331-3
Fay, P.A., Carlisle, J.D., Knapp, A.K., Blair, J.M., Collins, S.L., 2000. Altering rainfall timing and
quantity in a mesic grassland ecosystem: Design and performance of rainfall manipulation
shelters. Ecosystems 3, 308–319. doi:10.1007/s100210000028
Fernandez-Gimenez, M.E., Le Febre, S., 2006. Mobility in pastoral systems: Dynamic flux or
downward trend? Int. J. Sustain. Dev. World Ecol. 13, 341–362.
doi:10.1080/13504500609469685
Fidelis, A., Lyra, M.F. di S., Pivello, V.R., 2013. Above- and below-ground biomass and carbon
dynamics in Brazilian Cerrado wet grasslands. J. Veg. Sci. 24, 356–364. doi:10.1111/j.1654-
1103.2012.01465.x
Finkelstein, M., Cha, J.H., 2013. Stochastic Modeling for Reliability: Scocks, Burn-in and
Heterogeneous Population. Springer. doi:10.1007/978-1-4471-5028-2
Flintan, F., 2012. Making rangelands secure: Past experience and future options.
Flintan, F., Tache, B., Eid, A., 2011. Rangeland fragmentation in traditional grazing areas and its
impact on drought resilience of pastoral communities : Lessons from Borana , Oromia and
Harshin , Somali Regional States , Ethiopia [WWW Document]. URL
http://www.fao.org/fileadmin/user_upload/drought/docs/Ethiopia Land Fragmentation
Report_FINAL 7 feb 2012.pdf (accessed 11.1.15).
Forrest, B., Bailey, D., Ward, R., Coppock, D.L., 2014. Can Bush-Clearing, Deferred Grazing, or
Camels Help Mitigate Climate-Change and Population Effects for Borana Pastoralists? An
Economic Analysis of Potential Interventions. Res. Brief RB-19-2014.
Fox, N.J., Marion, G., Davidson, R.S., White, P.C.L., Hutchings, M.R., 2012. Livestock helminths
in a changing climate: Approaches and restrictions to meaningful predic. Animals 2, 93–107.
doi:10.3390/ani2010093
79
Frank, A., Berdahl, J., Hanson, J., 2004. Biomass and carbon partitioning in switchgrass. Crop Sci.
1396, 1391–1396.
Frank, D.A., Kuns, M.M., Guido, D.R., 2002. Consumer control of grassland plant production.
Ecology 83, 602–606. doi:10.1890/0012-9658(2002)083[0602:CCOGPP]2.0.CO;2
Fritz, H., Duncan, P., 2004. On the carrying capacity for large ungulates of African Savanna
ecosystems. Proc. Biol. Sci. 256, 78–82.
Funk, C., Hoell, A., Shukla, S., Blad??, I., Liebmann, B., Roberts, J.B., Robertson, F.R., Husak,
G., 2014. Predicting East African spring droughts using Pacific and Indian Ocean sea surface
temperature indices. Hydrol. Earth Syst. Sci. 18, 4965–4978. doi:10.5194/hess-18-4965-2014
Fynn, A.J., Alvarez, P., Brown, J.R., George, M.R., Kustin, C., Laca, E.A., Oldfield, J.T., Schohr,
T., Neely, C.L., Wong, C.P., 2010. Soil carbon sequestration in USA rangelands. Integr. Crop
Manag. 11, 57–104.
Fynn, R.W.S., O’Connor, T.G., 2000. Effect of stocking rate and rainfall on rangeland dynamics
and cattle performance in a semi-arid savanna, South Africa. J. Appl. Ecol. 37, 491–507.
doi:10.1046/j.1365-2664.2000.00513.x
Gaillard, J..-M.., Festa-Bianchet, M.., Yoccoz, N.. G.., Loison, A.., Toigo, C.., 2000. Temporal
Variation in Fitness Components and Population Dynamics of Large Herbivores. Annu. Rev.
Ecol. Syst. 31, 367–393.
Gaillard, J.M., Festa-Bianchet, M., Yoccoz, N.G., 1998. Population dynamics of large herbivores:
variable recruitment with constant adult survival (vol 13, pg 58, 1998). Trends Ecol. Evol.
13, 170. doi:10.1016/s0169-5347(97)01237-8
Gao, Y.Z., Giese, M., Lin, S., Sattelmacher, B., Zhao, Y., Brueck, H., 2008. Belowground net
primary productivity and biomass allocation of a grassland in Inner Mongolia is affected by
grazing intensity. Plant Soil 307, 41–50. doi:10.1007/s11104-008-9579-3
Garcia-Pausas, J., Casals, P., Romanyà, J., Vallecillo, S., Sebastià, M.T., 2011. Seasonal patterns
of belowground biomass and productivity in mountain grasslands in the Pyrenees. Plant Soil
340, 315–326. doi:10.1007/s11104-010-0601-1
Gebeye, B.A., 2016. Unsustain the Sustainable: An Evaluation of the Legal and Policy
Interventions for Pastoral Development in Ethiopia. Pastoralism 6, 1–14.
doi:10.1186/s13570-016-0049-x
Gemedo-Dalle, Maass, B.L., Isselstein, J., 2006. Rangeland condition and trend in the semi-arid
Rangeland condition and trend in the semi-arid Borana lowlands , southern. African J. Range
Forage Sci. 23, 49–58.
Georgiadis, N., Hack, M., Turpin, K., 2003. The influence of rainfall on zebra population
dynamics: Implications for management. J. Appl. Ecol. 40, 125–136. doi:10.1046/j.1365-
2664.2003.00796.x
Georgiadis, N.J., McNaughton, S.J., 1990. Elemental and fibre contents of savanna grasses:
variation with grazing, soil type, season and species. J. Appl. Ecol. 27, 623–634.
doi:10.2307/2404307
Getz, W.M., 1988. Harvesting discrete nonlinear age and stage structured populations. J. Optim.
Theory Appl. 57, 69–83. doi:10.1007/BF00939330
Gifford, R.M., 2010. Carbon sequestration in Australian grasslands: policy and technical issues,
in: Abberton, M., Conant, R., Batello, C. (Eds.), Integrated Crop Management Grassland
80
Carbon Sequestration: Management, Policy and Economics. Proceedings of the Workshop
on the Role of Grassland Carbon Sequestration in the Mitigation of Climate Change. pp. 31–
56.
Gilbert, A.A., Fraser, L.H., 2013. Effects of salinity and clipping on biomass and competition
between a halophyte and a glycophyte. Plant Ecol. 214, 433–442. doi:10.1007/s11258-013-
0180-3
Gillson, L., Hoffman, M.T., 2007. Rangeland ecology in a changing world. Science (80-. ). 315,
53–54. doi:10.1126/science.1136577
Godfray, H.C.J., 2009. Population Ecology, in: Simon A. Levin, Stephen R. Carpenter, H. Charles
J. Godfray, Ann P. Kinzig, Michel Loreau, Jonathan B. Losos, Brian Walker, D.S.W., Morris,
C.G. (Eds.), The Princeton Guide to Ecology. Princeton University Press, Princeton, New
Jersey, pp. 153–154.
Goel, N.S., Dyn, N.R., 1974. Stochastic models in biology.
Golodets, C., Sternberg, M., Kigel, J., Boeken, B., Henkin, Z., Seligman, N.G., Ungar, E.D., 2013.
From desert to Mediterranean rangelands: Will increasing drought and inter-annual rainfall
variability affect herbaceous annual primary productivity? Clim. Change 119, 785–798.
doi:10.1007/s10584-013-0758-8
Gómez, S., Ferrieri, R. a, Schueller, M., Orians, C.M., 2010. Methyl jasmonate elicits rapid
changes in carbon and nitrogen dynamics in tomato. New Phytol. 188, 835–844.
doi:10.1111/j.1469-8137.2010.03414.x
Gonze, D., 2015. The logistic equation.
Gurmessa, D., Nemomissa, S., Tadesse, G., 2013. Borana Rangeland change from 1986-2003 : the
application of Remote Sensing and GIS, in: Proceedings of Global Geospatial Conference
2013 Addis Ababa, Ethiopia, 4-8 November 2013.
Habtemicael, M., Yayneshet, T., Treydte, A.C., 2014. Responses of vegetation and soils to three
grazing management regimes in a semi-arid highland mixed crop-livestock system. Afr. J.
Ecol. 53, 75–82. doi:10.1111/aje.12185
Haddad, N.M., Brudvig, L. a., Clobert, J., Davies, K.F., Gonzalez, A., Holt, R.D., Lovejoy, T.E.,
Sexton, J.O., Austin, M.P., Collins, C.D., Cook, W.M., Damschen, E.I., Ewers, R.M., Foster,
B.L., Jenkins, C.N., King, a. J., Laurance, W.F., Levey, D.J., Margules, C.R., Melbourne, B.
a., Nicholls, a. O., Orrock, J.L., Song, D.-X., Townshend, J.R., 2015. Habitat fragmentation
and its lasting impact on Earth’s ecosystems. Sci. Adv. 1, 1–9. doi:10.1126/sciadv.1500052
Hafner, S., Unteregelsbacher, S., Seeber, E., Lena, B., Xu, X., Li, X., Guggenberger, G., Miehe,
G., Kuzyakov, Y., 2012. Effect of grazing on carbon stocks and assimilate partitioning in a
Tibetan montane pasture revealed by 13CO 2 pulse labeling. Glob. Chang. Biol. 18, 528–
538. doi:10.1111/j.1365-2486.2011.02557.x
Haile, A., Ayalew, W., Kebede, N., Dessie, T., Tegegne, A., 2011. Breeding strategy to improve
Ethiopian Boran cattle for meat and milk production. IPMS (Improving Productivity and
Market Success) of Ethiopian Farmers Project Working Paper 26. Nairobi, Kenya, ILRI.
Haile, G., Assen, M., Ebro, A., 2010. Land use/Cover dynamics and its implications since the
1960s in the Borana rangelands of Southern Ethiopia. Livest. Res. Rural Dev. 22.
Halley, J.M., Iwasa, Y., 1998. Extinction rate of a population under both demographic and
environmental stochasticity. Theor. Popul. Biol. 53, 1–15. doi:10.1006/tpbi.1997.1336
81
Hasen-Yusuf, M., Treydte, A.C., Abule, E., Sauerborn, J., 2013. Predicting aboveground biomass
of woody encroacher species in semi-arid rangelands, Ethiopia. J. Arid Environ. 96, 64–72.
doi:10.1016/j.jaridenv.2013.04.007
Hastings, A., 1997. Population Biology: Concepts and Models. Springer, New York.
He, B., Cui, X., Wang, H., Chen, A., 2014. Drought: The most important physical stress of
terrestrial ecosystems. Acta Ecol. Sin. 34, 179–183. doi:10.1016/j.chnaes.2014.05.004
Helland, J., 2001. Participation and Governance in the Development of Borana: Southern Ethiopia,
in: Salih, M. a. M., Dietz, T., Ahmad, A.G.M. (Eds.), African Pastoralism: Conflict,
Institutions and Government. International Conference on ’Resource Competition and
Sustainable Development in Eastern and Southern Africa. p. 320.
Helland, J., 1998. Institutional Erosion in the Drylands: Case of the Borana Pastoralists. East. Afr.
Soc. Sci. Res. Rev. 14, 49–72.
Henricksen, B.L., Durkin, J.W., 1986. Growing period and drought early warning in Africa using
satellite data. Int. J. Remote Sens. 7, 1583–1608. doi:10.1080/01431168608948955
Herrero-Jáuregui, C., Schmitz, M.F., Pineda, F.D., 2016. Effects of different clipping intensities
on above- and below-ground production in simulated herbaceous plant communities. Plant
Biosyst. - An Int. J. Deal. with all Asp. Plant Biol. 150, 468–476.
doi:10.1080/11263504.2014.965800
HLPE, 2012. Food security and climate change. A report by the High Level Panel of Experts on
Food Security and Nutrition of the Committee on World Food Security. Rome.
Holden, S.J., Coppock, D.L., Assefa, M., 1991. Pastoral dairy marketing and household wealth
interactions and their implications for calves and humans in Ethiopia. Hum. Ecol. 19, 35–59.
doi:10.1007/BF00888976
Holechek, J.L., Thomas, M., Molinar, F., Galt, D., 1999. Stocking Desert Rangelands: What
We’ve Learned. Rangelands 21, 8–12.
Holub, P., Fabšičová, M., Tůma, I., Záhora, J., Fiala, K., 2013. Effects of artificially varying
amounts of rainfall on two semi‐natural grassland types. J. Veg. Sci. 24, 518–529.
doi:10.1111/j.1654-1103.2012.01487.x
Homann, S., 2004. Indigenous knowledge of Borana pastoralists in natural resource management :
a case study from southern Ethiopia. Justus Liebig University Giessen.
Homann, S., Rischkowsky, B., Jörg, S., Workneh, A., 2004. Disturbed Traditional Resource
Management affects the Preservation of the Boran Cattle in their Original Habitat. Ethiop. J.
Anim. Prod. 4, 33–44.
Homann, S., Rischkowsky, B., Jörg, S., Workneh, A., 2003. Degradation of Borana Rangelands
Causes Genetic Erosion of the Typical Boran Cattle. A poster presented at “ Technological
and Institutional Innovations for Sustainable Rural Development ” Deutscher Tropentag,
October 8-10, 2003, Göttingen.
Homann, S., Rischkowsky, B., Steinbach, J., Kirk, M., Mathias, E., 2008. Towards Endogenous
Livestock Development: Borana Pastoralists’ Responses to Environmental and Institutional
Changes. Hum. Ecol. 36, 503–520. doi:10.1007/s10745-008-9180-7
Hoogenboom, G., Huck, M.G., Peterson, C.M., 1987. Root Growth Rate of Soybean as Affected
by Drought Stress. Agron. J. 614, 607–614.
Horvitz, C., Schemske, D.W., Caswell, H., 1997. The relative “importance” of life-history stages
82
to population growth: prospective and retrospective analyses. Struct. Model. Mar. Terr.
Freshw. Syst. 298, 247–271.
Hussain, F., Durrani, M.J., 2009. Nutritional evaluation of some forage plants from Harboi
rangeland, Kalat, Pakistan. Pakistan J. Bot. 41, 1137–1154.
ILCA, 1992. ILCA’s Rangeland Research Program in the arid and semiarid zones: Review and
recommendations. ILRI.
ILCA, 1985. The productivity and potential of the southern rangelands of Ethiopia., in: JOINT
ILCA/RDP ETHIOPIAN SYSTEMS STUDY PROGRAMME. pp. 107–200.
ILCA/ILRAD, 1988. Livestock production in tsetse affected areas of Africa. The African
trypanaotolerant livestock network Tsetse, in: Proceedings of a Meeting Held in Nairobi,
Kenya from the 23rd to 27th November 1978 Organized by the International Livestock Centre
for Africa and the International Laboratory for Research on Animal Diseases.
Illius, A.W., O’Connor, T.G., 2000. Resource heterogenity and ungulate population dynamics.
Oikos 89, 283–294. doi:10.1034/j.1600-0706.2000.890209.x
Illius, A.W., O’Connor, T.G., 1999. On the Relevance of Nonequilibrium Concepts to Arid and
Semiarid Grazing Systems. Ecol. Appl. 9, 798–813.
ILRI, 2008. ILRI Annual Report 2007: Markets That Work: Making a Living from Livestock.
ILRI, Nairobi, Kenya., The effects of brief mindfulness intervention on acute pain experience:
An examination of individual difference. doi:10.1017/CBO9781107415324.004
IPCC, 2013. Summary for Policymakers. In: Climate Change 2013: The Physical Science Basis:
Contribution of Working Group I to the Fifth Assessment Report of the Intergovernmental
Panel on Climate Change. Cambridge University Press, Cambridge, United Kingdom and
New York, NY, USA. doi:10.1017/CBO9781107415324.004
IPCC, 2007. Climate Change 2007: The Physical Science Basis Contribution of Working Group I
to the Fourth Assessment Report of the Intergovernmental Panel on Climate Change.
Cambridge University Press, Cambridge, United Kingdom and New York, NY, USA,.
doi:http://dx.doi.org/10.1017/CBO9780511546013
IPCC, 2001. Climate change 2001: impacts, adaptation, and vulnerability. Contribution of
Working Group II to the Third Assessment Report of the Intergovernmental Panel on Climate
Change. Published for the Intergovernmental Panel on Climate Change.
James, J.J., Carrick, P.J., 2016. Toward quantitative dryland restoration models. Restor. Ecol. 24,
S85–S90. doi:10.1111/rec.12393
James, J.J., Sheley, R.L., Erickson, T., Rollins, K.S., Taylor, M.H., Dixon, K.W., 2013. A systems
approach to restoring degraded drylands. J. Appl. Ecol. 50, 730–739. doi:10.1111/1365-
2664.12090
Jensen, H.P., Gillen, R.L., McCollum, F.T., 1990. Effects Of Herbage Allowance On Defoliation
Patterns Of Tallgrass Prairie. J. Range Manag. 43, 401–406.
Jeppsson, T., 2009. Stochasticity in the extinction process.
Jobbágy, E.G., Sala, O.E., 2000. Controls of grass and shrub aboveground production in the
Patagonian steppe. Ecol. Appl. 10, 541–549.
Jorge, M.A.B., Wouw, M. van de, Hanson, J., Mohammed, J., 2008. Characterisation of a
collection of buffel grass (Cenchrus ciliaris). Trop. Grasslands 42, 27–39.
83
Kahi, A.K., Wasike, C.B., Rewe, T.O., 2006. Beef production in the arid and semi-arid lands of
Kenya: Constraints and prospects for research and development. Outlook Agric. 35, 217–
225. doi:10.5367/000000006778536800
Kakinuma, K., Sasaki, T., Jamsran, U., Okuro, T., Takeuchi, K., 2014. Relationship Between
Pastoralists??? Evaluation of Rangeland State and Vegetation Threshold Changes in
Mongolian Rangelands. Environ. Manage. 54, 888–896. doi:10.1007/s00267-014-0341-8
Kamara, A., Kirk, M., Swallow, B., 2005. Property Rights and Land Use Change: Implications for
Sustainable Resource Management in Borana, Southern Ethiopia. J. Sustain. Agric. 25, 41–
61. doi:10.1300/J064v25n02_05
Kamara, A.B., Swallow, B., Kirk, M., 2004. Policies , Interventions and Institutional Change in
Pastoral Resource Management in Borana , Southern Ethiopia 22, 381–403.
Keba, H.T., Madakadze, I.C., Angassa, A., Hassen, A., 2013. Nutritive value of grasses in semi-
arid rangelands of Ethiopia: Local experience based herbage preference evaluation versus
laboratory analysis. Asian-Australasian J. Anim. Sci. 26, 366–377.
doi:10.5713/ajas.2012.12551
Keshavarz, M., Maleksaeidi, H., Karami, E., 2017. Livelihood vulnerability to drought: A case of
rural Iran. Int. J. Disaster Risk Reduct. 21, 223–230. doi:10.1016/j.ijdrr.2016.12.012
Kimiti, D.W., Hodge, A.-M.C., Herrick, J.E., Beh, A.W., Abbott, L.E., 2017. Rehabilitation of
community-owned, mixed-use rangelands: lessons from the Ewaso ecosystem in Kenya.
Plant Ecol. doi:10.1007/s11258-016-0691-9
Kleijnen, J.P.C., 1995. Statistical validation of simulation models. Eur. J. Oper. Res. 87, 21–34.
doi:10.1016/0377-2217(95)00132-A
Klein, J.A., Harte, J., Zhao, X.Q., 2007. Experimental warming, not grazing, decreases rangeland
quality on the Tibetan Plateau. Ecol. Appl. 17, 541–557. doi:10.1890/05-0685
Knapp, A.K., Beier, C., Briske, D.D., Classen, A.T., Luo, Y., Reichstein, M., Smith, M.D., Smith,
S.D., Bell, J.E., Fay, P. a., Heisler, J.L., Leavitt, S.W., Sherry, R., Smith, B., Weng, E., 2008.
Consequences of More Extreme Precipitation Regimes for Terrestrial Ecosystems.
Bioscience 58, 811. doi:10.1641/B580908
Knapp, A.K., Briggs, J.M., Koelliker, J.K., 2001. Frequency and extent of water limitation to
primary production in a mesic temperate grassland. Ecosystems 4, 19–28.
doi:10.1007/s100210000057
Knapp, A.K., Burns, C.E., Fynn, R.W.S., Kirkman, K.P., Morris, C.D., Smith, M.D., 2006.
Convergence and contingency in production-precipitation relationships in North American
and South African C4 grasslands. Oecologia 149, 456–464. doi:10.1007/s00442-006-0468-2
Köchy, M., Mathaj, M., Jeltsch, F., Malkinson, D., 2008. Resilience of stocking capacity to
changing climate in arid to Mediterranean landscapes. Reg. Environ. Chang. 8, 73–87.
doi:10.1007/s10113-008-0048-6
Koech, O.K., Kinuthia, R.N., Karuku, G.N., Mureithi, S.M., Wanjogu, R., 2015. Water use
efficiency of six rangeland grasses under varied soil moisture content levels in the arid Tana
River County, Kenya. African J. Environ. Sci. Technol. 9, 632–640.
doi:10.5897/AJEST2015.1917
Kori, E., Gondo, T., Madilonga, R., 2012. The Influence of Rainfall Variability on Arable Land
Use at Local Level: Realities from Nzhelele Valley, South Africa. Int. Conf. Futur. Environ.
Energy 28, 218–223.
84
Kramberger, B., Gselman, A., Podvršnik, M., Lešnik, M., Škorjanc, D., 2014. Effects of low
precipitation periods on the herbage yield of mesic semi-natural grasslands under different
cutting regimes. Zemdirbyste-Agriculture 101, 11–18. doi:10.13080/z-a.2014.101.002
Kuzyakov, Y., Domanski, G., 2000. Carbon input by plants into the soil. Review. J. Plant Nutr.
Soil Sci. 163, 421–431. doi:10.1002/1522-2624(200008)163:4<421::aid-jpln421>3.0.co;2-r
Larreguy, C., Carrera, A.L., Bertiller, M.B., 2014. Effects of long-term grazing disturbance on the
belowground storage of organic carbon in the patagonian monte, argentina. J. Environ.
Manage. 134, 47–55. doi:10.1016/j.jenvman.2013.12.024
Le Houerou, H.N., 1989. The Grazing Land Ecosystems of the African Sahel. Ecological Studies,
Analysis and Synthesis. Springer Verlag, Berlin. doi:10.1007/978-3-642-74457-0
Leriche, H., Le Roux, X., Desnoyers, F., Benest, D., Simioni, G., Abbadie, L., 2003. Grass
response to clipping in an african savanna: Testing the grazing optimization hypothesis. Ecol.
Appl. 13, 1346–1354. doi:10.1890/02-5199
Lesnoff, M., Corniaux, C., Hiernaux, P., 2012. Sensitivity analysis of the recovery dynamics of a
cattle population following drought in the Sahel region. Ecol. Modell. 232, 28–39.
doi:10.1016/j.ecolmodel.2012.02.018
Lind, J., Sabates-Wheeler, R., Kohnstamm, S., Caravani, M., Eid, A., Nightingale, D.M., Oringa,
C., 2016. Changes in the drylands of eastern Africa : case studies of pastoralist systems in the
region.
Littell, R.C., Stroup, W.W., Freund, R.J., 2002. SAS for linear models. SAS Institute., 4th ed.
Lund, H.G., 2007. Accounting for the World’s Rangelands. Rangelands 29, 3–10.
Lybbert, T.J., Barrett, C.B., Desta, S., Coppock, D.L., 2000. Pastoral Risk and Wealth-
Differentiated Herd Accumulation Patterns in Southern Ethiopia Pastoral Risk and Wealth-
Differentiated Herd Accumulation Patterns in Southern Ethiopia 1–36.
Macey, R., Oster, G., Zahnley, T., 2009. Berkeley Madonna User’s Guide. Integr. Vlsi J.
Mapfumo, E., Naeth, M. a, Baron, V.S., Dick, a C., Chanasyk, D.S., 2002. Grazing impacts on
litter and roots : perennial versus annual grasses. J. Range Manag. 55, 16–22.
doi:10.2307/4003258
Marshall, V.M., Lewis, M.M., Ostendorf, B., 2012. Buffel grass (Cenchrus ciliaris) as an invader
and threat to biodiversity in arid environments: A review. J. Arid Environ. 78, 1–12.
doi:10.1016/j.jaridenv.2011.11.005
Martin, D.W., Chambers, J.C., 2001. Restoring Degraded Riparian Meadows: Biomass and
Species Responses. J. Range Manag. 54, 284–291. doi:10.2307/4003249
Martin, R., Müller, B., Linstädter, A., Frank, K., 2014. How much climate change can pastoral
livelihoods tolerate? Modelling rangeland use and evaluating risk. Glob. Environ. Chang. 24,
183–192. doi:10.1016/j.gloenvcha.2013.09.009
Masih, I., Maskey, S., Mussá, F.E.F., Trambauer, P., 2014. A review of droughts in the African
continent: a geospatial and long-term perspective. Hydrol. Earth Syst. Sci. Discuss. 3635–
3649. doi:10.5194/hessd-11-2679-2014
Mayer, D.G., Butler, D.G., 1993. Statistical validation. Ecol. Modell. 68, 21–32.
doi:10.1016/0304-3800(93)90105-2
Mbatha, K.R., Ward, D., 2010. The effects of grazing, fire, nitrogen and water availability on
85
nutritional quality of grass in semi-arid savanna, South Africa. J. Arid Environ. 74, 1294–
1301. doi:10.1016/j.jaridenv.2010.06.004
McCabe, J.T., 1987. Drought and recovery: Livestock dynamics among the Ngisonyoka Turkana
of Kenya. Hum. Ecol. 15, 371–389. doi:10.1007/BF00887997
McInenly, L.E., Merrill, E.H., Cahill, J.F., Juma, N.G., 2010. Festuca campestris alters root
morphology and growth in response to simulated grazing and nitrogen form. Funct. Ecol. 24,
283–292. doi:10.1111/j.1365-2435.2009.01642.x
McNaughton, S.J., 1983. Compensatory Plant Growth as a Response to Herbivory as a response
to herbivory Compensatory plant growth. Oikos 40, 329–336.
McSherry, M.E., Ritchie, M.E., 2013. Effects of grazing on grassland soil carbon: A global review.
Glob. Chang. Biol. 19, 1347–1357. doi:10.1111/gcb.12144
Meehl, G.A., Stocker, T.F., Collins, W.D., Friedlingstein, P., Gaye, A.T., Gregory, J.M., Kitoh,
A., Knutti, R., Murphy, J.M., Noda, A., Raper, S.C.B., Watterson, I.G., Weaver, A.J., Zhao,
Z.-C., 2007. Global Climate Projections, in: Solomon, S., Qin, D., Manning, M., Chen, Z.,
Marquis, M., Averyt, K.B., Tignor, M., Miller, H.L. (Eds.), Climate Change 2007: The
Physical Science Basis. Contribution of Working Group I to the Fourth Assessment Report
of the Intergovernmental Panel on Climate Change. Cambridge University press, Cambridge,
United Kingdom and New York, NY, USA.
Megersa, B., Markemann, A., Angassa, A., Ogutu, J.O., Piepho, H.P., Valle Zárate, A., 2014.
Livestock Diversification: An Adaptive Strategy to Climate and Rangeland Ecosystem
Changes in Southern Ethiopia. Hum. Ecol. 42, 509–520. doi:10.1007/s10745-014-9668-2
Mei, W., Xiuqin, F., Fusun, S., Yanxing, W., Qian, W., Tao, L., Yan, W., 2014. Compensatory
growth responding to clipping: a case study in a subtropical grassland northeast of
Chongqing. Chin J Appl Env. Biol 20, 474–483. doi:10.3724/SP.J.1145.2014.07031
Mekuria, W., 2013. Conversion of communal grazing lands into exclosures restored soil properties
in the semi-arid lowlands of Northern Ethiopia. Arid L. Res. Manag. 153–166.
doi:10.1080/15324982.2012.721858
Mengistu, A., 2002. Forage production in Ethiopia: a case study with implications for livestock
production. Forage production in Ethiopia: a case study with implications for livestock
production.
Mganga, K.Z., Musimba, N.K.R., Nyangito, M.M., Nyariki, D.M., Mwangombe, A.W., Ekaya,
W.N., Muiru, W.M., Clavel, D., Francis, J., Verhagen, Kaufmann, R. von, Verhagen J., 2011.
Grass Reseeding Technology as a Means of Rehabilitating Degraded Lands and Improving
Livelihoods of Agro-pastoral Communities in Semi-arid Kenya, in: Agricultural Innovations
for Sustainable Development (Eds. Guy Manners and Anne Sweetmore). Contributions from
the Finalists of the 2009/2010 Africa-Wide Women and Young Professionals in Science
Competitions, Accra, Ghana. doi:10.1017/CBO9781107415324.004
Mganga, K.Z., Musimba, N.K.R., Nyariki, D.M., 2015. Combining Sustainable Land Management
Technologies to Combat Land Degradation and Improve Rural Livelihoods in Semi-arid
Lands in Kenya. Environ. Manage. 56, 1538–1548. doi:10.1007/s00267-015-0579-9
Mganga, K.Z., Musimba, N.K.R., Nyariki, D.M., Nyangito, M.M., Mwang’ombe, A.W., 2013.
The choice of grass species to combat desertification in semi-arid Kenyan rangelands is
greatly influenced by their forage value for livestock. Grass Forage Sci. 70, 161–167.
doi:10.1111/gfs.12089
86
Millennium Ecosystem Assessment, 2005a. Ecosystems and HumanWell-being: Current State and
Trends, The Millennium Ecosystem Assessment series. doi:10.1007/BF02987493
Millennium Ecosystem Assessment, 2005b. Ecosystems and HumanWell-being: Current State and
Trends, Summary: Ecosystems and Their Services around the Year 2000.
Milne, E., Aynekulu, E., Bationo, A., Batjes, N.H., Boone, R., Conant, R., Davies, J., Hanan, N.,
Hoag, D., Herrick, J.E., Knausenberger, W., Neely, C., Njoka, J., Ngugi, M., Parton, B.,
Paustian, K., Reid, R., Said, M., Shepherd, K., Swift, D., Thornton, P., Williams, S., 2016.
Grazing lands in Sub-Saharan Africa and their potential role in climate change mitigation:
What we do and don’t know. Environ. Dev. doi:10.1016/j.envdev.2016.06.001
Miranda, J.D., Armas, C., Padilla, F.M., Pugnaire, F.I., 2011. Climatic change and rainfall
patterns: Effects on semi-arid plant communities of the Iberian Southeast. J. Arid Environ.
75, 1302–1309. doi:10.1016/j.jaridenv.2011.04.022
Montagnini, F., Nair, P.K.R., 2004. Carbon sequestration: An underexploited environmental
benefit of agroforestry systems. Agrofor. Ecosyst. 61, 281–295.
Moreno-Mateos, D., Barbier, E.B., Jones, P.C., Jones, H.P., Aronson, J., López-López, J.A.,
McCrackin, M.L., Meli, P., Montoya, D., Benayas, J.M.R., 2017. Anthropogenic ecosystem
disturbance and the recovery debt. Nat. Commun. 8, 8–13. doi:10.1038/ncomms14163
Müller, B., Schulze, J., Kreuer, D., Linstädter, A., Frank, K., 2015. How to avoid unsustainable
side effects of managing climate risk in drylands — The supplementary feeding controversy.
Agric. Syst. 139, 153–165. doi:10.1016/j.agsy.2015.07.001
Muthoni, F.K., Groen, T.A., Skidmore, A.K., van Oel, P., 2014. Ungulate herbivory overrides
rainfall impacts on herbaceous regrowth and residual biomass in a key resource area. J. Arid
Environ. 100–101, 9–17. doi:10.1016/j.jaridenv.2013.09.007
Mwangi, E., Wetterhall, F., Dutra, E., Di Giuseppe, F., Pappenberger, F., 2014. Forecasting
droughts in East Africa. Hydrol. Earth Syst. Sci. 18, 611–620. doi:10.5194/hess-18-611-2014
Naudts, K., Van den Berge, J., Janssens, I.A., Nijs, I., Ceulemans, R., 2013. Combined effects of
warming and elevated CO2 on the impact of drought in grassland species. Plant Soil 369,
497–507. doi:10.1007/s11104-013-1595-2
Negassa, A., Jabbar, M., 2008. Livestock ownership, commercial off-take rates and their
determinants in Ethiopia.
Ng’ang’a, S.K., Van Wijk, M.T., Rufino, M.C., Giller, K.E., 2016. Adaptation of agriculture to
climate change in semi-arid Borena, Ethiopia. Reg. Environ. Chang. doi:10.1007/s10113-
016-0940-4
Ngatia, L.W., Turner, B.L., Njoka, J.T., Young, T.P., Reddy, K.R., 2015. The effects of herbivory
and nutrients on plant biomass and carbon storage in Vertisols of an East African savanna.
Agric. Ecosyst. Environ. 208, 55–63. doi:10.1016/j.agee.2015.04.025
Niamir-Fuller, M., 1999. Managing Mobility in African Rangelands, in: Managing Mobility in
African Rangelands. Property Rights, Risk and Livestock Development. pp. 102–131.
Niamir-Fuller, M., 1998. The resilience of pastoral herding in Sahelian Africa, in: Berkes, F.,
Folke, C., & Colding, J. (Ed.), Linking Social and Ecological Systems: Management Practices
and Social Mechanisms for Building Resilience. Cambridge University Press, Cambridge, p.
250–284.
Nippert, J.B., Fay, P.A., Carlisle, J.D., Knapp, A.K., Smith, M.D., 2009. Ecophysiological
87
responses of two dominant grasses to altered temperature and precipitation regimes. Acta
Oecologica 35, 400–408. doi:10.1016/j.actao.2009.01.010
Nosetto, M.D., Jobbagy, E.G., Paruelo, J.M., 2006. Carbon sequestration in semi-arid rangelands:
Comparison of Pinus ponderosa plantations and grazing exclusion in NW Patagonia. J. Arid
Environ. 67, 142–156. doi:10.1016/j.jaridenv.2005.12.008
Nowak, R.S., Caldwell, M.M., 1984. A test of compensatory photosynthesis in the field:
implications for herbivory tolerance. Oecologia 61, 311–318.
Nyangito, M.M., Musimba, N.K.R., Nyariki, D.M., 2008. Range use and dynamics in the
agropastoral system of southeastern Kenya. African J. Environ. Sci. Technol. 2, 222–230.
Oakley, J.E., Youngman, B.D., 2015. Calibration of Complex Computer Simulators using
Likelihood Emulation. Technometrics. doi:10.1080/00401706.2015.1125391
Oba, G., 2001. The Effect of Multiple Droughts on Cattle in Obbu, Northern Kenya. J. Arid
Environ. 49, 375–386. doi:10.1006/jare.2000.0785
Oba, G., Kotile, D.G., 2001. Assessments of landscape level degradation in Southern Ethiopia:
Pastoralists versus ecologists. L. Degrad. Dev. 12, 461–475. doi:10.1002/ldr.463
Oba, G., Stenseth, N.C., Lusigi, W.J., 2000. New perspectives on sustainable grazing management
in arid zones of sub-Saharan Africa. Bioscience 50, 35. doi:10.1641/0006-
3568(2000)050[0035:NPOSGM]2.3.CO;2
Ochoa, C.G., Fernald, A.G., Guldan, S.J., Shukla, M.K., 2009. Water Movement through a
Shallow Vadose Zone: A Field Irrigation Experiment. Vadose Zo. J. 8, 414.
doi:10.2136/vzj2008.0059
Oppel, S., Hilton, G., Ratcliffe, N., Fenton, C., Daley, J., Gray, G., Vickery, J., Gibbons, D., 2014.
Assessing population viability while accounting for demographic and environmental
uncertainty. Ecology 95, 1809–1818. doi:10.1890/13-0733.1
Otte, M.J., Chilonda, P., 2002. Cattle and small ruminant production systems in sub-Saharan
Africa: A systematic review, Book. Food and Agriculture Organization of the United Nations
Rome 2002, Rome.
Otto, S.P., Day, T., 2007. A Biologist’s Guide to Mathematical Modeling in Ecology and
Evolution. Princeton University Press, Princeton, NJ.
Owen-smith, N., 1987. Paleontological Society Pleistocene Extinctions : The Pivotal Role of
Megaherbivores Author ( s ): Norman Owen-Smith Published by : Paleontological Society
Stable URL : http://www.jstor.org/stable/2400736 JSTOR is a not-for-profit service that
helps schol 13, 351–362.
Palchaudhuri, M., Biswas, S., 2013. Analysis of Drought Using Standardized Precipitation Index
2, 119–126.
Pandey, C.B., Singh, J.S., 1992. Rainfall and grazing effects on net primary productivity in a
tropical savanna, India. Ecology 73, 2007–2021. doi:10.2307/1941451
Parton, W.J., Ojima, D.S., Schimel, D.S., 1994. Environmental Change in Grasslands: Assessment
Using Models. Clim. Change 28, 111–141.
Paustian, K., Andrén, O., Janzen, H.H., Lal, R., Smith, P., Tian, G., Tiessen, H., Van Noordwijk,
M., Woomer, P.L., 1997. Agricultural soils as a sink to mitigate CO2 emissions. Soil Use
Manag. 13, 230–244. doi:10.1111/j.1475-2743.1997.tb00594.x
88
Pavanello, S., 2010. Livestock marketing in Kenya- Ethiopia border areas : A baseline study.
Pavlů, V., Hejcman, M., Pavlů, L., Gaisler, J., Nežerková, P., 2006. Effect of continuous grazing
on forage quality, quantity and animal performance. Agric. Ecosyst. Environ. 113, 349–355.
doi:10.1016/j.agee.2005.10.010
Petri, M., Batello, C., Villani, R., Nachtergaele, F., 2010. Carbon status and carbon sequestration
potential in the world’ s grasslands, in: Grassland Carbon Sequestration: Management, Policy
and Economics. pp. 19–31.
Phillips, C., 2001. Grazing Management and Systems, in: Principles of Cattle Production.
doi:10.1017/CBO9781107415324.004
Piñeiro, G., Paruelo, J.M., Oesterheld, M., Jobbágy, E.G., 2010. Pathways of Grazing Effects on
Soil Organic Carbon and Nitrogen. Rangel. Ecol. Manag. 63, 109–119. doi:10.2111/08-255.1
Porto, A.F., 2014. Climate Change and Restoration of Degraded Land., Indian Forester.
Madrid:Colegio de Ingenieros de Montes.
Preger, A.C., Kösters, R., Du Preez, C.C., Brodowski, S., Amelung, W., 2010. Carbon
sequestration in secondary pasture soils: A chronosequence study in the South African
Highveld. Eur. J. Soil Sci. 61, 551–562. doi:10.1111/j.1365-2389.2010.01248.x
Pucheta, E., Bonamici, I., Cabido, M., Díaz, S., 2004. Below-ground biomass and productivity of
a grazed site and a neighbouring ungrazed exclosure in a grassland in central Argentina.
Austral Ecol. 29, 201–208. doi:10.1111/j.1442-9993.2004.01337.x
Raiesi, F., Riahi, M., 2014. The influence of grazing exclosure on soil C stocks and dynamics, and
ecological indicators in upland arid and semi-arid rangelands. Ecol. Indic. 41, 145–154.
doi:10.1016/j.ecolind.2014.01.040
Rege, J.E.O., Tawah, C.L., 1999. The state of African cattle genetic resources II. Geographical
distribution, characteristics and uses of present-day breeds and strains. Anim. Genet. Resour.
Inf. 26, 1–25. doi:10.1017/S1014233900001152
REGLAP, 2012. Key statistics on the drylands of Kenya, Uganda and Ethiopia.
Ren, H., Han, G., Lan, Z., Wan, H., Schönbach, P., 2016. Grazing effects on herbage nutritive
values depend on precipitation and growing season in Inner Mongolian grassland Running
title : Grazing effects on herbage nutritional quality.
Riche, B., Hachileka, E., Awuor, C.B., Hammill, A., 2009. Climate-related vulnerability and
adaptive-capacity in Ethiopia’s Borana and Somali communities.
Rizzo, D.M., Mouser, P.J., Whitney, D.H., Mark, C.D., Magarey, R.D., Voinov, A. a., 2006. The
comparison of four dynamic systems-based software packages: Translation and sensitivity
analysis. Environ. Model. Softw. 21, 1491–1502. doi:10.1016/j.envsoft.2005.07.009
Rockwood, L.L., 2015. Introduction to Population Ecology, 2nd ed, Journal of Chemical
Information and Modeling. John Wiley & Sons. doi:10.1017/CBO9781107415324.004
Roe, M., 1997. Viewpoint : On rangeland carrying capacity. J. Range Manag. 50, 467–472.
Rose, L., Hertel, D., Leuschner, C., 2013. Livestock-type effects on biomass and nitrogen
partitioning in temperate pastures with different functional-group abundance. Grass Forage
Sci. 68, 386–394. doi:10.1111/gfs.12001
Ruppert, J.C., Harmoney, K., Henkin, Z., Snyman, H.A., Sternberg, M., Willms, W., Linstädter,
A., 2015. Quantifying drylands’ drought resistance and recovery: The importance of drought
89
intensity, dominant life history and grazing regime. Glob. Chang. Biol. 21, 1258–1270.
doi:10.1111/gcb.12777
Rykiel, E.J., 1996. Testing ecological models: The meaning of validation. Ecol. Modell. 90, 229–
244. doi:10.1016/0304-3800(95)00152-2
Sæther, B.E., 1997. Environmental stochasticity and population dynamics of large herbivores: A
search for mechanisms. Trends Ecol. Evol. 12, 143–147. doi:10.1016/S0169-5347(96)10068-
9
Sæther, B.-E., Coulson, T., Grøtan, V., Engen, S., Altwegg, R., Armitage, K.B., Barbraud, C.,
Becker, P.H., Blumstein, D.T., Dobson, F.S., Festa-Bianchet, M., Gaillard, J.-M., Jenkins,
A., Jones, C., Nicoll, M. a C., Norris, K., Oli, M.K., Ozgul, A., Weimerskirch, H., 2013. How
life history influences population dynamics in fluctuating environments. Am. Nat. 182, 743–
759. doi:10.1086/673497
Sæther, B.-E., Tufto, J., Engen, S., Jerstad, K., Røstad, O.W., Skåtan, J.E., 2000. Consequences of
Climate Change for a Small Temperate Songbird. Science (80-. ). 287, 854–856.
Sargent, R.G., 2013. Verification and validation of simulation models. J. Simul. 7, 12–24.
doi:10.1057/jos.2012.20
Sargent, R.G., 1991. Simulation model verification and validation, in: Nelson, B.L., Kelton, W.D.,
Clark, G.M. (Eds.), Winter Simulation Conference. pp. 33–39.
Sasaki, T., 2010. Paradigm Integration between Equilibrium and Non-equilibrium Concepts for
Evaluating Vegetation Dynamics in Rangeland Ecosystems. Glob. Environ. Res. 14, 17–22.
Schärrer, S., Presi, P., Hattendorf, J., Chitnis, N., Reist, M., Zinsstag, J., 2014. Demographic model
of the Swiss cattle population for the years 2009-2011 stratified by gender, age and
production type. PLoS One 9. doi:10.1371/journal.pone.0109329
Schimel, D.S., 2010. Drylands in the Earth System Linked references are available on JSTOR for
this article : Drylands in the Earth System. Science (80-. ). 327, 418–419.
Schlesinger, W.H., 1991. Biogeochemistry: an analysis of global change.
Schmitt, A., Pausch, J., Kuzyakov, Y., 2013. Effect of clipping and shading on C allocation and
fluxes in soil under ryegrass and alfalfa estimated by 14C labelling. Appl. Soil Ecol. 64, 228–
236. doi:10.1016/j.apsoil.2012.12.015
Schönbach, P., Wan, H., Gierus, M., Loges, R., M??ller, K., Lin, L., Susenbeth, A., Taube, F.,
2012. Effects of grazing and precipitation on herbage production, herbage nutritive value and
performance of sheep in continental steppe. Grass Forage Sci. 67, 535–545.
doi:10.1111/j.1365-2494.2012.00874.x
Scoones, I., 1995. Exploiting heterogeneity:habitat use by cattle in dryland Zimbabwe. J. Arid
Environ. 29, 221–237. doi:10.1016/S0140-1963(05)80092-8
Scoones, I., 1992. Coping with drought: Responses of herders and livestock in contrasting savanna
environments in Southern Zimbabwe. Hum. Ecol. 20, 293–314. doi:10.1007/BF00889899
Scurlock, J.M.O., Cramer, W., Olson, R.J., Parton, W.J., Prince, S.D., 1999. Terrestrial NPP:
Toward a consistent data set for global model evaluation. Ecol. Appl. 9, 913–919.
doi:10.1890/1051-0761(1999)009[0913:TNTACD]2.0.CO;2
Shabb, D., Chitnis, N., Baljinnyam, Z., Saagii, S., Zinsstag, J., 2013. A mathematical model of the
dynamics of Mongolian livestock populations. Livest. Sci. 157, 280–288.
doi:10.1016/j.livsci.2013.07.009
90
Shafran-Nathan, R., Svoray, T., Perevolotsky, A., 2012. The resilience of annual vegetation
primary production subjected to different climate change scenarios. Clim. Change 118, 227–
243. doi:10.1007/s10584-012-0614-2
Shahzad, T., Chenu, C., Repinçay, C., Mougin, C., Ollier, J.L., Fontaine, S., 2012. Plant clipping
decelerates the mineralization of recalcitrant soil organic matter under multiple grassland
species. Soil Biol. Biochem. 51, 73–80. doi:10.1016/j.soilbio.2012.04.014
Sheffield, J., Wood, E.F., 2008. Global trends and variability in soil moisture and drought
characteristics, 1950-2000, from observation-driven simulations of the terrestrial hydrologic
cycle. J. Clim. 21, 432–458. doi:10.1175/2007JCLI1822.1
Shi, X.M., Li, X.G., Li, C.T., Zhao, Y., Shang, Z.H., Ma, Q., 2013. Grazing exclusion decreases
soil organic C storage at an alpine grassland of the Qinghai-Tibetan Plateau. Ecol. Eng. 57,
183–187. doi:10.1016/j.ecoleng.2013.04.032
Smoliak, S., Dormaar, J.F., Johnston, A., 1972. Long-Term Grazing Effects on Stipa-Bouteloua
Prairie Soils. J. Range Manag. 25, 246–250.
Snyman, H.A., 2009. Root studies on grass species in a semi-arid South Africa along a soil-water
gradient. Agric. Ecosyst. Environ. 131, 247–254. doi:10.1016/j.agee.2009.01.023
Snyman, H.A., du Preez, C.C., 2005. Rangeland degradation in a semi-arid South Africa - II:
Influence on soil quality. J. Arid Environ. 60, 483–507. doi:10.1016/j.jaridenv.2004.06.005
Solomon, A., Workalemahu, A., Jabbar, M.A., Ahmed, M.M., Hurissa, B., 2003. Livestock
marketing in Ethiopia: a review of structure, performance, and development initiatives,
Socio-economics and Policy Research Working Paper 52. Nairobi, Kenya.
Solomon, T.B., Snyman, H.A., Smit, G.N., 2007. Cattle-rangeland management practices and
perceptions of pastoralists towards rangeland degradation in the Borana zone of southern
Ethiopia. J. Environ. Manage. 82, 481–494. doi:10.1016/j.jenvman.2006.01.008
Soussana, J.F., Tallec, T., Blanfort, V., 2010. Mitigating the greenhouse gas balance of ruminant
production systems through carbon sequestration in grasslands. Integr. Crop Manag. 11.
Spinoni, J., Naumann, G., Carrao, H., Barbosa, P., Vogt, J., 2014. World drought frequency,
duration, and severity for 1951-2010. Int. J. Climatol. 34, 2792–2804. doi:10.1002/joc.3875
Starfield, A.M., 1990. Qualitative , Rule-Based Modeling 40, 601–604.
Sternberg, M., Gutman, M., Perevolotsky, A., Ungar, E.D., Kigel, J., Gutmant, M., Perevolotskyt,
A.V.I., Kigel, J., 2000. Vegetation response to grazing management in a Mediterranean
herbaceous community : a functional group approach. J. Appl. Ecol. 37, 224–237.
Stevens, C.J., Gowing, D.J.G., 2014. Effect of nitrogen addition, form and clipping on competitive
interactions between grassland species. J. Plant Ecol. 7, 222–230. doi:10.1093/jpe/rtt039
Sullivan, j. T., 1962. Evaluation of Forage Crops by Chemical Analysis . A Critique. Agron.
JOURNA.
Sultan, J.I., Manzoor, M.N., Shahzad, M.A., Nisa, M., 2011. Nutritional profile and in situ
digestion kinetics of some irrigated grasses at pre-bloom stage, in: International Conference
on Biology, Environment and Chemistry. pp. 455–463.
Tache, B., Oba, G., 2010. Is Poverty Driving Borana Herders in Southern Ethiopia to Crop
Cultivation? Hum. Ecol. 38, 639–649. doi:10.1007/s10745-010-9349-8
Tackenberg, O., 2007. A new method for non-destructive measurement of biomass, growth rates,
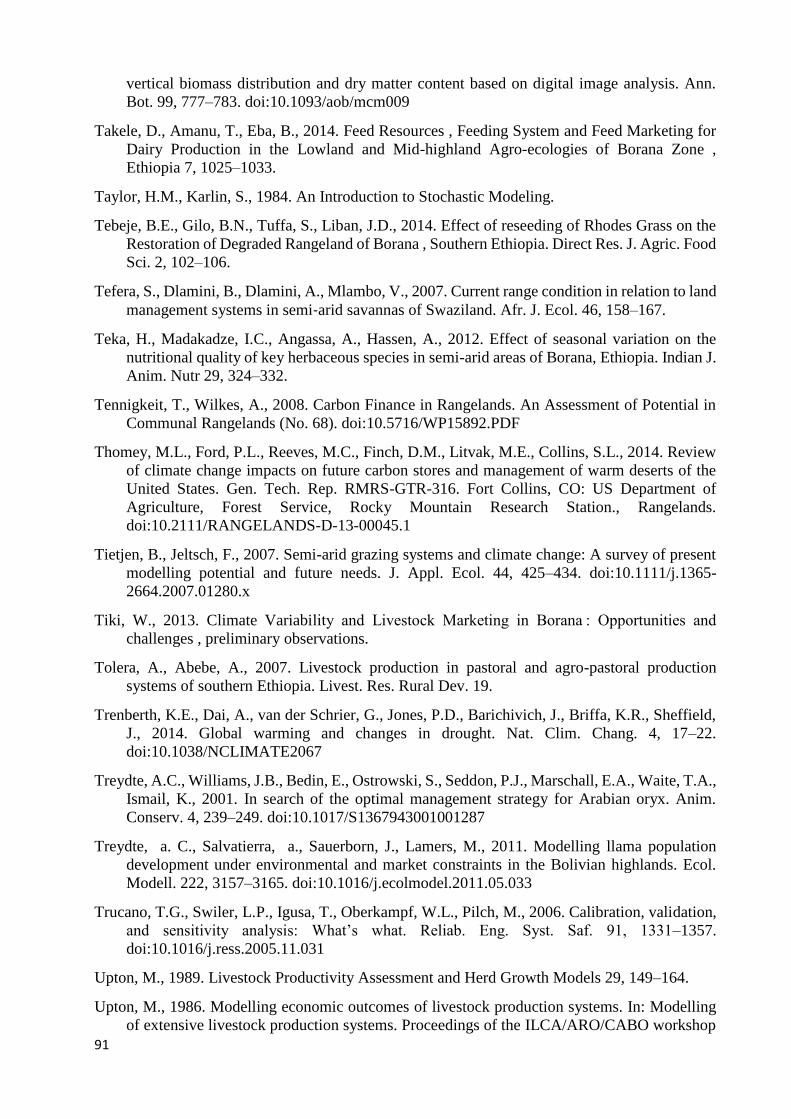
91
vertical biomass distribution and dry matter content based on digital image analysis. Ann.
Bot. 99, 777–783. doi:10.1093/aob/mcm009
Takele, D., Amanu, T., Eba, B., 2014. Feed Resources , Feeding System and Feed Marketing for
Dairy Production in the Lowland and Mid-highland Agro-ecologies of Borana Zone ,
Ethiopia 7, 1025–1033.
Taylor, H.M., Karlin, S., 1984. An Introduction to Stochastic Modeling.
Tebeje, B.E., Gilo, B.N., Tuffa, S., Liban, J.D., 2014. Effect of reseeding of Rhodes Grass on the
Restoration of Degraded Rangeland of Borana , Southern Ethiopia. Direct Res. J. Agric. Food
Sci. 2, 102–106.
Tefera, S., Dlamini, B., Dlamini, A., Mlambo, V., 2007. Current range condition in relation to land
management systems in semi‐arid savannas of Swaziland. Afr. J. Ecol. 46, 158–167.
Teka, H., Madakadze, I.C., Angassa, A., Hassen, A., 2012. Effect of seasonal variation on the
nutritional quality of key herbaceous species in semi-arid areas of Borana, Ethiopia. Indian J.
Anim. Nutr 29, 324–332.
Tennigkeit, T., Wilkes, A., 2008. Carbon Finance in Rangelands. An Assessment of Potential in
Communal Rangelands (No. 68). doi:10.5716/WP15892.PDF
Thomey, M.L., Ford, P.L., Reeves, M.C., Finch, D.M., Litvak, M.E., Collins, S.L., 2014. Review
of climate change impacts on future carbon stores and management of warm deserts of the
United States. Gen. Tech. Rep. RMRS-GTR-316. Fort Collins, CO: US Department of
Agriculture, Forest Service, Rocky Mountain Research Station., Rangelands.
doi:10.2111/RANGELANDS-D-13-00045.1
Tietjen, B., Jeltsch, F., 2007. Semi-arid grazing systems and climate change: A survey of present
modelling potential and future needs. J. Appl. Ecol. 44, 425–434. doi:10.1111/j.1365-
2664.2007.01280.x
Tiki, W., 2013. Climate Variability and Livestock Marketing in Borana : Opportunities and
challenges , preliminary observations.
Tolera, A., Abebe, A., 2007. Livestock production in pastoral and agro-pastoral production
systems of southern Ethiopia. Livest. Res. Rural Dev. 19.
Trenberth, K.E., Dai, A., van der Schrier, G., Jones, P.D., Barichivich, J., Briffa, K.R., Sheffield,
J., 2014. Global warming and changes in drought. Nat. Clim. Chang. 4, 17–22.
doi:10.1038/NCLIMATE2067
Treydte, A.C., Williams, J.B., Bedin, E., Ostrowski, S., Seddon, P.J., Marschall, E.A., Waite, T.A.,
Ismail, K., 2001. In search of the optimal management strategy for Arabian oryx. Anim.
Conserv. 4, 239–249. doi:10.1017/S1367943001001287
Treydte, a. C., Salvatierra, a., Sauerborn, J., Lamers, M., 2011. Modelling llama population
development under environmental and market constraints in the Bolivian highlands. Ecol.
Modell. 222, 3157–3165. doi:10.1016/j.ecolmodel.2011.05.033
Trucano, T.G., Swiler, L.P., Igusa, T., Oberkampf, W.L., Pilch, M., 2006. Calibration, validation,
and sensitivity analysis: What’s what. Reliab. Eng. Syst. Saf. 91, 1331–1357.
doi:10.1016/j.ress.2005.11.031
Upton, M., 1989. Livestock Productivity Assessment and Herd Growth Models 29, 149–164.
Upton, M., 1986. Modelling economic outcomes of livestock production systems. In: Modelling
of extensive livestock production systems. Proceedings of the ILCA/ARO/CABO workshop
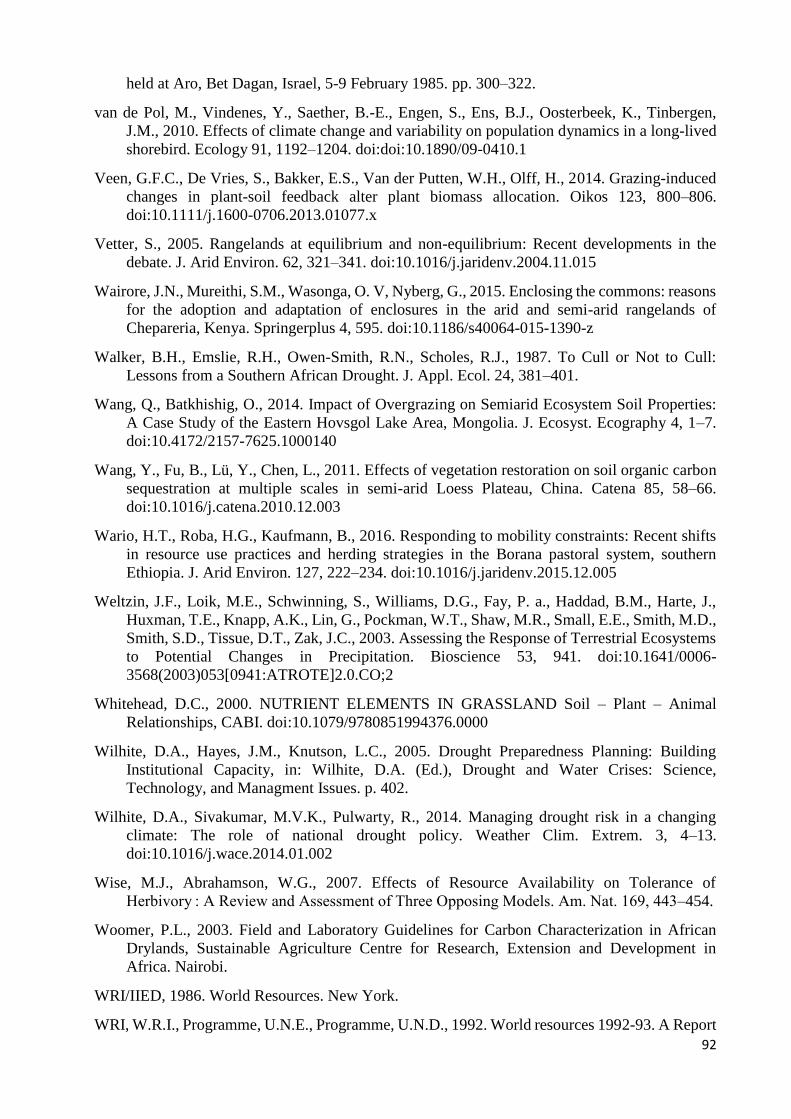
92
held at Aro, Bet Dagan, Israel, 5-9 February 1985. pp. 300–322.
van de Pol, M., Vindenes, Y., Saether, B.-E., Engen, S., Ens, B.J., Oosterbeek, K., Tinbergen,
J.M., 2010. Effects of climate change and variability on population dynamics in a long-lived
shorebird. Ecology 91, 1192–1204. doi:doi:10.1890/09-0410.1
Veen, G.F.C., De Vries, S., Bakker, E.S., Van der Putten, W.H., Olff, H., 2014. Grazing-induced
changes in plant-soil feedback alter plant biomass allocation. Oikos 123, 800–806.
doi:10.1111/j.1600-0706.2013.01077.x
Vetter, S., 2005. Rangelands at equilibrium and non-equilibrium: Recent developments in the
debate. J. Arid Environ. 62, 321–341. doi:10.1016/j.jaridenv.2004.11.015
Wairore, J.N., Mureithi, S.M., Wasonga, O. V, Nyberg, G., 2015. Enclosing the commons: reasons
for the adoption and adaptation of enclosures in the arid and semi-arid rangelands of
Chepareria, Kenya. Springerplus 4, 595. doi:10.1186/s40064-015-1390-z
Walker, B.H., Emslie, R.H., Owen-Smith, R.N., Scholes, R.J., 1987. To Cull or Not to Cull:
Lessons from a Southern African Drought. J. Appl. Ecol. 24, 381–401.
Wang, Q., Batkhishig, O., 2014. Impact of Overgrazing on Semiarid Ecosystem Soil Properties:
A Case Study of the Eastern Hovsgol Lake Area, Mongolia. J. Ecosyst. Ecography 4, 1–7.
doi:10.4172/2157-7625.1000140
Wang, Y., Fu, B., Lü, Y., Chen, L., 2011. Effects of vegetation restoration on soil organic carbon
sequestration at multiple scales in semi-arid Loess Plateau, China. Catena 85, 58–66.
doi:10.1016/j.catena.2010.12.003
Wario, H.T., Roba, H.G., Kaufmann, B., 2016. Responding to mobility constraints: Recent shifts
in resource use practices and herding strategies in the Borana pastoral system, southern
Ethiopia. J. Arid Environ. 127, 222–234. doi:10.1016/j.jaridenv.2015.12.005
Weltzin, J.F., Loik, M.E., Schwinning, S., Williams, D.G., Fay, P. a., Haddad, B.M., Harte, J.,
Huxman, T.E., Knapp, A.K., Lin, G., Pockman, W.T., Shaw, M.R., Small, E.E., Smith, M.D.,
Smith, S.D., Tissue, D.T., Zak, J.C., 2003. Assessing the Response of Terrestrial Ecosystems
to Potential Changes in Precipitation. Bioscience 53, 941. doi:10.1641/0006-
3568(2003)053[0941:ATROTE]2.0.CO;2
Whitehead, D.C., 2000. NUTRIENT ELEMENTS IN GRASSLAND Soil – Plant – Animal
Relationships, CABI. doi:10.1079/9780851994376.0000
Wilhite, D.A., Hayes, J.M., Knutson, L.C., 2005. Drought Preparedness Planning: Building
Institutional Capacity, in: Wilhite, D.A. (Ed.), Drought and Water Crises: Science,
Technology, and Managment Issues. p. 402.
Wilhite, D.A., Sivakumar, M.V.K., Pulwarty, R., 2014. Managing drought risk in a changing
climate: The role of national drought policy. Weather Clim. Extrem. 3, 4–13.
doi:10.1016/j.wace.2014.01.002
Wise, M.J., Abrahamson, W.G., 2007. Effects of Resource Availability on Tolerance of
Herbivory : A Review and Assessment of Three Opposing Models. Am. Nat. 169, 443–454.
Woomer, P.L., 2003. Field and Laboratory Guidelines for Carbon Characterization in African
Drylands, Sustainable Agriculture Centre for Research, Extension and Development in
Africa. Nairobi.
WRI/IIED, 1986. World Resources. New York.
WRI, W.R.I., Programme, U.N.E., Programme, U.N.D., 1992. World resources 1992-93. A Report
93
by The World Resources Institute in collaboration with The United Nations Environment
Programme and The United Nations Development Programme.
Xu, X., Sherry, R.A., Niu, S., Li, D., Luo, Y., 2013. Net primary productivity and rain-use
efficiency as affected by warming, altered precipitation, and clipping in a mixed-grass prairie.
Glob. Chang. Biol. 19, 2753–2764. doi:10.1111/gcb.12248
Yan, R., Xin, X., Wei, Z., Liu, S., Yang, J., Yang, G., 2012. Influences of various grazing systems
on community biomass of a desert grassland in Inner 4, 303–309.
doi:10.3724/SP.J.1226.2012.00303
Yilma, Z., Haile, A., Guerne Bleich, E., 2009. Effects of climate change on livestock production
and livelihood of pastoralists in selected pastoral areas of Borana, Ethiopia, Food and
Agriculture Organization of the United Nations, Sub Regional Office for Eastern Africa
(FAO/SFE), Addis Ababa, Ethiop. doi:10.13140/2.1.4475.9044
Zander, K.K., 2011. Attitudes of Livestock Keepers to Breeding Strategies – Threats and
Opportunities for on-farm Conservation of the Borana Cattle Breed. J. Agric. Sci. 3, 3–12.
doi:10.5539/jas.v3n2p3
Zander, K.K., Drucker, A.G., 2008. Conserving what’s important: Using choice model scenarios
to value local cattle breeds in East Africa. Ecol. Econ. 68, 34–45.
doi:10.1016/j.ecolecon.2008.01.023
Zander, K.K., Drucker, A.G., Holm-Müller, K., Simianer, H., 2009a. Choosing the “cargo” for
Noah’s Ark - Applying Weitzman’s approach to Borana cattle in East Africa. Ecol. Econ. 68,
2051–2057. doi:10.1016/j.ecolecon.2009.01.011
Zander, K.K., Drucker, a. G., Holm-Müller, K., 2009b. Costing the conservation of animal genetic
resources: The case of Borana cattle in Ethiopia and Kenya. J. Arid Environ. 73, 550–556.
doi:10.1016/j.jaridenv.2008.11.003
Zhang, Y., Huang, D., Badgery, W.B., Kemp, D.R., Chen, W., Wang, X., Liu, N., 2015. Reduced
grazing pressure delivers production and environmental benefits for the typical steppe of
north China. Sci. Rep. 5, 16434. doi:10.1038/srep16434
Zhou, X., Fei, S., Sherry, R., Luo, Y., 2012. Root Biomass Dynamics Under Experimental
Warming and Doubled Precipitation in a Tallgrass Prairie. Ecosystems 15, 542–554.
doi:10.1007/s10021-012-9525-3
Zimmermann, J., Higgins, S.I., Grimm, V., Hoffmann, J., Linstädter, A., 2015. Local density
effects on individual production are dynamic: insights from natural stands of a perennial
savanna grass. Oecologia 178, 1125–1135. doi:10.1007/s00442-015-3291-9
94
APPENDICES
Appendix A: Cattle population trajectories
(a)
(b)
Appendix A Fig. 1. Population growth interval on an annual integration time step.
-0.4
-0.3
-0.2
-0.1
0.0
0.1
0.2
0.3
Time (year)
0 20 40 60 80 100 120
Sto
cha
stic g
row
th r
ate
-0.4
-0.3
-0.2
-0.1
0.0
0.1
0.2
0.3
0 20 40 60 80 100 120
Scenario 1 Scenario 2
Scenario 3 Scenario 4
Appendix A Fig. 2 Stochastic growth rate of the Boran cattle population under the four drought scenarios
(scenario 1 = once every 20 years, scenario 2 = once every 15 years, scenario 3 = once every 10 years, and
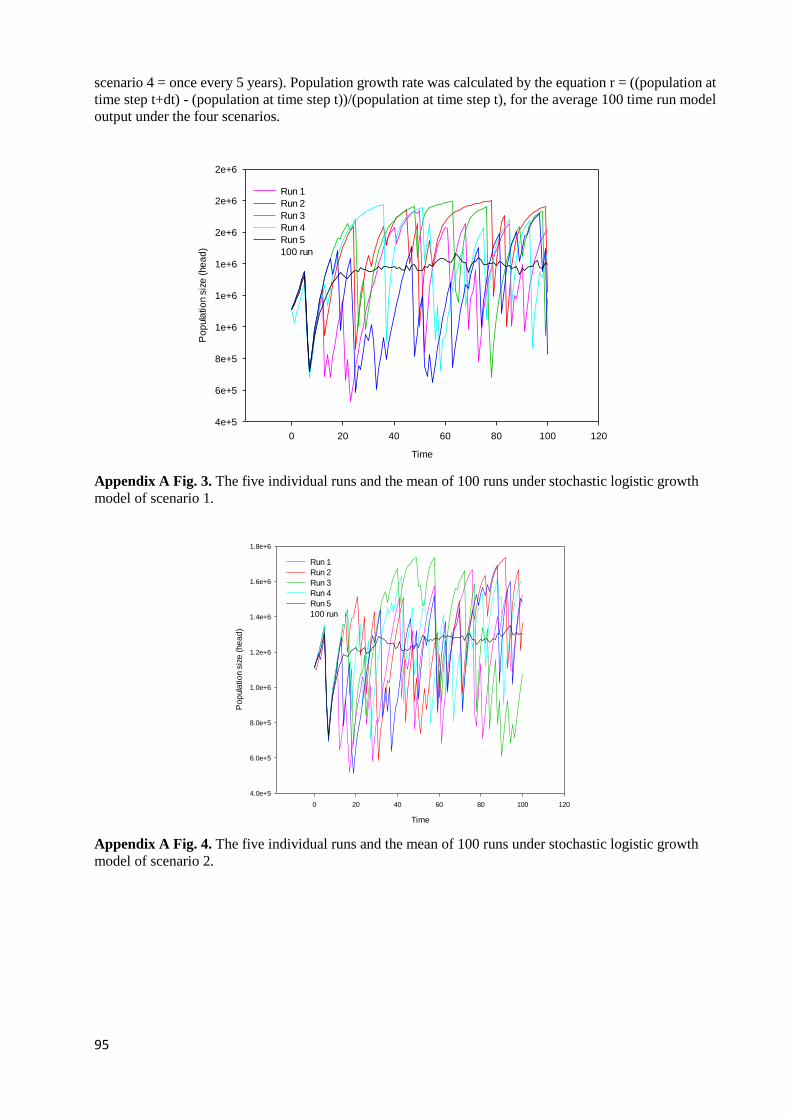
95
scenario 4 = once every 5 years). Population growth rate was calculated by the equation r = ((population at
time step t+dt) - (population at time step t))/(population at time step t), for the average 100 time run model
output under the four scenarios.
Time
0 20 40 60 80 100 120
Po
pula
tio
n s
ize
(he
ad
)
4e+5
6e+5
8e+5
1e+6
1e+6
1e+6
2e+6
2e+6
2e+6
Run 1
Run 2
Run 3
Run 4
Run 5
100 run
Appendix A Fig. 3. The five individual runs and the mean of 100 runs under stochastic logistic growth
model of scenario 1.
Time
0 20 40 60 80 100 120
Po
pula
tio
n s
ize
(he
ad
)
4.0e+5
6.0e+5
8.0e+5
1.0e+6
1.2e+6
1.4e+6
1.6e+6
1.8e+6
Run 1
Run 2
Run 3
Run 4
Run 5
100 run
Appendix A Fig. 4. The five individual runs and the mean of 100 runs under stochastic logistic growth
model of scenario 2.

96
Time
0 20 40 60 80 100 120
Po
pula
tio
n s
ize
(he
ad
)
0.0
2.0e+5
4.0e+5
6.0e+5
8.0e+5
1.0e+6
1.2e+6
1.4e+6
1.6e+6
1.8e+6
Run 1
Run 2
Run 3
Run 4
Run 5
100 run
Appendix A Fig. 5. The five individual runs and the mean of 100 runs under stochastic logistic growth
model of scenario 3.
Time
0 20 40 60 80 100 120
Po
pula
tio
n s
ize
(he
ad
)
0.0
2.0e+5
4.0e+5
6.0e+5
8.0e+5
1.0e+6
1.2e+6
1.4e+6
1.6e+6
Run 1
Run 2
Run 3
Run 4
Run 5
100 run
Appendix A Fig. 6. The five individual runs and the mean of 100 runs under stochastic logistic growth
model of scenario 4.
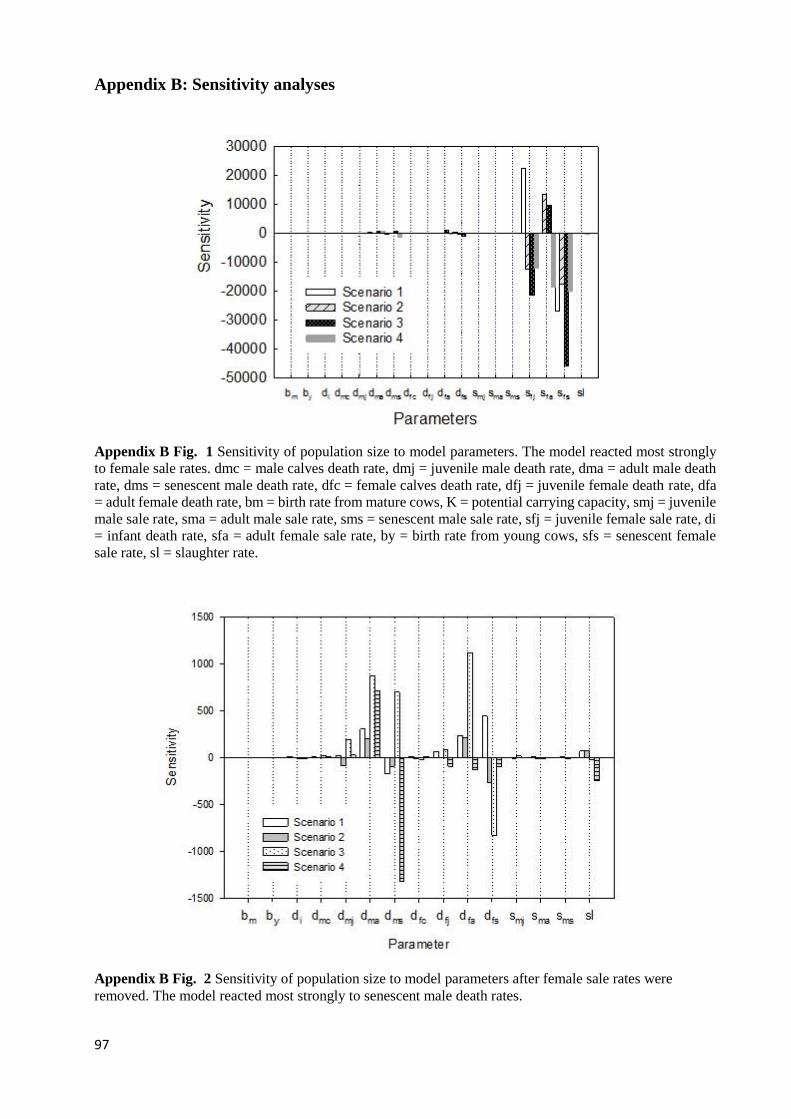
97
Appendix B: Sensitivity analyses
Appendix B Fig. 1 Sensitivity of population size to model parameters. The model reacted most strongly
to female sale rates. dmc = male calves death rate, dmj = juvenile male death rate, dma = adult male death
rate, dms = senescent male death rate, dfc = female calves death rate, dfj = juvenile female death rate, dfa
= adult female death rate, bm = birth rate from mature cows, K = potential carrying capacity, smj = juvenile
male sale rate, sma = adult male sale rate, sms = senescent male sale rate, sfj = juvenile female sale rate, di
= infant death rate, sfa = adult female sale rate, by = birth rate from young cows, sfs = senescent female
sale rate, sl = slaughter rate.
Appendix B Fig. 2 Sensitivity of population size to model parameters after female sale rates were
removed. The model reacted most strongly to senescent male death rates.