insights into campylobacter jejuniinsights into campylobacter jejuni desulforubrerythrin catalytic...
TRANSCRIPT

Diana Filipa Pereira Vaz
Graduated in Biochemistry
Dissertation presented to obtain the Master Degree in
Molecular Genetics and Biomedicine
Insights into Campylobacter jejuni
Desulforubrerythrin catalytic mechanism
Supervisor: Prof. Miguel S. Teixeira, Professor, ITQB-UNL
Co-Supervisor: Dr. Célia V. Romão, Auxiliary Investigator, ITQB-UNL
Membros do júri:
Presidente: Doutora Paula Maria Theriaga Mendes Bernardo Gonçalves
Arguente: Doutor Carlos Aberto Gomes Salgueiro
Vogal: Doutora Célia Maria Valente Romão
November 2013


V
Direitos de cópia
Insights into Desulforubrerythrin catalytic mechanism
Diana Filipa Pereira Vaz
FCT/UNL, UNL
A Faculdade de Ciências e Tecnologia e a Universidade Nova de Lisboa têm o direito, perpétuo
e sem limites geográficos, de arquivar e publicar esta dissertação através de exemplares impressos
reproduzidos em papel ou de forma digital, ou por qualquer outro meio conhecido ou que venha a ser
inventado, e de a divulgar através de repositórios científicos e de admitir a sua cópia e distribuição
com objectivos educacionais ou de investigação, não comerciais, desde que seja dado crédito ao
autor e editor.

VI

VII
“The scientist does not study nature because
it is useful; he studies it because he delights
in it, and he delights in it because it is beautiful.”
Jules Henri Poincaré

VIII

IX
Acknowledgments
Several people were indispensable for making of the work here described.
First, I would like to acknowledge the availability of my supervisors, Professor Miguel Teixeira and
Doctor Célia Romão. To Prof. Miguel Teixeira, I would like to thank for giving me the opportunity to
start my research work in his laboratory. I hope such an experience made me grow as a young
scientist and also as a person. I am also grateful for all the advices, knowledge and work discussions.
To Dr. Célia Romão, I acknowledge for all the advices and discussions, for always pushing me
forward, and also for her interest and concern in subjects that go beyond the present work.
I also would like to acknowledge all the other members of the Metalloproteins and Bioenergetics
Unit: Manuela Pereira, Afonso Duarte, Ana Paula Baptista, Patrícia Refojo, Vera Gonçalves, Sandra
Santos, Bruno Marreiros, Elísio Silva, Filipa Calisto, Filipa Sena, Joana Simões, Paulo Castro, Cecília
Miranda, Rodrigo David and Joana Carrilho. I would also like to thank to the former members of this
unit Miguel Ribeiro and Liliana Pinto. To all of them I am grateful for the help and the advices, namely
during my first stages in the laboratory, and also for all the good moments. The following people
deserve a special word of gratitude: Liliana, who introduced the laboratorial work to me; Joana C., who
was always available to help me; Rodrigo, who lots of times brought me to and from the lab.
I am grateful to my family, especially to my mother. Without her hard work and sacrifice I would
have never made it so far.
A special acknowledgement to the following friends: Margarida who, especially since the
beginning of the college was always there to listen to me; to André who, particularly during the write of
this thesis, always had a word (to try) to keep me calm and focused.

X

XI
Abstract
The following work aims to contribute to a better understanding of systems involved in resistance
to oxidative stress species, namely hydrogen peroxide. The work is focused in one protein from the
pathogen Campylobacter jejuni: desulforubrerythrin. Desulforubrerythrin is a non-heme iron protein in
which the catalytic centre harbours a diiron cluster. Besides, the protein has a desulforedoxin domain
at the N-terminal and a rubredoxin domain at the C-terminal. With the objective of understanding the
protein catalytic mechanism three site-directed mutants, as well the wild type protein, were over
expressed in Escherichia coli, purified and studied through biochemical and spectroscopic techniques.
The amino acid residues selected for mutations are two tyrosines near the catalytic centre (residues
59 and 127). These residues are strictly conserved in rubrerythrins; moreover in diiron centres
containing proteins tyrosines play a role in dissipating oxidizing species of iron (IV) by forming a tyrosil
radical. The selected residues were replaced by a phenalanine residue which gave rise to three
mutants: Y59F, Y127F and Y59F Y127F. These were characterized having as reference the wild type
protein. All proteins have a molecular mass of 24 kDa and are tetramers in solution. The EPR and UV-
visible techniques confirmed the presence of the three metallic domains in the wild type and Y59F
mutant. The Y127F mutant was successfully used to test a protocol for diiron centre reconstitution in
desulforubrerythrin.
Finally, crystals of the wild type and, for the first time, of the Y59F and double mutants were
obtained. The X-ray data for the mutants were collected with a resolution of 1.9 Å and its structure will
be determined.
Keywords: Campylobacter jejuni, desulforubrerythrin, hydrogen peroxide, crystallization, EPR.

XII
XIII
Resumo
O trabalho aqui apresentado pretende contribuir para alargar o conhecimento sobre sistemas
envolvidos na resistência ao stress oxidativo, nomeadamente na resistência ao peróxido de
hidrogénio. O trabalho foi dirigido para o estudo de uma proteína do patogénio Campylobacter jejuni:
desulforubreritrina. A desulforubreritrina é uma proteína com ferro não hémico cujo centro catalítico
comporta dois átomos de ferro. Além disso, a proteína possui no N-terminal um dominio do tipo
desulforedoxina e no C-terminal um domínio semelhante a uma rubredoxina
Com o objectivo de compreender o mecanismo catalítico da proteína três mutantes dirigidos,
assim como a proteína selvagem, foram sobre expressos em Escherichia coli, purificados e
caracterizados utilizando técnicas bioquímicas e espectroscópicas. Os resíduos de aminoácidos
seleccionados para efectuar as mutações são duas tirosinas que se encontram junto do centro
catalítico (resíduos 59 e127). Estes resíduos são estritamente conservados em rubreritrinas; além
disso, em proteínas que contêm centros binucleares de ferro as tirosinas desempenham um papel
importante na dissipação de espécies oxidantes de ferro (IV) à custa da formação de um radical
tirosil. Os resíduos seleccionados foram substituídos por uma fenilalanina dando origem a três
mutantes: Y59F, Y127F e Y59F Y127F. Os mutantes foram caracterizados tendo como referência a
proteína selvagem. Todas as proteínas têm uma massa molecular de 24 kDa e são tetrâmeros em
solução. As técnicas de Ressonância Paramagnética Electrónica (RPE) e de espectroscopia de UV-
Vis confirmaram a presença dos três domínios metálicos na proteína selvagem e no mutante Y59F. A
proteína com a mutação no resíduo 127 foi utilizada com sucesso para testar um protocolo de
reconstituição de centros binucleares de ferro na desulforubreritrina.
Finalmente, cristais da proteína selvagem e, pela primeira vez, dos mutantes Y59F e Y59F
Y127F foram obtidos. Os dados de difracção de raios-X para os mutantes foram recolhidos com uma
resolução de 1.9 Å
Termos-chave: Campylobacter jejuni, desulforubreritrina, peróxido de hidrogénio, cristalização, RPE.

XIV
XV
Table of contents
Direitos de cópia ................................................................................................................................. V
Acknowledgments .............................................................................................................................. IX
Abstract .............................................................................................................................................. XI
Resumo . ........................................................................................................................................... XIII
1. INTRODUCTION ............................................................................................................................ 1
1.1. Reactive oxygen species (ROS) and oxidative stress ....................................................... 1 1.1.1. Oxygen .................................................................................................................................... 1 1.1.2. Reactive oxygen species......................................................................................................... 1 1.1.3. Sources of ROS in living organisms ........................................................................................ 2 1.1.4. Iron and ROS .......................................................................................................................... 2 1.1.5. Toxicity of H2O2 ....................................................................................................................... 3 1.1.6. ROS detoxifying systems ........................................................................................................ 3
1.2. Rubrerythrins ........................................................................................................................ 4 1.2.1. Structural domains .................................................................................................................. 4 1.2.2. Physiological activity ............................................................................................................... 6 1.2.3. Desulforubrerythrin .................................................................................................................. 8
1.3. Campylobacter jejuni: an overview ..................................................................................... 9 1.3.1. C. jejuni, oxidative stress and iron ......................................................................................... 11 1.3.2. Pathogenesis mechanisms ................................................................................................... 14
1.4. Campylobacter jejuni, ROS and the immune system response ...................................... 16
2. MATERIALS AND METHODS ..................................................................................................... 19
2.1 Strains and resistances ...................................................................................................... 19
2.2 Gene cloning ....................................................................................................................... 19
2.3 Cells transformation ........................................................................................................... 19
2.4 Protein expression tests for DRbr mutants ...................................................................... 20
2.5 Expression of the recombinant DRbr and DRbr mutants ................................................ 20
2.6 Recombinant proteins purification .................................................................................... 20
2.7 Electrophoretic analysis ..................................................................................................... 21
2.8 Determination of protein and iron concentration ............................................................. 23
2.9 Molecular mass determination ........................................................................................... 23
2.10 N-terminal sequencing........................................................................................................ 24
2.11 Spectroscopies ................................................................................................................... 24

XVI
3 RESULTS ..................................................................................................................................... 27
3.1 Protein expression tests for the Desulforubrerythrin mutants ....................................... 27
3.2 Proteins expression ............................................................................................................ 28
3.3 Biochemical characterization ............................................................................................. 29 3.3.1 Protein purification ................................................................................................................ 29 3.3.2 Quantifications ...................................................................................................................... 33 3.3.3 UV-Visible spectra ................................................................................................................. 35 3.3.4 Oligomerization state in solution ........................................................................................... 36 3.3.5 N-terminal sequencing .......................................................................................................... 39
3.4 Crystallization experiments ................................................................................................ 40
3.5 EPR studies ......................................................................................................................... 45 3.5.1 EPR spectra .......................................................................................................................... 45 3.5.2 Diiron centre reconstitution.................................................................................................... 46 3.5.3 Redox titration of the wild type protein .................................................................................. 47
4 DISCUSSION ............................................................................................................................... 51
4.1 Diiron proteins ..................................................................................................................... 51
4.2 Protein expression tests for desulforubrerythrin mutants .............................................. 56
4.3 Proteins expression ............................................................................................................ 56
4.4 Biochemical characterization ............................................................................................. 56 4.4.1 Proteins purification ............................................................................................................... 56 4.4.2 UV-Vis spectra ...................................................................................................................... 57 4.4.3 Quantifications ...................................................................................................................... 58 4.4.4 Oligomerization state in solution ........................................................................................... 58 4.4.5 N-terminal sequencing .......................................................................................................... 58
4.5 Into desulforubrerythrin metallic sites: EPR studies ....................................................... 59
4.6 Final remarks ....................................................................................................................... 64
5 REFERENCES ............................................................................................................................. 67
6 APPENDIX ................................................................................................................................... 75
6.1 Electronic Paramagnetic Resonance ................................................................................ 75
6.2 List of reagents and proteins used to perform the experimental work .......................... 76

XVII
List of figures
Figure 1.1: Structure of Desulfovibrio vulgaris rubrerythrin . .................................................................. 4
Figure 1.2: Dendogram of proteins from the rubrerythrin family . .......................................................... 5
Figure 1.3: Four-helix bundle of D. vulgaris rubrerythrin........................................................................ 6
Figure 1.4: Comparison between rubredoxin and desulforedoxin.. ....................................................... 6
Figure 1.5: Desulforubrerythrin in a tetrameric conformation................................................................. 8
Figure 1.6: Depiction of the diiron centre evidencing its surrounding tyrosines. .................................... 9
Figure 1.7: Localization of Campylobacter genus in the tree of life. .................................................... 10
Figure 1.8: Campylobacter jejuni scanning microscopy image ............................................................ 11
Figure 1.9: Simplified representation of oxidative stress regulation in Campylobacter jejuni............... 14
Figure 1.10: NOX role in generation of ROS in phagosomes.. ............................................................ 16
Figure 1.11: Importance of ROS in the immune system. ..................................................................... 16
Figure 1.12: Representative scheme of pathological inflammation.. ................................................... 17
Figure 3.1: SDS-PAGE of non-induced and induced cell samples of the protein expression tests for
DRbr mutants. ...................................................................................................................................... 27
Figure 3.2: SDS-PAGE of samples from protein expression. .............................................................. 28
Figure 3.3: Resume of WT DRbr purification.. ..................................................................................... 30
Figure 3.4: Resume of the DRbr Y59F purification. ............................................................................. 31
Figure 3.5: Resume of the DRbr Y12F purification.. ............................................................................ 32
Figure 3.6: Resume of the DRbr Y59F Y127F purification.. ............................................................... 33
Figure 3.7: Calibration curve to determine the protein concentration through the BCA method. ......... 34
Figure 3.8: Calibration curve to determine the iron concentration through the TPTZ method.. ........... 34
Figure 3.9: UV-Visible spectra from final fractions of DRbr proteins. ................................................... 35
Figure 3.10: Overlap of the UV -Visible absorption spectra of wild type and desulforubrerythrin
mutants................................................................................................................................................. 36
Figure 3.11: Calibration curve of the size exclusion column.. .............................................................. 37
Figure 3.12: Elution profiles of DRbr proteins from the analytical size exclusion column. ................... 38
Figure 3.13: PVDF membrane after the protein transference and before the bands were cut............. 39
Figure 3.14: Examples of some DRbr Y127F crystals obtained using the Structure Screen 1 & 2. ..... 40
Figure 3.15: Crystallizations conditions tested for the protein DRbr Y127F with 100 mM Hepes pH 7.5
and 10% isopropanol with different concentrations of PEG 4K. ........................................................... 41
Figure 3.16: Crystallizations conditions tested for the protein DRbr Y127F with 100 mM Hepes pH 7.5
and 10% glycerol with different concentrations of PEG 8K................................................................... 41
Figure 3.17: Crystallizations conditions tested for the protein DRbr Y127F with 100 Bicine pH 9.0 and
100 mM NaCl with different concentrations of PEG 550. ..................................................................... 41
Figure 3.18: Crystallizations conditions tested for the protein DRbr Y127F with 100 mM Tris-HCl pH
8.5 and 10 mM NiCl2 with different concentrations of PEG 2K. ............................................................ 42
Figure 3.19: Crystallizations conditions tested for the protein DRbr Y127F with 100 mM Hepes pH 7.5
and 10 % PEG 8K with different concentrations of glycerol.................................................................. 42
Figure 3.20: Resume of all crystallization conditions tested for the wild type protein. ......................... 43

XVIII
Figure 3.21: Example of crystals obtained for the wild type protein. .................................................... 43
Figure 3.22: Resume of all crystallization conditions tested for DRbr Y59F and DRbr Y59F Y127F. .. 44
Figure 3.23: Crystals obtained for DRbr Y59F. .................................................................................... 44
Figure 3.24: Crystals obtained for DRbr Y59F Y127F.. ....................................................................... 45
Figure 3.25: EPR spectra of DRbr proteins.. ....................................................................................... 46
Figure 3.26: EPR spectra of the DRbr Y127F before and after the diiron centre reconstitution. ......... 47
Figure 3.27: Redox titration of desulforubrerythrin wild type................................................................ 48
Figure 3.28: Redox titration of DRBr WT followed by EPR spectroscopy. ........................................... 49
Figure 3.29: Redox titration of DRBr WT followed by EPR spectroscopy.. .......................................... 49
Figure 3.30: Redox titration of DRbr WT followed by EPR spectroscopy.. .......................................... 50
Figure 4.1: Amino acid sequence alignment of rubrerythrins and ribonucleotide reductases. ............ 55
Figure 4.2: UV-Visible spectra of erythrin and desulforubrerythrin.. .................................................... 57
Figure 4.3: Multiple sequence alignment of rubrerythrins using Clustal X. ......................................... 63

XIX
List of tables
Table 1.1: Example of genes up and down regulated by Fur, PerR and iron. ...................................... 14
Table 2.1: Instructions for LB and LA media preparation. ................................................................... 19
Table 2.2: Instructions for preparation of SDS-PAGE gels.. ............................................................... 21
Table 2.3: Solution components for preparing loading buffer with and without urea. ........................... 22
Table 2.4: Components and respective concentrations of the lysis buffer. .......................................... 22
Table 3.1: Quantifications performed for all final fractions from the protein purifications. .................... 34
Table 3.2: Absorbance ratios between the different absorbance peaks............................................... 36
Table 3.3: Elution volumes of the molecular mass standards of the S-200 calibration. ....................... 37
Table 3.4: Elution volumes and molecular masses of WT and DRbr mutants ..................................... 39
Table 3.5: Elution volumes and molecular masses of WT and DRbr mutants ..................................... 39
Table 3.6: Results of the N-terminal sequencing …..............................................................................40
Table 4.1: Reduction potentials of WT C.pasteurianum and its mutants ............................................. 60

XX

XXI
Abbreviations
Å Angstrom (10-10
meters)
BCA Bicinchoninc acid
BSA Bovine Serum Albumine
Cia Campylobacter invasion antigens
CDT Cytolethal Distending Toxin
CD Coestimulatory molecule
Da Dalton
DC Dendritic cell
DRbr Desulforubrerythrin
DRbr Y59F Desulforubrerythrin with residue 59 (tyrosine) replaced by a
phenylalanine
DRbr Y127F Desulforubrerythrin with residue 127 (tyrosine) replaced by a
phenylalanine
DRbr Y59F Y127F Desulforubrerythrin with residues 59 and 127 (tyrosines) replaced by
phenylalanines
Dfx Desulfoferrodoxin
DNA Deoxyribonucleic acid
Dps DNA binding protein from starved cells
Dx Desulforedoxin
E’0 Conditional reduction potential
e- Electron
ε Molar absortivity
EPR Electron paramagnetic resonance
FUR Ferric uptake regulator
g EPR-g factor
H+
Proton
ICP Induced Coupled Plasma
IL Interleukine
IPTG Isopropythiogalactoside
LB Lysogeny broth
LOS Lipooligossacharides
MES 2-(N-morpholino) ethanesulphonic acid
NADH Reduced nicotinamide adenine dinucleotide
NF-B Nuclear factor B
NADPH Reduced nicotinamide adenine dinucleotide phosphate
O.D. Optical density
PAGE Polyacrylamide gel electrophoresis
PEG Polyethylene glycol
PerR Peroxide Regulator

XXII
PDB Protein Data Bank
Rbr Rubrerythrin
Rd Rubredoxin
ROS Reactive oxygen species
S Spin quantum number
SDS Sodium dodecyl sulphate
SOD Superoxide Dismutase
TCEP Tris-(2-Carboxyethyl)phosphine hydrochloride
TEMED N, N, N', N'-tetramethylethylenediamine
TNF-α Tumor Necrosis Factor α
TPTZ 2, 4, 6 – tripyridyl-triazine
Tris Tris (hydroxymethyl)-aminomethane
UV Ultraviolet
Vis Visible
Wt Wild type
Latin abbreviations
c.a. circa, approximately
e.g. exempli gratia, for example
et al. et alia, and other people

XXIII

XXIV

1
1. INTRODUCTION
1.1. Reactive oxygen species (ROS) and oxidative stress
1.1.1. Oxygen
Molecular oxygen (O2) is essential to all aerobic organisms but at the same time it can cause
serious cellular damage. O2 has a strong oxidizing potential, which makes this molecule very suitable
for accepting electrons in reduction-oxidation reactions (Bartz and Piantadosi, 2010). The complete
reduction of O2 to water has a reduction potential of 0.815 V at pH 7.0 (Wood, 1988) (eq 1.1).
O2 + 4 H+ + 4 e
- 2 H2O2 (eq 1.1)
Oxygen has two unpaired electrons with the same spin, what limits its reactivity due to spin
restriction rules (Fridovich, 2013).
1.1.2. Reactive oxygen species
Reactive oxygen species are molecules derived from oxygen reduction that can cause serious cell
damaging. The most common ROS in living organisms are superoxide anion (O2.), hydrogen peroxide
(H2O2), hydroxyl radical (HO.) and singlet oxygen (
1O2) (Birben et al, 2012; Dröge, 2002).
These molecules can be free radicals on non-radicals with unstable bonds. In the first the high
reactivity is due to the presence of unpaired electrons (Burton and Jauniaux, 2011).
Superoxide anion is formed by one electron reduction of oxygen (eq 1.2). It can react with another
molecule of superoxide and form again oxygen and hydrogen peroxide in an autodismutation process
(eq 1.3) (Jena, 2012).
O2 + 1e- O2
.- (eq 1.2)
2O2.- + 2H
+ O2 + H2O2 (eq 1.3)
Hydrogen peroxide can also be formed by the reduction of oxygen by two electrons (eq 1.4) or
dimerization of two hydroxyl radicals (eq 1.5). In the case of hydrogen peroxide its reactivity is due to
its low energy bonds when compared with O2 and O2.- (Brieger et al, 2012).
O2 + 2H+ + 2e
- H2O2 (eq 1.4)
2HO. H2O2 (eq 1.5)
The hydroxyl radical, the most dangerous ROS for in vivo systems, can be formed by reacting
superoxide and hydrogen peroxide, through the Haber-Weiss reaction (eq 1.6).
O2.- + H2O2 HO
. + OH
- + O2 (eq 1.6)

2
Singlet oxygen is very reactive and highly toxic in biological systems. This species corresponds to
an excited form of molecular oxygen in which one of the electrons underwent a spin inversion, in an
endothermic process (Fridovich, 2013). One of its sources is enzymatic reactions of photo-oxidation of
biological compounds. Singlet oxygen reacts with DNA, particularly with guanine bases due to their
lower redox potential (Agnez-Lima et al., 2012).
1.1.3. Sources of ROS in living organisms
ROS are produced by all living organisms as a result of the normal aerobic metabolism and can
be produced by external agents, such as ionizing radiation and transition metal ions (Birben et al.,
2012).
The production of ROS assumes particular importance in organisms in which O2 is the final
electron acceptor in the respiratory chain due to the leakage of electrons from respiratory enzymes.
These electrons can lead to one electron reduction of O2 and the subsequent formation of O2.-, the
most common radical in living organisms. The main source of hydrogen peroxide is the dismutation of
O2.- by superoxide dismutase (SOD). This is readily converted to water by several enzymatic systems,
such as catalase and glutathione reductase. When these systems fail, H2O2 becomes available to
react with O2.- and yield the dangerous HO
.. This radical has no known scavenger and reacts very
rapidly with biological molecules. Besides, H2O2 can diffuse freely through biological membranes and
cells have to cope with H2O2 produced in the outside of the cell (Brieger et al., 2012).
Singlet oxygen can be formed by photo-oxidation of molecular compounds or by enzymatic
reactions.
1.1.4. Iron and ROS
Iron is essential for all organisms. The couple Fe2+
/Fe3+
in biological systems has a redox potential
that varies from -500 mV and +300 mV. This characteristic and its ability to exist in different redox
states make iron a perfect co-factor for electron transfer reactions (van Vliet et al., 2002). Iron can
present oxidation numbers between -2 and +6, but in biological systems is only found Fe (II), Fe (III)
and Fe (IV), respectively ferrous, ferric and ferryl forms (Cornelis and Andrews, 2010).
In biological systems iron is present in heme containing proteins and non-heme containing
proteins, such as iron-sulfur proteins and non iron-sulfur proteins. These proteins have a wide diversity
of functions, such as transcriptional regulation, electron transference, respiration or ROS detoxifying
proteins (van Vliet et al., 2002).
In spite of its importance, iron can cause serious injury when allowed to remain free in the cell, for
its reaction with oxygen is one of the sources of ROS in the cell. This is mainly due to the Fenton
reaction (eq 1.7) In the presence of iron (II) hydrogen peroxide is reduced and HO. is formed. The
cycle is completed by the regeneration of ferrous iron at the expense of one electron from superoxide
radical (eq 1.8) (Birben et al., 2012).

3
Fe2+
+ H2O2 + H+ Fe
3+ + HO
. + H2O (eq 1.7)
Fe3+
+ O2.- Fe
2+ + O2 (eq 1.8)
To prevent these nefarious effects organisms have several proteins to capture free iron in a
controlled way through sensor and regulatory systems. In more complex organisms this restriction is
per se a defence against microbial colonization, given that all (pathogenic) organisms need iron
(Holmes et al., 2005), a process called nutritional immunity (Damo et al., 2012). Also it is not
surprising that iron and oxidative stress response genes are regulated by common mechanisms.
1.1.5. Toxicity of H2O2
The toxic effects of ROS, especially H2O2, for the bacterial cells can be used for human benefit.
The immune system already takes advantage of ROS to kill invading pathogens and also to initiate the
adaptive immune response. The great advantage of these substances is their non specific mode of
action, thus they can be use against several bacteria (Linley et al., 2012). But these compounds can
also be use as disinfectant agents in industry or medical services. Its cellular targets are also very
distinct. Hydrogen peroxide can react with co-factors from metallic proteins; can damage the DNA via
Fenton reaction and lipids peroxidation which will lead to unstable cellular membranes (Finnegan et
al., 2010).
1.1.6. ROS detoxifying systems
Antioxidants keep ROS levels balanced by competing with other oxidizing substrates (Droge,
2002). Antioxidants can be enzymes, such as superoxide dismutase, catalase, or glutathione
peroxidase, or small molecules as glutathione, vitamin C and vitamin E (Birben et al., 2012).
When an organism reaches a state in which the amount of antioxidants and oxidative species is
unbalanced favouring the later, we can say to have a situation of oxidative stress (Birben et al., 2012).
Superoxide dismutases are enzymes responsible by dismutation of superoxide anion to hydrogen
peroxide and oxygen. They can be separated in three families depending on the co-factor utilized.
FeSOD/MnSOD can utilize iron or manganese as co-factor; the Cu, Zn SOD family in which the
protein uses an atom of copper as co-factor and a zinc atom as structural element; and finally a family
of SOD that uses nickel as co-factor (NiSOD) (Aguirre and Culotta, 2012).
Peroxidases are the mainly responsible enzymes for H2O2 reduction, being catalase a specific
enzyme within this family. The first reduce hydrogen peroxide to water by oxidizing other substrates,
while catalase catalyses the dismutation to water and oxygen (eq 1,9). This family includes gluthatione
peroxidases and peroxiredoxins (Prx). Contrary to what is observed in many ROS destoxifying
enzymes, Prx does not possess any metal co-factor. The reduction of hydrogen peroxide is performed
by active cysteine residues and the resultant disulfide bond is reduced by thioredoxin (Rhee et al.,
2012).
2 H2O2 2 H2O + O2 (eq 1.9)

4
1.2. Rubrerythrins
Rubrerythrins (Rbr) are non-heme iron containing proteins. The first rubrerythrin was identified in
Desulfovibrio vulgaris (Figure 1.1) (Legall et al., 1988), but other rubrerythrins were lately found in
organisms from all life domains, mainly anaerobic and microaerophilic ones (e.g. Pütz et al., 2005;
Wakagi, 2003). They belong to the ferritin-like super family mainly by their four-helix bundle domain
(Andrews, 1998; Cooley et al., 2011).
Most rubrerythrins are composed by two domains: a diiron oxo-bridged centre incorporated in a
four-helix bundle and a rubredoxin domain at the N-terminal which contains an iron atom coordinated
by four cysteines. Rubrerythrins are usually purified as homodimeric proteins with a “head to tail”
arrangement (Coulter et al., 2000; Lumpio et al., 2001; Weinberg et al., 2004).
Figure 1.1: Structure of Desulfovibrio vulgaris rubrerythrin (PDB codes: A. 1RYT. B. 1LKM and C. 1LKO). The
green area corresponds to the four-helix bundle domain and the red area is the rubredoxin domain. The iron atoms are represented in black. (A) Protein in a monomeric conformation. (B) Diiron centre all ferric. (C) Diiron centre all ferrous. Pictures created with Chimera.
1.2.1. Structural domains
The family of rubrerythrins is large and diverse due to the occurrence of several domains addition
at the C and N-terminals (Figure 1.2).
A B
C
Fe1 Fe2
Fe1 Fe2

5
Figure 1.2: Dendogram of proteins from the rubrerythrin family (Pinto, 2012).
The simplest rubrerythrin contains only the four helix-bundle domain, like simerythrin from
Cyanophora paradoxa or sulerythrin from the archeon Sulfolobus tokodaii (Cooley et al., 2011;
Wakagi, 2003). The four-helix bundle carries a diiron centre responsible for the catalytic activity of the
protein. The iron ligands are two histidines, four carboxylates and one glutamate, depending upon its
oxidation state. When oxidized the Fe1 is coordinated by four glutamate residues and Fe2 is
coordinated by three glutamates and one histidine. The two iron atoms are connected by two of the
glutamate residues ligands and one molecule of solvent. In the reduced form the molecule of solvent
disappears and each iron is coordinated by one histidine, three glutamates and one molecule of water
(Figure 1.1) (Pinto, 2012).
Given the high similarity of helix A/B and helix C/D it is proposed that rubrerythrins ancestors
were homodimeric proteins containing only replicas of helix A and B (Figure 1.3) and the appearance
of the actual rubrerythrins was probably due to a gene duplication event (Andrews, 2010).

6
Figure 1.3: Four-helix bundle of D. vulgaris rubrerythrin. Image coloured from blue (N-terminal) to red (C-terminal). PDB code: 1ryt. The helixes are designated by the letters (A-D). Picture created with Chimera.
The C-terminal of rubrerythrins usually has a rubredoxin domain. Rubredoxins are iron-sulfur
proteins harbouring an iron atom coordinated by four cysteine residues (Bentrop et al., 2001).
Two types of rubredoxin proteins are so far described in literature. The difference between type I
and type II rubredoxins is based on the distance between the cysteine ligands to the iron. Type I
rubredoxins have a binding motif of the type CX2CXnCX2C and are the most common rubredoxins.
Type II rubredoxins have two extra residues between the first pair of cysteines. In rubrerythrins the
rubredoxin like domain resembles a type I rubredoxin. Desulforedoxin is a rubrerythrin-like protein in
which the amino acids between the first pair of cysteines are absent, that causes a distortion in the
protein structure (Figure 1.4) (Archer et al., 1995).
Figure 1.4: Comparison between rubredoxin and desulforedoxin. (A) Three-dimensional structure of Desulfovibrio vulgaris rubredoxin. Structure 1RB9 from PDB. (B) Three-dimensional structure of D. vulgaris desulforedoxin. Structure 1DXG from PDB. Iron atoms are coloured in black. Figures created with Chimera.
1.2.2. Physiological activity
Considering the structural domains present in rubrerythrins it was initially thought that they can be
involved in iron storage or in protection against oxidative stress. The diiron centre of rubrerythrins has
a three-dimensional structure similar with that of ferritins and is able to oxidize ferrous iron (eq 1.10
A
B
C
D
A B

7
and 1.11) (Coulter et al., 2000), however rubrerythrins do not form a hollow sphere that could store
iron.
Fe2+
+ Rbrox Fe3+
+ Rbrred (eq 1.10)
Rbrred + O2 Rbrox + [O2]red (eq 1.11)
To study the possible role of rubrerythrin, Lumppio and collaborators transformed an Escherichia
coli strain (QC774) deficient in sodA and sodB that requires supplementation of the minimal medium in
order to grow in aerobic conditions. This observed phenotype is probably due to the accumulation of
superoxide anion and free iron. They transformed this strain with a plasmid coding for rubrerythrin and
compared the growth rates of the non-transformed strain versus the transformed strain and found no
significant differences, excluding the hypothesis of this protein acting as a superoxide dismutase. On
the other hand they also transformed an E. coli strain (NC202) deficient in katG and katE (genes that
encode catalase) and observed that the strain expressing the rubrerythrin had a higher survival rate
when aerobically exposed to 2.5 mM H2O2 than that of the wild type strain. Similar results were obtain
for nigerythrin, a Rbr-like protein also identified in D. vulgaris, thus indicating a role in hydrogen
peroxide detoxification for these proteins (eq 1.12 and eq 1.13) (Lumpio et al., 2001).
NADH + Rbrox Rbrred + NAD+ + H
+ (eq 1.12)
2 H+ + Rbrred + H2O2 Rbrox + 2 H2O (eq 1.13)
In another work the authors studied the ability of wild type and mutant rubrerythrins from D.
vulgaris to perform the referred functions attributed to rubrerythrins (peroxidase and ferroxidase). The
work was performed with wild type and rubrerythrin mutants. The results obtained for Rbr Y27F and
hydrogen peroxide are of particular importance, given the subject under study in this work. Observing
the results obtained for the wild type protein the NADH peroxidase activity (251 3.2 M min-1
) seems
to be more likely to occur in vivo than the ferroxidase activity (2 0.3 M min-1
). Furthermore, the
Y27F mutant showed only 30% of the wild type peroxidase activity, thus indicating the residue in
position 27 as being important to this activity. (Coulter et al., 2000).
In Pseudomonas gingivalis W83 was detected the presence of a Rbr. Initial studies done by M.
Sztukowsaka and collaborators showed the impact of Rbr gene disruption. They showed an increase
in Rbr gene transcription upon exposure to oxygen or hydrogen peroxide and also the P. gingivalis rbr-
mutant is more sensitive to oxygen and hydrogen peroxide (Sztukowsaka et al., 2002). Later, Mydel
and collaborators studied the importance of Rbr for P. gingivalis infection using a murine model.
Although they showed the importance of Rbr in P. gingivalis proliferation in vivo through protection
against reactive nitrogen species (RNS) (Mydel et al., 2006). Having in mind the previous results this
is a little intriguing and the physiological role of rubrerythrins as well their physiological electron donors
needs further investigation.

8
1.2.3. Desulforubrerythrin
Desulforubrerythrin (Figure 1.5) was identified in Campylobacter jejuni NCTC11168. After
exposing cells to H2O2, it was observed that a protein of approximately 27 kDa started to degrade.
After N-terminal sequencing it was identified as the product of the gene cj0012c (Yamasaki et al.,
2004).
Figure 1.5: Desulforubrerythrin in a tetrameric conformation. Each monomer is represented with a different
colour. (Unpublished data under refinement).
The sequence analysis of the protein revealed the presence of a desulforedoxin like domain at
the N-terminal, wrongly labelled by the authors as rubredoxin oxidoreductase (Rbo) and a rubrerythrin
like domain at the C-terminal, leading to the first designation of the protein: Rrc (Rbo/Rbr like protein
from C. jejuni). Lately the domain at the N-terminal was identified as a desulforedoxin domain, leading
to the actual denomination of the protein: desulforubrerythrin - DRbr (Pinto et al., 2011). This similarity
with rubrerythrins leaded the authors to speculate about the protein function as being related with
oxidative stress protection. Although the levels of protein decrease upon cells exposure to hydrogen
peroxide, no significant alterations were detected in the mRNA levels (Yamasaki et al., 2004).
In case the protein is involved in hydrogen peroxide reduction its degradation at higher levels of
its substrate may be an auto-regulation mechanism. It is clear that the protein needs to be reduced by
some enzymatic system which in last instance should lead to NAD(P)H consumption. Thus, in
elevated concentrations of hydrogen peroxide exists the serious possibility of depletion the cell of its
reducing equivalents.
Lately, A.F. Pinto and collaborators showed that the protein has NADH-linked hydrogen
peroxidase activity. They showed that the protein is able to reduce hydrogen peroxide to water in the
presence of NADH, flavorubredoxin oxidoreductase and rubredoxin domain of flavorubredoxin, both
from Escherichia coli (Pinto et al., 2011). The same work also showed that the protein is isolated as a
tetramer and has an isoelectric point of 5.37.
To better understand the catalytic mechanisms of the reaction with hydrogen peroxide, three
mutant proteins were here studied. Two single mutant proteins and one double mutant comprising
both mutations. The residues chosen were tyrosine 59 and 127. These residues are strictly conserved

9
in rubrerythrins and are hydrogen bounded to iron ligands (Figure 1.6). Besides, tyrosines surrounding
diiron centres are known for being important in dissipation of oxidizing species such as Fe (IV) by
formation of a tyrosil radical (Pinto, 2012). The residues were replaced by a phenylalanine, a
structuraly similar amino acid but lacking the hydroxyl group. This difference should be enough to
induce changes in protein activity (in case the residues are important for its activity) but should not be
enough to change the three-dimensional structure around the catalytic centre.
The work here presented was based in expression, purification and characterization of the mutant
proteins having as reference the wild type protein.
Figure 1.6: Depiction of the diiron centre evidencing its surrounding tyrosines. Iron atoms are represented in red; tyrosine 59 is represented in red; tyrosine 127 is represented in yellow. The dashed black lines represent hydrogen bonds between the tyrosines and glutamates. (Unpublished data under refinement).
1.3. Campylobacter jejuni: an overview
Campylobacter jejuni is a microaerophilic Gram-negative bacterium. It belongs to the delta-epsilon
class of proteobacteria (Figure 1.7) and is a flagellate spiral bacterium (Figure 1.8). This species is the
main cause of foodborne gastroenteritis in the world. The infection is acquired by consumption of
contaminated meat, especially poultry. In developing countries contaminated water can also be a
source of infection. The symptoms include fever, abdominal pain and diarrhoea (Dasti et al., 2010;
Young at al., 2007). The disease can cause different symptoms apparently depending on the socio-
economic level of the country. In developed countries the infection causes bloody diarrhoea with
mucus while in developing countries the infection is more common in children and causes watery
diarrhoea (Young et al., 2007). This could be due to the fact that in developing countries people are
exposed to the pathogen at early stages of life and this could confer a certain immunity against
subsequent infections. In any case the infection in self-limiting, but in more severe cases antibiotic
therapy may be required, generally erythromycin but also quinolones. Initially erythromycin was the
chosen antibiotic to treat campylobacteriosis, being replaced nowadays by fluroquinolones. Although
initially these drugs were efficient in treating the infection, soon cases o antibiotic resistance started to
emerge due to the indiscriminate use of antibiotics in animals (Engberg et al., 2001), making urgent
the identification of alternative targets to other drugs.

10
Fig
ure
1.7
: Localiz
ation o
f C
am
pylo
bacte
r genus in t
he t
ree o
f lif
e.
(A)
Tre
e o
f lif
e b
ased o
n s
sR
NA
Ad
ap
ted
fro
m T
od
ar
20
12
. (B
) P
hylo
ge
netic
tr e
e o
f B
acte
ria b
ased i
n p
rote
ins.
(C)
Phylo
genetic t
ree o
f P
rote
obacte
ria b
ased o
n p
rote
ins.
Th
e n
um
be
rs r
ep
rese
nt
bo
ots
tra
p s
up
po
rt.
Adapte
d f
rom
(G
upta
, 2006).

11
The infection can cause serious sequelae, such as reactive arthritis and Guillian-Barre syndrome
(GBS), a muscular neuropathy (Altekruse et al., 1999; Kassem et al., 2012; Young et al, 2007). The
GBS seems to be an auto-immune response to the infection to the lipooligosacharides (LOS) of C.
jejuni that are similar to human gangliosides. This results in temporary paralysis of the peripheral
nerves and more rarely it can lead to death (Bingham-Ramos and Hendrixson, 2008; Kaakoush et al.,
2007).
Figure 1.8: Campylobacter jejuni scanning microscopy image (Altekruse et al.,1999)
The genome of C. jejuni NCTC11168 has 164 148 base pairs, from which 94.3% encodes proteins
making it one of the densest genomes sequenced. The analysis of the genome revealed
homopolymeric tracts with great variability, probably coding for LOS, flagellar systems or other
extracellular components (Parkhill et al, 2000). This diversity in extracellular surface structures may be
one way to escape the immune system.
C. jejuni requires low O2 concentrations (5-10%) and 5-10% of carbon dioxide to grow, which
makes this microorganism microaerophilic and capnophilic, respectively. Its optimum growth
temperature is 42ºC, just the same temperature of the chicken gut: its commensal host. In vitro growth
of this microorganism requires media supplemented with blood or fetal bovine serum (Atack and Kelly,
2009). This makes one wonder how C. jejuni survives in the environment while travelling between
hosts (see section 3.1).
Campylobacter members have a full tricarboxylic acid cycle (TCA) but are unable to utilize
carbohydrates as energy source; they rely on intermediates of the TCA cycle (Brenner et al., 2005).
C. jejuni possesses a highly branched respiratory chain allowing the organism the use of a wide
range of substrates, including formate, malate, succinate and lactate, amongst others (Hoffman and
Goodman, 1982; Kassem et al., 2012).
1.3.1. C. jejuni, oxidative stress and iron
Although C. jejuni requires specific conditions for optimal growth it has the ability to colonize
different hosts and to survive in different environments, where may face different type of stresses:
nutrients depletion (namely iron), atmospheric concentrations of O2, ROS produced by the host,
amongst others. To be able to survive these stressful conditions C. jejuni needs oxygen consuming
enzymes and reactive oxygen species scavengers.

12
The respiratory chain of C. jejuni possesses a cbb3 type oxygen reductase and a bd-type quinol:
O2 oxidoreductase, which are important for O2 consumption (Smith et al., 2000).
C. jejuni is a catalase-positive organism. Its genome analysis shows the presence of only one
catalase coding gene named katA. W. A. Day and collaborators showed that a C. jejuni catalase
deficient strain loses its viability after 15 minutes exposure to H2O2, while the wild type bacteria
maintains a viability of approximately 60% after 1 hour in the same conditions. They also showed that
the wild type strain could survive upon uptake by murine and porcine macrophages, while the mutant
bacteria were not able to recover. Moreover, in macrophages treated with an oxidative burst inhibitor
no differences were detected between the wild type and catalase deficient strains. Altogether these
results show the importance of catalase in H2O2 resistance for C. jejuni (Day et al., 2000).
The superoxide dismutation is performed by an iron superoxide dismutase (Fe-SOD). A mutant
strain lacking the sodB gene was less able to survive inside human embryonic intestinal cells when
compared with the wild type strain (Pesci et al., 1994).
Proteins belonging to the family of peroxiredoxins were also identified in C. jejuni. These are alkyl
hydroperoxide reductase (AhpC), thiol peroxidase (Tpx) and bacteoferritin comigratory protein (Bcp).
The AhpC protein was showed to increase the aerotolerance under normal atmospheric conditions of
C. jejuni but showed no detected effects in H2O2 resistance (Baillon et al., 1999). Studies with Tpx and
Bcp suggest that these two proteins may have a redundant role by comparing the phenotype of a wild
type C. jejuni strain with tpx and bcp single mutants and with a double mutant. When growing the
strains microaerobically the single mutants showed growth profiles very similar with the wild type
strain. The double mutant reached the same cellular density than the wild type strain, but took more
than twice as long. This was also verified when the cells were exposed to 1 or 2 mM of H2O2. The
same study shows that Tpx and Bcp have substrate specificity. Both enzymes can reduce H2O2 in the
presence of thioredoxin, thioredoxin reductase and NADH but only Bcp was able to reduce cumene
hydroperoxide and tert-butyl-hydroperoxide, common artificial substrates to measure peroxidase
activity (Atack et al., 2008).
C. jejuni also contains a DNA binding protein from starved cells (Dps). Dps are DNA binding
proteins, that also bind iron, thus preventing the production of HO. (Miyamoto, et al., 2011). It was
observed that the Dps confers H2O2 resistance by binding iron in the cell, because bacteria lacking the
Dps showed the same H2O2 resistance than the wild type bacteria when an iron chelator was added to
the growth medium (Ishikawa et al., 2003). Just recently was shown that the C. jejuni Dps has DNA
binding ability in the presence of H2O2 and Fe2+
, thus protecting DNA from the nefarious effects of
H2O2 (Huergo et al. 2013).
A truncated globin (Ctb) was identified in C. jejuni as important to bacteria survival even under
microaerophilic conditions, the ctb mutant showed a slower growth when compared with the wild type
protein (Wainwrigh et al., 2005).
Although C. jeujuni seems to be lacking siderophores (iron chelators exported by microorganisms
(Pi et al., 2012)) it is able to use siderophores from other bacteria present in the bowel and iron is then
transported to the cell by a ferric-enterobactin (CfrA). Furthermore, C.jejuni is able to use the heme
group from exogenous proteins through the heme uptake system ChuABCD (Butcher et al., 2010).

13
All these ROS detoxifying systems need to be tightly regulated. Contrarily to other bacteria C.
jejuni lacks the regulators OxyR and SoxR, respectively involved in hydrogen peroxide and superoxide
sensing. Instead, this bacterium possesses the PerR protein, usually found in Gram-positive bacteria,
which is an hydrogen peroxide regulator (Butcher et al., 2010) The iron uptake also needs to be
carefully controlled since it is involved in the generation of the dangerous hydroxyl radical. This is
regulated by the ferric uptake regulator (Fur), a member of the PerR family. Fur is a repressor that in
the presence of ferrous iron Fur binds itself to the promoter of iron uptake genes and inhibits their
transcription (Palyada et al., 2004). Fur also represses genes involved in ROS detoxifications (katA,
ahpC) (Table 1.1) (Butcher et al., 2010). This last result seems contradictory given that iron is tightly
connected to the formation and elimination of ROS via the Fenton reaction and by its role in
detoxifying enzymes, respectively. So under iron rich conditions an over expression in iron-containing
proteins would be expected to avoid the dangers of free iron in the cell.
PerR works by inhibiting the transcription of genes involved in oxidative stress response. Its own
expression is iron-dependent but not H2O2 dependent and is auto regulated by binding to the perR
promoter (Kim, et al., 2011). In the absence of iron Apo-PerR is unable to bind to the promoter region
in the DNA resulting in induction of oxidative stress resistance genes, even in the absence of ROS
(Butcher et al., 2010)
The implication of PerR in H2O2 resistance is corroborated by studies where a strain lacking perR
is more resistant to H2O2, due to continuous transcription of katA and ahpC (Palyada et al., 2009).
Due to the close relation between iron and oxidative stress several genes are co-repressed by
PerR and Fur (Figure 1.9).
In a fur mutant cj0012c transcription is activated under iron rich conditions and is repressed in the
absence of iron. In the wild type strain its transcription is also decreased when iron is not available
(Butcher et al., 2012; Holmes et al., 2005). Furthermore cj0012c is also repressed by PerR (Palyada
et al., 2009), which is in agreement with the results shown by Yamazaki et al. that observed
unchanged levels of cj0012c transcripts in the presence of hydrogen peroxide.

14
Figure 1.9: Simplified representation of oxidative stress regulation in Campylobacter jejuni. Anti-oxidant systems
are in blue coloured boxes; oxidants species are coloured in red; Fur is coloured in the green box; Per-R is in the yellow coloured box. Full trace lines represent primary repression and dashed lines represent secondary repression. Adapted from Palyada et al., 2009.
Table 1.1: Example of genes up and down regulated by Fur, PerR and iron. The signals “-” and “+” stand for repression or activation, respectively. Adapted from Butcher et al.,
2010.
Gene name and category
Fur-Fe Fur+Fe Fe PerR-Fe PerR+Fe
Iron transport
cfrA - -
chuABCD - - -
Oxidative stress defense
ahpC - - -
cft -
katA - - - -
rrc - + + -
1.3.2. Pathogenesis mechanisms
Approximately 90% of the campylobacteriosis cases are due to Campylobacter jejuni and the
other cases are almost entirely attributed to Campylobacter coli.
ChuABCD
PerR-Oxi
PerR-Fe
Fur-Fe
CfrA
SodB
Fe2+
Heme
[4Fe-4S]
KatA
AhpC
H2O2
H2O2
Fe2+ Fe2+
H2O2O2.-
Fe2+
ROOH
ROOH
Fe3+ +OH- + RO.
Fe3+ +OH- + HO.
ROH + H2O
H2O + O2

15
Based on the symptoms two disease mechanisms are hypothesised: adherence of the bacteria to
the intestine and production of toxins or invasion and replication inside the host cells which will initiate
an inflammatory disease. In the first case the symptoms include watery diarrhea, while in the second
bloody diarrhea (Janssen et al., 2008).
Colonization of the host occurs in the small bowel and in the colon (Altekruse et al.,1999). The
first barrier that the bacteria should overcome is the acidic environment of the stomach, followed by
the barrier of the gastrointestinal tract, namely the mucus layer. The bacteria overpass the mucus
layer thanks to their corkscrew shape, motility and chemotaxis (Altekruse et al., 1999; Young et al.,
2007; Kassem et al., 2012). To fulfil the colonization process the bacteria must adhere to the epithelial
cells through membrane proteins. Several proteins are involved in cell adherence: CadF, CapA, PEB1
and JlpA (Dasti et al., 2010). CadF is also required for cell invasion in a fibronectin dependent way.
Mutants in CadF and JlpA have shown impaired ability to invade several cell lines in vitro and are also
less prone to colonize chicken gut (Dasti et al., 2010; Young et al., 2007).
More than being involved in motility the flagella also seem to be important for cell invasion and
toxicity. The flagellar filament is composed by two proteins: FlaA and FlaB. Deletion studies in a
human clinical strain showed that deletion of flaA results in impaired motility and invasion, but the
adherence ability of the bacteria was enhanced. The double mutant in flaA and flab showed even a
greater adherence improvement but the invasion was poorer than in the flaA mutant. (Konkel et al.,
2004).
The secretion mechanisms are not yet clear, but no type III secretion system was identified. It is
believed that secretion is dependent on the flagellar machinery due to homology of secreted proteins
with flagellins. These secreted proteins are named Campylobacter invasion antigens (Cia) and their
functions are still unknown. The secretion pathway via flagellum is corroborated by mutagenesis
studies. In the mutant flaAflaB no secretion of this CiaB was detected although the protein was
expressed (Konkel et al., 2004). This highlights the importance of the flagellar apparatus in secretion
and consequently on the disease.
The only toxin identified so far in C. jejuni is the cytolethal distending toxin (CDT) which is also
found in other species in the same genus and in Escherichia coli. CDT is a holotoxin composed of
smaller proteins: CdtA, CdtB and CdtC. This toxin arrests the cellular cycle at G2 phase and causes
cell distension. CdtB is responsible for the protein activity, while CdtA and CdtC probably play a role in
the uptake by the host cells but there is no evidence if these subunits enter the cell or not. The
sequence of the CdtB subunit showed similarity with DNase-I like proteins, and CdtB was showed to
have DNase activity in plasmidic DNA (Ohara et al., 2004).
The mechanism by which CDT is exported from the bacterial cell is unknown but one study
suggests that outer membrane vesicles (OMV) may be a vehicle for toxin export (Lindmark et al.,
2009). CdtB is probably translocated to the nucleus of the host cell via via retrogade transport (Young
et al., 2007).

16
1.4. Campylobacter jejuni, ROS and the immune system response
The role of ROS in the immune system concerns both the innate and acquired immunity.
After ingestion of microorganisms by
phagocytic cells a “respiratory burst” takes place
inside the phagolysosome. This process starts
with the production of O2.-
by the NADPH oxidase
enzyme present in the phagossome membrane
(NOX2) that transfers electrons from NADPH to
two O2. As seen in section 1.1, O2.-
production will
lead to production of several oxidant molecules,
namely H2O2 and HO.. The hydrogen peroxide can
also be converted in hypoclorous acid, a strong
oxidant, by mieloperoxidase or eosinophil
peroxidase (Winterbourn, 2008) (Figure 1.10).
These molecules will hopefully cause serious
damage in the pathogenic bacteria. The
importance of NOX is corroborated by a reduced
resistance to infections in mice lacking NOX
subunits (Alfadda and Sallam, 2012;, Droge,
2002). Besides, NOX1 is present at the cellular
membrane and transfers electrons to O2 present
at the outside of the cell (Winterbourn, 2008),
allowing to fight bacteria that resist phagocitosis.
The role of ROS goes beyond this non-selective response. The production of ROS at the infection
local decreases the threshold activation of T -lymphocytes due to amplification in signalling cascades
(Figure 1.11) (Kaakoush et al., 2007).
Figure 1.11: Importance of ROS in the immune system. ROS production by activated macrophages is a non-
specific defence against invading pathogens. ROS also play an important role in activation of T-lymphocytes along with pathogen determinants presented by Major Complex of Histocompatibility (MHC) molecules. (Adapted from Droge, 2002)
ARActivated
macrophageMHC
Antigenic
Peptide
Pathogen
T-Lymphocyte
ROS
Pathogen
PathogenPathogen
+
First line
of defense
Proliferation and
differentiation of
effector cells
Figure 1.10: NOX role in generation of ROS in
phagosomes. NOX generates O2-. that dismutes into
H2O2. Myeloperoxidase converts hydrogen peroxide in hypochlorous acid. Image from Winterbourn, 2008.

17
After interaction of C. jejuni with epithelial cells cytokine production is induced, namely IL-8. IL-8
secretion leads to recruitment of dendritic cells (DCs), macrophages and neutrophils (Zheng et al.,
2008).
Dendritic cells (DC) seem to play a fundamental role in the immune response to C. jejuni
activation. Based on in vitro results C. jejuni is rapidly internalized by DC promoting the DCs
maturation verified by expression of coestimulatory molecules (CD40, CD80 and CD86) (Hu et al.,
2006). In the same study production of cytokines by infected DC was also observed, especially IL-8
and TNF- (Tumor Necrosis Factor ) as well NF-B (Nuclear Factor-B) activation. The activation of
DCs is extremely important to stimulate naive T cells through antigen presenting. The same study also
points LOS as one important feature in cytokine production (Young et al., 2007).
The production of IL-8 by epithelial cells seems to be dependent of the flagellum and the CDT
given that mutants in one of these features are less efficient in promoting IL-8 secretion. Furthermore
this secretion also seems to be dependent of NF-B activation (Figure 1.12) (Zheng et al., 2008).
Figure 1.12: Representative scheme of pathological inflammation. This response of the immune system is
triggered by “pathogen-associated molecular motifs (PAMP)”. Bacterial cells interact with the epithelium inducing realising of pro-inflamatory cytokines (CXCL20, IL-8). This leads to the recruitment of dendritic cells (DCs), macrophages and neutrophils. The internalization of the bacteria by DCs will initiated the activation of the
NF-B via. Image from Sansonetti and Santo, 2007.

18

19
2. MATERIALS AND METHODS
Unless stated otherwise all procedures were performed with wild type and DRbr mutants.
2.1 Strains and resistances
Competent Escherichia coli strain BL21DE3GOLD cells were used to over express the proteins
under study. In the expression assays BL21DE3 and STAR strains from E. coli were also used.
2.2 Gene cloning
The pMAL system from New England Biolabs was used for cloning the gene cj0012c from C.
jejuni NTTC11168 with and without the desired mutations. The clone for the wild type protein was
provided by Yamazaki M.1,2
, Amano F.2 and Ignimi S
3.
The clones for the mutant proteins were done by Pinto, A. using the Quick Change Multi-Site
Directed Mutagenesis Kit from Agilent Technologies. The residues chosen for mutation were tyrosines
59 and 127. In two mutants one of the residues was replaced by a phenylalanine and in a third both
tyrosines were replaced, also by two phenylalanines.
2.3 Cells transformation
Competent E. coli BL21DE3 GOLD cells were transformed with plasmids containing the gene for
the wild type or mutant proteins. To 100 L of competent cells were added 2 L of plasmid at c.a. 83
ng/L. The mixture was incubated in ice for 30 minutes. Afterwards cells were heated at 42ºC during
20 seconds and then immediately put in ice for 2 more minutes. To the cells were added 900 L of
lysogeny broth (LB) medium (Table 2.1) and the mixture was incubated for 1 hour at 37ºC with
shaking. Cells were harvested by centrifugation and resuspended in 100 L of supernant before
plating in LB agar (LA) medium (Table 2.1) supplemented with 100 g/mL ampicilin. The plates were
incubated at 37ºC overnight.
Table 2.1: Instructions for LB and LA media preparation.
Components LB medium (Adjust pH to 7.0) LA medium
Tryptone 10 % (w/v) 10 % (w/v)
Yeast extract 10 % (w/v) 5 % (w/v)
NaCl 10 % (w/v) 10 % (w/v)
Agar - 5% (w/v)
1 Faculty of Agriculture, Tokyo University of Agriculture and Technology, Japan
2 Department of Hygienic Chemistry, Osaka University of Pharmaceutical Sciences, Japan
3 Division of Biomedical Food Research, National Institute of Health Sciences, Japan

20
2.4 Protein expression tests for DRbr mutants
A few colonies from the LA plates were used to inoculate 25 mL of LB medium with 100 g/mL
ampicilin. Cells were grown at 37ºC until the optical density (OD) at 600 nm reached 0.6. Then 250 M
of isopropyl-1-thio--D-galactopyranoside (IPTG) was added. After 4 hours cells were harvested by
centrifugation at 5000 g during 10 minutes at 4ºC. Two samples were analyzed, corresponding to the
cells before and after induction. Both samples were disrupted by freezing/thawing cycles with liquid
nitrogen. The levels of protein in the soluble fraction were evaluated by sodium dodecyl sulfate
polyacrylamide gel electrophoresis (SDS-PAGE).
2.5 Expression of the recombinant DRbr and DRbr mutants
A pre-inoculum of 100 mL with 100 g/mL of ampicilin was prepared overnight at 37ºC, from fresh
colonies (prepared plate).
Over-expression of DRbr and mutants was achieved by growing the cells aerobically at 37ºC in
M9 minimal medium supplemented with 20 mM glucose, 400 M FeSO4 and 100 g/mL ampicilin. The
medium was inoculated with 1% from the pre-inoculum. At OD600 of 0.3 it was added 250 M IPTG.
Cells were grown overnight and then the cells were harvested by centrifugation at 7000 g during 10
minutes and 4ºC and then stored at -20ºC.
Minimal medium M9 was prepared accordingly the following instructions: for 1 litre of medium 5
times concentrated the following quantities were dissolved in deionized water: 64 g of Na2HPO4.7H2O,
15 g of KH2PO4, 2.5 g of NaCl and 5 g of NH4Cl.
2.6 Recombinant proteins purification
The purification process was performed in anaerobic conditions in a Coy glove box under an
atmosphere of approximately 95% argon and 5% hydrogen at room temperature. All buffers were
previously degassed and the atmosphere was replaced with nitrogen, prior to their introduction in the
glove box
The cells were unfrozen and washed in a buffer containing 10 mM Tris-HCl H 7.2 for three times,
then were harvested by centrifugation and resuspended in a buffer containing 50 mM Tris HCl pH 8,
100 mM NaCl, 1 mM MgCl2, 0.1 mg/mL lysozyme and 20 g/mL DNase I. The cellular extract
(supernatant) was obtained by passing the cells three times through a French Press at 35 000 psi.
Soluble fraction was collected after ultracentrifugation the cellular extract at 125 000 g for 1 hour at
4ºC. The atmosphere of the soluble extract was replaced with nitrogen and applied in a Q-Sepharose
Fast Flow column XK 26 (XK26/20, GE Healthcare) equilibrated with 20 mM Tris-HCl pH 7.2. The
protein was eluted with a linear gradient from 0 to 1 M NaCl at 2 mL/min. The DRbr and its mutants
eluted between 0.2 M and 0.3 M NaCl and were then dialyzed overnight against 10 mM KPi pH 7.2.
This fraction was subsequently applied in a Bio-gel hydroxyapatite (HTP) type II (XK 16/20 GE
Healthcare) column previously equilibrated with 10 mM KPi pH 7.2. The protein was eluted with a

21
linear gradient from 10 mM to 1M of KPi pH 7.2. Fractions containing the protein were collected at
approximately 0.3 M of KPi pH 7.2 and concentrated to a maximum volume of 2 mL in a Diaflo
(Amicon) using a YM30 membrane. Finally the protein was applied to a Superdex-200 (XK 16/170, GE
Healthcare) column equilibrated with 20 mM Tris-HCl pH 7.2 and 150 mM NaCl and eluted with the
same buffer. The final fraction was concentrated using a Diaflo (Amicon) and stored at -20ºC in
anaerobic conditions.
The purity of the final fractions was accessed by 15% SDS-PAGE.
2.7 Electrophoretic analysis
All SDS-PAGE analysis were performed in a 15 % gel with 1 mm thickness. The solution
components and volumes are listed in Table 2.2
Table 2.2: Instructions for preparation of SDS-PAGE gels. Components and volumes for preparing one resolving 15% SDS-PAGE gel and one stacking 5% SDS-PAGE gel.
Solution components Stacking gel (mL) Resolving gel (mL)
30% Acrylamide mix 0.67 5
1.5 M Tris-HCl pH 8.8 - 2.5
1 M Tris-HCl pH 6.8 500 -
Deionised Water 2.7 2.3
10% SDS 0.04 0.1
10% Ammonium persulfate (APS) 0.04 0.1
N, N, N', N'-tetramethylethylenediamine
(TEMED) 0.004 0.004
The electrophoresis were performed with a BioRad MiniProtean system and a power supply from
Amershan Biosciences at 180 V during approximately one hour. The running buffer contained 0.6 %
(w/v) Tris-(hydroxymethyl) aminomethane (Tris), 4 % (w/v) glycine and 0.2 % (w/v) SDS. The pH was
adjusted to 8.3 with HCl.
The molecular weight of the samples was inferred from the low molecular mass markers from GE
Healthcare.
Sample visualization was achieved by staining the gel in a solution containing 0.1% Coomassie
G, 50% methanol and 10 % acetic acid for approximately 30 minutes. Next the gel was submersed in
a destaining solution with 40 % acetic acid and 10 % methanol for 30 minutes. The gels were left in
water overnight.
Depending upon the origin of the sample to analyze, its pre-treatment was different.

22
Induced versus non-induced cells: 1 mL of culture media before and after induction was centrifuged to
collect the cells. Next, 30 µL of Loading Buffer with urea (Table 2.3Table 2.4) was added to resuspend
the pellet and the mixture was heated at 100 ºC during 5 minutes. Finally the mixture was centrifuged
for 2 minutes at 14 000 g and 15 µL of the supernatant were applied in the gel.
Soluble versus non-soluble fraction: 2 mL of culture media was collected after finishing the protein
expression tests or the growths and centrifuged to collect the cells. Cells were lysed by adding 500 µL
of lysis buffer (Table 2.4) and by doing freezing/ thawing cycles with liquid nitrogen. The mixture was
centrifuged and the supernatant was collect and once more centrifuged. The supernatant and the
pellet were both collected corresponding to the soluble and non-soluble fractions respectively; to both
were added 30 µL of Loading Buffer with urea and applied in the gel after heating at 100 ºC for 5
minutes and centrifuged at 14 000 g.
Table 2.3: Solution components for preparing loading buffer with and without urea.
Solution components Loading buffer with urea (2x) Loading buffer (2x)
500 mM Tris-HCl pH 8.0 4 mL -
500 mM Tris-HCl pH 6.8 - 1.5 mL
SDS 0.8 g 0.8 g
Glycerol (88%) 4.6 mL 2.5 mL
β-mercaptoethanol 400 L 500 L
Bromophenol blue 0.04 g 0.04 g
Urea 4.8 g -
Water - 4.25 mL
Table 2.4: Components and respective concentrations
of the lysis buffer.
Lysis buffer
50 mM Tris-HCl pH 8.0
20 % (w/v) sucrose
100 mM NaCl
1mM MgCl2
0.1 mg/mL lysozyme
20 µg/ mL DNase I

23
Protein samples: To 15 µL of sample 15 µL of Loading Buffer were added (Table 2.3). The mixture
was heated at 100º C during 5 minutes, centrifuged at 14 000 g and applied in the gel.
2.8 Determination of protein and iron concentration
Protein concentration was determined using the bicinchoninic acid (BCA) (Pierce) method and
the iron content was assayed using 2, 4, 6-tripyridyl - 1, 2, 3-triazine (TPTZ) method and by Inductevily
Coupled Plasma Atomic Emission spectroscopy (ICP). The zinc content was also determined by ICP.
The ICP was performed at REQUIMTE Analysis Laboratory at Faculdade de Ciências e Tecnologia da
Universidade Nova de Lisboa.
For the BCA method were prepared 8 tubes with BSA (Bovine Serum Albumin) concentrations
between 0 and 1 mg/mL, plus the samples tubes. To each tube was added 1 mL of BCA solution
previously prepared by mixing 50 parts of reagent A (Bicinchonic acid and tartrate in an alkaline
carbonate buffer) with one part of reagent B (4% copper sulfate pentahydrate). This method is based
in the chelation of Cu1+
with protein in an alkaline buffer, the biuret reaction, which forms a light blue
complex. The second step is the reaction of the BCA reagent with the Cu1+
to yield a purple product,
which increases the sensitivity of the method 100 times when compared with the traditional
biuredtmethod. After 30 minutes incubation on the dark the absorbance at 562 nm was registered. The
calibration and the samples were prepared in triplicates.
For the TPTZ method a calibration was performed by preparing tubes with iron concentrations
between 0 and 25 M. The tubes with the samples were also prepared by diluting a small amount (5
L) with water. To all tubes was added 100 L of 8 M HCl followed by mixing in the vortex to remove
the iron from the protein. Next, 100 L of a solution of TCA (Trichloroacetic acid) 80% was added to
precipitate the protein and the mixture was again homogenised in the vortex. The standards and the
samples were centrifuged during 10 minutes at 14 000 g and 800 L of supernatant were transferred
to a new vial. To each tube was added 200 L of 75% of ammonium acetate to set the pH around 4.5
and 80 L of 10% ammonium hydroxide which reduces the iron to ferrous. The solutions were mixed
and finally 80 L of 4 mM of TPTZ was added. After incubation for 10 minutes in the dark, the
absorbance was measured at 593 nm (Fischer and Price, 1964).
2.9 Molecular mass determination
The molecular mass in solution was determined by size exclusion chromatography with an
analytical Superdex 200 column (10/300 GE Healthcare). The column was equilibrated with 50 mM
KPi pH 7.2 with 150 mM NaCl. A calibration was performed in which the following commercial proteins
were used: aprotinin (Mm = 6500 Da), myoglobin (Mm = 17600 Da), chymotrypsinogen (Mm = 25 000
Da), albumin (Mm = 66 000 Da), canalbumin (Mm = 76 600), aldolase (Mm = 158 000 Da), catalase
(Mm = 240000 Da) and ferritin (Mm = 440 000 Da). Dextran blue (Mm = 2 000 000 Da) was used in all
standards and samples as internal control.

24
2.10 N-terminal sequencing
All solutions used in the protocol for N-terminal sequencing were prepared with ultra pure MiliQ
water except TEMED.
To perform the N-terminal sequencing a sample of protein was applied in 15% SDS - acrylamide
gel. The running buffer was prepared with 1.5 % (w/v) Tris, 7.2 % (w/v) glycine, 25 mL 0.5 % (w/v)
SDS and the pH was set to 8.3. All solutions were prepared following the instructions in section 2.7.
A pre-run with 40 M glutathione added in the cathode was performed at 100 V during 2 hours.
Subsequently the buffer inside the cathode was removed and new buffer was added, alongside 6 µL
of thioglycolic acid. The sample was applied and the run was performed at 150 V during approximately
one and a half hour. The run was tracked by the addition of molecular mass marker pre-coloured from
Bio-Rad.
The transference to a PVDF membrane with 0.2 m pore was performed using a Trans-Blot SD
semi-dry transfer cell at 15 Volts for 20 minutes at room temperature. The transference buffer was 1 x
CAPS (Cyclohexylamino propanesulphonic acid) (w/v) and 10 % methanol (v/v). Before the
transference the membrane was activated in 100 % methanol for 15 seconds followed by washing with
water for 5 minutes and finally was submersed in transference buffer. The gel and the filter paper were
also submersed in transference buffer immediately before the assembly of the system.
To visualize the bands corresponding to the samples the membrane was submersed in a solution
of Coomassie R followed by alternate washing with water and a solution of 50 % methanol.
The sequencing was performed at the Analytical Laboratory, Analytical Services Unit, Instituto de
Tecnologia Química e Biológica, Universidade Nova de Lisboa.
2.11 Spectroscopies
UV-Vis spectra, as well all spectrophotometric data, were collected with a Shimadzu UV-1603 or
Shimadzu UV-1700 spectrophotometers.
EPR spectra were acquired with a Bruker EMX spectrometer, equipped with an ESR 900
continuous-flow helium cryostat from Oxford Instruments.
2.12 Redox titrations
Redox titrations were analysed by EPR spectroscopy and performed under argon at room
temperature. At appropriate potentials a sample was collected into an EPR tube and immediately
frozen in liquid nitrogen. The assays were performed in 50 mM Tris-HCl pH 7.2 by stepwise addition of
sodium dithionite as a reducing agent. The protein final concentration was 80 M as well the following
redox mediators: potassium ferricyanide (E’0 = +430 mV), N,N dimethyl-pphenylenediamine (E’0 =
+340 mV), tetramethyl-p-phenylenediamine (E’0 = +260 mV), 1,2-naphtoquinone-4-sulphonic acid (E’0
= +215 mV), 1,2-naphtoquinone (E’0 = +180 mV), trimethylhydroquinone (E’0 = +115mV), 1,4-
naphtoquinone (E’0 = +60 mV), menadione (E’0 = 0 mV), plumbagin (E’0 = -40 mV), indigo
trisulphonate (E’0 = -70 mV), phenazine (E’0 = -125 mV), 2-hydroxy-1,4-naphtoquinone (E’0 = -152
25
mV) and anthraquinone-2-sulphonate (E’0 = -225 mV). The electrodes were previously calibrated with
a saturated quinhydrone solution at pH 7.0. All data were analyzed using the Nernst equation and the
reduction potential values are reported in relation to the standard hydrogen electrode.
2.13 Reconstitution of the binuclear centre
The procedures were performed in an anaerobic chamber under an atmosphere of argon.
To 100 µM of DRbr Y127F sample in 20 mM Tis-HCl with 150 mM NaCl were added 2 M of
dithiothreitol (DTT) and 300 µM of Fe2+
(Ammonium iron (II) sulfate hexahydrate). The mixture was
incubated during 30 minutes and then 50 µL of sample were applied in a desalting column (Micro Spin
6 from Bio-Rad) and eluted in the sample buffer by centrifugation at 1000 g during 4 minutes. The
binuclear centre reconstitution was assessed by EPR.
2.14 Protein crystallization
Proteins were dialyzed against 100 mM MES pH 6.2 with 500 mM NaCl and then concentrated to
c.a. 25 mg/mL using a Vivaspin of 10 kDa from Startorius.
The first trials were done using a Cartesian Crystallization Robot Dispensing System (Genomics
Solutions) and round-bottom Greiner 96-well CrystalQuickTM
plates. This allowed the use of protein
quantities at the nanolitre scale. Structure Screen 1 & 2 HT-96 from Molecular Dimensions was used
and the plate remained at 20ºC as well all the plates that would follow.
Crystals appeared when the crystallization solutions included 0.1 M Hepes pH 7.5, 0.1 M, Bicine pH 9
or 0.1 M Tris-HCl pH 8.5. To improve the crystals quality the hanging-drop vapor diffusion technique
was used. In these trials crystals appeared only when the buffer was Hepes, so the optimization
proceeded only with this buffer. The optimization followed varying the type and concentration of
precipitant agents (several PEGs - Polyethylene glycol, isopropanol and glycerol) and also with the
additive TCEP (Tris-(2-Carboxyethyl)phosphine hydrochloride), but the later did not improve the
results.
The selected crystals were frozen in liquid nitrogen in the reservoir solution plus 20% glycerol as
cryo-protectant. Some crystals were also incubated with 10 mM H2O2 or 50 mM sodium dithionite as
reductant or oxidant, respectively. The crystals were tested at the ALBA synchrotron in Barcelona,
Spain.

26

27
3 RESULTS
3.1 Protein expression tests for the Desulforubrerythrin mutants
The expression tests were performed in LB medium at 37ºC. The cells were induced with IPTG
and harvested after 4 hours. The samples corresponding to non-induced and induced cells were
analyzed by a 15% SDS-PAGE gel. The location of the protein in the induced samples was also
analyzed (soluble fraction and pellet that includes membranes and inclusion bodies) (Figure 3.1.)
Figure 3.1: SDS-PAGE of non-induced and induced cell samples of the protein expression tests for DRbr mutants. (A) Mutant proteins expressed in E. coli BL21DE3 Gold. (B) Mutant proteins expressed in E. coli BL21DE3 Star (C) Mutant proteins expressed in E. coli BL21DE3. NI: Non-induced cells; I: Induced cells; S:
Soluble fraction; P: Pellet (non-soluble fraction); ctr: DRbr WT previously purified.
As can been seen in Figure 3.1 all proteins were successfully over expressed in all cellular strains
tested. Given that the wild type protein had already been over expressed in E. coli BL21DE3 Gold
cells this was the strain chosen to express the mutant proteins.
24 kDa
24 kDa
24 kDa
NI I S P NI I M S P NI I S P ctr
DRbr Y59F DRbr Y127F DRbr Y59FY127F
NI I S NI I S NI I S M ctr
DRbr Y59F DRbr Y127F
DRbr Y59FY127
M ctr NI I S NI I S NI I S
DRbr Y59F DRbr Y127FDRbr
Y59FY127F
A
E. coli BL21DE3 Gold
E. coli BL21DE3 Star
E. coli BL21DE3
B
C
P
DR
br
Y5
9F
DR
br
Y1
27
F
DR
br
Y5
9F
Y1
27
FP
DR
br
Y5
9F
DR
br
Y1
27
F
DR
br
Y5
9F
Y1
27
F

28
3.2 Proteins expression
The cells were grown in minimal medium supplemented with iron and induced with IPTG when the
O.D. at 600 nm reached 0.3. Each growth was performed in erlenmeyers of 2 litres capacity filled with
1 Litre of medium and 1% of pre-inoculum. Cells were grown overnight and were harvested by
centrifugation. Samples of the non induced and induced cells were analyzed by 15% SDS-PAGE
(Figure 3.2). For each protein were performed two independent growths. Given that all procedures
were the same and the results were very similar, here will be presented only one example of one
growth for each protein.
Figure 3.2: SDS-PAGE of samples from protein expression. (A) DRbr WT and (B) DRbr mutants in non-induced
(NI) and induced (I) cells: soluble fraction (S) and pellet (P). ctr: Wild type protein previously purified.
As can be seen in Figure 3.2, all proteins were over expressed and are present in both soluble
and non soluble fraction.
Mm (kDa) M NI I S P
24 kDa
97
66
45
30
20.1
14.4
DRbr WTA
Mm (kDa) NI I S NI I S NI I S M ctr
97
66
45
30
20.1
14.4
24 kDa
P
DRbr Y59F DRbr Y127FDRbr
Y59FY127F
DR
br
Y5
9F
DR
br
Y1
27
F
DR
br
Y5
9F
Y1
27
F
B

29
3.3 Biochemical characterization
3.3.1 Protein purification
After harvesting the cells and collecting the soluble fraction all proteins were purified in an O2 free
atmosphere. Since the protocol was always the same and the results were also very similar next will
be presented one example for each protein.
Wild type desulforubrerythrin
After ultracentrifugation the soluble fraction was applied to a Q-Sepharose FF column and eluted
with 20 mM Tris-HCl pH 7.2 plus a linear gradient from 0 to 1 M NaCl. The selection of fraction was
based on the chromatogram and on the colour of the protein eluted. The oxidized protein is pink or red
depending on its concentration, but when reduced it is colourless. After eluting the Q-Sepharose
column the protein is in the reduced state. To ascertain its localization 2 L of sample corresponding
to the chromatograms peaks were removed from the glove chamber. After exposure to O2 the protein
reoxidizes and its identification was made by analyzing the colour of the sample. The protein eluted
between 0.2 and 0.3 M NaCl. This fraction was dialyzed overnight at 4ºC against 10 mM KPi pH 7.2
and was applied in a HTP column. After this step the protein was oxidized making possible its prompt
identification by the colour of the fractions. The protein was eluted with a linear gradient from 10 mM to
1 M KPi pH 7.2 and the fraction containing the protein eluted at approximately 0.3 M KPi. This fraction
was concentrated to a maximum volume of 2 mL using a Diaflo and was applied in a size exclusion
column and eluted with 20 mM Tris-HCl pH 7.2 with 150 mM NaCl; the retention time of the protein
was around 150 minutes. After this step the protein was considered pure and was stored at -20 ºC in
aliquots of 500 L.
During the purification, samples from the eluted fractions containing protein were stored and
afterwards were applied in a 15% SDS-PAGE gel to evaluate the efficiency of the process. The
chromatograms and the gel can be seen in Figure 3.3

30
A
B
C
D
Figure 3.3: Resume of WT DRbr purification. (A) Chromatogram of the elution of the soluble fraction from the
Q-Sepharose FF column. The solid black line corresponds to the absorbance at 280 nm and the dashed line is the percentage of 20 mM Tris-HCl pH 7.2 with 1 M NaCl. (B) Elution of the sample from the Q-Sepharose FF column in the HTP column. The solid black line corresponds to the absorbance at 280 nm and the dashed line is the percentage of 1 M KPi pH 7.2. (C) Chromatogram showing the DRbr WT elution profile in the size
exclusion column. The solid black line corresponds to the absorbance at 280 nm. The red line corresponds to the elution of DRbr WT. (D) SDS-PAGE with samples of each eluted fraction containing DRbr WT. In the last step of the purification were obtained three fractions containing the protein. The peak line coloured in red in panel C corresponds to the elution of the sample shown in the last lane of the gel presented in panel D.
Desulforubrerythrin mutants
The procedure to purify the DRbr mutants was equal to that of the DRbr WT procedure. The
elution profiles were also very similar. The chromatograms and the gels are shown in Figures 3.4, 3.5
and 3.6, respectively for DRbr Y59F, DRbr Y127F and the double mutant.
97
66
45
30
20.1
14.4
Mm (kDa) M QS HTP S-200
0
20
40
60
80
100
0
500
1000
1500
2000
2500
0 75 150 225 300
% 2
0 m
M T
ris
-HC
l p
H 7
.2, 1
M N
aC
l
Ab
so
rba
nc
e280n
m (m
AU
)
t (min)
0
300
600
900
1200
1500
1800
0 50 100 150 200 250
Ab
so
rba
nc
e280n
m (m
AU
)
t (min)
0
20
40
60
80
100
0
400
800
1200
1600
0 100 200 300
% 1
M K
Pi
pH
7.2
Ab
so
rba
nc
e2
80
(m
AU
)
t (min)
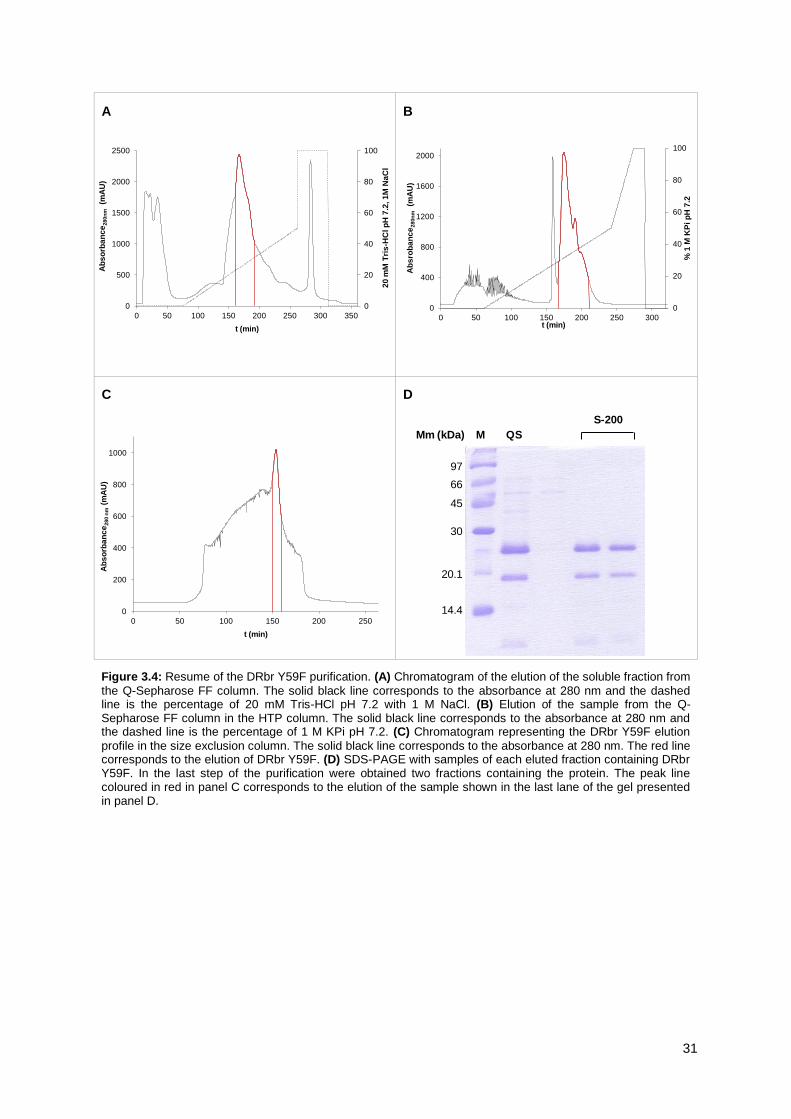
31
A
B
C D
Figure 3.4: Resume of the DRbr Y59F purification. (A) Chromatogram of the elution of the soluble fraction from
the Q-Sepharose FF column. The solid black line corresponds to the absorbance at 280 nm and the dashed line is the percentage of 20 mM Tris-HCl pH 7.2 with 1 M NaCl. (B) Elution of the sample from the Q-Sepharose FF column in the HTP column. The solid black line corresponds to the absorbance at 280 nm and the dashed line is the percentage of 1 M KPi pH 7.2. (C) Chromatogram representing the DRbr Y59F elution
profile in the size exclusion column. The solid black line corresponds to the absorbance at 280 nm. The red line corresponds to the elution of DRbr Y59F. (D) SDS-PAGE with samples of each eluted fraction containing DRbr Y59F. In the last step of the purification were obtained two fractions containing the protein. The peak line coloured in red in panel C corresponds to the elution of the sample shown in the last lane of the gel presented in panel D.
97
66
45
30
20.1
14.4
Mm (kDa) M QS
S-200
0
20
40
60
80
100
0
500
1000
1500
2000
2500
0 50 100 150 200 250 300 350
20
mM
Tri
s-H
Cl p
H 7
.2, 1
M N
aC
l
Ab
so
rba
nc
e280n
m (m
AU
)
t (min)
0
20
40
60
80
100
0
400
800
1200
1600
2000
0 50 100 150 200 250 300
% 1
M K
Pi
pH
7.2
Ab
sro
ba
nc
e280n
m (m
AU
)
t (min)
0
200
400
600
800
1000
0 50 100 150 200 250
Ab
so
rba
nc
e280 n
m (
mA
U)
t (min)

32
A B
C
D
Figure 3.5: Resume of the DRbr Y12F purification. (A) Chromatogram of the elution of the soluble fraction from
the Q-Sepharose FF column. The solid black line corresponds to the absorbance at 280 nm and the dashed line is the percentage of 20 mM Tris-HCl pH 7.2 with 1 M NaCl. (B) Elution of the sample from the Q-
Sepharose FF column in the HTP column. The solid black line corresponds to the absorbance at 280 nm and the dashed line is the percentage of 1 M KPi pH 7.2. (C) Chromatogram representing the DRbr Y127F elution
profile in the size exclusion column. The solid black line corresponds to the absorbance at 280 nm. The red line corresponds to the elution of DRbr Y127F. (D) SDS-PAGE with samples of each eluted fraction containing
DRbr Y127F.
97
66
45
30
20.1
14.4
Mm (kDa) M QS HTP S-200
0
20
40
60
80
100
0
500
1000
1500
2000
2500
0 75 150 225 300 375 450
% 2
0 m
M T
ris-H
C p
H 7
.2, 1
M N
aC
l
Ab
so
rba
nc
e 2
80 n
m (
mA
U)
t (min)
0
20
40
60
80
100
0
400
800
1200
1600
2000
0 50 100 150 200 250 300
% 1
M K
Pi p
H7
.2
Ab
so
rba
nc
e 2
80 n
m (m
AU
)
t (min)
0
400
800
1200
1600
2000
0 50 100 150 200 250
Ab
so
rba
nc
e 2
80n
m (
mA
U)
t (min)

33
3.3.2 Quantifications
The concentrations of the final fractions were determined through the BCA method. The iron was
quantified by the TPTZ method and also by ICP. The content of zinc was also determined by ICP.
A B
C D
Figure 3.6: Resume of the DRbr Y59F Y127F purification. (A) Chromatogram of the elution of the soluble
fraction from the Q-Sepharose FF column. The solid black line corresponds to the absorbance at 280 nm and the dashed line is the percentage of 20 mM Tris-HCl pH 7.2 with 1 M NaCl. (B) Elution of the sample from the
Q-Sepharose FF column in the HTP column. The solid black line corresponds to the absorbance at 280 nm and the dashed line is the percentage of 1 M KPi pH 7.2. (C) Chromatogram representing the DRbr Y59F
Y127F elution profile in the size exclusion column. The solid black line corresponds to the absorbance at 280 nm. The red line corresponds to the elution of DRbr Y59F T127F. (D) SDS-PAGE with samples of each eluted
fraction containing DRbr Y59F Y127F.
97
66
45
30
20.1
14.4
Mm (kDa) M QS HTP S-200
0
20
40
60
80
100
0
500
1000
1500
2000
0 50 100 150 200 250 300 350
% 2
0 m
M T
ri-H
Cl p
H 7
.2,
1 M
Na
Cl
Ab
so
rba
nc
e280n
m (m
AU
)
t (min)
0
20
40
60
80
100
0
300
600
900
1200
1500
0 50 100 150 200 250 300
% 1
M K
Pi
pH
7.2
Ab
so
rba
nc
e280 n
m
(mA
U)
t (min)
0
300
600
900
1200
1500
0 50 100 150 200
Ab
so
rba
nc
e280 n
m
(mA
U)
t (min)

34
Figure 3.7: Calibration curve to determine the protein concentration through the BCA method. The results are
the median calculated from three replicas. The curve was adjusted by the mean root square method.
Figure 3.8: Calibration curve to determine the iron concentration through the TPTZ method. The
experimental results are the median calculated from three replicas. The curve was adjusted to the results by the mean root square method.
The expected result of 4 atoms of iron per monomer of protein was observed for some fractions
of WT, DRbr Y59F and DRbr Y59F Y127F. For the mutant Y127F none of the purified fractions had
the expected amount of iron. The results of the TPTZ method are corroborated by the ICP results and
also by the ERP experiments (see section 3.5).
Table 3.1: Quantifications performed for all final fractions from the protein purifications.
Protein Cellular yield
(g of cells/Litre of growth)
Protein yield
(mg/Litre of growth)
Iron
(Atoms/Monomer of protein)
DRbr WT 6.4 23 4.19
DRbr Y59F 6.5 25 4.22
DRbr Y127F 6 47 1.17
DRbr Y59F Y127F 6.9 22 2.89
y = 1.0299x + 0.0304R² = 0.9848
0.000
0.200
0.400
0.600
0.800
1.000
1.200
0.00 0.20 0.40 0.60 0.80 1.00
Ab
so
rba
nc
e562n
m
[Standard protein] (mg /mL)
y = 0.0121x + 0.0054R² = 0.9932
0.000
0.075
0.150
0.225
0.300
0 5 10 15 20 25
Ab
so
rba
nce
593n
m
[Fe] (µM)

35
0
0.1
0.2
0.3
0.4
250 325 400 475 550 625 700
Ab
so
rba
nc
e (
A.U
.)
Wavelenght (nm)
0
0.2
0.4
0.6
0.8
250 325 400 475 550 625 700
Ab
so
rba
nc
e (
A.U
.)
Wavelenght (nm)
0
0.2
0.4
0.6
0.8
1
250 325 400 475 550 625 700
Ab
so
rba
nc
e (
A.U
.)
Wavelenght (nm)
0
0.2
0.4
0.6
250 325 400 475 550 625 700
Ab
so
rba
nc
e (
A.U
.)
Wavelenght (nm)
3.3.3 UV-Visible spectra
Immediately after the purification UV-Visible spectra of all the final fractions were acquired. The
spectra are in Figure 3.9 and Figure 3.10 shows the overlap of all spectra for an easier comparison
between the different proteins.
A
Abs280nm Abs370nm Abs490nm Abs560nm
0.336 0.135 0.081 0.046
B
Abs280nm Abs370nm Abs490nm Abs560nm
0.635 0.275 0.176 0.105
C
Abs280nm Abs370nm Abs490nm Abs560nm
0.944 0.397 0.283 0.169
D
Abs280nm Abs370nm Abs490nm Abs560nm
0.771 0.343 0.243 0.146
Figure 3.9: UV-Visible spectra from final fractions of DRbr proteins. Protein was in 20 mM Tris-HCl pH 7.2 with 150 mM NaCl (A) DRbr Wt (B) DRbr Y59F (C) DRbr Y127F (D) DRbr Y59F Y127F.

36
Figure 3.10: Overlap of the UV-Visible absorption spectra of wild type and desulforubrerythrin mutants.
To compare the fractions of the different purified proteins the ratios between the absorbance
peaks were calculated and are summarized in Table 3.2.
Table 3.2: Absorbance ratios between the different absorbance bands.
Protein Abs280/Abs490 Abs370/Abs560 Abs490/Abs560 Abs370/Abs490
DRbr WT 4.2 2.9 1.8 1.7
DRbr Y59F 3.6 2.6 1.7 1.6
DRbr Y127F 3.5 2.4 1.7 1.4
DRbr Y59F Y127F 3.2 2.4 1.7 1.4
3.3.4 Oligomerization state in solution
In order to determine the oligomerization state of the proteins in solution the samples were
applied in an analytical S-200 column. A calibration was previously performed with adequate
molecular mass standards. The elution volumes are listed in Table 3.3.
250 300 350 400 450 500 550 600 650 700
Wavelenght (nm)
wild type
Y59F
Y127F
Y59F Y127F
300 350 400 450 500 550 600
Wavelenght (nm)

37
Table 3.3: Elution volumes of the molecular mass standards of the S-200
calibration. V0 corresponds to the elution volume of blue dextran and is the dead volume of the column. Vt is the column volume. Ve is the elution volume for each protein. Kav is the partition coefficient and is obtained by the equation Kav = (ve-v0) / (vt-v0). For proteins with a similar shape the formula can bbe linearized and Kav = - A log Mm + B, where A is the slope of the curve and be is the interception of the y-axis.
Standard Mm log (Mm) Ve (mL) Kav
Aprotinin 6600 3.820 18.530 0.630
Myoglobin 17600 4.246 16.950 0.539
Chimiotripsogen 25000 4.398 16.800 0.529
Albumin 66000 4.820 15.318 0.441
Canalbumin 76600 4.884 14.330 0.383
Aldolase 158000 5.199 13.386 0.327
Catalase 240000 5.380 12.973 0.305
Ferritin 440000 5.643 11.156 0.194
y = -0.2315x + 1.5292R² = 0.98
0.000
0.200
0.400
0.600
0.800
3.500 4.000 4.500 5.000 5.500 6.000
Kav
log (Mm)
Figure 3.11: Calibration curve of the size exclusion column. The theoretical curve was adjusted to the
experimental points via the mean root square method.
After the standards, the samples were applied in the column and the chromatograms and the
retention volumes were recorded. The chromatogram of each protein is Figure 3.12.
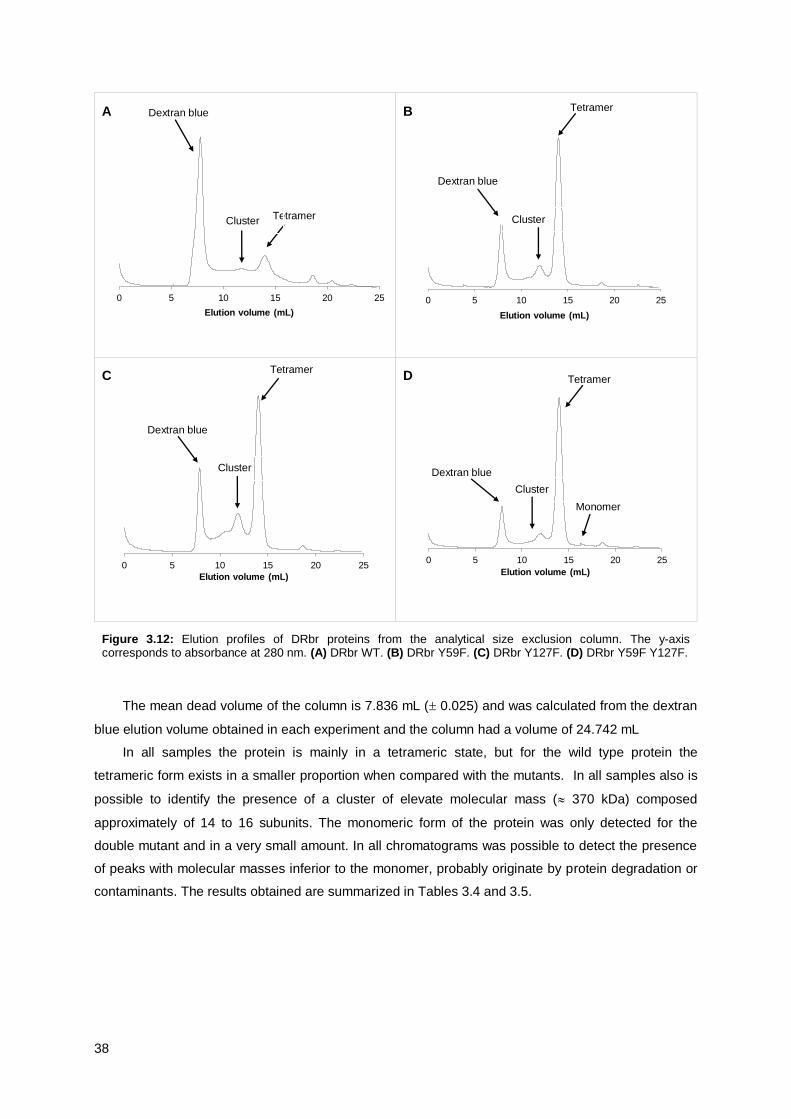
38
Tetramer
0 5 10 15 20 25
Elution volume (mL)
0 5 10 15 20 25
Elution volume (mL)
0 5 10 15 20 25
Elution volume (mL) 0 5 10 15 20 25
Elution volume (mL)
A B
C D
Figure 3.12: Elution profiles of DRbr proteins from the analytical size exclusion column. The y-axis corresponds to absorbance at 280 nm. (A) DRbr WT. (B) DRbr Y59F. (C) DRbr Y127F. (D) DRbr Y59F Y127F.
The mean dead volume of the column is 7.836 mL ( 0.025) and was calculated from the dextran
blue elution volume obtained in each experiment and the column had a volume of 24.742 mL
In all samples the protein is mainly in a tetrameric state, but for the wild type protein the
tetrameric form exists in a smaller proportion when compared with the mutants. In all samples also is
possible to identify the presence of a cluster of elevate molecular mass ( 370 kDa) composed
approximately of 14 to 16 subunits. The monomeric form of the protein was only detected for the
double mutant and in a very small amount. In all chromatograms was possible to detect the presence
of peaks with molecular masses inferior to the monomer, probably originate by protein degradation or
contaminants. The results obtained are summarized in Tables 3.4 and 3.5.
Dextran blue
Tetramer Cluster
Dextran blue
Cluster
Tetramer
Dextran blue
Cluster Dextran blue
Tetramer
Cluster
Monomer

39
Table 3.4: Elution volumes and molecular masses of WT and DRbr mutants and its degradation
products. The molecular masses were calculated using the elution volumes from the size exclusion column and the calibration curve obtained for the standard proteins.
DRbr Ve (mL) Mm (kDa) Subunits Ve (mL) Mm (kDa) Subunits
WT
12 37 15 14 108 4
Y59F
Y127F
Y59F Y127F
Table 3.5: Elution volumes and molecular masses of WT and DRbr mutants and its degradation products
(continued from Table 3.4)
DRbr Ve (mL) Mm (kDa) Subunits Ve (mL) Mm (kDa) Ve (mL) Mm (kDa) Ve (mL) Mm
WT
- - - 19 7
20 2.3
22 790 Y59F
- - Y127F
Y59F Y127F 16 28 1 - - - -
3.3.5 N-terminal sequencing
To determine the origin of the bands detected in the SDS-PAGE gel of the mutant proteins one
sample of the mutant Y59F was sent to N-terminal sequencing. In order to do that the sample was
applied in a 15% SDS-PAGE gel and was transferred to a PVDF membrane. The bands ranging from
10 to 40 kDa were isolated and its N-terminal sequencing was performed (Figure 3.13). The results
obtained for each band are in Table 3.6.
Figure 3.13: PVDF membrane after the protein transference and before the bands were cut.

40
3.4 Crystallization experiments
The mutant DRbr Y127F previously dialyzed into 100 mM MES pH 6.2 with 500 mM NaCl and
concentrated to approximately 20 mg/mL was submitted to crystallization trials. An initial screen was
performed, using a 96 well plate in the nanorobot. The crystallization assays started by performing a
screen using the Structure Screen 1 and 2 (Molecular Dimension). The set up method was the vapour
diffusion sitting drop technique and the plate remained at 20ºC. For each condition were tested three
proportions of protein (P) and reservoir solution (R): 1:2, 1:1, 2:1 (P:R). Small needle-shaped crystals
appeared in the following conditions: 100 mM Hepes pH 7.5, 10% Isopropanol, 20% PEG 4K (1:1);
100 mM Tris-HCl pH 8.5, 10 mM NiCl2 , 20% PEG 2K (1:1, 1:2, 2:1); 100 mM Bicine pH 9.0, 100 mM
NaCl, 30% PEG 550 (1:1); 100 mM Hepes pH 7.5, 10% PEG 6K, 5% MPD (1:1) (Figure 3.14).
Figure 3.14: Examples of some DRbr Y127F crystals obtained using the Structure Screen 1 & 2. (A) 100 mM Bicine pH 9, 30 % PEG 550. (B) 100 mM Tris-HCl pH 8.5, 10 mM NiCl2, 10% PEG 6K. (C) 100 mM Hepes pH 7.5, 10% isopropanol, 20% PEG 4K.
These conditions were reproduced in a 24 well plate using the hanging drop technique. Some
variations were done, namely in the concentration of the precipitant agents. In none of the conditions
appeared crystals suitable for X-ray diffraction. The work proceeded by doing drastic alterations in the
crystallization solutions, namely in the pH value, the buffer and the precipitant reagents. Still no
improvement on the crystals was achieved. The conditions tested are resumed in the schemes of
Figures 3.15, 3.16, 3.17, 3.18 and 3.19.
Table 3.6: Results of the N-terminal sequencing
Band Molecular mass
(kDa) (approximate) N-terminal sequence
A 40 DIQVG
B 24 MRQYETY
C 20 -
D 14 MRQYE
E 10 MRQYE

41
Figure 3.15: Crystallizations conditions tested for the protein DRbr Y127F with 100 mM Hepes pH 7.5 and 10%
isopropanol with different concentrations of PEG 4K.
Figure 3.16: Crystallizations conditions tested for the protein DRbr Y127F with 100 mM Hepes pH 7.5 and 10%
glycerol with different concentrations of PEG 8K.
Figure 3.17: Crystallizations conditions tested for the protein DRbr Y127F with 100 Bicine pH 9.0 and 100 mM
NaCl with different concentrations of PEG 550.
100 mM Hepes pH 7.510% Isopropanol
15% PEG 4K
10% PEG 4K
20% PEG 4K
25% PEG 4K
100 mM Hepes pH 7.510% Glycerol
14% PEG 8K
10% PEG 8K
17% PEG 8K
20% PEG 8K
100 mM Bicine pH 9.0100 mM NaCl
25% PEG 550
30% PEG 550
35% PEG 550

42
Figure 3.19: Crystallizations conditions tested for the protein DRbr Y127F with 100 mM Hepes pH 7.5 and 10 %
PEG 8K with different concentrations of glycerol.
The work continued with the other proteins. The conditions tested were based on the results
obtained for the Y127F mutant and on previous results obtained for the wild type protein. This time no
screen was performed and the experiments begun using a 24 well plate. The conditions that produced
better crystals were: 100 mM Hepes pH 7.5, 14% PEG 8K, 10% glycerol; 100 mM Hepes pH 7.5, 5%
isopropanol, 10 % PEG 4K; 100 mM Hepes pH 7.5, 5% isopropanol, 10 % PEG 4K; 100 mM Hepes
pH 7.5, 10% isopropanol, 10 % PEG 4K; 100 mM Hepes pH 7.5, 14% PEG 8K, 10% glycerol; 100 mM
Hepes pH 7.5, 5% isopropanol, 10 % PEG 4K. In some assays was used 100 mM TCEP as additive
but it did not produce any improvement in the crystals. All the conditions tested are described in the
schemes of Figures 3.20 and 3.22.
100 mM Hepes pH 7.510% PEG 8K
5% Glycerol
8% Glycerol
10% Glycerol
Figure 3.18: Crystallizations conditions tested for the protein DRbr Y127F with 100 mM Tris-HCl pH 8.5 and 10
mM NiCl2 with different concentrations of PEG 2K.
100 mM Tris-HCl pH 8.510 mM NiCl2
15% PEG 2K
10% PEG 2K
20% PEG 2K
25% PEG 2K

43
Figure 3.20: Resume of all crystallization conditions tested for the wild type protein.
For the wild type protein the following conditions produced crystals suitable for X-ray diffraction:
100 mM Hepes pH 7.5, 5% isopropanol. 10% PEG 4K; 100 mM Hepes pH 7.5, 14% PEG 8K, 10%
glycerol (Figure 3.21). The crystals were cryoprotected in the respective reservoir solution plus 20 %
glycerol before flash-cooling in liquid nitrogen.
100 mM Hepes
pH 7.510% Isopropanol
5 % Isopropanol
10% PEG 8K
14% PEG 8K
10% PEG 4K8% PEG 4K
10% PEG 4K
8% Glycerol
10% Glycerol
Figure 3.21: Example of crystals obtained for the wild type protein. (A) 100 mM Hepes pH 7.5, 14% PEG 8K, 10% glycerol (1:1). (B) 100 mM Hepes pH 7.5, 5% isopropanol, 10 % PEG 4K (1:2).
A BI

44
For the mutant Y59F crystals were obtained using the following conditions: 100 mM Hepes pH
7.5, 5% isopropanol, 10 % PEG 4K; 100 mM Hepes pH 7.5, 10 % isopropanol, 10 % PEG 4K (Figure
3.23). The crystals were cryoprotected in the liquid reservoir plus 20% glycerol prior to flash-cooling in
liquid nitrogen and X-ray diffraction data were collected.
The double mutant crystals appeared in the following conditions: 100 mM Hepes pH 7.5, 5%
isopropanol, 10 % PEG 4K; 100 mM Hepes pH 7.5, 14 % PEG 8K, 10 % glycerol (Figure 3.24). The
crystals were flash-cooled in liquid nitrogen after being immersed in a cryoprotectant solution with
liquid reservoir and 20 % glycerol. X-ray diffraction data were collected.
Figure 3.22: Resume of all crystallization conditions tested for DRbr Y59F and DRbr Y59F Y127F.
Figure 3.23: Crystals obtained for DRbr Y59F (A) 100 mM Hepes pH 7.5, 5% isopropanol, 10 % PEG 4K (1:2) (B) 100 mM Hepes pH 7.5, 10% isopropanol, 10 % PEG 4K.
100 mM Hepes
pH 7.510% Isopropanol
5 % Isopropanol
14% PEG 8K
10% PEG 4K
10% PEG 4K 10% Glycerol
A B
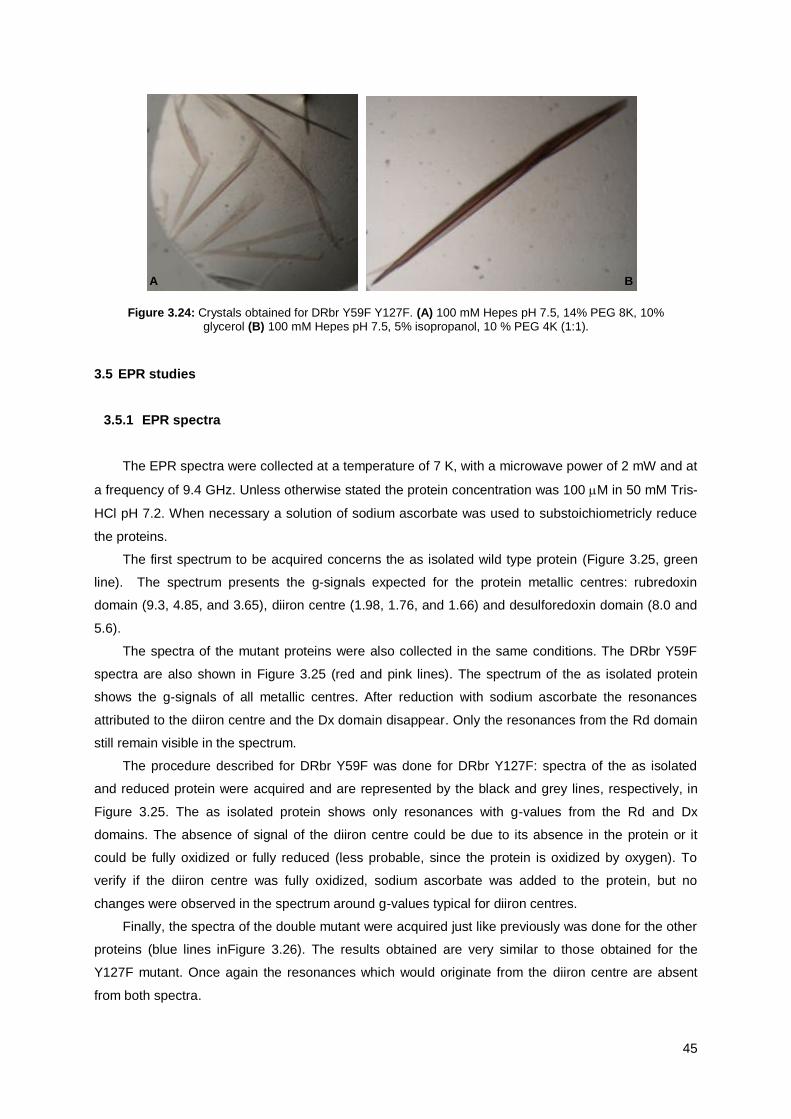
45
Figure 3.24: Crystals obtained for DRbr Y59F Y127F. (A) 100 mM Hepes pH 7.5, 14% PEG 8K, 10% glycerol (B) 100 mM Hepes pH 7.5, 5% isopropanol, 10 % PEG 4K (1:1).
3.5 EPR studies
3.5.1 EPR spectra
The EPR spectra were collected at a temperature of 7 K, with a microwave power of 2 mW and at
a frequency of 9.4 GHz. Unless otherwise stated the protein concentration was 100 M in 50 mM Tris-
HCl pH 7.2. When necessary a solution of sodium ascorbate was used to substoichiometricly reduce
the proteins.
The first spectrum to be acquired concerns the as isolated wild type protein (Figure 3.25, green
line). The spectrum presents the g-signals expected for the protein metallic centres: rubredoxin
domain (9.3, 4.85, and 3.65), diiron centre (1.98, 1.76, and 1.66) and desulforedoxin domain (8.0 and
5.6).
The spectra of the mutant proteins were also collected in the same conditions. The DRbr Y59F
spectra are also shown in Figure 3.25 (red and pink lines). The spectrum of the as isolated protein
shows the g-signals of all metallic centres. After reduction with sodium ascorbate the resonances
attributed to the diiron centre and the Dx domain disappear. Only the resonances from the Rd domain
still remain visible in the spectrum.
The procedure described for DRbr Y59F was done for DRbr Y127F: spectra of the as isolated
and reduced protein were acquired and are represented by the black and grey lines, respectively, in
Figure 3.25. The as isolated protein shows only resonances with g-values from the Rd and Dx
domains. The absence of signal of the diiron centre could be due to its absence in the protein or it
could be fully oxidized or fully reduced (less probable, since the protein is oxidized by oxygen). To
verify if the diiron centre was fully oxidized, sodium ascorbate was added to the protein, but no
changes were observed in the spectrum around g-values typical for diiron centres.
Finally, the spectra of the double mutant were acquired just like previously was done for the other
proteins (blue lines inFigure 3.26). The results obtained are very similar to those obtained for the
Y127F mutant. Once again the resonances which would originate from the diiron centre are absent
from both spectra.
A B

46
Figure 3.25: EPR spectra of DRbr proteins. When indicated proteins were reduced with sodium ascorbate.
Proteins concentration was 100 M in 50 mM Tris-HCl pH 7.2. The experimental conditions were: T: 7K; microwave power: 2 mW; microwave frequency: 9.4 GHZ.
3.5.2 Diiron centre reconstitution
Apparently the mutant Y127F and the double mutant were lacking the diiron site. This was taken
as an advantage to try a process for the reconstitution of the diiron centre. The reconstitution was
done by incubating 100 M of DRbr Y127F with 2 M of DTT and 300 M of Fe2+
for half an hour, in
anaerobic conditions. After removing the excess of iron the success of the process was confirmed by
the EPR spectrum (Figure 3.26). The spectrum acquired immediately after the reconstitution lacks the
resonances usually attributed to the diiron centre, but after addition of sodium ascorbate a signal
appears around g values 1.7, thus an indication that the process was successful.
0.01 0.98 0.186 0.274 0.362 0.45
B (T)
1.98
1.66
1.76
9.3
8
5.6
4.85
3.65
4.3
WT DRbr as isolated
DRbr Y59F as isolated
DRbr Y59F reduced
DRbr Y127F as isolated
DRbr Y127F reduced
DRbr Y59F Y127F as isoltaded
DRbr Y59F Y127F reduced

47
Figure 3.26: EPR spectra of the DRbr Y127F before (A) and after (B) the diiron centre reconstitution. Protein
concentration was 100 M in 20 mM Tris-HCl pH 7.2 with 150 mM NaCl.
3.5.3 Redox titration of the wild type protein
Due to limitations in the amount of protein purified with the correct amount of iron this experiment
was only done for the wild type protein.
The redox titration was performed under argon in 50 mM Tris-HCl pH 7.2. To the protein at a
concentration of 80 M were added redox mediators from -225 mV to + 430 mV each at a
concentration of 80 M. The spectra are shown in Figure 3.27.
1.98
1.66
1.76
0.01 0.108 0.206 0.304 0.402 0.5
B (T)
A
B

48
Figure 3.27: Redox titration of desulforubrerythrin wild type. The protein concentration was 80 M.
The data were analysed using the Nernst equation [E = E0 – RT/nF ln Q; R: Universal gas
constant, F: Faraday constant, n: number of electrons involved in the transition, Q: quotient between
the concentrations of the species involved in the reaction]. In this case the coefficient of the reaction is
expressed by the amplitude of the signal correspondent for each transition. Given that the amplitude of
the signal is not necessarily dependent on the concentration of the species all amplitudes were
normalized considering the maximum signal for each g-value.
For the diiron centre were considered two consecutive single electron transitions. The first
transition corresponds to the reduction of the first atom of iron, given rise to the mixed-valence state
(Fe3+
/Fe3+ Fe
3+/F
2+) – which gives the EPR signal. The second transition corresponds to the fully
reduction of the diiron centre (Fe3+
/Fe2+ Fe
2+/Fe
2+). This process was followed by the resonances at
g-values of 1.76 and 1.66. The concentration of the mixed-valence state can be calculated by the
following Nernst equation: [Fe3+
/Fe2+
] = 10[(E1 – E) /(RT/nF)]
/ (1+10[(E1-E)/(RT/nF)]
+ 10[(E1+E2-2E)/(RT/nF)]
). The
potential of each transition is noted by E1 and E2, respectively for the first and second transitions and E
is the redox potential of the solution at a certain moment. The equation fits the experimental data for
potentials of 270 and 235 mV, for the first and second transitions (Figure 3.28).
0.1 0.108 0.206 0.304 0.402 0.5
B (T)
257.9 mV
231 mV
197.8 mV
176.2 mV
158.9 mV
132.6 mV
107.9 mV
97.9 mV

49
0
0.1
0.2
0.3
0.4
0.5
0.6
0.7
0.8
0.9
1
0 25 50 75 100 125 150 175 200 225 250 275 300
Sig
na
l in
ten
sit
y (n
orm
ali
ze
d)
E0 (mV)
g-value 1.66
g-value 1.76
Figure 3.28: Redox titration of DRBr WT followed by EPR spectroscopy. The redox changes of the diiron centre
were monitored by the changes in the amplitudes at g-values 1.66 and 1.76.
For the rubredoxin and desulforedoxin domains the same approach was used but considering
only one electronic transition. In these cases the Nernst equation assumes a simpler form: [Fe3+
]=10[(E-
E1)/(RT/nF)] / (1+10
[(E-E1)/(RT/nF)]). The theoretical data fit the experimental values for potentials of 170 and
200 mV for the rubredoxin and desulforedoxin domain, respectively (Figure 3.29 and Figure 3.30).
0
0.1
0.2
0.3
0.4
0.5
0.6
0.7
0.8
0.9
1
0 25 50 75 100 125 150 175 200 225 250 275 300
Sig
na
l in
ten
su
ty (
no
rma
liz
ed
)
E0 (mV)
g-value 9.3
g-value 4.85
Figure 3.29: Redox titration of DRBr WT followed by EPR spectroscopy. The redox changes of the rubredoxin
domain were monitored by the changes in the amplitudes at g-values 9.3 and 4.85.

50
0
0.1
0.2
0.3
0.4
0.5
0.6
0.7
0.8
0.9
1
0 25 50 75 100 125 150 175 200 225 250 275 300
Sig
na
l in
ten
sit
y (
no
rma
liz
ed
)
E0 (mV)
g-value 8.0
g-value 5.6
Figure 3.30: Redox titration of DRbr WT followed by EPR spectroscopy. The redox changes of the
rdesulforedoxin domain were monitored by the changes in the amplitudes at g-values 8 and 5.6.

51
4 DISCUSSION
4.1 Diiron proteins
Diiron proteins are widespread among the three life domains. Rubrerythrins and ribonucleotide
reductases (RNR) are examples of two families of proteins with this feature. RNR are proteins
responsible to reduce ribonucleotides making deoxyribonucleotides available to DNA synthesis. They
are usually divided in three classes. Class I RNR are composed of two subunits: the small subunit
contains a diiron centre and its mechanism relies in the formation of a tyrosil radical that is transported
to the large subunit of the protein where the reduction reaction takes place (Zhang et al., 2011).
To try to find other common features between the two families of proteins a sequence alignment
was performed between several rubrerythrins and the small subunit of four RNR. The RNR proteins
chosen are representative from organisms with different levels of complexity: a virus (Epstain-Barr), a
bacterium (E. coli), a fungus (Saccharomyces cerevisiae) and a mammal (Homo sapiens).
As can be seen in Figure 4.1, in all rubrerythrins analysed the iron ligands are aligned in positions
174 (E), 209 (E), 212 (H), 266 (E), 269 (E), 300 (E) and 303 (H). In erythrin only one ligand (the first
glutamate) is aligned with the other rubrerythrins, due to the small size of the protein. The tyrosines
hydrogen bonded to glutamate involved in iron coordination (positions 182 and 274) are conserved in
all rubrerythrins, supporting the idea that these residues should be important for protein function.
Three iron ligands (positions 266, 300 and 303) are highly conserved in all proteins analysed,
including the RNR. In the eukaryotic RNR the glutamate in the position 174 is also conserved. The
tyrosine responsible for radical formation in E.coli RNR is aligned with the first tyrosine hydrogen
bonded to glutamate in rubrerythrins (position 182) that corresponds to amino acid 122 in the protein
sequence. In the other RNR the tyrosine is the position 199 (Zhou et al., 2005). Curiously, the other
tyrosine locate immediately after the highly conserved glutamate is replaced by a phenylalanine in all
RNR (position 274), thus eliminating the possibility of another radical at this site.

52

53

54

55
F
igu
re 4
.1:
Am
ino a
cid
sequence a
lignm
ent
of
rubre
ryth
rins a
nd r
ibonucle
otide r
ed
ucta
ses.
Da
rk g
rey b
oxe
s r
ep
rese
nt
hig
hly
co
nse
rve
d
resid
ues a
nd lig
ht
gre
y b
oxes r
epre
sents
conserv
e r
esid
ues in the p
resente
d s
equence
s.
Th
e b
oxe
s lim
ite
d b
y b
lack r
ecta
ng
les a
re t
he
tyro
sil
radic
als
in R
NR
. T
he r
esid
ues identified w
ith “
*” a
re iro
n lig
ands a
nd r
esid
ues identifie
d w
ith “
” a
re th
e t
yro
sin
es p
ossib
ly in
vo
lve
d in
ra
dic
al
form
ation in R
brs
. A
lignm
ent perf
orm
ed w
ith C
lusta
l X
. T
he p
rote
in s
equences a
re f
rom
th
e U
niP
rot
we
bsite
:
D.
vu
lga
ris ru
bre
ryth
rin:
P2
49
31
, D
. vu
lgaris n
ige
ryth
rin:
P3
082
0,
D.
de
su
lfuri
can
s:
Q30
W1
5,
C.
pe
rfri
ng
en
s:
P5
15
91,
P.
gin
giv
alis
: Q
9A
GG
3,
C.
ace
tob
uty
licum
: Q
97
FZ
9,
P.
ab
yssi:
Q9
V0
A0
, C
. d
ifficile
: C
9X
M5
5,
C.
bu
tyri
cum
: B
1R
05
2,
M.
the
rmoa
ce
tica
: Q
2R
IY9
, A
. am
biv
ale
ns:
Q8
X27
3,
S.t
oko
da
ii: F
9V
PE
5,
A.
fulg
idu
s:
O2
94
27
, P
. fu
riosu
s:
Q9
UW
P7
, C
.para
do
xa
:
P4
83
29
, T
. va
gin
alis
: A
2E
HC
4,
E.
his
toly
tca
: C
4M
03
0,
Ep
sta
in-B
arr
vir
us:
P0
CA
P6
, S
.ce
revis
iae
: P
09
93
8,
E.
co
li: P
69
92
4,
H.
sa
pie
ns:
P3
13
50.

56
4.2 Protein expression tests for desulforubrerythrin mutants
The protein expression tests were performed in three E. coli strains: BL21DE3 GOLD, STAR and
BL21DE3. Analyzing the gel images in Figure 3.1 it is possible to observe that all strains successfully
expressed the mutant proteins. The E.coli BL21DE3 GOLD cells apparently expressed more DRbr
proteins but also more contaminants, although this perception may be due to an excess of sample
applied on the gel. It also seems that a great amount of protein is not in the soluble fraction, but this
may be caused by incomplete cellular lysis or the protein may be localized in inclusion bodies.
A closer look into the gels, particularly the results obtained for E. coli STAR and E. coli BL21DE3,
reveals that the mutants have a slightly different migration pattern when compared with the wild type
protein (Figure 3.1 B and C).
Considering the obtained results and having in mind that the wild type protein had already been
successfully over expressed in E. coli BL21DE3 GOLD this cellular strain was chosen to over express
the mutant proteins.
4.3 Proteins expression
The cells over expressing the proteins were grown in M9 medium supplemented with iron. This is
fundamental given that iron is an essential prosthetic group. The M9 medium was chosen instead of
LB medium because the last contains zinc in its composition that would be incorporated in the protein
instead of iron. Transformed cells were selected due to ampicilin resistance conferred by the pMAL
plasmid.
After harvesting the cells by centrifugation their weight was registered and the cellular yield was
determined. Although only two growths of each protein were performed the expression of the different
proteins does not seem to influence the cellular yield.
Similarly to what had been done to the expression tests samples of the non-induced and induced
cells were analyzed in a 15% SDS-PAGE (Figure 3.2). In spite of the contaminants it is possible to
observe the systematic over expression of other proteins along with the DRbr mutants, particularly in
non-soluble fraction (Figure 3.2). Once again a considerable amount of the protein appears in the non-
soluble fraction. Considering the high levels of protein obtained it is probably due to the formation of
inclusion bodies. Anyway, given the high amount of protein in the soluble fraction there was no need
to solubilise the protein from the inclusion bodies.
4.4 Biochemical characterization
The first step to study each protein was its purification. All protein containing samples obtained
from the last purification step were analysed by UV-Vis spectroscopy and by SDS-PAGE.
4.4.1 Proteins purification
All proteins were successfully purified in three steps: anionic exchange, adsorption and size
exclusion. During the purification is crucial that all steps are anaerobically performed to avoid protein

57
degradation. For the wild type protein this strategy seems efficient, given that the gels performed
immediately after the purification showed no degradation of the protein (Figure 3.3). For the mutant
proteins some degradation is observed in the gels, but this degradation is visible in the gels performed
right after the growths (Figure 3.2), so that was not due to the purification process.
4.4.2 UV-Vis spectra
The UV-Vis spectra of all as isolated proteins are very similar (Figure 3.10). That means the
mutations did not induce alterations in the UV-Vis spectra. UV-Vis spectra of diiron protein usually
have a band between 300 and 400 nm (Makris et al., 2010) (Figure 4.2), but in this case this is not
visible due to the large molar absorptivity of the rubredoxin-like domains in that area of the spectrum.
Given that the mutations under study are located near the diiron centre changes in the UV-Vis spectra
were not expected.
0.00
0.15
0.30
0.45
0.60
250 300 350 400 450 500 550 600 650 700
Ab
so
rban
ce (
A.U
.)
Wavelenght (nm)
Erythrin
Wt DRbr
Figure 4.2: UV-Visible spectra of erythrin and desulforubrerythrin. The black line represents the UV-Vis spectrum of as isolated erythrin from A. ambivalens in 200 mM KPi pH 7.2.
4 The green line is the spectrum of
as isolated wild type desulforubrerythrin in 20 mM Tris-HCl pH 7.2 plus 150 mM NaCl.
The absorption at 490 and 560 nm are typical features from rubredoxin-like domains (e.g.:
Auchere et al., 2004; Bruschi et al., 1977; Shimizu et al., 1989; Yoon, et al., 1999) and are due to the
ferric iron coordinated by four cysteines. The absorption at 370 is due to the Fe(Cys)4 but also to the
diiron centres in the ferric state (Coulter et al., 1999; Coulter et al., 2000).
Previously was determined a characteristic absorbance ratio of 3.7 between Abs280/Abs490 for the
wild type desulforubrerythrin (Pinto, 2012). For the mutant Y59F and Y127F proteins was possible to
have, at least, one fraction with a ratio very close to 3.7 but for the wild type protein and for the double
mutant this ratio was more distant from the reference value (Table 3.2). This could indicate the
presence of contaminants or, given that the absorbance at 490 nm is dependent of the iron occupancy
of Rd and Dx domains, another explanation could be the absence of iron in some protein monomers.
4 Work performed by Joana Carrilho from the Metalloenzymes and Molecular Bioenergetics Group, ITQB-UNL.

58
In the case of the wild type protein neither option seems viable given that the sample in the SDS-
PAGE gel is apparently free of contaminants and the TPTZ quantification yielded a result of 4 atoms of
iron per monomer of protein. For the double mutant an explanation could be the absence of iron, but
this hypothesis does not seem viable for two reasons: first, all the other absorbance ratios are very
similar in all proteins; second, the EPR spectra of this protein show resonances characteristic from Rd
and Dx domains.
The remainder ratios have some differences between the wild type protein and the Y59F mutant
(both with 4 atoms of iron per monomer) and the Y127F mutant and the double mutant (with less than
4 atoms of iron per monomer). These small differences could be due to the absence of iron in some
Dx or Rd domains.
4.4.3 Quantifications
The protein in the fractions resulting from the S-200 column was quantified through the BCA
method. This allowed to evaluate the yield of each protein. The values obtained are around 23 mg of
protein per litre of growth, except for the Y127F mutant which yield was 47 mg of protein per litre of
growth (Table 3.1). In both set of growths the mutant Y127F always rendered more protein.
4.4.4 Oligomerization state in solution
The oligomerization state of the protein was determined by size exclusion chromatography. All
proteins are present in a large cluster with a molecular mass between 353 kDa and 368 kDa. For the
mutants the protein is in a tetrameric conformation with a molecular mass ranging between 106 and
109 kDa; accordingly with the monomeric molecular mass of the protein the tetramer should have
approximately 97 kDa. The wild type protein is also present in this tetrameric form but the intensity of
this peak much more reduced (Figure 3.12). Previous work performed with other rubrerythrins showed
that rubrerythrins are isolate in solution as dimers, although they crystallize as tetramers (e.g.: Coulter
et al., 1999; Fushinobu et al., 2003: Jin et al., 2002; Li et al., 2003), suggesting that the tetramer
results from the dimerization of a dimer.
4.4.5 N-terminal sequencing
As seen in panel D from Figure 3.4, 3.5 and 3.6 the SDS-PAGE gels of the mutant proteins
present several bands besides the 24 kDa one. To determine if these bands are the result of protein
degradation or are contaminants a sample of the Y59F mutant was separated by electrophoresis and
transferred to a PVDF membrane. The N-terminal sequences of each band were determined (Figure
3.13 and Table 3.6). The results for the N-terminal sequencing confirmed the 24 kDa band as being
desulforubrerythrin. For all the other bands the results obtained are not so simple to interpret. The
band with nearly 40 kDa is probably a contaminant, given that the determined sequence does not
match the protein sequence. The band with 20 kDa presented an inconclusive result given the
possibility of several different amino acids for each position. Given that none of the possibilities match

59
the sequence of the protein this should be a contaminant instead of a degradation product. All the
bands with inferior molecular match the beginning of the protein. Their origin should be due to protein
degradation, but the bands corresponding to the other product(s) of degradation are not visible in the
SDS-PAGE gel, possibly due to their small size.
4.5 Into desulforubrerythrin metallic sites: EPR studies
EPR studies were performed to study the metallic centres of DRbr. This technique allows one to
study the metallic centres, its composition and the redox state of each centre.
The spectrum of the as isolated wild type protein shows resonances characteristic of all iron
centres proposed for the protein. The attribution of the resonances to each domain is made by
comparison with spectra from other proteins known by sharing metallic sites with DRbr. The
resonances at g-values lower than 2 are characteristic of diiron centres in the mixed-reduced state
with S=1/2 (Kao et al., Legall et al., 1988; 2008; Pierik et al., 1993; Yamasaki et al., 2004). The
resonances at higher g-values are typical for systems with S= 5/2. The assignment of the rubredoxin
and desulforedoxin resonances is possible by comparing the spectrum with rubredoxins,
desulfoferrodoxins, desulforedoxin from D. gigas and rubrerythrin from D. vulgaris. The resonances at
g-values 3.65, 4.85 and 9.3 are due to the rubredoxin domain (Auchere et al., 2004; Legall et al.,
1988; Zeng et al., 1996). The desulforedoxin domain has resonances at g-values 8, 5.6 and 3.6
(Moura et al., 1980). The resonance with g-value 4.3 is attributed to heterogeneous ferric sites (Pinto
et al., 2011).
The reduction potential of each metallic centre was determined by redox titration followed by EPR
analysis. The rubredoxin centre has the lowest potential: 170 mV making this centre the entrance
point for electrons. The diiron centre has potentials of 270 and 235 mV, respectively for the first and
second transitions. This means that the rubredoxin domains receives the first electron and then
transfers it to the diiron centre. After that another electron reduces the rubredoxin domain that, again,
transfers the electron to the diiron domain. Just after the complete reduction of the diiron centre the
rubredoxin will be reduced. The desulforedoxin domain was a potential of 200 mV and its function is
still unknown. Accordingly with the redox potentials this domain should be reduced after the complete
reduction of the diiron centre.
The only reduction potentials within the range of previously calculated values to rubrerythrins
belong to the diiron centre (Gupta et al., 1995). The reduction potential calculated for the rubredoxin is
higher than its usual value in rubredoxins but lower than its value for rubredoxin domains in
rubrerythrins. Rubredoxins usually have potentials between – 100 mV to 50 mV (Luo et al., 2010;
Moura et al., 1979; Lee et al., 1995) and between 230 and 281 mV in rubrerythrins (Legall et al., 1988;
Pierik et al., 1993). The desulforedoxin domain has a potential much higher than desulforedoxin
domains in desulfoferrodoxin that usually have values around 0 mV (Moura et al., 1994; Verhagen et
al., 1993). Desulforedoxin from D. gigas has a potential of -35 mV (Archer et al., 1999).

60
To try to find an explanation for the great diversity of values for rubredoxins and rubredoxin
domains a multiple sequence alignment was performed. The proteins chosen have potentials ranging
from -87 mV to +230 mV and belong to organisms from all life domains. Accordingly to some authors
the reduction potential of rubredoxins may be influenced by the residues charge around the active site
and also by hydrogen bonds (Bönisch et al., 2007; Lin et al., 2005).
To test the effect of hydrogen bonds strength in the reduction potential Lin and collaborators
made studies on Clostridium pasteurianum rubredoxin. As they observed that rubredoxins with lower
potential have a valine in the second position after the last cysteine ligand while rubredoxins with
higher reduction potentials usually have an alanine. C. pasteurianum rubredoxin has a reduction
potential of -77 mV and has a valine in position 44. In this study the authors constructed several
mutants where the valine has replaced by a glycine, an alanine, an isoleucine and valine. For each
protein they determined the reduction potential and the hydrogen bond length between residue 44 and
the sulphur from cysteine 42 (Table 4.1). They also did the same considering valine in position 8 and
cysteine in position 6. Their work showed a relation in the length of the hydrogen bond and in the
reduction potential: amino acids in position 44 that establish a short hydrogen bond will increase the
reduction potential. For the substitutions in position 8 the changes in the reduction potential are not so
pronounced (Lin et al., 2005).
Table 4.1: Reduction potentials of WT C.pasteurianum and its mutants (Adapted from Lin et al., 2005).
Protein Reduction potential (mV)
V44G 0
V44A -24
V44I -53
WT -77
V44L -87
Analysing the protein alignment in Figure 4.3 is possible to observe that all proteins with a valine
two residues after the last cysteine that is involved in iron coordination have a negative reduction
potential. In proteins with positive potential that position is mainly occupied by an alanine, but in some
cases a tyrosine, a lysine or a serine replace the alanine. The rubredoxin domain of C. jejuni DRbr has
an alanine and a potential of +170 mV, which is in agreement with the observed results for C.
pasteurianum rubredoxin. Although this analysis helps to understand the different reduction potentials
in rubredoxins this is not sufficient to explain the large range of values observed in these proteins,
especially the high reduction potentials observed in rubrerythrins.

61

62

63
Fig
ure
4.3
: M
ultip
le s
eq
uence a
lignm
ent
of
rubre
ryth
rins u
sin
g C
lusta
l X
. S
tric
tly c
onse
rve
d r
esid
ue
s a
re i
n b
lack b
oxes,
da
rk g
rey
boxes p
oin
t hig
hly
conse
rved r
esid
ues a
nd l
ight
gre
y b
oxes m
ark
conserv
ed r
esid
ues.
Iro
n l
iga
nd a
re i
nd
ica
ted b
y “*
” a
nd r
esid
ue
corr
espondin
g to a
lanin
e 4
7 in C
. paste
urianum
rubre
doxin
is indic
ate
d b
y “
”.
All
sequences a
re f
rom
the U
nip
rot w
ebsite.
D. vulg
aris r
ubre
ryth
rin: P
24931;
C.
jeju
ni D
Rb
r: Q
0P
CB
3;
E. co
li ru
bre
doxin
: F
9C
LA
6;
Guill
ard
ia t
heta
ru
bre
do
xin
: Q
9X
G40;
D. desulfuricans R
ubre
doxin
: Q
93P
P8;
Megasphaera
els
de
nii
rub
red
oxin
: P
00
27
1;
D. g
iga
s
rub
redo
xin
: P
00
27
0;
D. vulg
aris M
iyazaki ru
bre
doxin
: P
15412;
D. vulg
aris H
ildenboro
ugh r
ub
red
oxin
; P
yro
co
ccu
s f
uriosu
s r
ub
redo
xin
:
P24297;
Pseudom
onas o
leovara
ns r
ub
redo
xin
: P
12
69
2;
Buty
ribacte
rium
meth
ylo
trophic
um
ru
bre
doxin
: P
14
07
1; H
elio
bacill
us m
ob
ilis
rub
redo
xin
: P
56
63;
Chlo
robaculu
m thio
sulfatiphilu
m r
ub
redo
xin
. B
3Q
L56;
Tre
ponem
a p
alli
du
m r
ub
redo
xin
O8
39
56
; C
lostr
idiu
m
paste
urianum
ru
bre
do
xin
: P
00
26
8;
Chlo
robiu
m tepid
um
ru
bre
do
xin
: P
58
02
5.
64
4.6 Final remarks
The work here described pretends to be a step in the comprehension of resistance to reactive
oxygen species in microorganisms. In this particular case the protein under study belongs to a
pathogenic bacterium responsible for a high number of gastroenteritis all over the world. As with other
bacteria the resistance to antibiotics is a serious problem, which makes unviable the use of these
substances to control the presence of C. jejuni in chicken and poultry, in which it inhabits as a
commensal. The resistance to antibiotics can also become a problem in the treatment of infected
humans. This makes urgent to identify new targets with anti-microbial function. To accomplish that
objective is important to understand the metabolism of the microorganism, mainly the pathways
involved with survival inside the host. One of the defences of the innate immune system against
pathogens is the production of reactive oxygen species, so pathogen bacteria must be well equipped
to fight these species. A profound knowledge of how bacteria overcome that barrier may help to
provide new drugs to combat bacterial infections.
To verify the existence of the DRbr in other C. jejuni strains, and eventually in other bacteria of
the same genus a search was performedat the Uniprot website. The results showed that 19 strains of
C. jejuni have a protein with 100% of identity with the protein under study. Moreover, 42 strains of C.
jejuni also have a protein 99 % identical with C. jejuni NCTC 11168 DRbr. Finally, proteins with 97 %
of identity are present in several strains of Campylobacter coli. So, this protein is present in all strains
of Campylobacter.
As seen before, detoxification of hydrogen peroxide is performed by a great diversity of proteins,
so at first sight studying another protein with the same function may seem redundant. It is important to
refute that idea. Although all proteins have the same function they are active under different
circumstances that depend on substrate concentration, co-factors availability (iron, manganese),
availability of reduction potential in the cell (NAD(P)H) and of other electron donor proteins
(Winterbourn, 2008). Hydrogen peroxide is able to penetrate membranes and gives rise to the
hydroxyl radical, so cells cannot rely on one single type of molecule to reduce hydrogen peroxide to
water.
With this work was possible to biochemically characterize three proteins expressed for the first
time. It was shown that the mutations did not affect the biochemical properties of the protein. Also, the
metallic domains were found in all proteins.
It was possible to obtain crystals suitable for Xray diffraction for the wild type, Y59F and double
mutants and solve their structures.
The next step in this work would be the determination of the NADH:peroxidase activities for the
mutant proteins and compare with the values previously determined to the wild type protein. One
intriguing aspect that remains is the function of the desulforedoxin domain. Given the reduction
potentials of the domains and the spatial localization, it is not likely to transfer electrons to the catalytic
one. One possibility is that this domain function as a sensor of hydrogen peroxide, leading to protein
degradation upon exposure to high concentrations of hydrogen peroxide. In a more advanced phase
of the work would be important to perform complementation assays using a broad range of

65
concentrations of H2O2 in E. coli strains lacking some hydrogen peroxide detoxifying proteins to
confirm the in vivo function of the protein and also to determine the range of substrate concentrations
in which it is active. Finally would be desirable to perform that complementation tests in C. jejuni and
try to identify the physiological electron donors of the protein.

66

67
5 REFERENCES
Agnez-Lima, L.F., Melo, J.T., Silva, A.E., Oliveira, A.H., Timoteo, A.R., Lima-Bessa, K.M., Martinez,
G.R., Medeiros, M.H., Di Mascio, P., Galhardo, R.S. and Menck, C.F. 2012. DNA damage by singlet
oxygen and cellular protective mechanisms. Mutation research 751: 15-28.
Aguirre, J.D. and Culotta, V.C., 2012. Battles with iron: manganese in oxidative stress protection. The
Journal of biological chemistry 287: 13541-13548.
Alfadda, A.A and Sallam, R.M. 2012. Reactive Oxygen Species in Health and Disease. Journal of
Biomedicine and Biotechnology 2012
Alterkruse, S.F., Stern, N.J., Fields, P.I. and Swerdlow, D.L. 1999. Campylobacter jejuni – An
Emerging Foodborne Pathogen. Emerging Infection Diseases 5: 28-35
Andrews, S.C., 1998. Iron storage in bacteria. Advances in microbial physiology 40: 281-351.
Andrews, S.C., 2010. The Ferritin-like superfamily: Evolution of the biological iron storeman from a
rubrerythrin-like ancestor Biochimica et biophysica acta 1800: 691-705
Atack, J.M., Harvey, P., Jones, M.A. and Kelly, D.J. 2008. The Campylobacter jejuni Thiol
Peroxidases Tpx and Bcp Both Contribute to Aerotolerance and Peroxide-Mediated Stress Resistance
but Have Distinct Substrate Specificities. Journal of Bacteriology 190: 5279-5290
Atack, J.M. and Kelly, D.J. 2009. Oxidative stress in Campylobacter jejuni: responses, resistance and
regulation. Future Microbiology 4: 677-690.
Archer, M., Huber, R., Tavares, P., Moura, I., Moura, J.G., Carrondo, M.A., Sieker, L., C., LaGall, J.,
and Romão, M.J. 1995. Crystal Structure of Desulforedoxin from Desulfovibrio vulgarisi Determined at
1.8 Å Resolution: A Novel Non-heme Iron Protein Structure. Journal of Molecular Biology 251: 690-
702.
Archer, M., Carvalho, A.L., Teixeira, S., Moura, I., Moura, J.J., Rusnak, F. and Romao, M.J. 1999.
Structural studies by X-ray diffraction on metal substituted desulforedoxin, a rubredoxin-type protein.
Protein science: a publication of the Protein Society 8: 1536-1545.
Auchere, F., Sikkink, R., Cordas, C., Raleiras, P., Tavares, P., Moura, I. and Moura, J.J.G. 2004.
Overexpression and purification of Treponema pallidum rubredoxin; kinetic evidence for a superoxide-
mediated electron transfer with the superoxide reductase neelaredoxin. Journal of Biological Inorganic
Chemistry 9: 839-849.
Baillon, M.L.A., van Vliet, A.H.M., Ketley, J.M., Constantinidou, C. and Penn, C.W. 1999. An iron-
regulated alkyl hydroperoxide reductase (AhpC) confers aerotolerance and oxidative stress resistance
to the microaerophilic pathogen Campylobacter jejuni. Journal of bacteriology 181: 4798-4804.

68
Bartz, R.R. and Piantadosi, C.A., 2010. Clinical review: oxygen as a signaling molecule. Critical Care
14: 234-243.
Bentrop, D., Capozzi, F. and Luchinat, C. 2001. Iron-Sulfur Proteins With Known Structures. In
Handbook on Metalloproteins (I. Bertini, A. Sigel and H. Sigel eds), pp 357 - 447, Marcel Dekker, New
York
Bingham-Ramos, L.K. and Hendrixson, D.R. 2008. Characterization of Two Putative Cytochrome c
Peroxidases of Campylobacter jejuni Involved in Promoting Commensal Colonization of Poultry.
Infection and Immunity 76: 1105:1114
Birben, E., Sahiner, U.M., Sackesen, C., Erzurum and S., Kalayci, O. 2012. Oxidative stress and
antioxidant defense. The World Allergy Organization journal 5: 9-19.
Bönisch, H., Schmidt, C.L., Bianco, P. and Ladenstein, R. 2007. Ultrahigh-resolution study on
Pyrococcus abyssi rubredoxin: II. Introduction of an O-H...Sγ-Fe hydrogen bond increased the
reduction potential by 65 mV. Journal of Biological Inorganic Chemistry 12: 1163-1171.
Brenner, D.J., Krieg, N.R. and Staley, J.T. 2005. Bergey’s Manual of Systematic Bacteriology, Volume
Two, Part C. Springer, USA
Brieger, K., Schiavone, S., Miller, F.J., Jr. and Krause, K.H. 2012. Reactive oxygen species: from
health to disease. Swiss medical weekly 142.
Bucher, J., Flint, A., Stahl, M. and Stintz A. 2010. Campylobacter Fur and PerR Regulons in Iron
Uptake and Homeostasis in Microorganisms (P. Cornelis and S.C. Andrews eds.) pp167-195, Caister
Academic Press, Northfolk UK.
Burton, G.J. and Jauniaux, E., 2011. Oxidative stress. Best practice & research. Clinical obstetrics &
gynaecology 25: 287-299.
Butcher, J., Sarvan, S., Brunzelle, J., Couture, J-F. and Stintzi, A. 2012. Structure and regulon of
Campylobacter jejuni ferric uptake regulator Fur define apo-Fur regulation. Proceedings of the
National Academy of Sciences of the Unites States of America 19: 10047-10052.
Bruschi, M., Hatchikian, C.E., Golovleva, L.A. and Gall, J.L. 1977. Purification and characterization of
cytochrome c3, ferredoxin, and rubredoxin isolated from Desulfovibrio desulfuricans Norway. Journal
of bacteriology 129: 30-38.
Cooley, R.B., Arp, D.J. and Karplus, P.A. 2011. Symerythrin structures at atomic resolution and the
origins of rubrerythrins and the ferritin-like superfamily. Journal of molecular biology 413: 177-194.
Cornelis, P. and Andrews, S.C. 2010. Iron Uptake and Homeostasis in Microorganisms. Caister
Academic Press, Northfolk, UK

69
Coulter, E.D., Shenvi, N.V., and Kurtz, D.M. 1999. NADH peroxidase activity of rubrerythrin.
Biochemical and biophysical research communications 255: 317-323.
Coulter, E.D., Shenvi, N.V., Beharry, Z.M., Smith, J.J., Prickril, B.C., and Kurtz, D.M. 2000.
Rubrerythrin-catalyzed substrate oxidation by dioxygen and hydrogen peroxide. Inorganica Chimica
Acta 297: 231-241
Damo, S., Chazin, W.J., Skaar, E.P. and Kehl-Fie, T.E., 2012. Inhibition of bacterial superoxide
defense: a new front in the struggle between host and pathogen. Virulence 3: 325-328.
Dasti, J.I., Tareen, A.M., Lugert, R., Zautner, A.E. and Gro, U. 2010. Campylobacter jejuni: A brief
overview on pathogenecity-associated factors and disease-mediating mechanisms. International
Journal of Medical Microbiology 300: 205-211
Day, W. A.Jr., Sajecki, J.L., Pitts, T.M. and Joens, L.A. 2000. Role of Catalase in Campylobacter jejuni
Intracellular Survival. Infection and Immunity 68: 6337-6345
Droge, W., 2002. Free radicals in the physiological control of cell function. Physiological reviews 82:
47-95.
Engberg, J., Aarestrup, F.M., Taylor, D.E., Gerner-Smidt, P. and Nachamkin, I. 2001. Quinolone and
macrolide resistance in Campylobacter jejuni and C. coli: Resistance mechanisms and trends in
human isolates. Emerging infectious diseases 7: 24-34.
Finnegan, M., Linley, E., Denyer, S.P., McDonnell, G., Simons, C. and Maillard, J.Y., 2010. Mode of
action of hydrogen peroxide and other oxidizing agents: differences between liquid and gas forms. The
Journal of antimicrobial chemotherapy 65: 2108-2115.
Fischer, D.S. and Price, D. C. 1964. A Simple Serum Iron Method Using the New Sensitive
Chromogen Tripyridyl-s-triazine. Clinical Chemistry 10: 21-31
Fridovich, I., 2013. Oxygen: how do we stand it? Medical principles and practice. International journal
of the Kuwait University, Health Science Centre 22: 131-137.
Fushinobu, S., Shoun, H. and Wakagi, T. 2003. Crystal structure of sulerythrin, a rubrerythrin-like
protein from a strictly aerobic archaeon, Sulfolobus tokodaii strain 7, shows unexpected domain
swapping. Biochemistry 42: 11707-11715.
Gupta, N., Bonomi, F., Kurtz, D.M., Ravi, N., Wang, D.L. and Huynh, B.H. 1995. Recombinant
Desulfovibrio vulgaris Rubrerythrin - Isolation and Characterization of the Diiron Domain. Biochemistry
34: 3310-3318.
Gupta, R.S. 2006. Molecular signatures (unique proteins and conserved indels) that are specific for
the epsilon proteobacteria (Campylobacterales). BMC Genomics 7: 167
Hagen, W.R. 2006. EPR spectroscopy as a probe of metal centres in biological systems. Dalton
Transactions 37: 4415-4434

70
Hoffman, P.S. and Goodman, T.G. 1982. Respiratory Physiology and Energy Conservation Efficiency
of Campylobacter jejuni. Journal of Bacteriology 150: 319-326
Holmes, K., Mulholland, F., Pearson, B.M., Pin, C., McNicholl-Kennedy, J., Ketley, J.M. and Wells,
J.M. 2005. Campylobacter jejuni gene expression in response to iron limitation and the role of Fur.
Microbiology 151: 243-257.
Hu, L., Bray, M.D., Osorio, M. and Kopecko, D.J. 2006. Campylobacter jejuni Induces Maturation and
Cytokine Production in Human Dendritic Cells. Infection and Immunity 74:2697-2705
Huergo, L.F., Rahman, H., Ibrahimovic, A., Day, C.J. and Korolik, V. 2013. Campylobacter jejuni Dps
Protein Binds DNA in the Presence of Iron or Hydrogen Peroxide. Journal of Bacteriology 195: 1970-
1978.
Ishikawa, T., Mizunoe, Y., Kawabata, S., Takade, A., Harada, M., Wai, S.N. and Yoshida, S. 2003.
The Iron-Binding Protein Dps Confers Hydrogen Peroxide Stress Resistance to Campylobacter jejuni.
Journal of Bacteriology 185: 1010-1017.
Janssen, R., Krogfelt,K.A., Cawthraw, S.A., van Pelt, W., Wagenaar, J.A. and Owen, R.J. 2008. Host-
Pathogen Interactions in Campylobacter Infections: the Host Perspective. Clinical Microbiology
Reviews 21:505-518.
Jin, S., Kurtz, D.M., Liu, Z.J., Rose, J. and Wang, B.C. 2002. X-ray crystal structures of reduced
rubrerythrin and its azide adduct: A structure-based mechanism for a non-heme diiron peroxidase.
Journal of the American Chemical Society 124: 9845-9855.
Jena, N.R. 2012. DNA damage by reactive species: Mechanisms, mutation and repair. Journal of
biosciences 37: 503-517.
Kaakoush N.O., Miller, W.G., Reuse, H.D. and Mendz, G.L. 2007. Oxygen requirement and tolerance
of Campylobacter jejuni. Research in Microbiology 158: 644-650.
Kassem, I.I, Khatri, M., Esseili, M., Sanad, Y.M., Saif, Y.M., Olson, J.W. and Rajashekara, G. 2012.
Respiratory proteins contribute differentially to Campylobacter jejuni’s survival and in vitro interactions
with hosts’ intestinal cells. BMC Microbiology 12.
Kao, W.C., Wang, V.C.C., Huang, Y.C., Yu, S.S.F., Chang, T.C. and Chan, S.I. 2008. Isolation,
purification and characterization of hemerythrin from Methylococcus capsulatus (Bath). Journal of
Inorganic Biochemistry 102: 1607-1614.
Kim, M., Hwang, S., Ryu, S. and Jeon, B. Regulation of perR Expression by Iron and PerR in
Campylobacter jejuni. Journal of Bcateriology 193:6171-6178

71
Konkel, M.E., Klena, J.D., Rivera-Amill, V., Monteville, M.R., Biswas, D., Raphael, B. and Mickelson J.
2004. Secretion of Virulence Proteins from Campylobacter jejuni Is Dependent on a Functional
Flagellar Export Apparatus. Journal of Bacteriology 186:3296-3303.
Lee, W.Y., Brune, D.C., Lobrutto, R. and Blankenship, R.E. 1995. Isolation, Characterization, and
Primary Structure of Rubredoxin from the Photosynthetic Bacterium, Heliobacillus mobilis. Archives of
biochemistry and biophysics 318: 80-88.
Legall, J., Prickril, B.C., Moura, I., Xavier, A.V., Moura, J.J.G. and Huynh, B.H. 1988. Isolation and
Characterization of Rubrerythrin, a Non-Heme Iron Protein from Desulfovibrio vulgaris That Contains
Rubredoxin Centers and a Hemerythrin-Like Binuclear Iron Cluster. Biochemistry 27: 1636-1642.
Li, M., Liu, M.Y., Le Gall, J., Gui, L.L., Liao, J., Jiang, T., Zhang, J.P., Liang, D.C. and Chang, W.R.
2003. Crystal structure studies on rubrerythrin: enzymatic activity in relation to the zinc movement.
Journal of Biological Inorganic Chemistry 8: 149-155.
Lin, I.J., Gebel, E.B., Machonkin, T.E., Westler, W.M. and Markley, J.L. 2005. Changes in hydrogen-
bond strengths explain reduction potentials in 10 rubredoxin variants. Proceedings of the National
Academy of Sciences of the United States of America 102: 14581-14586.
Lindmark, B., Rompikuntal, P.K., Vaitkevicius, K., Song, T., Mizunoe, Y., Uhlin, B.E., Guerry, P. and
Wai, S.N. 2009. Outer membrane vesicle-mediated release of cytolethal distendingtoxin (CDT) from
Campylobacter jejuni. BMC Microbiology 9:220.
Linley, E., Denyer, S.P., McDonnell, G., Simons, C. and Maillard, J.Y., 2012. Use of hydrogen
peroxide as a biocide: new consideration of its mechanisms of biocidal action. The Journal of
antimicrobial chemotherapy 67: 1589-1596.
Lumpio, H.L., Shenvi, N.V, Summers, A.O., Voordouw, G. and Kurtz, D.M. Jr. 2001. Rubrerythrin and
Rubredoxin Oxidoreductase in Desulfovibrio vulgaris: a Novel Oxidative Stress Protection System.
Journal of Bacteriology 183: 101-108.
Luo, Y., Ergenekan, C.E., Fischer, J.T., Tan, M.L. and Ichiye, T. 2010. The Molecular Determinants of
the Increased Reduction Potential of the Rubredoxin Domain of Rubrerythrin Relative to Rubredoxin.
Biophysical journal 98: 560-568.
Makris, T.M., Chakrabarti, M., Munck, E. and Lipscomb, J.D. 2010. A family of diiron monooxygenases
catalyzing amino acid beta-hydroxylation in antibiotic biosynthesis. Proceedings of the National
Academy of Sciences of the United States of America 107: 15391-15396.
Miyamoto, T., Asahina, Y., Miyazaki, S., Shimizu, H., Ohto, U., Noguchi, S. and Satow, Y. 2011.
Structures of the SEp22 dodecamer, a Dps-like protein from Salmonella enterica subsp. enteric
serovar Enteritidis. Acta Crystallographica 67: 17-22
72
Moura, I., Moura, J.J.G., Santos, M.H., Xavier, A.V. and Legall, J. 1979. Redox Studies on
Rubredoxins from Sulfate and Sulfur Reducing Bacteria. FEBS letters 107: 419-421.
Moura, I., Huynh, B.H., Hausinger, R.P., Le Gall, J., Xavier, A.V. and Munck, E. 1980. Mossbauer and
EPR studies of desulforedoxin from Desulfovibrio gigas. The Journal of biological chemistry 255:
2493-2498.
Moura, I., Tavares, P. and Ravi, N. 1994. Characterization of three proteins containing multiple iron
sites: rubrerythrin, desulfoferrodoxin, and a protein containing a six-iron cluster. Methods in
enzymology 243: 216-240.
Mydel, P., Takahashi, Y., Yumoto, H., Sztukowska, M., Kubica, M., Gilbson, F.C., Kurtz, D.M., Travis,
J., Collins, L.V, Nguyens, K., Genco, C.A. and Potempai J. 2006. Roles of the Host Oxidative Immune
Response and Bacterial Antioxidant Rubrerythrin during Porphyromonas gingivalis Infection. PLOS
Pathogens 2: 712-725.
Ohara, M., Oswald, E. and Sugai M. 2004. Cytolethal Distending Toxin: A Bacterial Bullet Targeted to
Nucleus. Journal of Biochemistry 136:409-413
Palyada, K., Threadgill, D. and Stintzi, A.2004. Iron Acquisition and Regulation in Campylobacter
jejuni. Journal of Bacteriology 186:4714-4729
Palyada, K. Sun, Y.Q., Flint, A., Butcher, J., Naikare, H. and Stintzi, A. 2009. Characterization of the
oxidative stress stimulon and PerR regulon of Campylobacter jejuni. BMC Genomics 10:481
Parkhill, J., Wren, B.W., Mungall, K. Ketley, J.M., Churcher, C., Basham, D., Chillingworth, T., Davies,
R.M., Feltwell, T., Holroyd, S., Jagels, K., Karlyshev, A.V., Moule, S., Pallen, M.J., Pennk, C.W., Quail,
M.A., Rajandream, M-A., Rutherford, K.M., van Vliet, H.M., Whitehead, S. and Barrel, B.G. 2000. The
genome sequence of the food-borne pathogen Campylobacter jejuni reveals hypervariable
sequences. Nature 403: 665-668
Pesci, E.C., Cottle, D.L. and Picket, C.L. 1994. Genetic, Enzymatic, and Pathogenic Studies of the
Iron Superoxide Dismutase of Campylobacter jejuni. Infection and Immunity 62: 2687-2694.
Pi, H.L., Jones, S.A., Mercer, L.E., Meador, J.P., Caughron, J.E., Jordan, L., Newton, S.M., Conway,
T. and Klebba, P.E. 2012. Role of Catecholate Siderophores in Gram-Negative Bacterial Colonization
of the Mouse Gut. PloS one 7.
Pierik, A.J., Wolbert, R.B., Portier, G.L., Verhagen, M.F. and Hagen, W.R. 1993. Nigerythrin and
rubrerythrin from Desulfovibrio vulgaris each contain two mononuclear iron centers and two dinuclear
iron clusters. European journal of biochemistry / FEBS 212: 237-245.

73
Pinto, A.F., Todorovic, S., Hildebrandt, P., Yamazaki, M., Amano,F., Igimi, S., Romão, C.V. and
Teixeira, M. 2011. Desulforubrerythrin from Campylobacter jejuni, a novel multidomain protein. Journal
of Biological Inorganic Chemistry 13: 501-510
Pinto, A.F. 2012. Reductive scavenging of reactive oxygen species in prokaryotes, Rubrerythrin and
Superoxide Reductase. Ph.D Thesis. Instituto de Tecnologia Química e Biológica, Universidade Nova
de Lisboa
Putz, S., Gelius-Dietrich, G., Piotrowski, M. and Henze, K. 2005. Rubrerythrin and peroxiredoxin: Two
novel putative peroxidases in the hydrogenosomes of the microaerophilic protozoon Trichomonas
vaginalis. Molecular and biochemical parasitology 142: 212-223.
Rhee, S.G., Woo, H.A., Kil, I.S. and Bae, S.H., 2012. Peroxiredoxin functions as a peroxidase and a
regulator and sensor of local peroxides. The Journal of biological chemistry 287: 4403-4410.
Sahu I.D., McCarrick, R.M. ND Lorigan, G.A. 2013. Use of Electron Paramagnetic Resonance To
Solve Biochemical Problems. Biochemistry 52: 5967-5984
Sansonetti, P.J. and Di Santo, J.P. 2007. Debugging how bacteria manipulate the immune response.
Immunity 26: 149-161.
Shimizu, F., Ogata, M., Yagi, T., Wakabayashi, S. and Matsubara, H. 1989. Amino-Acid-Sequence
and Function of Rubredoxin from Desulfovibrio-Vulgaris Miyazaki. Biochimie 71: 1171-1177.
Smith, M.A., Finel, M., Korolik, V. and Mendtz G.L. 2000. Characteristics of the aerobic respiratory
chains of the microaerophilics Campylobacter jejuni and Helicobacter pylori. Archives of Microbiology
174: 1-10
Sztukowsaka M., Bugno M., Potempa, J., Travis, J. and Kurtz, D.M. 2002. Role of rubrerythrin in the
oxidative stress responseof Porphyromonas gingivalis. Molecular Microbiology 44: 479-488
Todar, K. 2008. Important groups of Procaryotes. Version 1st September 2013.
http://textbookofbacteriology.net/procaryotes.html in Todar’s Online Textbook of Bacteriology,
http://textbookofbacteriology.net
Verhagen, M.F., Voorhorst, W.G., Kolkman, J.A., Wolbert, R.B. and Hagen, W.R. 1993. On the two
iron centers of desulfoferrodoxin. FEBS letters 336: 13-18.
Vliet, A.H. van, Ketley, J.M., Park, S.F. and Penn, C.W. 2002. The role of iron in Campylobacter gene
regulation, metabolism and oxidative stress defense. FEMS microbiology reviews 26: 173-186.
Wainwright, L.M., Elvers,K.T., Park., S.F. and Poole, R.K. 2005. A truncated haemoglobin implicated
in oxygen metabolism by the microaerophilic food-borne pathogen Campylobacter jejuni. Microbiology
151: 4079-4091

74
Wakagi, T. 2003. Sulerythrin, the smallest member of the rubrerythrin family, from a strictly aerobic
and thermoacidophilic archaeon, Sulfolobus tokodaii strain 7. FEMS Microbiology Letters 222: 33-37
Weinberg, M.V., Jenney, F.E., Jr., Cui, X. and Adams, M.W., 2004. Rubrerythrin from the
hyperthermophilic archaeon Pyrococcus furiosus is a rubredoxin-dependent, iron-containing
peroxidase. Journal of bacteriology 186: 7888-7895.
Wiinterbourn, C.C. 2008. Reconciling the chemistry and biology of reactive oxygen species. Nature
Chemical Biology. 4:278-286.
Wood, P.M., 1988. The potential diagram for oxygen at pH 7. The Biochemical journal 253: 287-289.
Yamasali, M., Igimi, S., Katayama, Y., Yamamoto, S. and Amano, F. 2004. Identification of an
oxidative stress-sensitive protein from Campylobacter jejuni, homologous to rubredoxin
oxidoreductase/rubrerythrin. FEMS Microbiology Letters 235: 57-63
Yoon, K.S., Hille, R., Hemann, C. and Tabita, F.R. 1999. Rubredoxin from the green sulfur bacterium
Chlorobium tepidum functions as an electron acceptor for pyruvate ferredoxin oxidoreductase. Journal
of Biological Chemistry 274: 29772-29778.
Young, K., Davis, L.M., DiRita, V.J. 2007. Campylobacter jejuni: molecular biology and pathogenesis.
Nature Reviews Microbiology 5: 665-679.
Zhang, Y., Liu, L., Wu, X., An, X., Stubbe, J. and Huang, M. 2011. Investigation of in vivo diferric
tyrosyl radical formation in Saccharomyces cerevisiae Rnr2 protein: requirement of Rnr4 and
contribution of Grx3/4 AND Dre2 proteins. The Journal of biological chemistry 286: 41499-41509.
Zeng, Q.D., Smith, E.T., Kurtz, D.M. and Scott, R.A. 1996. Protein determinants of metal site reduction
potentials: Site-directed mutagenesis studies of Clostridium pasteurianum rubredoxin. Inorganica
Chimica Acta 242: 245-251.
Zheng, J., Meng, J., Zhao, S., Singh, R. and Song, W. 2008. Campylobacter-Induced Interleukin-8
Secretion in Polarized Human Intestinal Epithelial Cells Requires Campylobacter-Secreted Cytolethal
Distending Toxin- and Toll-Like Receptor-Mediated Activation of NF-B. Infection and Immunity 76:
4498-4508.
Zhou, B., Shao, J., Su, L., Yuan, Y.C., Qi, C., Shih, J., Xi, B., Chu, B. and Yen, Y. 2005. A dityrosyl-
diiron radical cofactor center is essential for human ribonucleotide reductases. Molecular cancer
therapeutics 4: 1830-1836.
75
6 APPENDIX
6.1 Electronic Paramagnetic Resonance
Electronic Paramagnetic Resonance (EPR) is a technique used to study species with unpaired
electrons, which limits the use of this technique but also increases its specificity. Each electron has an
associated spin number (S) with a value of 1/2 and can exist with a quantum state 1/2. In the
absence of a magnetic field those states are degenerate (have the same energy), but when a
magnetic field is applied the energy of the negative state decreases and the energy of the positive
state increases. The energy between the two levels is gβeB0, where g is a characteristic of the
electron, βe is the electron Bohr magneton and B0 is the magnetic affecting the electron (that results
both from the external magnetic field applied and the field generate by the molecule nucleus). In an
EPR experiment the frequency of the radiation is constant and the field varies within a determined
range. When the microwave radiation energy equals the energy difference between the two levels
there is absorption of energy that is converted into a spectrum. Usually the result is shown as the
derivative of the signal and not the signal itself. At this point is possible to determine the g-value of the
system, which allows characterize the system.
In biology EPR is particularly useful in the study of molecules with transition metals (e.g.: Fe, Co,
Mn) or molecules harbouring radicals (Hagen 2006; Sahu et al.,2013)

76
6.2 List of reagents and proteins used to perform the experimental work
Product Brand/Seller
Acetic acid glacial Panreac
Acrylamide 30% Roth
Agar Fragon
Aldolase
Sigma Aldrich
Albumin, from chicken egg Sigma Aldrich
Ammonium acetate Fisher Chemicals
Ammonium hydroxide Fluka
Ammonium chloride Panreac
Ammonium Persulfate (APS) Roth
Ampicilin sodium salt Sigma Aldrich
Anthraquinone-2-sulfonic Sigma Aldrich
Aprotinin Sigma Aldrich
BCA Reagents A and B Pierce
BSA, protein standard for BCA Sigma Aldrich
Bicine Sigma Aldrich
Blue Dextran Sigma Aldrich
Brilliant Blue G ACROS
Bromophenol Blue Sigma Aldrich
Calcium chloride dihydrate Merck
Cyclohexylamino propanesulphonic acid (CAPS) Roth
Catalase Sigma Aldrich
Conalbumin Sigma Aldrich
di-Sodium Hydrogen Phospate (Na2HPO4) Panreac
di-Potassium Hydrogen Phosphate anhydrous (K2HPO4)
Panreac
D-Glucose Roth
DNAse I Applichem
Ethanol (Absolute) Scharlau
Ferritin, type I from horse spleen Sigma Aldrich

77
Glutathione reduced form GSH Sigma Aldrich
Glycerol 86-88% Scharlau
Glycerol 99.5% Sigma Aldrich
Glycine Roth
Hepes Roth
Hydrochloric acid (HCl) 37% Panreac
Hydrogen peroxide Sigma Aldrich
Iron Standard for ICP Fluka
Iron (II) sulfate heptahydrate Merck
Isopropyl β-D-1-thiogalactopyranoside (IPTG) Apollo Scientific
Lysozyme Sigma Aldrich
LMW calibration kit for SDS electrophoresis (14.4-97kDa) GE Healthcare
Magnesium sulphate anhydrous (MgSO4) Fluka
MES hydrate Sigma
Menadione Sigma Aldrich
Methanol 99.8% Sigma Aldrich
Myoglobin Sigma Aldrich
Nickel (II) chloride hexahydrate (NiCl2) Merck
n,n-dimethyl-p-phenylendiamine sulfate Sigma Aldrich
N, N,N’,N’-Tetrametyldiamine 99% (TEMED) ACROS Organics
N,N,N,N-tetramethyl-1,4- phenylenodiamine ACROS
Phenazine Sigma Aldrich
Potassium dihydrogen phosphate (KH2PO4) Panreac
Potassium Indigotrisulfonate Sigma Aldrich
plumbagin Sigma Aldrich
Polyethylene glycol methyl ether 550 (PEG 550) Fluka
Polyethylene glycol monomethylether 2000 (PEG 2 K) Fluka
Polyethylene glycol 4000 (PEG 4 K) Merck
Polyethylene glycol 6000 (PEG 6K) Merck
Polyethylene glycol 8000 (PEG 8K) Sigma

78
Potassium ferricyanide Merck
Prestained SDS PAGE marker (6-203 kDa) BioRad
quinhydrone 98% Merck
Sodium chloride (NaCl) José Manuel Gomes dos Santos
Sodium dithionite Sigma Aldrich
Sodium dodecyl sulphate (SDS) Panreac
Sucrose Sigma Aldrich
Trichloroacetic Acid (TCA) Roth
Trimethylhydroquinone 97% Sigma Aldrich
Triptone Cultimed
Tris-(hydroxymethyl)aminomethane (Tris) Panreac
Tris-(2-Carboxyethyl)phosphine hydrochloride (TCEP) Sigma Aldrich
Urea Harnstoff
Yeast extract Cultimed
1,2 Naphthoquinone Fluka
1,4- Napthoquinone hydrate 97% Sigma Aldrich
1,2-naphtoquinone-4-sulfonic acid, sodium salt 99% Sigma Aldrich
2-Hydroxy-1,4-naphthoquinone Sigma Aldrich
2-Mercaptoethanol Sigma Aldrich
2-Methyl-2,4 pentanediol (MPD) Merck
2- Propanol Riede-deHaën
2, 4, 6 Tris (2-pyridyl) – S-triazine (TPTZ) Sigma Aldrich
(+)-sodium L - ascorbate Sigma Aldrich

79

80