insight address: "cross-media marketing synergies: spreading dollars across channels"
TRANSCRIPT

Cross-Channel Marketing & Measurement

Cross-channel is a media property, service, story or experience distributed across media platforms using a variety of media forms

The landscape has changed

• According to IAB, it took 38 years for Radio to reach 50mm users, 13 years for TV, 10
years for Cable, less than 5 years for Internet and less than 2 years for Internet Video.
• Study by IDC says average American spends half-an-hour w/ magazine a day, 2.7 hours
with TV, and twice that, 5 hours, with Internet.
• comScore says over 84 million people watch Internet video in a day;
average Facebook users spend over 4.5 hours a month on the site.
• YET we spend 21.3% of our Ad budgets on print, 65.8% on TV,
and only 6.4% on Internet. (4.1% among Top 100!)

Just Over 1% of Online Video Time is Spent Watching Ads, Compared to 25% of Television Time
Source: Video Metrix March 2010 Data
All Online Video Television

Even When The Analysis is Limited to Premium Content, TV’s Ad Load is Far Higher
Source: Video Metrix March 2010 Data
TelevisionOnline Long-Form
Premium

6 to 7 Minutes of Advertising Per Hour is Acceptable; 35% More Than is Currently Being Delivered
1 min 2 min 3 min 4 min 5 min 6 min 7 min 8 min 9 min 10 min 11 min 12 min 13 min 14 min 15 min0.0
20.0
40.0
60.0
80.0
100.0
Negligible Minimal Long Enough Too Long
Desired Length of Commercials
Source: ‘The future of original TV Viewing and the new digital consumer’’ survey conducted by comScore in December 2009

0 2,500 5,000 7,500 10,000 12,500 15,0000
102030405060708090
100
67.874.1
85.1 87.9
Cost ($000)
Total reach
Effective Reach (3+ Impressions)
Reach and Effective Reach for a TV campaign as a function of cost
Brands Going For High Audience Reach with TV Only Hit A Plateau

Media Plan GRPs Cost Total Reach Effective Reach
TV Only 1,000 10,000 85.1% 67.8%
TV + Internet Combination
TV (90%) 900 9,000 83.7% 65.8%
Online (10%) 500 1,000 63.8% 44.0%
TV + Online 1,400 10,000 90.2% 83.7%
TV Only vs.90% TV + 10% Online 400 0 5.1% 15.9%
Impact of a 90/10 budget allocation
Adding Internet Builds Reach with Identical Investment

10
Del Monte Digital Vision
Offline
Online
Source: Forrester Research

% Contribution To Sales
Marketing Mix Model Outputs
$$$
Effec
tiven
ess
Where does Digital fit?
Trade
TV
Radio

Marketing Mix Modeling has Limitations
• Digital’s curve hasn’t been seen long enough and spend is not high enough for high degrees of variance to appear
• Moving curve – not all impressions are the same– Eg. How do you measure social?
• Synergistic and ordered effects

How do we measure New World fairly?
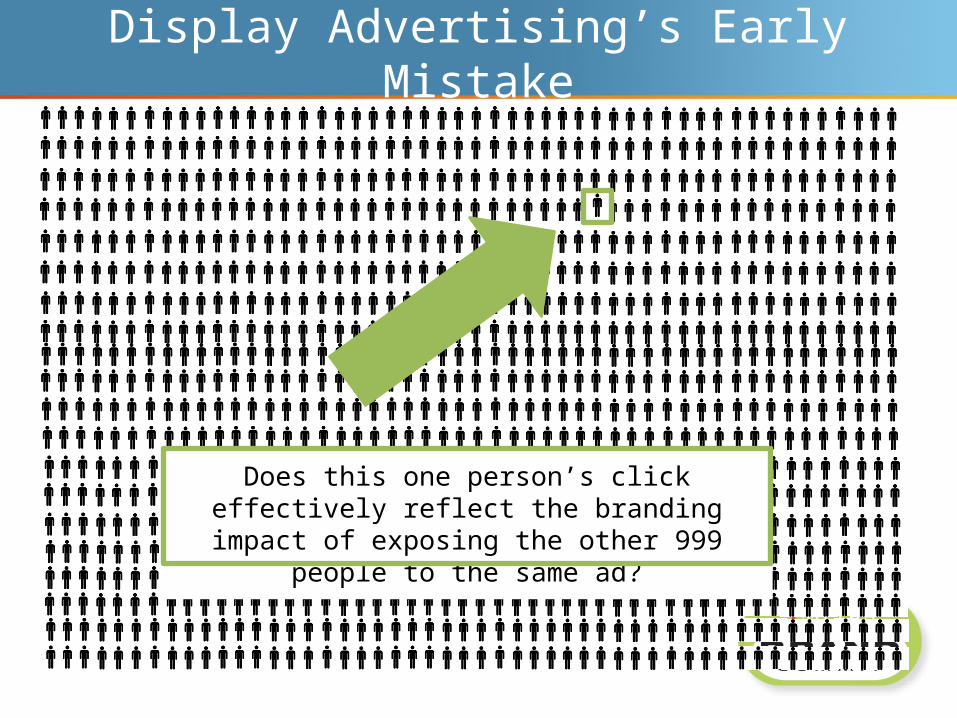
Display Advertising’s Early Mistake
Does this one person’s click effectively reflect the branding impact of exposing the other 999 people to
the same ad?

• Traditional Marketing Mix Modeling, alone, is not enough
• Two Methods will work– Marketing Mix Modeling + digital-driver analysis– Integrated panels with “opportunity-to-see” survey
• Digital must fix it’s creative problem

Brand AwarenessTop-of-Mind & Secondary Unaided
Aided
Brand Favorability Perceptions
Attributes
Likelihood to Recommend
Intent to Purchase
30 DaysFuture
Campaign Impact on Brand Effectiveness, Online Behavior and Sales
Attitudes about the BrandOnline Site Visitation and
Trademark Search
Transactions andRetail Purchases
Exposure to advertising in
TV, Online, Print channels

Synergistic and Ordered Effect• From GroupM Search/M80/comScore
study released in October 2009– Searchers involved with branded social
media more likely to search lower in purchase funnel
– Consumers exposed to brand’s social media and paid search 2.8x more likely to search for that brand than those who only saw paid search alone
– 50% CTR increase in paid search when exposed to branded social media
– Among searchers using branded terms in query, CTR increased from 4.5% to 11.8% when searcher was exposed to both branded social media AND paid search
For more information please contact: Cindy Kerber Spellman Director, Corporate Communications T: +1 314 682 2055 E: [email protected]

Search TV Radio Magazine Newspaper
1774
440 302 23662
Search Transactions Driven by Offline Media
Marketing Driven Transactions
Search TV Radio Magazine Newspaper
1550
440 302 23662
15515 16
38
Search Transactions Driven by Offline Media
Marketing Driven Transactions Offline Impact on Search
Example: Impact of Offline Media on Search (Retail)
Multi-stage Modeling spreads credit appropriately.
• Source: Media Management Analytics
Transactions (000’s)

Newspapers
TV Advertising
Out-of-Home
Radio
Magazine
Search
Newspapers
TV Advertising
Out-of-Home
Radio
Magazine
Search
$0.51
$0.52
$1.20
$1.40
Accurate ROI measurement through search reattribution…
• Source: Media Management Analytics
Spend
$46.0 MM
$9.8 MM
$14.6 MM
$0.5 MM
$62.5 MM
$5.0 MM
ROI after reattribution of upstream media effectsExample: Reattributed Search ROI (Retail)

• Traditional Marketing Mix Modeling, alone, is not enough
• Two Methods will work– Marketing Mix Modeling + digital-driver analysis– Integrated panels with “opportunity-to-see” survey
• Digital must fix it’s creative problem

Internet Ad Exposure TV Ad ExposureSurvey for
Opportunityto See Other
Media
Single-Source Panel + Survey

Brand Perceptions: Specific Attributes
Percentage Point Impacts… Online Print TV Online + TV
Online + Print
TV + Print
Online + TV + Print
Developed by doctors -1 pts +10 pts +3 pts +13 pts +4 pts +16 pts +20 pts
Money back guarantee +3 pts +11 pts +8 pts +13 pts +13 pts +18 pts +32 pts
Popular +1 pts +13 pts +11 pts +16 pts +9 pts +23 pts +28 pts
Premium Quality No Lift +5 pts +4 pts +7 pts +4 pts +17 pts +24 pts
Most effective -6 pts +1 pts +2 pts +5 pts +4 pts +11 pts +25 pts
Works quickly No Lift +10 pts +7 pts +12 pts +3 pts +18 pts +32 pts
Is gentle -4 pts +2 pts +7 pts +14 pts +7 pts +24 pts +30 pts
Contains effective ingredients +1 pts +8 pts +7 pts +10 pts +11 pts +22 pts +34 pts
=significantly greater/less than not-exposed at the 95% confidence level
=significantly greater/less than not-exposed at the 90% confidence level
Cross Media and TV + Print impact every brand attribute measure
Source: Cross Media Brand Survey Lift

Early results are very consistent …
TV provides stronger lift and contribution than DigitalDigital provides stronger ROI (driven by lower cost)Part of the problem is the creative

Display advertising early mistake #1: Clutter
Can you imagine?
Clutter Brand advertisers tell stories. They don’t want to compete with other advertisers. This is a better model for display.

Over 50% of the Impact of Advertising is Driven by the Strength of the Creative
% Influence on Market Share ShiftsSource: Source: comScore ARS Global Validation Summary Creative is 4x
More Impactful in
Influencing Sales
Than
Planning Variables

Pre-qualifying Creative Has Been Proven to Drive Better Advertising Results and Lower Upfront Development Costs
Lower testing and production costs• Stronger First-time Success Rates
Volume increases• Ad Scores Go Up
Client A 2006 2007 2008 2009EFFICIENCY
More Ads QualifiedTo Run
53% 55% 60% 65%
EFFECTIVENESSAverage Scores Increased 128 134 143 156


Ads within the food database that have scored similarly to “My Ad Execution" have seen an average +2.0 days of incremental volume with 550 GRPs spent.
Pre-Testing Can Predict In-Store Sales
ARS Persuasion Market Mix Modeling Validation
Est. ARS Persuasion Range Your AdAverage Days of Incremental
Category Volume^
15.0 + +7.3
11.0 to 14.9 +2.9
9.0 to 10.9 +2.2
7.0 to 8.9 My Ad (version 1) +2.0
5.0 to 6.9 My Ad (version 2) +1.4
3.0 to 4.9 +0.9
<3.0 +0.7

Implications:-Traditional MMM alone won’t work, but there are scalable ways
- MMM + digital drivers analysis- Cross-channel panel plus survey
-We have a creative problem … pre-qualify digital like you would TV
