input related microbial carbon dynamic of soil organic matter in particle size fractions
TRANSCRIPT
at SciVerse ScienceDirect
Soil Biology & Biochemistry 47 (2012) 209e219
Contents lists available
Soil Biology & Biochemistry
journal homepage: www.elsevier .com/locate/soi lb io
Input related microbial carbon dynamic of soil organic matter in particlesize fractions
Antje Gude a, Ellen Kandeler b, Gerd Gleixner a,*aMax Planck Institute for Biogeochemistry, Postbox 100164, 07701 Jena, Germanyb Institute of Soil Science and Land Evaluation, Section of Soil Biology, University of Hohenheim, 70593 Stuttgart, Germany
a r t i c l e i n f o
Article history:Received 25 August 2011Received in revised form2 January 2012Accepted 4 January 2012Available online 15 January 2012
Keywords:PLFACarbon isotopesFungiGram negative bacteriaGram positive bacteriaMycorrhizaCarbon use efficiency
* Corresponding author.E-mail addresses: [email protected] (A.
hohenheim.de (E. Kandeler), [email protected]
0038-0717/$ e see front matter � 2012 Elsevier Ltd.doi:10.1016/j.soilbio.2012.01.003
a b s t r a c t
This paper investigated the flow of carbon into different groups of soil microorganisms isolated fromdifferent particle size fractions. Two agricultural sites of contrasting organic matter input werecompared. Both soils had been submitted to vegetation change from C3 (Rye/Wheat) to C4 (Maize)plants, 25 and 45 years ago. Soil carbon was separated into one fast-degrading particulate organic matterfraction (POM) and one slow-degrading organo-mineral fraction (OMF). The structure of the soilmicrobial community were investigated using phospholipid fatty acids (PLFA), and turnover of singlePLFAs was calculated from the changes in their 13C content. Soil enzyme activities involved in thedegradation of carbohydrates was determined using fluorogenic MUF (methyl-umbelliferryl phosphate)substrates.
We found that fresh organic matter input drives soil organic matter dynamic. Higher annual input offresh organic matter resulted in a higher amount of fungal biomass in the POM-fraction and shortermean residence times. Fungal activity therefore seems essential for the decomposition and incorporationof organic matter input into the soil. As a consequence, limited litter input changed especially the fungalcommunity favoring arbuscular mycorrhizal fungi. Altogether, supply and availability of fresh plantcarbon changed the distribution of microbial biomass, the microbial community structure and enzymeactivities and resulted in different priming of soil organic matter.
Most interestingly we found that only at low input the OMF fraction had significantly highercalculated MRT for Gram-positive and Gram-negative bacteria suggesting high recycling of soil carbonor the use of other carbon sources. But on average all microbial groups had nearly similar carbonuptake rates in all fractions and both soils, which contrasted the turnover times of bulk carbon.Hereby the microbial carbon turnover was always faster than the soil organic carbon turnover andhigher carbon input reduced the carbon storage efficiency from 51% in the low input to 20%. Thesefindings suggest that microbial community preferentially assimilated fresh carbon sources but alsoused recycled existing soil carbon. However, the priming rate was drastically reduced under carbonlimitation. In consequence at high carbon availability more carbon was respired to activate the existingsoil carbon (priming) whereas at low carbon availability new soil carbon was formed at higherefficiencies.
� 2012 Elsevier Ltd. All rights reserved.
1. Introduction
Soil organicmatter (SOM) is an importantpool for the releaseandsequestration of atmospheric CO2 (Schlesinger, 1977). It is formed,degraded, and transformed by soil organisms and consists of plantand soil microbial remains. Soil microorganism additionally affect
Gude), [email protected] (G. Gleixner).
All rights reserved.
the stabilization and destabilization of SOM and soil carbondynamics (Gleixner et al., 2001; Six et al., 2006). However, theregulation of microbial activity in SOM is not well understood,additional cofactors like the quality of SOM and litter and quantityof biomass inputs have to be considered (Fontaine et al., 2004).The activity of the soil microbial community can be analyzed e.g. bythe activities of extracellular enzymes and/or the microbial carbon-uptake. Soil enzymes catalyze the degradation of complexcompounds into smaller products and are therefore indicators oforganic matter composition, transformation pathways, and micro-bial composition (Kögel-Knabner, 2002; Stemmer et al., 1998).
A. Gude et al. / Soil Biology & Biochemistry 47 (2012) 209e219210
Carbon uptake is generally measured by the uptake of isotopically-labeled substrates into soil microbial phospholipid fatty acids(PLFA) (Kramer and Gleixner, 2006). PLFAs are constituents of cellmembranes and thus can be used as distinctive biomarkers of livingbiomass (Mudd, 1980; White et al., 1979). The differences in thechemical structure of individual PLFA relate to specific groups ofmicroorganisms (Frostegård and Bååth, 1996; Zelles, 1997, 1999).Based on differences in the isotopic enrichment of naturally labeled13C in C4 versus C3 plants after a vegetation change, it is possible toestimate the input of C4 (litter)-derived carbon or turnover times ofdifferent microbial carbon sources (Balesdent and Mariotti, 1996;Gleixner et al., 2002).
Improved understanding of SOM dynamics additionally requiresstudying the structure of the soil and its different types of mineral-organic associations (Kleber et al., 2007; Six et al., 2002; Sollinset al., 1996, 2009). Soil organic matter of different quality, such asdead fine roots ormore decomposed organic biomolecules, is foundin different mineral-associations (Oades, 1993). Soil particle-sizefraction in the organo-mineral bound fraction (OMF) and theparticulate organic matter (POM) fraction hold decomposed andtransformed organic molecules and plant remains, respectively (Bolet al., 2009; Flessa et al., 2008). In addition, decomposers arespecialized in specificmicrohabitats defined by SOMcharacteristics,for example, fungi are most abundant in the POM-fractions (Pollet al., 2003). This might be a result of fungal hyphae reacting asa better binding material between organic compounds and macro-aggregates than bacteria (Tisdall and Oades, 1982). Previous inves-tigations of carbon decomposition rates in OMF and POM fractionsreveal mean residence times (MRT) of molecular compoundsvarying from less than 10 to nearly 100 years and, only in excep-tional cases, up to 1000 years, and turnover times are faster in thePOM- than the OMF-fraction (Bol et al., 2009; Derrien et al., 2006;Flessa et al., 2008; Gleixner et al., 2002; Marschner et al., 2008).Surprisingly, labile substances such as soil sugar or carbohydratesshow long turnover times of 50e100 years (Bol et al., 2009; Derrienet al., 2006; Gleixner et al., 2002; Grandy et al., 2008), suggestingmicrobial carbon recycling (Bol et al., 2009; Gleixner et al., 2002;Kramer and Gleixner, 2006). Soil enzymes could give additionalinformation supporting the recycling or stability of carbohydrates inthe soil. For example, b-D-glucosidase, b-D-Xylosidase and b-D-cel-lobiohydrolase are exclusively involved in plant biomass degrada-tion, whereas a-D-glucosidase is also able to degrade cell wallsugars, which can serve as carbon source for soil microorganisms.
Variable biomass inputs lead to differences in soil carbon storage(Skinner et al., 2006; Steinbeiss et al., 2008) and trigger soilmicrobialactivity (Habekost et al., 2008; Stephan et al., 2000; Wardle et al.,1999). Litter input activates microbial degradation and result ina mobilization of already existing soil organic carbon (Kuzyakov,2010; Steinbeiss et al., 2008). However, the interplay of microbialactivities in particle size fractions and litter input is not completelyunderstood (Kandeler et al., 1999; Kirchmann et al., 2004).
More research is necessary to better understand the underlyingmechanisms that are responsible for differences in microbialbiomass activity, microbial carbon uptake, and resulting soil carbondynamics.
Consequently, in this studywe investigated PLFA combined withenzyme activity in particle size fractions. We chose two arable soilswith different carbon inputs to obtain information about themechanisms underlying carbon turnover in particle size fractions.Both soils underwent a vegetation change from C3 to C4 plants,which allows the opportunity to follow carbon transfer of the newvegetation into the microorganisms by analyzing the 12C/13Cisotope ratio. It was hypothesized that input and availability of freshmaterial would be most important in controlling the carbondynamics in the different particle size fractions.
We therefore predicted that i) the input of fresh material ispositively correlated with microbial biomass and its activity in thedifferent particle size fractions, ii) different amounts of freshmaterial inputs would be reflected in the MRT of microbial carbonin the fractions, with higher MRT in the OMF-fractions and in thelow-input site.
2. Materials and methods
2.1. Study site and soil sampling
Soil samples were collected from two long-term field experi-ments in Germany, both characterized by a vegetation change fromC3 to C4 vegetation (Rethemeyer et al., 2005). The first site waslocated at Rotthalmünster (Bavaria) (48�220N, 13�120O), a rural areawith no influence of industrial activities. Wheat (C3 plant) wascultivated as a monoculture there between 1961 and 1979 when itwas replaced bymaize (C4 plant). Only kernels are harvested and allremains are ploughed in to the soil after harvest one time per year.The mean annual input of fresh litter is 315 g C m�2 y�1 (John et al.,2005) and the carbon stock is 4.3 kg C/m2. The soil can be classifiedas Stagnic Cutanic Luvisol (WRB, 2006) derived from loess withapproximately 73% silt, 16% clay, and 11% sand (John et al., 2005).
The second experimental site, Halle/Saale (51�290N, 11�580O) islocated in an industrial area of the former GDR. Its been used for ryecultivation only since 1878 (Merbach et al., 2000). In 1961 some of thefields were converted to silage maize cultivation. Only roots andstubbles remained in the plots after harvest each year and wereploughed into the soil one time a year. Themean annual input of freshcarbonconsequently is very low, 35gCm�2 y�1 (KramerandGleixner,2006), but the carbon stock is 5.3 kgC/m2. The soil is classified as LuvicPhaeozem (WRB, 2006) derived from sandy loesswith approximately29% silt, 9% clay and 62% sand (Kögel-Knabner et al., 2008).
At both study sites soil samples (10 cores per subunit) wereobtained from the ploughed horizon (0e25 cm at Rotthalmünster,0e30 cm at Halle) of fertilized plots (mineral fertilizer, NPK). Thesampling was done after harvest at the end of September andbeginning of October 2006, respectively. From each plot sampleswere mixed and homogenized in order to achieve representativesoil samples. In the beginning of March 2007 additionally threereplicates per plot were obtained for soil enzyme activity.
2.2. Soil pretreatment
Fresh soil samples were sieved within 48 h of sampling to 2mm,and all visible plant debris were carefully removed, reducing theinfluence of plant and soil fauna material. The samples werehomogenized and divided into two parts. One part was dried at30 �C for 48 h and ground (ball-mill, 3 min at a frequency of 30/s)for bulk organic carbon analysis, total nitrogen measurements, andbulk 13C isotope analysis. The second part was used for physicalfractionation either as freshmaterial or as material stored at�20 �Cand thawed at 4 �C.
2.3. Physical fractionation
Low-energy sonification was performed to disrupt macro-aggregates while avoiding the release of physically protectedstable organic matter in micro-aggregates (Stemmer et al., 1998)and the rupture of microbial cell walls. Field moist soil (25 gequivalent dry weight) was dispersed in 100 ml of cooled distilledwater (5 �C, Dewar vessel) and treated ultrasonically at 60 J/ml witha probe-type sonicator (Branson digital sonifier 450D). The soni-cator was calibrated according to North (1976) to prevent highultrasonic energy output.
A. Gude et al. / Soil Biology & Biochemistry 47 (2012) 209e219 211
Particulate organic matter fractions (2000e200 mm and200e63 mm) were separated bymanual wet sieving. Centrifugation(3900 g for 30 min at 15 �C) was used to separate the organo-mineral fraction (OMF, <63 mm). The coarse sand fraction (POM)and the OMF-fraction were prepared for PLFA-analysis and enzymeactivity measurement (Poll et al., 2003).
2.4. Stable isotope measurements of soil particle size fractions
The d 13C values of the soil samples were determined by anelement analyzer (EA 1110, CE Instruments, Milan, Italy) coupled toan isotope ratiomass spectrometer IRMS (DELTAplusXL, FinniganMAT,Bremen, Germany). Prepared soil samples were weighed, subjectedto C-content, into tin capsules and combusted in an oxygen streamat1000 �C furnace temperature. To determine d 13C values, evolved CO2was transferred to the IRMS (standard deviation of the standard0.04&). Using NBS 22 as standard material 13C isotope ratios areexpressed as d 13C value in per mil [&] relative to the internationalreference standard V-PDB (Coplen et al., 2006a, 2006b).
2.5. PLFA analysis and compound-specific d 13C measurements
PLFAs were extracted according to Kramer and Gleixner (2006)based on Bligh and Dyer (1959). Briefly, soil lipids were extractedusing a mixture of chloroform, methanol and 0.05 M phosphatebuffer, ph 7.4, (1:2:0.8 vol). Neutral lipids, glycolipids and phos-pholipids were separated by eluting with chloroform, acetone andmethanol, respectively, using a silica-filled solid phase extractioncolumn (SPE). Phospholipid fatty acids were hydrolyzed and meth-ylated by a KOH/methanol solution to form phospholipid fatty acidmethyl esters (PLFA-ME). Using an aminopropyl-modified SPE andsilver-impregnated SCX column, PLFA-ME were separated intosaturated, monosaturated, and polysaturated PLFA-ME to avoidoverlapping peaks when analyzed by GC/MS-IRMS for compound-specific d 13C values. PLFA 19:0 was used as an internal standardfor quantification with GC-FID (Agilent Technologies, Santa Clare,USA), HP Ultra 2 column (50 m length � 0.32 mm i.d., 0.52 mm filmthickness) and helium as carrier gas. The temperature started at140 �C (1min isotherm) and rose 2 �Cmin�1 toe270 �C, was held at270 for 6 min, and followed by a final heating rate of 30 �C min�1 toe320 �C, which was held for 3 min. After measurement all valueswere corrected for the methyl carbon according to (Kramer andGleixner, 2006). To identify the PLFA-ME, the gas chromatographwas coupled to an ion trap mass spectrometer (GCQ, Thermoquest,Germany). The results were assigned to specific PLFA-ME massspectra of reference standards as well as spectra of the WileyMS-libraryand in-housedatabases. Using theGC/MS-IRMS, a total of69 compound-specific peaks was detected, of which 66 PLFAs couldbe identified. For further quantifications with GC-FID, only peakswith an area larger than 30 pA*s were used to avoid a nonlinearcalibration curve (46 peaks quantified). Compound-specific d13Ccould be determined for 20 peaks, that occurred in all soils andwereabove the threshold intensity of 100 mV (25 ng on the column).Mean standard deviation of reference standard was 0.3&.
2.6. Calculation of microbial biomass
PLFAs were assigned to different microbial groups according toBach et al. (2008) and Zelles (1997), with branched chain fatty acidsrepresenting Gram-positive bacteria. Monosaturated fatty acids aswell as cyclo 17:0, cyclo 19:0 are characteristic for Gram-negativebacteria. Polyunsaturated fatty acids reflect eucaryotic organisms.Fatty acid 18:2u6 shows the presence of fungi. According toKroppenstedt (1985) and Lechevalier (1977), 10Me17:0 and10Me18:0 fatty acids represent Gram-positive actinobacteria. PLFA
without a specific correlation (e.g. 16:0) were combined andconsidered ‘general microorganisms.’
Microbial biomass was calculated as the sum of bacterialbiomasse using the sum of all PLFAs identifiedwith larger amountsin all study sites and particle size fractions, i.e. i15:0, a15:0, 15:0n,i16:0, 16:1u9, 16:1u7, i17:0, a17:0, cy17:0, 17:0n, 18:1u7, cy19:0 andconversion factor of 1.4 � 10�17 mol bactPLFA/cell according toFrostegård and Bååth (1996) as well as 20 fg biomass-C/cell,described in Bååth (1994) e and fungal biomass (conversion factor11.8 mmol 18:2u6/g biomass-C according to Klamer and Bååth(2004)). The former listed PLFAs also were used to calculate thefungal:bacterial biomass ratio (Frostegård and Bååth, 1996).
2.7. Soil enzymes
Fourenzymeswere selectedcatalyzing thedegradationofdifferentthe carbohydrates: a-D-glucosidase- degrading starch and othera-bond glucose moieties, b-D-glucosidase and b-D-cellobiohydrolase-degrading cellulose, the major plant-derived structural carbohydrateand b-D-xylosidase- degrading xylan, a major component of hemi-cellulose. Bacteria and fungi are both capable of producing theseenzymes. Enzyme activity was measured according to Marx et al.(2001) and Poll et al. (2006) using MUF-substrates. Briefly, 1 g moistsoil was dispersed in 50 ml de-ionized water by an ultrasonic dis-aggregator (50 J s�1 for120 s). 50ml soil suspension, 50ml of autoclavedbuffer and 100 ml substratewere dispensed into a microtitre plate (PPmicroplate, black 96 well Greiner Bio-One GmbH, Frickenhausen,Germany). Measurements were carried out in triplicates. To obtaina final concentration of 0, 0.5, 1, 2.5, 4 and 6 mM (Poll et al., 2008)standards were mixed with soil suspension and buffer.
Microplates were incubated for 3 h at 30 �C, fluorescencemeasurements were performed at 30, 60, 120 and 180 min bya microplate reader (FLX 800, Microplate Fluorescence Reader,Bio-Tek Instruments Inc., Winooski, USA). Enzyme activity waslinearly correlated with the intensity of fluorescence and wasquantified with standards.
2.8. Calculation of the input of C4-derived carbon to soil organicmatter and molecular residence time
The percentage of C4-derived carbon was calculated using thedifferences in the isotopic compositions of PLFA, collected in thesame year from both fields, e.g., continuous C3 cropping andvegetation change to C4 cropping. This enabled us to neglectisotopic fractionation in the decomposition as it occurred at bothplots. Thus, the observed isotopic effect is only related to the input.Assuming that the study sites are in steady state with a constantannual carbon input, we used the following equations to calculate(Balesdent and Mariotti, 1996):
a) the percentage of C4 -derived carbon to soil organic matter(SOM)
C4-derivedcarbon ½%� ¼��
d13CC4PLFA�d13CC3PLFA�.
�d13CC4plant�d13CC3plant
���100
b) the MRT of individual PLFA
MRT ¼ ðt � t0Þ=lnðCt=Ct0Þwith t0 as year of vegetation change, t as year of sampling, Ct ascarbon content of the soil at the sampling time labeled from C3
a b
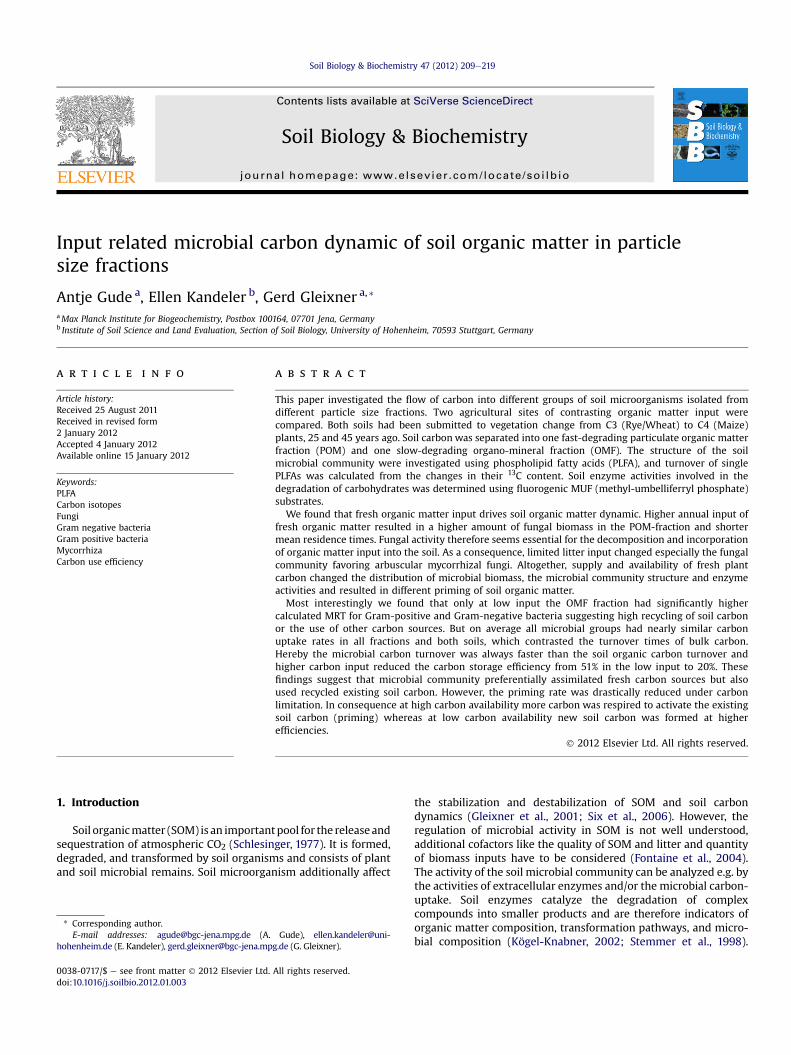
Fig. 1. Distribution of soil carbon [%] found in the POM- and OMF-fraction of C3 and C4 cultivated soils at the study sites Standard deviations for the carbon content of the singleparticle size fractions are lower 0.01. (a), C/N ratios of POM- and OMF-fraction of C3 and C4 plots at both study sites (b).
A. Gude et al. / Soil Biology & Biochemistry 47 (2012) 209e219212
vegetation, Ct0 as carbon content labeled from C3 vegetation at thetime of the vegetation change t0.
The calculated mean residence time give the average timenecessary to fully label the PLFA with the new plant-derivedcarbon. In case other carbon sources like recycling of soil organicmatter or use of other carbon sources the MRT are used thecalculated MRT overestimate the turnover.
2.9. Calculation of the carbon storage efficiency
Carbon storage efficiency (CSE) is calculated using the followingequation:
CSE ¼ Cst=MRT*i;
with Cst as carbon stock, MRT as mean residence time and i asannual fresh biomass input. Carbon stock divided by mean resi-dence time represents C4 carbon flux.
2.10. Statistical analysis
Two-way analyses of variance (ANOVA) were carried out to testsignificance of observed differences in MRTs of individual PLFAassigned to microbial groups as well as enzyme activity betweenthe size fraction and study sites. If mathematically necessary, datawere log-transformed to improve the normality. The effects of C3and C4 cultivated soils and enzyme activity was evaluated bya one-way ANOVA and Tukey’s Honestly Significant Difference(HSD) test for post hoc multiple comparisons. Since soil fractionsare not independent, the statistical results should be used withcaution. SPSS 16 was used for all statistical calculations.
Table 1Amount of bacterial and fungal biomass as well as total amount of microbial biomass in tfractions and study sites.
Amount of
Total microbialbiomass [mg/g C]a
se Fungal biomass[mg/g C]a
se Bacterial biomass[mg/g C]a
low inputsite
POM 8.04 0.65 5.12 0.43 2.92OMF 0.07 0.01 0.03 0.004 0.03
high inputsite
POM 0.21 0.01 0.19 0.01 0.02OMF 5.80 3.03 3.00 1.43 2.80
a Calculated as mean value between C3 and C4 soils. Standard errors describe differenb Based on the amount of all quantified individual PLFA (nmol/g C).c Without Actinobacteria.
3. Results
3.1. Soil organic matter concentrations and C/N ratios in differentparticle size fractions
Less than 5% of the carbonwas found in the POM-fraction at thelow input site. At the high input treatment, same fraction, only 10%of the C was determined (Fig. 1a). Here highest C/N ratios comparedto all other fractions were found. At the low input treatment, theC/N ratios of the particle size fractions were nearly equal (Fig. 1b).
3.2. Microbial community composition, enzyme activity and fungal/bacterial biomass ratio
The microbial composition varied between the size fractions. Atthe low input site most microbial biomass was found in the (small)POM fraction (Table 1), being dominated by fungal biomass. Incontrast, at the high input site the largest amount of microbialbiomass was detected in the OMF-fractionwith fungal and bacterialbiomass being equally distributed. The POM fraction was domi-nated by fungal biomass, and almost 10 times more fungi thanbacteria were found (Table 1). At the low input site the fungal/bacterial ratios of the OMF- and POM-fractions were nearly iden-tically to the ratio in the OMF-fraction at the high input study,ranging between 1 and 2 (Table 1).
More detailed information about the composition of themicrobial community can be found with the distribution of theindividual PLFAs. In the POM-fraction, fungi weremost abundant atboth study sites, with the highest amounts at the high input site(Table 1). The OMF-fractions at both study sites had a similardistribution of actinobacteria and other Gram-positive bacteria.
he different particle size fractions; distribution of the microbial groups between the
Fungal/bacterialbiomass ratio
sd Distribution of microbial groups [%]b
se Actino-bacteria
Gram-positivebacteriac
Gram-negativebacteria
Fungi
0.33 1.75 0.03 3.17 24.25 8.69 63.890.003 0.98 0.04 7.12 22.60 22.47 47.810.002 9.32 2.02 1.30 8.13 10.21 80.361.61 1.43 0.44 9.56 20.77 55.63 14.04
ces between the soils.
A. Gude et al. / Soil Biology & Biochemistry 47 (2012) 209e219 213
Gram-negative bacteria had more pronounced differences betweenthe POM- and OMF-fractions, and the highest amounts were foundin the OMF-fraction at the high input site (Table 1).
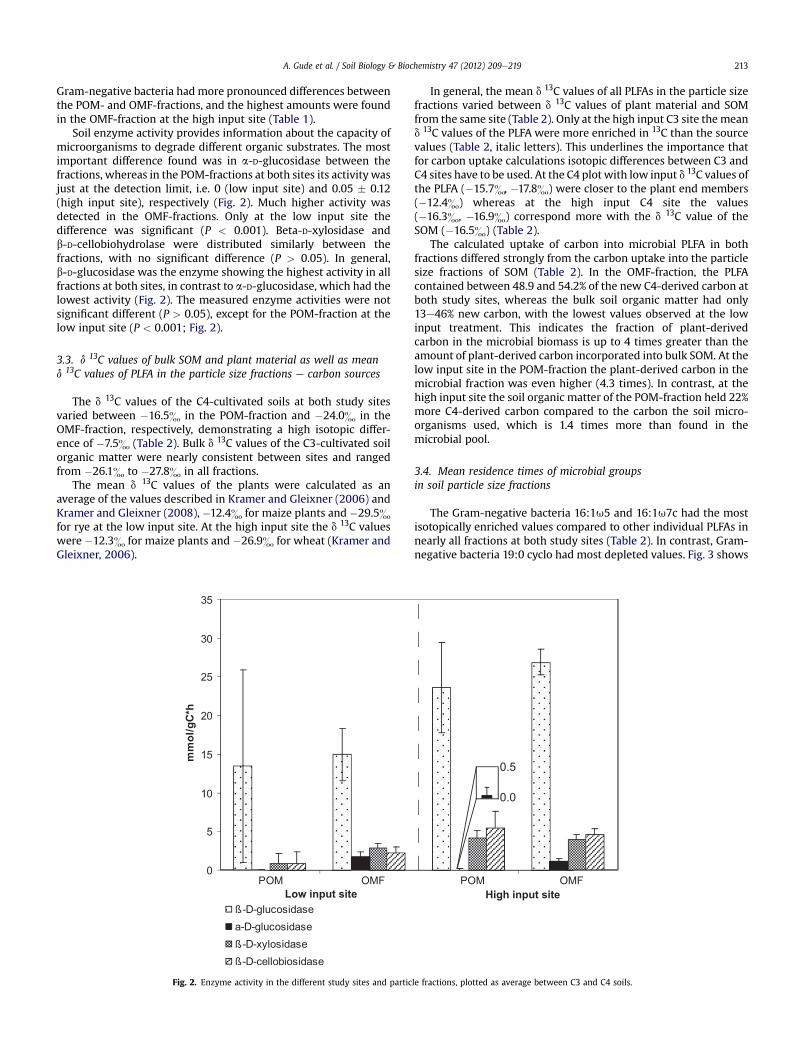
Soil enzyme activity provides information about the capacity ofmicroorganisms to degrade different organic substrates. The mostimportant difference found was in a-D-glucosidase between thefractions, whereas in the POM-fractions at both sites its activity wasjust at the detection limit, i.e. 0 (low input site) and 0.05 � 0.12(high input site), respectively (Fig. 2). Much higher activity wasdetected in the OMF-fractions. Only at the low input site thedifference was significant (P < 0.001). Beta-D-xylosidase andb-D-cellobiohydrolase were distributed similarly between thefractions, with no significant difference (P > 0.05). In general,b-D-glucosidase was the enzyme showing the highest activity in allfractions at both sites, in contrast to a-D-glucosidase, which had thelowest activity (Fig. 2). The measured enzyme activities were notsignificant different (P > 0.05), except for the POM-fraction at thelow input site (P < 0.001; Fig. 2).
3.3. d 13C values of bulk SOM and plant material as well as meand 13C values of PLFA in the particle size fractions e carbon sources
The d 13C values of the C4-cultivated soils at both study sitesvaried between �16.5& in the POM-fraction and �24.0& in theOMF-fraction, respectively, demonstrating a high isotopic differ-ence of �7.5& (Table 2). Bulk d 13C values of the C3-cultivated soilorganic matter were nearly consistent between sites and rangedfrom �26.1& to �27.8& in all fractions.
The mean d 13C values of the plants were calculated as anaverage of the values described in Kramer and Gleixner (2006) andKramer and Gleixner (2008), �12.4& for maize plants and �29.5&for rye at the low input site. At the high input site the d 13C valueswere �12.3& for maize plants and �26.9& for wheat (Kramer andGleixner, 2006).
Fig. 2. Enzyme activity in the different study sites and partic
In general, the mean d 13C values of all PLFAs in the particle sizefractions varied between d 13C values of plant material and SOMfrom the same site (Table 2). Only at the high input C3 site the meand 13C values of the PLFA were more enriched in 13C than the sourcevalues (Table 2, italic letters). This underlines the importance thatfor carbon uptake calculations isotopic differences between C3 andC4 sites have to be used. At the C4 plot with low input d 13C values ofthe PLFA (�15.7&, �17.8&) were closer to the plant end members(�12.4&) whereas at the high input C4 site the values(�16.3&, �16.9&) correspond more with the d 13C value of theSOM (�16.5&) (Table 2).
The calculated uptake of carbon into microbial PLFA in bothfractions differed strongly from the carbon uptake into the particlesize fractions of SOM (Table 2). In the OMF-fraction, the PLFAcontained between 48.9 and 54.2% of the new C4-derived carbon atboth study sites, whereas the bulk soil organic matter had only13e46% new carbon, with the lowest values observed at the lowinput treatment. This indicates the fraction of plant-derivedcarbon in the microbial biomass is up to 4 times greater than theamount of plant-derived carbon incorporated into bulk SOM. At thelow input site in the POM-fraction the plant-derived carbon in themicrobial fraction was even higher (4.3 times). In contrast, at thehigh input site the soil organic matter of the POM-fraction held 22%more C4-derived carbon compared to the carbon the soil micro-organisms used, which is 1.4 times more than found in themicrobial pool.
3.4. Mean residence times of microbial groupsin soil particle size fractions
The Gram-negative bacteria 16:1u5 and 16:1u7c had the mostisotopically enriched values compared to other individual PLFAs innearly all fractions at both study sites (Table 2). In contrast, Gram-negative bacteria 19:0 cyclo had most depleted values. Fig. 3 shows
le fractions, plotted as average between C3 and C4 soils.
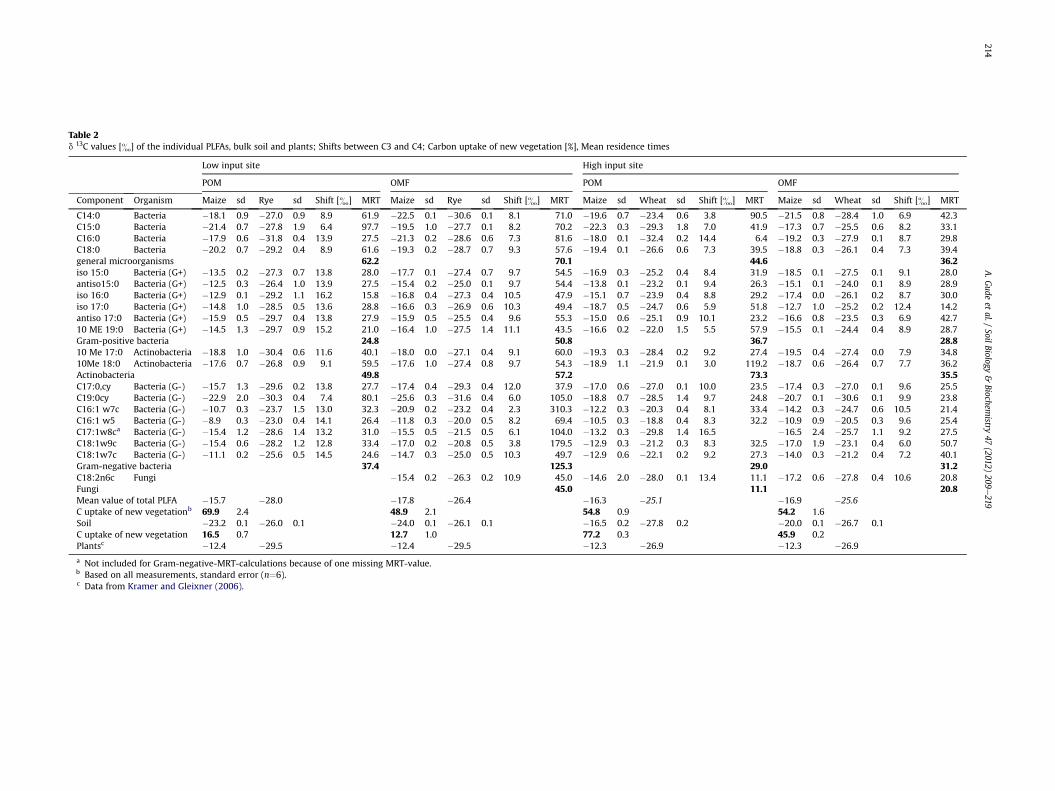
Table 2d 13C values [&] of the individual PLFAs, bulk soil and plants; Shifts between C3 and C4; Carbon uptake of new vegetation [%], Mean residence times
Low input site High input site
POM OMF POM OMF
Component Organism Maize sd Rye sd Shift [&] MRT Maize sd Rye sd Shift [&] MRT Maize sd Wheat sd Shift [&] MRT Maize sd Wheat sd Shift [&] MRT
C14:0 Bacteria �18.1 0.9 �27.0 0.9 8.9 61.9 �22.5 0.1 �30.6 0.1 8.1 71.0 �19.6 0.7 �23.4 0.6 3.8 90.5 �21.5 0.8 �28.4 1.0 6.9 42.3C15:0 Bacteria �21.4 0.7 �27.8 1.9 6.4 97.7 �19.5 1.0 �27.7 0.1 8.2 70.2 �22.3 0.3 �29.3 1.8 7.0 41.9 �17.3 0.7 �25.5 0.6 8.2 33.1C16:0 Bacteria �17.9 0.6 �31.8 0.4 13.9 27.5 �21.3 0.2 �28.6 0.6 7.3 81.6 �18.0 0.1 �32.4 0.2 14.4 6.4 �19.2 0.3 �27.9 0.1 8.7 29.8C18:0 Bacteria �20.2 0.7 �29.2 0.4 8.9 61.6 �19.3 0.2 �28.7 0.7 9.3 57.6 �19.4 0.1 �26.6 0.6 7.3 39.5 �18.8 0.3 �26.1 0.4 7.3 39.4general microorganisms 62.2 70.1 44.6 36.2iso 15:0 Bacteria (G+) �13.5 0.2 �27.3 0.7 13.8 28.0 �17.7 0.1 �27.4 0.7 9.7 54.5 �16.9 0.3 �25.2 0.4 8.4 31.9 �18.5 0.1 �27.5 0.1 9.1 28.0antiso15:0 Bacteria (G+) �12.5 0.3 �26.4 1.0 13.9 27.5 �15.4 0.2 �25.0 0.1 9.7 54.4 �13.8 0.1 �23.2 0.1 9.4 26.3 �15.1 0.1 �24.0 0.1 8.9 28.9iso 16:0 Bacteria (G+) �12.9 0.1 �29.2 1.1 16.2 15.8 �16.8 0.4 �27.3 0.4 10.5 47.9 �15.1 0.7 �23.9 0.4 8.8 29.2 �17.4 0.0 �26.1 0.2 8.7 30.0iso 17:0 Bacteria (G+) �14.8 1.0 �28.5 0.5 13.6 28.8 �16.6 0.3 �26.9 0.6 10.3 49.4 �18.7 0.5 �24.7 0.6 5.9 51.8 �12.7 1.0 �25.2 0.2 12.4 14.2antiso 17:0 Bacteria (G+) �15.9 0.5 �29.7 0.4 13.8 27.9 �15.9 0.5 �25.5 0.4 9.6 55.3 �15.0 0.6 �25.1 0.9 10.1 23.2 �16.6 0.8 �23.5 0.3 6.9 42.710 ME 19:0 Bacteria (G+) �14.5 1.3 �29.7 0.9 15.2 21.0 �16.4 1.0 �27.5 1.4 11.1 43.5 �16.6 0.2 �22.0 1.5 5.5 57.9 �15.5 0.1 �24.4 0.4 8.9 28.7Gram-positive bacteria 24.8 50.8 36.7 28.810 Me 17:0 Actinobacteria �18.8 1.0 �30.4 0.6 11.6 40.1 �18.0 0.0 �27.1 0.4 9.1 60.0 �19.3 0.3 �28.4 0.2 9.2 27.4 �19.5 0.4 �27.4 0.0 7.9 34.810Me 18:0 Actinobacteria �17.6 0.7 �26.8 0.9 9.1 59.5 �17.6 1.0 �27.4 0.8 9.7 54.3 �18.9 1.1 �21.9 0.1 3.0 119.2 �18.7 0.6 �26.4 0.7 7.7 36.2Actinobacteria 49.8 57.2 73.3 35.5C17:0,cy Bacteria (G-) �15.7 1.3 �29.6 0.2 13.8 27.7 �17.4 0.4 �29.3 0.4 12.0 37.9 �17.0 0.6 �27.0 0.1 10.0 23.5 �17.4 0.3 �27.0 0.1 9.6 25.5C19:0cy Bacteria (G-) �22.9 2.0 �30.3 0.4 7.4 80.1 �25.6 0.3 �31.6 0.4 6.0 105.0 �18.8 0.7 �28.5 1.4 9.7 24.8 �20.7 0.1 �30.6 0.1 9.9 23.8C16:1 w7c Bacteria (G-) �10.7 0.3 �23.7 1.5 13.0 32.3 �20.9 0.2 �23.2 0.4 2.3 310.3 �12.2 0.3 �20.3 0.4 8.1 33.4 �14.2 0.3 �24.7 0.6 10.5 21.4C16:1 w5 Bacteria (G-) �8.9 0.3 �23.0 0.4 14.1 26.4 �11.8 0.3 �20.0 0.5 8.2 69.4 �10.5 0.3 �18.8 0.4 8.3 32.2 �10.9 0.9 �20.5 0.3 9.6 25.4C17:1w8ca Bacteria (G-) �15.4 1.2 �28.6 1.4 13.2 31.0 �15.5 0.5 �21.5 0.5 6.1 104.0 �13.2 0.3 �29.8 1.4 16.5 �16.5 2.4 �25.7 1.1 9.2 27.5C18:1w9c Bacteria (G-) �15.4 0.6 �28.2 1.2 12.8 33.4 �17.0 0.2 �20.8 0.5 3.8 179.5 �12.9 0.3 �21.2 0.3 8.3 32.5 �17.0 1.9 �23.1 0.4 6.0 50.7C18:1w7c Bacteria (G-) �11.1 0.2 �25.6 0.5 14.5 24.6 �14.7 0.3 �25.0 0.5 10.3 49.7 �12.9 0.6 �22.1 0.2 9.2 27.3 �14.0 0.3 �21.2 0.4 7.2 40.1Gram-negative bacteria 37.4 125.3 29.0 31.2C18:2n6c Fungi �15.4 0.2 �26.3 0.2 10.9 45.0 �14.6 2.0 �28.0 0.1 13.4 11.1 �17.2 0.6 �27.8 0.4 10.6 20.8Fungi 45.0 11.1 20.8Mean value of total PLFA �15.7 �28.0 �17.8 �26.4 �16.3 �25.1 �16.9 �25.6C uptake of new vegetationb 69.9 2.4 48.9 2.1 54.8 0.9 54.2 1.6Soil �23.2 0.1 �26.0 0.1 �24.0 0.1 �26.1 0.1 �16.5 0.2 �27.8 0.2 �20.0 0.1 �26.7 0.1C uptake of new vegetation 16.5 0.7 12.7 1.0 77.2 0.3 45.9 0.2Plantsc �12.4 �29.5 �12.4 �29.5 �12.3 �26.9 �12.3 �26.9
a Not included for Gram-negative-MRT-calculations because of one missing MRT-value.b Based on all measurements, standard error (n¼6).c Data from Kramer and Gleixner (2006).
A.G
udeet
al./Soil
Biology&
Biochemistry
47(2012)
209e219
214
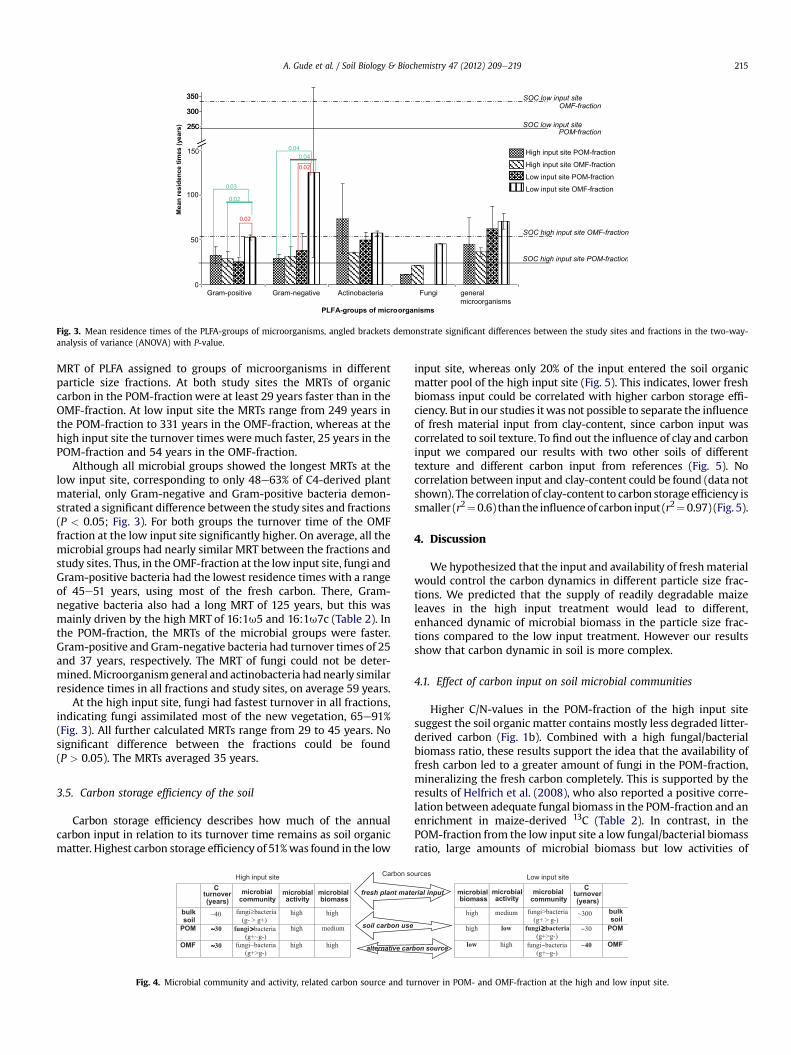
Fig. 3. Mean residence times of the PLFA-groups of microorganisms, angled brackets demonstrate significant differences between the study sites and fractions in the two-way-analysis of variance (ANOVA) with P-value.
A. Gude et al. / Soil Biology & Biochemistry 47 (2012) 209e219 215
MRT of PLFA assigned to groups of microorganisms in differentparticle size fractions. At both study sites the MRTs of organiccarbon in the POM-fraction were at least 29 years faster than in theOMF-fraction. At low input site the MRTs range from 249 years inthe POM-fraction to 331 years in the OMF-fraction, whereas at thehigh input site the turnover times were much faster, 25 years in thePOM-fraction and 54 years in the OMF-fraction.
Although all microbial groups showed the longest MRTs at thelow input site, corresponding to only 48e63% of C4-derived plantmaterial, only Gram-negative and Gram-positive bacteria demon-strated a significant difference between the study sites and fractions(P < 0.05; Fig. 3). For both groups the turnover time of the OMFfraction at the low input site significantly higher. On average, all themicrobial groups had nearly similar MRT between the fractions andstudy sites. Thus, in the OMF-fraction at the low input site, fungi andGram-positive bacteria had the lowest residence times with a rangeof 45e51 years, using most of the fresh carbon. There, Gram-negative bacteria also had a long MRT of 125 years, but this wasmainly driven by the high MRT of 16:1u5 and 16:1u7c (Table 2). Inthe POM-fraction, the MRTs of the microbial groups were faster.Gram-positive and Gram-negative bacteria had turnover times of 25and 37 years, respectively. The MRT of fungi could not be deter-mined.Microorganismgeneral and actinobacteria hadnearly similarresidence times in all fractions and study sites, on average 59 years.
At the high input site, fungi had fastest turnover in all fractions,indicating fungi assimilated most of the new vegetation, 65e91%(Fig. 3). All further calculated MRTs range from 29 to 45 years. Nosignificant difference between the fractions could be found(P > 0.05). The MRTs averaged 35 years.
3.5. Carbon storage efficiency of the soil
Carbon storage efficiency describes how much of the annualcarbon input in relation to its turnover time remains as soil organicmatter. Highest carbon storage efficiency of 51%was found in the low
Fig. 4. Microbial community and activity, related carbon source and tu
input site, whereas only 20% of the input entered the soil organicmatter pool of the high input site (Fig. 5). This indicates, lower freshbiomass input could be correlated with higher carbon storage effi-ciency. But in our studies it was not possible to separate the influenceof fresh material input from clay-content, since carbon input wascorrelated to soil texture. To find out the influence of clay and carboninput we compared our results with two other soils of differenttexture and different carbon input from references (Fig. 5). Nocorrelation between input and clay-content could be found (data notshown). The correlation of clay-content to carbon storage efficiency issmaller (r2¼0.6) than the influenceof carbon input (r2¼0.97) (Fig. 5).
4. Discussion
We hypothesized that the input and availability of freshmaterialwould control the carbon dynamics in different particle size frac-tions. We predicted that the supply of readily degradable maizeleaves in the high input treatment would lead to different,enhanced dynamic of microbial biomass in the particle size frac-tions compared to the low input treatment. However our resultsshow that carbon dynamic in soil is more complex.
4.1. Effect of carbon input on soil microbial communities
Higher C/N-values in the POM-fraction of the high input sitesuggest the soil organic matter contains mostly less degraded litter-derived carbon (Fig. 1b). Combined with a high fungal/bacterialbiomass ratio, these results support the idea that the availability offresh carbon led to a greater amount of fungi in the POM-fraction,mineralizing the fresh carbon completely. This is supported by theresults of Helfrich et al. (2008), who also reported a positive corre-lation between adequate fungal biomass in the POM-fraction and anenrichment in maize-derived 13C (Table 2). In contrast, in thePOM-fraction from the low input site a low fungal/bacterial biomassratio, large amounts of microbial biomass but low activities of
rnover in POM- and OMF-fraction at the high and low input site.
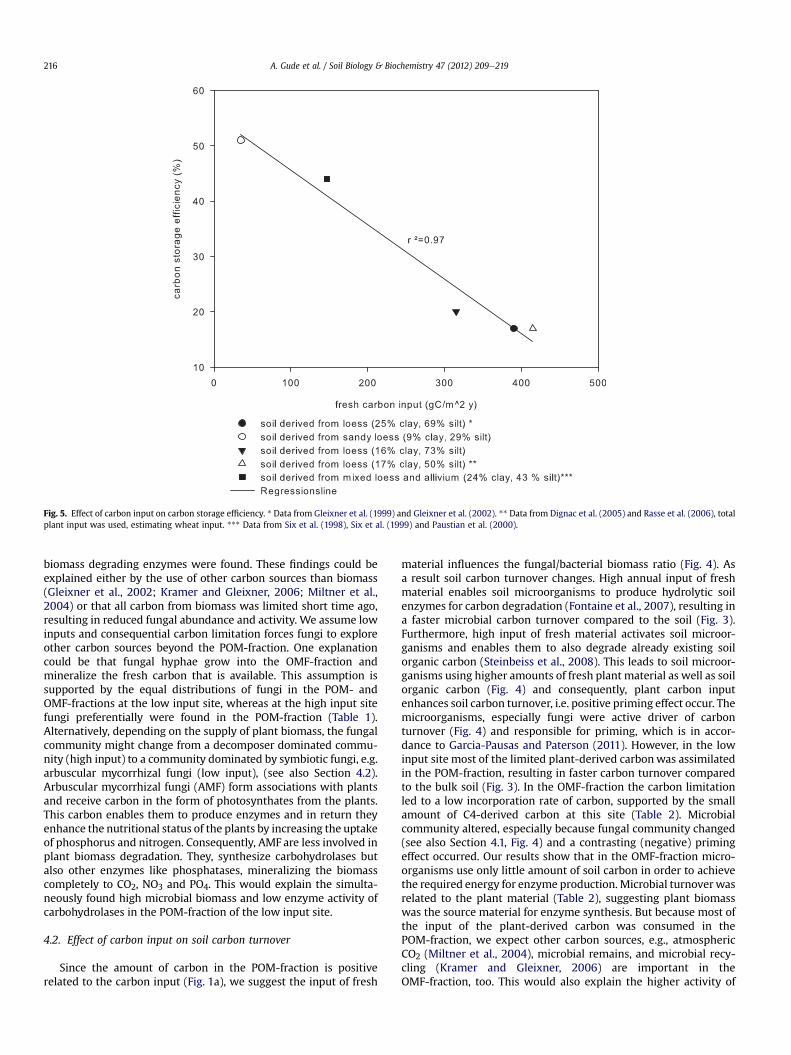
Fig. 5. Effect of carbon input on carbon storage efficiency. * Data from Gleixner et al. (1999) and Gleixner et al. (2002). ** Data from Dignac et al. (2005) and Rasse et al. (2006), totalplant input was used, estimating wheat input. *** Data from Six et al. (1998), Six et al. (1999) and Paustian et al. (2000).
A. Gude et al. / Soil Biology & Biochemistry 47 (2012) 209e219216
biomass degrading enzymes were found. These findings could beexplained either by the use of other carbon sources than biomass(Gleixner et al., 2002; Kramer and Gleixner, 2006; Miltner et al.,2004) or that all carbon from biomass was limited short time ago,resulting in reduced fungal abundance and activity. We assume lowinputs and consequential carbon limitation forces fungi to exploreother carbon sources beyond the POM-fraction. One explanationcould be that fungal hyphae grow into the OMF-fraction andmineralize the fresh carbon that is available. This assumption issupported by the equal distributions of fungi in the POM- andOMF-fractions at the low input site, whereas at the high input sitefungi preferentially were found in the POM-fraction (Table 1).Alternatively, depending on the supply of plant biomass, the fungalcommunity might change from a decomposer dominated commu-nity (high input) to a community dominated by symbiotic fungi, e.g.arbuscular mycorrhizal fungi (low input), (see also Section 4.2).Arbuscular mycorrhizal fungi (AMF) form associations with plantsand receive carbon in the form of photosynthates from the plants.This carbon enables them to produce enzymes and in return theyenhance the nutritional status of the plants by increasing the uptakeof phosphorus and nitrogen. Consequently, AMF are less involved inplant biomass degradation. They, synthesize carbohydrolases butalso other enzymes like phosphatases, mineralizing the biomasscompletely to CO2, NO3 and PO4. This would explain the simulta-neously found high microbial biomass and low enzyme activity ofcarbohydrolases in the POM-fraction of the low input site.
4.2. Effect of carbon input on soil carbon turnover
Since the amount of carbon in the POM-fraction is positiverelated to the carbon input (Fig. 1a), we suggest the input of fresh
material influences the fungal/bacterial biomass ratio (Fig. 4). Asa result soil carbon turnover changes. High annual input of freshmaterial enables soil microorganisms to produce hydrolytic soilenzymes for carbon degradation (Fontaine et al., 2007), resulting ina faster microbial carbon turnover compared to the soil (Fig. 3).Furthermore, high input of fresh material activates soil microor-ganisms and enables them to also degrade already existing soilorganic carbon (Steinbeiss et al., 2008). This leads to soil microor-ganisms using higher amounts of fresh plant material as well as soilorganic carbon (Fig. 4) and consequently, plant carbon inputenhances soil carbon turnover, i.e. positive priming effect occur. Themicroorganisms, especially fungi were active driver of carbonturnover (Fig. 4) and responsible for priming, which is in accor-dance to Garcia-Pausas and Paterson (2011). However, in the lowinput site most of the limited plant-derived carbonwas assimilatedin the POM-fraction, resulting in faster carbon turnover comparedto the bulk soil (Fig. 3). In the OMF-fraction the carbon limitationled to a low incorporation rate of carbon, supported by the smallamount of C4-derived carbon at this site (Table 2). Microbialcommunity altered, especially because fungal community changed(see also Section 4.1, Fig. 4) and a contrasting (negative) primingeffect occurred. Our results show that in the OMF-fraction micro-organisms use only little amount of soil carbon in order to achievethe required energy for enzyme production. Microbial turnoverwasrelated to the plant material (Table 2), suggesting plant biomasswas the source material for enzyme synthesis. But because most ofthe input of the plant-derived carbon was consumed in thePOM-fraction, we expect other carbon sources, e.g., atmosphericCO2 (Miltner et al., 2004), microbial remains, and microbial recy-cling (Kramer and Gleixner, 2006) are important in theOMF-fraction, too. This would also explain the higher activity of
A. Gude et al. / Soil Biology & Biochemistry 47 (2012) 209e219 217
a-D-glucosidase here compared to the POM-fractions. We supportthe idea, that microbial residues might be an alternative substratefor a-D-glucosidase (Poll et al., 2003), since this enzyme also splitscarbohydrates from glycoproteins and glycolipids in bacterial cellwalls and from glycogen, the bacterial storage carbohydrate.
4.3. Effect of carbon input on carbon turnover of microbial groups
In accordance with the different inputs, we predicted that themean residence times (MRT) of the microbial groups would differbetween input treatments and particle size fractions. Unexpectedly,the concentrations of fungal markers were to low for reliable d 13Cmeasurements in the POM-fraction of the low input site and there-fore the MRT of the fungi could not be completely described. Wehypothesize the turnover is slower than at the high input treatment,due to lower inputs of plant material and the low influence ofC4-derived carbon in the POM-fraction (Table 1). At the high inputsite, we observed that an intact fungal community was associatedwith fresh labile carbon,which also appeared to be important for theincorporation of fresh carbon into the soil. Thus, the fast turnover offungi (Fig. 3) at the high input treatment, especially in thePOM-fraction, supports our assumption that fungi were moreimportant than bacteria for decomposing fresh litter material(Rubino et al., 2009). In addition, the MRT of fungi depend on freshcarbon input.
However, contrary to our prediction of input relatedMRT in othermicrobial groups we found that only Gram-negative and Gram-positive bacteria had significantly different MRT between the inputtreatments and only at the low input site between the fractions.Depending on substrate availability, Gram-positive and Gram-negative bacteria use different carbon sources (Kramer andGleixner, 2008). Gram-positive were suggested to be more wide-spread found in soils, degrading complex substrates like SOC, whileGram-negative bacteriaweremore root associated, relying on simplecarbon sources like exudates (Bird et al., 2011). This results indifferentMRTof the carbon in themicrobial extracts. If there is a highinput of litter carbon into the soil, Gram-positive bacteria will alsobenefit from fresh carbon source. In this case we assume the MRT ofboth bacterial groups would be equal. This is supported by our datashowing both similar amounts of Gram-positive and Gram-negativemarkers in the POM-fraction as well as similar MRT, which alsomatched the age of the SOC at the high input site (Fig. 3 and Table 1).In the OMF-fraction the higher amount of Gram-negative bacteriamight be a result of positive priming, stimulating soil microbes andleading to higher MRT, but the higher MRT does not match ourresults. Hence, we rather suggest a combined carbon source: soilorganic carbon, plant-derived carbon and microbial remains.
The low input treatment was correlated with a fast MRT of soilmicroorganisms and low C4-derived carbon incorporation into thesoil, suggesting that microbes use fresh plant material with onlylittle degree of microbial decomposition as their carbon source(comp. Bol et al., 2009). But, slower MRT of carbon in both groups,Gram-negative and Gram-positive bacteria together with a higherproportion of Gram-positive bacteria and higher activity ofa-D-glucosidase in the OMF-fraction indicate that the carbon usedin this fraction is not directly from plant litter but from Cwhichwasalready considerably modified by soil microbes (resynthesis, recy-cling). This would nicely explain the presence of labile compoundswith high turnover times (Amelung et al., 2008; Gleixner et al.,2002; Kramer and Gleixner, 2006).
4.4. Effect of carbon input on carbon turnover of individual PLFA
Our data showed that fatty acids markers for Gram-negativebacteria, 16:1u5, 16:1u7 and 18:1u9c, had most enriched d 13C
values compared to other individual PLFA in nearly all fractions atboth study sites, opposite is 19:0 cyclo. Two of the individual PLFAwere known to be produced by bacteria as well as either (sapro-phytic) fungi (18:1u9c) or arbuscular mycorrhizal fungi (16:1u5)(Myers et al., 2001; Pennanen et al., 1996; Vestal and White, 1989).Especially at the low input study site these PLFAs had fast MRT(average 30 years) and a similar proportion (data not shown) asdescribed in Rillig et al. (2006) for arbuscular mycorrhizal fungi.This finding is in accordance with the high proportion of fungi atthis study site (Table 1), especially since rye and maize are colo-nized bymycorrhiza (Gollner et al., 2011; Tarkalson et al., 1998), butalso agree with the different efficiency of fungi, compared to thehigh input study. Low input favors specialized arbuscular mycor-rhizal fungi, which are able to interact in symbiotic relationshipwith plants in case of carbon limitation. Therefore we assume thesePLFAs rather associated with arbuscular mycorrhizal fungi thanwith Gram-negative bacteria at this study site. In contrast, thed 13C-value of 19:0 cyclo combined with the highest MRT indicatesno involvement into substrate decomposition. The high variableMRT of individual gram-negative PLFA bacteria suggest a criticalview for grouping of soil microorganisms. In future investigationsa single view of individual PLFA is recommended.
4.5. Effect of carbon input on carbon storage efficiency of the bulksoil
Our results showed no correlation of clay-content and carbonstorage efficiency could be found (Fig. 5). Assuming that the carbonstorage efficiency reflects the microbial respiration efficiency, thisfinding indicates that microorganisms respire less carbon if onlylimited carbon amounts are available. Consequently, with carbonlimitation the microorganisms are more efficient. These findingssupport our former results: carbon limitation forces microorgan-isms to use other carbon sources and suggests microbial recyclingas an important factor in soil carbon dynamics.
5. Conclusions
We conclude that supply and availability of fresh material inputdrives soil carbon dynamics. It leads to different distribution ofmicrobial biomass, differentmicrobial community composition anddifferent enzyme activity. Furthermore, carbon limitation supportshigher microbial efficiency and results in a negative priming effecton carbon turnover. Higher annual input leads to amicrobial carbonturnover that corresponds with the soil. Lower input forced the soilmicroorganisms to explore other alternative carbon sources.Overall the microbial carbon turnover was nearly similar in allgroups and fractions, but much faster than the SOC turnover.Microbial community in fact prefers easy available carbonsubstrates and compounds. Carbon limitation favors alternativecarbon sources.
Acknowledgments
The authors would like to thank Steffen Rühlow for the helpduring stable isotope analysis, Heike Geilmann from the ISOLABgroup of MPI-BGC for the stable isotope measurements of the soilmaterial and Doreen Berner for measurements of enzymes activi-ties. We also like to thank Susan Trumbore for her useful contri-bution and discussion and to reviewer1 for the valuablecontribution improving our manuscript. This study was supportedby the German Research Foundation (DFG), project Gl262/4 of thepriority program SPP 1090.
A. Gude et al. / Soil Biology & Biochemistry 47 (2012) 209e219218
References
Amelung, W., Brodowski, S., Sandhage-Hofmann, A., Bol, R., 2008. Combiningbiomarker with stable isotope analyses for assessing the transformation andturnover of soil organic matter. Advances in Agronomy 100 (100), 155e250.
Bååth, E., 1994. Thymidine and leucine incorporation in soil bacteria with differentcell-size. Microbial Ecology 27, 267e278.
Bach, L.H., Frostegård, Å., Ohlson, M., 2008. Variation in soil microbial communitiesacrossaboreal spruce forest landscape.Canadian JournalofForestResearcheRevueCanadienne De Recherche Forestiere 38, 1504e1516.
Balesdent, J., Mariotti, A., 1996. Measurement of soil organic matter turnover using13C natural abundance. In: Boutton, T.W., Yamasaki, S. (Eds.), Mass Spectrometryof Soils. Marcel Dekker, Inc., New York, pp. 83e111.
Bird, J.A., Herman, D.J., Firestone, M.K., 2011. Rhizosphere priming of soil organicmatter by bacterial groups in a grassland soil. Soil Biology & Biochemistry 43,718e725.
Bligh, E.G., Dyer, W.J., 1959. A rapid method of total lipid extraction and purification.Canadian Journal of Biochemistry and Physiology 37, 911e917.
Bol, R., Poirier, N., Balesdent, J., Gleixner, G., 2009. Molecular turnover time of soilorganic matter in particle-size fractions of an arable soil. Rapid Communica-tions in Mass Spectrometry 23, 2551e2558.
Coplen, T.B., Brand, W.A., Gehre, M., Groning, M., Meijer, H.A.J., Toman, B.,Verkouteren, R.M., 2006a. After two decades a second anchor for the VPDBdelta C-13 scale. Rapid Communications in Mass Spectrometry 20, 3165e3166.
Coplen, T.B., Brand, W.A., Gehre, M., Groning, M., Meijer, H.A.J., Toman, B.,Verkouteren, R.M., 2006b. New guidelines for delta C-13 measurements.Analytical Chemistry 78, 2439e2441.
Derrien, D., Marol, C., Balabane, M., Balesdent, J., 2006. The turnover of carbohydratecarbon in a cultivated soil estimated by C-13 natural abundances. EuropeanJournal of Soil Science 57, 547e557.
Dignac, M.F., Bahri, H., Rumpel, C., Rasse, D.P., Bardoux, G., Balesdent, J., Girardin, C.,Chenu, C., Mariotti, A., 2005. Carbon-13 natural abundance as a tool to study thedynamics of lignin monomers in soil: an appraisal at the Closeaux experimentalfield (France). Geoderma 128, 3e17.
Flessa, H., Amelung, W., Helfrich, M., Wiesenberg, G.L.B., Gleixner, G., Brodowski, S.,Rethemeyer, J., Kramer, C., Grootes, P.M., 2008. Storage and stability of organicmatter and fossil carbon in a Luvisol and Phaeozem with continuous maizecropping: a synthesis. Journal of Plant Nutrition and Soil Science e Zeitschriftfür Pflanzenernährung und Bodenkunde 171, 36e51.
Fontaine, S., Bardoux, G., Abbadie, L., Mariotti, A., 2004. Carbon input to soil maydecrease soil carbon content. Ecology Letters 7, 314e320.
Fontaine, S., Barot, S., Barre, P., Bdioui, N., Mary, B., Rumpel, C., 2007. Stability oforganic carbon in deep soil layers controlled by fresh carbon supply. Nature 450277eU210.
Frostegård, Å., Bååth, E., 1996. The use of phospholipid fatty acid analysis toestimate bacterial and fungal biomass in soil. Biology and Fertility of Soils 22,59e65.
Garcia-Pausas, J., Paterson, E., 2011. Microbial community abundance and structureare determinants of soil organic matter mineralisation in the presence of labilecarbon. Soil Biology & Biochemistry 43, 1705e1713.
Gleixner, G., Bol, R., Balesdent, J., 1999. Molecular insight into soil carbon turnover.Rapid Communications in Mass Spectrometry 13, 1278e1283.
Gleixner, G., Czimczik, C., Kramer, C., Lühker, B., Schmidt, M., 2001. Plantcompounds and their turnover and stabilization as soil organic matter. In:Schulze, E.-D., Heimann, M., Harrison, S.P. (Eds.), Global Biogeochemical Cyclesin the Climate Systems. Academic Press, pp. 201e215.
Gleixner, G., Poirier, N., Bol, R., Balesdent, J., 2002. Molecular dynamics of organicmatter in a cultivated soil. Organic Geochemistry 33, 357e366.
Gollner, M.J., Wagentristl, H., Liebhard, P., Friedel, J.K., 2011. Yield and arbuscularmycorrhiza of winter rye in a 40-year fertilisation trial. Agronomy forSustainable Development 31, 373e378.
Grandy, A., Sinsabaugh, R., Neff, J., Stursova, M., Zak, D., 2008. Nitrogen depositioneffects on soil organic matter chemistry are linked to variation in enzymes,ecosystems and size fractions. Biogeochemistry 91, 37e49.
Habekost, M., Eisenhauer, N., Scheu, S., Steinbeiss, S., Weigelt, A., Gleixner, G., 2008.Seasonal changes in the soil microbial community in a grassland plant diversitygradient four years after establishment. Soil Biology & Biochemistry 40,2588e2595.
Helfrich, M., Ludwig, B., Potthoff, M., Flessa, H., 2008. Effect of litter quality and soilfungi on macroaggregate dynamics and associated partitioning of litter carbonand nitrogen. Soil Biology & Biochemistry 40, 1823e1835.
John, B., Yamashita, T., Ludwig, B., Flessa, H., 2005. Storage of organic carbon inaggregate and density fractions of silty soils under different types of land use.Geoderma 128, 63e79.
Kandeler, E., Palli, S., Stemmer, M., Gerzabek, M.H., 1999. Tillage changes microbialbiomass and enzyme activities in particle-size fractions of a Haplic Chernozem.Soil Biology & Biochemistry 31, 1253e1264.
Kirchmann, H., Haberhauer, G., Kandeler, E., Sessitsch, A., Gerzabek, M.H., 2004.Effects of level and quality of organic matter input on carbon storage andbiological activity in soil: synthesis of a long-term experiment. Global Biogeo-chemical Cycles 18, 1e9.
Klamer, M., Bååth, E., 2004. Estimation of conversion factors for fungal biomassdetermination in compost using ergosterol and PLFA 18: 2 omega 6,9. SoilBiology & Biochemistry 36, 57e65.
Kleber, M., Sollins, P., Sutton, R., 2007. A conceptual model of organo-mineralinteractions in soils: self-assembly of organic molecular fragments into zonalstructures on mineral surfaces. Biogeochemistry 85, 9e24.
Kögel-Knabner, I., 2002. The macromolecular organic composition of plant andmicrobial residues as inputs to soil organic matter. Soil Biology & Biochemistry34, 139e162.
Kögel-Knabner, I., Ekschmitt, K., Flessa, H., Guggenberger, G., Matzner, E.,Marschner, B., von Lützow, M., 2008. An integrative approach of organic matterstabilization in temperate soils: linking chemistry, physics, and biology. Journalof Plant Nutrition and Soil Science e Zeitschrift für Pflanzenernährung undBodenkunde 171, 5e13.
Kramer, C., Gleixner, G., 2006. Variable use of plant- and soil-derived carbon bymicroorganisms in agricultural soils. Soil Biology and Biochemistry 38,3267e3278.
Kramer, C., Gleixner, G., 2008. Soil organic matter in soil depth profiles: distinctcarbon preferences of microbial groups during carbon transformation. SoilBiology & Biochemistry 40, 425e433.
Kroppenstedt, R.M., 1985. Fatty Acid and Menaquinone Analysis of Actinomycetesand Related Organisms, Chemical Methods in Bacterial Systematics. AcademicPress, London, U.K, pp. 173e199.
Kuzyakov, Y., 2010. Priming effects: interactions between living and dead organicmatter. Soil Biology & Biochemistry 42, 1363e1371.
Lechevalier, M.P., 1977. Lipids in bacterial taxonomy e taxonomists view. Crc CriticalReviews in Microbiology 5, 109e210.
Marschner, B., Brodowski, S., Dreves, A., Gleixner, G., Gude, A., Grootes, P.M.,Hamer, U., Heim, A., Jandl, G., Ji, R., Kaiser, K., Kalbitz, K., Kramer, C.,Leinweber, P., Rethemeyer, J., Schaeffer, A., Schmidt, M.W.I., Schwark, L.,Wiesenberg, G.L.B., 2008. How relevant is recalcitrance for the stabilization oforganic matter in soils? Journal of Plant Nutrition and Soil Science e Zeitschriftfür Pflanzenernährung und Bodenkunde 171, 91e110.
Marx, M.C., Wood, M., Jarvis, S.C., 2001. A microplate fluorimetric assay for thestudy of enzyme diversity in soils. Soil Biology & Biochemistry 33, 1633e1640.
Merbach, W., Garz, J., Schliephake, W., Stumpe, H., Schmidt, L., 2000. The long-termfertilization experiments in Halle (Saale), Germany e introduction and survey.Journal of Plant Nutrition and Soil Science e Zeitschrift für Pflanzenernährungund Bodenkunde 163, 629e638.
Miltner, A., Richnow, H.H., Kopinke, F.D., Kastner, M., 2004. Assimilation of CO2 bysoil microorganisms and transformation into soil organic matter. OrganicGeochemistry 35, 1015e1024.
Mudd, J.B., 1980. Phospholipid biosynthesis. In: Stumpf, P.K. (Ed.), Lipids, Structureand Function. The Biochemistry of Plants, A Comprehensive Treatise. AcademicPress Inc., New York.
Myers, R.T., Zak, D.R., White, D.C., Peacock, A., 2001. Landscape-level patterns ofmicrobial community composition and substrate use in upland forest ecosys-tems. Soil Science Society of America Journal 65, 359e367.
North, P.F., 1976. Towards an absolute measurement of soil structural stability usingultrasound. Journal of Soil Science 27, 451e459.
Oades, J.M., 1993. The role of biology in the formation, stabilization and degradationof soil structure. Geoderma 56, 377e400.
Paustian, K., Six, J., Elliott, E.T., Hunt, H.W., 2000. Management options for reducingCO2 emissions from agricultural soils. Biogeochemistry 48, 147e163.
Pennanen, T., Frostegård, Å., Fritze, H., Bååth, E., 1996. Phospholipid fatty acidcomposition and heavy metal tolerance of soil microbial communities alongtwo heavy metal-polluted gradients in coniferous forests. Applied and Envi-ronmental Microbiology 62, 420e428.
Poll, C., Ingwersen, J., Stemmer, M., Gerzabek, M.H., Kandeler, E., 2006. Mechanismsof solute transport affect small-scale abundance and function of soil microor-ganisms in the detritusphere. European Journal of Soil Science 57, 583e595.
Poll, C., Marhan, S., Ingwersen, J., Kandeler, E., 2008. Dynamics of litter carbonturnover and microbial abundance in a rye detritusphere. Soil Biology &Biochemistry 40, 1306e1321.
Poll, C., Thiede, A., Wermbter, N., Sessitsch, A., Kandeler, E., 2003. Micro-scaledistribution of microorganisms and microbial enzyme activities in a soil withlong-term organic amendment. European Journal of Soil Science 54, 715e724.
Rasse, D.P., Mulder, J., Moni, C., Chenu, C., 2006. Carbon turnover kinetics withdepth in a French loamy soil. Soil Science Society of America Journal 70,2097e2105.
Rethemeyer, J., Kramer, C., Gleixner, G., John, B., Yamashita, T., Flessa, H.,Andersen, N., Nadeau, M.J., Grootes, P.M., 2005. Transformation of organicmatter in agricultural soils: radiocarbon concentration versus soil depth. Geo-derma 128, 94e105.
Rillig, M.C., Mummey, D.L., Ramsey, P.W., Klironomos, J.N., Gannon, J.E., 2006.Phylogeny of arbuscular mycorrhizal fungi predicts community composition ofsymbiosis-associated bacteria. Fems Microbiology Ecology 57, 389e395.
Rubino, M., Lubritto, C., D’Onofrio, A., Terrasi, F., Kramer, C., Gleixner, G.,Cotrufo, M.F., 2009. Isotopic evidences for microbiologically mediated anddirect C input to soil compounds from three different leaf litters during theirdecomposition. Environmental Chemistry Letters 7, 85e95.
Schlesinger, W.H., 1977. Carbon balance in terrestrial detritus. Annual Review ofEcology and Systematics 8, 51e81.
Six, J., Conant, R.T., Paul, E.A., Paustian, K., 2002. Stabilization mechanisms of soilorganicmatter: implications for C-saturation of soils. Plant and Soil 241,155e176.
Six, J., Elliott, E.T., Paustian, K., 1999. Aggregate and soil organic matter dynamicsunder conventional and no-tillage systems. Soil Science Society of AmericaJournal 63, 1350e1358.
A. Gude et al. / Soil Biology & Biochemistry 47 (2012) 209e219 219
Six, J., Elliott, E.T., Paustian, K., Doran, J.W., 1998. Aggregation and soil organicmatter accumulation in cultivated and native grassland soils. Soil ScienceSociety of America Journal 62, 1367e1377.
Six, J., Frey, S.D., Thiet, R.K., Batten, K.M., 2006. Bacterial and fungal contributions tocarbon sequestration in agroecosystems. Soil Science Society of America Journal70, 555e569.
Skinner, R.H., Sanderson, M.A., Tracy, B.F., Dell, C.J., 2006. Above- and belowgroundproductivity and soil carbon dynamics of pasture mixtures. Agronomy Journal98, 320e326.
Sollins, P., Homann, P., Caldwell, B.A., 1996. Stabilization and destabilization of soilorganic matter: mechanisms and controls. Geoderma 74, 65e105.
Sollins, P., Kramer, M.G., Swanston, C., Lajtha, K., Filley, T., Aufdenkampe, A.K.,Wagai, R., Bowden, R.D., 2009. Sequential density fractionation across soils ofcontrasting mineralogy: evidence for both microbial- and mineral-controlledsoil organic matter stabilization. Biogeochemistry 96, 209e231.
Steinbeiss, S., Temperton, V.M., Gleixner, G., 2008. Mechanisms of short-term soilcarbon storage in experimental grasslands. Soil Biology & Biochemistry 40,2634e2642.
Stemmer, M., Gerzabek, M.H., Kandeler, E., 1998. Organic matter and enzymeactivity in particle-size fractions of soils obtained after low-energy sonication.Soil Biology & Biochemistry 30, 9e17.
Stephan, A., Meyer, A.H., Schmid, B., 2000. Plant diversity affects culturable soilbacteria in experimental grassland communities. Journal of Ecology 88, 988e998.
Tarkalson, D.D., Jolley, V.D., Robbins, C.W., Terry, R.E., 1998. Mycorrhizal colonizationand nutrition of wheat and sweet corn grown in manure-treated and untreatedtopsoil and subsoil. Journal of Plant Nutrition 21, 1985e1999.
Tisdall, J.M., Oades, J.M., 1982. Organic-matter and water-stable aggregates in soils.Journal of Soil Science 33, 141e163.
Vestal, J.R., White, D.C., 1989. Lipid analysis in microbial ecology e quantitativeapproaches to the study of microbial communities. Bioscience 39, 535e541.
Wardle, D.A., Bonner, K.I., Barker, G.M., Yeates, G.W., Nicholson, K.S., Bardgett, R.D.,Watson, R.N., Ghani, A., 1999. Plant removals in perennial grassland: vegetationdynamics, decomposers, soil biodiversity, and ecosystem properties. EcologicalMonographs 69, 535e568.
White, D.C., Davis, W.M., Nickels, J.S., King, J.D., Bobbie, R.J., 1979. Determination of thesedimentarymicrobial biomassbyextractable lipidphosphate.Oecologia40,51e62.
WRB, 2006. World Reference Base for Soil Resources, second ed. FAO, Rome.Zelles, L., 1997. Phospholipid fatty acid profiles in selected members of soil micro-
bial communities. Chemosphere 35, 275e294.Zelles, L., 1999. Fatty acid patterns of phospholipids and lipopolysaccharides in the
characterisation of microbial communities in soil: a review. Biology and Fertilityof Soils 29, 111e129.