innovative financing workshop - kansas department … financing, ... concessionaire receives...
TRANSCRIPT
Innovative Project Financing /
Alternative Project Delivery
Alternative Delivery Methods for
Infrastructure
March 4, 2010Wyndham Garden Hotel
Public-Private Partnerships (PPPs) Innovative Financing, Alternative Project Delivery
Presented by: Yuval Cohen, PB
Transportation Workshop:
Innovative Project Financing/Alternative DeliveryMarch 4 2010, Overland Park, KS
Transportation Workshop Mar 4 2010
Agenda
Definitions
Alternative Delivery Mechanisms in detail
Why now? Why are these back under consideration?
Where/when have they been tried?
Lessons learned
Resource links
Transportation Workshop Mar 4 2010
Public-Private Partnership (PPP), a form ofAlternative Project (Program) Delivery(APD)
What it is:
Alternative procurement and delivery approach to financing and delivery of a project
Contractual arrangement whereby government entity engages the private sector to do more than it usually does in delivering a public use service or facility
Private sector entity assumes obligations to develop, finance, design, construct, operate and maintain
Transportation Workshop Mar 4 2010
Range of Delivery Options
Range from:
1. Outsourcing – maintenance, operations
2. PPPs – a genuine sharing of risks between public and private sectors under a comprehensive development agreement (CDA)
3. Privatization – asset sale, take over/purchase
Focus today:
PPPs
Collaborative enterprise, joint ventures
Maintain public control + oversight + ownership
Transportation Workshop Mar 4 2010
PPPs or APDs
D – design
B - build
O - operate
F - finance
M - maintain/manage
T - transfer back
All together form elements of PPP
Transportation Workshop Mar 4 2010
O & M (+ manage)
Simplest of partnerships
Publicly owned asset
Operated and maintained under contract with private sector
Control is maintained
Payment via fee to contractor, incentives to perform + penalties for non-performance
Examples: transit systems; wastewater treatment; pavement management
Transportation Workshop Mar 4 2010
D + B
Increasing acceptance nationally
Performance specifications, rather than design specs
Private entity incentive to come up with innovation, cost-effective concept
Can delivery of project be accelerated (portions of D + B can be accomplished simultaneously, therefore quicker)?
Better control over delivered price, fewer change orders?
Transportation Workshop Mar 4 2010
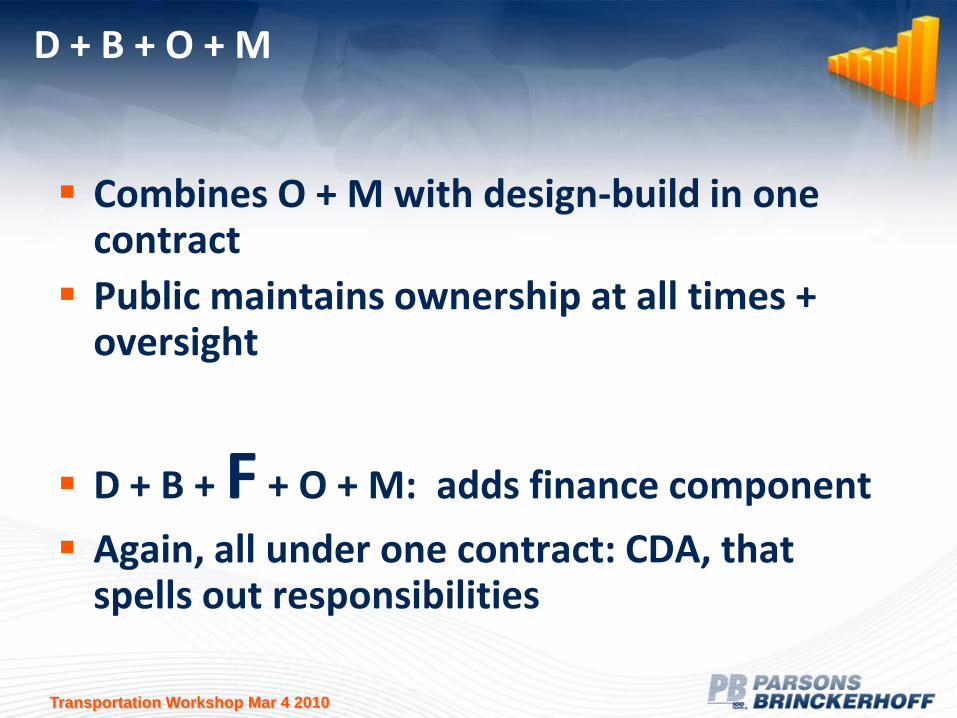
D + B + O + M
Combines O + M with design-build in one contract
Public maintains ownership at all times + oversight
D + B + F + O + M: adds finance component
Again, all under one contract: CDA, that spells out responsibilities
Transportation Workshop Mar 4 2010
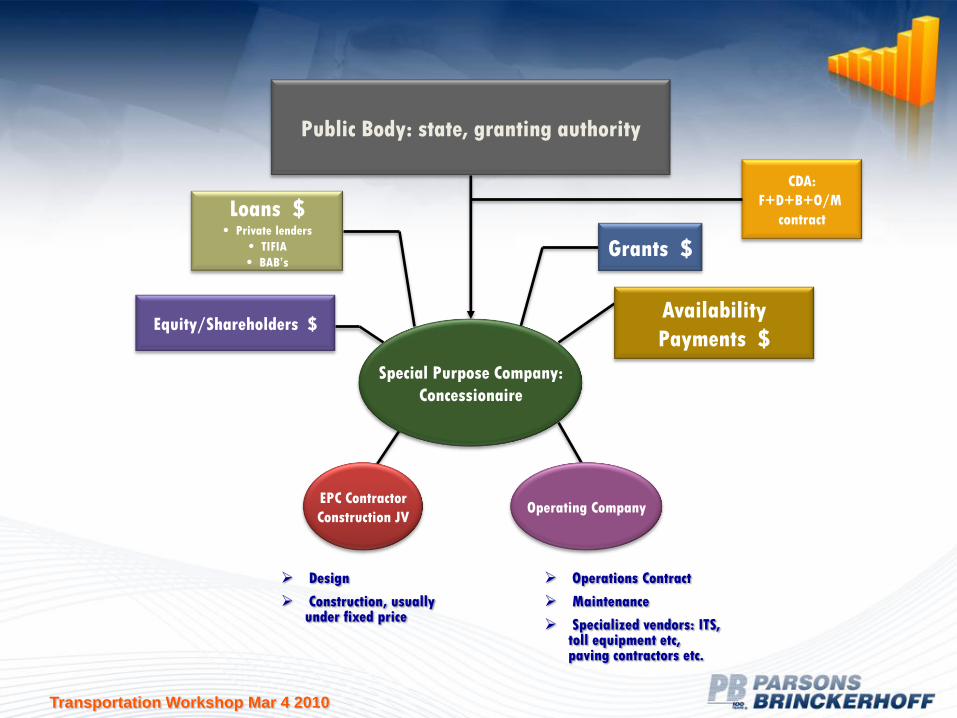
Design
Construction, usually under fixed price
Operations Contract
Maintenance
Specialized vendors: ITS, toll equipment etc, paving contractors etc.
Public Body: state, granting authority
Special Purpose Company:
Concessionaire
Loans $• Private lenders
• TIFIA
• BAB’s
Equity/Shareholders $
EPC Contractor
Construction JVOperating Company
Grants $
Availability
Payments $
CDA:
F+D+B+O/M
contract
Transportation Workshop Mar 4 2010
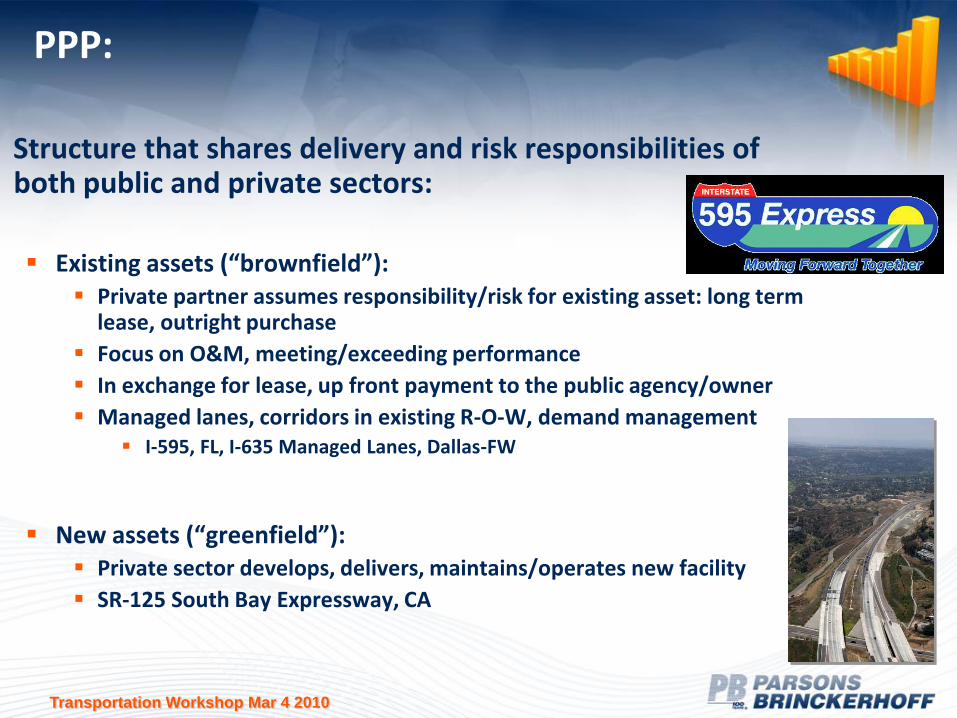
PPP:
Structure that shares delivery and risk responsibilities of both public and private sectors:
Existing assets (“brownfield”): Private partner assumes responsibility/risk for existing asset: long term
lease, outright purchase
Focus on O&M, meeting/exceeding performance
In exchange for lease, up front payment to the public agency/owner
Managed lanes, corridors in existing R-O-W, demand management I-595, FL, I-635 Managed Lanes, Dallas-FW
New assets (“greenfield”): Private sector develops, delivers, maintains/operates new facility
SR-125 South Bay Expressway, CA
Transportation Workshop Mar 4 2010
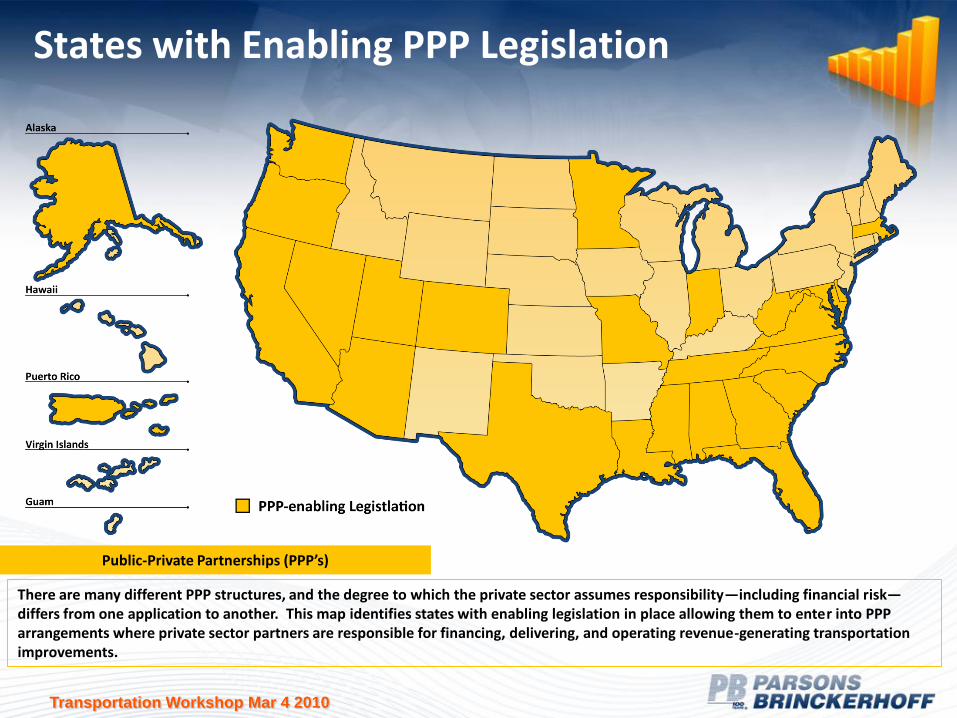
States with Enabling PPP Legislation
There are many different PPP structures, and the degree to which the private sector assumes responsibility—including financial risk—differs from one application to another. This map identifies states with enabling legislation in place allowing them to enter into PPP arrangements where private sector partners are responsible for financing, delivering, and operating revenue-generating transportation improvements.
Public-Private Partnerships (PPP’s)
Transportation Workshop Mar 4 2010
Innovative Financing
Financing methods are not really “innovative”
Instead, this refers to:
Alternative delivery methods where some form of private capital is involved
Combination of private financing and public funding
Financial mechanisms bundled to deliver projects more timely, efficiently, value for money basis
Expanded choice set of available tools
Transportation Workshop Mar 4 2010
Sources of financing (in addition to regular public funding):
Many forms, used in various combinations:
Revenues from performance of asset itself, basis for issuing/repaying DEBT: Farebox, tolls, fees, rates
Joint development
Special federal (US) mechanisms to encourage delivery
Direct private equity investment
Commercial bank loans
Transportation Workshop Mar 4 2010
Mechanisms to Encourage Project Delivery:
Availability payments Public sponsor, state DOT or authority
Supplemented from state highway funds Appropriations based
Annual payment to concessionaire for performance of road
1. Based upon specific project milestones (acceptance payment) Completion of facility by certain deadline or other construction milestones
2. Facility performance standards: Lane availability, incident management metrics Penalties for not meeting metrics:
Lane closures for maintenance, lane availability Snow removal; mowing grass; clearing debris LOS performance can also be used as metric for managed lanes concessions
3. Suitable when inadequate toll revenues to finance lifecycle of construction + O&M costs
4. Less risk to private sector than under full road concessions: little T&R risk Concessionaire receives predictable, fixed set of payments over life of concession Reliance on public agency credit/appropriations
5. Used extensively in Canada, Europe, Australia
Transportation Workshop Mar 4 2010
Mechanisms to Encourage Project Delivery:
Private activity bonds (PAB) Tax exempt bonds issued by public entity for benefit of
private developers who are responsible for repayment
Repayment risk: relying on toll revenues
$2 billion North Tarrant Express managed lanes project, Fort Worth TX (2009): $400m in (senior lien) revenue bond financing
Issued on project’s behalf by Texas PAB Surface Transportation Corporation
Even with risk of managed lanes (toll free alternative is a few feet away)!
Transportation Workshop Mar 4 2010
Mechanisms to Encourage Project Delivery:
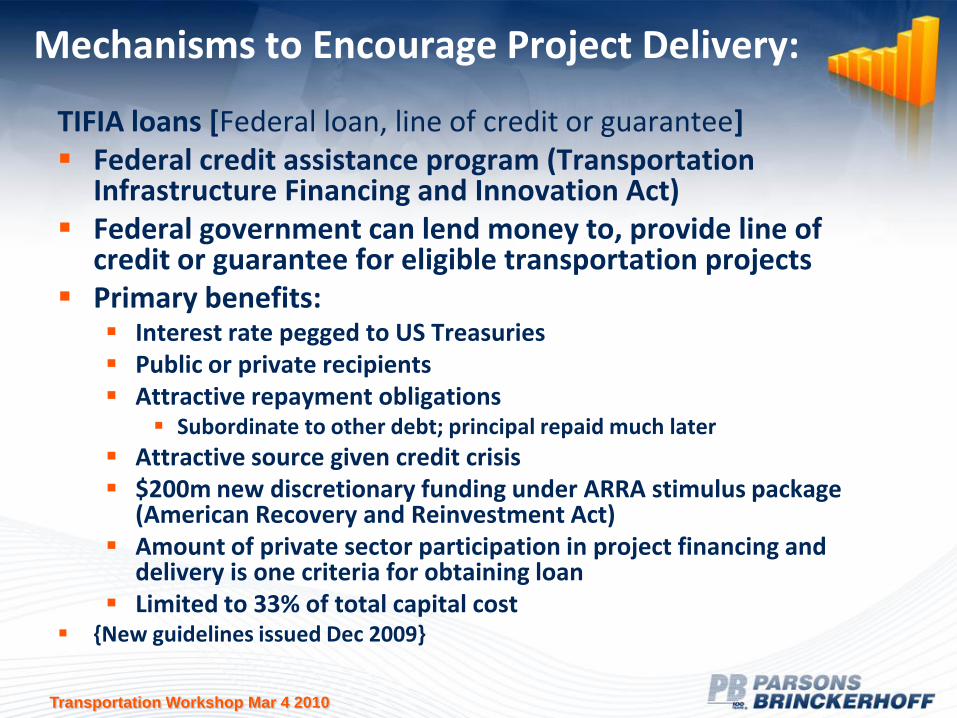
TIFIA loans [Federal loan, line of credit or guarantee] Federal credit assistance program (Transportation
Infrastructure Financing and Innovation Act) Federal government can lend money to, provide line of
credit or guarantee for eligible transportation projects Primary benefits:
Interest rate pegged to US Treasuries Public or private recipients Attractive repayment obligations
Subordinate to other debt; principal repaid much later
Attractive source given credit crisis $200m new discretionary funding under ARRA stimulus package
(American Recovery and Reinvestment Act) Amount of private sector participation in project financing and
delivery is one criteria for obtaining loan Limited to 33% of total capital cost
{New guidelines issued Dec 2009}
Transportation Workshop Mar 4 2010
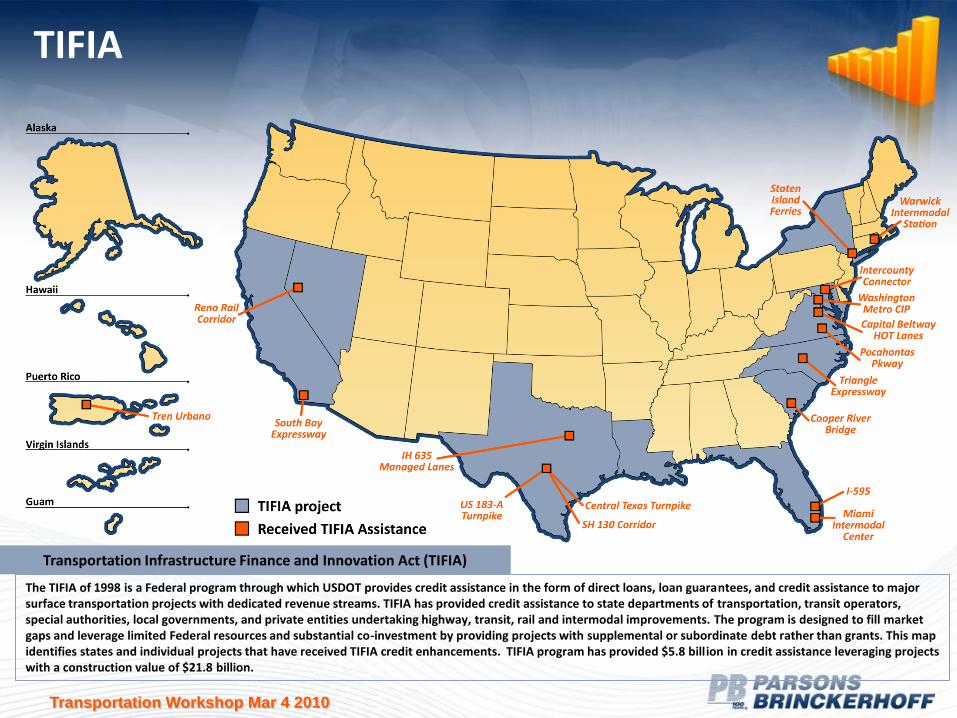
TIFIA
The TIFIA of 1998 is a Federal program through which USDOT provides credit assistance in the form of direct loans, loan guarantees, and credit assistance to major surface transportation projects with dedicated revenue streams. TIFIA has provided credit assistance to state departments of transportation, transit operators, special authorities, local governments, and private entities undertaking highway, transit, rail and intermodal improvements. The program is designed to fill market gaps and leverage limited Federal resources and substantial co-investment by providing projects with supplemental or subordinate debt rather than grants. This map identifies states and individual projects that have received TIFIA credit enhancements. TIFIA program has provided $5.8 billion in credit assistance leveraging projects with a construction value of $21.8 billion.
Transportation Infrastructure Finance and Innovation Act (TIFIA)
Transportation Workshop Mar 4 2010
Mechanisms to Encourage Project Delivery:
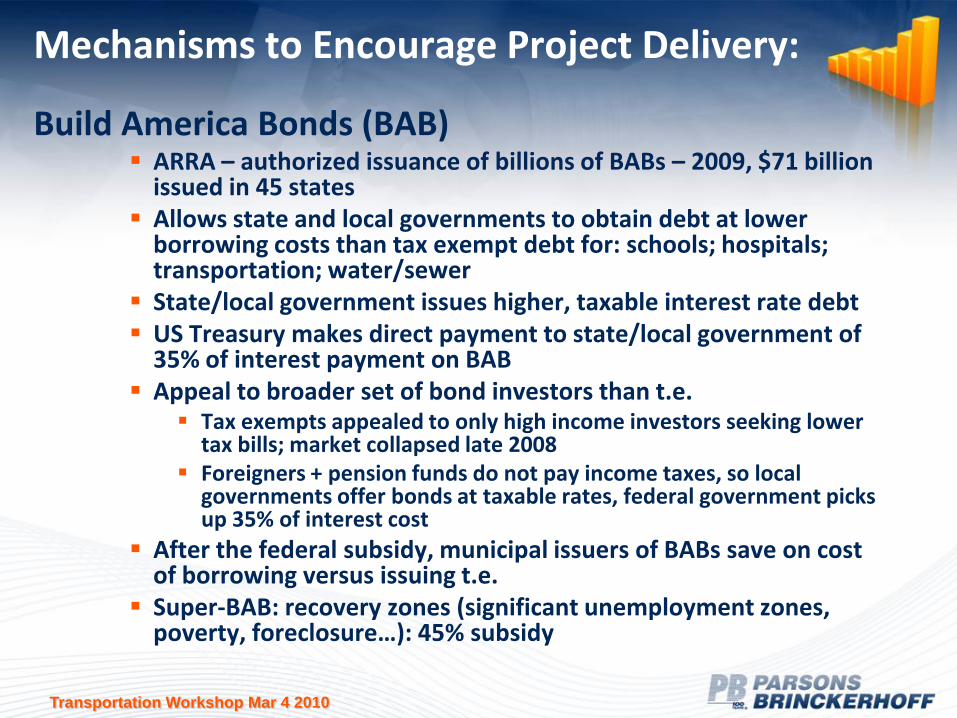
Build America Bonds (BAB) ARRA – authorized issuance of billions of BABs – 2009, $71 billion
issued in 45 states Allows state and local governments to obtain debt at lower
borrowing costs than tax exempt debt for: schools; hospitals; transportation; water/sewer
State/local government issues higher, taxable interest rate debt US Treasury makes direct payment to state/local government of
35% of interest payment on BAB Appeal to broader set of bond investors than t.e.
Tax exempts appealed to only high income investors seeking lower tax bills; market collapsed late 2008
Foreigners + pension funds do not pay income taxes, so local governments offer bonds at taxable rates, federal government picks up 35% of interest cost
After the federal subsidy, municipal issuers of BABs save on cost of borrowing versus issuing t.e.
Super-BAB: recovery zones (significant unemployment zones, poverty, foreclosure…): 45% subsidy
Transportation Workshop Mar 4 2010
Mechanisms to Encourage Project Delivery:
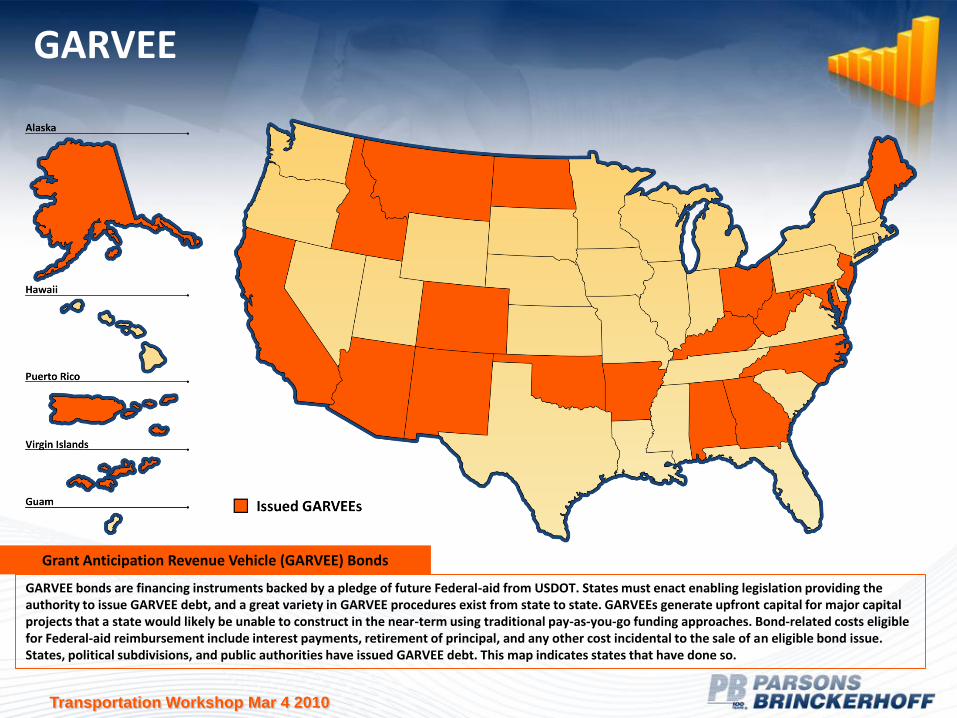
GARVEE
Grant Anticipation Revenue Vehicles
Bonds permit states (and sometimes localities) to repay debt service with future Federal-aid highway apportionments
Used in advance construction to enable using Federal-aid funds to spread payments over useful life of asset (rather than over construction period)
Transportation Workshop Mar 4 2010
GARVEE
GARVEE bonds are financing instruments backed by a pledge of future Federal-aid from USDOT. States must enact enabling legislation providing the authority to issue GARVEE debt, and a great variety in GARVEE procedures exist from state to state. GARVEEs generate upfront capital for major capital projects that a state would likely be unable to construct in the near-term using traditional pay-as-you-go funding approaches. Bond-related costs eligible for Federal-aid reimbursement include interest payments, retirement of principal, and any other cost incidental to the sale of an eligible bond issue. States, political subdivisions, and public authorities have issued GARVEE debt. This map indicates states that have done so.
Grant Anticipation Revenue Vehicle (GARVEE) Bonds
Transportation Workshop Mar 4 2010
Joint Development Mechanisms as a Funding Tool
TOD: transit oriented development Special form of joint development Pedestrian-friendly residential/commercial development near transit
facilities Partnership between private interests with local
governments/agencies Private developer responsible for F + B development on publicly
owned land Benefits: lease rents; capital contributions; development; access;
higher land values; increased tax base
JDA: joint development agreements True partnership, public agency and private developers Develop facilities in return for negotiated payment E.g.: annual ground lease payment Benefits: shared fees, revenues
Transportation Workshop Mar 4 2010
Other Funding Tools
Business improvement districts (BID) BIDs assess properties within defined areas to finance variety of
services (security, maintenance, parking, transportation)
Benefits: property tax assessment revenues
Tax increment financing (TIF) Municipality finances development through increased property taxes
derived from enhanced property values resulting from activities
TIFs can use revenue stream to finance infrastructure (streets etc)
TIF can be debt issued by municipality, repaid from enhanced property value proceeds, provided the development materializes
Benefit: dedicated funding stream to repay debt without increasing tax rates
Transportation Workshop Mar 4 2010
Funding Mechanisms …..
Long-term leases Public agency leases to private concessionaire
Under lease, concessionaire agrees to pay upfront fee to agency in return for right to collect fees (tolls) for 25-99 years
Agrees to operate/maintain facility for lease term
No change in ownership
Benefits: large up-front revenues, transferring risks of operation/financial to private concessionaire
Chicago Skyway (05): $1.8 billion up front in exchange for 99-yr lease
Indiana Toll Road (05): $3.8 b for 75-years, fully funding state’s 10-yr plan + each county in state for local projects
Parking lease: Chicago received $563m for 99-yr lease of 4 garages + $1.2b for 75-yr lease on 36,000 metered spaces
Problem: most of proceeds will be spent before the leases end, temptation to renegotiate/cancel lease as higher tolls/charges kick in
Transportation Workshop Mar 4 2010
“Concessionaire” is key actor
Contracts with government body/agency for a particular project Investment vehicle: either wholly owned, or portion of a joint venture
arrangement Funded by equity investment from parent, lead or other j.v. partners Benefits from proceeds from borrowings raised from debt capital
markets, or commercial bank loan Responsible for developing, building, operating and maintaining asset
under PPP structure Receives income (returns on investment) from ongoing operations:
Hospitals: number of beds available Roads:
Volume of traffic, tolls, toll revenues Availability payment for making facility “available” Shadow tolls/”pass through tolls”: payment for each vehicle counted
Military housing: fees paid directly to concessionaire Prisons: number of inmates (payment for each one served)
Transportation Workshop Mar 4 2010
State Infrastructure Bank (SIB)
State Departments of Transportation use Federal Highway funding to create State Infrastructure Banks (SIBs)
SIBs are revolving loan funds for transportation projects Any private or public entity may apply for SIB credit assistance, for
eligible project Amount of assistance depends on the size of the state’s SIB SIBs vary widely in size: from under $1 million to more than $100 million SIBs can also provide loan guarantees for private loans, or a line of credit Interest rate is set by the state (maximum at market rate, but typically
below or even 0%) Maximum loan term is 35 years (though DOT will usually negotiate for
less) State may be willing to take more risk than a commercial bank Significant public benefits
Transportation Workshop Mar 4 2010
Why now, again?
Funding constraints: Diminishing traditional sources of funding Timing of appropriations cycle, segmented delivery vs integrated Debt capacity of even the best capitalized authorities
Capital needs to renew, replace, maintain, operate Congestion management Highway/transit/port capacity Delivered + clean water needs
Unfunded mandates priorities: Security at ports, environmental
Global credit crisis, effects on municipal tax-exempt borrowing
Desire by private consortia to play more active role in delivering infrastructure Private capital/credit made available up front
Transportation Workshop Mar 4 2010
Benefits of PPPs/APD?
Addresses highway capacity/congestion mitigation earlier Government can leverage its resources better,
accomplishing more projects for the same $’s Raises new investment capital from investors (Dallas Police
& Fire Pension Fund, IH-635 LBJ Freeway, TX) Risk sharing with investors More business like approaches More innovations, packaging, ideas (inc. D/B):
Capital Beltway (VA), proposed 2 HOT lanes instead of state’s concept of 2 HOV lanes, $2 billion cost savings for same capacity
POMT + I-595, Florida
Up front payments from concessionaires ($1/2 billion paid by BRISA/CCR for Northwest Parkway, CO, 99-yr lease)
Faster…..?
Transportation Workshop Mar 4 2010
Value for Money?
Does alternative delivery method ostensibly: Deliver project earlier than design-bid-build, PAYGO approach?
Minimize outlays while sharing risk with private sector?
Accomplish goals more cost effectively, on a present value (future costs and benefits) basis?
How do you analyze this? Estimate costs, schedule, possible revenues etc under
traditional delivery vs. alternative delivery methods
Will potentially higher financing costs and risk premiums be more than offset by: Advancing completion of works; delivering project earlier; other
efficiency gains; lifecycle cost savings, performance gains during operations?
NPV analysis of cost and benefit streams
Transportation Workshop Mar 4 2010
Public Sector Interests Need to be Preserved:
Are delivery, procurement, financing options effective?
Do these methods have potential for value added? Will programs be delivered faster, more cost effectively over life
cycle (value for money analysis)?
Will this approach be attractive to private interests?
Assess risks: technical, market (revenue, patronage), environmental (programmatic), financial
Is there sufficient protection of the public interest? Quality? Safety?
Stability of private sector developers over time?
Transportation Workshop Mar 4 2010
Other Questions…..
Will these mechanisms feature local job creation/preservation?
Roads designed/built to state/local specifications/standards, approvals, monitoring?
Robust environmental process
Basic premise: these are partnerships, not a cessation of public control/oversight/ownership functions……
Transportation Workshop Mar 4 2010
History of PPP/APD in US: Over 200 Years
Private sector has always been involved in delivering U.S. infrastructure Post-Revolutionary War, local authorities faced financial burden of debts
accumulated State governments chartered private companies to construct + deliver
roads “turn the pike”:
US: 3,200 companies successfully financed, built, and operated toll roads, 1792-1902: Private, stock-financed corporations, designed to pay dividends to its
shareholders Higher class of service, stone/packed gravel surface, then wooden planks
(“getting farmers out of the mud”) Faster speeds, shorter travel times to market, for a fee 1st turnpike: Alexandria-Berryville, VA, 1792 1st private turnpike: Philadelphia-Lancaster, PA, 1792 Typical profile:
Relatively high construction costs (<$2,000/mile), 15-40 miles in length Few earned profit, paid out dividends to investors: initial stock offerings paid for
construction; toll receipts then paid for operating expenses Value: not in profits to shareholders, but in providing access to landowners, access to
markets, improved land values
Most successful: private toll bridge companies (Boston’s Charles River Bridge): average annual return of 10.5% for investors (1790s): no toll exemptions, little toll evasion, no conflict over location of toll gates
Transportation Workshop Mar 4 2010
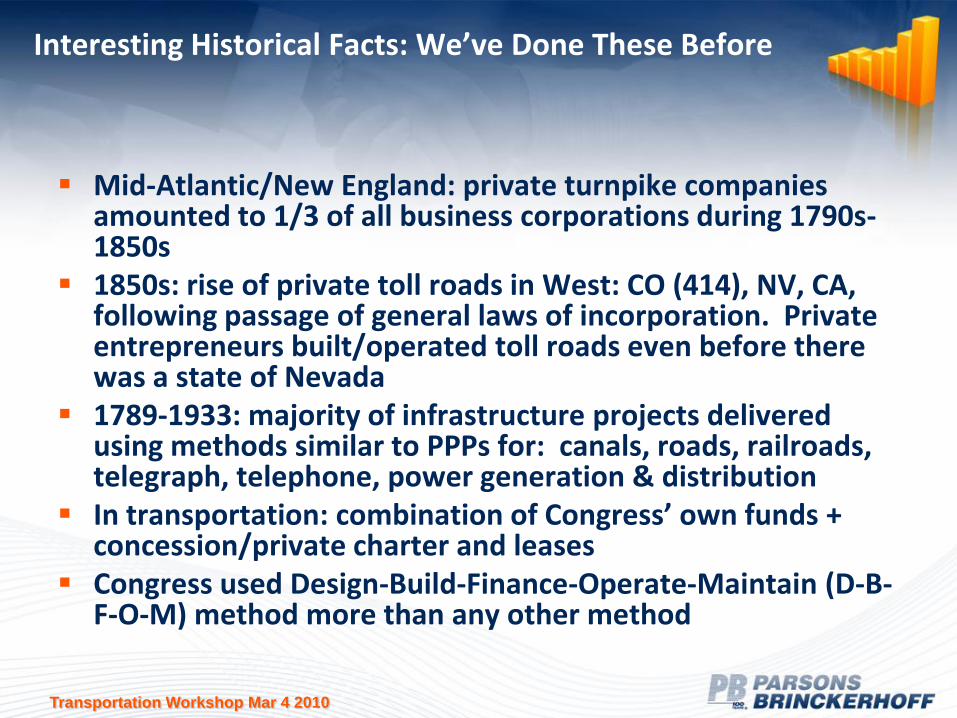
Interesting Historical Facts: We’ve Done These Before
Mid-Atlantic/New England: private turnpike companies amounted to 1/3 of all business corporations during 1790s-1850s
1850s: rise of private toll roads in West: CO (414), NV, CA, following passage of general laws of incorporation. Private entrepreneurs built/operated toll roads even before there was a state of Nevada
1789-1933: majority of infrastructure projects delivered using methods similar to PPPs for: canals, roads, railroads, telegraph, telephone, power generation & distribution
In transportation: combination of Congress’ own funds + concession/private charter and leases
Congress used Design-Build-Finance-Operate-Maintain (D-B-F-O-M) method more than any other method
Transportation Workshop Mar 4 2010
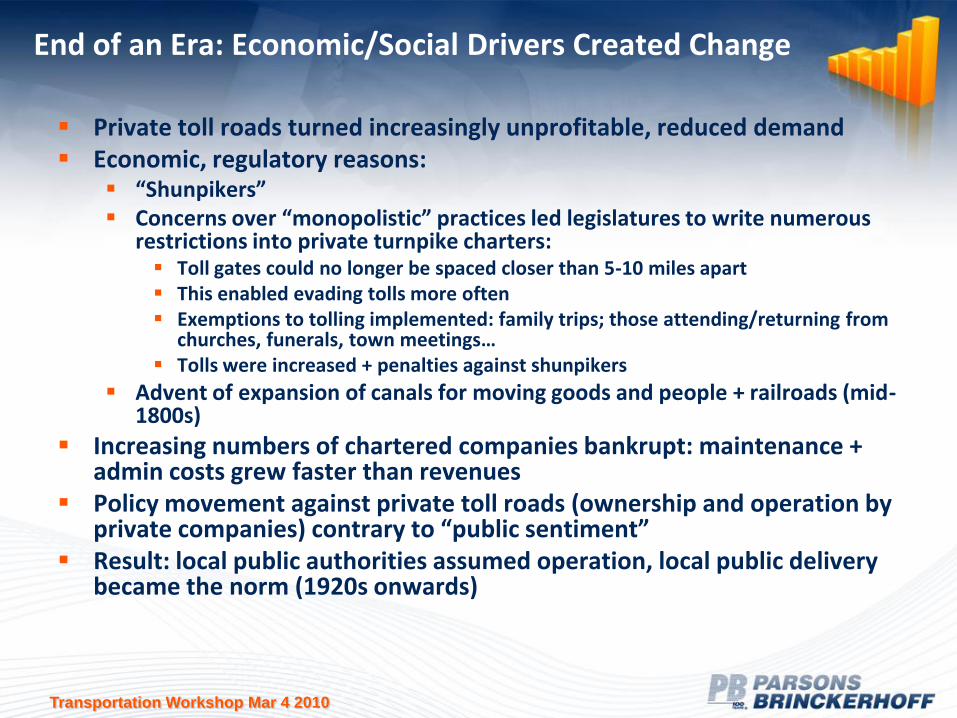
End of an Era: Economic/Social Drivers Created Change
Private toll roads turned increasingly unprofitable, reduced demand Economic, regulatory reasons:
“Shunpikers” Concerns over “monopolistic” practices led legislatures to write numerous
restrictions into private turnpike charters: Toll gates could no longer be spaced closer than 5-10 miles apart This enabled evading tolls more often Exemptions to tolling implemented: family trips; those attending/returning from
churches, funerals, town meetings… Tolls were increased + penalties against shunpikers
Advent of expansion of canals for moving goods and people + railroads (mid-1800s)
Increasing numbers of chartered companies bankrupt: maintenance + admin costs grew faster than revenues
Policy movement against private toll roads (ownership and operation by private companies) contrary to “public sentiment”
Result: local public authorities assumed operation, local public delivery became the norm (1920s onwards)
Transportation Workshop Mar 4 2010
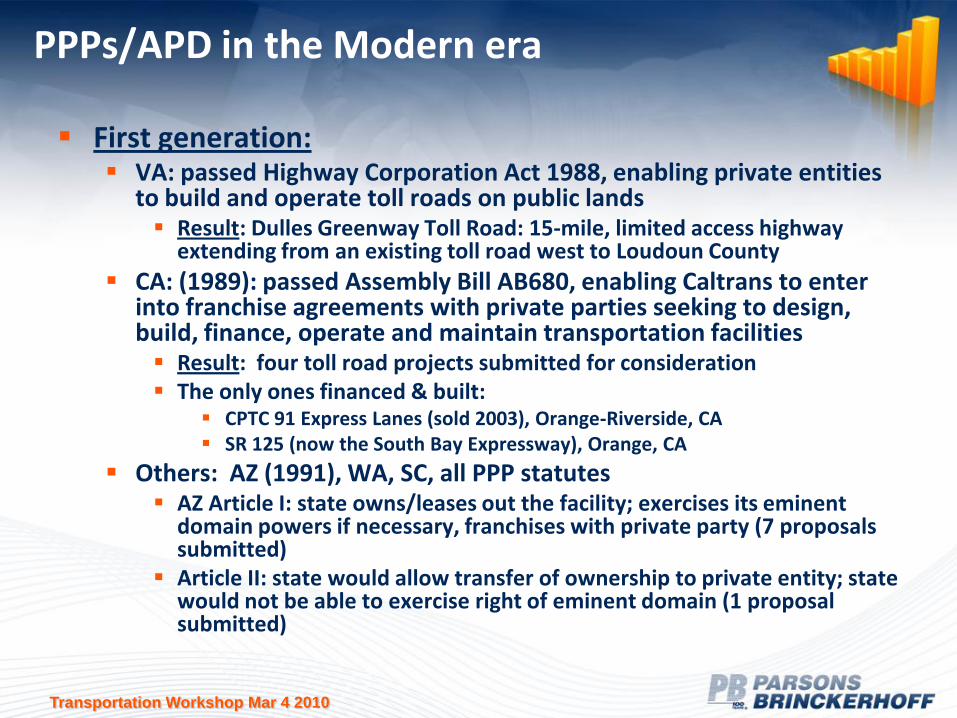
PPPs/APD in the Modern era
First generation: VA: passed Highway Corporation Act 1988, enabling private entities
to build and operate toll roads on public lands Result: Dulles Greenway Toll Road: 15-mile, limited access highway
extending from an existing toll road west to Loudoun County
CA: (1989): passed Assembly Bill AB680, enabling Caltrans to enter into franchise agreements with private parties seeking to design, build, finance, operate and maintain transportation facilities Result: four toll road projects submitted for consideration The only ones financed & built:
CPTC 91 Express Lanes (sold 2003), Orange-Riverside, CA SR 125 (now the South Bay Expressway), Orange, CA
Others: AZ (1991), WA, SC, all PPP statutes AZ Article I: state owns/leases out the facility; exercises its eminent
domain powers if necessary, franchises with private party (7 proposals submitted)
Article II: state would allow transfer of ownership to private entity; state would not be able to exercise right of eminent domain (1 proposal submitted)
Transportation Workshop Mar 4 2010
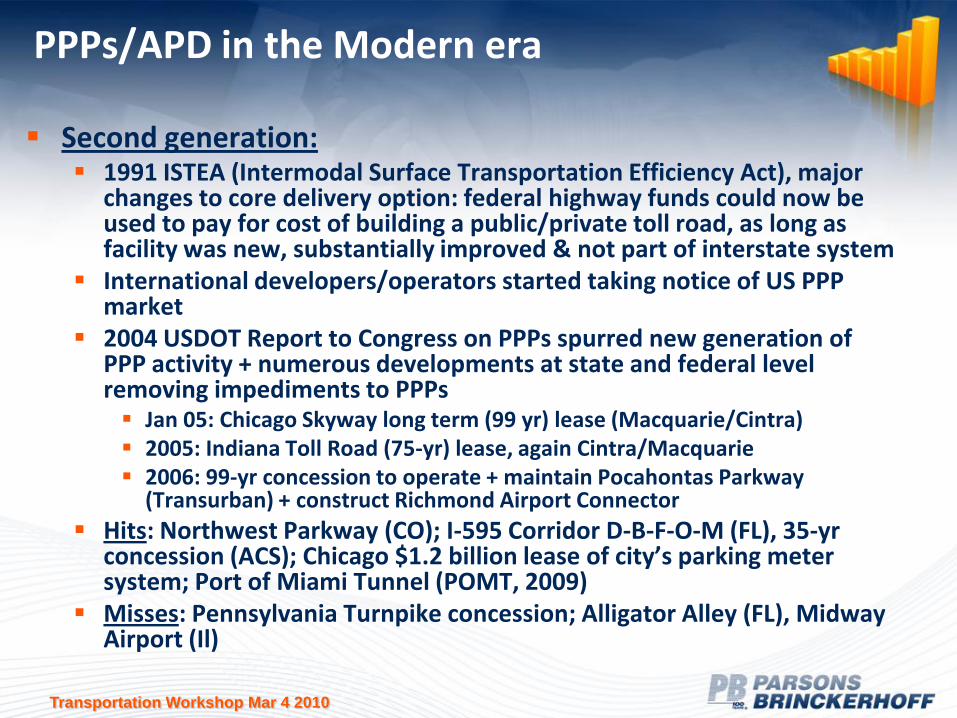
PPPs/APD in the Modern era
Second generation: 1991 ISTEA (Intermodal Surface Transportation Efficiency Act), major
changes to core delivery option: federal highway funds could now be used to pay for cost of building a public/private toll road, as long as facility was new, substantially improved & not part of interstate system
International developers/operators started taking notice of US PPP market
2004 USDOT Report to Congress on PPPs spurred new generation of PPP activity + numerous developments at state and federal level removing impediments to PPPs Jan 05: Chicago Skyway long term (99 yr) lease (Macquarie/Cintra) 2005: Indiana Toll Road (75-yr) lease, again Cintra/Macquarie 2006: 99-yr concession to operate + maintain Pocahontas Parkway
(Transurban) + construct Richmond Airport Connector
Hits: Northwest Parkway (CO); I-595 Corridor D-B-F-O-M (FL), 35-yr concession (ACS); Chicago $1.2 billion lease of city’s parking meter system; Port of Miami Tunnel (POMT, 2009)
Misses: Pennsylvania Turnpike concession; Alligator Alley (FL), Midway Airport (Il)

Transportation Workshop Mar 4 2010
Some Recent Transactions: How to get this done
Florida: I-595 Managed Lanes Upgrade 10.5-mile segment I-595 (AADTs 184,000) Florida DOT signed agreement with I-595 Express LLC, ACS-led consortium: D-B-
O-M project for 35 years $1.8 billion, upgrading current 6-lane highway to include 3 reversible managed
lanes in median, 2/4 auxiliary lanes outside general purpose lanes + others, congestion reliever
In exchange, concessionaire receives annual availability payment of $64m, as long as certain performance metrics are met
DOT collects toll revenues and sets toll rates Private Equity: $207m $607m debt from FHWA TIFIA loan:
Principal repayments scheduled to begin 2031 Subordinate to bank debt. Low rate at 3.64%, 1st interest payment 2014 First disbursement made in March 2009
$780m debt loaned by 12 commercial banks: 10-yr maturity: $255m tranche repaid with proceeds from FDOT availability payments $525m tranche repaid by acceptance payments from FDOT for completion of works
Construction commenced; projected completion 2014
Transportation Workshop Mar 4 2010
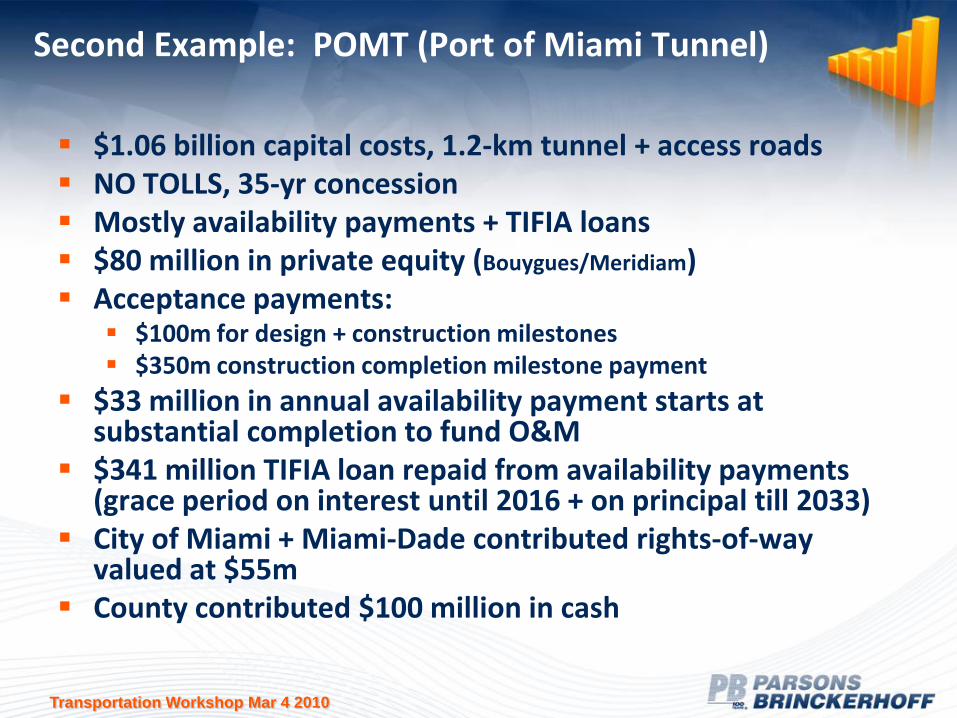
Second Example: POMT (Port of Miami Tunnel)
$1.06 billion capital costs, 1.2-km tunnel + access roads NO TOLLS, 35-yr concession Mostly availability payments + TIFIA loans $80 million in private equity (Bouygues/Meridiam) Acceptance payments:
$100m for design + construction milestones $350m construction completion milestone payment
$33 million in annual availability payment starts at substantial completion to fund O&M
$341 million TIFIA loan repaid from availability payments (grace period on interest until 2016 + on principal till 2033)
City of Miami + Miami-Dade contributed rights-of-way valued at $55m
County contributed $100 million in cash
Transportation Workshop Mar 4 2010
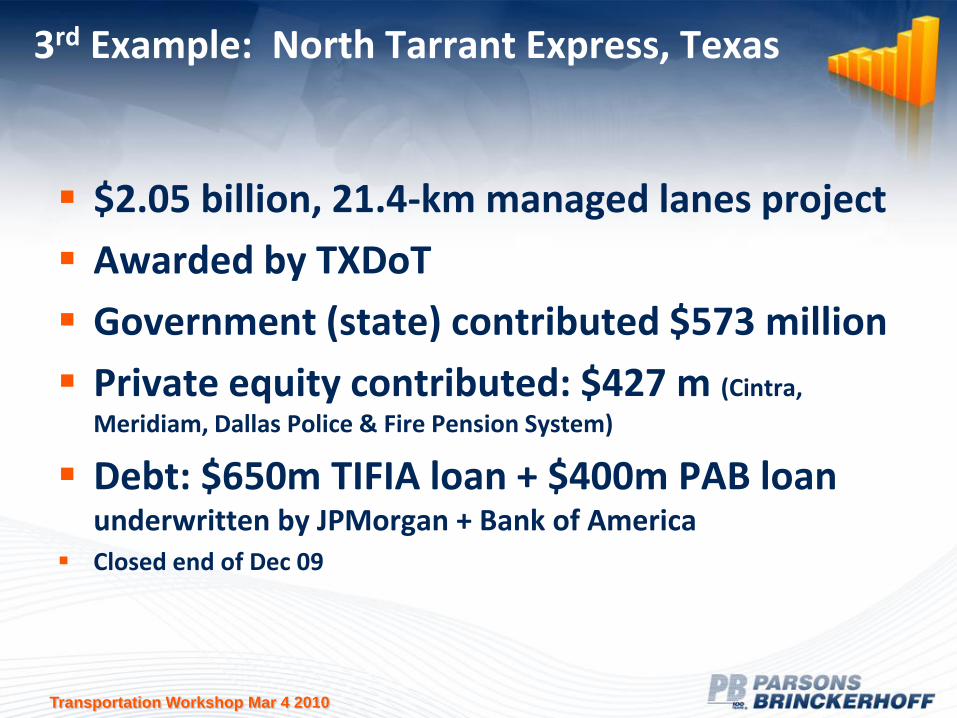
3rd Example: North Tarrant Express, Texas
$2.05 billion, 21.4-km managed lanes project
Awarded by TXDoT
Government (state) contributed $573 million
Private equity contributed: $427 m (Cintra,
Meridiam, Dallas Police & Fire Pension System)
Debt: $650m TIFIA loan + $400m PAB loan underwritten by JPMorgan + Bank of America
Closed end of Dec 09
Transportation Workshop Mar 4 2010
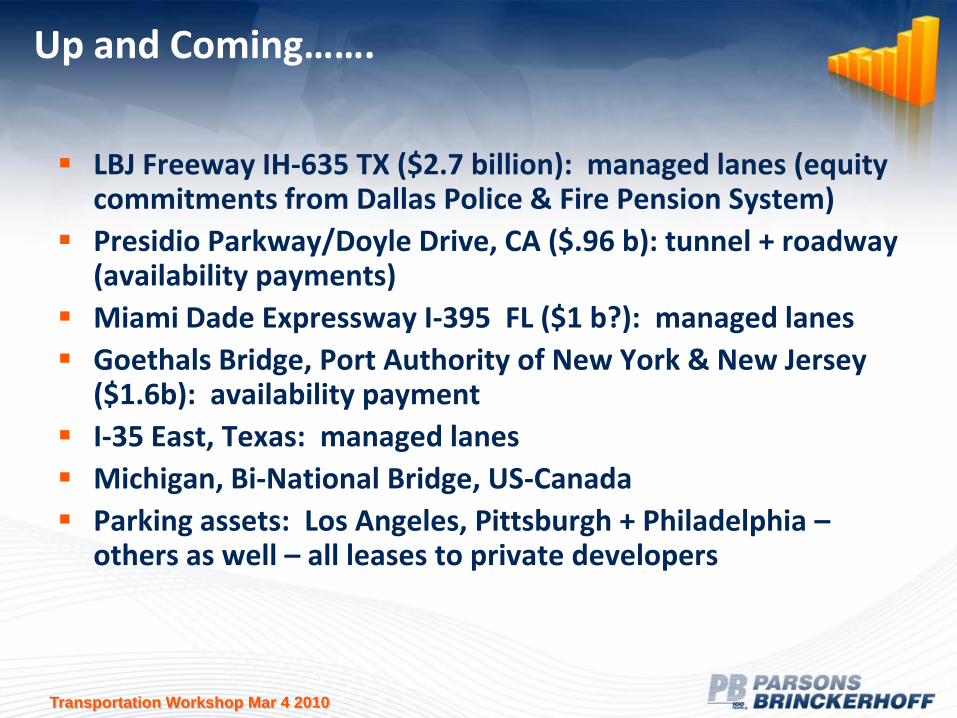
Up and Coming…….
LBJ Freeway IH-635 TX ($2.7 billion): managed lanes (equity commitments from Dallas Police & Fire Pension System)
Presidio Parkway/Doyle Drive, CA ($.96 b): tunnel + roadway (availability payments)
Miami Dade Expressway I-395 FL ($1 b?): managed lanes
Goethals Bridge, Port Authority of New York & New Jersey ($1.6b): availability payment
I-35 East, Texas: managed lanes
Michigan, Bi-National Bridge, US-Canada
Parking assets: Los Angeles, Pittsburgh + Philadelphia –others as well – all leases to private developers
Transportation Workshop Mar 4 2010
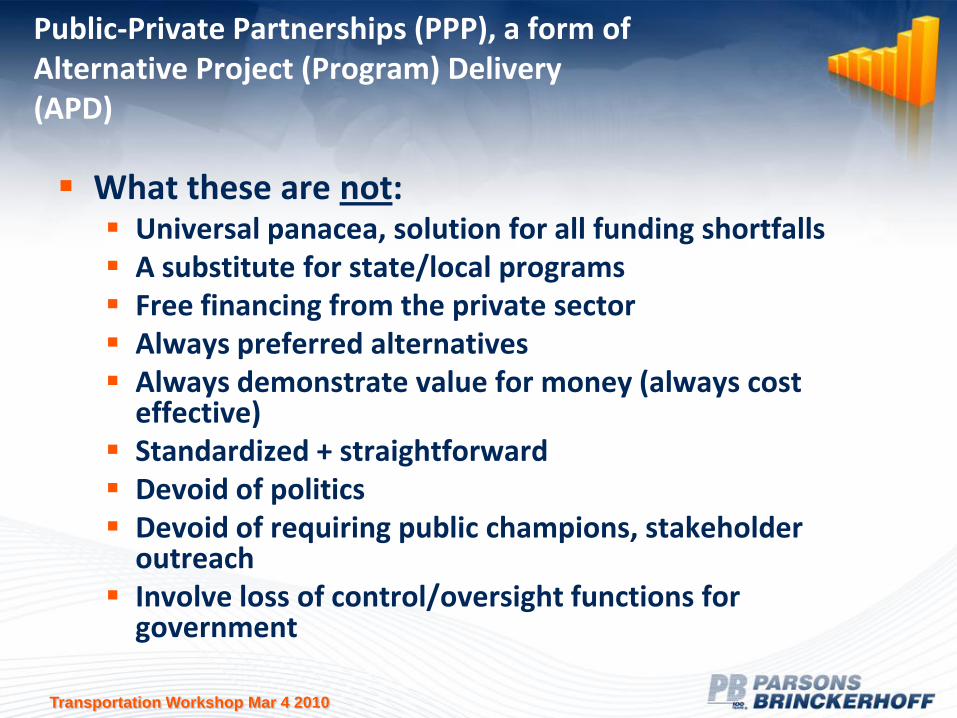
Public-Private Partnerships (PPP), a form ofAlternative Project (Program) Delivery(APD)
What these are not: Universal panacea, solution for all funding shortfalls A substitute for state/local programs Free financing from the private sector Always preferred alternatives Always demonstrate value for money (always cost
effective) Standardized + straightforward Devoid of politics Devoid of requiring public champions, stakeholder
outreach Involve loss of control/oversight functions for
government
Transportation Workshop Mar 4 2010
Issues/Risks
Public acceptance: private profit/tolls/new partners
Control
Political stability (AZ TX others)
Protectionism (foreign)
Complexities
Not a long track record + not wanting to be a pioneer
Usual project life cycle cost coverage
State/local staffing + champions
Default Project company on Southern Connector (Greenville SC) defaulted
on bond debt
Las Vegas Monorail filed for Chapter 11 (DBFOM)
Transportation Workshop Mar 4 2010
Lessons Learned?
It can be done Needs enabling legislation + local process adapted Is it worthwhile from a value for money viewpoint? Flexible, adaptable in financing structure, procurement
process, contract documents Ability to finance in stressed market Variety of funding sources Not a substitute for federal/state/local financing Often needs federal/state/local funding support Willingness to find solutions, even some at 11th hour DOT willingness + capabilities Support at state + local levels Federal support has to mirror state/local Strong support from local stakeholders, cities/counties Strong DOT outreach, public hearings eliciting public support It’s an ART, not a science
Transportation Workshop Mar 4 2010
Some Resources on PPPsAlternative Financing + Delivery
AASHTO Innovative Finance Web Site:http://www.transportation-finance.org/
FHWA Office of Innovative Program Delivery:http://www.fhwa.dot.gov/ipd/
FHWA PPP Homepage: http://www.fhwa.dot.gov/PPP/ Public Works Financing Newsletter:
http://pwfinance.net US DOT Report to Congress on Costs, Benefits and Efficiencies of PPPs
for Fixed Guideway Capital Projects, available from FTA:
http://www.fta.dot.gov/documents/Costs_Benefits_Efficiencies_of_Public-Private_Partnerships.pdf
Contact: Yuval Cohen at [email protected]
Alternative Delivery Methods for Infrastructure
www.5CountyStudy.org
Five-County Study Innovative Financing / Delivery Workshop
March 4, 2010
Joseph J. Erskine, Deputy Secretary- Finance & Administration
Kansas Department of TransportationT WORKS TRANSPORTATION WORKS FOR KANSAS
Jobs Safety Economic Development
Agenda
• Discussion of Long Range Transportation
Plan and TLINK Process
• Needs Identified and Delivery Techniques
• Funding and Financing Scenarios
Public Input
• Long Range Transportation Plan
• T-LINK
• More than 60 meetings held
• More than 1,000 Kansans participating
• Strong online presence: www.ktoc.net
Highways
• Enhanced Project Selection
– Link project selection to economic
development
– More frequent project selection to address
emerging opportunities
– This approach has been vetted with Kansans
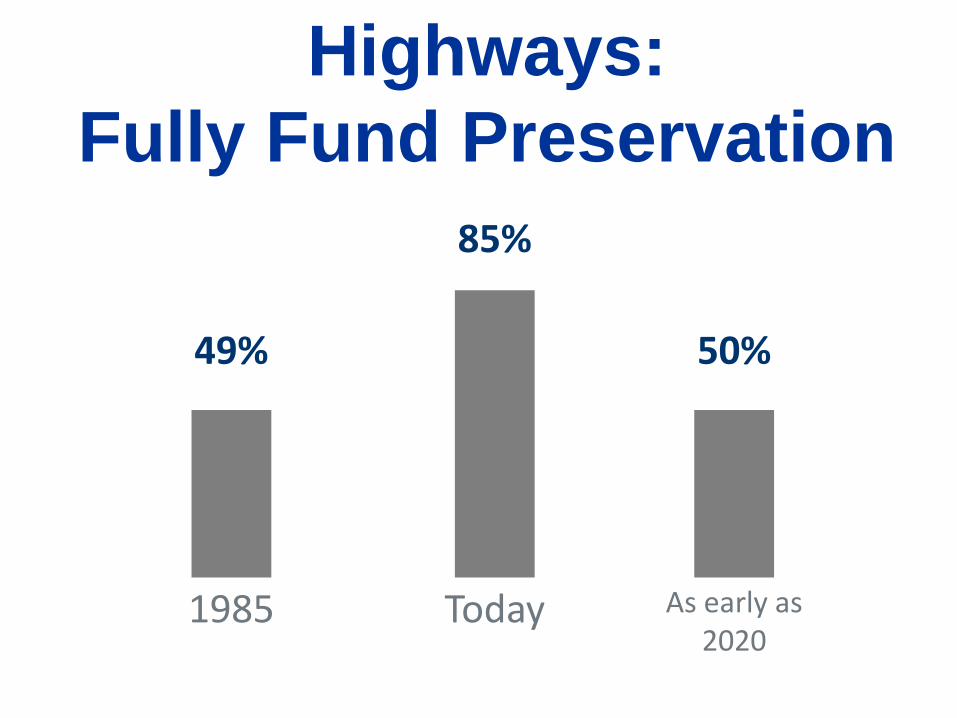
Highways:
Fully Fund Preservation
1985
49%
Today
85%
As early as 2020
50%
Highways
• Increase funding for
capacity needs
• Implement Practical
Improvement
Approach
Local Roads
• Continued funding under the Special City County Highway Fund & Sustainable Priority Network Concept
• Fund Exchange Program– Moving forward
Transit
• Regional approach to improve rural
services & efficiency
• Revised rural & urban funding formulas
• Create a commuter corridor transit
funding program
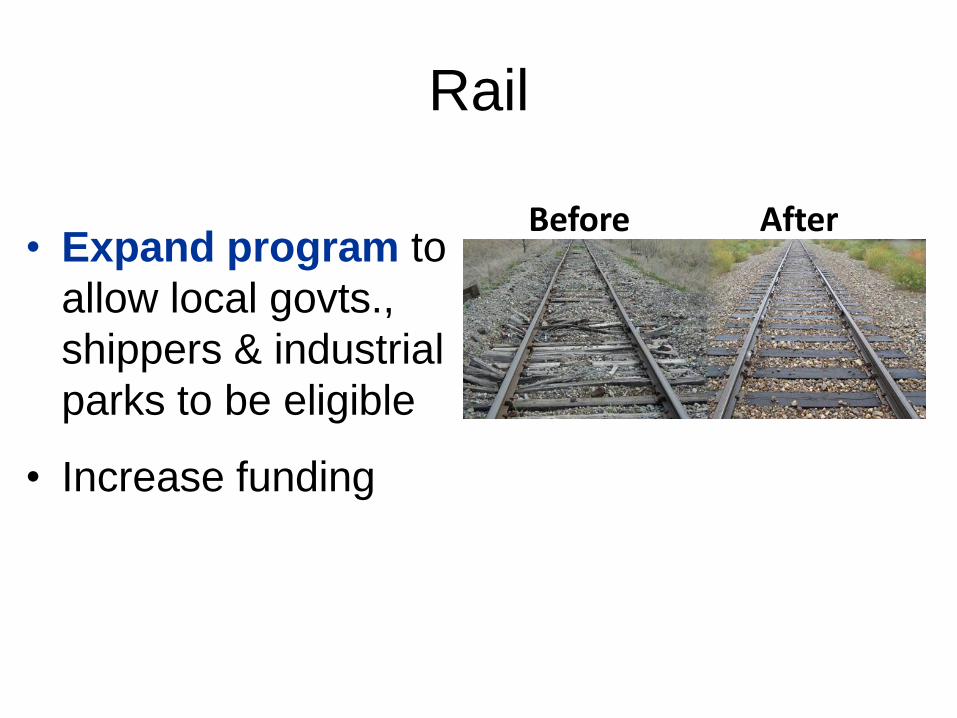
Rail
• Expand program to
allow local govts.,
shippers & industrial
parks to be eligible
• Increase funding
Before After
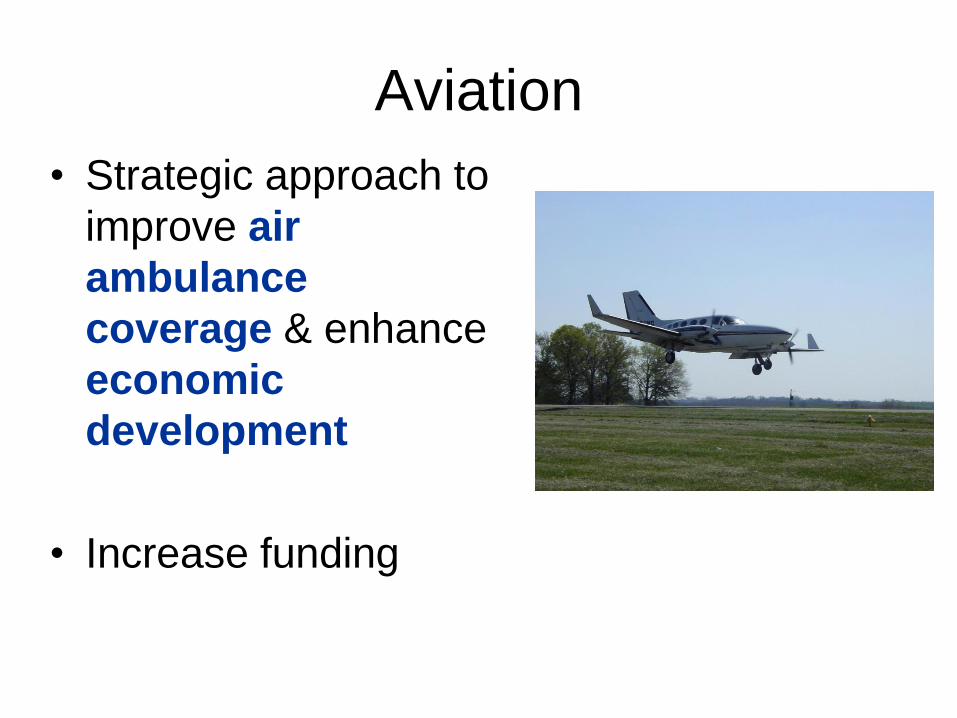
Aviation
• Strategic approach to
improve air
ambulance
coverage & enhance
economic
development
• Increase funding
Multimodal Economic
Development Program
• Fund at $20 million
• Project decisions made on continuous
cycle
• Opens program to other modes
Funding & Finance
• T-LINK Recommended Program Size
• Preservation Gap for first 3 years (assuming delayed
program)
• Cash Flow/Debt Management Strategy to fill 3
year Preservation Gap
• T-EDL (Transportation - Economic Development
Loans)
• Tolling Considerations
• Funding Scenarios

Program Size Over 10 years
• Preservation- $4.6 Billion
• Modernization- $430 Million
• Expansion/Capacity- $3.6 Billion
• Additional Modal Support- $240 Million
• Additional Local Support- $645 Million
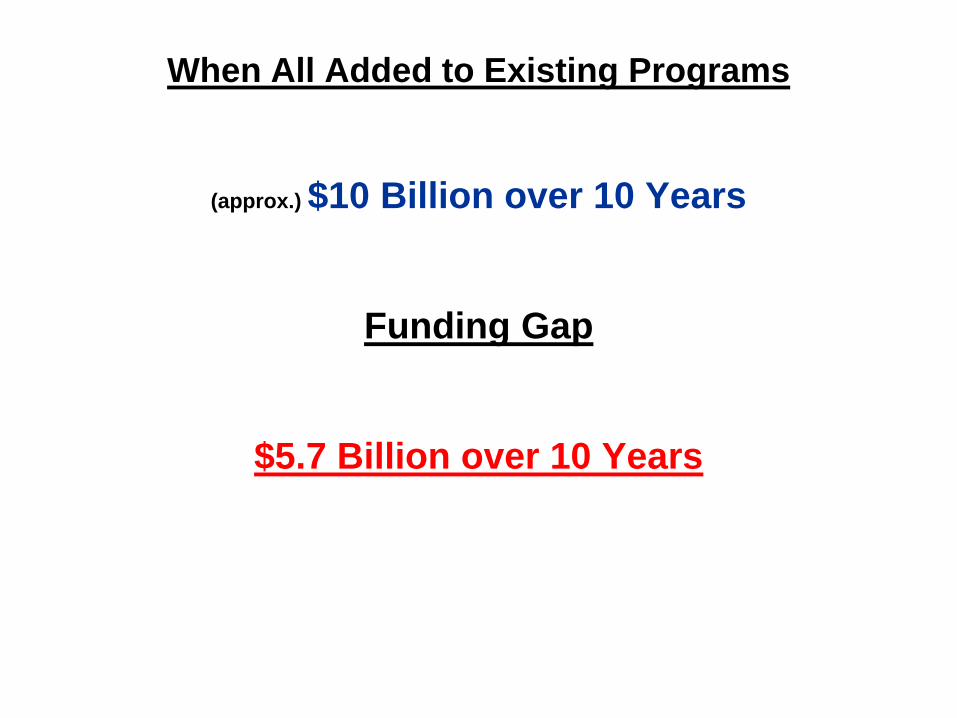
When All Added to Existing Programs
(approx.) $10 Billion over 10 Years
Funding Gap
$5.7 Billion over 10 Years
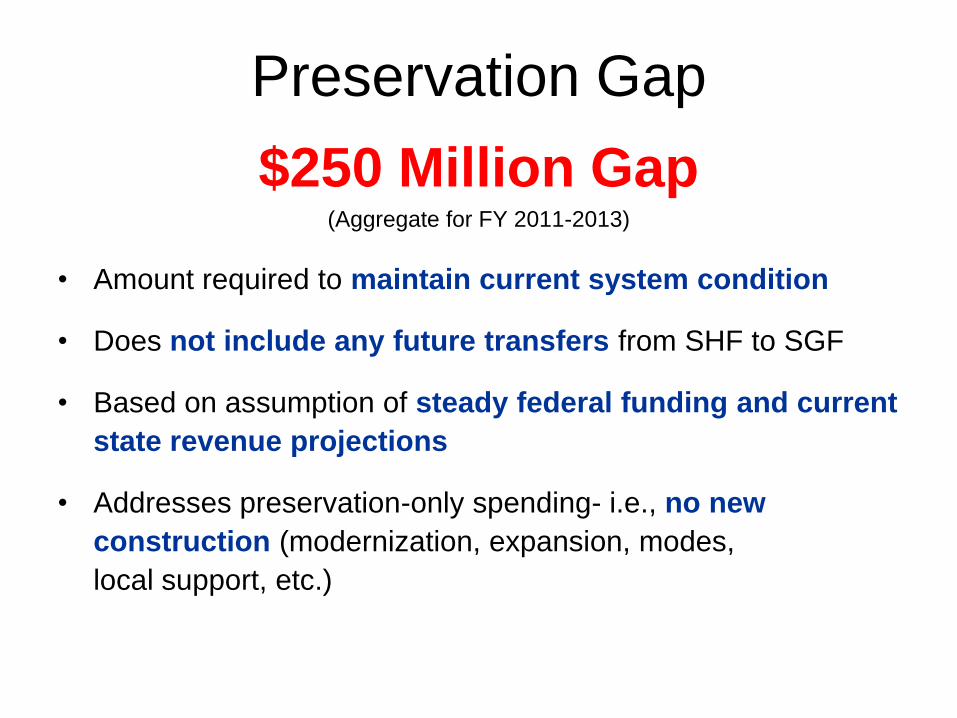
Preservation Gap
$250 Million Gap(Aggregate for FY 2011-2013)
• Amount required to maintain current system condition
• Does not include any future transfers from SHF to SGF
• Based on assumption of steady federal funding and current
state revenue projections
• Addresses preservation-only spending- i.e., no new
construction (modernization, expansion, modes,
local support, etc.)
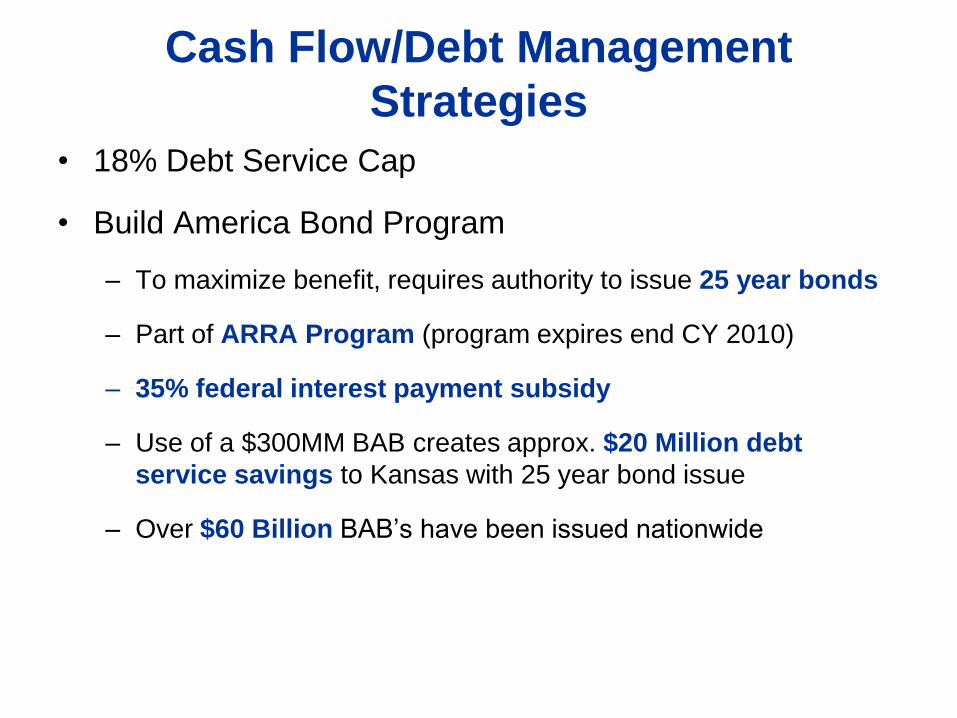
Cash Flow/Debt Management
Strategies
• 18% Debt Service Cap
• Build America Bond Program
– To maximize benefit, requires authority to issue 25 year bonds
– Part of ARRA Program (program expires end CY 2010)
– 35% federal interest payment subsidy
– Use of a $300MM BAB creates approx. $20 Million debt
service savings to Kansas with 25 year bond issue
– Over $60 Billion BAB’s have been issued nationwide
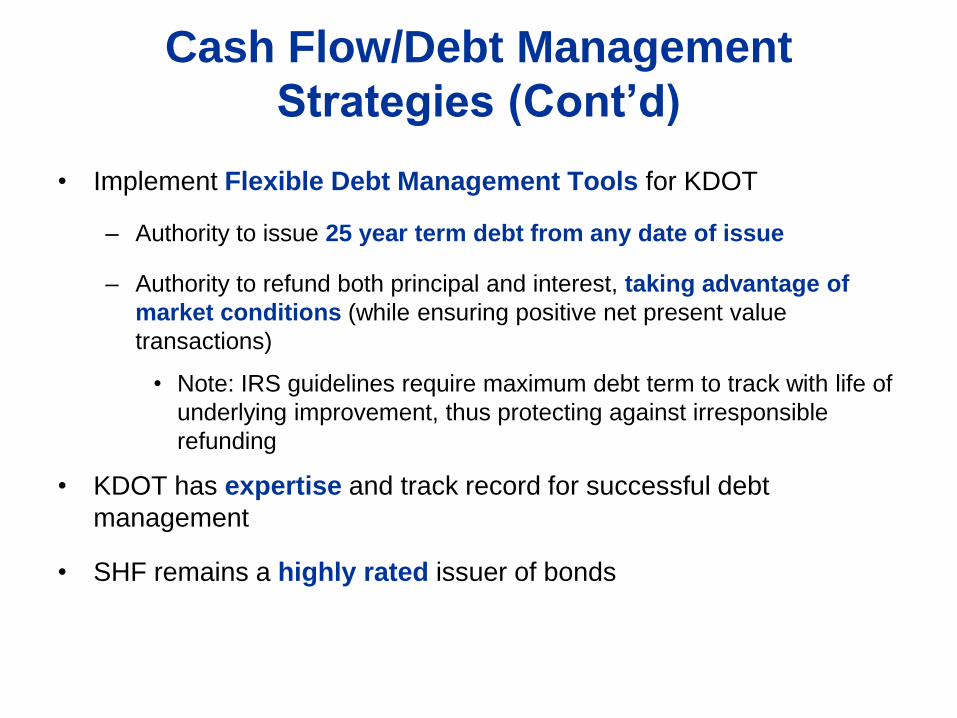
Cash Flow/Debt Management
Strategies (Cont’d)
• Implement Flexible Debt Management Tools for KDOT
– Authority to issue 25 year term debt from any date of issue
– Authority to refund both principal and interest, taking advantage of
market conditions (while ensuring positive net present value
transactions)
• Note: IRS guidelines require maximum debt term to track with life of
underlying improvement, thus protecting against irresponsible
refunding
• KDOT has expertise and track record for successful debt
management
• SHF remains a highly rated issuer of bonds
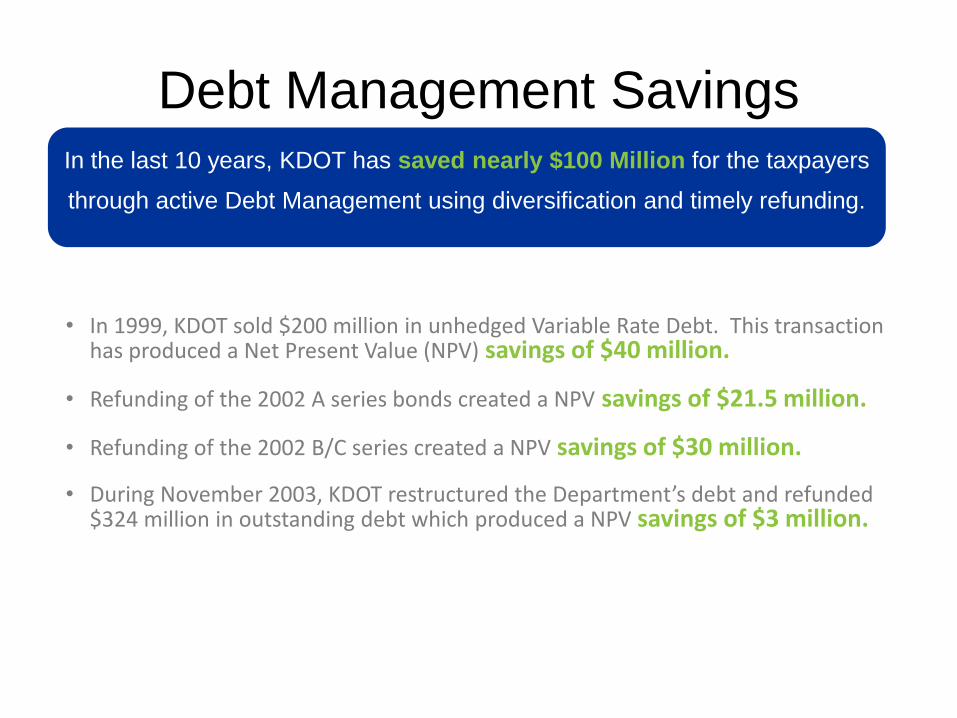
Debt Management SavingsIn the last 10 years, KDOT has saved nearly $100 Million for the taxpayers
through active Debt Management using diversification and timely refunding.
• In 1999, KDOT sold $200 million in unhedged Variable Rate Debt. This transaction has produced a Net Present Value (NPV) savings of $40 million.
• Refunding of the 2002 A series bonds created a NPV savings of $21.5 million.
• Refunding of the 2002 B/C series created a NPV savings of $30 million.
• During November 2003, KDOT restructured the Department’s debt and refunded $324 million in outstanding debt which produced a NPV savings of $3 million.
Transportation – Economic
Development Loans (T-EDL)(TLINK Executive Summary Report-January 2009)
To open financing options for local communities, allow the
Secretary of transportation to review transportation-related
economic development opportunities and authorize the use of
debt financing with repayment streams flowing from the
development revenue.
T-LINK recognized that communities –even growing communities –struggle to
fund improvements to serve new development. Current financing options
are difficult and cumbersome for communities to use. Therefore, T-LINK
recommends combining into a single piece of legislation approaches similar
to the economic development and transportation specific elements found in
STAR Bonds, Transportation Development Districts (TDD’s) and Tax
Increment Financing (TIF).
Transportation – Economic
Development Loans (T-EDL)• Administered through the Transportation Revolving Fund (TRF)
• Loans for local governments to fund transportation improvements to serve economic development
• Authorizes the SHF to bridge the debt service gap between construction and when new, incremental revenues begin to flow
• Authorize revenues from CIDs, TDDs, TIFs, in addition to other pledged sources, to service the T-EDL loan payments
• Feasibility Study Required
• Projects Approved on Project by Project Basis by Secretary of Transportation, with consultation from Secretaries of Commerce and Revenue
TollingT-LINK Positions:
• Kansas should consider toll financing
where practical;
• Any new toll revenues should be used forroads and highways;
• Tolling practices should not require 100% of costs to be covered by tolling revenue.
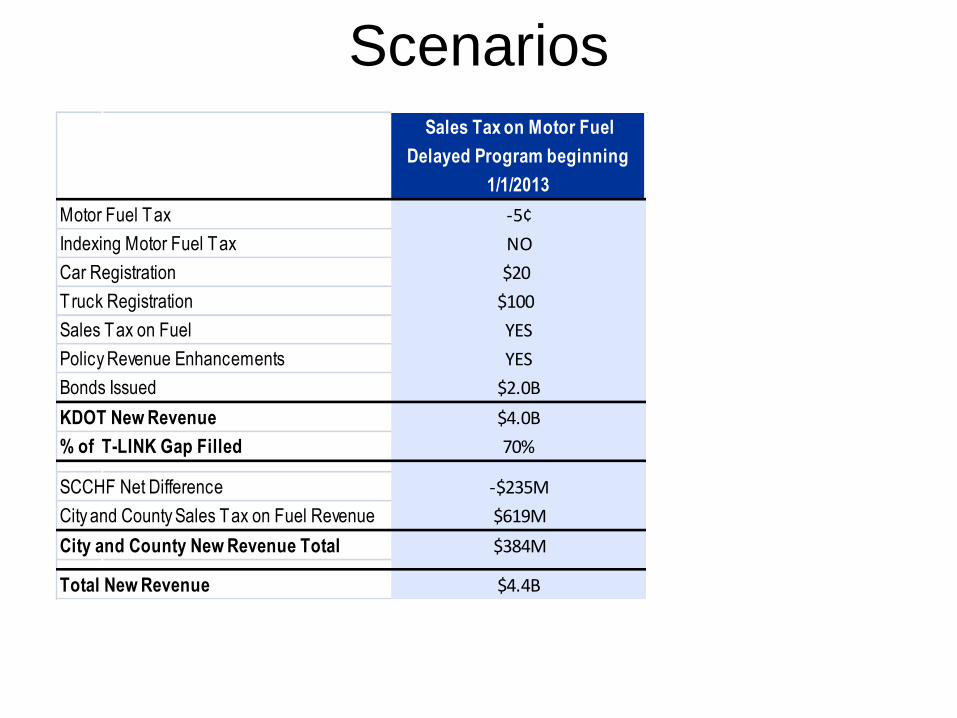
Scenarios Sales Tax on Motor Fuel
Delayed Program beginning
1/1/2013
Motor Fuel Tax -5¢
Indexing Motor Fuel Tax NO
Car Registration $20
Truck Registration $100
Sales Tax on Fuel YES
Policy Revenue Enhancements YES
Bonds Issued $2.0B
KDOT New Revenue $4.0B
% of T-LINK Gap Filled 70%
SCCHF Net Difference -$235M
City and County Sales Tax on Fuel Revenue $619M
City and County New Revenue Total $384M
Total New Revenue $4.4B
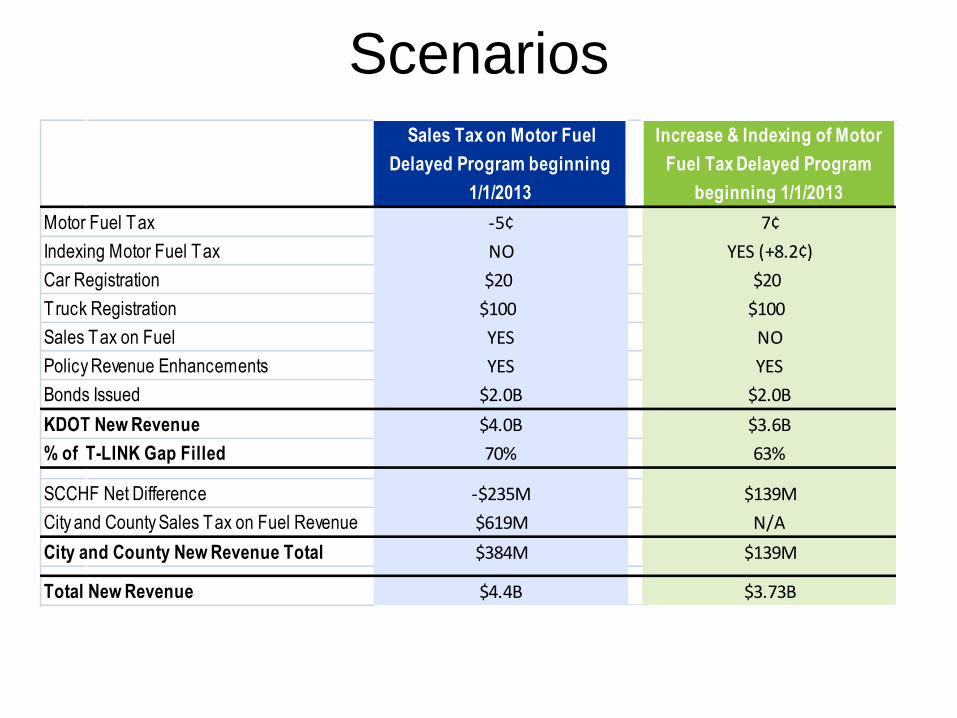
Scenarios Sales Tax on Motor Fuel
Delayed Program beginning
1/1/2013
Increase & Indexing of Motor
Fuel Tax Delayed Program
beginning 1/1/2013
Motor Fuel Tax -5¢ 7¢
Indexing Motor Fuel Tax NO YES (+8.2¢)
Car Registration $20 $20
Truck Registration $100 $100
Sales Tax on Fuel YES NO
Policy Revenue Enhancements YES YES
Bonds Issued $2.0B $2.0B
KDOT New Revenue $4.0B $3.6B
% of T-LINK Gap Filled 70% 63%
SCCHF Net Difference -$235M $139M
City and County Sales Tax on Fuel Revenue $619M N/A
City and County New Revenue Total $384M $139M
Total New Revenue $4.4B $3.73B
Questions?
Senate Transportation Committee
Scheduled to open hearings next week,
(approx.) Wednesday, March 10th.

Alternative Delivery Methods for Infrastructure
www.5CountyStudy.org
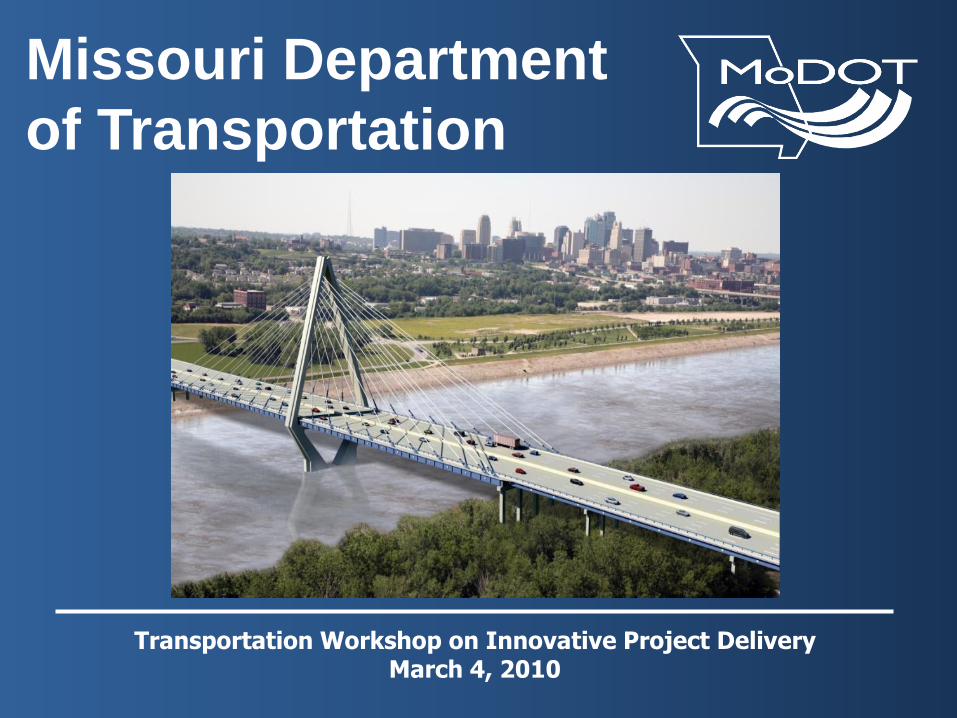
Transportation Workshop on Innovative Project DeliveryMarch 4, 2010
Missouri Department
of Transportation
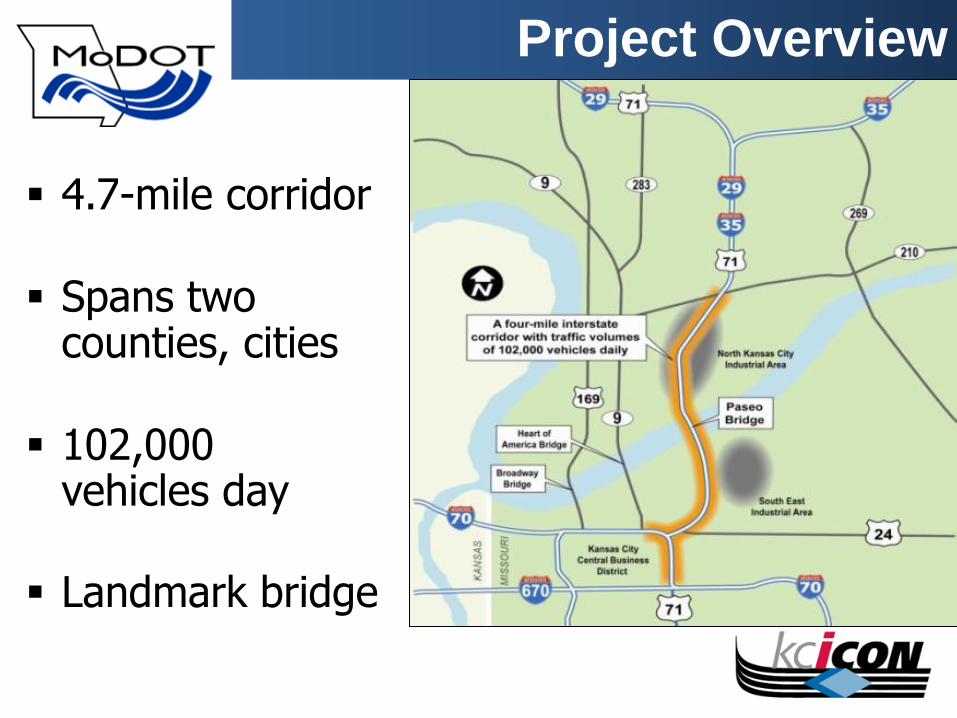
Project Overview
KC
4.7-mile corridor
Spans two counties, cities
102,000vehicles day
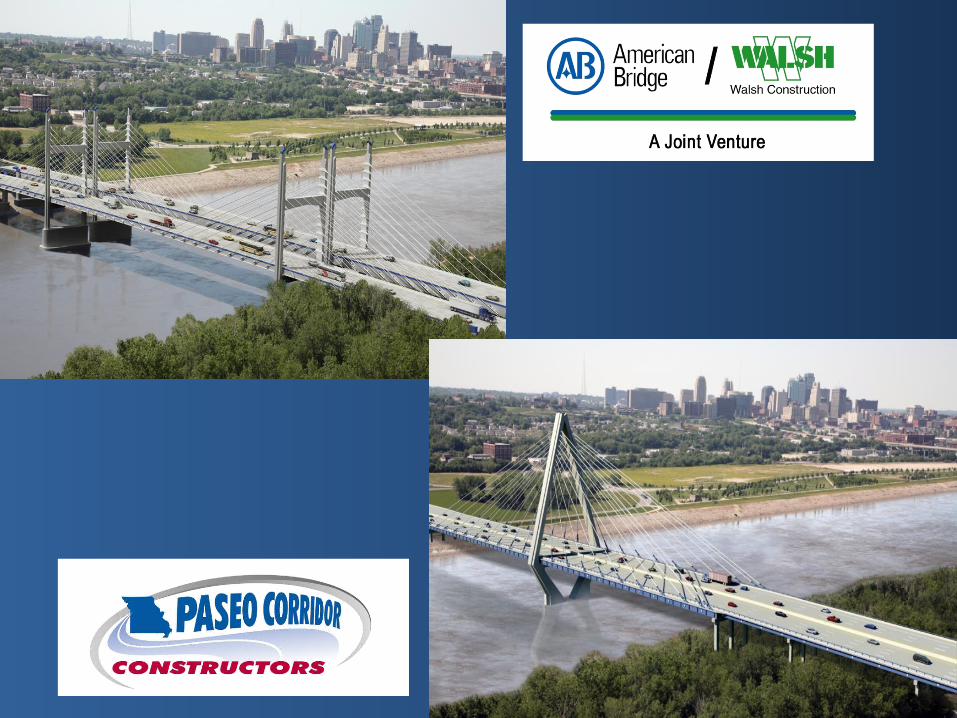
Landmark bridge
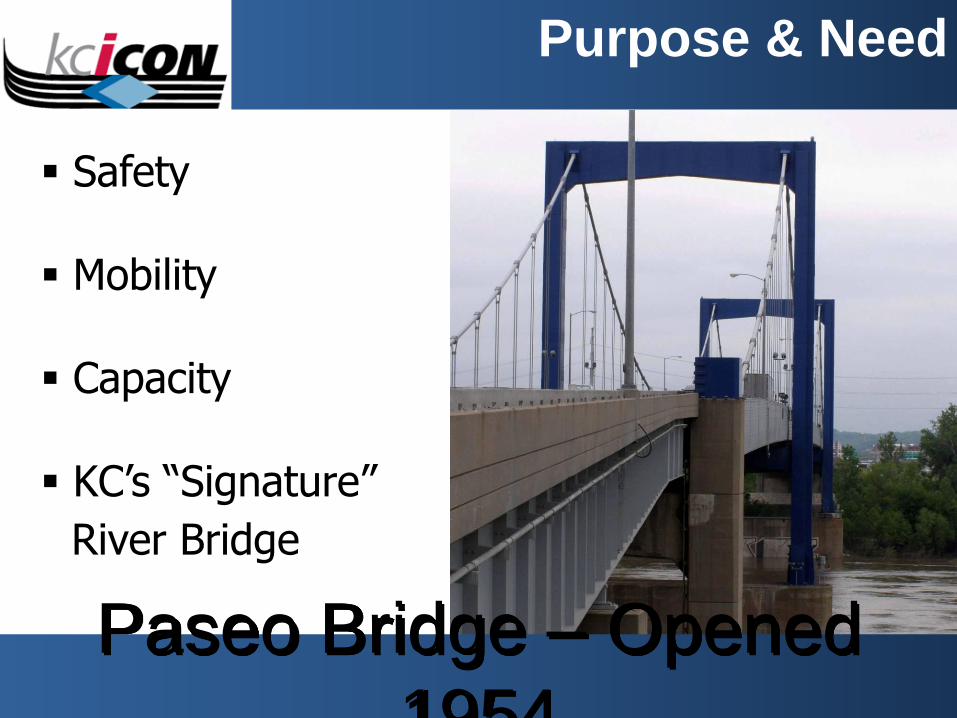
Purpose & Need
Safety
Mobility
Capacity
KC’s “Signature”
River Bridge
Paseo Bridge – Opened
1954
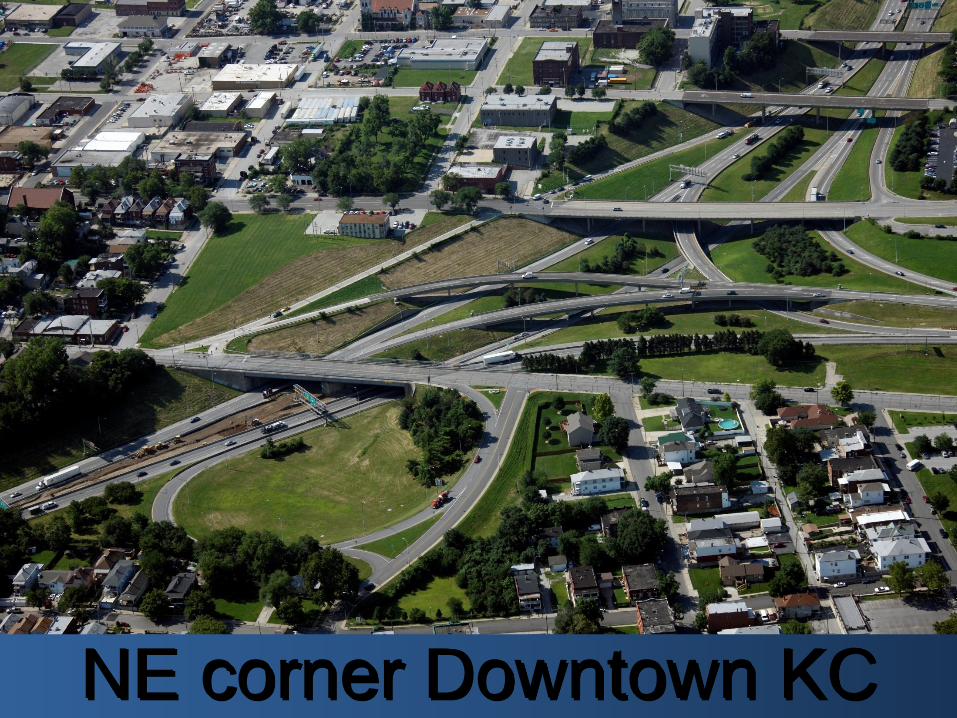
NE corner Downtown KC
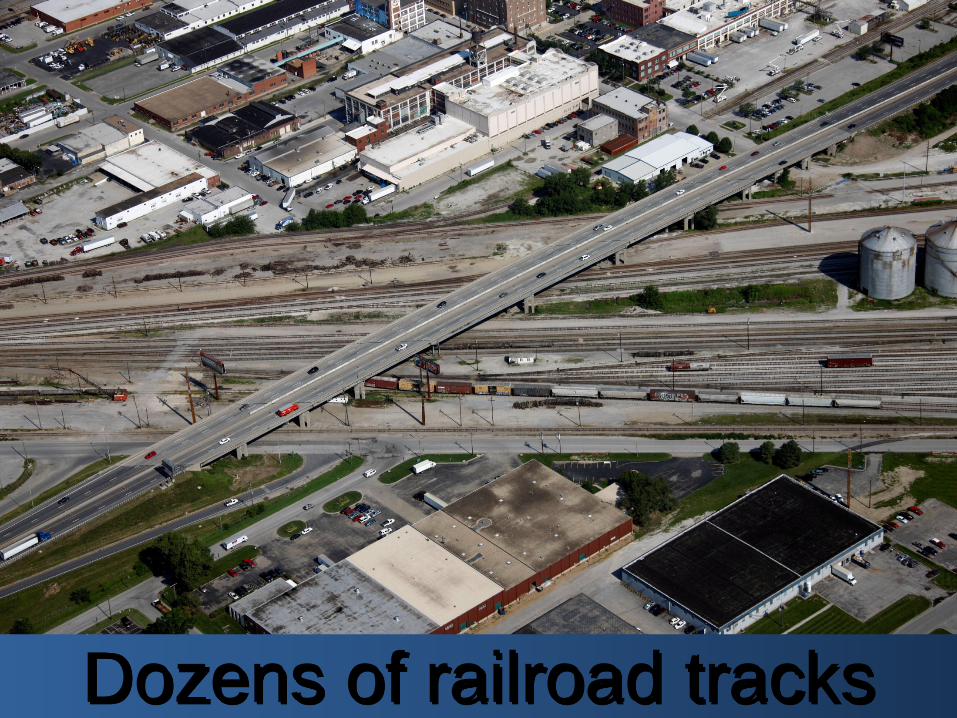
Dozens of railroad tracks
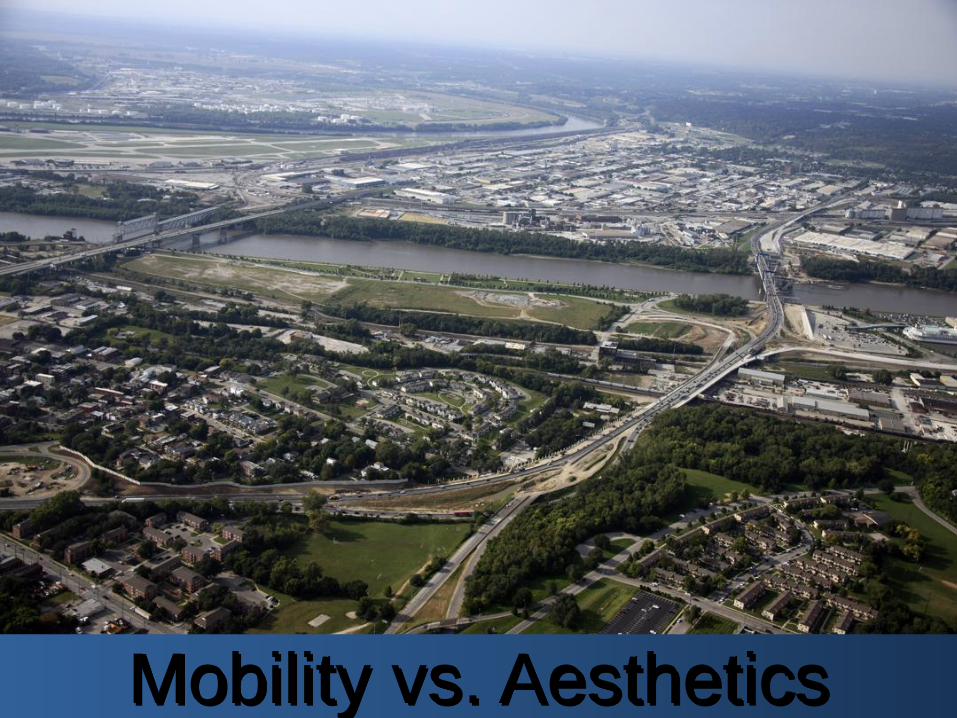
Mobility vs. Aesthetics
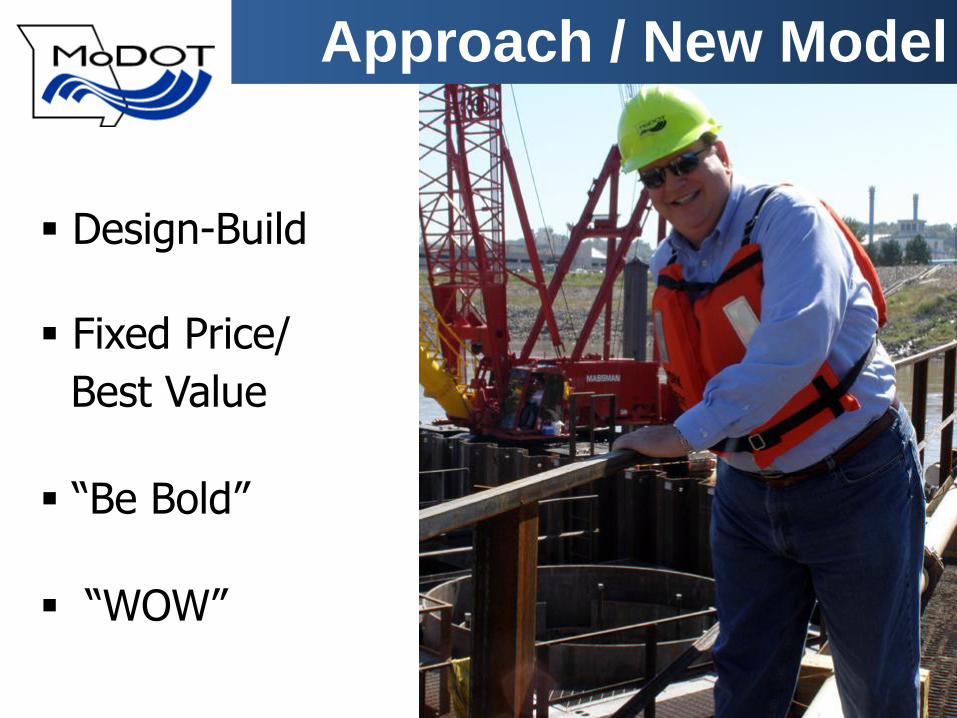
Approach / New Model
Design-Build
Fixed Price/
Best Value
“Be Bold”
“WOW”
Approach / New Model
Go “unreasonably” fast
Maximum Flexibility
Small, empowered core team
….and, complete NEPA (EIS)
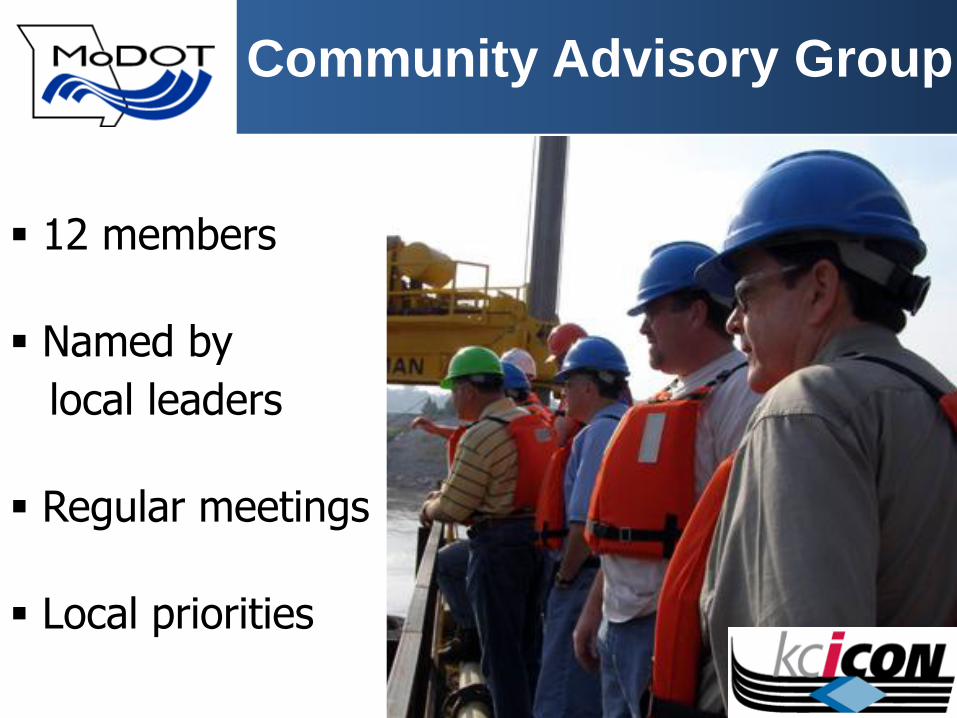
12 members
Named by
local leaders
Regular meetings
Local priorities
Community Advisory Group
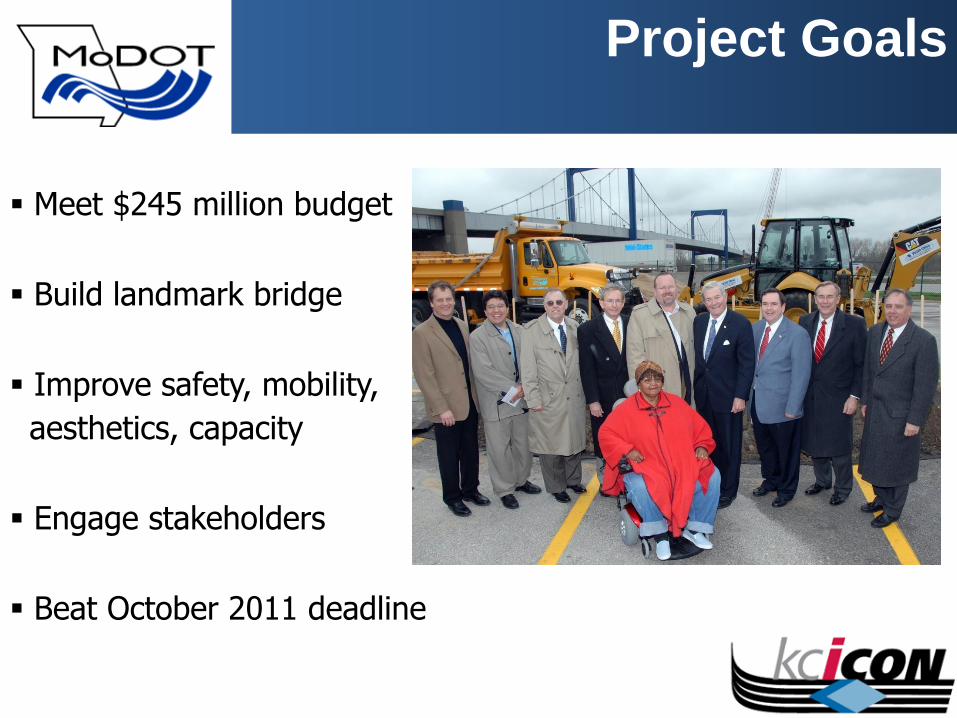
Project Goals
Meet $245 million budget
Build landmark bridge
Improve safety, mobility,
aesthetics, capacity
Engage stakeholders
Beat October 2011 deadline
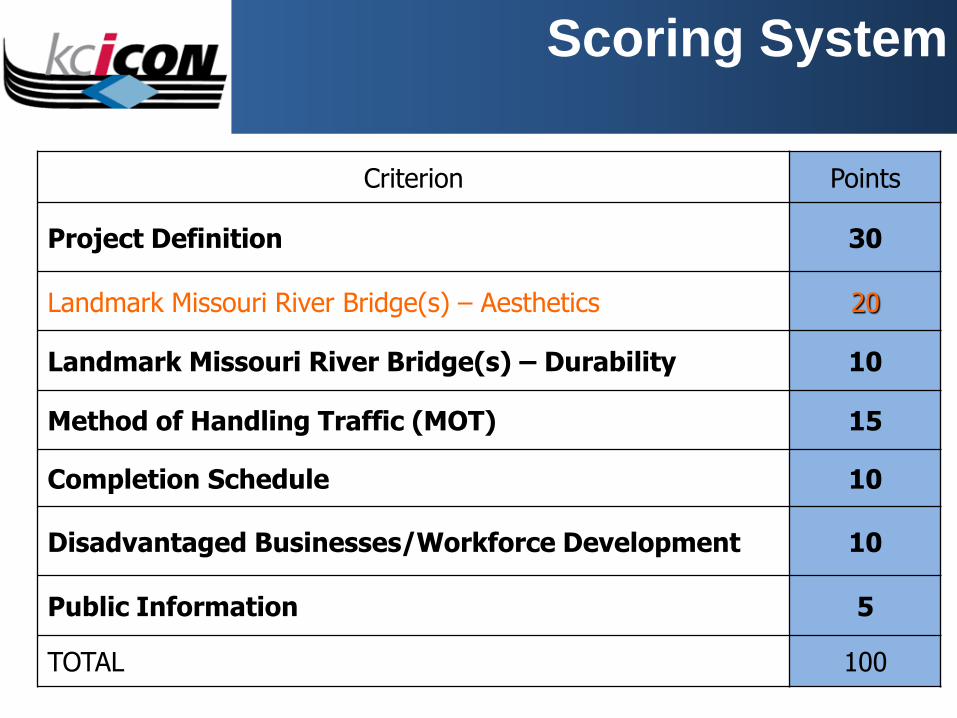
Scoring System
Criterion Points
Project Definition 30
Landmark Missouri River Bridge(s) – Aesthetics 20
Landmark Missouri River Bridge(s) – Durability 10
Method of Handling Traffic (MOT) 15
Completion Schedule 10
Disadvantaged Businesses/Workforce Development 10
Public Information 5
TOTAL 100
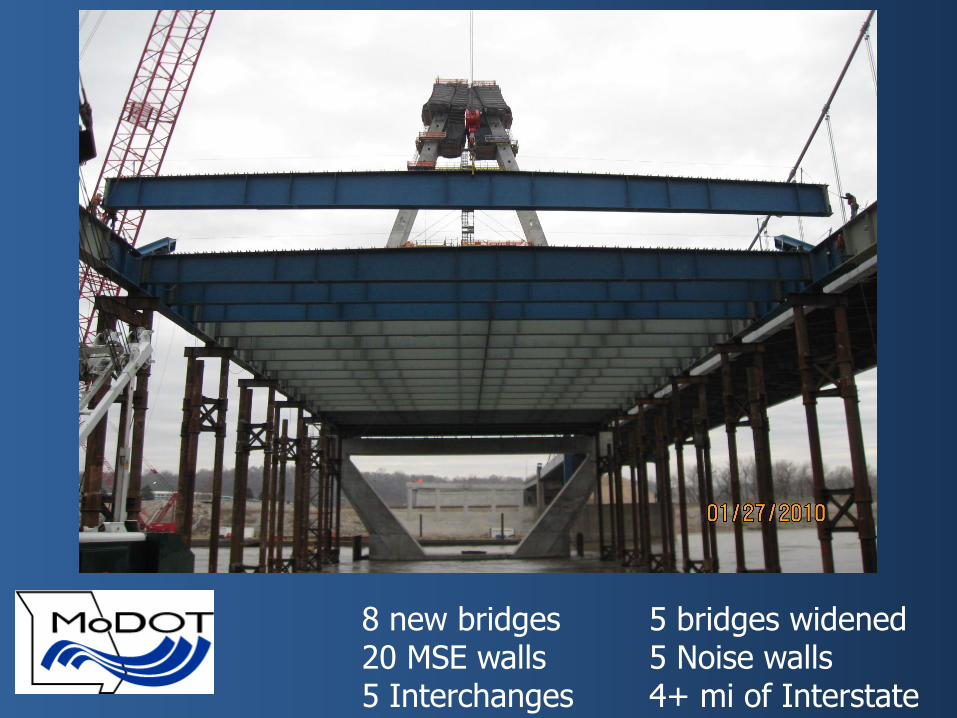
8 new bridges 5 bridges widened20 MSE walls 5 Noise walls5 Interchanges 4+ mi of Interstate

Design & FAA Challenge
316 ft.
above
river’s
surfac
e
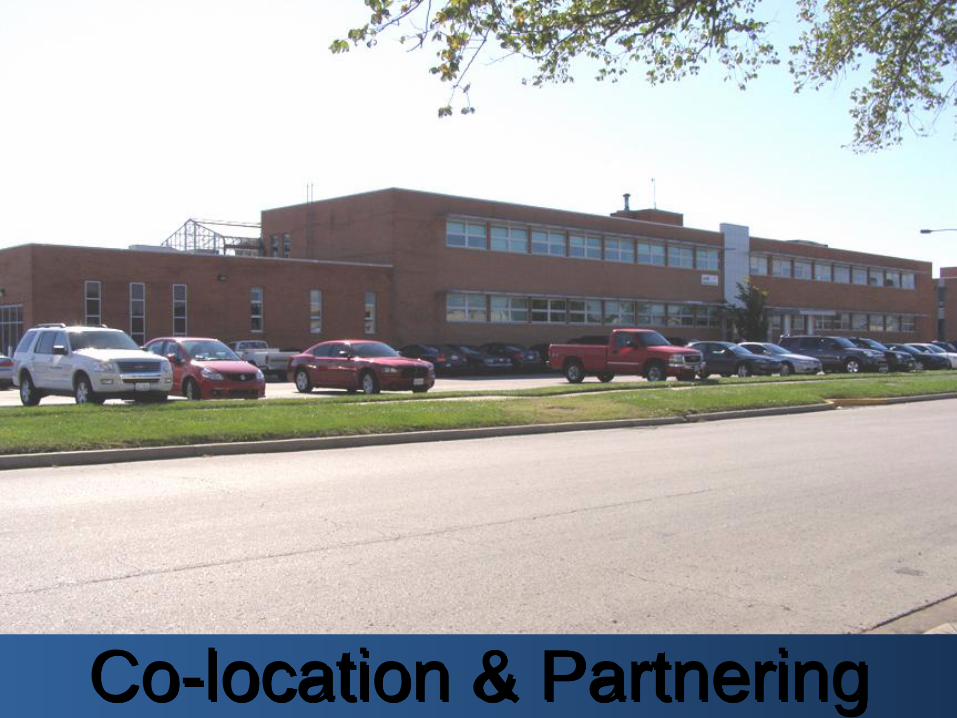
Co-location & Partnering
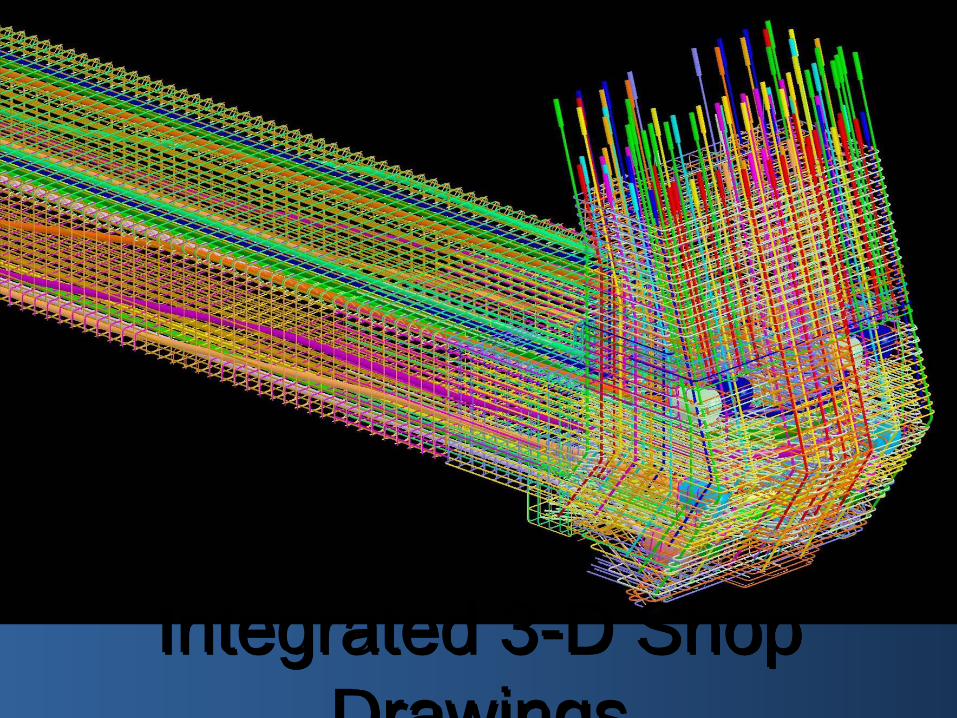
Integrated 3-D Shop
Drawings
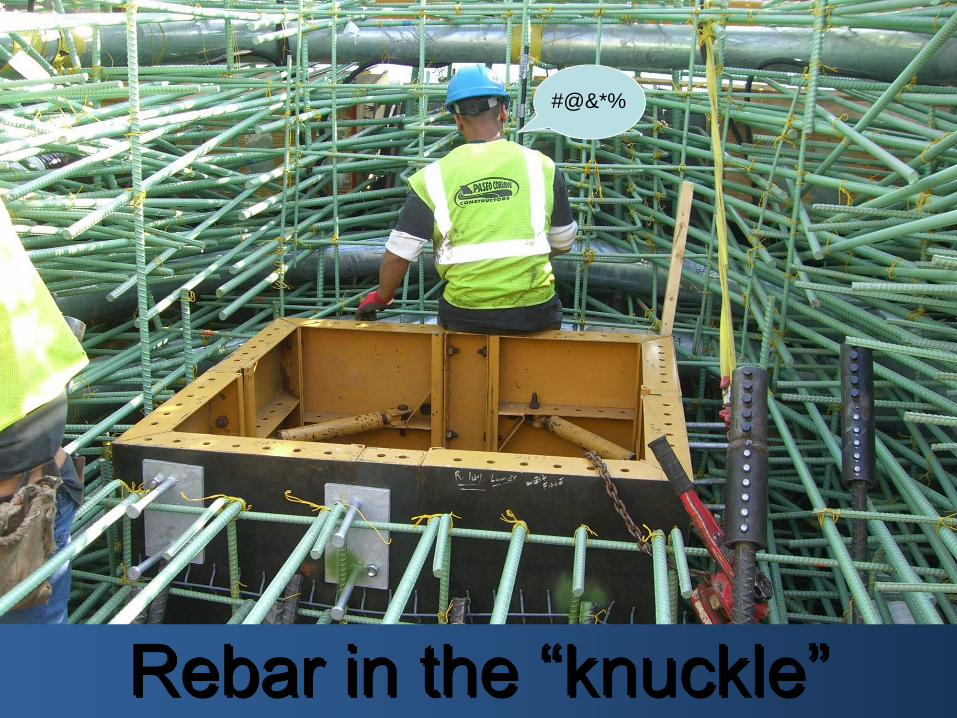
#@&*%
Rebar in the “knuckle”
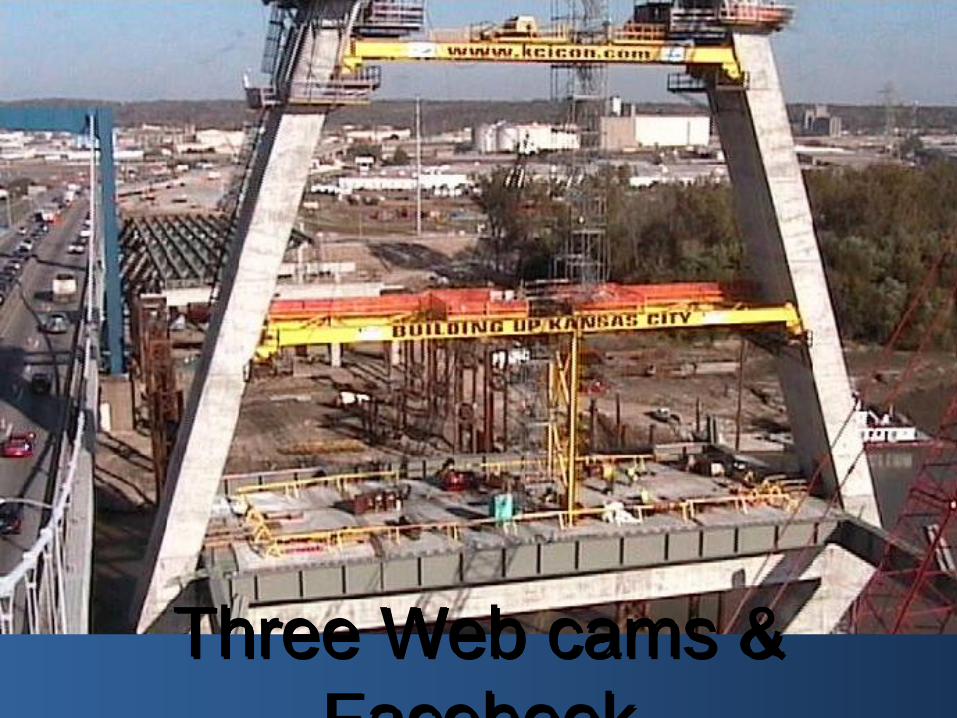
Three Web cams &
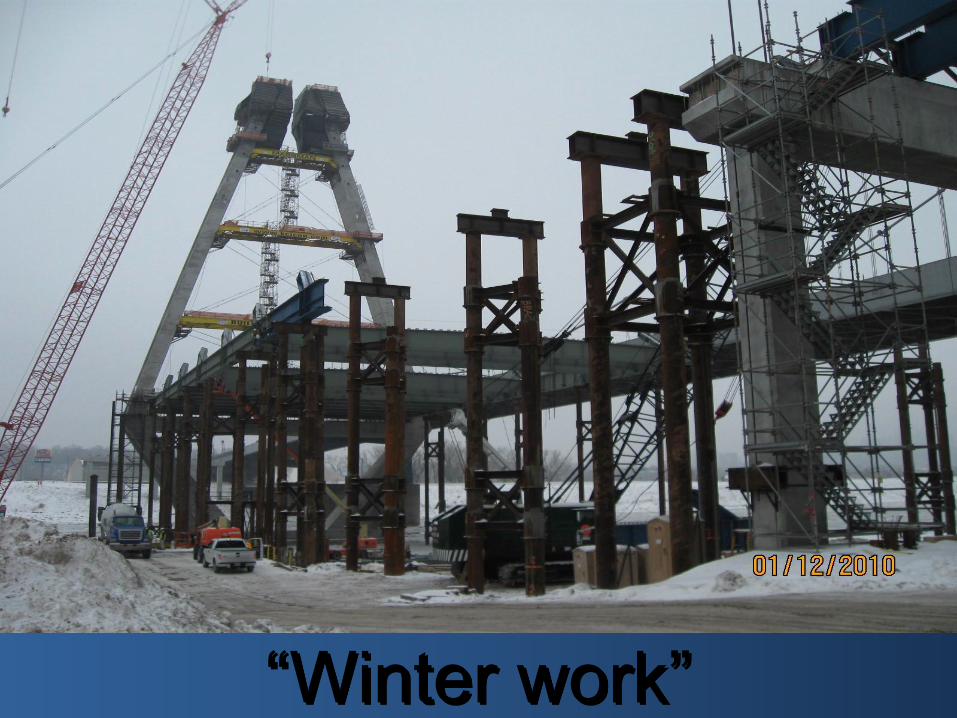
“Winter work”
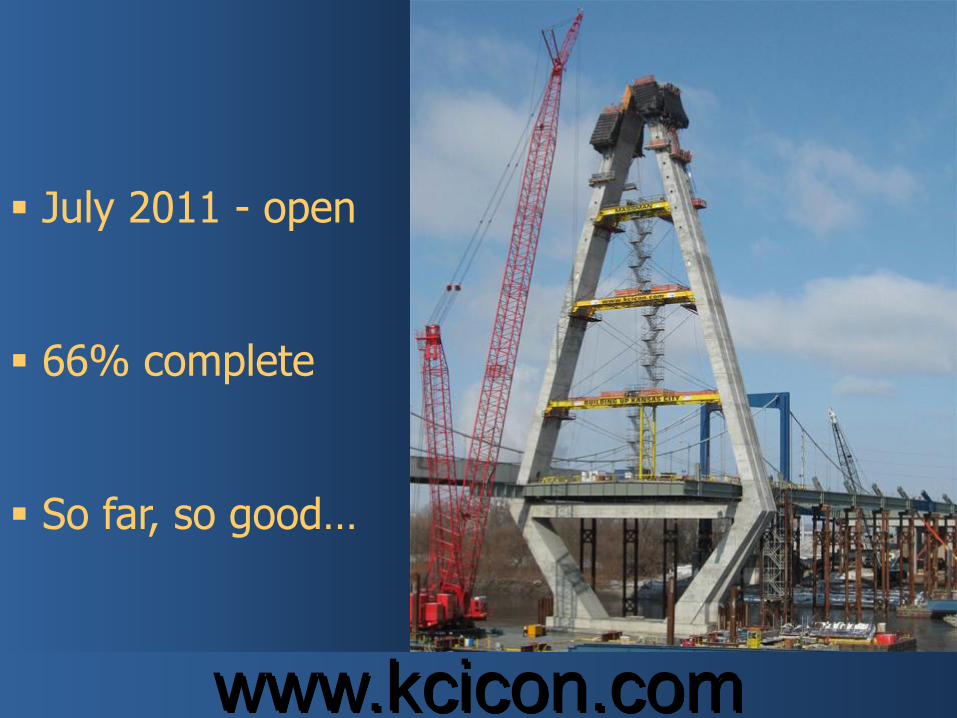
July 2011 - open
66% complete
So far, so good…
www.kcicon.com

Alternative Delivery Methods for Infrastructure
www.5CountyStudy.org
Public-Private Partnerships (P3)in
Transportation Development
5-County Innovative Financing Study
March 3, 2010
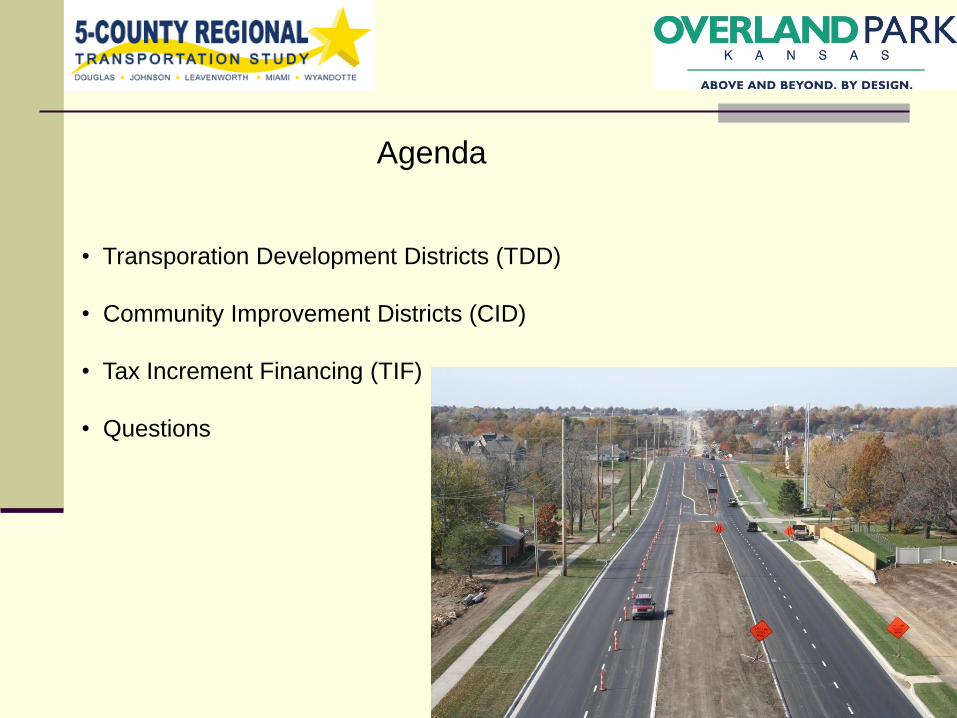
Agenda
• Transporation Development Districts (TDD)
• Community Improvement Districts (CID)
• Tax Increment Financing (TIF)
• Questions
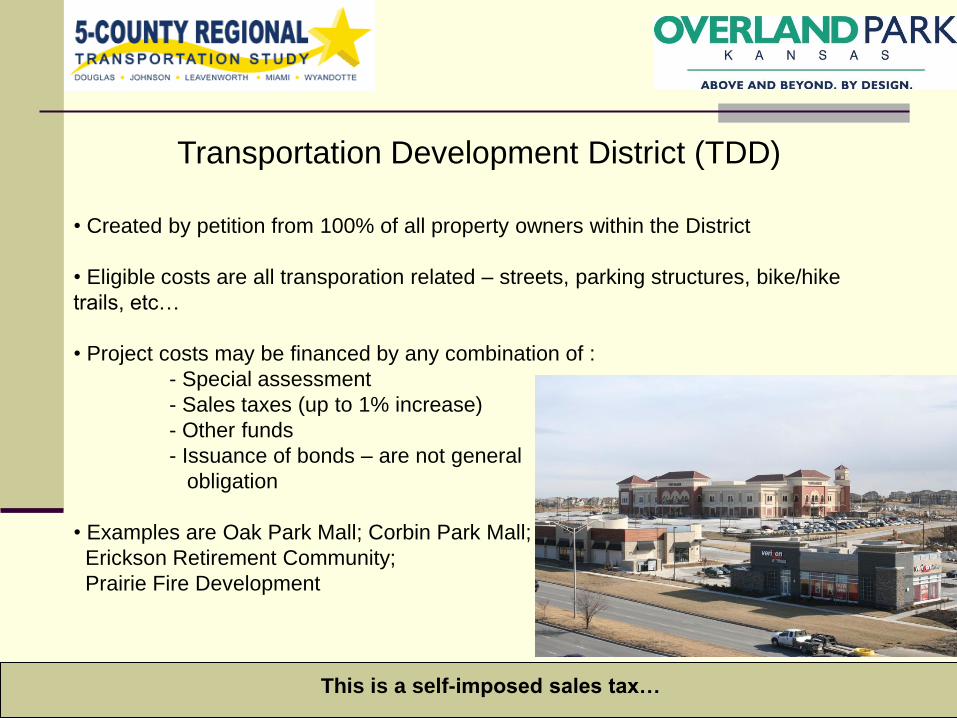
Transportation Development District (TDD)
• Created by petition from 100% of all property owners within the District
• Eligible costs are all transporation related – streets, parking structures, bike/hike
trails, etc…
• Project costs may be financed by any combination of :
- Special assessment
- Sales taxes (up to 1% increase)
- Other funds
- Issuance of bonds – are not general
obligation
• Examples are Oak Park Mall; Corbin Park Mall;
Erickson Retirement Community;
Prairie Fire Development
This is a self-imposed sales tax…
Community Improvement District (CDD)
• Created by petition:
- 100% of all property owners within the District if special assessments are
used
- 55% of all property owners or 55% of assessed value
• Eligible costs are broad – transporation, utilities, facilities, operations, etc.
• Project costs may be financed by any combination of :
Special assessment
Sales taxes (up to 2% increase) – self imposed
Other funds
Issuance of bonds – special obligation or general obligation
• Examples ….none yet
The way of the public-private partnership in the future …
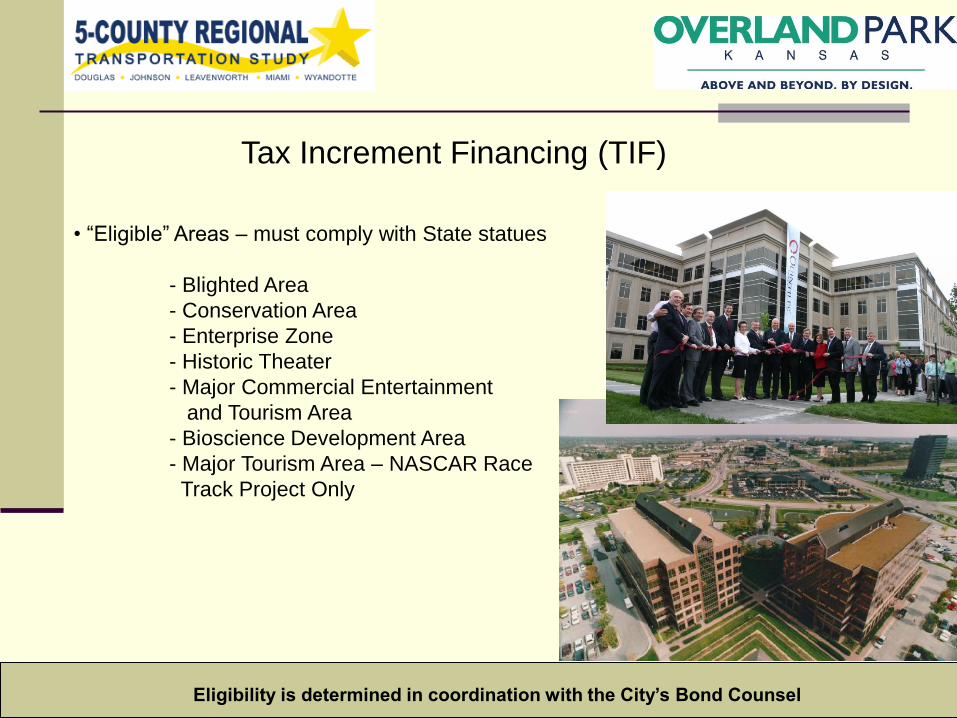
Tax Increment Financing (TIF)
• “Eligible” Areas – must comply with State statues
- Blighted Area
- Conservation Area
- Enterprise Zone
- Historic Theater
- Major Commercial Entertainment
and Tourism Area
- Bioscience Development Area
- Major Tourism Area – NASCAR Race
Track Project Only
Eligibility is determined in coordination with the City’s Bond Counsel
• Requires creation of a redevelopment district following a public hearing
- Can be vetoed by County or School District
• Requires approval of a redevelopment project area plan
- Financial Feasibility Study
- Relocation Assistance Plan
• Eligible costs are usually site plan costs – no buildings
- Utilities, streets, stormwater, etc…
• Paid as either pay-as-you-go proceeds or issuance of bonds
- Bonds can be special obligation or full faith and credit tax
increment bonds
• Paid for by incremental property tax and/or sales tax
• City may use eminent domain in all areas except “conservation areas”
Tax Increment Financing (TIF)
Tax Increment Financing (TIF)
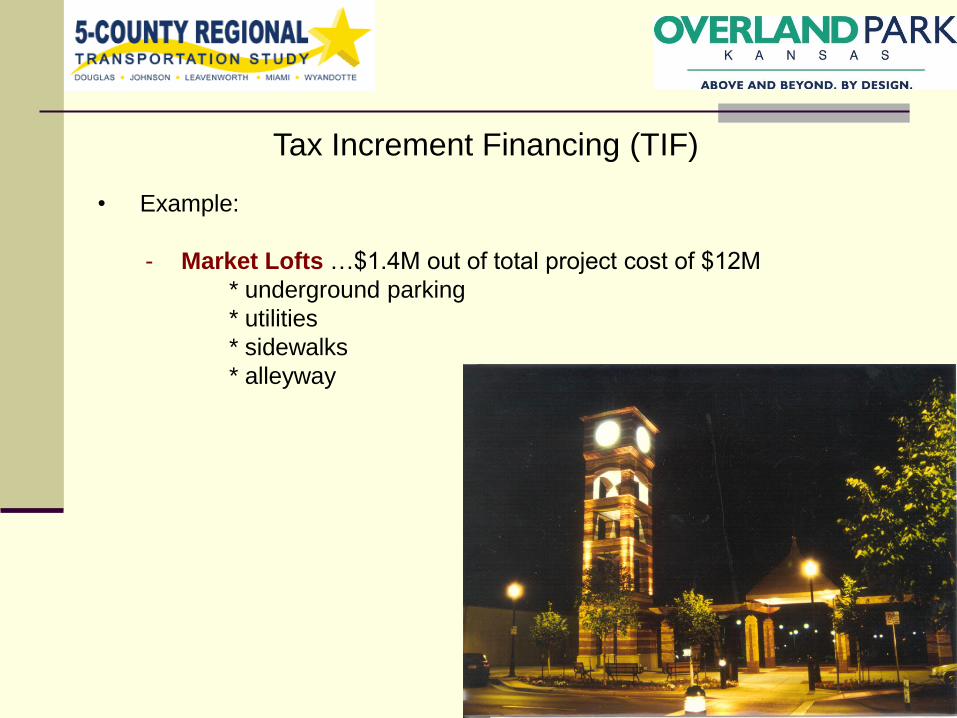
• Example:
- Market Lofts …$1.4M out of total project cost of $12M
* underground parking
* utilities
* sidewalks
* alleyway
Tax Increment Financing (TIF)
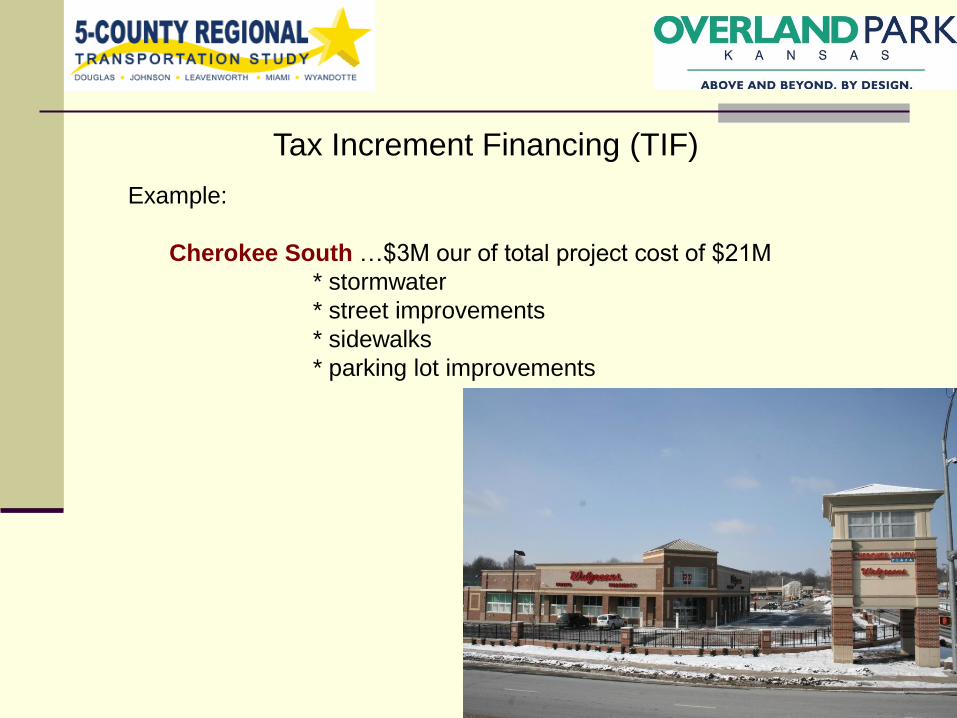
Example:
Cherokee South …$3M our of total project cost of $21M
* stormwater
* street improvements
* sidewalks
* parking lot improvements
Some Considerations for Council
• Cost of the project – funding; amount of equity invested; “but-for” analysis
• Experience and financial stability of the developer
• Viability and quality of the project – tenant activity; quality of tenants;
economic competition in the area
• Performance guarantees
• Liability to the City – how is the development agreement structured?
Questions?
Alternative Delivery Methods
for Infrastructure
Team Brainstorming Session
Lawrence / Douglas County MPO