innovation for sustainable agricultural growth in …...innovation for sustainable agricultural...
TRANSCRIPT
OCTOBER 2017Program of Accompanying
Research for Agricultural Innovation resear h agri o a� o .org
Innovation for
Sustainable Agricultural Growth
in Zambia
ACKNOWLEDGEMENTS
The paper as de eloped ithi the proje t Progra of A o pa yi g Resear h for Agri ultural I o a-� o PARI , hi h is fu ded y the Ger a Federal Mi istry of E o o i Coopera� o a d De elop e t BM) .
COORDINATION:
This report as oordi ated y Dr. Oli er K. Kirui )EF a d Dr. Fatu i Olu ole A iodu FARA .
CONTRIBUTORS TO THE COUNTRY DOSSIER ZAMBIA
)ARI: Moses M ale, Chris� a Cho a
FARA: Ye i Aki a ijo, Fatu i Olu ole A iodu
)EF: Heike Bau üller, Joa hi o Brau , A apia De arry, Tiga u Degu Getahu , Chris� e Hus a , Oli er K. Kirui, Ehsa Eyshi Rezaei, Leo ie Rou� l, “ougry o a )ai atou “ore, Jus� e Akpe e Ta o, Detlef Vir ho , Doris Wies a
This report is ork i progress a d o � uously ei g updated. A y feed a k a d sugges� o s for further i pro e e t are el o e a d a e se t to pari@u i- o .de.
SUGGESTED CITATION
)EF, FARA, )ARI . Cou try Dossier: I o ai o for Sustai a le Agri ultural Gro th i Za ia. Progra of A o pa yi g Resear h for Agri ultural I o a� o . Bo , A ra a d Lusaka: Ce ter for De elop e t Resear h, Foru for Agri ultural Resear h i Afri a a d )a ia Agri ultural Resear h I s� tute.
Layout & Edi� g: E ely Baraké, “e as� a E kert, Kathari a Galla t, Ha ah Jae i ke, Yesi Pa al, Kathari a )i
Country Dossier Zambia
1
About this study
In 12 African countries and India Green Innovation Centers (GICs) have been established under the
O e Wo ld, No Hu ge I itiati e “EWOH of the Ge a go e e t and other investors. The aim
of the GICs is to promote agricultural innovation, improve food and nutrition security and build
sustainable value chains in the agri-food sector of these countries. The Program of Accompanying
Research for Agricultural Innovation (PARI) has been providing independent research to the SEWOH
since 2015. PARI is led by the Center for Development Research (ZEF) at the University of Bonn in close
collaboration with the Forum for Agricultural Research in Africa (FARA) and its network of national and
regional partners in Africa, the African Growth and Development Policy Modeling Consortium
(AGRODEP) facilitated by the International Food Policy Research Institute (IFPRI, Africa Office) and
other partners in Germany and India. This country dossier offers a situation analysis of the current
state of the agri-food sector, related policies and existing agricultural innovations. It thereby provides
asi a kg ou d k o ledge e essa to ake f uitful i est e ts i li e ith the ou t s policies
and its potentials, and to find promising partners for development cooperation.
Program of Accompanying Research for Agricultural Innovation (PARI)
2
Table of Contents
1 General background information of the agricultural and food sectors ....................................... 5
1.1 Pan-African policies and strategies .......................................................................................... 7
1.2 National (and regional) policies and strategies........................................................................ 8
1.3 Data on food and nutrition security in Zambia and the GIC region ......................................... 9
1.3.1 Socio-economic and agricultural data .............................................................................. 9
1.3.2 Consumption and nutrition status .................................................................................. 12
1.4 Data on most relevant crops and value chains ...................................................................... 19
1.4.1 Production ...................................................................................................................... 19
1.4.2 Trade ............................................................................................................................... 19
1.5 National (and regional) innovation system ............................................................................ 20
1.5.1 Research system and organizations ............................................................................... 20
1.5.2 Innovation Platforms ...................................................................................................... 21
1.5.3 Extension system and organizations .............................................................................. 21
1.5.4 Private research and development activities ................................................................. 22
1.6 Key challenges, emerging needs and potentials in the agricultural sector ........................... 22
1.7 Potential areas for investment in Zambia .............................................................................. 23
2 Most relevant value chains in Zambia .................................................................................. 25
2.1 GIC value chains ..................................................................................................................... 26
2.1.1 Soybean .......................................................................................................................... 26
2.1.2 Groundnuts ..................................................................................................................... 26
2.1.3 Milk ................................................................................................................................. 26
2.2 Other relevant value chains ................................................................................................... 27
2.2.1 Maize .............................................................................................................................. 27
2.2.2 Cotton ............................................................................................................................. 28
2.2.3 Cassava ........................................................................................................................... 29
2.2.4 Wheat and Rice ............................................................................................................... 29
2.2.5 Aquaculture .................................................................................................................... 30
2.2.6 Fresh Fruits and Vegetables ........................................................................................... 30
2.3 Promising agricultural products and value chains ................................................................. 31
2.4 Summary on selection of agricultural products and value chains ......................................... 33
3 Innovations in value chains in the past 20 years ................................................................... 33
3.1 Main limiting factors .............................................................................................................. 33
3.2 Important value-chain related and cross-cutting innovations............................................... 34
3.2.1 GIC value chains .............................................................................................................. 34
3.2.2 Other value chains and cross-cutting innovations ......................................................... 35
4 Suggestions for collaboration .............................................................................................. 36
References ................................................................................................................................. 37
Annex A: Background Information on Nutrition ........................................................................... 41
Country Dossier Zambia
3
List of Tables
Table 1: Selected national economic and health-related data ............................................................... 9
Table 2: Food and nutrition security indicators .................................................................................... 13
Table 3: Child feeding practices by region, 2013-14 ............................................................................. 16
Table 4: Child nutrition status by region, 2013-14 ................................................................................ 17
Ta le : Wo e s ut itio status egio , -14 ......................................................................... 17
Table 6: Top 10 crops produced by area, volume and value ................................................................ 19
Ta le : )a ia s i po ts ..................................................................................................................... 19
Ta le : )a ia s e po ts ...................................................................................................................... 20
Table 9: Zambia performance indicators............................................................................................... 24
Table 10: Selection of promising agricultural products /value chains .................................................. 32
Table 11: Summary of all value chains .................................................................................................. 33
List of Figures
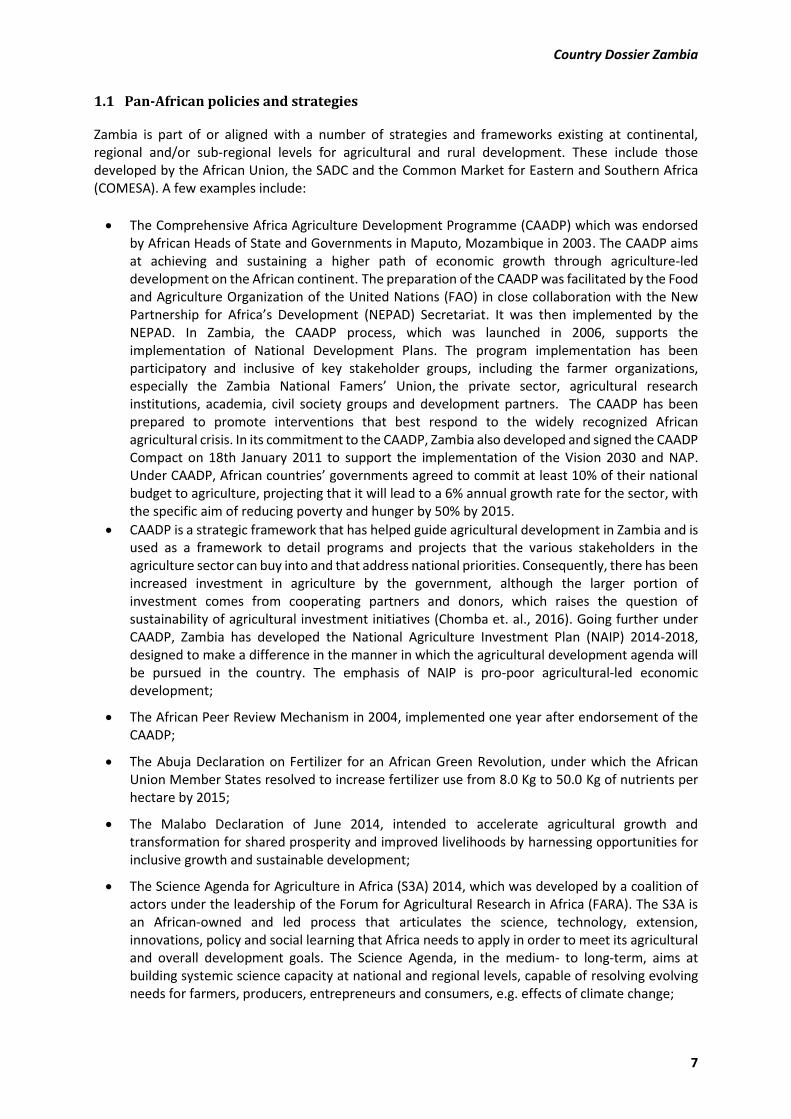
Figure 1: Annual GDP Growth (%) 1965 to 2011 ................................................................................... 10
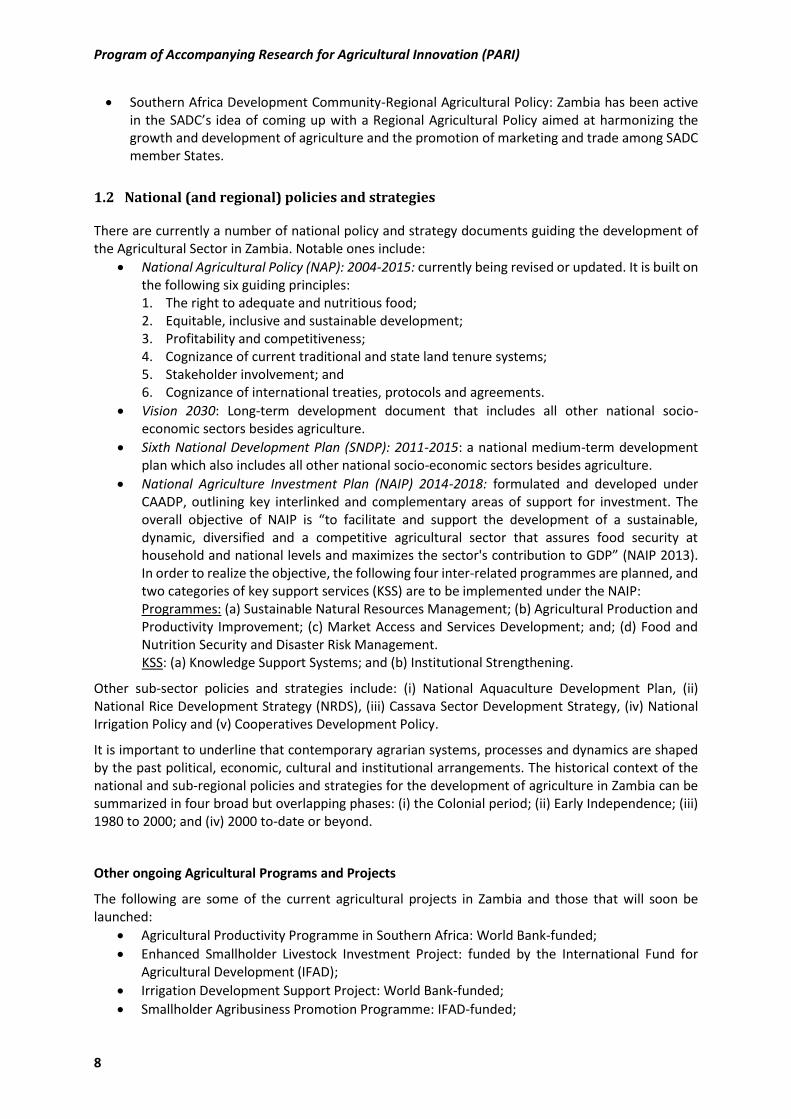
Figure 2: Incidence of Poverty (1996 - 2015) ........................................................................................ 10
Figure 3: Percentage of National Budget Spent on Agriculture 2007-2012: Allocated and Actual
Spending ................................................................................................................................................ 11
Figure 4: 2013 Budget Allocations to Agriculture ................................................................................. 11
Figure 5: Distribution of Poverty Reduction Programme Spending 2013 ............................................. 12
Figure 6: Prevalence of undernourishment and food over-acquisition (1990-92 to 2014-16) ............. 12
Figure 7: Supply of non-staple foods (1990-2013) ................................................................................ 14
Figure 8: Percentage of infants and young children consuming foods from selected food groups (2013-
14) .......................................................................................................................................................... 15
Figure 9: Underweight, overweight and obesity among women of reproductive age (1992-2014) .... 16
Figure 10: Distance to market ............................................................................................................... 25
Figure 11: Cotton price trend in the Chipata and Lundazi districts ....................................................... 28
Program of Accompanying Research for Agricultural Innovation (PARI)
4
Acronyms/Abbreviations
AfDB African Development Bank
CAADP Comprehensive Africa Agriculture Development Programme
COMACO Community Markets for Conservation
COMESA Common Market for Eastern and Southern Africa
CSO Central Statistical Office of Zambia
DHS Demographic and Health Survey
EU European Union
FAO Food and Agriculture Organization
FARA Forum for Agricultural Research in Africa
FFV Fresh Fruits and Vegetables
FRA Food Reserve Agency
GART Golden Valley Agricultural Research Trust
GDP Gross Domestic Product
GHI Global Hunger Index
GIC Green Innovation Center
GIZ Deutsche Gesellschaft für Internationale Zusammenarbeit / German Agency for
International Cooperation
GNI Gross National Income
GRZ Government of the Republic of Zambia
HIV/AIDS Human Immunodeficiency Virus/ Acquired Immune Deficiency Syndrome
IAPRI Indaba Agricultural Policy Research Institute
IFAD International Fund for Agricultural Development
IFPRI International Food Policy Research Institute
IITA International Institute of Tropical Agriculture
IP Innovation Platform
KSS Key Support Services
MT Metric Ton
NAIP National Agriculture Investment Plan
NAP National Agricultural Policy
NEPAD New Partnership for Africa's Development
NGO Non-Governmental Organization
NRDS National Rice Development Strategy
PARI Program of Accompanying Research for Agricultural Innovation
PPP Purchasing Power Parity
R&D Research and Development
RCA Revealed Comparative Advantage
S3A Science Agenda for Agriculture in Africa
SADC Southern African Development Community
SARD-SC Support to Agricultural Research for Development of Strategic Crops in Africa
SEWOH O e Wo ld, No Hu ge i itiati e
SNDP Sixth National Development Plan
SRI System of Rice Intensification
TFP Total Factor Productivity
UNICEF U ited Natio s I te atio al Child e s E e ge Fu d
UNZA University of Zambia
USAID United States Agency for International Development
VCA Value Chain Approach
WHO World Health Organization
ZARI Zambia Agriculture Research Institute
ZEF Zentrum für Entwicklungsforschung / Center for Development Research
Country Dossier Zambia
5
1 General background information of the agricultural and food sectors
The agricultural sector plays an important role in the Zambian economy. It generates between 16 and
20% of the Gross Domestic Product (GDP) and more than 70% of the cou t s populatio depe ds o agriculture for their livelihood, especially in rural areas. The sector also accounts for about 67% of the
labor force and remains the main source of income and employment for rural women and men
(Government of the Republic of Zambia-Food and Agriculture Organization (GRZ-FAO), 2009). The
current Zambian government (and even past governments) has identified agriculture as the main
sector driving the economy, complementing the mining sector which has been the largest contributor
of foreign exchange earnings and national revenue.
The aspirations of the Zambian people – as captured in the Vision 2030 formulated in December 2006
– is among other things, a diversified and balanced and strong industrial sector, a modern agricultural
sector and an efficient and productive services sector (Vision 2030). In the policy context, the Sixth
National Development Plan: 2011-2015 (SNDP: 2011-2015) stipulated that the agricultural sector will
continue to be a strategic area of focus in promoting economic growth, reducing poverty and creating
employment. The major emphasis under the SNDP was on economic diversification, focusing on
agriculture, tourism, manufacturing, mining and energy, as the growth sectors/areas.
This is in cognizance of the cou t s ast esou e e do e t i te s of la d, ate , labor and
climate. This vast natural resource endowment reflects the enormous potential to expand and/or excel
in agricultural development. Out of the 75 million ha total land area, 42 million ha (58%) is classified as
having medium to high potential for agricultural production and being suitable for the production of a
broad range of crops, livestock and fish, considering its annual rainfall ranging between 800 mm to
1500 mm. The potential irrigable land area is over 423,000 ha, of which about 100,000 ha is currently
irrigated by large-scale, emergent and smallholder farmers. With the cou t s a u da t su fa e a d underground water resources, there is potential to drastically increase the area under irrigation (it is
said that Zambia has about 40% of the water resources in the Southern African Development
Community [SADC] region).
Agriculturally, Zambia is classified into three agro-ecological regions (Regions I, II and III) which are
delineated on the basis of agro-climatic conditions, including rainfall patterns, temperature, farming
systems and soil types.
Region I covers parts of Southern, Eastern and Western Provinces and constitutes 12% of the cou t s total land area. This region receives annual rainfall of less than 800 mm, and its soil type is loamy to
clayey on the valley floor and course to fine loamy shallow soils on the escarpment. It is suitable for
the production of crops such as cotton, sesame, sorghum, groundnuts, beans, sweet potatoes, cassava,
rice and millet and has potential for the production of various irrigated crops including fruits and
vegetables. This region is also suitable for extensive cattle production. However, the valley part of the
region is not suitable for cattle rearing due to its hot and humid climate, its low altitude, and because
of the tsetse flies.
Region II is sub-divided into Region IIa and IIb. It constitutes 42% of the country and receives annual
rainfall of between 800 mm to 1,000 mm. Region IIa covers the Central, Lusaka, and parts of Southern
and Eastern provinces. It has, for the most part, inherently fertile soils, and thus permanent settled
systems of agriculture are practiced in this sub-region. A variety of crops are grown, including maize,
cotton, tobacco, sunflower, soybeans, irrigated wheat, groundnuts and other arable crops. The area is
also suitable for flowers, capsicum and vegetable production. The sub-region is also suitable for beef,
dairy and poultry production. On the other hand, sub-Region IIb covers part of Western Province and
consists of sandy soils. It is suitable for the production of cashew nut, rice, cassava, millet and
vegetables; it is also suitable for beef, dairy and poultry production.
Region III: covers the Copperbelt, Luapula, Northern, Muchinga and North-Western Provinces. It
constitutes 46% of the cou t s total la d a ea a d receives an annual rainfall of between 1,000 mm
Program of Accompanying Research for Agricultural Innovation (PARI)
6
and 1,500 mm. With the exception of the Copperbelt Province, the region is characterized by highly
leached, acidic soils and thus the regio s ag i ultu al pote tial a e e ha ed by the application of
agricultural lime and organic matter. However, it has the inherent potential for the production of
millet, cassava, sorghum, beans, groundnuts, coffee, sugarcane, rice and pineapples. Its perennial
streams can be utilized for small-scale irrigation. Increased exploitation of the fisheries resources and
introduction of fish farming offers good opportunities for development.
In nearly all the cou t s Natio al De elop e t Pla s, agriculture has featured prominently. During
the implementation of the National Agricultural Policy (NAP) 2004-2015, the agriculture sector
registered some positive gains in a number of areas. The cited notable ones include:
i) An increase in crop production. For instance, for selected crops, harvests from 2004 to 2013
increased as follows:
Maize: from 1,213,202 metric tons (MT) to 2,532,800 MT (by an average of 12.8 %);
Rice: from 11,699 MT to 44,747 MT (by an average of 18.3 %);
Wheat: from 82,585 MT to 273,584 MT (by an average of 18.8 %);
Cassava: from 911,673 MT to 1,114,583 MT (by an average of 6.4 %);
Groundnuts: from 69,696 MT to 106,792 MT (by an average of 13.9 %);
Mixed beans: from 18,161 MT to 56,411 MT (by an average of 16.8 %);
Soybeans: from 54,687 MT to 261,063 MT (by an average of 26.3 %); and
Sunflower: from 13,857 MT to 33,733 MT (by an average of 29.6 %).
ii) An increase in capture fisheries and aquaculture fish production. Total annual capture fish
production increased from 67,725 MT in 2004 to 76,214 MT in 2012 (by 12.5 %). Total inland
aquaculture fish production, on the other hand, increased from 5,125 MT in 2004 to 12,988 MT in
2012 (by 153 %)
iii) A general increase in the pig population from 286,726 in 2004 to 704,832 in 2008. However, the
goat population decreased from 1,002,376 in 2004 to 746,143 in 2008 and the cattle population
decreased from 2,341,970 in 2004 to 2,315,327 in 2008;
iv) Additionally, the average maize yields of small scale farmers increased from 1.93 MT/ha in 2004 to
2.24 MT/ha in 2012, thereby marginally contributing to increased maize production, an increase
that was previously attributed to increased area under maize production. However, it should be
noted that these average yields dipped from 1.93 MT/ha in 2004 to 1.31 MT/ha in 2008 before
reaching a maximum of 2.25 MT/ha in 2010 and again decreasing to 1.93 MT/ha in 2013. This
indicates that no meaningful progress has been recorded in achieving increased productivity in
maize production, despite huge investments made in providing input subsidies. Low productivity
has been attributed to unfavorable rainfall conditions, weak extension services and poor research
and technology transfer.
A o di g to the Ce t al “tatisti al Offi e s C“O Living Conditions Monitoring Surveys of 2006 and
2010, agriculture has marginally increased rural incomes and contributed marginally to poverty
reduction and increased food and nutrition security (Mason et al., 2013).
Additionally, the increases in agriculture production and/or gains recorded during the implementation
of the NAP: 2004-2015 have not been significant enough to meet the growing domestic and foreign
demand for Zambian agricultural commodities. This is also despite the skewed increase in government
budgetary allocations (more than 60%) of the expenditure towards maize production and marketing.
In twelve African countries, including Zambia, Green Innovation Centers (GICs) have been established
i sele ted egio s u de the O e Wo ld, No Hu ge Initiative (SEWOH) of the German government
and other investors. The aim of the GICs is to promote agricultural innovation, improve food and
nutrition security and build sustainable value chains in the agri-food sector. The selected value chains
in Zambia are legume value chains (particularly soybean and groundnut) in the Petauke and Katete
districts in the Eastern Province and the milk value chain in the Choma district in the Southern Province.
Country Dossier Zambia
7
1.1 Pan-African policies and strategies
Zambia is part of or aligned with a number of strategies and frameworks existing at continental,
regional and/or sub-regional levels for agricultural and rural development. These include those
developed by the African Union, the SADC and the Common Market for Eastern and Southern Africa
(COMESA). A few examples include:
The Comprehensive Africa Agriculture Development Programme (CAADP) which was endorsed
by African Heads of State and Governments in Maputo, Mozambique in 2003. The CAADP aims
at achieving and sustaining a higher path of economic growth through agriculture-led
development on the African continent. The preparation of the CAADP was facilitated by the Food
and Agriculture Organization of the United Nations (FAO) in close collaboration with the New
Partnership for Af i a s De elop e t NEPAD) Secretariat. It was then implemented by the
NEPAD. In Zambia, the CAADP process, which was launched in 2006, supports the
implementation of National Development Plans. The program implementation has been
participatory and inclusive of key stakeholder groups, including the farmer organizations,
especially the Zambia Natio al Fa e s U io , the private sector, agricultural research
institutions, academia, civil society groups and development partners. The CAADP has been
prepared to promote interventions that best respond to the widely recognized African
agricultural crisis. In its commitment to the CAADP, Zambia also developed and signed the CAADP
Compact on 18th January 2011 to support the implementation of the Vision 2030 and NAP.
U de CAADP, Af i a ou t ies go e e ts ag eed to o it at least % of thei atio al budget to agriculture, projecting that it will lead to a 6% annual growth rate for the sector, with
the specific aim of reducing poverty and hunger by 50% by 2015.
CAADP is a strategic framework that has helped guide agricultural development in Zambia and is
used as a framework to detail programs and projects that the various stakeholders in the
agriculture sector can buy into and that address national priorities. Consequently, there has been
increased investment in agriculture by the government, although the larger portion of
investment comes from cooperating partners and donors, which raises the question of
sustainability of agricultural investment initiatives (Chomba et. al., 2016). Going further under
CAADP, Zambia has developed the National Agriculture Investment Plan (NAIP) 2014-2018,
designed to make a difference in the manner in which the agricultural development agenda will
be pursued in the country. The emphasis of NAIP is pro-poor agricultural-led economic
development;
The African Peer Review Mechanism in 2004, implemented one year after endorsement of the
CAADP;
The Abuja Declaration on Fertilizer for an African Green Revolution, under which the African
Union Member States resolved to increase fertilizer use from 8.0 Kg to 50.0 Kg of nutrients per
hectare by 2015;
The Malabo Declaration of June 2014, intended to accelerate agricultural growth and
transformation for shared prosperity and improved livelihoods by harnessing opportunities for
inclusive growth and sustainable development;
The Science Agenda for Agriculture in Africa (S3A) 2014, which was developed by a coalition of
actors under the leadership of the Forum for Agricultural Research in Africa (FARA). The S3A is
an African-owned and led process that articulates the science, technology, extension,
innovations, policy and social learning that Africa needs to apply in order to meet its agricultural
and overall development goals. The Science Agenda, in the medium- to long-term, aims at
building systemic science capacity at national and regional levels, capable of resolving evolving
needs for farmers, producers, entrepreneurs and consumers, e.g. effects of climate change;
Program of Accompanying Research for Agricultural Innovation (PARI)
8
Southern Africa Development Community-Regional Agricultural Policy: Zambia has been active
i the “ADC s idea of o i g up with a Regional Agricultural Policy aimed at harmonizing the
growth and development of agriculture and the promotion of marketing and trade among SADC
member States.
1.2 National (and regional) policies and strategies
There are currently a number of national policy and strategy documents guiding the development of
the Agricultural Sector in Zambia. Notable ones include:
National Agricultural Policy (NAP): 2004-2015: currently being revised or updated. It is built on
the following six guiding principles:
1. The right to adequate and nutritious food;
2. Equitable, inclusive and sustainable development;
3. Profitability and competitiveness;
4. Cognizance of current traditional and state land tenure systems;
5. Stakeholder involvement; and
6. Cognizance of international treaties, protocols and agreements.
Vision 2030: Long-term development document that includes all other national socio-
economic sectors besides agriculture.
Sixth National Development Plan (SNDP): 2011-2015: a national medium-term development
plan which also includes all other national socio-economic sectors besides agriculture.
National Agriculture Investment Plan (NAIP) 2014-2018: formulated and developed under
CAADP, outlining key interlinked and complementary areas of support for investment. The
o e all o je ti e of NAIP is to fa ilitate and support the development of a sustainable,
dynamic, diversified and a competitive agricultural sector that assures food security at
household a d atio al le els a d a i izes the se to 's o t i utio to GDP (NAIP 2013).
In order to realize the objective, the following four inter-related programmes are planned, and
two categories of key support services (KSS) are to be implemented under the NAIP:
Programmes: (a) Sustainable Natural Resources Management; (b) Agricultural Production and
Productivity Improvement; (c) Market Access and Services Development; and; (d) Food and
Nutrition Security and Disaster Risk Management.
KSS: (a) Knowledge Support Systems; and (b) Institutional Strengthening.
Other sub-sector policies and strategies include: (i) National Aquaculture Development Plan, (ii)
National Rice Development Strategy (NRDS), (iii) Cassava Sector Development Strategy, (iv) National
Irrigation Policy and (v) Cooperatives Development Policy.
It is important to underline that contemporary agrarian systems, processes and dynamics are shaped
by the past political, economic, cultural and institutional arrangements. The historical context of the
national and sub-regional policies and strategies for the development of agriculture in Zambia can be
summarized in four broad but overlapping phases: (i) the Colonial period; (ii) Early Independence; (iii)
1980 to 2000; and (iv) 2000 to-date or beyond.
Other ongoing Agricultural Programs and Projects
The following are some of the current agricultural projects in Zambia and those that will soon be
launched:
Agricultural Productivity Programme in Southern Africa: World Bank-funded;
Enhanced Smallholder Livestock Investment Project: funded by the International Fund for
Agricultural Development (IFAD);
Irrigation Development Support Project: World Bank-funded;
Smallholder Agribusiness Promotion Programme: IFAD-funded;
Country Dossier Zambia
9
Livestock Development and Animal Health Project: World Bank-funded;
Livestock Infrastructure Support Project: African Development Bank (AfDB)-funded;
Support to Productivity and Production Project (S3P): IFAD-funded;
Pilot Project on Climate Resilience: World Bank-funded through the Zambia National Climate
Change Secretariat;
Farmer Input Support Programme: Government of the Republic of Zambia (GRZ)-funded;
Support to the Agricultural Sector Performance Enhancement Programme-Phase II: European
Union (EU)-funded;
Conservation Agriculture Scaling-Up Project: EU-funded through the FAO;
Agricultural Productivity and Market Enhancement Project (APMEP): AfDB-funded;
Strengthening Rice Seed Production and Enhancing Extension Services to increase Rice
Production in Zambia (FAO);
Developing Value Chain Innovations and Value Chains to Improve Food Security in East &
Southern Africa: Australian-agency-funded;
Food Security Pack: GRZ-funded;
Program of Accompanying Research for Agricultural Innovation (PARI): University of Bonn
(German Government)-funded through FARA.
1.3 Data on food and nutrition security in Zambia and the GIC region
The following section includes information about important socio-economic and agricultural indicators
and data on diet quantity, diet quality and nutrition status.
1.3.1 Socio-economic and agricultural data
Table 1: Selected national economic and health-related data
Indicator Value Year
Population, total 1,5021,002 2014
Population growth (annual %) 2.5 2014
Rural population (% of total population) 60 2014
GDP per capita, PPP (constant 2011 international $) 3898 2014
GNI per capita, PPP (constant 2011 international $) 52,914,077,683 2013
Poverty headcount ratio at $2 a day (PPP) (% of population) 87 2010
Poverty headcount ratio at $1.25 a day (PPP) (% of population) 74 2010
Poverty headcount ratio at national poverty lines (% of population) 61 2010
Rural poverty headcount ratio at national poverty lines (% of rural population) 78 2010
Agricultural land (% of land area) 32 2012
Agriculture value added per worker (constant 2005 US$) 353 2014
Agriculture, value added (% of GDP) 10 2013
Access to electricity, rural (% of rural population) 5.8 2012
Employees, agriculture, female (% of female employment) 79 2005
Employees, agriculture, male (% of male employment) 66 2005
Employment in agriculture (% of total employment) 72 2005
Literacy rate, adult total (% of people ages 15 and above) 61 2007
Ratio of female to male secondary enrollment (%) 59 1988
Mortality rate, under-5 (per 1,000 live births) 87 2013
Maternal mortality ratio (modeled estimate, per 100,000 live births) 280 2013
Source: World Bank, http://data.worldbank.org/country
Note: GDP refers to Gross Domestic Product; GNI refers to Gross National Income; PPP refers to Purchasing Power Parity
Program of Accompanying Research for Agricultural Innovation (PARI)
10
Figure 1: Annual GDP Growth (%) 1965 to 2011
Source: Autho s p ese tatio ased o data f o CSO (2014)
Figure 2: Incidence of Poverty (1996 - 2015)
Source: Autho s p ese tatio ased o data f o CSO (2014)
17
-2
2
-2
45.2
6.2 5.7 6 6.37.6
6.6
-5
0
5
10
15
20
1965 1975 1985 1995 2000 2005 2006 2007 2008 2009 2010 2011
% G
DP
Gro
wth
Year
0
10
20
30
40
50
60
70
80
90
100
1996 1998 2003 2004 2006 2010 2015
Pe
rce
nt
Total Rural Urban
Country Dossier Zambia
11
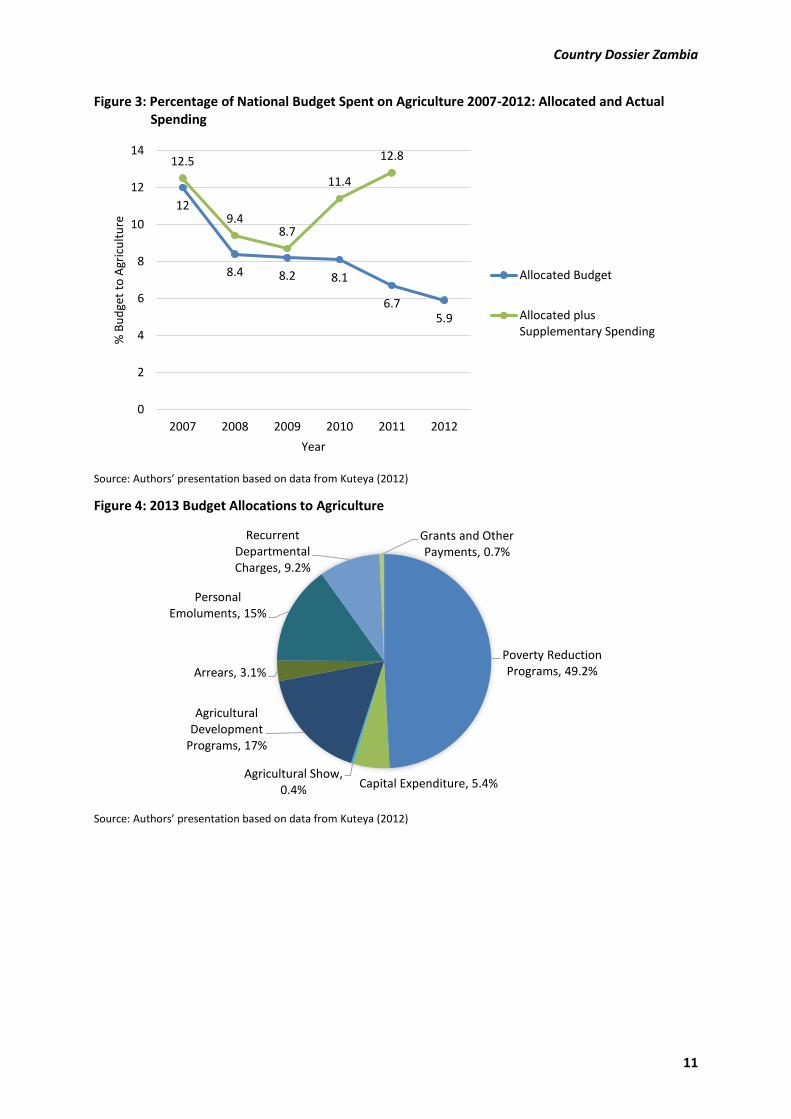
Figure 3: Percentage of National Budget Spent on Agriculture 2007-2012: Allocated and Actual
Spending
Source: Autho s p ese tatio ased o data f o Kuteya (2012)
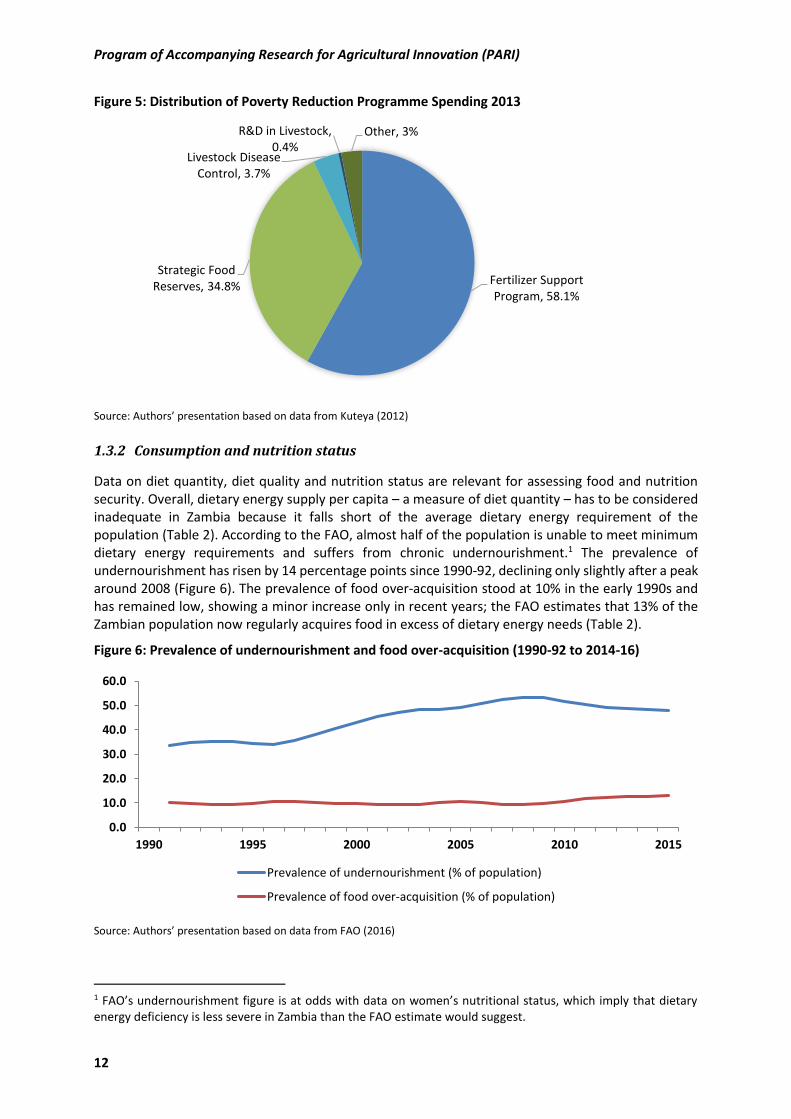
Figure 4: 2013 Budget Allocations to Agriculture
Source: Autho s p ese tatio ased o data f o Kuteya (2012)
12
8.4 8.2 8.1
6.75.9
12.5
9.48.7
11.4
12.8
0
2
4
6
8
10
12
14
2007 2008 2009 2010 2011 2012
% B
ud
ge
t to
Ag
ricu
ltu
re
Year
Allocated Budget
Allocated plus
Supplementary Spending
Poverty Reduction
Programs, 49.2%
Capital Expenditure, 5.4%Agricultural Show,
0.4%
Agricultural
Development
Programs, 17%
Arrears, 3.1%
Personal
Emoluments, 15%
Recurrent
Departmental
Charges, 9.2%
Grants and Other
Payments, 0.7%
Program of Accompanying Research for Agricultural Innovation (PARI)
12
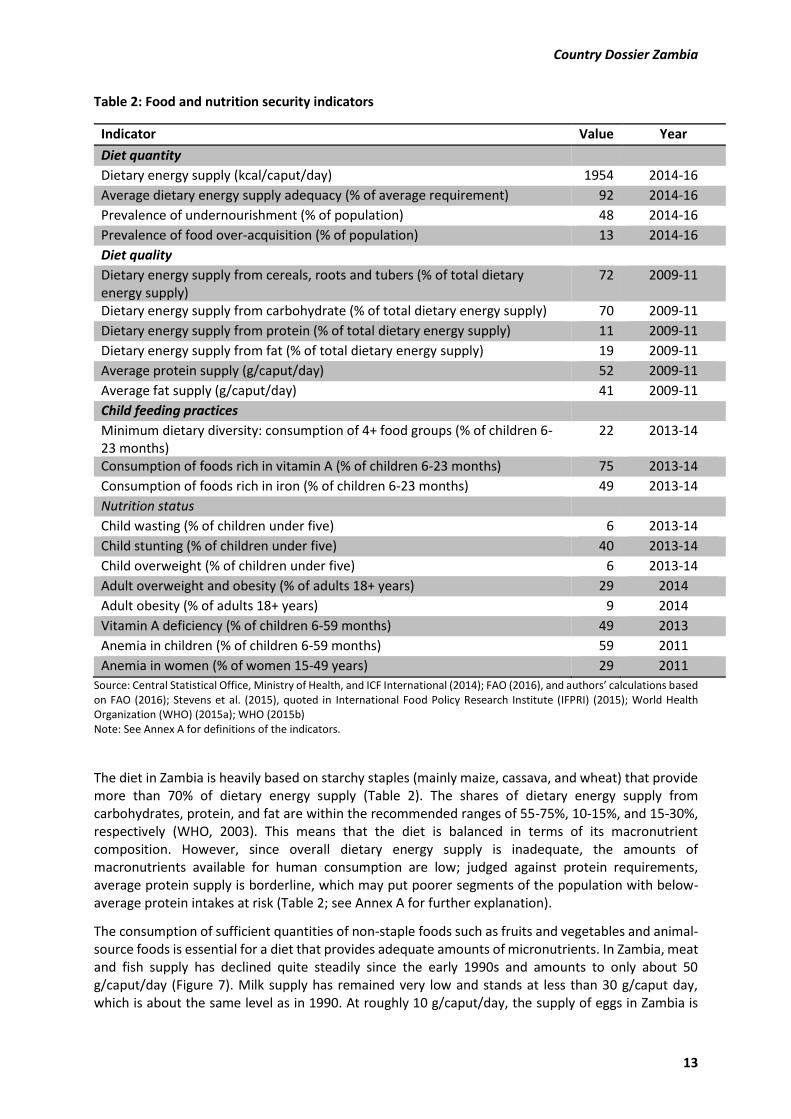
Figure 5: Distribution of Poverty Reduction Programme Spending 2013
Source: Autho s p ese tatio ased o data f o Kuteya (2012)
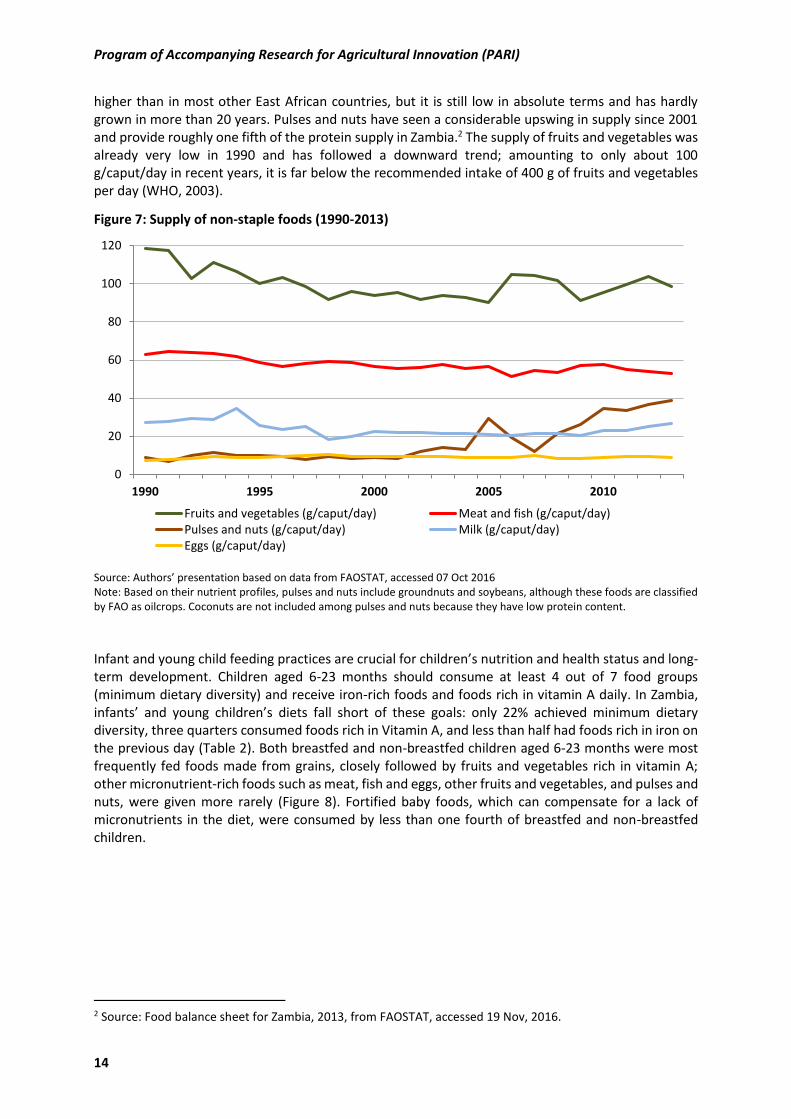
1.3.2 Consumption and nutrition status
Data on diet quantity, diet quality and nutrition status are relevant for assessing food and nutrition
security. Overall, dietary energy supply per capita – a measure of diet quantity – has to be considered
inadequate in Zambia because it falls short of the average dietary energy requirement of the
population (Table 2). According to the FAO, almost half of the population is unable to meet minimum
dietary energy requirements and suffers from chronic undernourishment.1 The prevalence of
undernourishment has risen by 14 percentage points since 1990-92, declining only slightly after a peak
around 2008 (Figure 6). The prevalence of food over-acquisition stood at 10% in the early 1990s and
has remained low, showing a minor increase only in recent years; the FAO estimates that 13% of the
Zambian population now regularly acquires food in excess of dietary energy needs (Table 2).
Figure 6: Prevalence of undernourishment and food over-acquisition (1990-92 to 2014-16)
Source: Autho s p ese tatio ased o data f o FAO
1 FAO s u de ou ish e t figu e is at odds ith data o o e s ut itio al status, hi h i pl that dieta energy deficiency is less severe in Zambia than the FAO estimate would suggest.
Fertilizer Support
Program, 58.1%
Strategic Food
Reserves, 34.8%
Livestock Disease
Control, 3.7%
R&D in Livestock,
0.4%
Other, 3%
0.0
10.0
20.0
30.0
40.0
50.0
60.0
1990 1995 2000 2005 2010 2015
Prevalence of undernourishment (% of population)
Prevalence of food over-acquisition (% of population)
Country Dossier Zambia
13
Table 2: Food and nutrition security indicators
Indicator Value Year
Diet quantity
Dietary energy supply (kcal/caput/day) 1954 2014-16
Average dietary energy supply adequacy (% of average requirement) 92 2014-16
Prevalence of undernourishment (% of population) 48 2014-16
Prevalence of food over-acquisition (% of population) 13 2014-16
Diet quality
Dietary energy supply from cereals, roots and tubers (% of total dietary
energy supply)
72 2009-11
Dietary energy supply from carbohydrate (% of total dietary energy supply) 70 2009-11
Dietary energy supply from protein (% of total dietary energy supply) 11 2009-11
Dietary energy supply from fat (% of total dietary energy supply) 19 2009-11
Average protein supply (g/caput/day) 52 2009-11
Average fat supply (g/caput/day) 41 2009-11
Child feeding practices
Minimum dietary diversity: consumption of 4+ food groups (% of children 6-
23 months)
22 2013-14
Consumption of foods rich in vitamin A (% of children 6-23 months) 75 2013-14
Consumption of foods rich in iron (% of children 6-23 months) 49 2013-14
Nutrition status
Child wasting (% of children under five) 6 2013-14
Child stunting (% of children under five) 40 2013-14
Child overweight (% of children under five) 6 2013-14
Adult overweight and obesity (% of adults 18+ years) 29 2014
Adult obesity (% of adults 18+ years) 9 2014
Vitamin A deficiency (% of children 6-59 months) 49 2013
Anemia in children (% of children 6-59 months) 59 2011
Anemia in women (% of women 15-49 years) 29 2011
“ou e: Ce t al “tatisti al Offi e, Mi ist of Health, a d ICF I te atio al ; FAO , a d autho s al ulatio s ased
on FAO (2016); Stevens et al. (2015), quoted in International Food Policy Research Institute (IFPRI) (2015); World Health
Organization (WHO) (2015a); WHO (2015b)
Note: See Annex A for definitions of the indicators.
The diet in Zambia is heavily based on starchy staples (mainly maize, cassava, and wheat) that provide
more than 70% of dietary energy supply (Table 2). The shares of dietary energy supply from
carbohydrates, protein, and fat are within the recommended ranges of 55-75%, 10-15%, and 15-30%,
respectively (WHO, 2003). This means that the diet is balanced in terms of its macronutrient
composition. However, since overall dietary energy supply is inadequate, the amounts of
macronutrients available for human consumption are low; judged against protein requirements,
average protein supply is borderline, which may put poorer segments of the population with below-
average protein intakes at risk (Table 2; see Annex A for further explanation).
The consumption of sufficient quantities of non-staple foods such as fruits and vegetables and animal-
source foods is essential for a diet that provides adequate amounts of micronutrients. In Zambia, meat
and fish supply has declined quite steadily since the early 1990s and amounts to only about 50
g/caput/day (Figure 7). Milk supply has remained very low and stands at less than 30 g/caput day,
which is about the same level as in 1990. At roughly 10 g/caput/day, the supply of eggs in Zambia is
Program of Accompanying Research for Agricultural Innovation (PARI)
14
higher than in most other East African countries, but it is still low in absolute terms and has hardly
grown in more than 20 years. Pulses and nuts have seen a considerable upswing in supply since 2001
and provide roughly one fifth of the protein supply in Zambia.2 The supply of fruits and vegetables was
already very low in 1990 and has followed a downward trend; amounting to only about 100
g/caput/day in recent years, it is far below the recommended intake of 400 g of fruits and vegetables
per day (WHO, 2003).
Figure 7: Supply of non-staple foods (1990-2013)
“ou e: Autho s p ese tatio ased o data f o FAO“TAT, a essed O t
Note: Based on their nutrient profiles, pulses and nuts include groundnuts and soybeans, although these foods are classified
by FAO as oilcrops. Coconuts are not included among pulses and nuts because they have low protein content.
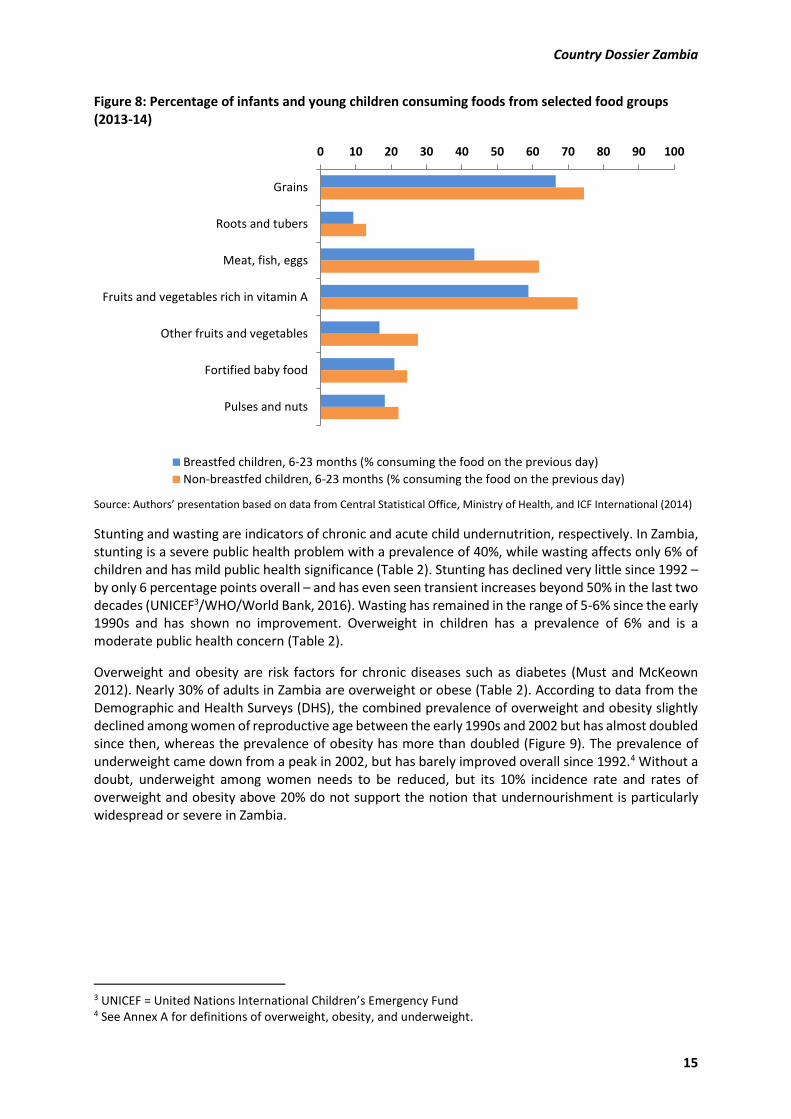
Infant and young child feeding practices are crucial for childre s ut ition and health status and long-
term development. Children aged 6-23 months should consume at least 4 out of 7 food groups
(minimum dietary diversity) and receive iron-rich foods and foods rich in vitamin A daily. In Zambia,
i fa ts a d ou g hild e s diets fall sho t of these goals: o l % a hie ed i i u dieta diversity, three quarters consumed foods rich in Vitamin A, and less than half had foods rich in iron on
the previous day (Table 2). Both breastfed and non-breastfed children aged 6-23 months were most
frequently fed foods made from grains, closely followed by fruits and vegetables rich in vitamin A;
other micronutrient-rich foods such as meat, fish and eggs, other fruits and vegetables, and pulses and
nuts, were given more rarely (Figure 8). Fortified baby foods, which can compensate for a lack of
micronutrients in the diet, were consumed by less than one fourth of breastfed and non-breastfed
children.
2 Source: Food balance sheet for Zambia, 2013, from FAOSTAT, accessed 19 Nov, 2016.
0
20
40
60
80
100
120
1990 1995 2000 2005 2010
Fruits and vegetables (g/caput/day) Meat and fish (g/caput/day)
Pulses and nuts (g/caput/day) Milk (g/caput/day)
Eggs (g/caput/day)
Country Dossier Zambia
15
Figure 8: Percentage of infants and young children consuming foods from selected food groups
(2013-14)
“ou e: Autho s p ese tatio ased o data f o Ce t al “tatisti al Offi e, Mi ist of Health, a d ICF I te atio al
Stunting and wasting are indicators of chronic and acute child undernutrition, respectively. In Zambia,
stunting is a severe public health problem with a prevalence of 40%, while wasting affects only 6% of
children and has mild public health significance (Table 2). Stunting has declined very little since 1992 –
by only 6 percentage points overall – and has even seen transient increases beyond 50% in the last two
decades (UNICEF3/WHO/World Bank, 2016). Wasting has remained in the range of 5-6% since the early
1990s and has shown no improvement. Overweight in children has a prevalence of 6% and is a
moderate public health concern (Table 2).
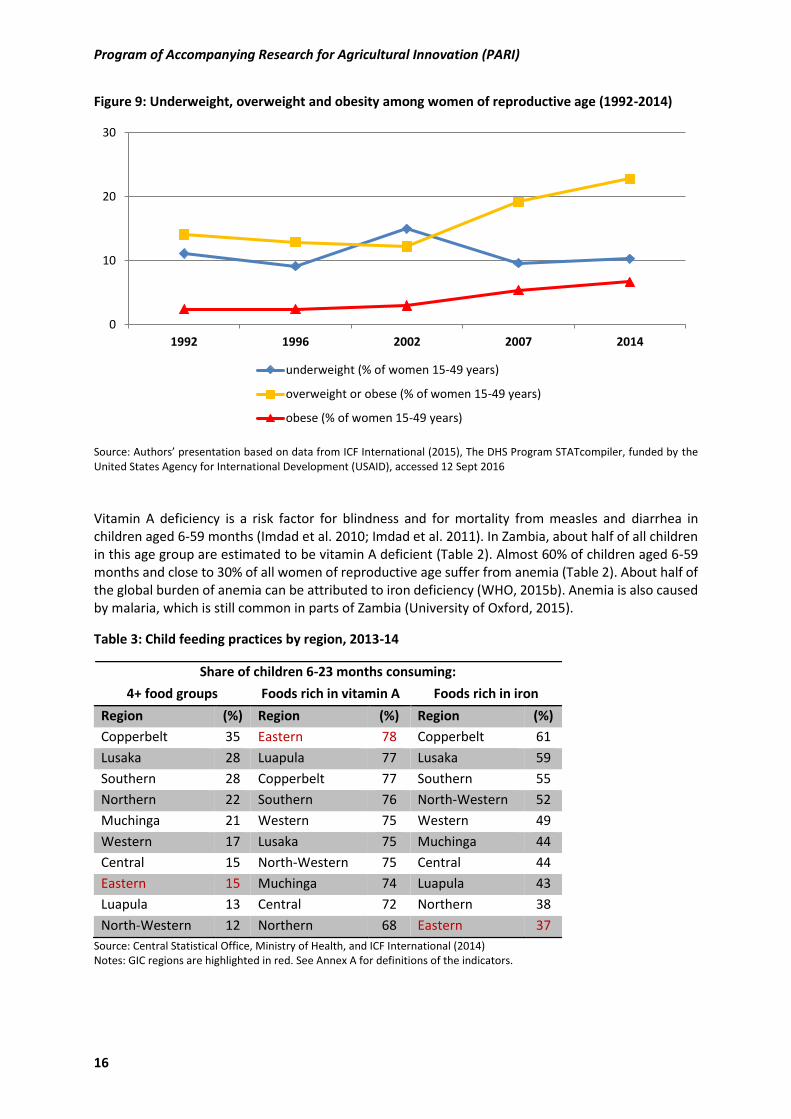
Overweight and obesity are risk factors for chronic diseases such as diabetes (Must and McKeown
2012). Nearly 30% of adults in Zambia are overweight or obese (Table 2). According to data from the
Demographic and Health Surveys (DHS), the combined prevalence of overweight and obesity slightly
declined among women of reproductive age between the early 1990s and 2002 but has almost doubled
since then, whereas the prevalence of obesity has more than doubled (Figure 9). The prevalence of
underweight came down from a peak in 2002, but has barely improved overall since 1992.4 Without a
doubt, underweight among women needs to be reduced, but its 10% incidence rate and rates of
overweight and obesity above 20% do not support the notion that undernourishment is particularly
widespread or severe in Zambia.
3 UNICEF = U ited Natio s I te atio al Child e s E e ge Fu d 4 See Annex A for definitions of overweight, obesity, and underweight.
0 10 20 30 40 50 60 70 80 90 100
Grains
Roots and tubers
Meat, fish, eggs
Fruits and vegetables rich in vitamin A
Other fruits and vegetables
Fortified baby food
Pulses and nuts
Breastfed children, 6-23 months (% consuming the food on the previous day)
Non-breastfed children, 6-23 months (% consuming the food on the previous day)
Program of Accompanying Research for Agricultural Innovation (PARI)
16
Figure 9: Underweight, overweight and obesity among women of reproductive age (1992-2014)
Source: Autho s p ese tatio ased o data f o ICF I te atio al , The DH“ P og a “TAT o pile , fu ded the
United States Agency for International Development (USAID), accessed 12 Sept 2016
Vitamin A deficiency is a risk factor for blindness and for mortality from measles and diarrhea in
children aged 6-59 months (Imdad et al. 2010; Imdad et al. 2011). In Zambia, about half of all children
in this age group are estimated to be vitamin A deficient (Table 2). Almost 60% of children aged 6-59
months and close to 30% of all women of reproductive age suffer from anemia (Table 2). About half of
the global burden of anemia can be attributed to iron deficiency (WHO, 2015b). Anemia is also caused
by malaria, which is still common in parts of Zambia (University of Oxford, 2015).
Table 3: Child feeding practices by region, 2013-14
Share of children 6-23 months consuming:
4+ food groups Foods rich in vitamin A Foods rich in iron
Region (%) Region (%) Region (%)
Copperbelt 35 Eastern 78 Copperbelt 61
Lusaka 28 Luapula 77 Lusaka 59
Southern 28 Copperbelt 77 Southern 55
Northern 22 Southern 76 North-Western 52
Muchinga 21 Western 75 Western 49
Western 17 Lusaka 75 Muchinga 44
Central 15 North-Western 75 Central 44
Eastern 15 Muchinga 74 Luapula 43
Luapula 13 Central 72 Northern 38
North-Western 12 Northern 68 Eastern 37
Source: Central Statistical Office, Ministry of Health, and ICF International (2014)
Notes: GIC regions are highlighted in red. See Annex A for definitions of the indicators.
0
10
20
30
1992 1996 2002 2007 2014
underweight (% of women 15-49 years)
overweight or obese (% of women 15-49 years)
obese (% of women 15-49 years)
Country Dossier Zambia
17
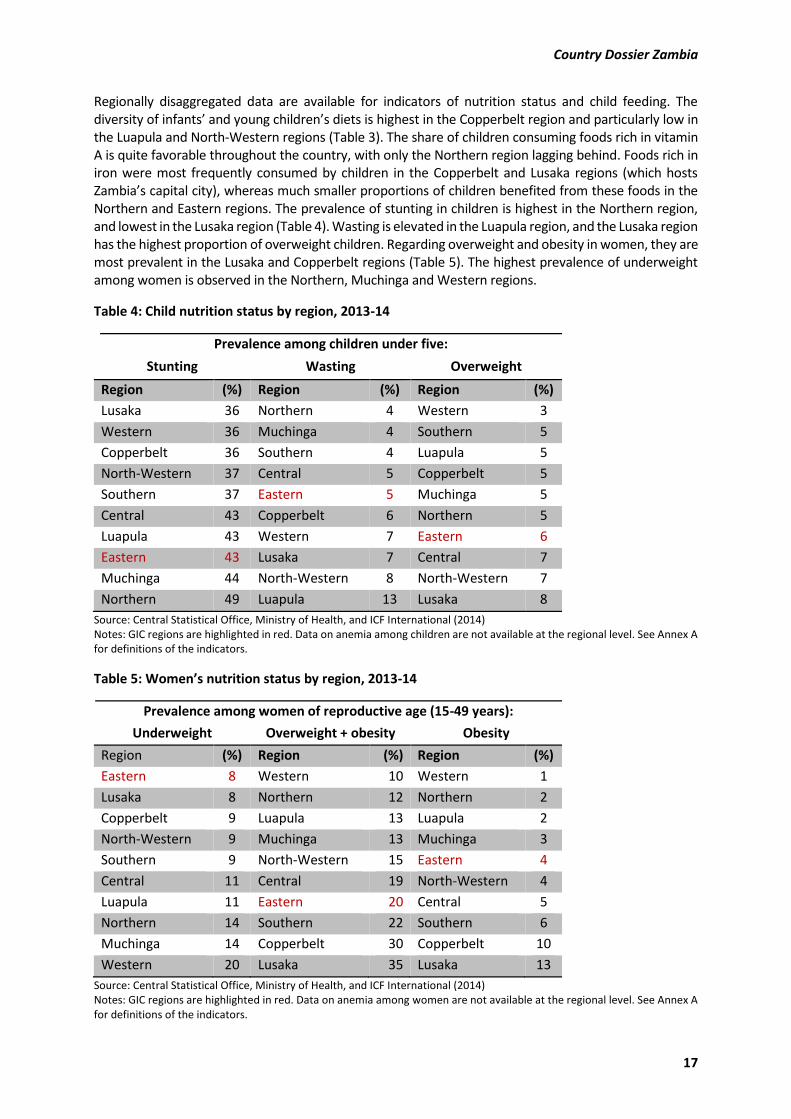
Regionally disaggregated data are available for indicators of nutrition status and child feeding. The
di e sit of i fa ts a d ou g hild e s diets is highest in the Copperbelt region and particularly low in
the Luapula and North-Western regions (Table 3). The share of children consuming foods rich in vitamin
A is quite favorable throughout the country, with only the Northern region lagging behind. Foods rich in
iron were most frequently consumed by children in the Copperbelt and Lusaka regions (which hosts
)a ia s apital it , he eas u h s alle p opo tio s of hild e e efited f o these foods i the Northern and Eastern regions. The prevalence of stunting in children is highest in the Northern region,
and lowest in the Lusaka region (Table 4). Wasting is elevated in the Luapula region, and the Lusaka region
has the highest proportion of overweight children. Regarding overweight and obesity in women, they are
most prevalent in the Lusaka and Copperbelt regions (Table 5). The highest prevalence of underweight
among women is observed in the Northern, Muchinga and Western regions.
Table 4: Child nutrition status by region, 2013-14
Prevalence among children under five:
Stunting Wasting Overweight
Region (%) Region (%) Region (%)
Lusaka 36 Northern 4 Western 3
Western 36 Muchinga 4 Southern 5
Copperbelt 36 Southern 4 Luapula 5
North-Western 37 Central 5 Copperbelt 5
Southern 37 Eastern 5 Muchinga 5
Central 43 Copperbelt 6 Northern 5
Luapula 43 Western 7 Eastern 6
Eastern 43 Lusaka 7 Central 7
Muchinga 44 North-Western 8 North-Western 7
Northern 49 Luapula 13 Lusaka 8
Source: Central Statistical Office, Ministry of Health, and ICF International (2014)
Notes: GIC regions are highlighted in red. Data on anemia among children are not available at the regional level. See Annex A
for definitions of the indicators.
Table 5: Wo e ’s utritio status by region, 2013-14
Prevalence among women of reproductive age (15-49 years):
Underweight Overweight + obesity Obesity
Region (%) Region (%) Region (%)
Eastern 8 Western 10 Western 1
Lusaka 8 Northern 12 Northern 2
Copperbelt 9 Luapula 13 Luapula 2
North-Western 9 Muchinga 13 Muchinga 3
Southern 9 North-Western 15 Eastern 4
Central 11 Central 19 North-Western 4
Luapula 11 Eastern 20 Central 5
Northern 14 Southern 22 Southern 6
Muchinga 14 Copperbelt 30 Copperbelt 10
Western 20 Lusaka 35 Lusaka 13
Source: Central Statistical Office, Ministry of Health, and ICF International (2014)
Notes: GIC regions are highlighted in red. Data on anemia among women are not available at the regional level. See Annex A
for definitions of the indicators.
Program of Accompanying Research for Agricultural Innovation (PARI)
18
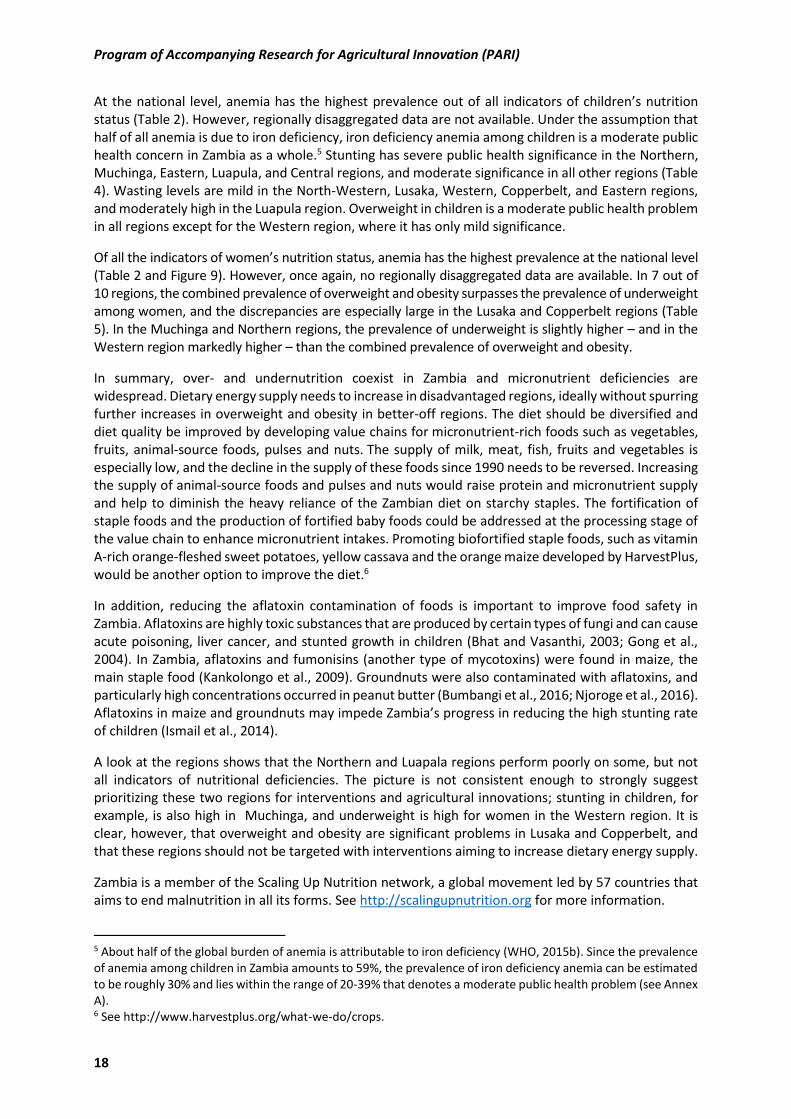
At the national level, anemia has the highest prevalence out of all i di ato s of hild e s ut itio status (Table 2). However, regionally disaggregated data are not available. Under the assumption that
half of all anemia is due to iron deficiency, iron deficiency anemia among children is a moderate public
health concern in Zambia as a whole.5 Stunting has severe public health significance in the Northern,
Muchinga, Eastern, Luapula, and Central regions, and moderate significance in all other regions (Table
4). Wasting levels are mild in the North-Western, Lusaka, Western, Copperbelt, and Eastern regions,
and moderately high in the Luapula region. Overweight in children is a moderate public health problem
in all regions except for the Western region, where it has only mild significance.
Of all the i di ato s of o e s ut itio status, a e ia has the highest p e ale e at the ational level
(Table 2 and Figure 9). However, once again, no regionally disaggregated data are available. In 7 out of
10 regions, the combined prevalence of overweight and obesity surpasses the prevalence of underweight
among women, and the discrepancies are especially large in the Lusaka and Copperbelt regions (Table
5). In the Muchinga and Northern regions, the prevalence of underweight is slightly higher – and in the
Western region markedly higher – than the combined prevalence of overweight and obesity.
In summary, over- and undernutrition coexist in Zambia and micronutrient deficiencies are
widespread. Dietary energy supply needs to increase in disadvantaged regions, ideally without spurring
further increases in overweight and obesity in better-off regions. The diet should be diversified and
diet quality be improved by developing value chains for micronutrient-rich foods such as vegetables,
fruits, animal-source foods, pulses and nuts. The supply of milk, meat, fish, fruits and vegetables is
especially low, and the decline in the supply of these foods since 1990 needs to be reversed. Increasing
the supply of animal-source foods and pulses and nuts would raise protein and micronutrient supply
and help to diminish the heavy reliance of the Zambian diet on starchy staples. The fortification of
staple foods and the production of fortified baby foods could be addressed at the processing stage of
the value chain to enhance micronutrient intakes. Promoting biofortified staple foods, such as vitamin
A-rich orange-fleshed sweet potatoes, yellow cassava and the orange maize developed by HarvestPlus,
would be another option to improve the diet.6
In addition, reducing the aflatoxin contamination of foods is important to improve food safety in
Zambia. Aflatoxins are highly toxic substances that are produced by certain types of fungi and can cause
acute poisoning, liver cancer, and stunted growth in children (Bhat and Vasanthi, 2003; Gong et al.,
2004). In Zambia, aflatoxins and fumonisins (another type of mycotoxins) were found in maize, the
main staple food (Kankolongo et al., 2009). Groundnuts were also contaminated with aflatoxins, and
particularly high concentrations occurred in peanut butter (Bumbangi et al., 2016; Njoroge et al., 2016).
Aflatoxins in maize and groundnuts a i pede )a ia s p og ess i edu i g the high stu ti g ate of children (Ismail et al., 2014).
A look at the regions shows that the Northern and Luapala regions perform poorly on some, but not
all indicators of nutritional deficiencies. The picture is not consistent enough to strongly suggest
prioritizing these two regions for interventions and agricultural innovations; stunting in children, for
example, is also high in Muchinga, and underweight is high for women in the Western region. It is
clear, however, that overweight and obesity are significant problems in Lusaka and Copperbelt, and
that these regions should not be targeted with interventions aiming to increase dietary energy supply.
Zambia is a member of the Scaling Up Nutrition network, a global movement led by 57 countries that
aims to end malnutrition in all its forms. See http://scalingupnutrition.org for more information.
5 About half of the global burden of anemia is attributable to iron deficiency (WHO, 2015b). Since the prevalence
of anemia among children in Zambia amounts to 59%, the prevalence of iron deficiency anemia can be estimated
to be roughly 30% and lies within the range of 20-39% that denotes a moderate public health problem (see Annex
A). 6 See http://www.harvestplus.org/what-we-do/crops.
Country Dossier Zambia
19
1.4 Data on most relevant crops and value chains
1.4.1 Production
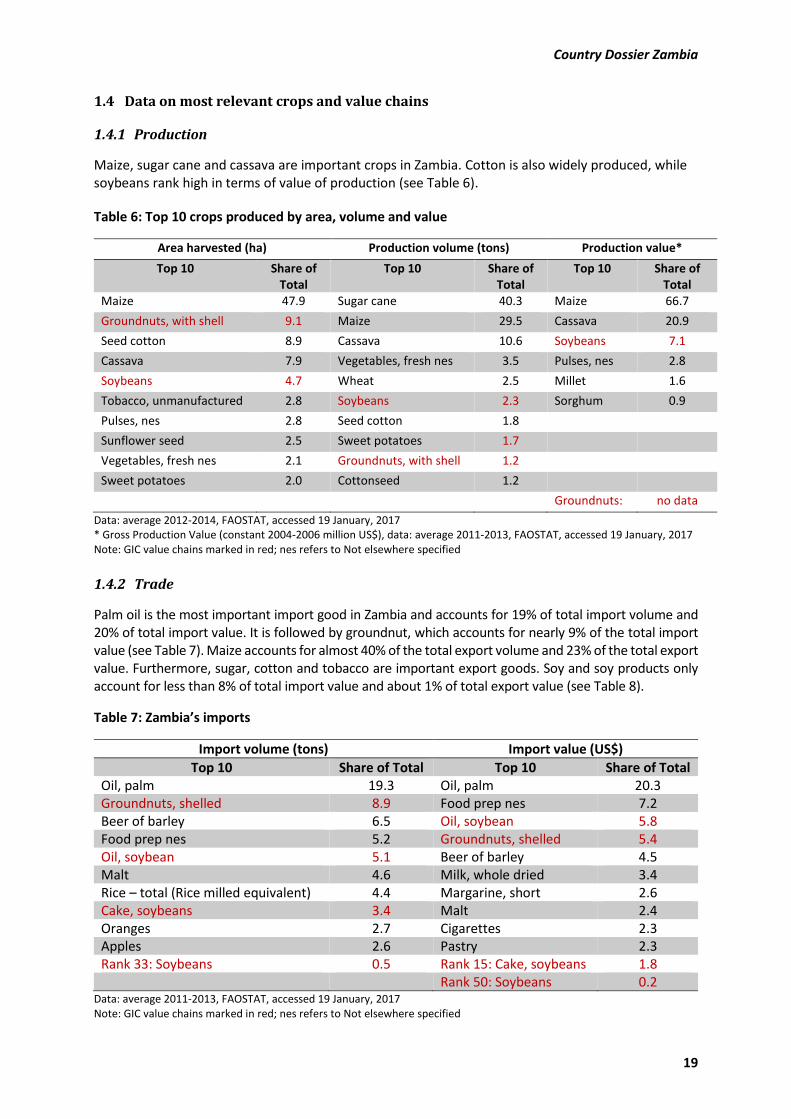
Maize, sugar cane and cassava are important crops in Zambia. Cotton is also widely produced, while
soybeans rank high in terms of value of production (see Table 6).
Table 6: Top 10 crops produced by area, volume and value
Area harvested (ha) Production volume (tons) Production value*
Top 10 Share of
Total
Top 10 Share of
Total
Top 10 Share of
Total
Maize 47.9 Sugar cane 40.3 Maize 66.7
Groundnuts, with shell 9.1 Maize 29.5 Cassava 20.9
Seed cotton 8.9 Cassava 10.6 Soybeans 7.1
Cassava 7.9 Vegetables, fresh nes 3.5 Pulses, nes 2.8
Soybeans 4.7 Wheat 2.5 Millet 1.6
Tobacco, unmanufactured 2.8 Soybeans 2.3 Sorghum 0.9
Pulses, nes 2.8 Seed cotton 1.8
Sunflower seed 2.5 Sweet potatoes 1.7
Vegetables, fresh nes 2.1 Groundnuts, with shell 1.2
Sweet potatoes 2.0 Cottonseed 1.2
Groundnuts: no data
Data: average 2012-2014, FAOSTAT, accessed 19 January, 2017
* Gross Production Value (constant 2004-2006 million US$), data: average 2011-2013, FAOSTAT, accessed 19 January, 2017
Note: GIC value chains marked in red; nes refers to Not elsewhere specified
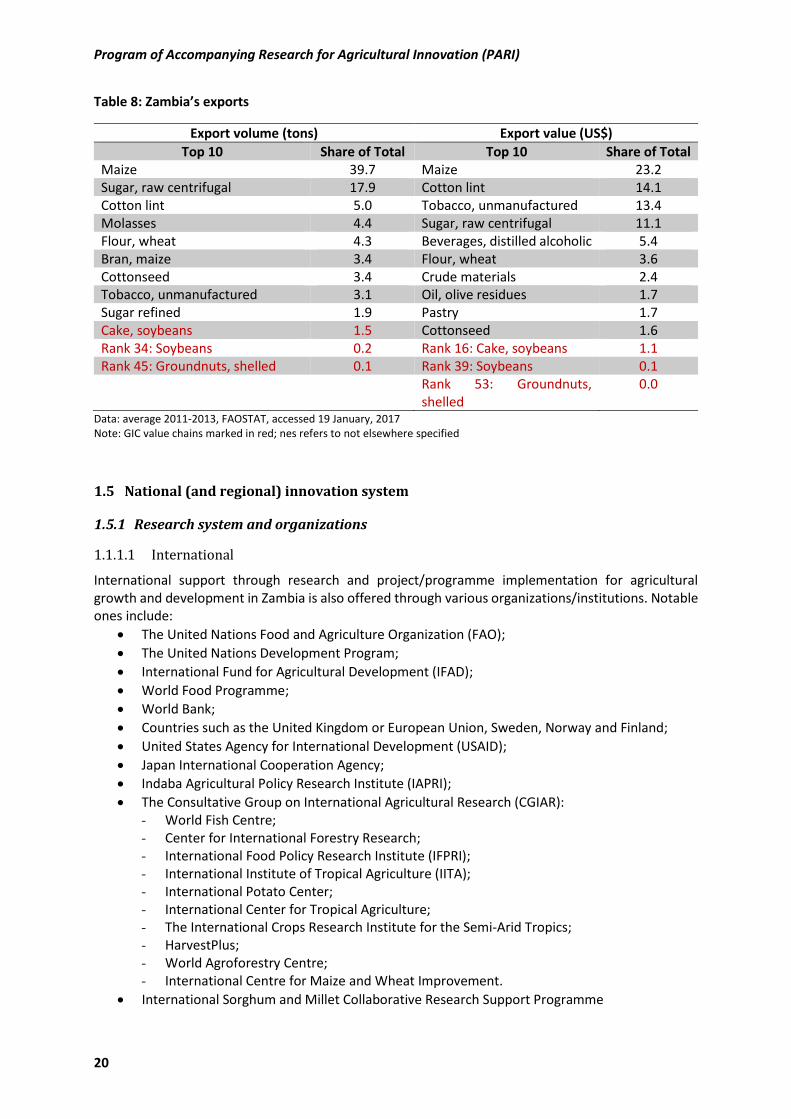
1.4.2 Trade
Palm oil is the most important import good in Zambia and accounts for 19% of total import volume and
20% of total import value. It is followed by groundnut, which accounts for nearly 9% of the total import
value (see Table 7). Maize accounts for almost 40% of the total export volume and 23% of the total export
value. Furthermore, sugar, cotton and tobacco are important export goods. Soy and soy products only
account for less than 8% of total import value and about 1% of total export value (see Table 8).
Table 7: Za bia’s i ports
Import volume (tons) Import value (US$)
Top 10 Share of Total Top 10 Share of Total
Oil, palm 19.3 Oil, palm 20.3
Groundnuts, shelled 8.9 Food prep nes 7.2
Beer of barley 6.5 Oil, soybean 5.8
Food prep nes 5.2 Groundnuts, shelled 5.4
Oil, soybean 5.1 Beer of barley 4.5
Malt 4.6 Milk, whole dried 3.4
Rice – total (Rice milled equivalent) 4.4 Margarine, short 2.6
Cake, soybeans 3.4 Malt 2.4
Oranges 2.7 Cigarettes 2.3
Apples 2.6 Pastry 2.3
Rank 33: Soybeans 0.5 Rank 15: Cake, soybeans 1.8
Rank 50: Soybeans 0.2 Data: average 2011-2013, FAOSTAT, accessed 19 January, 2017
Note: GIC value chains marked in red; nes refers to Not elsewhere specified
Program of Accompanying Research for Agricultural Innovation (PARI)
20
Table 8: Za bia’s exports
Export volume (tons) Export value (US$)
Top 10 Share of Total Top 10 Share of Total
Maize 39.7 Maize 23.2
Sugar, raw centrifugal 17.9 Cotton lint 14.1
Cotton lint 5.0 Tobacco, unmanufactured 13.4
Molasses 4.4 Sugar, raw centrifugal 11.1
Flour, wheat 4.3 Beverages, distilled alcoholic 5.4
Bran, maize 3.4 Flour, wheat 3.6
Cottonseed 3.4 Crude materials 2.4
Tobacco, unmanufactured 3.1 Oil, olive residues 1.7
Sugar refined 1.9 Pastry 1.7
Cake, soybeans 1.5 Cottonseed 1.6
Rank 34: Soybeans 0.2 Rank 16: Cake, soybeans 1.1
Rank 45: Groundnuts, shelled 0.1 Rank 39: Soybeans 0.1
Rank 53: Groundnuts,
shelled
0.0
Data: average 2011-2013, FAOSTAT, accessed 19 January, 2017
Note: GIC value chains marked in red; nes refers to not elsewhere specified
1.5 National (and regional) innovation system
1.5.1 Research system and organizations
1.1.1.1 International
International support through research and project/programme implementation for agricultural
growth and development in Zambia is also offered through various organizations/institutions. Notable
ones include:
The United Nations Food and Agriculture Organization (FAO);
The United Nations Development Program;
International Fund for Agricultural Development (IFAD);
World Food Programme;
World Bank;
Countries such as the United Kingdom or European Union, Sweden, Norway and Finland;
United States Agency for International Development (USAID);
Japan International Cooperation Agency;
Indaba Agricultural Policy Research Institute (IAPRI);
The Consultative Group on International Agricultural Research (CGIAR):
- World Fish Centre;
- Center for International Forestry Research;
- International Food Policy Research Institute (IFPRI);
- International Institute of Tropical Agriculture (IITA);
- International Potato Center;
- International Center for Tropical Agriculture;
- The International Crops Research Institute for the Semi-Arid Tropics;
- HarvestPlus;
- World Agroforestry Centre;
- International Centre for Maize and Wheat Improvement.
International Sorghum and Millet Collaborative Research Support Programme
Country Dossier Zambia
21
Other regional organizations also contributing to agricultural development in the country include:
African Development Bank (AfDB);
Forum for Agricultural Research in Africa (FARA);
Centre for Coordination of Agricultural Research and Development for Southern Africa;
Coalition for African Rice Development;
SADC - Genetic and Plant Resources Research Institute;
Common Market for Eastern and Southern Africa (COMESA).
1.1.1.2 National
Agricultural research in Zambia is largely undertaken by the Ministry of Agriculture through the Zambia
Agriculture Research Institute (ZARI), the Golden Valley Agricultural Research Trust (GART), and by the
Ministry of Fisheries and Livestock Development through the Central Veterinary Research Institute.
The University of Zambia (UNZA), National Institute for Scientific and Industrial Research and of late
Mulungushi University also undertake research. Thus innovations are locally developed through the
above institutions.
In July this 2015, FARA, in partnership with the German Government, represented by the Center for
Development Research (ZEF) of the U i e sit of Bo u de its O e Wo ld No Hu ge i itiati e, entered into an agreement with ZARI in implementing PARI. ZARI is currently playing the role of lead
implementing institution for the PARI in Zambia.
1.5.2 Innovation Platforms
From 2005 to 2015 there were at least 16 agricultural Innovation Platforms (IPs) functioning in Zambia.
Of those, eight were covering cassava innovations, other IPs were dedicated to maize, rice, sorghum,
soy, wheat and conservation agriculture. The IPs were funded by international embassies, national and
pan-African agricultural projects (mostly the Support to Agricultural Research for Development of
Strategic Crops in Africa Project [SARD-SC]). For instance, during the 2013-2014 period, maize
I o atio Platfo s e e esta lished the IITA s fa ilitated “A‘D-SC Maize Programme in four
districts of Zambia, namely Mkushi, Serenje, Katete and Monze. Participating members included
Zambian ministries, agricultural organizations, the private sector and banks, as well as directly involved
actors along the value chain, such as farmer representatives, transporters and processors. The concept
of commodity-based IPs is still in its infancy stage in Zambia and most agricultural stakeholders to-date
are generally unaware of the workings and benefits of IPs, which explains in part the low number of
IPs (Chomba et. al., 2016). There are therefore plans to enhance/increase awareness on IPs, through
PARI activities.
1.5.3 Extension system and organizations
The NAIP dis usses the halle ge of li ited e te sio se i es as follo s: As of March 2011,
the Principal Methodology Extension Officer estimated that the extension officer to farmer ratio in
Zambia is only 1:900. This is in line with the IFPRI/RENEWAL study (Yamauchi et al., 2009) whose
findings indicate that the Agricultural Extension worker-to-farmer ratio was 1:800. This far exceeds the
recommended level of 1:400 . It further remarks that ost of e te sio offi e s ti e is spe t dealing
with logistical issues rather than the actual provision of extension services. As a cause for insufficient
extension services, the World Bank names incomplete implementation of public policies. Where public
services are lacking, the private sector has, to some degree, taken over the costly provision of extension
services. However, missing public market infrastructure and weak law enforcement (including contract
enforcement) are hampering this development. High crime rates and farmers disregarding agreements
discourage private sector investment. The share of public expenditures on extension services is
insufficiently low, as the government mainly subsidizes farm inputs (World Bank, 2007). The
Program of Accompanying Research for Agricultural Innovation (PARI)
22
Participatory Extension Approach is currently widespread in the provision of agricultural extension
services in Zambia.
1.5.4 Private research and development activities
Building and establishing strong collaborations among the national, regional and international centers
(public and private) that are involved in agricultural research and development (R&D) is encouraged in
order to improve efficiency and reduce costs throughout the value chains.
The Ministry of Agriculture through ZARI has well-established links with a number of local, regional and
international research institutions. As such, ZARI has signed agreements with some of these
institutions, to their mutual benefit. These agreements include capacity building (both short and long
te , esea h p oje t fu di g a d e uip e t fi a i g. )A‘I s ag ee e ts ith local institutions
include those with the Zambia Seed Company, GART, the Cotton Development Trust, UNZA and the
Programme Against Malnutrition. On the international side, some on-going agreements include those
with the following institutions:
i. International Institute for Tropical Agriculture (IITA);
ii. International Centre for Maize and Wheat Improvement;
iii. International Sorghum and Millet Collaborative Research Support Programme;
iv. International Institute for Communication Development;
v. The International Plant Protection Convention;
vi. The International Treaty on Plant Genetic Resources for Food and Agriculture; and
vii. The Alliance for a Green Revolution in Africa.
The assistance from and/or collaborations with these local and international organizations has
complemented government efforts and has enabled ZARI to meet some of the objectives and targets
set out in the development plan.
1.6 Key challenges, emerging needs and potentials in the agricultural sector
The agriculture sector continues to face several challenges such as:
Low agricultural production and productivity;
Erosion of indigenous livestock and plant genetic resources;
Dominance of monocropping (maize) among small-scale farmers leading to one-dimensional
nutrition;
Low private sector participation in agricultural development, especially in agricultural
marketing;
High levels of food and nutrition insecurity, particularly at the household level;
Poor coordination among key players dealing with food and nutrition causing persistent
malnutrition despite the increase in agricultural production;
Poor food storage at the household level;
High dependence on rain-fed agriculture, exacerbated by low levels of irrigation, especially by
small scale farmers;
Diminished investment in agricultural R&D;
Inefficient agricultural extension service delivery;
Low levels of agricultural mechanization among smallholder farmers;
Inefficient agricultural markets for inputs and outputs;
Limited access and availability to agricultural finance and credit facilities;
Reduced net value of agricultural exports, particularly for horticulture, floriculture and fish
products, although the overall value of non-traditional exports has been rising due to the
inclusion of exports of timber, honey and handcrafts;
Country Dossier Zambia
23
Need for inclusive growth as rural poverty rates remain high;
Unsustainable use of natural resources;
Land degradation due to natural and human induced factors;
Inadequate mechanisms to deal with disaster risk management (insurance, early warning
systems);
Low adaptation and resilience to the effects of climate change;
Inadequate mainstreaming of gender and governance issues, and HIV/AIDS7;
Agriculture not perceived as a rewarding business among youth (Chomba et. al., 2016).
In the continued effort of enhancing the performance of the agricultural sector, the vision of the
e ised NAP is: To attain sustainable agricultural production which will enhance competitiveness,
profitability, food and nutrition security and contribute to employment and income generation, national
economic development and contribute to poverty reduction by 2020 (NAIP, 2013).
To support and/or complement the implementation of NAP and the Vision 2030, Zambia has signed
the CAADP Compact and formulated the NAIP 2014-2018, under CAADP. The NAIP seeks to identify
priority investment and policy changes that would result in robust agricultural growth that lessens the
incidences of rural poverty.
1.7 Potential areas for investment in Zambia
Based on the general approach presented in chapter 4 of Husmann et al (2015) and in pursuit of
efficiency and effectiveness, investment by Germany into the agricultural and food sector are
suggested in African countries that:
Show actual progress in sustainable agricultural productivity driven by related innovations, as
indicated by comprehensive productivity measurement and innovation actions on the ground;
Have a track record of political commitment to foster sustainable agricultural growth, as
indicated by performance under CAADP; and
Prioritize actions for hunger and malnutrition reduction and show progress, but where
agricultural and rural development and nutrition interventions are likely to make a significant
difference, as indicated by public policy and civil society actions.
Results of assessment for Zambia8
Expected agricultural growth performance:
Zambia has only increased its agricultural growth by more than the 6% required by the CADDP
for two of the ten years between 2005 and 2014 (www.resakss.org);
However, Total Factor Productivity in Zambia had improved by 27% between 2001 and 2008
(Fuglie and Rada, 2011), indicating substantial improvement in ou t s innovation
performance.
Government commitment:
Zambia has a track record of political commitment to foster sustainable agricultural growth by
being modestly active in the CAADP process and having completed five out of the eight steps
in the CAADP process (www.resakss.org);
However, the Zambian government has only invested more than 10% of total government
expenditure (CAADP target) into the agriculture sector for three of the years between 2005
and 20149;
7 HIV/AIDS = human immunodeficiency virus/ acquired immune deficiency syndrome 8 Details on the data sources and methodology used in the assessment can be found in Husmann et al. (2015) 9 www.resakss.org
Program of Accompanying Research for Agricultural Innovation (PARI)
24
In addition, Zambia spends only 0.4% of its agricultural GDP10 on agricultural R&D, which is
much lower than Sub-Saharan Africa s average and the African Union target value of 1%. This
indicates that Zambia´s investment into agricultural innovation is not yet sufficient.
Food and nutrition security progress and need:
Zambia is not prioritizing actions for hunger and malnutrition reduction, and the prevalence of
undernourishment has even increased by about 5% between 2001 and 2011.
The country also has one of the highest rates of malnutrition-related stunting in the world with
45% of children under the age of five being stunted (World Bank, 2009).
Several interconnected causes of child malnutrition include: inadequate dietary intake, low
micronutrient content in most major foods consumed at household level, infrequent and
inadequate consumption of nutritious food and low diversity of such foods, high disease
burden and coupled with high poverty levels, especially in rural areas.
In addition, Zambia has a very high Global Hunger Index (GHI) score value of 24.4, reflecting an
alarming level of hunger (von Grebmer et al., 2014)11. This makes the investment into the
agricultural and food sector in Zambia very urgent in order to fight the high rate of food
insecurity.
Table 9: Zambia performance indicators
Indicator Indicator
score
Overall
score
1. Number of years with more than 6% agricultural growth (2005 to
2014)
2 20
2. Percentage point change in TFP index between 2001 and 2008 27 100
3. Number of years with more than 10% government expenditure
(2005 to 2014)
3 30
4. Average share of agricultural GDP spent on R&D (2005 to 2011) in % 0.4 38
5. Steps in CAADP completed 5 63
6. Percentage point improvement in undernourishment between 2001
and 2011
-4.9 0
7. Global Hunger Index (2014) 23.2 100
Total score (weighted)
51 Data source: Husmann et al (2015)
Note: TFP refers to Total Factor Productivity
Overall, the economic, political, and social/nutrition framework in Zambia recommends modest
investments into the agricultural and food sector of the country.
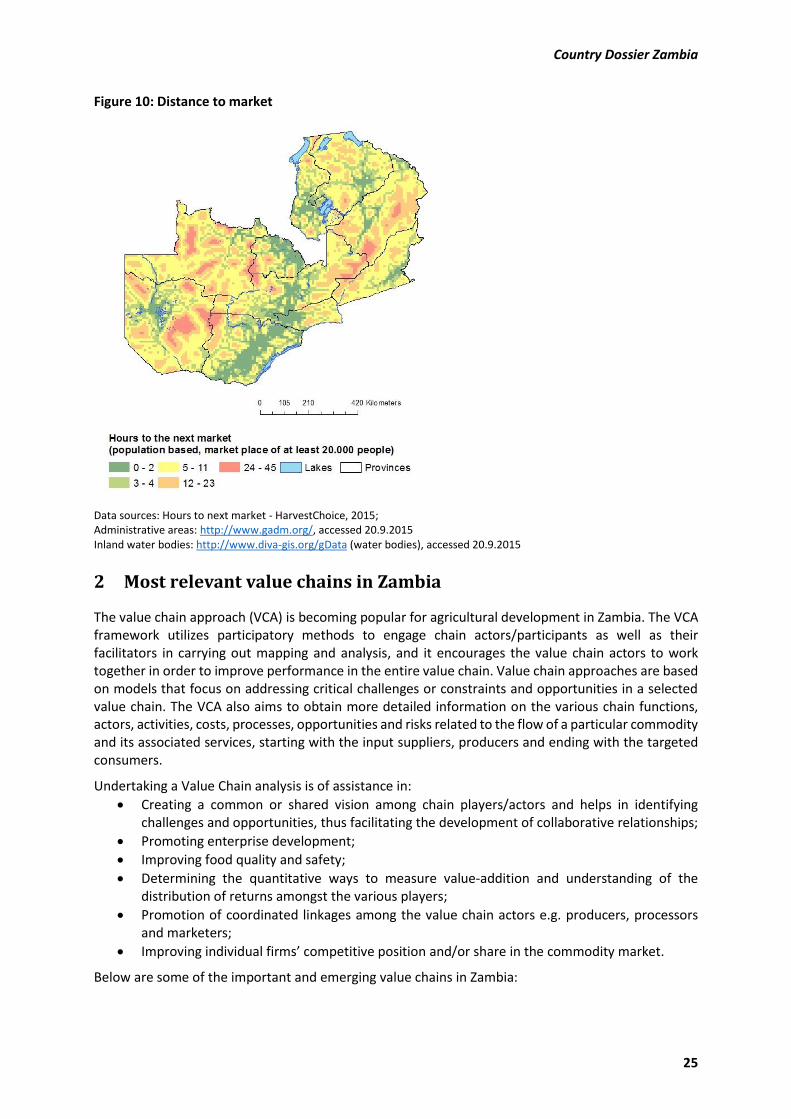
The selection the value chain on which to focus is also determined by market access, i.e. transport-
intensive products should be promoted in areas that are well connected to markets, whereas remote
areas should focus on low volume and livestock value chain segments. Figure 10 presents the average
time (number of hours) it takes to reach the nearest market place of at least 20,000 people in Zambia.
10 www.asti.cgiar.org 11 GHI s o e Values less tha . efle t lo hu ge , alues f o . to . efle t ode ate hu ge , alues f o . to . i di ate a se ious le el of hu ge , alues f o . to . a e ala i g, a d alues of . or g eate a e e t e el ala ing (von Grebmer et al., 2014).
Country Dossier Zambia
25
Figure 10: Distance to market
Data sources: Hours to next market - HarvestChoice, 2015;
Administrative areas: http://www.gadm.org/, accessed 20.9.2015
Inland water bodies: http://www.diva-gis.org/gData (water bodies), accessed 20.9.2015
2 Most relevant value chains in Zambia
The value chain approach (VCA) is becoming popular for agricultural development in Zambia. The VCA
framework utilizes participatory methods to engage chain actors/participants as well as their
facilitators in carrying out mapping and analysis, and it encourages the value chain actors to work
together in order to improve performance in the entire value chain. Value chain approaches are based
on models that focus on addressing critical challenges or constraints and opportunities in a selected
value chain. The VCA also aims to obtain more detailed information on the various chain functions,
actors, activities, costs, processes, opportunities and risks related to the flow of a particular commodity
and its associated services, starting with the input suppliers, producers and ending with the targeted
consumers.
Undertaking a Value Chain analysis is of assistance in:
Creating a common or shared vision among chain players/actors and helps in identifying
challenges and opportunities, thus facilitating the development of collaborative relationships;
Promoting enterprise development;
Improving food quality and safety;
Determining the quantitative ways to measure value-addition and understanding of the
distribution of returns amongst the various players;
Promotion of coordinated linkages among the value chain actors e.g. producers, processors
and marketers;
Improving individual firms o petiti e positio and/or share in the commodity market.
Below are some of the important and emerging value chains in Zambia:
Program of Accompanying Research for Agricultural Innovation (PARI)
26
2.1 GIC value chains
The value chains chosen for the Green Innovation Centers (GIC) include soybean and groundnut in the
Eastern province. The milk value chain is also considered in the Choma district in the Southern
province.
2.1.1 Soybean
The soybean value chain provides a promising opportunity for entrepreneurship and food and nutrition
security in Zambia. This is largely through its potential for growth due to demand from the livestock
feed industry, notably the poultry sub-sector. Additionally soybean is increasingly becoming accepted
for human consumption as it provides high quality protein at much lower cost than the most common
alternative proteins sources.
Zambia is self-sufficient (a net exporter) in soy production; production for the year 2009/10 is
estimated at about 112,000 MT, while consumption is estimated at 90,000 MT (Technoserve, 2010).
Commercial farmers predominantly produce and export soy in Zambia (85% of total production).
Growth in production has largely been achieved by increasing the area for harvest rather than by
increases in yield as the market has grown (ibid). The growth in demand for soybean in Zambia is also
promising due to of the excess processing capacity accompanied by good vertical integration (such as
with livestock feed manufactures).
Despite strong export market opportunities in Zimbabwe, South Africa and the Democratic Republic of
Congo, several constraints continue to hinder the soy value chain in Zambia.
2.1.2 Groundnuts
Groundnuts and common beans are primarily small-scale farmer crops grown by over half a million
Zambian households on about 9% of the total area harvested (see Table 6). Approximately 80% of these
food crops are consumed at the household level or within the local area. Groundnuts account for 72
kcal per capita per day on average (FAOSTAT, 2017). Most of the surplus crops enter the informal
market chain. There is, however, major potential market demand for both crops in terms of regional
and international markets, provided that these crops are produced, harvested and processed according
to market specifications. Groundnuts are currently the second most imported good, making up almost
9% of total imports in tons (see Table 7).
)a ia s li ate a d soil o ditions are ideal for growing groundnuts. In the 1960s and 1970s, Zambia
was a major exporter of premium-grade groundnuts to the European confectionery market. However,
in the 1980s, the private sector was unable to fill the void left by the dismantling of the State-owned
parastatal companies such as the National Agricultural Marketing Board, which led to a decline in seed
production, lower yields, loss of sorting and grading capacity, increased aflatoxin levels, and loss in
farmer, trade and customer confidence. There is currently a remaining revealed comparative
disadvantage, indicated by an RCA index as low as 0.04. Nonetheless, development of groundnut
production looks promising, judging from a measured average annual yield growth of 11% (see Table
10).
2.1.3 Milk
The dairy sector in Zambia is made up of 3,000-4,000 smallholder and commercial dairy farmers that
produce milk for the formal market, and of about 300,000 traditional cattle-owning households that
also produce milk (ACF, 2012; World Bank, 2010). Traditional cattle farmers differ from the commercial
farmers in the sense that cattle is viewed by the former as a store of wealth and a means of subsistence
and draught power, rather than a commercial business opportunity (Mumba et al., 2013). There is
Country Dossier Zambia
27
tremendous room for market growth in the Zambian dairy sector. Out of an estimated total national
production of 253 million liters of milk, only 44 million liters go through the formal channels (ACF,
2012). A substantial portion of raw milk produced through informal channels does not reach the formal
a ket. This lost ilk is usuall o su ed o sold lo all i u p o essed o fe e ted fo , o asted (Mumba et al., 2013). Dairy processors in Zambia face shortages of raw milk supply due to increasing
domestic demand for dairy products. Therefore, there is pressure for the country to import cheaper
and poor quality fresh milk from other countries. Dairy processors need to access larger volumes of
the domestically produced raw milk to achieve economies of scale. However, the lack of data on the
locations and potential milk volumes needed hinders further investments to expand the network of
hilli g, p o u i g a d p o essi g fa ilities i o de to tap i to the lost ilk Mu a et al., 2013).
2.2 Other relevant value chains
2.2.1 Maize
Maize is )a ia s ai staple food, a d p o ides al ost , k al/ da pe apita to the ou t s populatio FAO“TAT, . It is ai l p epa ed i the fo of a thi k po idge alled nshima.
According to the National Food Balance Sheet, maize also receives the most support in terms of the
go e e t s udgeta allo atio a d p o isio of othe ag i ultu al se i es, o pa ed to othe agricultural commodities. However, urban consumption observations indicate some changes in
preference, especially among the youth. Among a good number of young urban consumers, rice and
wheat products e.g. bread, are becoming preferable substitutes for maize.
Maize production makes up close to half of the total area harvested in Zambia (47.9%) and two thirds
of the agricultural production value (66.7%), which makes it the most produced crop in the country
(see Table 6). It is the most prominent crop among the small- and medium-scale famers, who
contribute about 80% to the total national maize production. Ne e theless a o di g to the NAIP due to low yields, combined with limited land holding sizes, very few smallholder farmers are able to
p odu e suffi ie t op su pluses to sell NAIP, . ‘esea h eeds assess e ts also i di ate that low crop yields are a result of poor agronomic practices, limited access to agricultural input credit,
limited access to extension services and agricultural innovations and technologies among smallholder
farmers. ZARI has developed low nitrogen as well as drought-tolerant aize a ieties ut fa e s access to such varieties still remains a challenge due to poorly developed Innovation Platforms that
could otherwise fast track the scaling up of such technologies (NAIP, 2013).
Indeed, in most years, roughly 30 percent of all Zambian smallholders were net buyers of maize. Low
yields can be caused by a variety of factors, including low soil fertility, drought, and late planting.
Between 2002 and 2008 these factors led to 33% of the maize harvesting area in Zambia being
abandoned before harvesting (Garrity, 2010). The highest achieving maize farmers of Zambia reach
productivity levels of close to 6 Mt/ha, which is almost 4 Mt more than the national average, indicating
great investment potential (NAIP, 2013).
The maize value chain has the highest number of actors in its value chain functions, i.e. input suppliers,
producers, processors traders and consumers. The crop is grown in nearly all provinces of Zambia, even
where it is not agronomically recommended. Some few commercial farmers also grow maize for
livestock feed and sometimes as a winter crop, under irrigation, for human consumption when a short-
fall in production is anticipated.
Maize is the major crop bought for and stored/preserved in the national food strategic reserves by the
Food Reserve Agency (FRA). Maize is also currently one of the main raw materials in the Zambian
livestock feed mill industry.
Maize is )a ia s p imary export good, as shown in Table 8, making up almost 40% of exports in tons
and 23.2% of exports in value. It is one of the most promising agricultural products for investors, with
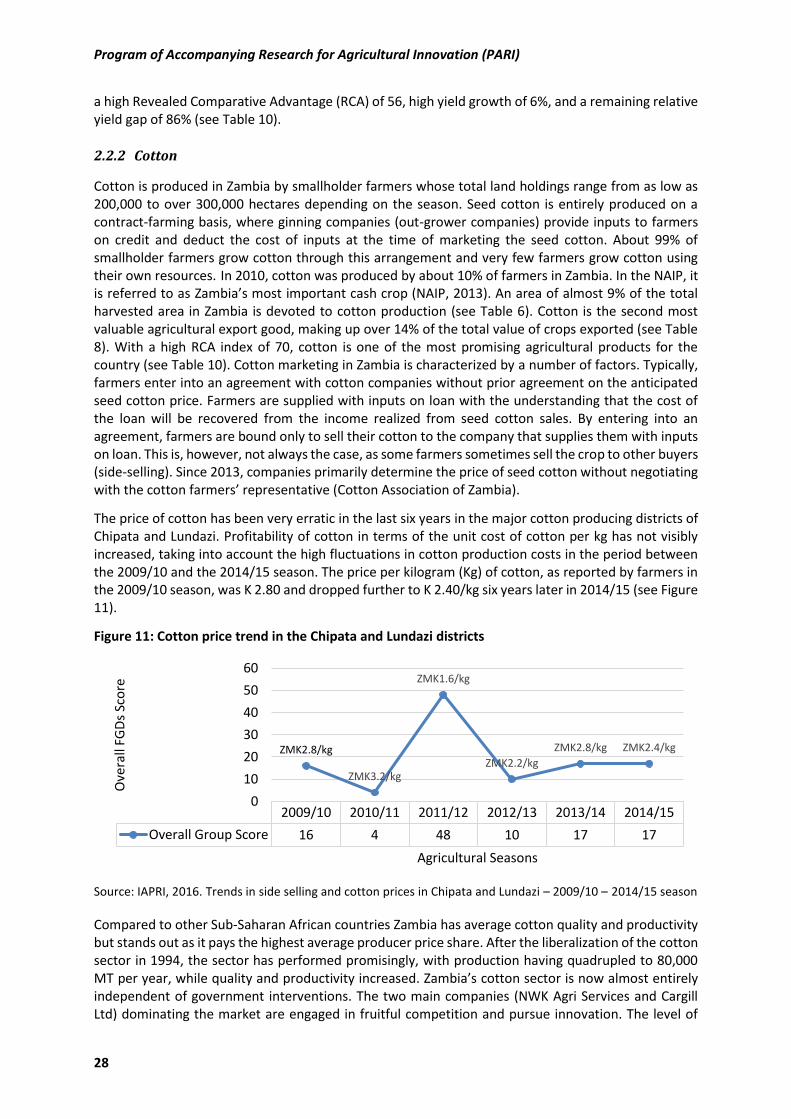
Program of Accompanying Research for Agricultural Innovation (PARI)
28
a high Revealed Comparative Advantage (RCA) of 56, high yield growth of 6%, and a remaining relative
yield gap of 86% (see Table 10).
2.2.2 Cotton
Cotton is produced in Zambia by smallholder farmers whose total land holdings range from as low as
200,000 to over 300,000 hectares depending on the season. Seed cotton is entirely produced on a
contract-farming basis, where ginning companies (out-grower companies) provide inputs to farmers
on credit and deduct the cost of inputs at the time of marketing the seed cotton. About 99% of
smallholder farmers grow cotton through this arrangement and very few farmers grow cotton using
their own resources. In 2010, cotton was produced by about 10% of farmers in Zambia. In the NAIP, it
is efe ed to as )a ia s ost i po ta t ash op NAIP, . A a ea of al ost % of the total harvested area in Zambia is devoted to cotton production (see Table 6). Cotton is the second most
valuable agricultural export good, making up over 14% of the total value of crops exported (see Table
8). With a high RCA index of 70, cotton is one of the most promising agricultural products for the
country (see Table 10). Cotton marketing in Zambia is characterized by a number of factors. Typically,
farmers enter into an agreement with cotton companies without prior agreement on the anticipated
seed cotton price. Farmers are supplied with inputs on loan with the understanding that the cost of
the loan will be recovered from the income realized from seed cotton sales. By entering into an
agreement, farmers are bound only to sell their cotton to the company that supplies them with inputs
on loan. This is, however, not always the case, as some farmers sometimes sell the crop to other buyers
(side-selling). Since 2013, companies primarily determine the price of seed cotton without negotiating
ith the otto fa e s ep ese tati e Cotto Asso iatio of )a ia .
The price of cotton has been very erratic in the last six years in the major cotton producing districts of
Chipata and Lundazi. Profitability of cotton in terms of the unit cost of cotton per kg has not visibly
increased, taking into account the high fluctuations in cotton production costs in the period between
the 2009/10 and the 2014/15 season. The price per kilogram (Kg) of cotton, as reported by farmers in
the 2009/10 season, was K 2.80 and dropped further to K 2.40/kg six years later in 2014/15 (see Figure
11).
Figure 11: Cotton price trend in the Chipata and Lundazi districts
Source: IAPRI, 2016. Trends in side selling and cotton prices in Chipata and Lundazi – 2009/10 – 2014/15 season
Compared to other Sub-Saharan African countries Zambia has average cotton quality and productivity
but stands out as it pays the highest average producer price share. After the liberalization of the cotton
sector in 1994, the sector has performed promisingly, with production having quadrupled to 80,000
MT per year, while quality and productivity increased. )a ia s otto se to is o al ost e ti el independent of government interventions. The two main companies (NWK Agri Services and Cargill
Ltd) dominating the market are engaged in fruitful competition and pursue innovation. The level of
2009/10 2010/11 2011/12 2012/13 2013/14 2014/15
Overall Group Score 16 4 48 10 17 17
ZMK2.8/kg
ZMK3.2/kg
ZMK1.6/kg
ZMK2.2/kg
ZMK2.8/kg ZMK2.4/kg
0
10
20
30
40
50
60
Ove
rall
FGD
s Sc
ore
Agricultural Seasons
Country Dossier Zambia
29
concentration among ginners in Zambia has therefore helped the positive development of the sector
(Boughton et al., 2003).
2.2.3 Cassava
Cassava is the second dominant national staple food crop after maize, and one of the most important
crops for food security in the country (especially in the northern part of the country). It provides about
211 kcal per capita per day to the Zambian population (FAOSTAT, 2017). It is mainly produced in
Northern, Muchinga and Luapula provinces, as well as in some areas of the Western and North-
Western provinces, making up over 20% of the total production value (see Table 6). The crop is almost
exclusively produced by smallholder farmers. It is mostly used for home consumption (over 94 of
consumption). Only around 8% of the crop produced is currently marketed locally as fresh root or sold
as dried chips. This mainly occurs at informal markets in the Lusaka and Copperbelt provinces. There
are some regional exports of dried chips to the Democratic Republic of Congo, mainly through informal
cross border markets, such as at Kasumbalesa.
Cassava has a number of advantages compared to maize, and is very much suited for small-scale farmer
production in that:
It is a low input crop (no/limited fertilizer requirement, no annual seed purchase, etc.);
A large number of small-scale farmers in the high cassava production areas have good
production knowledge of cassava;
It is not affected by drought as it is able to tolerate long periods without rain (once it is
established);
It is mainly grown in high/reliable rainfall areas.
It can be harvested throughout the year, depending on household needs.
In trying to promote the commercialization of cassava, the government has developed a National
Cassava Development Strategy. This decision was made recognizing that cassava is one of the main
food security crops in the country and that a number of market development opportunities exist, which
have the potential to create substantial additional market pull for cassava. These include use in starch
production, in feed mill, for beer brewing, for the milling industry, etc.
Cassava commercialization (through product/market development) is expected to lead to increased
incomes by increasing the proportion of the crop that is marketed, which will lead to increased
production (market pull). Commercialization of cassava is also expected to lead to an increase in land
used for cassava production, providing additional small-scale farmers with both increased incomes as
well as food security. Cassava is a major world food crop with global production in excess of 230 million
tons per year, with the four major producing countries (Nigeria, Brazil, Indonesia and Thailand)
producing almost half the world supply. However, the commercial exploitation of cassava in Zambia is
hampered by several factors (see 3.1).
2.2.4 Wheat and Rice
Wheat is predominantly produced by large-scale/commercial farmers using irrigation. Yields vary from
2 tons per hectare in rain-fed production, to 6 tons per hectare when irrigated (NAIP, 2013). It is among
the top ten agricultural products in terms of production volume. Zambia usually has surplus wheat
production. Between 2011 and 2013 . % of the ou t s e po t value came from wheat flour (see
Table 8). Wheat is one of )a ia s p o isi g ag i ultu al p odu ts, si e it a hie es a a e age a ual yield growth of 5% and demand for the crop is rising, especially among the urban youth.
There are some established rice IPs in the Country, although few. Current additional initiatives inlcude:
(i) promotion of Sustainable Rice Intensification Initiative methodology for increased productivity &
production; (ii) development of NRDS; (iii) creation of an apex body-Zambia Rice Federation, although
it is still eak; i )A‘I s o -going programme of local rice variety purification (which has culminated
Program of Accompanying Research for Agricultural Innovation (PARI)
30
in the release of Supa-Mg variety); and (v) the development of formal Rice Standards, including Grades,
for locally produced and processed rice (activity undertaken in October 2016 under ZARI-PARI and
facilitated by Zambia Bureau of Standards.
Rice is predominantly grown by small-scale farmers. Since it is a convenient food to cook and consume,
rice is increasingly becoming a mainstream alternative to the traditional staples such as maize and
cassava, which nevertheless continue to be eaten by large populations in Zambia and all across Africa.
There is also growing awareness in the country that the rising demand for rice is not transient but is
rather part of a general trend in food consumption seen across the African, arising from the increasing
urban and predominantly young populations. In response to this trend, Zambia has developed NRDS:
2015-2019, whose overall strategic objective is to increase local rice production by at least 50% and
also to enhance its competitiveness on the market. Additionally, in recognition of the growing
importance of rice as a national cereal staple, the government has designated it as one of the two food
commodities purchased by the FRA for the national strategic food reserves.
Rice has reportedly been cultivated in Zambia at a subsistence level for quite a long time but is currently
being grown as a cash crop by smallholder farm families and thus offers great potential to contribute
to income and employment in the country, especially in the rural areas. A strong supply response by
smallholder farmers of diversifying into rice production has been observed. This is not only due to the
incentive of rising domestic consumer demand, but also due to the low cost of rice inputs compared
to maize or cotton, under the traditional farming system they practice.
The leading provinces, in terms of percentage contribution to aggregate national production are
Western, Northern, Muchinga, Luapula and Eastern. According to the Ministry of Agriculture and the
Ce t al “tatisti al Offi e s C op Fo e asti g “u e esults, the i e ulti atio area has averaged about
36,144 ha over the last six years, of which Western province accounted for 43%, Northern Province 31%,
Muchinga Province 17%, Eastern and Luapula provinces 4% each, and the rest of the provinces 2%.
2.2.5 Aquaculture
Zambia, with funding provided by the Food and Agricultural Organization (FAO), developed a National
Aquaculture Strategy in 2004. The National Aquaculture Strategy proposes means and methods of
addressing critical issues relating to aquaculture development through input supply (i.e. production
and delivery of feeds and seeds as well as the availability of farm credit) and access to extension
support and markets. The National Aquaculture Strategy was later followed with the formulation of
National Aquaculture Development Plan, starting 2009. Both programs was renewed for the 2015-2020
period.
Aquaculture (fish-farming) is becoming more important, notably in light of the depletion of fisheries in
the cou t s atu al odies of water. Aquaculture is practiced and promoted by both commercial and
small-scale fish farmers in impoundments, reservoirs and dams; earthen ponds (small and large); and
in cages.
Most commercial fish farms are located in the provinces of Southern, Lusaka and Copperbelt. On the
other hand, small-scale fish farmers are concentrated in Northern, Northwestern and Eastern
provinces (constituting 80% of the total). The number of small-scale farmers taking up fish farming has
been increasing rapidly over the years due aquaculture projects.
The production systems and practices of fish farming in Zambia are diverse, ranging from extensive to
intensive practices and from multi-species to mono species.
2.2.6 Fresh Fruits and Vegetables
Promoting commercial production of fresh fruits and vegetables (FFV) and increasing access to markets
for smallholder farmers have been identified as key ways to stimulate inclusive economic growth and
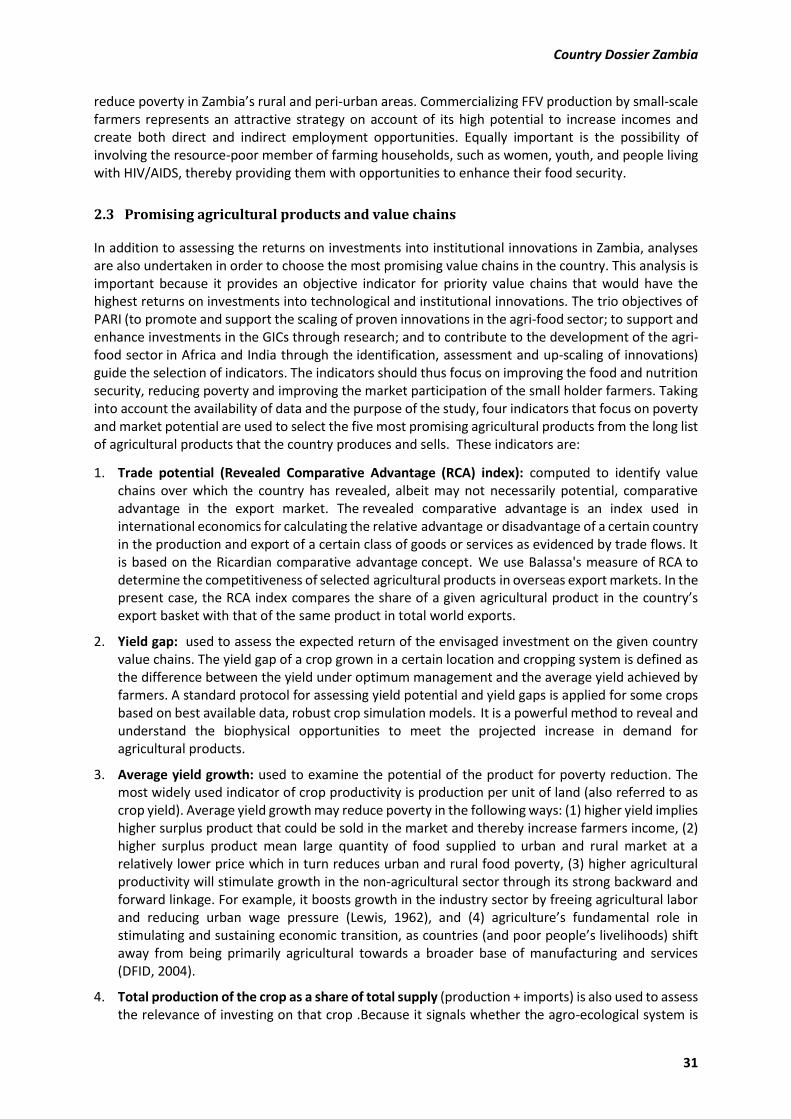
Country Dossier Zambia
31
reduce poverty in )a ia s rural and peri-urban areas. Commercializing FFV production by small-scale
farmers represents an attractive strategy on account of its high potential to increase incomes and
create both direct and indirect employment opportunities. Equally important is the possibility of
involving the resource-poor member of farming households, such as women, youth, and people living
with HIV/AIDS, thereby providing them with opportunities to enhance their food security.
2.3 Promising agricultural products and value chains
In addition to assessing the returns on investments into institutional innovations in Zambia, analyses
are also undertaken in order to choose the most promising value chains in the country. This analysis is
important because it provides an objective indicator for priority value chains that would have the
highest returns on investments into technological and institutional innovations. The trio objectives of
PARI (to promote and support the scaling of proven innovations in the agri-food sector; to support and
enhance investments in the GICs through research; and to contribute to the development of the agri-
food sector in Africa and India through the identification, assessment and up-scaling of innovations)
guide the selection of indicators. The indicators should thus focus on improving the food and nutrition
security, reducing poverty and improving the market participation of the small holder farmers. Taking
into account the availability of data and the purpose of the study, four indicators that focus on poverty
and market potential are used to select the five most promising agricultural products from the long list
of agricultural products that the country produces and sells. These indicators are:
1. Trade potential (Revealed Comparative Advantage (RCA) index): computed to identify value
chains over which the country has revealed, albeit may not necessarily potential, comparative
advantage in the export market. The revealed comparative advantage is an index used in
international economics for calculating the relative advantage or disadvantage of a certain country
in the production and export of a certain class of goods or services as evidenced by trade flows. It
is based on the Ricardian comparative advantage concept. We use Balassa's measure of RCA to
determine the competitiveness of selected agricultural products in overseas export markets. In the
p ese t ase, the ‘CA i de o pa es the sha e of a gi e ag i ultu al p odu t i the ou t s export basket with that of the same product in total world exports.
2. Yield gap: used to assess the expected return of the envisaged investment on the given country
value chains. The yield gap of a crop grown in a certain location and cropping system is defined as
the difference between the yield under optimum management and the average yield achieved by
farmers. A standard protocol for assessing yield potential and yield gaps is applied for some crops
based on best available data, robust crop simulation models. It is a powerful method to reveal and
understand the biophysical opportunities to meet the projected increase in demand for
agricultural products.
3. Average yield growth: used to examine the potential of the product for poverty reduction. The
most widely used indicator of crop productivity is production per unit of land (also referred to as
crop yield). Average yield growth may reduce poverty in the following ways: (1) higher yield implies
higher surplus product that could be sold in the market and thereby increase farmers income, (2)
higher surplus product mean large quantity of food supplied to urban and rural market at a
relatively lower price which in turn reduces urban and rural food poverty, (3) higher agricultural
productivity will stimulate growth in the non-agricultural sector through its strong backward and
forward linkage. For example, it boosts growth in the industry sector by freeing agricultural labor
a d edu i g u a age p essu e Le is, , a d ag i ultu e s fu da e tal ole i stimulating and sustai i g e o o i t a sitio , as ou t ies a d poo people s li elihoods shift away from being primarily agricultural towards a broader base of manufacturing and services
(DFID, 2004).
4. Total production of the crop as a share of total supply (production + imports) is also used to assess
the relevance of investing on that crop .Because it signals whether the agro-ecological system is
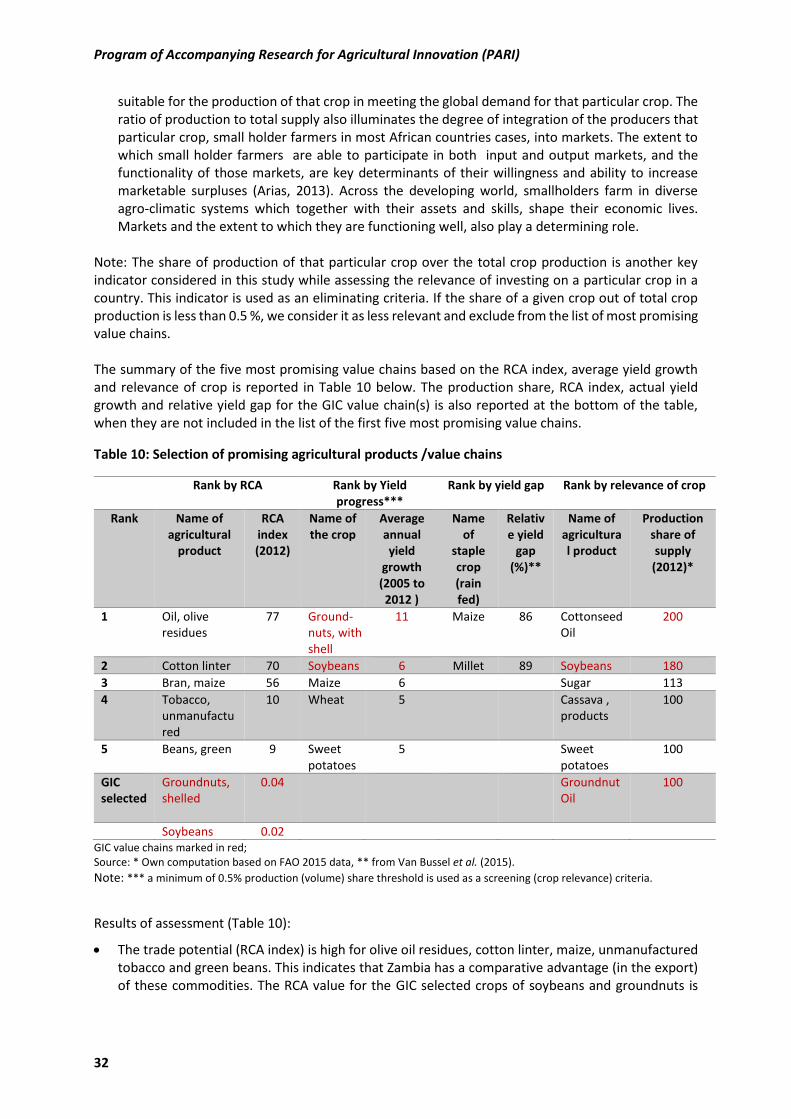
Program of Accompanying Research for Agricultural Innovation (PARI)
32
suitable for the production of that crop in meeting the global demand for that particular crop. The
ratio of production to total supply also illuminates the degree of integration of the producers that
particular crop, small holder farmers in most African countries cases, into markets. The extent to
which small holder farmers are able to participate in both input and output markets, and the
functionality of those markets, are key determinants of their willingness and ability to increase
marketable surpluses (Arias, 2013). Across the developing world, smallholders farm in diverse
agro-climatic systems which together with their assets and skills, shape their economic lives.
Markets and the extent to which they are functioning well, also play a determining role.
Note: The share of production of that particular crop over the total crop production is another key
indicator considered in this study while assessing the relevance of investing on a particular crop in a
country. This indicator is used as an eliminating criteria. If the share of a given crop out of total crop
production is less than 0.5 %, we consider it as less relevant and exclude from the list of most promising
value chains.
The summary of the five most promising value chains based on the RCA index, average yield growth
and relevance of crop is reported in Table 10 below. The production share, RCA index, actual yield
growth and relative yield gap for the GIC value chain(s) is also reported at the bottom of the table,
when they are not included in the list of the first five most promising value chains.
Table 10: Selection of promising agricultural products /value chains
Rank by RCA Rank by Yield
progress***
Rank by yield gap Rank by relevance of crop
Rank Name of
agricultural
product
RCA
index
(2012)
Name of
the crop
Average
annual
yield
growth
(2005 to
2012 )
Name
of
staple
crop
(rain
fed)
Relativ
e yield
gap
(%)**
Name of
agricultura
l product
Production
share of
supply
(2012)*
1 Oil, olive
residues
77 Ground-
nuts, with
shell
11 Maize 86 Cottonseed
Oil
200
2 Cotton linter 70 Soybeans 6 Millet 89 Soybeans 180
3 Bran, maize 56 Maize 6 Sugar 113
4 Tobacco,
unmanufactu
red
10 Wheat 5 Cassava ,
products
100
5 Beans, green 9 Sweet
potatoes
5 Sweet
potatoes
100
GIC
selected
Groundnuts,
shelled
0.04 Groundnut
Oil
100
Soybeans 0.02
GIC value chains marked in red;
Source: * Own computation based on FAO 2015 data, ** from Van Bussel et al. (2015).
Note: *** a minimum of 0.5% production (volume) share threshold is used as a screening (crop relevance) criteria.
Results of assessment (Table 10):
The trade potential (RCA index) is high for olive oil residues, cotton linter, maize, unmanufactured
tobacco and green beans. This indicates that Zambia has a comparative advantage (in the export)
of these commodities. The RCA value for the GIC selected crops of soybeans and groundnuts is
Country Dossier Zambia
33
much lower than 1 indicating that Zambia has a comparative disadvantage (in the export) of all
these GIC selected crops.
The yield performance, which indicates progress, suggests that over the CAADP period (2005 to
2012), the value chains selected by GIC (groundnuts and soybeans), maize, wheat and sweet
potatoes are the five most promising crops.
Yield gaps indicate potential from another angle and are observed to be high for rain maize and
millet, indicating the high potential return to investing into these value chains.
In terms of relevance (production share of supply), the leading value chains are cottonseed oil,
soybeans, sugar (raw equivalent), cassava and sweet potatoes. The total production of the first
two products meets the total demand. The full supply of sugar, cassava, sweet potatoes, and
ground nuts (the other value chain selected by GIC) is also produced in the country.
2.4 Summary on selection of agricultural products and value chains
This chapter (chapter 2) has presented different relevant and important value chains in Zambia based
on different criteria which resulted in the selection of different value chains. In summary, the three top
value chains among those selected by the GIC, other relevant value chains, and those identified by
analysis of promising agricultural products and value chains are presented in Table 11. The summary
table shows that all except one of GIC-selected value chains (common beans) are identified as
promising by the analysis of promising agricultural products and value chains. However, none of the
value chains discussed in the literature review is present in the analysis of promising agricultural
products and value chains.
Table 11: Summary of all value chains
GIC value chains Other value
chains
Promising agricultural products and value chains (top 3)
RCA Yield progress Yield gap Relevance of
crop
Soybeans Cassava Oil, olive
residues
Groundnuts,
with shell
Maize Cottonseed oil
Groundnuts Wheat & rice Cotton linter Soybeans Millet Soybeans
Aquaculture Bran, maize Maize Sugar
Milk Fresh fruits &
vegetables
Source: Authors o pilatio
3 Innovations in value chains in the past 20 years
3.1 Main limiting factors
According to the NAIP, general limiting factors faced by the Zambian agricultural sector include (2013):
Weak extension services and poor research and technology transfer;
Poor technology uptake (i.e. a minority of farmers use fertilizer or hybrid seed);
Limited access to inputs;
Poor price incentives to increase production (low and highly volatile prices due to
unpredictable trade policies, counterproductive market interventions, insufficient investment
in road infrastructure);
Limited public investment in market information systems and lack of ICTs; (Kalusopa, 2005)
Program of Accompanying Research for Agricultural Innovation (PARI)
34
Land degradation due to poor management of forests, pasture, cropland and water resources;
E pi i all poo , ot o e iall ia le etu s to fe tilize o )a ia s a idi soils (World
Bank, 2010);
Lack of adaptation to the effects of climate change;
Several constraints continue to hinder the soy value chain in Zambia, including (Technoserve, 2010):
Relatively high cost base;
Poor transport infrastructure and uncertainty in the export policy;
Lack of access to inputs (seed) and technical knowledge (especially pertaining to quality issues)
for smallholder farmers;
High transport costs pose challenges for import/export market opportunities;
Week relations between farmers and the private sector (Chomba et. al., 2016).
Limiting factors in the cassava value chain include:
Low smallholder farmer productivity and production levels;
Lack of disease-free seed (planting materials) (Chomba et. al., 2016)
Government maize price subsidies that create barriers-to-trade. The current FRA-discounted
price distorts the market and makes it very difficult for cassava chip farmers/processors to
compete (major feed-mill companies are willing to substitute thousands of tons of maize with
cassava because they can purchase the latter at 70% of the price of maize);
High t a spo t osts, as ost assa a is g o fa f o )a ia s a ufa tu i g e te s (in
the provinces of Luapula, Northern, Muchinga and Western);
Lack of product consistency: failure to secure a regular market, poor procedures, ineffective
quality controls and/or lack of farmer awareness has led to non-commercial, inconsistent
product quality / specification;
Lack of traceability: to protect their reputation, share-value, profits, and to avoid litigation,
large food companies demand that suppliers provide clear, detailed evidence showing the
origin of all food ingredients.
In the cotton sector, liberalization measures are already working to remove the following limiting
factors: Weak Cotton Farmers Association (to enforce contracts and bargain prices), rural credit and
input market failure and weak contract enforcement. According to Boughton et al. (2003) funding is
needed in the following three areas in order to foste fu the i o atio : i estment in
development and multiplication of new varieties, 2) improved pest management, and 3) updated raw
otto g adi g s ste s.
3.2 Important value-chain related and cross-cutting innovations
In this section, we describe some of the key innovations that have been initiated in selected value
chains in Zambia in the last 20 years. The innovations described are considered significant or beneficial
because of their widespread adoption, proven positive impact on increasing productivity, as well as
their potential to increase incomes, create employment, and adaptability to environmental challenges
(such as drought), etc.
3.2.1 GIC value chains
Formerly, innovations in the maize value chain mostly focused on increasing yields and pest resistance.
In the last two decades, as awareness of malnutrition and vitamin deficiencies in the population grew,
new innovations included varieties with increased nutritional value, notably in terms of Vitamin A and
protein content. To help farmers adapt to climate change, drought-tolerant varieties were also
developed a d p o oted. Despite the de elop e t a d elease of i p o ed a ieties, it has ee
Country Dossier Zambia
35
observed that the adoption rate of these varieties by farmers (small scale farmers) is still low. There is
the efo e eed fo i te sified se sitizatio a d/o p o otio . There are also concerted efforts made
to promote a diversity of products using vitamin A-rich maize and quality protein maize. Value addition
devices such as the Maize Sheller ha e ee popula ized to ake s all fa e s p odu tio ost-
effective and competitive (Chomba et. al., 2016).
In 2006, an innovation platform for rice, called System of Rice Intensification (SRI) was established, in
which the participating members were the Community Markets for Conservation (COMACO) and the
non-governmental organization (NGO) Centre for SRI Initiative. The platform successfully trained
farmers in improved rice husbandry to increase production and yield. SRI continues to be promoted by
NGOs to increase yields for smallholder producers, but receives little support from policy makers (Ibid).
Generally, innovations have been centered on increasing productivity, production and aroma. Upland
rice types are being promoted to expand rice production and meet rising demand. Acceptance of new
varieties by the population depends on aroma; new improved varieties lacking aroma have not been
successful on the market. Crop-processing innovations that ensure a quality of rice meeting market
requirements have been promoted (Chomba et. al., 2016).
3.2.2 Other value chains and cross-cutting innovations
Improved crop varieties (high-yielding, early maturing varieties), husbandry practices (i.e. herbicides,
fertilizer) and crop-processing techniques (i.e. a solar power drying machine) have been developed and
promoted in the cassava value chain. However, production and productivity of local farmers still falls
short of industrial demand. Government and cooperating partners have shown commitment to further
develop the cassava value chain; more innovation platforms were held on Cassava in the last ten years
(2005-2015) than on any other crop. The focus point of the platforms was on improved varieties,
disease-free planting material, high quality cassava flour and the cassava value chain in general.
Several innovations promoted by the government and the private sector are aiming at lowering
Aflatoxin contamination in groundnuts. These include post-harvest practices (promoted by COMACO)
and a technology to locally produce and apply the chemical Aflasafe, designed to prevent
contamination and mitigate its effects. The chemical is a promising innovation currently in its last
stages of field testing. Additionally, innovations in local processing technologies are promoted, with
the potential to benefit small-scale farmers and the health of consumers.
Policy-induced cross-cutting innovations include afforestation with soil-enriching trees, energy saving
stoves, irrigation technologies, farm mechanization, and promotion of conservation agriculture
(Chomba et. al., 2016).
Conservation farming has been shown to be a highly successful innovation in the last two decades. The
approach has been introduced in many areas across the country by a coalition of stakeholders including
the private sector, government and donor communities. Promoted practices include minimum tillage,
crop rotation with nitrogen-fixing species, retention of crop residue for improved soil structure,
fertilizer use, and integration of Faidherbia albida trees into fields for increased fertility. Further
research into improved husbandry practices is underway. Conservation farming has proven to be
effective for nitrogen fixation, maintaining vegetative soil cover, improving soil structure and water
infiltration, water retention and plant root development. Practicing farmers were able to reduce land
preparation costs in the long term while increasing maize yields by 1.5 tons per hectare and cotton
yields by 460 kg per hectare. Therefore, smallholder productivity has increased along with food security
and family income (Garrity, 2010).
B p o oti g the ethos of Fa i g as a Busi ess the government-supported Agricultural Support
Programme 2003-2008 has achieved positive outcomes for participating communities and households.
Results included heightened asset acquisition and decreased food insecurity (NAIP, 2013).
Program of Accompanying Research for Agricultural Innovation (PARI)
36
4 Suggestions for collaboration
With )a ia s high pote tial fo ag i ultu al de elop e t a d di e sifi atio f o the i i g se to for economic growth and poverty reduction, there is huge scope for long-term collaboration between
Zambia and Germany. PA‘I s e isti g pa t e ships with Zambia should therefore be utilized as a
springboard towards this goal.
Partnership with Germany and Zambia would be based on the strategic commodities and themes as
envisioned in the Zambian agricultural development policies. Zambia appears to be behind in terms of
innovation platforms, and therefore needs close follow-up with Germany following the signing on the
agreement between FARA and ZARI. Collaboration in the area of identifying and coming up with
appropriate innovation platforms and/or technology generation for these commodities will be a crucial
to generating impact.
A good partnership framework is essential in order for the German–Zambian collaboration to come to
fruition. Besides ZARI (and the Ministry of Agriculture, in general), other prospective partners with
Germany in Zambia will include the Ministry of Fisheries and Livestock Development, universities, and
fa e s organizations/ associations, non-governmental organizations and relevant private sector
actors.
The potential for German collaboration in fostering Zambian agricultural growth and development is
enormous. This could range from research partnerships for the generation of technology and
innovations, to capacity building and developing pathways and systems to translate research outputs
into positive socio-economic development outcomes.
Country Dossier Zambia
37
References
ACF. 2012. Agricultural Consultative Forum: Performance and competitiveness of the dairy value
chain in Zambia. Volume 1, issue #2.
Arias, P., Hallam, D., Krivonos, E., & Morrison, J. 2013. Smallholder integration in changing food
markets. Food and Agriculture Organization of the United Nations, Rome.
Bhat, R. V. and Vasanthi, S. 2003. Mycotoxin food safety risk in developing countries. In: Unnevehr, L.
J. (ed.). 2020 Focus 10: Food safety in food security and food trade. IFPRI, Washington DC
Boughton, D., Tschirley, D., Zulu, B., Ofiço, A. O., & Marrule, H. 2003. Cotton sector policies and
performance in sub-Saharan Africa: Lessons behind the numbers in Mozambique and Zambia.
In 25th International Conference of Agricultural Economists, August (Vol. 16).
Bumbangi, N. F., Muma, J. B., Choongo, K., Mukanga, M., Velu, M. R., Veldman, F., Hatloy, A. and
Mapatano, M. A. 2016. Occurrence and factors associated with aflatoxin contamination of raw
pea uts f o Lusaka dist i t s a kets, )a ia. Food Co t ol, O to e , -296
Cafiero, C. 2014. The excessive (and wasteful) consumption of food. Technical note 3. In: IFPRI. Global
Nutrition Report 2014: Actions and Accountability to Accelerate the Wo ld s P og ess o Nutrition. IFPRI, Washington, DC
Central Statistical Office (CSO) [Zambia], Ministry of Health (MOH) [Zambia], and ICF International.
2014. Zambia Demographic and Health Survey 2013-14. Central Statistical Office, Ministry of
Health, and ICF International, Rockville, Maryland.
Chomba C., Mnwale M. and Mwila G. (2016). Status of Agricultural Innovations, Innovation Platforms,
and Innovations Investment. 2015 PARI project country report: Republic of Zambia. Accra and
Bonn: Forum for Agricultural Research in Africa (FARA) and Center for Development Research
(ZEF), University of Bonn.
DFID. . Ag i ultu e, G o th a d Po e t ‘edu tio , A essed f o : http://www.dfid.gov.uk/Documents/publications/agri-poverty-reduction.pdf
FAO. 2016. Food security indicators. Retrieved June 17, 2016, from
http://www.fao.org/economic/ess/ess-fs/ess-fadata/en
FAOSTAT. 2017. Food and agriculture data. Last accessed on January 17, 2017 from:
http://www.fao.org/faostat/en/#home
Fuglie K. a d ‘ada N. , „Poli ies a d p odu ti it g o th i Af i a ag i ultu e , i Ag i ultu al ‘&D: I esti g i Af i a s Futu e. A al zi g T e ds, Challe ges a d Oppo tu ities, Bd. (ASTI/IFPRI-FARA Conference, Accra, Ghana: Citeseer, 2011),
http://citeseerx.ist.psu.edu/viewdoc/download?doi=10.1.1.371.9698&rep=rep1&type=pdf
Garrity, D. P. 2010. Evergreen Agriculture. Food security: the science, sociology and economics of
food production and access to food, Vol 2 Iss 3 pp. 197-214.
Gong, Y., Hounsa, A., Egal, S., Turner, P. C., Sutcliffe, A. E., Hall, A. J., Cardwell, K., Wild, C. P. 2004.
Postweaning exposure to aflatoxin results in impaired child growth: a longitudinal study in
Benin, West Africa. Environmental Health Perspectives, 112(13), 1334-1338
GRZ-FAO. 2009. GRZ–FAO National Medium Term Priority Framework 2009-2013 – ZAMBIA. APRIL
2009. Retrieved on September 28, 2015 from:
ftp://ftp.fao.org/TC/CPF/Country%20NMTPF/Zambia/Status/NMTPF.pdf
HarvestChoice. 2015. "Travel time to nearest town over 20K (mean, hours, 2000)." International Food
Policy Research Institute, Washington, DC., and University of Minnesota, St. Paul, MN.
Available online at http://harvestchoice.org/data/tt_20k
Program of Accompanying Research for Agricultural Innovation (PARI)
38
HarvestPlus. 2017. What we do: crops. Accessed online at http://www.harvestplus.org/what-we-
do/crops
Husmann C., von Braun J., Badiane O., Akinbamijo Y., Fatunbi A.O., Virchow D. 2015. Tapping
Potentials of Innovation for Food Security and Sustainable Agricultural Growth – an Africa-
wide Perspective. Program of Accompanying Research for Agricultural Innovation (PARI).
Bonn: Center for Development Research.
ICF International. 2015. The DHS Program STATcompiler. Last accessed on September 12, 2016 from:
http://www.statcompiler.com/en/
IFPRI. 2015. Global Nutrition Report 2015: Actions and Accountability to Advance Nutrition and
Sustainable Development: Nutrition Country Profiles. IFPRI, Washington DC.
Imdad, A., Herzer, K., Mayo-Wilson, E., Yakoob, M. Y. and Bhutta, Z. A. 2010. Vitamin A
supplementation for preventing morbidity and mortality in children from 6 months to 5 years
of age. Cochrane Database of Systematic Reviews, 12, CD008524
Imdad, A., Yakoob, M. Y., Sudfeld, C., Haider, B. A., Black, R. E., Bhutta, Z. A. 2011. Impact of vitamin A
supplementation on infant and childhood mortality. BMC Public Health, 11(Suppl 3), S20
Ismail, S., Shindano, J., Nyirenda, D. B., Bandyopadhyay, R. and Akello, J. 2014. Does Exposure to
Aflatoxin Constrain Efforts to Reduce Stunting in Zambia? In: Harris, J., Haddad, L. and Seco-
Grütz, S. Turning Rapid Growth into Meaningful Growth: Sustaining the Commitment to
Nutrition in Zambia. Institute of Development Studies, Brighton.
Kalusopa T. 2005. The challenges of utilizing information communication technologies (ICTs) for the
small-scale farmers in Zambia. Library Hi Tech, Vol. 23 Iss 3 pp. 414 – 424. Available online at
http://dx.doi.org/10.1108/07378830510621810
Kankolongo, M. A., Hell, K. and Nawa, I. N. 2009. Assessment for Fungal, Mycotoxin and Insect
Spoilage in Maize Stored for Human Consumption in Zambia. Journal of the Science of Food
and Agriculture, 89(8), 1366-1375
Kuteya A. 2012. A al zi g )a ia s Ag i ultu al “e to Budget . Presentation at the ACF/IAPRI.
Lewis, W. A. (1962). Education and economic development. Caribbean Quarterly, 7(4), 171-184.
Mason N.M., Jayne T.S. and Mofya‐Mukuka ‘. . )a ia's i put su sid programs. Agricultural
Economics, 44(6), 613-628.
Mumba C., Pandey G. S. and van der Jagt C. 2013: Milk production potential, marketing and income
opportunities in key traditional cattle keeping areas of Zambia. Livestock Research for Rural
Development. Volume 25, Article #73. Retrieved August 1, 2017, from:
http://www.lrrd.org/lrrd25/4/mumb25073.htm
Must, A. and McKeown, N. M. 2012. The disease burden associated with overweight and obesity. In:
De Groot, L. J., Beck-Peccoz, P., Chrousos, G., Dungan, K., Grossman, A., Hershman, J. M.,
Koch, C., McLachlan, R., New, M., Rebar, R., Singer, F., Vinik, A., and Weickert, M. O. (editors).
Endotext. MDText.com, Inc., South Dartmouth (MA). Retrieved October 10, 2016, from
https://www.ncbi.nlm.nih.gov/books/NBK279095/
National Agricultural Investment Plan (NAIP), Final Draft. May 2013. Ministry of Agriculture and
Livestock. Lusaka, Zambia. Available online at:
http://www.gafspfund.org/sites/gafspfund.org/files/Documents/6.%20Zambia_investment%2
0plan.pdf
Njoroge, S. M. C., Matumba, L., Kanenga, K., Siambi, M., Waliyar, F., Maruwo, J. and Monyo, E. S.
2016. A Case for Regular Aflatoxin Monitoring in Peanut Butter in Sub-Saharan Africa: Lessons
from a 3-Year Survey in Zambia. Journal of Food Protection, 79(5), 795-800
Country Dossier Zambia
39
PAHO/WHO. 2003. Guiding principles for complementary feeding of the breastfed child. PAHO,
Washington DC.
Rapsomanikis, G. 2014. The economic lives of smallholder farmers; An analysis based on household
surveys. Rome: Food and Agriculture Organization.
ReSAKSS. 2017. Homepage. Accessed from: http://resakss.org/
Scaling Up Nutrition. 2017. Homepage. Accessed from: http://scalingupnutrition.org/
Stevens, G. A., Bennett, J. E., Hennocq, Q. et al. 2015. Trends and Mortality Effects of Vitamin A
Deficiency in Children in 138 Low- and Middle-Income Countries: Pooled Analysis of
Population-Based Surveys. Lancet, 3(9), e528–e536
Technoserve. 2010. Southern Africa Soy Roadmap – Zambia value chain analysis. November 2010 –February 2011
UNICEF. 2013. Improving child nutrition: The achievable imperative for global progress. UNICEF, New
York.
UNICEF/WHO/World Bank. 2016. Levels and Trends in Child Malnutrition: UNICEF-WHO-The World
Bank: Joint Malnutrition Estimates, August 2016. New York, Geneva, and Washington, DC.
Retrieved September 26, 2016, from http://who.int/nutgrowthdb/estimates2015/en/
University of Oxford (2015). The Malaria Atlas Project. http://www.map.ox.ac.uk. Accessed 22 Nov
2016
USDA (US Department of Agriculture, Agricultural Research Service, Nutrient Data Laboratory). 2016.
USDA National Nutrient Database for Standard Reference, Release 28 (Slightly revised).
Retrieved October 5, 2016, from http://www.ars.usda.gov/ba/bhnrc/ndl
Van Bussel L.G.J., Grassini P., van Wart J., Wolf J., Claessens L., Yang H., Boogaard H., de Groot H.,
Saito K., Cassman K.G., van Ittersum M.K. 2015. From field to atlas: Upscaling of location-
specific yield gap estimates. Field Crops Research, 117, 98-108.
von Grebmer K., Saltzman A., Birol E., Wiesmann D., Prasai N., Yohannes Y., Menon P., Thompson J.
and Sonntag A. 2014. Global Hunger Index 2014: The Challenge of Hidden Hunger.
Bonn/Washington D.C./Dublin: Welthungerhilfe, International Food Policy Research Institute
(IFPRI), Concern Worldwide.
WHO. 1995. Physical Status: The Use and Interpretation of Anthropometry. Report of a WHO Expert
Committee. Technical Report Series 845, WHO, Geneva.
WHO. 2000. The Management of Nutrition in Major Emergencies. WHO, Geneva.
WHO. 2003. Nutrition and the prevention of chronic diseases. Report of a Joint WHO/FAO Expert
Consultation. Technical Report Series 916, WHO, Geneva.
WHO. 2005. Guiding principles for feeding non-breastfed children 6-24 months of age. WHO, Geneva.
WHO. 2010. Indicators for Assessing Infant and Young Child Feeding Practices, Part 1: Definitions.
WHO, Geneva.
WHO. 2015a. Global Health Observatory Data Repository: Adult overweight and adult obesity.
Retrieved September 15, 2016, from
http://apps.who.int/gho/data/node.main.A897A?lang=en and
http://apps.who.int/gho/data/node.main.A900A?lang=en
WHO. 2015b. The Global Prevalence of Anaemia in 2011. WHO, Geneva.
WHO/FAO/UNU. 2007. Protein and amino acid requirements in human nutrition. Report of a joint
FAO/WHO/UNU expert consultation. Technical Report Series 935, WHO, Geneva.
Program of Accompanying Research for Agricultural Innovation (PARI)
40
World Bank. 2006. Repositioning Nutrition as Central to Development: A Strategy for Large-Scale
Action. World Bank, Washington DC.
World Bank. 2007. Zambia, Smallholder Agricultural Commercialization Strategy. World Bank,
Washington D.C..
World Bank. 2009. Nutrition at a glance. Accessed from:
http://siteresources.worldbank.org/NUTRITION/Resources/281846-
1271963823772/Zambia.pdf
World Bank. 2010. Jobs, prosperity and competitiveness: what would it take for the cattle industry to
achieve its potential? A final report. Sponsored by World Bank, DFID and AfDB
World Bank. 2017. Country data. Retrieved from http://data.worldbank.org/country
Yamauchi, F., P. Hamazakaza, and S. Drimie (2009). AIDS-Related Human Capital Loss and Labor
Productivity Decline in Government Service Delivery: Agricultural Extension Service in Zambia
Country Dossier Zambia
41
Annex A: Background Information on Nutrition
This annex provides background information on diet quantity and quality, child feeding practices and
nutrition status (including micronutrient deficiencies) and definitions of the food and nutrition security
indicators presented in Chapter 1.4.2.
Background on food and nutrition security
Diet quantity: Dietary energy supply per capita is an indicator of diet quantity that can be gauged against
a populatio s a e age dieta e e g e ui e e t. The data a e ased o FAO s food ala e sheets that estimate the quantity of each food item available for human consumption at the national level. It
has to be emphasized that supply does not equal intake: Supply includes food that households feed to
domestic animals or pets and food that they waste. Also, a sufficient average supply of dietary energy (or
a nutrient such as protein) may leave those parts of the population deprived that have greater-than-
average requirements or lower-than-average intakes. Indicators of undernourishment and food over-
acquisition seek to consider the distribution of dietary energy consumption in the population and the
minimum/maximum requirements of the average individual in a country (Cafiero, 2014).
Diet quality: Assessing diet quality requires a look at the composition of the diet. In the absence of
national food o su ptio su e s fo ost ou t ies, data f o FAO s food ala e sheets a e used. The percentage of dietary energy supply from starchy staples (cereals, roots and tubers) is a rough
indicator of diet quality: generally, the higher this percentage, the lower the micronutrient density of
the diet; starchy staples are rich in carbohydrate and good sources of dietary energy, but they are
usually not very micronutrient-rich. Non-staple foods are important for micronutrient and protein
supply: Foods of animal origin are good sources of high-quality protein and vitamin A as well as highly
bioavailable iron and zinc (meat, fish) and calcium (milk, small fish eaten whole with bones). Pulses and
nuts are also good sources of protein and micronutrients. Fruits and vegetables provide a range of
micronutrients while generally contributing little dietary energy (USDA, 2016).
The shares of dietary energy supply from carbohydrate, protein, and fat roughly indicate whether the
diet is balanced in terms of its macronutrient composition. The recommended shares of dietary energy
are 55-75% for carbohydrate, 10-15% for protein, and 15-30% for fat (WHO, 2003). It should be noted
that these shares do not reveal whether dietary energy supply per capita and average protein supply
are insufficient, sufficient, or excessive in absolute terms. A diet that meets the average dietary energy
requirement for Africa as a whole (2200 kcal/day according to FAO, 2016) and provides 55-82.5 g
protein per day and 36-73 g fat per day contains the recommended shares of 10-15% of dietary energy
from protein and 15-30% of dietary energy from fat. For an adult weighing 60 kg, a protein intake of
50 g/day is considered sufficient, and 60 g/day for an adult weighing 75 kg. No safe upper limit of
protein intake has been established, but it is unlikely that intakes of twice the recommended level pose
any risk (WHO/FAO/UNU, 2007).
Child feeding practices: Feeding practices are determined by local food availability and household access
to food, but also by maternal knowledge and care. Breastfed and non-breastfed children aged 6-23
months should eat foods rich in iron (meat, fish, or eggs) and fruits and vegetables rich in vitamin A daily,
and consume at least 4 out of 7 food groups every day (PAHO/WHO, 2003; WHO, 2005; WHO, 2010).
Nutrition status: Household food se u it , the health e i o e t, a d othe s a i g apa it i flue e hild e s dieta i takes a d the isk of i fe tio , a d the e thei ut itio a d health status (UNICEF, 2013). Wasting, or acute undernutrition, is the result of recent rapid weight loss or the
failure to gain weight that is caused by inadequate diets or infection. Stunting is the failure to grow
adequately and results from chronic or recurrent undernutrition or infection (UNICEF/WHO/World
Bank, 2016). Stunting in early childhood can have irreversible consequences, such as impaired motor
and cognitive development, shorter adult height, lower attained schooling, and reduced adult income,
whereas wasting carries a higher mortality risk (Victora et al. 2008; Black et al. 2013; Olofin et al. 2013).
Overweight in children and overweight and obesity in adults occur when dietary energy intakes exceed
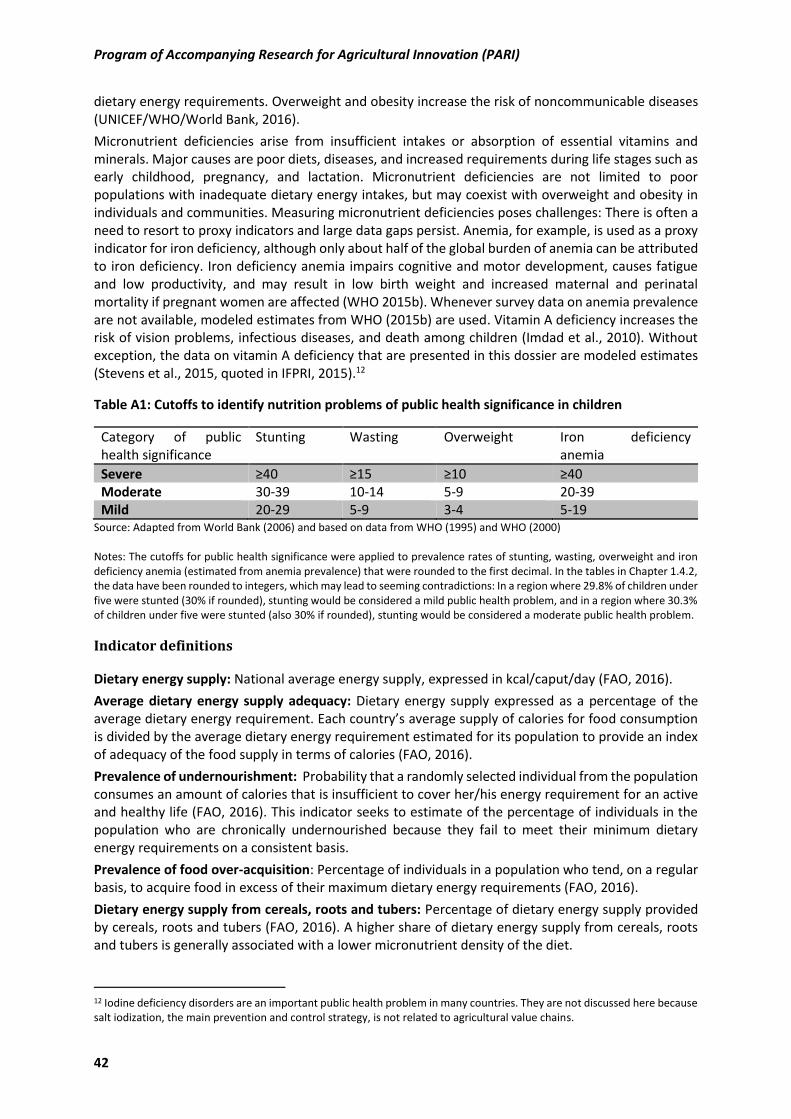
Program of Accompanying Research for Agricultural Innovation (PARI)
42
dietary energy requirements. Overweight and obesity increase the risk of noncommunicable diseases
(UNICEF/WHO/World Bank, 2016).
Micronutrient deficiencies arise from insufficient intakes or absorption of essential vitamins and
minerals. Major causes are poor diets, diseases, and increased requirements during life stages such as
early childhood, pregnancy, and lactation. Micronutrient deficiencies are not limited to poor
populations with inadequate dietary energy intakes, but may coexist with overweight and obesity in
individuals and communities. Measuring micronutrient deficiencies poses challenges: There is often a
need to resort to proxy indicators and large data gaps persist. Anemia, for example, is used as a proxy
indicator for iron deficiency, although only about half of the global burden of anemia can be attributed
to iron deficiency. Iron deficiency anemia impairs cognitive and motor development, causes fatigue
and low productivity, and may result in low birth weight and increased maternal and perinatal
mortality if pregnant women are affected (WHO 2015b). Whenever survey data on anemia prevalence
are not available, modeled estimates from WHO (2015b) are used. Vitamin A deficiency increases the
risk of vision problems, infectious diseases, and death among children (Imdad et al., 2010). Without
exception, the data on vitamin A deficiency that are presented in this dossier are modeled estimates
(Stevens et al., 2015, quoted in IFPRI, 2015).12
Table A1: Cutoffs to identify nutrition problems of public health significance in children
Category of public
health significance
Stunting Wasting Overweight Iron deficiency
anemia
Severe ≥ ≥ ≥ ≥ Moderate 30-39 10-14 5-9 20-39 Mild 20-29 5-9 3-4 5-19
Source: Adapted from World Bank (2006) and based on data from WHO (1995) and WHO (2000)
Notes: The cutoffs for public health significance were applied to prevalence rates of stunting, wasting, overweight and iron
deficiency anemia (estimated from anemia prevalence) that were rounded to the first decimal. In the tables in Chapter 1.4.2,
the data have been rounded to integers, which may lead to seeming contradictions: In a region where 29.8% of children under
five were stunted (30% if rounded), stunting would be considered a mild public health problem, and in a region where 30.3%
of children under five were stunted (also 30% if rounded), stunting would be considered a moderate public health problem.
Indicator definitions
Dietary energy supply: National average energy supply, expressed in kcal/caput/day (FAO, 2016).
Average dietary energy supply adequacy: Dietary energy supply expressed as a percentage of the
a e age dieta e e g e ui e e t. Ea h ou t s a e age suppl of alo ies fo food o su ptio is divided by the average dietary energy requirement estimated for its population to provide an index
of adequacy of the food supply in terms of calories (FAO, 2016).
Prevalence of undernourishment: Probability that a randomly selected individual from the population
consumes an amount of calories that is insufficient to cover her/his energy requirement for an active
and healthy life (FAO, 2016). This indicator seeks to estimate of the percentage of individuals in the
population who are chronically undernourished because they fail to meet their minimum dietary
energy requirements on a consistent basis.
Prevalence of food over-acquisition: Percentage of individuals in a population who tend, on a regular
basis, to acquire food in excess of their maximum dietary energy requirements (FAO, 2016).
Dietary energy supply from cereals, roots and tubers: Percentage of dietary energy supply provided
by cereals, roots and tubers (FAO, 2016). A higher share of dietary energy supply from cereals, roots
and tubers is generally associated with a lower micronutrient density of the diet.
12 Iodine deficiency disorders are an important public health problem in many countries. They are not discussed here because
salt iodization, the main prevention and control strategy, is not related to agricultural value chains.
Country Dossier Zambia
43
Dietary energy supply from carbohydrate: Percentage of dietary energy supply provided by
carbohydrates, calculated by subtracting dietary energy supply from protein and dietary energy supply
from fat from 100%.
Dietary energy supply from protein: Percentage of dietary energy supply provided by protein,
calculated as average protein supply times 4 kcal/g divided by total dietary energy supply.
Dietary energy supply from fat: Percentage of dietary energy supply provided by fat, calculated as
average fat supply times 9 kcal/g divided by total dietary energy supply.
Average protein/fat supply: National average protein/fat supply, expressed in g/caput/day (FAO, 2016).
Minimum dietary diversity: consumption of 4+ food groups: Percentage of children aged 6-23 months
fed four or more food groups in the 24 hours preceding the survey. The food groups are 1) infant formula,
milk other than breast milk, cheese or yogurt or other milk products; 2) foods made from grains, roots,
and tubers, including porridge and fortified baby food from grains; 3) vitamin A-rich fruits and vegetables
(and red palm oil); 4) other fruits and vegetables; 5) eggs; 6) meat, poultry, fish, and shellfish (and organ
meats); 7) legumes and nuts (ICF International, 2015, The DHS Program STATcompiler).
Consumption of foods rich in vitamin A: Percentage of children aged 6-23 months who consumed
foods rich in vitamin A in the 24 hours preceding the survey. Foods rich in vitamin A include meat (and
organ meat), fish, poultry, eggs, pumpkin, red or yellow yams or squash, carrots, red sweet potatoes,
dark green leafy vegetables (for example, cassava leaves, pumpkin leaves, kale or spinach), mango,
papaya, and other locally grown fruits and vegetables that are rich in vitamin A (ICF International, 2015,
The DHS Program STATcompiler).
Consumption of foods rich in iron: Percentage of children aged 6-23 months who consumed foods rich
in iron in the 24 hours preceding the survey. Foods rich in iron include meat (and organ meat), fish,
poultry, and eggs (ICF International, 2015, The DHS Program STATcompiler).
Child wasting: Percentage of children under five who are wasted, that is, have weight-for-height below
minus 2 standard deviations of the median of the WHO Child Growth Standards. This means that they
are too thin for their height (UNICEF/WHO/World Bank, 2016).
Child stunting: Percentage of children under five who are stunted, that is, have height-for-age below
minus 2 standard deviations of the median of the WHO Child Growth Standards. This means that they
are too short for their age (UNICEF/WHO/World Bank, 2016).
Child overweight: Percentage of children under five who are overweight, that is, have weight-for-
height above 2 standard deviations of the median of the WHO Child Growth Standards. This means
that they are too heavy for their height (UNICEF/WHO/World Bank, 2016).
Adult overweight and obesity/overweight and obesity among women of reproductive age: Percentage
of adults aged 18 years or older/percentage of women of reproductive aged 15-49 years whose body
mass index (BMI) is equal to or greater than 25 kg/m2 (WHO, 2015a; ICF International, 2015, The DHS
Program STATcompiler). BMI is calculated by dividing body weight in kg by squared height in m.
Adult obesity/obesity among women of reproductive age: Percentage of adults aged 18 years or
older/percentage of women aged 15-49 years whose body mass index (BMI) is equal to or greater than
30 kg/m2 (WHO, 2015a; ICF International, 2015, The DHS Program STATcompiler).
Adult underweight/underweight among women of reproductive age: Percentage of adults aged 18
years or older/percentage of women aged 15-49 years whose body mass index (BMI) is below 18.5
kg/m2 (ICF International, 2015, The DHS Program STATcompiler).
Vitamin A deficiency: Percentage of children aged 6-59 months with a serum retinol concentration
elo . μ ol/l. Anemia in children: Percentage of children aged 6-59 months with anemia, namely, a blood
hemoglobin concentration below 11.0 g/dl.
Anemia in women: Percentage of women aged 15-49 years with anemia, namely, a blood hemoglobin
concentration below 12.0 g/dl for non-pregnant women and below 11.0 g/dl for pregnant women.

ABOUT PARI
The Progra of A o pa yi g Resear h for Agri ultural I o a� o PARI ri gs together part ers fro Afri a, I dia a d Ger a y to o tri ute to sustai a le agri ultural gro th a d food a d
utri� o se urity i Afri a a d I dia as part of the O e World, No Hu ger I i� a� e supported y the Ger a go er e t.
PROJECT DIRECTORProf. Dr. Joa hi o Brau
Ce ter for De elop e t Resear h )EFGe s herallee
Bo , Ger a yE-Mail: pari@u i- o .de
Pho e: + - -
.research4agrinno a� on.org
Follo us o Fa e ook a d T i� er.fa e ook. o /pari.zef
T i� er: @PARI_)EF