innovation and productivity in manufacturing and service ... · innovation and productivity in...
TRANSCRIPT
Economics of Innovation and New TechnologyVol. 19, No. 3, April 2010, 233–258
Innovation and productivity in manufacturing and service firmsin Catalonia: a regional approach
Agustí Segarra-Blasco*
Research Industry and Territory Group, Department of Economics, Rovira i Virgili University,Reus, Spain
(Final version received 21 October 2008 )
This article analyses the determinants of research and development (R&D) and the roleof innovation on labour productivity in Catalan firms. Our empirical analysis found aconsiderable heterogeneity in firm performances between the manufacturing and ser-vice industries and between low- and high-tech industries. The frontiers that separatemanufacturing and service industries are increasingly blurred. In Catalonia high-techknowledge-intensive services (KIS) play a strategic role in promoting innovation inboth manufacturing and service industries, and driving growth throughout the regionaleconomy. Empirical results show new firms created during the period 2002–2004 thathave a greater R&D intensity than incumbent firms (54.1% in high-tech manufactur-ing industries and 68.8% in high-tech KIS). Small and young firms in the high-techKIS sector are very prone to carrying out R&D and they invest more in innovationprojects. R&D expenditures, output innovation, investment in physical capital, marketshare and export have positive effects on labour productivity in both the manufacturingand service sectors. Firm size, on the other hand, has a positive effect on productivity inmanufacturing industries but not in services.
Keywords: innovation; R&D; productivity; knowledge-intensive services
JEL Classification: 140; 310; L100
1. IntroductionThis article explores the determinants of research and development (R&D), innovation andproductivity at the firm level in both manufacturing and service industries in Catalonia.In general, empirical literature focuses on manufacturing firms and only a few contribu-tions shed some light on the services sector (Strambach 2001; Tether 2003; Miles 2005;Hempell 2005; Cainelli, Evangelista, and Savona 2006; Lööf and Heshmati, 2006; Arvanitis2008). Despite the increasing prominence of services in the European economies and thecentral role acquired by knowledge-intensive services (KIS) in the emerging knowledge-based economies few articles have dealt with both manufacturing and services industries.
*Email: [email protected]
ISSN 1043-8599 print/ISSN 1476-8364 online© 2010 Taylor & FrancisDOI: 10.1080/10438590802469594http://www.informaworld.com
Downloaded By: [Consorci de Biblioteques Universitaries de Catalunya] At: 09:31 2 September 2010
234 A. Segarra-Blasco
However, in R&D and innovative activities there is considerable heterogeneity among firmsand among industries.
The determinants of R&D and innovation and their effects on productivity at the firmlevel have been subject to increasing interest in recent years (Griliches 1995; Crépon,Duguet, and Mairesse 1998; Mairesse and Mohnen 2004; Hall and Mairesse 2006; Mohnen,Mairesse, and Dagenais 2006). The greater availability of micro-level data in the EU,especially since the advent of the Community Innovation Survey (CIS), has led to a growingnumber of studies on the links between R&D, innovation and productivity at the firmlevel. Access to the micro-aggregated data of the innovation surveys in different Europeancountries has also resulted in a new analytical perspective. Some empirical studies estimate aproduction function of knowledge by relating R&D to innovation, measured as the number ofpatents or the share of innovative sales. Others link R&D, innovation output and productivityat the firm level using the framework proposed by Crépon, Duguet and Mairesse (1998) forFrance (henceforth, the CDM model). We apply a structural model that describes the linkbetween R&D expenditure, innovation output and productivity proposed by these authorsand its successive modifications (Griffith et al. 2006; Hall and Mairesse, 2006; Mohnen,Mairesse, and Dagenais 2006). The CMD model proposes a simple framework that linksinnovative and productive activities, and provides estimation methods that are appropriateto the specification of the model and the nature of data. In this article we estimated a three-stage econometric model linking research, innovation and labour productivity using recentfirm-level data.
This article contributes to the literature by investigating the different patterns of man-ufacturing and service firms in Catalonia. The data set is a broad sample of 3554 Catalanfirms that answered the Spanish version of the CIS questionnaire in 2002–2004. CIS-4 hasbeen considerably improved with respect to previous editions: it is representative of firmswith more than 10 employees (versus 20+ employees in CIS-3) and of both manufacturingand service firms (CIS-3 was representative of the manufacturing industry only). The aim ofthis article is to investigate the links between R&D, innovation and productivity in Catalanfirms from both the manufacturing and service industries.
The main empirical results are the following. New firms created during the period 2002–2004 present high levels of R&D expenditures in high-tech manufacturing and serviceindustries. High-tech industries and high-tech KIS are more sensitive to market share,public funds and export activities. In low-tech industries and services the market shareincreases the propensity to engage in R&D but the export activity and the presence of newfirms have no direct effect on firm R&D intensity. As far as the determinants of outputinnovation were concerned, the main results were the following: the probability that a firmwill innovate increases with its size, R&D inputs and the contracting of research personnel.Finally, in the link between innovation and productivity empirical results show that labourproductivity was directly affected by R&D intensity, output innovation and firm marketshare.
In this article we adopt an integrated approach in which manufacturing and service firmsdo not follow entirely different innovation processes but present important differences inthe nature of innovation. Service firms are less likely to acquire knowledge and technologythrough ‘hard’ sources (R&D, acquisition of external R&D or the incorporation of newequipment) and are more likely to source knowledge and technology through ‘soft’ sources(relations with suppliers and customers, cooperation with partners or internal organizationalchanges). Despite these differences in the nature of the innovation process between manu-facturers and services, the answer to the question ‘Do services innovate differently?’ is no,in the sense that service firms have no particular innovation pattern (Tether 2005).
Downloaded By: [Consorci de Biblioteques Universitaries de Catalunya] At: 09:31 2 September 2010
Economics of Innovation and New Technology 235
Although the services sector has been the only one in the European economy to havegenerated jobs in the last two decades, innovation studies are largely associated withmanufacturing industries in one particular country (see Smith 2005) or different countries(Mohnen, Mairesse, and Dagenais 2006; Peters 2009; Pianta and Vaona 2007). In recentyears, however, increasing attention has been paid to innovation and the innovation processin service firms (Evangelista 2000; Howells and Tether 2004; Miles 2005).1
In addition, the fact that KIS have become involved in innovation and research ina particular region is of great importance. Some studies show that innovation rates aregreater in those regions where the concentration of KIS is high, since KIS generate anincreasing number of innovations and facilitate knowledge transfer and the adaptation ofexisting knowledge to the specific needs of manufacturing firms (Strambach 2001). For107 European regions, Camacho and Rodríguez (2005a) show that KIS have a centralrole in regional innovative performance. In nine European innovation systems (those ofDenmark, Finland, France, Germany, Greece, Italy, the Netherlands, Spain and the UnitedKingdom), Camacho and Rodríguez (2005b) found that, first, many service activities inno-vate and secondly, that some services, in particular KIS, play a key role in diffusingknowledge.
The aim of the present article is threefold. First, we observe the factors that determinewhether firms carry out R&D and the effects of R&D and innovation on productivity.Second, we focus on the different performance of firms in the manufacturing and serviceindustries. Third, we explore the importance of KIS in Catalonia and the role of services inregional innovation systems.
In recent years Catalonia has undergone an intense process of economic opening andhad its comparative advantages in traditional industries eroded, which has given rise tosignificant changes in its industrial mix. In 2006, the services sector accounted for 63.7%of total employment, whereas the manufacturing sector was responsible for only 22.7% oftotal employment. In Catalonia, between 1996 and 2006, employment in the manufacturingsector increased at an annual rate of 3.0%, whereas employment in total services increasedat an annual rate of 5.8% and KIS increased by 8.1%. The Catalan economy had 540,175employees in KIS industries in 1996 and 979,788 employees in 2006. Catalonia is aninteresting case for study for various reasons. First, because Catalan firms are much morecommitted to R&D activities than the rest of the Spanish regions. Secondly, because theurban system is dominated by the Barcelona metropolitan area, but there is also a networkof medium-sized cities with considerable economic and social vitality. Thirdly, the region’sindustrial tradition is based on medium- and low-technology manufacturing industries andis undergoing increasing specialization in services, particularly in high-tech KIS. Finally,in Catalonia KIS play an important role in spreading knowledge and in firm innovativeprojects.
The remainder of the article is organized as follows: in Section 2, we describe thegrowing strategic role of KIS in spreading knowledge and carrying out innovations. InSection 3, we present the database used on a sample of Catalan firms and the main descriptiveindicators of innovation activities. Section 4 presents the structural model that describes thelink between R&D expenditure, innovation output and productivity based on the frameworkproposed by Crépon, Duguet and Mairesse (1998). Section 5 describes the econometricresults in three steps. In the first step we applied selection and intensity models to analysethe determinants of the firm’s decision to carry out internal R&D. In the second step weanalysed the effect of several inputs on innovation. In the third step we analysed the linkbetween R&D, innovation and firm productivity. Finally, Section 6 summarizes the mainresults obtained in the empirical work.
Downloaded By: [Consorci de Biblioteques Universitaries de Catalunya] At: 09:31 2 September 2010
236 A. Segarra-Blasco
2. Innovation and productivity: the role of servicesAll advanced economies of the world are increasingly dominated by service activities, interms of value added and employment. In recent decades, net employment growth has beenabsorbed entirely by the service industries (Schettkat and Yocarini 2003). In 2004 in theEU-15 countries, the services sector accounted for 68.9% of total employment, whereas themanufacturing sector only accounted for 18.1%. In other terms, almost 113 million peoplewere employed in services, whereas only 30 million were employed in the manufacturingsector. Between 1999 and 2004 employment in the manufacturing sector in the EU-15decreased at an annual rate of 1.2%. Whereas employment in total services increased at anannual rate of 1.9%, KIS increased by 2.6% and high-tech KIS by 2.9%.
The economic literature has made two classic analyses of the expansion of the servicesector in industrialized economies. From the demand-side perspective, Clark (1940) arguesthat when income grows in industrialized countries, consumer demand for services is fargreater than for manufactured goods and this increases the participation of services in thelabour force and real output. From the supply-side perspective, Baumol (1967) developeda model in which the share of services and goods in real output is constant over time andacross countries. In this model the low productivity of the services sector is the drivingforce that explains the increasing share of services sector employment in industrializedcountries. For Clark, the shift to service employment is the result of changing final demandand for Baumol it is the result of differential productivity growth between manufacturingand service industries.
Baumol’s pessimistic vision of the negative impact of increasing specialization in theservices sector on the growth of aggregate productivity has been subject to review from twoperspectives. First, as Oulton (2001) argues, Baumol’s model of unbalanced growth is onlycorrect if the relatively stagnant service industries produce final products. When servicesproduce intermediate products (e.g. ICT activities, financial and business services), theaggregate growth rate of productivity does not necessarily fall. Second, service sectorsthat are part of the KIS in computer services, R&D services and financial and businessconsultancy have an increasing role in innovation and register high growth rates in terms ofproductivity (Barras 1986). Subsequent research has highlighted that the shift to the servicessector in industrialized countries has given rise to increasing productivity differentials inservice industries (Fuchs 1968; Schettkat and Yocarini 2003). Nevertheless, as Griliches(1992) has pointed out, there is a stronger downward bias in service-output measurement andin some service industries this measurement bias leads to an underestimation of productivitygrowth, particularly in KIS activities.
The intense transformation of services, particularly into KIS, makes it necessary toquestion two of the traditional myths of the services sector: namely, low productivity andmoderate innovative activity. Some services – particularly those catering for end consumerdemand and non-market services – still use a considerable number of low-qualified workers,and in general these activities register only sporadic increases in productivity. Other industryservices, however, register high productivity growth rates, are highly innovative and requireconsiderable numbers of skilled workers. What is more, service industries, particularly inthe KIS sector, are more internationalized and they face increasing market competition(Barras 1986; Wolff 1999; Oulton 2001).
In the last two decades the innovative activities of service firms have changed consider-ably. Service firms are becoming more R&D intensive; innovation output in service firms isincreasing and service firms increasingly centre on non-technological, disembodied formsof innovation. In this respect, innovative behaviour in manufacturing industries is not a goodmirror for services. There are important differences in the nature of innovation processes
Downloaded By: [Consorci de Biblioteques Universitaries de Catalunya] At: 09:31 2 September 2010
Economics of Innovation and New Technology 237
between manufacturing and service industries, and the traditional indicators used to eval-uate R&D and innovation outputs cannot be used for services. There are various reasonsfor this: the traditional concept of R&D has been shaped by technological innovations inthe manufacturing sector; organizational and marketing innovation play an important rolein services; the division between R&D investment and non-R&D innovation expendituresis not at all clear in services and, finally, patent applications are of limited use as outputindicators for service firms.
Service industries have undergone a profound transformation in several aspects: theimportance of KIS has been growing; the presence of qualified personnel – engineers,economists, analysts, lawyers – and knowledge content has increased; relations with othersectors have been encouraged through outsourcing from manufacturing to services and,finally, the international trade in KIS has grown by offshoring some activities to othercountries. The increasing tradability of KIS and the ease with which KIS can be transmittedover long distances facilitate the internationalization of KIS firms and give KIS a majorrole in regional innovation systems.
In addition, KIS play a crucial role in the creation and commercialization of new prod-ucts, processes and services (Metcalfe and Miles 2000; Miles 2005). High-tech KIS inparticular play a central role in regional innovation systems, especially in those domi-nated by SMEs. Innovative activities link SMEs and high-tech KIS through the process ofgenerating, transferring and spreading knowledge (Muller and Zenker 2001). Face-to-faceinteraction is very important in the relationships that KIS firms have with their customersand these relationships tend to be long term (Cohen and Levinthal 1989). Service firmsacquire explicit and tactical knowledge about their customer firm which enables them toadopt innovative problem solutions to organization specific requirements and to integratethem into the corresponding firm structure and culture (Strambach 2001).
The interactions between firms and institutions that make up the regional innovationsystem (universities, research and transfer centres, innovative firms, etc.) generate externaleconomies of knowledge that benefit firms. Most research on the geographic scope of knowl-edge spillovers suggests that they are local or regional (Jaffe, Trajtenberg, and Henderson1993; Audretsch and Feldman 1996; Ciccone and Hall 1996). The Catalan innovation sys-tem consists of the Catalan system of science and technology on the one hand (includinguniversities, public research centres and R&D departments) and innovating firms located inCatalonia, on the other. In this context, KIS firms play an increasing role in the generationand transfer of new knowledge.2
The effects of KIS on the regional innovation system are direct and indirect. On theone hand, the innovative activities of KIS firms have direct effects such as new knowledgegeneration, and process, product, organizational and market innovations.3 In this respect,this study presents empirical evidence about the difference in innovative behaviour betweenmanufacturing and service firms. In manufacturing firms technological innovation is moreimportant, but in service firms innovative activity is more varied, and innovation related toorganizational change has greater weight. On the other hand, KIS have indirect effects on andgive positive feedback to manufacturing firms. The role of KIS in the regional innovationsystem is closely related to the nature of their products: expert knowledge, consultancy indifferent areas, R&D ability and problem-solving ability.
3. The surveySince the early 1990s, international bodies have initiated two main projects that facilitatethe study of the determinants of innovation in both manufacturing and service industries.
Downloaded By: [Consorci de Biblioteques Universitaries de Catalunya] At: 09:31 2 September 2010
238 A. Segarra-Blasco
On the one hand, a collective project under the auspices of the OECD on the nature andmeasurement of innovative activities, carried out by statisticians, resulted in the so-calledOslo manual (1992). Subsequent versions of the Oslo manual (1996, 2005) provide newviews of the innovation process in firms. The most recent version, in particular, pointsout the role of organizational and marketing innovation. On the other hand, following theguidelines set out in the Oslo manual, a number of countries have designed a commoncore questionnaire on firms’ innovative activities. Since 1990, many European countrieshave launched different versions of the CIS,4 which provide access to a range of informa-tion about the innovative behaviour of European firms in both manufacturing and servicessectors.
The data set used was based on a sample of Catalan firms and was part of the Spanishsample of CIS. This database contains extensive information about the strategies and per-formance of business innovation during the period 2002–2004. The Spanish CIS-4 coveredprivate sector firms with at least 10 employees. This survey asked firms which sources theyused in their innovation process. The innovation sources include cooperation agreementswith other firms and public institutions, internal R&D, public funds and a large amount ofquantitative and qualitative data on the firms’ innovative behaviour.
Given that the aim of this article is to study the determinants of innovative activitiesin both manufacturing and service firms, it is advisable to properly delimit the activitiesthat are included in the services. The KIS sector has often been defined as consisting ofmany forms of technical and management consultancies and a wide variety of specialists –for example, in financial management, marketing and advertising, staff recruitment anddevelopment, trade promotion or distribution logistics (Wood 2002). Eurostat divides theKIS sector into a variety of groups. Knowledge-intensive business services working intelecommunications, computer services and R&D activities – codes 64, 72 and 73 – playan increasing role in the production and diffusion of knowledge in innovation processes(Muller and Zenker 2001). Other KIS related to financial activities, transport and distributionlogistics, education, health and social services – codes 61, 62, 65–67, 70, 71, 74, 80, 85 and92 – play an increasingly more important role in the business environment and affect theability of companies to innovate.
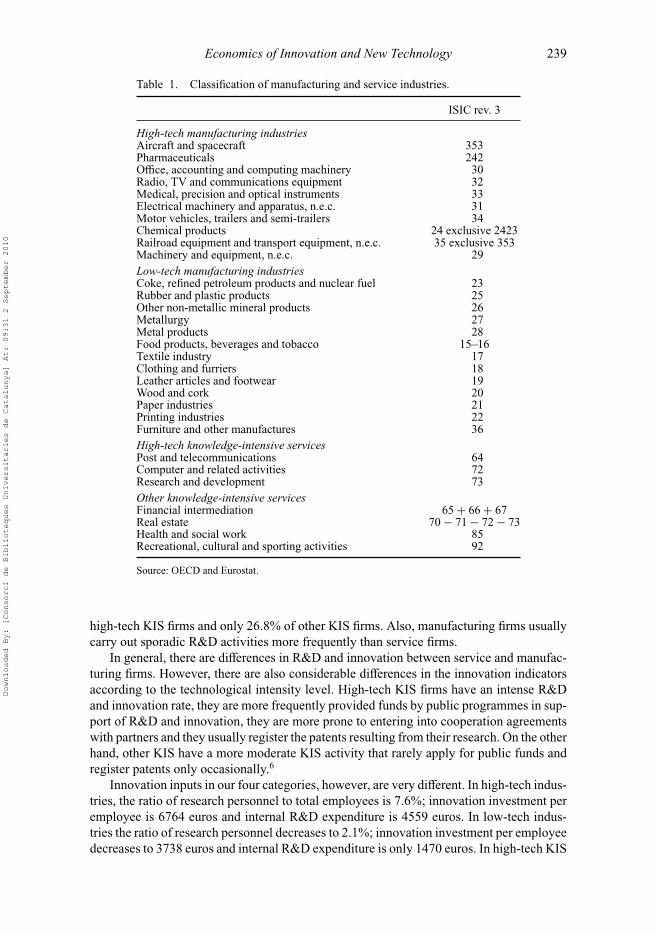
Our database includes the CIS questionnaires completed by 3554 Catalan firms. In orderto analyse the differences between innovation patterns in the manufacturing and servicesectors the firm sample is grouped into four categories (Table 1): high-technology manu-facturing industries (1130 firms); low-technology manufacturing industries (1443 firms);high-technology KIS (277 firms) and other KIS (704 firms).
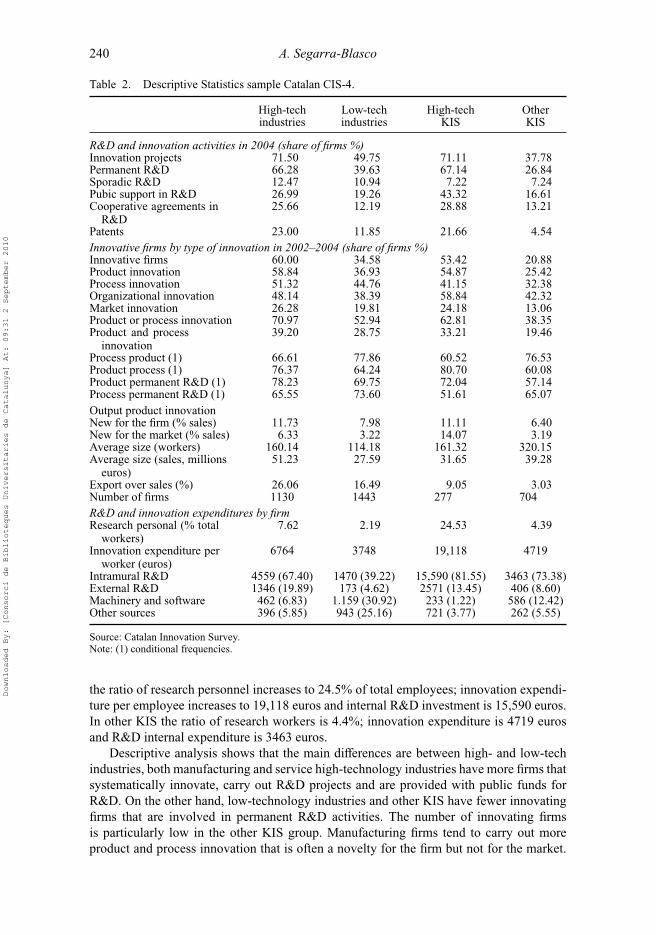
3.1. Some descriptive statisticsBefore describing the econometric model we shall present some indicators of R&D andinnovative activities. We pay special attention to the differences between the four categories.Our data source is the Catalan sample of CIS-4, and the variables used in the empirical workare defined in the appendix. Table 2 shows that in the period 2002–2004 manufacturing firmswere more prone to carrying out innovative activities than service firms. In the high-techindustries, 60.0% of firms are innovative; in the low-tech industries, 34.5% of firms areinnovative; in the high-tech KIS the percentage of innovative firms rises to 53.4% and,finally, in the other KIS only 20.8% of firms are innovative.5
In addition, the number of firms that undertake permanent R&D activities differs betweengroups. Permanent R&D is applied by 66.2% of the firms in high-tech industries but only by39.6% firms in low-tech industries. However, permanent R&D is carried out by 67.1% of
Downloaded By: [Consorci de Biblioteques Universitaries de Catalunya] At: 09:31 2 September 2010
Economics of Innovation and New Technology 239
Table 1. Classification of manufacturing and service industries.
ISIC rev. 3
High-tech manufacturing industriesAircraft and spacecraft 353Pharmaceuticals 242Office, accounting and computing machinery 30Radio, TV and communications equipment 32Medical, precision and optical instruments 33Electrical machinery and apparatus, n.e.c. 31Motor vehicles, trailers and semi-trailers 34Chemical products 24 exclusive 2423Railroad equipment and transport equipment, n.e.c. 35 exclusive 353Machinery and equipment, n.e.c. 29Low-tech manufacturing industriesCoke, refined petroleum products and nuclear fuel 23Rubber and plastic products 25Other non-metallic mineral products 26Metallurgy 27Metal products 28Food products, beverages and tobacco 15–16Textile industry 17Clothing and furriers 18Leather articles and footwear 19Wood and cork 20Paper industries 21Printing industries 22Furniture and other manufactures 36High-tech knowledge-intensive servicesPost and telecommunications 64Computer and related activities 72Research and development 73Other knowledge-intensive servicesFinancial intermediation 65 + 66 + 67Real estate 70 − 71 − 72 − 73Health and social work 85Recreational, cultural and sporting activities 92
Source: OECD and Eurostat.
high-tech KIS firms and only 26.8% of other KIS firms. Also, manufacturing firms usuallycarry out sporadic R&D activities more frequently than service firms.
In general, there are differences in R&D and innovation between service and manufac-turing firms. However, there are also considerable differences in the innovation indicatorsaccording to the technological intensity level. High-tech KIS firms have an intense R&Dand innovation rate, they are more frequently provided funds by public programmes in sup-port of R&D and innovation, they are more prone to entering into cooperation agreementswith partners and they usually register the patents resulting from their research. On the otherhand, other KIS have a more moderate KIS activity that rarely apply for public funds andregister patents only occasionally.6
Innovation inputs in our four categories, however, are very different. In high-tech indus-tries, the ratio of research personnel to total employees is 7.6%; innovation investment peremployee is 6764 euros and internal R&D expenditure is 4559 euros. In low-tech indus-tries the ratio of research personnel decreases to 2.1%; innovation investment per employeedecreases to 3738 euros and internal R&D expenditure is only 1470 euros. In high-tech KIS
Downloaded By: [Consorci de Biblioteques Universitaries de Catalunya] At: 09:31 2 September 2010
240 A. Segarra-Blasco
Table 2. Descriptive Statistics sample Catalan CIS-4.
High-tech Low-tech High-tech Otherindustries industries KIS KIS
R&D and innovation activities in 2004 (share of firms %)Innovation projects 71.50 49.75 71.11 37.78Permanent R&D 66.28 39.63 67.14 26.84Sporadic R&D 12.47 10.94 7.22 7.24Pubic support in R&D 26.99 19.26 43.32 16.61Cooperative agreements in
R&D25.66 12.19 28.88 13.21
Patents 23.00 11.85 21.66 4.54Innovative firms by type of innovation in 2002–2004 (share of firms %)Innovative firms 60.00 34.58 53.42 20.88Product innovation 58.84 36.93 54.87 25.42Process innovation 51.32 44.76 41.15 32.38Organizational innovation 48.14 38.39 58.84 42.32Market innovation 26.28 19.81 24.18 13.06Product or process innovation 70.97 52.94 62.81 38.35Product and process
innovation39.20 28.75 33.21 19.46
Process product (1) 66.61 77.86 60.52 76.53Product process (1) 76.37 64.24 80.70 60.08Product permanent R&D (1) 78.23 69.75 72.04 57.14Process permanent R&D (1) 65.55 73.60 51.61 65.07Output product innovationNew for the firm (% sales) 11.73 7.98 11.11 6.40New for the market (% sales) 6.33 3.22 14.07 3.19Average size (workers) 160.14 114.18 161.32 320.15Average size (sales, millions
euros)51.23 27.59 31.65 39.28
Export over sales (%) 26.06 16.49 9.05 3.03Number of firms 1130 1443 277 704R&D and innovation expenditures by firmResearch personal (% total
workers)7.62 2.19 24.53 4.39
Innovation expenditure perworker (euros)
6764 3748 19,118 4719
Intramural R&D 4559 (67.40) 1470 (39.22) 15,590 (81.55) 3463 (73.38)External R&D 1346 (19.89) 173 (4.62) 2571 (13.45) 406 (8.60)Machinery and software 462 (6.83) 1.159 (30.92) 233 (1.22) 586 (12.42)Other sources 396 (5.85) 943 (25.16) 721 (3.77) 262 (5.55)
Source: Catalan Innovation Survey.Note: (1) conditional frequencies.
the ratio of research personnel increases to 24.5% of total employees; innovation expendi-ture per employee increases to 19,118 euros and internal R&D investment is 15,590 euros.In other KIS the ratio of research workers is 4.4%; innovation expenditure is 4719 eurosand R&D internal expenditure is 3463 euros.
Descriptive analysis shows that the main differences are between high- and low-techindustries, both manufacturing and service high-technology industries have more firms thatsystematically innovate, carry out R&D projects and are provided with public funds forR&D. On the other hand, low-technology industries and other KIS have fewer innovatingfirms that are involved in permanent R&D activities. The number of innovating firmsis particularly low in the other KIS group. Manufacturing firms tend to carry out moreproduct and process innovation that is often a novelty for the firm but not for the market.
Downloaded By: [Consorci de Biblioteques Universitaries de Catalunya] At: 09:31 2 September 2010
Economics of Innovation and New Technology 241
Service firms, however, carry out less product or process innovation but it is more ofteninnovation for the market. Service firms also carry out more organizational and marketinnovation than manufacturing firms. Descriptive data show interesting differences betweenthe manufacturing and service sector and between the high- and low-tech sectors in the fieldsof R&D, sources of innovation and innovation output.
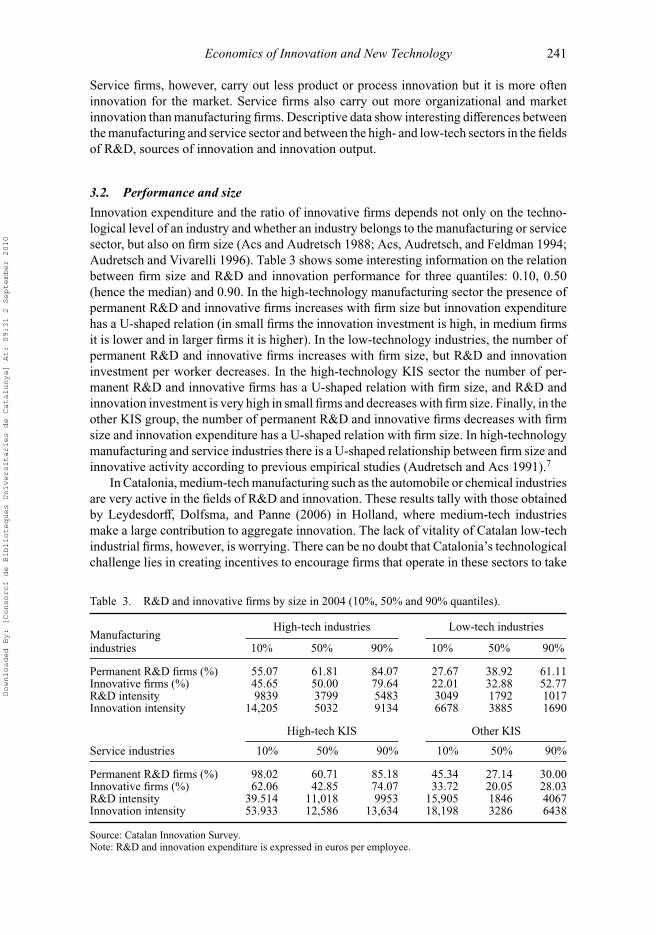
3.2. Performance and sizeInnovation expenditure and the ratio of innovative firms depends not only on the techno-logical level of an industry and whether an industry belongs to the manufacturing or servicesector, but also on firm size (Acs and Audretsch 1988; Acs, Audretsch, and Feldman 1994;Audretsch and Vivarelli 1996). Table 3 shows some interesting information on the relationbetween firm size and R&D and innovation performance for three quantiles: 0.10, 0.50(hence the median) and 0.90. In the high-technology manufacturing sector the presence ofpermanent R&D and innovative firms increases with firm size but innovation expenditurehas a U-shaped relation (in small firms the innovation investment is high, in medium firmsit is lower and in larger firms it is higher). In the low-technology industries, the number ofpermanent R&D and innovative firms increases with firm size, but R&D and innovationinvestment per worker decreases. In the high-technology KIS sector the number of per-manent R&D and innovative firms has a U-shaped relation with firm size, and R&D andinnovation investment is very high in small firms and decreases with firm size. Finally, in theother KIS group, the number of permanent R&D and innovative firms decreases with firmsize and innovation expenditure has a U-shaped relation with firm size. In high-technologymanufacturing and service industries there is a U-shaped relationship between firm size andinnovative activity according to previous empirical studies (Audretsch and Acs 1991).7
In Catalonia, medium-tech manufacturing such as the automobile or chemical industriesare very active in the fields of R&D and innovation. These results tally with those obtainedby Leydesdorff, Dolfsma, and Panne (2006) in Holland, where medium-tech industriesmake a large contribution to aggregate innovation. The lack of vitality of Catalan low-techindustrial firms, however, is worrying. There can be no doubt that Catalonia’s technologicalchallenge lies in creating incentives to encourage firms that operate in these sectors to take
Table 3. R&D and innovative firms by size in 2004 (10%, 50% and 90% quantiles).
High-tech industries Low-tech industriesManufacturingindustries 10% 50% 90% 10% 50% 90%
Permanent R&D firms (%) 55.07 61.81 84.07 27.67 38.92 61.11Innovative firms (%) 45.65 50.00 79.64 22.01 32.88 52.77R&D intensity 9839 3799 5483 3049 1792 1017Innovation intensity 14,205 5032 9134 6678 3885 1690
High-tech KIS Other KIS
Service industries 10% 50% 90% 10% 50% 90%
Permanent R&D firms (%) 98.02 60.71 85.18 45.34 27.14 30.00Innovative firms (%) 62.06 42.85 74.07 33.72 20.05 28.03R&D intensity 39.514 11,018 9953 15,905 1846 4067Innovation intensity 53.933 12,586 13,634 18,198 3286 6438
Source: Catalan Innovation Survey.Note: R&D and innovation expenditure is expressed in euros per employee.
Downloaded By: [Consorci de Biblioteques Universitaries de Catalunya] At: 09:31 2 September 2010
242 A. Segarra-Blasco
a much more active role in making innovation a driving force in their competitiveness,especially larger firms that operate in international markets.
4. R&D, innovation and productivity: an empirical modelThis section presents a structural model linking R&D, innovation and productivity. It isbased on the analytical frame described by Crépon, Duguet and Mairesse (1998), and its suc-cessive reexaminations (Kremp, Mairesse, and Mohnen 2004; Mairesse and Mohnen 2004;Griffith et al. 2006; Mohnen, Mairesse, and Dagenais 2006). The CDM model explains pro-ductivity in terms of innovation output and innovation output in terms of R&D investment.The basic structure of the model describes how firms decide whether to make an effort toinnovate, how much effort to make and how much knowledge is produced as a result of thisinvestment; and output is produced using physical and labour factors and knowledge input.
The CDM model establishes a sequence that ranges from the factors that determine firms’R&D activities, to the effect that innovating firms have on productivity. In the first step,firms decide whether or not to carry out intramural R&D. In the second step, we analyse thedeterminants of R&D investment. In the third step, we deal with the factors that determinethe firm’s innovation output. Finally, in the fourth step, we use Cobb–Douglas’ productionfunction to determine the effects of innovation output and R&D on firm productivity. Wealso try to calculate the differences in the behaviour of manufacturing and service firms.
We use our data in four different equations to calculate: (i) firm’s decisions to carry outcontinuous R&D, (ii) the intensity of R&D investment, (iii) the determinants of innovationoutput and (iv) the output production function where knowledge is an input.
We also describe an econometric model for observing the determinants of R&D decision,innovation output and productivity. The first equation describes whether a firm is engagedin R&D activities or not. We assume there is a latent dependent variable rd∗
i for firm ‘i’that expresses some decision criteria, such as the expected present value of the firm’s profitrelated to R&D investment (Crépon, Duguet, and Mairesse 1998). R&D is modelled as ageneralized tobit model that expresses R&D decision as follows,
rd∗i = βXi + μi (1)
where Xi is a vector of determinants of R&D decision, β is a vector of parameters tobe estimated and μi is a random error term. In this binary model, the latent variable, thepropensity to engage in R&D activities rd∗
i is not observed. Therefore, the dependent variableis an unobservable latent variable (Greene 2003). The CIS questionnaire only providesinformation about whether the firm carries out continuous R&D activities or not. Using rdito denote the binary variable indicating that firm ‘i’ engages in continuous R&D activities,we obtain,
rdi ={
= 1 if rd∗i > 0
= 0 if rd∗i ≤ 0
(2)
where rdi is the observed binary variable which is zero for non-R&D firms and one forR&D firms. As explanatory variable Xi we include firm size and firm size square measuredas the log of the firm’s employees; a dummy that indicates whether the firm belongs to agroup; a dummy that indicates whether the firm receives public financial support in R&Dprojects; an export dummy; the firm’s market share in logs and a dummy with a value ofone if the firm was created between 2002 and 2004 and zero otherwise. We also introducea vector with industry dummy variables that captures the heterogeneity between industries.
Downloaded By: [Consorci de Biblioteques Universitaries de Catalunya] At: 09:31 2 September 2010
Economics of Innovation and New Technology 243
The second equation in our generalized tobit model measures a firm’s R&D intensityas the amount of R&D expenditure per employee. A firm’s R&D effort is described by thelatent variable r∗
i ,
r∗i = αZi + εi (3)
where Zi is a vector of determinants of R&D effort, α is a vector of parameters to beestimated and εi is a random error term. As explanatory variables of R&D intensity, we usefirm size, firm size square, a group membership dummy, public funds for R&D projects,firm market share, an export dummy and four dummy variables that capture sources ofinformation that are proxies of knowledge spillovers: internal information sources withininternal departments or other firms of the group; market information sources from clients andsuppliers; institutional information sources from public research centres and universities;and tacit information sources from conferences, trade fairs and face-to-face contacts. Inall estimations we also introduce a vector with industry dummy variables. We can see theamount of resources that an individual firm devotes to R&D projects and firm research effortis defined as follows,
ri ={
r∗i = ααi + εi if rdi = 1
0 if rdi = 0(4)
From expressions (1) and (3) we can estimate the determinants of the propensity to investand the intensity of investment in R&D in our four sectorial groups: high-tech manufacturingindustries, low-tech manufacturing industries, high-tech KIS and other KIS. Our decisionequation takes into account all firms and the intensity equation concentrates on innovativefirms that carry out continuous R&D activities.
A firm’s R&D activity generates knowledge and gives rise to various innovation outputs.We measure knowledge output with six indicators. Four dichotomic variables are related toproduct, process and organizational innovation and patent applications, and two continuousvariables are related to the share in the sales of new products or services new to the firmor to the market. In general the output innovation equation depends on R&D and has thefollowing general form,
gi = γ ri + δWi + υi (5)
where ri is the firm’s R&D intensity measured as the amount of R&D expenditure peremployee, Wi is a vector with the remaining determinants of knowledge production and υiis a random error term. Since output innovation presents two types of variables – a per-centage of innovative output on sales and a dichotomic output related to product, processand organizational innovation and patent applications – the appropriate model is a general-ized tobit model, with four selection equations and two intensity equations (Mairesse andMohnen 2005). In these estimations we are interested in determining the effect of R&Don innovation. We control for size and firm market share expressed as logs; a dummy thatindicates whether the firm belongs to a group; a dummy that takes the value 1 when thefirms make cooperation agreements for R&D projects with other partners; a dummy thatindicates whether the firm receives public funding for R&D and innovation in the EU,Spain or Catalonia; a dummy that indicates whether the firm exports; a vector with industrydummy variables and an error term.
The final equation of our model explains the determining factors of productivity levelby means of an augmented Cobb–Douglas production function with conventional inputs(employment and investment in physical capital), a vector with different knowledge prox-ies (such as in-house R&D expenditures and innovation output) and a vector with the
Downloaded By: [Consorci de Biblioteques Universitaries de Catalunya] At: 09:31 2 September 2010
244 A. Segarra-Blasco
firm’s characteristics. Under the assumption of constant returns to scale and by applyinglogarithms, the output production takes the following form,
yi = π1li + π2ki + π3gi + π4Xi + νi (6)
where yi is the firm productivity level measured as sales per employee, li is the labourfactor, ki is the physical capital measured by physical investment, gi is a vector of outputinnovation and, finally, Xi is a vector of firm characteristics and νi is a random error term.As explanatory variables we include output measures, in particular the innovative share ofsales per employee, and two measures of input innovation related to the number of scientificpersonnel per total employees and R&D expenditures per total employees. We also controlfor size and market share in logs, patents, group, cooperation in R&D, and export andsectorial characteristics expressed as dummy variables.
5. ResultsIn this section we summarize the results of our econometric analysis. All results areexpressed in terms of the marginal effect of the explanatory variables in the R&D andinnovation equations. In all estimations we have obtained specific results for four subsam-ples of firms in accordance with the technological intensity in the manufacturing sector andthe knowledge intensity in the service sector.
First we estimate what characteristics affect the probability that a firm will carry outpermanent R&D activities. In line with the recent literature, we are interested in observinghow a firm’s individual characteristics affect the probability of undertaking permanent R&D.
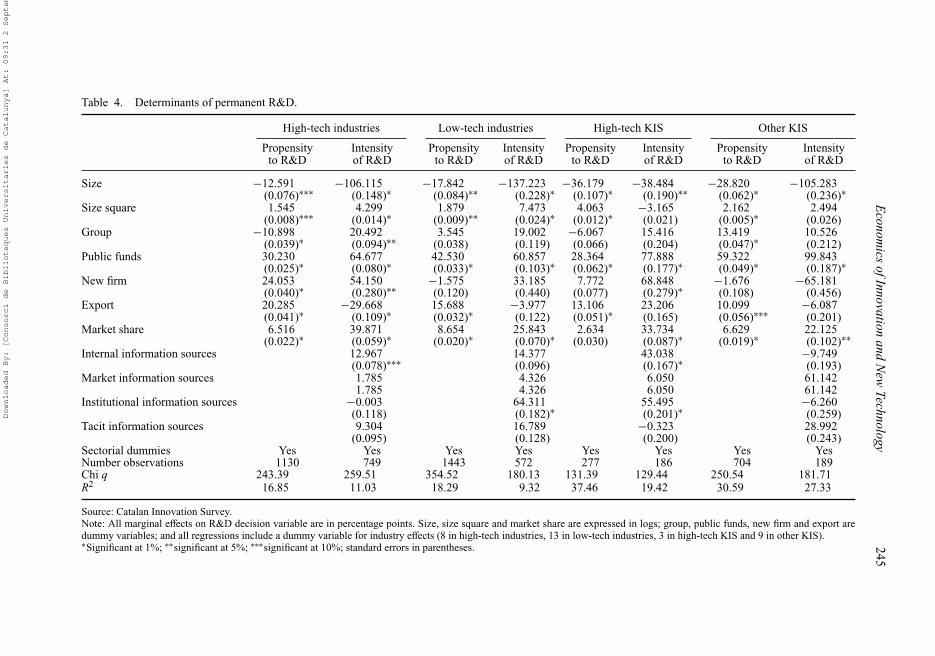
5.1. Determining factors of R&D behaviourTable 4 compares the marginal effects of the explanatory variables in the permanent R&Dequation. The results obtained using a logit binomial model show that the propensity toengage in permanent R&D increases with a firm’s market share (particularly in manufac-turing industries), the availability of public funds and whether the firm exports. When firmsare involved in foreign markets the propensity to engage in continuous intramural R&Dincreases by 20.2 percentage points in high-tech manufacturing industries, by 15.6 percent-age points in low-tech manufacturing industries, by 13.1 percentage points in high-tech KISand by 10.0 percentage points in other KIS. In contrast, the relation between the propensityto engage in permanent R&D and size describes a U-shape curve. These results tell usthat small and large firms have a greater propensity to undertake permanent R&D, whereasmedium-size companies have a lower propensity to carry out permanent R&D. In particular,there are numerous small firms that carry out continuous R&D in high-tech KIS: in the firstdecile 89.1% of the smallest firms in the sample carried out continuous R&D, whereas themean number of firms with continuous R&D was 39.3% in the high-tech KIS subsample.
Contrary to our expectations, we found that belonging to a group of firms has differenteffects on the probability of carrying out continuous R&D. In high-tech industries, belongingto a group has a positive impact on the R&D intensity, but in other KIS firms it has a positiveeffect on the carrying out of continuous R&D. These results may reflect that the variablepropensity to R&D has a lower informative capacity than the variable R&D intensity inhigh-technology industries. In addition, new firms created during the period 2002–2004 aremore prone to carrying out continuous R&D activities in high-tech manufacturing industries.
Finally, the firm’s market share and exports have a positive effect on the propensity offirms to undertake internal R&D. These results are particularly important in manufactured
Downloaded By: [Consorci de Biblioteques Universitaries de Catalunya] At: 09:31 2 September 2010
Econom
icsofInnovation
andN
ewTechnology
245
Table 4. Determinants of permanent R&D.
High-tech industries Low-tech industries High-tech KIS Other KIS
Propensity Intensity Propensity Intensity Propensity Intensity Propensity Intensityto R&D of R&D to R&D of R&D to R&D of R&D to R&D of R&D
Size −12.591 −106.115 −17.842 −137.223 −36.179 −38.484 −28.820 −105.283(0.076)∗∗∗ (0.148)∗ (0.084)∗∗ (0.228)∗ (0.107)∗ (0.190)∗∗ (0.062)∗ (0.236)∗
Size square 1.545 4.299 1.879 7.473 4.063 −3.165 2.162 2.494(0.008)∗∗∗ (0.014)∗ (0.009)∗∗ (0.024)∗ (0.012)∗ (0.021) (0.005)∗ (0.026)
Group −10.898 20.492 3.545 19.002 −6.067 15.416 13.419 10.526(0.039)∗ (0.094)∗∗ (0.038) (0.119) (0.066) (0.204) (0.047)∗ (0.212)
Public funds 30.230 64.677 42.530 60.857 28.364 77.888 59.322 99.843(0.025)∗ (0.080)∗ (0.033)∗ (0.103)∗ (0.062)∗ (0.177)∗ (0.049)∗ (0.187)∗
New firm 24.053 54.150 −1.575 33.185 7.772 68.848 −1.676 −65.181(0.040)∗ (0.280)∗∗ (0.120) (0.440) (0.077) (0.279)∗ (0.108) (0.456)
Export 20.285 −29.668 15.688 −3.977 13.106 23.206 10.099 −6.087(0.041)∗ (0.109)∗ (0.032)∗ (0.122) (0.051)∗ (0.165) (0.056)∗∗∗ (0.201)
Market share 6.516 39.871 8.654 25.843 2.634 33.734 6.629 22.125(0.022)∗ (0.059)∗ (0.020)∗ (0.070)∗ (0.030) (0.087)∗ (0.019)∗ (0.102)∗∗
Internal information sources 12.967 14.377 43.038 −9.749(0.078)∗∗∗ (0.096) (0.167)∗ (0.193)
Market information sources 1.785 4.326 6.050 61.1421.785 4.326 6.050 61.142
Institutional information sources −0.003 64.311 55.495 −6.260(0.118) (0.182)∗ (0.201)∗ (0.259)
Tacit information sources 9.304 16.789 −0.323 28.992(0.095) (0.128) (0.200) (0.243)
Sectorial dummies Yes Yes Yes Yes Yes Yes Yes YesNumber observations 1130 749 1443 572 277 186 704 189Chi q 243.39 259.51 354.52 180.13 131.39 129.44 250.54 181.71R2 16.85 11.03 18.29 9.32 37.46 19.42 30.59 27.33
Source: Catalan Innovation Survey.Note: All marginal effects on R&D decision variable are in percentage points. Size, size square and market share are expressed in logs; group, public funds, new firm and export aredummy variables; and all regressions include a dummy variable for industry effects (8 in high-tech industries, 13 in low-tech industries, 3 in high-tech KIS and 9 in other KIS).∗Significant at 1%; ∗∗significant at 5%; ∗∗∗significant at 10%; standard errors in parentheses.
Downloaded By: [Consorci de Biblioteques Universitaries de Catalunya] At: 09:31 2 September 2010
246 A. Segarra-Blasco
goods of high technological intensity, given that the elasticities of the market share and theorientation towards the foreign markets are high. Our results show that firm size does nothave a linear effect on R&D, but, in relation to the second Schumpeterian hypothesis, wefind that the market power of firms stimulates R&D activities. These results agree with otherstudies (Blundell, Griffith, and Van Reenen 1999) and indicate that the dominant firms intheir regional markets have a higher incentive to innovate.
These results agree with those obtained for Spanish industrial firms during the period1994–2004 that showed that market product competition promotes productivity growthwhen firms enjoy positive but moderate margins (Segarra and Teruel 2006). Firms withreduced business margins do not have the necessary cash flow to invest in additional high-risk R&D and innovation. These results also agree with those obtained in the extensivetheoretical and empirical literature that has been published in recent years, based on theneo-Schumpeterian models that show greater incentives to innovate when there is a certainlevel of competitive rivalry in the market, while allowing firms to obtain positive profitmargins (see survey in Aghion and Griffith 2005).
When we analyse the marginal effects of explanatory variables on R&D intensity inthe four subsamples of innovating firms, we observe considerable differences between thedeterminants of continuous R&D and the intensity of R&D expenditures. R&D intensityin all subsamples is positively affected by the firm’s market share and the availability ofpublic funds. In addition, new firms that were created during the period 2002–2004 presenthigh levels of R&D expenditures in high-tech industries, in both the manufacturing andservice sectors. New firms increase R&D intensity by 54.1 percentage points in high-techmanufacturing industries and by 68.8 percentage points in high-tech KIS. Internal sources ofinformation from other firms in the group play an important role in high-tech manufacturingindustries and high-tech KIS, and information from public organizations and universitiespositively affects R&D intensity in low-tech manufacturing industries and high-tech KIS.Tacit information channels are not significant.
There are interesting differences between the propensity to engage in continuous R&Dand R&D intensity in different industries. High-tech manufacturing and service industriesare more sensitive to public funds and export activities, and firms that are new or that haveinternal sources of information tend to have greater R&D intensity. The market share oflow-tech manufacturing and service industries increases the propensity to engage in R&D,but its effect on R&D intensity is lower.
5.2. Determining factors of innovative behaviourIn this section we analyse a set of indicators of innovative output. The CIS questionnaireprovides qualitative and quantitative indicators of innovative output. Two of the indicatorsare quantitative and measure the product innovation new to the firm (but not necessarily tothe sector) and the product innovation new to the market. Products new to the firm are theshare in sales of products or services new to the firm but not to the market, and productsnew to the market are the share in sales of products and services new to the market. Theseindicators relate the novelty of the sales to the product innovation of a firm during theperiod 2002–2004. Products new to the firm are already on the market and firms imitateother competitors. Products new to the market are examples of true innovation: that is to say,innovative firms discover new products or services. In markets where product differentiationis the driving force in market competition, the share of new products or services will behigher. Both indicators provide quantitative information about product innovation and thiscan be interpreted as a measure of innovativeness (i.e. shares in sales taken by new products).
Downloaded By: [Consorci de Biblioteques Universitaries de Catalunya] At: 09:31 2 September 2010
Economics of Innovation and New Technology 247
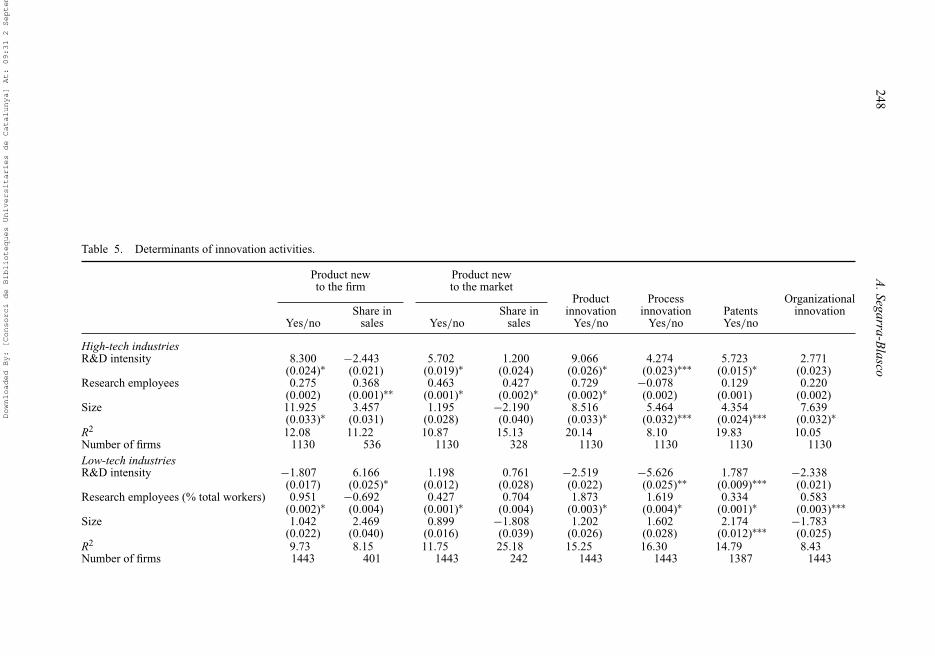
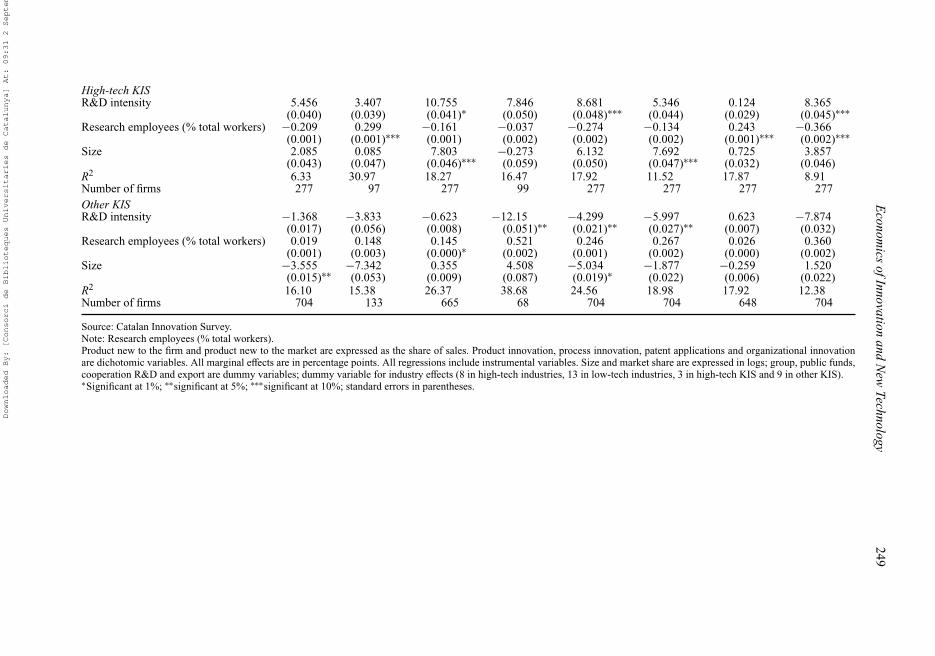
In addition, we use four dichotomous indicators of innovation output: a firm’s product,process and organizational innovation and patent applications. The CIS-4 questionnaire pro-vides interesting information about activities undertaken by a firm to carry out innovationsduring the period 2002–2004. Table 5 presents the results of econometric analysis in termsof the marginal effect on the various innovation indicators. We are especially interested incomparing the marginal effects of R&D intensity (R&D expenditures per employee) andresearch employees (numbers of researchers per total employees) on eight measures ofinnovation output.
In general these results show that the probability that a firm will innovate increases withits size, with a higher R&D input and with contracts being given to research personnel.Product and process innovation correlates positively with firm size, except in other KISactivities, but firm size has little marginal effect on the propensity to materialize innovationoutputs. The probability that a firm will engage in product or process innovation increaseswith R&D intensity and firm size in both manufacturing and service high-tech industries,but not in low-tech industries. Large firms have a greater capacity to undertake permanentinnovations, but the relationship between innovation and firm size is not simple. In oursample, large firms are more prone to engaging in continuous innovation but the numberof innovative small firms is high, particularly among those created during the period 2002–2004.8 Our results differ from those obtained by Lööf and Heshmati (2006) with data fromSwedish manufacturing and service firms in the mid-1990s. They found that the probabilityof innovating increased with firm size in both manufacturing and service industries. How-ever, after controlling for industry and obstacles to innovation investment, they found thatinnovation intensity was not constant and decreased with size.
When we compared the marginal impact of R&D, research workers and size in the fourgroups of industries we found important differences. In particular, the propensity to registerpatents is low in other KIS sectors, and R&D intensity, research workers and size do notsignificantly affect the probability that a firm will do so. Traditionally, service sector firmshave developed new products and processes in the absence of legal protection mechanisms(Encaoua, Guellec, and Martínez 2006). However, innovative firms in high-tech KIS havestarted to patent extensively in Catalonia in recent decades. In 2004, 21.66% high-tech KISfirms have some patents.
In general terms, the marginal effects of the explanatory variables on the different indi-cators of innovation output are quite different in different sectorial groups. The differencesbetween high- and low-tech industries, in both the manufacturing and service sectors, areparticularly important. Therefore, high-tech industries are not a good mirror for low-techmanufacturing industries or other KIS in relation to determinants of output innovation.
Our results indicate that in high-tech manufacturing industries internal R&D peremployee, research employees and size increase the probability of innovation. The pos-itive effect of firm size shows the presence of important economies of scale in innovationactivities due to the sunk cost linked to R&D or the capacity of the firm to finance andachieve a return on their innovations (Cohen and Klepper 1996). In product and processinnovations, the elasticity of internal R&D activities, researchers/employees and size ishigh. In high-tech industries if the R&D intensity increases by 100% the probability ofintroducing product innovation increases by 9.0%, the probability of introducing a newprocess increases by 4.2% and the probability of applying for a patent increases by 5.7%.These results are in line with the similar marginal effects obtained for other European coun-tries (Mairesse and Mohnen 2005). The probability of making new products is sensitive toR&D intensity. If R&D intensity increases by 100%, the probability of obtaining productsnew to the firm increases by 8.3% and the probability of developing products new to the
Downloaded By: [Consorci de Biblioteques Universitaries de Catalunya] At: 09:31 2 September 2010
248A
.Segarra-Blasco
Table 5. Determinants of innovation activities.
Product new Product newto the firm to the market
Product Process OrganizationalShare in Share in innovation innovation Patents innovation
Yes/no sales Yes/no sales Yes/no Yes/no Yes/no
High-tech industriesR&D intensity 8.300 −2.443 5.702 1.200 9.066 4.274 5.723 2.771
(0.024)∗ (0.021) (0.019)∗ (0.024) (0.026)∗ (0.023)∗∗∗ (0.015)∗ (0.023)Research employees 0.275 0.368 0.463 0.427 0.729 −0.078 0.129 0.220
(0.002) (0.001)∗∗ (0.001)∗ (0.002)∗ (0.002)∗ (0.002) (0.001) (0.002)Size 11.925 3.457 1.195 −2.190 8.516 5.464 4.354 7.639
(0.033)∗ (0.031) (0.028) (0.040) (0.033)∗ (0.032)∗∗∗ (0.024)∗∗∗ (0.032)∗R2 12.08 11.22 10.87 15.13 20.14 8.10 19.83 10.05Number of firms 1130 536 1130 328 1130 1130 1130 1130Low-tech industriesR&D intensity −1.807 6.166 1.198 0.761 −2.519 −5.626 1.787 −2.338
(0.017) (0.025)∗ (0.012) (0.028) (0.022) (0.025)∗∗ (0.009)∗∗∗ (0.021)Research employees (% total workers) 0.951 −0.692 0.427 0.704 1.873 1.619 0.334 0.583
(0.002)∗ (0.004) (0.001)∗ (0.004) (0.003)∗ (0.004)∗ (0.001)∗ (0.003)∗∗∗Size 1.042 2.469 0.899 −1.808 1.202 1.602 2.174 −1.783
(0.022) (0.040) (0.016) (0.039) (0.026) (0.028) (0.012)∗∗∗ (0.025)R2 9.73 8.15 11.75 25.18 15.25 16.30 14.79 8.43Number of firms 1443 401 1443 242 1443 1443 1387 1443
Downloaded By: [Consorci de Biblioteques Universitaries de Catalunya] At: 09:31 2 September 2010
Econom
icsofInnovation
andN
ewTechnology
249
High-tech KISR&D intensity 5.456 3.407 10.755 7.846 8.681 5.346 0.124 8.365
(0.040) (0.039) (0.041)∗ (0.050) (0.048)∗∗∗ (0.044) (0.029) (0.045)∗∗∗Research employees (% total workers) −0.209 0.299 −0.161 −0.037 −0.274 −0.134 0.243 −0.366
(0.001) (0.001)∗∗∗ (0.001) (0.002) (0.002) (0.002) (0.001)∗∗∗ (0.002)∗∗∗Size 2.085 0.085 7.803 −0.273 6.132 7.692 0.725 3.857
(0.043) (0.047) (0.046)∗∗∗ (0.059) (0.050) (0.047)∗∗∗ (0.032) (0.046)R2 6.33 30.97 18.27 16.47 17.92 11.52 17.87 8.91Number of firms 277 97 277 99 277 277 277 277Other KISR&D intensity −1.368 −3.833 −0.623 −12.15 −4.299 −5.997 0.623 −7.874
(0.017) (0.056) (0.008) (0.051)∗∗ (0.021)∗∗ (0.027)∗∗ (0.007) (0.032)Research employees (% total workers) 0.019 0.148 0.145 0.521 0.246 0.267 0.026 0.360
(0.001) (0.003) (0.000)∗ (0.002) (0.001) (0.002) (0.000) (0.002)Size −3.555 −7.342 0.355 4.508 −5.034 −1.877 −0.259 1.520
(0.015)∗∗ (0.053) (0.009) (0.087) (0.019)∗ (0.022) (0.006) (0.022)R2 16.10 15.38 26.37 38.68 24.56 18.98 17.92 12.38Number of firms 704 133 665 68 704 704 648 704
Source: Catalan Innovation Survey.Note: Research employees (% total workers).Product new to the firm and product new to the market are expressed as the share of sales. Product innovation, process innovation, patent applications and organizational innovationare dichotomic variables. All marginal effects are in percentage points. All regressions include instrumental variables. Size and market share are expressed in logs; group, public funds,cooperation R&D and export are dummy variables; dummy variable for industry effects (8 in high-tech industries, 13 in low-tech industries, 3 in high-tech KIS and 9 in other KIS).∗Significant at 1%; ∗∗significant at 5%; ∗∗∗significant at 10%; standard errors in parentheses.
Downloaded By: [Consorci de Biblioteques Universitaries de Catalunya] At: 09:31 2 September 2010
250 A. Segarra-Blasco
market increases by 5.7%. However, R&D intensity does not have a significant effect onthe share in sales of new products.
In low-tech industries, the effect of R&D intensity, research personnel and firm size oninnovation is more ambiguous. The marginal effect of R&D intensity on the share of newproducts on the market and patent applications is small and positive, but the presence ofresearchers on a firm’s staff has a positive marginal effect on all dichotomous measuresof output innovation. When the number of researchers per total employees in the firmincreases by 100%, the propensity to carry out product innovation increases by 1.8% andthe propensity to carry out process innovation increases by 1.6%.
In high-tech KIS the effect of R&D intensity on innovation in general is strong. Themarginal effect of R&D intensity is high on the share of new products, product innovationand organizational innovation. In contrast, in other KIS the effect of R&D intensity, the ratioof researchers to total employees and firm size are not relevant, and often present negativeparameters.
5.3. Productivity and innovation effects at the firm levelThe relationship between R&D, innovation and productivity has been widely examinedin the last two decades. Many studies have found a significant link between innovationand productivity (Griliches and Mairesse 1998), but other studies have failed to do so. Ingeneral, empirical studies based on cross-section data are more likely to find a significantlink between innovation and productivity (Crépon, Duguet, and Mairesse 1998).
Therefore, having analysed how the individual characteristics and conditions of themarket in which firms operate affect R&D and innovation, this section explores how differentindicators of innovation affect a firm’s productivity. R&D and innovation activities increaseproductivity in different ways. First, they generate new knowledge and bring new productsto the firm and the market. In this respect, physical technologies play a leading role inthe process of economic growth, but social institutions are required to reduce transactioncosts, promote financial support, protect property rights and define the rules of the game(Nelson and Nelson 2002). Secondly, intramural R&D plays the dual role of producingnew knowledge and promoting a firm’s ‘absorptive capacity’ from external sources ofinformation (Cohen and Levinthal 1990). This means that R&D can affect productivity byfacilitating the absorption of new technologies (Parisi, Schiantarelli, and Sembenelli 2006).Finally, R&D directly affects a firm’s knowledge capital and spillovers on productivity(Jaffe 1986; Griliches 1992), increases profitability (Geroski, Machin, and Van Reenen1993; Hanel and St-Pierre 2002; Cefis and Ciccarelli 2005) and has a positive effect on theprobability of survival (Cefis and Marsili 2006). Innovating strategies increases a firm’sturnover growth (Morone and Testa 2008) and are crucial for the fastest growing firms(Coad and Rao 2008).
Our estimation approach has some potential problems. Given the limitations of ourdatabase in the empirical estimation, we cannot include lagged innovation measures in ourequation assuming that innovation affects productivity in the same period. However, the tim-ing of the relationship between innovation and productivity is not clear (Hall and Mairesse1995). When lagged innovation indicators have been included, they tend to reduce theexplanatory power of other variables due to the widely observed persistence of innovationactivities (Hall, Griliches, and Hausman 1986). Therefore, this restriction has a moderateeffect on the results because as Scherer (1982) pointed out, R&D intensity in manufacturingfirms is relatively stable over time so the timing of the variable seems to have little effect inpractice. In addition, the persistence of R&D and innovation activities versus time is strong
Downloaded By: [Consorci de Biblioteques Universitaries de Catalunya] At: 09:31 2 September 2010
Economics of Innovation and New Technology 251
across firms (Cefis and Orsenigo 2001; Roper and Hewitt-Dundas 2008) and the distributionof the returns of innovating firms is also extremely stable (Marsili and Salter 2005).
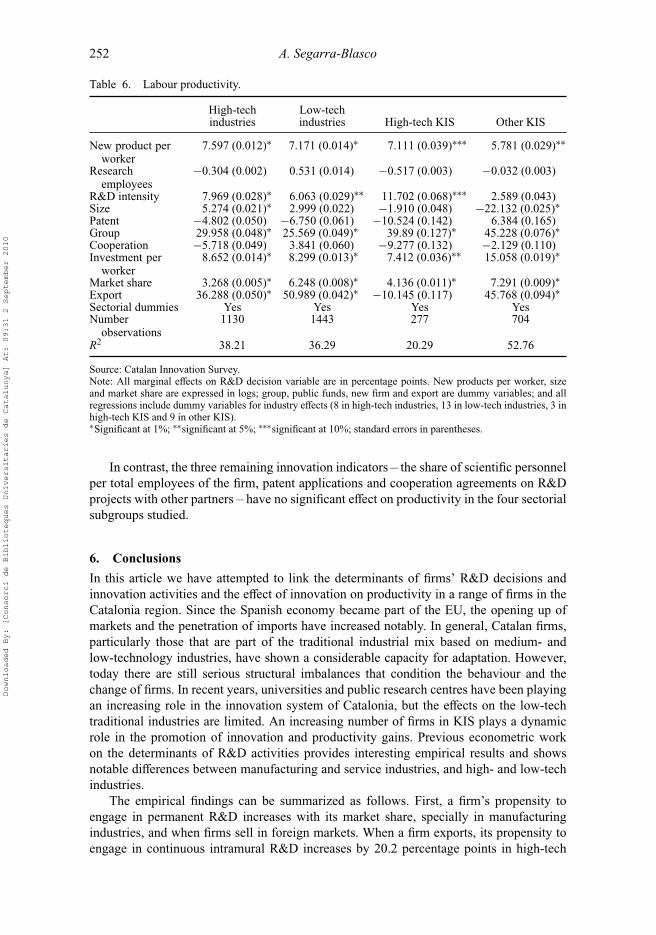
Using expression (6) we can directly derive the empirical model that will serve as a basison which to study the effect of innovation indicators on firm productivity. As determinants ofa firm’s productivity level we introduce five variables related to output and input innovation:the percentage of new products and services in each worker’s sales; the number of scientificpersonnel per total employees; R&D intensity measured as internal R&D investment perworker; a dummy that indicates whether the firm has registered any patents and a dummy thatindicates if the firm has any cooperation agreements with other partners.9 All regressionsinclude a set of control variables related to the individual characteristics of the firms: thefirm size, measured as the number of workers; a dummy that indicates if the firm belongsto a group; the investment in physical capital per worker; the firm’s market share; a dummythat indicates if the firm exports and a set of sectorial dummies.
Unlike Crépon, Duguet and Mairesse (1998), we considered all firms in our estimation.But before analysing econometric results, the problems of measuring the elasticity of labourproductivity with respect to innovation indicators in both manufacturing and services needto be taken into account. Our database provided only a weak measure of production: totalsales per total workers of the firm. These considerations are particularly important in theservice sector. Indeed, the problems of measuring the elasticity of productivity with respectto innovation indicators in the service sector are a difficult task. For some authors qualityimprovements in service production are sometimes almost impossible to measure (Aghionand Howitt 1998), and for others it is harder to achieve productivity improvements inservices than in manufacturing industries (Lööf 2004). In this respect, the introduction ofan innovation is always the result of blending and recombining elements of technologicalknowledge both as assets and embodied in capital goods, external knowledge, organizationalprocedures and routines introduced elsewhere (Antonelli 2006).
The results obtained in the four sectorial groups considered indicate that size has apositive effect on productivity in manufacturing industries but not in services. Investmentin physical capital, market share, export activities and membership of a group appears tobe significantly associated with labour productivity. Investment in physical capital (moreaccurately, investment per employee) has a positive effect on productivity.10 As far asmarket characteristics are concerned, those firms that have a larger market share and a largerpercentage of new products or services also reach higher levels of productivity. When weincorporate a dummy related to a firm’s exporting activities we find a close relationshipbetween export activities and a firm’s productivity, particularly in the low-tech sectors ofboth manufacturing and service industries. In line with other studies (Baily and Solow2001), we find empirical evidence that international competition has a disciplinary effect onthe company, making it reach higher productivity levels, especially in the mature industrialsectors in Catalonia that have suffered considerable external pressure in recent years.
As we expected, all columns in Table 6 show that R&D intensity increases labourproductivity.11 It increased productivity by 7.9 percentage points in high-tech manufac-turing industries, by 6.0 percentage points in low-tech manufacturing industries, by 11.7percentage points in high-tech KIS and by only 2.5 percentage points in other KIS. Theseresults are in line with those of other studies (Crépon, Duguet, and Mairesse 1998; Kafouros2005), and highlight how R&D intensity increases labour productivity, particularly in high-tech service and manufacturing industries.12 When we measured output innovation as ashare of sales we found that this factor positively affects labour productivity. The elasticityof the share of new products and services of total sales is about 7 percentage points, exceptin other KIS, which have a more moderate elasticity of about 5.7%.
Downloaded By: [Consorci de Biblioteques Universitaries de Catalunya] At: 09:31 2 September 2010
252 A. Segarra-Blasco
Table 6. Labour productivity.
High-tech Low-techindustries industries High-tech KIS Other KIS
New product perworker
7.597 (0.012)∗ 7.171 (0.014)∗ 7.111 (0.039)∗∗∗ 5.781 (0.029)∗∗
Researchemployees
−0.304 (0.002) 0.531 (0.014) −0.517 (0.003) −0.032 (0.003)
R&D intensity 7.969 (0.028)∗ 6.063 (0.029)∗∗ 11.702 (0.068)∗∗∗ 2.589 (0.043)Size 5.274 (0.021)∗ 2.999 (0.022) −1.910 (0.048) −22.132 (0.025)∗Patent −4.802 (0.050) −6.750 (0.061) −10.524 (0.142) 6.384 (0.165)Group 29.958 (0.048)∗ 25.569 (0.049)∗ 39.89 (0.127)∗ 45.228 (0.076)∗Cooperation −5.718 (0.049) 3.841 (0.060) −9.277 (0.132) −2.129 (0.110)Investment per
worker8.652 (0.014)∗ 8.299 (0.013)∗ 7.412 (0.036)∗∗ 15.058 (0.019)∗
Market share 3.268 (0.005)∗ 6.248 (0.008)∗ 4.136 (0.011)∗ 7.291 (0.009)∗Export 36.288 (0.050)∗ 50.989 (0.042)∗ −10.145 (0.117) 45.768 (0.094)∗Sectorial dummies Yes Yes Yes YesNumber
observations1130 1443 277 704
R2 38.21 36.29 20.29 52.76
Source: Catalan Innovation Survey.Note: All marginal effects on R&D decision variable are in percentage points. New products per worker, sizeand market share are expressed in logs; group, public funds, new firm and export are dummy variables; and allregressions include dummy variables for industry effects (8 in high-tech industries, 13 in low-tech industries, 3 inhigh-tech KIS and 9 in other KIS).∗Significant at 1%; ∗∗significant at 5%; ∗∗∗significant at 10%; standard errors in parentheses.
In contrast, the three remaining innovation indicators – the share of scientific personnelper total employees of the firm, patent applications and cooperation agreements on R&Dprojects with other partners – have no significant effect on productivity in the four sectorialsubgroups studied.
6. ConclusionsIn this article we have attempted to link the determinants of firms’ R&D decisions andinnovation activities and the effect of innovation on productivity in a range of firms in theCatalonia region. Since the Spanish economy became part of the EU, the opening up ofmarkets and the penetration of imports have increased notably. In general, Catalan firms,particularly those that are part of the traditional industrial mix based on medium- andlow-technology industries, have shown a considerable capacity for adaptation. However,today there are still serious structural imbalances that condition the behaviour and thechange of firms. In recent years, universities and public research centres have been playingan increasing role in the innovation system of Catalonia, but the effects on the low-techtraditional industries are limited. An increasing number of firms in KIS plays a dynamicrole in the promotion of innovation and productivity gains. Previous econometric workon the determinants of R&D activities provides interesting empirical results and showsnotable differences between manufacturing and service industries, and high- and low-techindustries.
The empirical findings can be summarized as follows. First, a firm’s propensity toengage in permanent R&D increases with its market share, specially in manufacturingindustries, and when firms sell in foreign markets. When a firm exports, its propensity toengage in continuous intramural R&D increases by 20.2 percentage points in high-tech
Downloaded By: [Consorci de Biblioteques Universitaries de Catalunya] At: 09:31 2 September 2010
Economics of Innovation and New Technology 253
manufacturing industries, by 15.6 percentage points in low-tech manufacturing industries,by 13.1 percentage points in high-tech KIS and by 10.0 percentage points in other KIS.Secondly, the link between R&D decision and firm size describes a U-shape relation. Smalland large firms have a greater propensity to undertake continuous R&D than medium-sizefirms. This relation is more pronounced in high-tech KIS where numerous small firmsundertake continuous R&D. In terms of R&D firm decisions and R&D intensity our resultsdo not show a linear link between firm size and R&D. However, in accordance with theSchumpeterian hypothesis, we find that market power encourages firms to undertake R&Dand innovation activities.
R&D intensity in all sectorial categories is also directly affected by the availability ofpublic funds and firm market share, but the export orientation of the firm only positivelyaffects R&D investment in service industries. In addition, new firms created during theperiod 2002–2004 present high levels of R&D expenditures in high-tech manufacturing andservice industries. Firms less than 3 years old increase R&D intensity to 54.1 percentagepoints in high-tech manufacturing industries and to 68.8 percentage points in high-techKIS. High-tech manufacturing industries and high-tech KIS are more sensitive to marketshare, public funds and export activities. In low-tech industries and services the marketshare increases the propensity to engage in R&D, but the export activity of a firm and thepresence of new firms have no direct effect on firm R&D intensity.
When we applied a probit model to analyse the determinants of output innovation themain results were the following: the probability that a firm will innovate increases with itssize, with higher R&D inputs and with the contracting of research personnel. The probabilityof product or process innovation increases with R&D intensity and firm size in high-techmanufacturing and service industries, but its effect is much more moderate in low-techindustries. Large firms are more prone to engage in continuous innovation but the numberof innovative firms is high among small and young firms.
When we analysed the link between innovation and productivity, we found that labourproductivity was directly affected by R&D intensity, output innovation proxied by the shareof new products or services in sales, belonging to a group, investment in physical capital andfirm market share on labour productivity. R&D intensity presents positive marginal elasticityon labour productivity in all estimations: 7.9% in high-tech manufacturing industries, 6.0%in low-tech manufacturing industries, 11.7% in high-tech KIS and only 2.5% in other KIS.However, firm size has a positive effect on productivity in manufacturing industries but notin services. In addition, when firms export their productivity level increases, particularly inlow-tech manufacturing and service industries.
Catalonia is a good place for analysing the differences and similarities between manufac-turing and service industries. There is a high presence of innovative service firms, especiallyin high-tech KIS. Young and small firms in the KIS sector are very prone to carrying outR&D, they invest heavily in innovation and they are often involved in a wide variety ofinnovations (product, process, organizational and market). It is clear that if appropriatepolicies for promoting innovation are to be designed, the determinants of R&D activitiesand output innovation need to be understood. What is more, when studying the link betweenfirm productivity level and innovation sources we have found some important differencesin the behaviour of manufacturing and service firms.
Today the borders separating manufacturing and service industries are increasinglyfuzzy. The traditional industrial classification that distinguishes between goods and servicesis no longer applicable in the current knowledge economy, in which KIS are importantdriving forces that promote innovation, drive economic growth and enhance internationalcompetitiveness.
Downloaded By: [Consorci de Biblioteques Universitaries de Catalunya] At: 09:31 2 September 2010
254 A. Segarra-Blasco
AcknowledgementsThe database used in this paper was provided by the Catalan Statistics Institute (IDESCAT). The authoracknowledges useful comments and suggestions from Mercedes Teruel, two anonymous referees andthe managing editor. Veronica Gombau provided excellent research assistance. The usual disclaimersapply.
Notes1. Despite this, it is not easy to analyse the nature of the innovation process in services given the
characteristics of the information data. The fact that the Oslo manual and CIS questionnairepresent a clear dichotomous distinction between (technological) product and process innova-tion limits the possibilities of properly studying the differences in the pattern of innovation inmanufacturing and service firms.
2. Empirical studies show that innovation rates are greater in those regions with high concentrationsof KIS (Camacho and Rodríguez 2005b).
3. Strambach (2001) argued that KIS, in particular high-tech KIS, have a direct effect on the devel-opment of KIS’s own innovations and an indirect effect in four different ways: knowledge transferin the form of specialized technological knowledge or know-how management, integration of thedifferent stocks of knowledge and competences, adaptation of existing knowledge to the specificneeds of clients and production of new knowledge. KIS produce and spread knowledge, whichis crucial for innovation processes.
4. There are four editions of the CIS: CIS-1 covering the period 1990–1992, CIS-2 covering theperiod 1994–1996, CIS-3 covering the period 1998–2000 and CIS-4 covering the period 2002–2004.
5. According to CIS empirical literature a firm is considered to be innovative when it carries outinnovation products or innovation processes and permanent R&D activities. A firm is consideredto undertake permanent R&D when it responds in the affirmative to the following question in thesurvey: Does your company undertake continuous R&D?.
6. In general, the propensity to patent may differ widely by sectors (Brouwer and Kleinknecht1999).
7. For a sample of 2954 Catalan firms in manufacturing and service industries Segarra, Garcia andTeruel (2008) found that innovative firms have higher barriers to innovation than non-innovativefirms, especially in the cost and knowledge fields. In addition, small firms have higher barriersto innovation than their counterparts, especially in two items related to cost; lack of internalfunds and high cost of innovation. At the industrial group level, high-tech manufacturing showsa higher global index of barriers to innovation, especially in the items related to cost factors, thanlow-tech manufacturing and KIS.
8. Cefis and Orsenigo (2001) observe with panel data on patent applications to the European PatentOffice in the period 1978–1993 that some large firms were persistently analysed as non-innovators,whereas small firms were persistent innovators.
9. For Spanish firms Segarra and Arauzo (2008) found that R&D cooperation performance betweenfirms and partners differs a lot between manufacturing and service industries and between low-and high-tech industries.
10. As we did, in a sample of Spanish manufacturing firms, Huergo and Jaumandreu (2004) foundthat the innovation process at some point leads to extra productivity growth, which persists butdecreases over time.
11. Extensive empirical literature has found that a firm’s decisions on R&D and physical investmentare affected by financing constraints. For a panel of German firms, Harhoff (2000) found evidencethat larger firms have no financing constraints on physical investment but that small firms do. Hefound no empirical evidence of financing constraints on R&D investments. On the other hand,some research provides empirical evidence that R&D expenditures and physical investment arehighly sensitive to cash flow and that R&D activities are affected by financial constraints (Hall1992).
12. The sensitivity of labour productivity to R&D investment is moderate in developing economiesthat are still a long way from the technological frontier. For example, in a range of Chilean firms,Benavente (2006) found that R&D does not contribute to productivity.
Downloaded By: [Consorci de Biblioteques Universitaries de Catalunya] At: 09:31 2 September 2010
Economics of Innovation and New Technology 255
ReferencesAcs, Z.J., and D.B. Audretsch. 1988. Innovation in large and small firms: An empirical analysis. The
American Economic Review 78, no. 4: 678–90.Acs, Z.J., D.B. Audretsch, and M.P. Feldman. 1994. R&D spillovers and recipient firm size. Review
of Economics and Statistics 76: 336–40.Aghion, P., and R. Griffith. 2005. Competition and growth. Boston: MIT Press.Aghion, P., and P. Howitt. 1998. Endogenous growth theory. Cambridge, MA: MIT Press.Antonelli, G. 2006. Diffusion as a process of creative adoption. Journal of Technology Transfer 31:
211–26.Arvanitis, S. 2008. Explaining innovative activity in service industries: Micro data evidence for
Switzerland. Economics of Innovation and New Technology 17, no. 3: 209–25.Audretsch, D.B., and Z.J. Acs. 1991. Innovation and size at the firm level. Southern Economic Journal
57, no. 3: 739–44.Audretsch, D.B., and M.P. Feldman. 1996. Knowledge spillovers and the geography of innovation
and production. American Economic Review 86: 630–40.Audretsch, D.B., and M. Vivarelli. 1996. Firm size and R&D spillovers: Evidence from Italy. Small
Business Economics 8, no. 3: 249–58.Baily, M., and R. Solow. 2001. International productivity comparisons built from the firm level.
Journal of Economic Perspectives 15, no. 3: 151–72.Barras, R. 1986. Towards a theory of innovation in services. Research Policy 15: 161–73.Baumol, W.J. 1967. Macroeconomics of unbalanced growth: The anatomy of urban crisis. American
Economic Review 57: 415–26.Benavente, J.M. 2006. The role of research and innovation in promoting productivity in Chile.
Economics of Innovation and New Technology 15, nos. 4–5: 301–15.Blundell, R., R. Griffith, and J. Van Reenen. 1999. Market share, market value and innovation in a
panel of British manufacturing firms. Review of Economic Studies 66: 529–54.Brouwer, E., and A. Kleinknecht. 1999. Innovative output, and a firm’s propensity to patent. An
exploration of CIS micro data. Research Policy 28: 615–24.Cainelli, G., R. Evangelista, and M. Savona. 2006. Innovation and economic performance in services:
A firm-level analysis. Cambridge Journal of Economics 30, no. 3: 435–58.Camacho, J.A., and M. Rodríguez. 2005a. How innovative are services? An empirical analysis for
Spain. The Service Industries Journal 25, no. 2: 253–71.Camacho, J.A., and M. Rodríguez. 2005b. Servicios intensivos en conocimiento e innovación regional.
Un análisis para las regiones europeas. Investigaciones Regionales 7: 91–111.Cefis, E., and M. Ciccarelli. 2005. Profit differentials and innovation. Economics of Innovation and
New Technology 14, nos. 1–2: 43–61.Cefis, E., and O. Marsili. 2006. Survivor: The role of innovation in firms’ survival. Research Policy
35: 626–41.Cefis, E., and L. Orsenigo. 2001. The persistence of innovative activities. A cross-countries and
cross-sectors comparative analysis. Research Policy 30: 1139–58.Ciccone, A., and R. Hall. 1996. Productivity and the density of economic activity. American Economic
Review 86, no. 1: 54–70.Clark, C. 1940. The conditions of economic progress. London: MacMillan &Co.Coad, A., and R. Rao. 2008. Innovation and firm growth in high-tech sectors: A quantile regression
approach. Research Policy 37: 633–48.Cohen, W.M., and S. Klepper. 1996. A reprise of size and R&D. Economic Journal 106:
925–57.Cohen, W.M., and D.A. Levinthal. 1989. Innovation and learning: The two faces of R&D. Economic
Journal 99: 569–96.Cohen, W.M., and D.A. Levinthal. 1990. Absorptive-capacity – A new perspective on learning and
innovation. Administrative Science Quarterly 35, no. 1: 128–52.Crépon, B., E. Duguet, and J. Mairesse. 1998. Research, innovation and productivity: An econometric
analysis at the firm level. Economics of Innovation and New Technology 7: 115–58.Encaoua, D., D. Guellec, and C. Martínez. 2006. Patent systems for encouraging innovation: Lessons
from economic analysis. Research Policy 35: 1423–40.Evangelista, R. 2000. Sectorial patterns of technological change in services. Economics of Innovation
and New Technology 9: 183–221.
Downloaded By: [Consorci de Biblioteques Universitaries de Catalunya] At: 09:31 2 September 2010
256 A. Segarra-Blasco
Fuchs, V.R. 1968. The service economy. New York: Columbia University Press.Geroski, P., S. Machin, and J. Van Reenen. 1993. The profitability of innovating firms. RAND Journal
of Economics 24, no. 2: 198–211.Greene, W.H. 2003. Econometric analysis. 5th ed. Upper Saddle River, NJ: Prentice Hall.Griffith, R., E. Huergo, J. Mairesse, and P. Bettina. 2006. Innovation and productivity across four
European countries. Oxford Review of Economic Policy 22, no. 4: 483–98.Griliches, Z. 1992. The search for R&D spillovers. Scandinavian Journal of Economics 94: 29–47.Griliches, Z. 1995. R&D and productivity: Econometric results and measurement issues. In Handbook
of the economics of innovation and technological change, ed. P. Stoneman, 52–89. Oxford:Blackwell.
Griliches, Z., and J. Mairesse. 1998. Production functions: The search for identification. In Econo-metrics and economic theory in the 20th century: The Ragnar Frisch Centennial Symposium, ed.S. Ström, 169–203. Cambridge: Cambridge University Press.
Hall, B.H. 1992. Investment and research and development at the firm level: Does the source offinancing matter. NBER Discussion Paper N. 4096, NBER, Cambridge, MA.
Hall, B.H., Z. Griliches, and J.A. Hausman. 1986. Patents and R&D, is there a lag? InternationalEconomic Review 27: 265–83.
Hall, B.H., and J. Mairesse. 1995. Exploring the relationship between R&D and productivity in Frenchmanufacturing firms. Journal of Econometrics 65: 263–93.
Hall, B.H., and J. Mairesse. 2006. Empirical studies of innovation in the knowledge-driven economy.Economics of Innovation and New Technology 15, nos. 4–5: 289–99.
Hanel, P., and A. St-Pierre. 2002. Effects of R&D spillovers on the profitability of firms. Review ofIndustrial Organization 20: 305–22.
Harhoff, D. 2000. Are there financing constraints for R&D and investment in German manufactur-ing firms? In The economics and econometrics of innovation, eds. D. Encaoua, H.H. Bronwyn,F. Laisney, and J. Mairesee, 399–434. Boston: Kluwer Academic Publishers.
Hempell, T. 2005. Does experience matter? Innovations and the productivity of information andcommunication technologies in German services. Economics of Innovation and New Technology14, no. 4: 277–303.
Howells, J., and B. Tether. 2004. Innovation in services: Issues at stake and trends. Final Report,Commission of the European Communities, Brussels.
Huergo, E., and J. Jaumandreu. 2004. Firms’ age, process innovation and productivity growth. Journalof Industrial Organization 22: 541–59.
Jaffe, A.B. 1986. Technological opportunity and spillovers of R&D: Evidence from firms’ patents,profits and market value. American Economic Review 76: 984–1001.
Jaffe, A., M. Trajtenberg, and R. Henderson. 1993. Geographic localization of knowledge spilloversas evidenced by patent citations. Quarterly Journal of Economia 108, no. 3: 577–98.
Kafouros, M.I. 2005. R&D and productivity growth: Evidence from the UK. Economics of Innovationand New Technology 14, no. 6: 479–97.
Kremp, E., J. Mairesse, and P. Mohnen. 2004. R&D, innovation and productivity: A new look, mimeo.Leydesdorff, L., W. Dolfsma, and G. Panne. 2006. Measuring the knowledge base of an economy in
germs of triple-helix relations among ‘technology, organization, and territory’. Research Policy35: 181–99.
Lööf, H. 2004. A comparative perspective on innovation and productivity in manufacturing andservices. In Entrepreneurship, the new economy and public policy: Schumpeterian perspectives,eds. U. Cantner, E. Dinopoulos, and R.F. Lanzillotti, 181–202. Berlin: Springer.
Lööf, H., and A. Heshmati. 2006. On the relationship between innovation and performance: Asensitivity analysis. Economics of Innovation and New Technology 15, nos. 4–5: 317–44.
Mairesse, J., and P. Mhonen. 2004. The importance of R&D for innovation: A reassessment usingFrench survey data. The Journal of Technology Transfer 30, nos. 1–2: 183–97.
Mairesse, J., and P. Mhonen. 2005. The importance of R&D for innovation: A reassessment usingFrench survey data. The Journal of Technology Transfer 30, nos. 2: 183–97.
Marsili, O., and A. Salter. 2005. ‘Inequality’ of innovation: Skewed distributions and the returnsto innovation in Dutch manufacturing. Economics of Innovation and New Technology 14,nos. (1–2)b: 83–102.
Metcalfe, S. and I. Miles. 2000. Innovation systems in the service economy. Measurement and casestudy analysis. Boston: Kluwer.
Miles, I. 2005. Innovation in services. In The Oxford handbook of innovation, eds. J. Fagerberg,D. Mowery, and R. Nelson, 433–58. Oxford: University Press.
Downloaded By: [Consorci de Biblioteques Universitaries de Catalunya] At: 09:31 2 September 2010
Economics of Innovation and New Technology 257
Mohnen, P., J. Mairesse, and M. Dagenais. 2006. Innovativity: A comparison across seven Europeancountries. Economics of Innovation and New Technology 15, nos. 4–5: 391–413.
Morone, P., and G. Testa. 2008. Firms growth, size and innovation and investigation into the Italianmanufacturing sector. Economics of Innovation and New Technology 17, no. 4: 311–29.
Muller, E., and A. Zenker. 2001. Business services as actors of knowledge transformation: The roleof KIBS in regional and national innovation systems. Research Policy 30, no. 9: 1501–516.
Nelson, R.R., and K. Nelson. 2002. Technology, institutions, and innovation systems. Research Policy31, no. 2: 265–72.
OECD. 1992, 1996, 2005. Oslo manual. 1st, 2nd and 3rd ed. Paris: OECD.Oulton, N. 2001. Must the growth rate decline? Baumol’s unbalanced growth revisited. Oxford
Economic Papers 53: 605–27.Parisi, M.L., F. Schiantarelli, and A. Sembenelli. 2006. Productivity, innovation and R&D: Micro
evidence for Italy. European Economic Review 50: 2037–61.Peters, B. 2009. Persistence of innovation: Stylised facts and panel data evidence. Journal of
Technology Transfer 34, no. 2: 226–43.Pianta, M., and A. Vaona. 2007. Innovation and productivity in European industries. Economics of
Innovation and New Technology 16, no. 7: 485–99.Roper, S., and N. Hewitt-Dundas. 2008. Innovation persistence: Survey and case-study evidence.
Research Policy 37: 149–62.Scherer, F.M. 1982. Inter-industry technology flows and productivity growth. Review of Economics
and Statistics 64: 627–34.Schettkat, R., and L. Yocarini. 2003. The shift to services: A review of the literature. Structural
Change and Economic Dynamics 17, no. 2: 127–47.Segarra, A., and J.M. Arauzo. 2008. Sources of innovation and industry–university interaction:
Evidence from Spanish firms. Research Policy 37: 1283–95.Segarra, A., J. Garcia, and M. Teruel. 2008. Barriers to innovation and public policy in Catalonia.
International Entrepreneurship and Management Journal 4, no. 4: 431–51.Segarra, A., and Teruel, M. 2006. Productivity growth and competition in Spanish manufacturing
firms: What has happened in recent years? Working paper, 2006-09 Reference Network forResearch in Applied Economics, Barcelona.
Smith, K. 2005. Measuring innovation. In The Oxford handbook of innovation, eds. J. Fagerberg,D. Mowery, and R. Nelson, 148–77. Oxford: University Press.
Strambach, S. 2001. Innovation process and the role of knowledge-intensive business services. InInnovation networks—concepts and challenges in the European perspective, eds. K. Koschatzky,M. Kulicke, and A. y Zenker, 53–68. Berlin: Springer.
Tether, B. 2003. The sources and aims of innovation in services: Variety between and within sectors.Economics of Innovation and New Technology 12, no. 6: 481–505.
Tether, B.S. 2005. Do services innovate (differently)? Insights from the European innobarometersurvey. Industry and Innovation 12, no. 2: 153–84.
Wolff, E. 1999. The productivity paradox: Evidence from indirect indicators of service sectorproductivity growth. Canadian Journal of Economics 32, no. 2: 281–308.
Wood, P. 2002. Knowledge-intensive services and urban innovativeness. Urban Studies 39, nos. 5–6:993–1002.
AppendixDefinition of variablesPermanent R&D firm: Dummy variable, which takes the value 1 if the firm reports continuous R&Dengagement in intramural R&D activities during the period 2002–2004.
R&D intensity: R&D expenditure in 2004, per employee (in log).
Innovative firm: Dummy variable, which takes the value 1 if the firm reports product or processinnovation and continuous R&D engagement in intramural R&D activities during the period 2002–2004.
Innovation intensity: Innovation expenditure in 2004, per employee (in log).
Process innovation: Dummy variable, which takes the value 1 if the firm reports having introducednew or significantly improved production processes during 2002–2004.
Downloaded By: [Consorci de Biblioteques Universitaries de Catalunya] At: 09:31 2 September 2010
258 A. Segarra-Blasco
Product innovation: Dummy variable, which takes the value 1 if the firm reports having introducednew or significantly improved products during 2002–2004 (new to the market or only new to thefirm).
Organizational innovation: Dummy variable, which takes the value 1 if the firm reports havingintroduced new or significantly amended forms of organization, business structures or practices,aimed at step changes in internal efficiency during 2002–2004.
New firm: Dummy variable that takes the value 1 if the firm was created during the three-year period2002–2004.
Products new to the firm: Dummy variable, which takes the value 1 if the firm introduced productsor services new to the firm but not new to the market during 2002–2004.
Share of products new to the firm: Share in sales of new products or services new to the firm butnot new to the market during 2002–2004.
Products new to the market: Dummy variable, which takes the value 1 if the firm introduced productsor services new to the market during 2002–2004.
Share of products new to the market: Share in sales of new products or services new to the marketduring 2002–2004.
New products per worker: Share in sales of new products or services per worker during 2002–2004.
Patents: Dummy variable, which takes the value 1 if the firm made patent applications to protectinnovations during the three-year period 2002–2004.
Productivity: Sales per employee in 2004 (in log).
Size: Number of employees of the firm (in log).
Size square: Square number of employees of the firm (in log).
Group: Dummy variable, which takes the value 1 if the firm belongs to a group of companies.
Public funds: Dummy variable, which takes the value 1 if the firm received EU, regional or local,funding for innovation projects during 2002–2004.
Market share: Firm’s sales divided by the value of its industry’s sales in the sample by SIC industrydivision (in log).
Cooperation: Dummy variable, which takes the value 1 if the firm had some cooperative arrangementsin innovation activities during 2002–2004.
Investment intensity: Gross investments in tangible goods in 2002, per employee (in log).
Export: Dummy variable, which takes the value 1 if the firm exports some of its sales in 2004.
Research employees: Personnel (researchers and grant holders) involved full time in internal R&Dcarried out by the firm.
Internal information sources: Dummy variable, which takes the value 1 if the firm has innovationsources for innovation activities from the enterprise or enterprise group during the period 2002–2004.
Market information sources: Dummy variable, which takes the value 1 if the firm has informationsources for innovation activities from suppliers, customers or competitors during the period 2002–2004.
Institutional information sources: Dummy variable, which takes the value 1 if the firm hasinformation sources from universities or public research centres during the period 2002–2004.
Tacit information sources: Dummy variable, which takes the value 1 if the firm has informationsources from conferences, trade fairs, exhibitions, technical publications, professional and industryassociations or face-to-face contacts during the period 2002–2004.
Downloaded By: [Consorci de Biblioteques Universitaries de Catalunya] At: 09:31 2 September 2010