innerarity island utilities system evaluation report · 2015-11-03 · water system improvements...
TRANSCRIPT

INNERARITY ISLAND UTILITIES SYSTEM
EVALUATION REPORT
Prepared by:
Prepared for: Escambia County
OCTOBER 28, 2015

2015-24 Page 1
INNERARITY ISLAND UTILITIES SYSTEM EVALUATION REPORT
OCTOBER 28, 2015
Prepared by: Kenneth Horne & Associates, Inc.
BACKGROUND The Innerarity Island Development Corporation (IIDC) provided water and waste water service to the residents of Innerarity Island in southwestern Escambia County, FL (see Exhibit A for location map). IIDC purchased water from the Emerald Coast Utilities Authority (ECUA) and resold to the residents. Waste water is currently collected in a gravity sewer system and conveyed via a system of lift stations and force mains to ECUA lift station No. 380. Waste water is metered at the discharge of the lift station before leaving the island. The waste water is metered and billed independently of the potable water. Water and sewer services provided in the past by IIDC were subject to regulation by the Public Service Commission of the State of Florida. IIDC has ceased maintenance and operation of the systems. An agreement in principal has been reached between ECUA and Escambia County regarding future ownership and maintenance of the Innerarity Island Utilities, as well as options for financing mechanisms allowing ECUA to complete design and construction, as necessary, to bring the existing utility systems into compliance with current FDEP and ECUA standards. In an effort to facilitate the transfer of the water & sewer infrastructure to ECUA for ownership, operation and maintenance, Escambia County has commissioned Kenneth Horne & Associates, Inc. (KHA) to refine a previously completed evaluation of the systems and identify any maintenance and capital improvement requirements that would be prerequisite for ECUA acceptance and to prepare a preliminary cost estimate for the improvements deemed necessary. The purpose of this report is to document the results of that effort. The approximate geographic limits of the IIDC franchise area are depicted in Exhibit A. SUMMARY OF INVESTIGATIVE SERVICES Initial onsite investigative services of existing conditions were performed throughout the IIDC franchise area to evaluate the existing water and sewer systems. This work was conducted on behalf of and funded by the Innerarity Island Development Corporation. This investigation included the following services:
• Location of existing utility lines

2015-24 Page 2
• Survey all right-of-ways, easements, and marked utilities • Video inspection and cleaning of all gravity sewer lines • Fire hydrant and dead-end flush valve testing and evaluation • Manhole and lift station inspections • Potholing of utilities to determine size and materials of construction • Evaluation of the existing water and sewer capacity versus anticipated future needs
The results of these investigations were then analyzed to determine where deficiencies in the systems might exist and what remedial action would likely be required for ECUA acceptance. System maps of the water and waste water infrastructure as surveyed by Merrill Parker Shaw, Inc., video inspection reports, and manhole inspection reports are included with this report. While KHA is familiar with ECUA standards and has strived to evaluate the system accordingly, these recommendations are subject to review and concurrence from ECUA staff. EXECUTIVE SUMMARY While recognizing that the final authority on what constitutes minimum requirements for ECUA acceptance will rest with the ECUA Board of Directors, KHA, with coordination with ECUA staff, has estimated those requirements and associated costs as follows: Water system improvements would consist of: a) relatively minor main relocations to remove encroachments of the water facilities from private properties. As an alternative to relocations, easements could be secured with the assistance of the Innerarity Island Homeowners Association (II HOA) to negate the need for the relocations. b) installation of system isolation valves, c) fire hydrant additions, d) modification of dead end water lines to provide either flush valves or circulation loops, e) water service renewals to remove polybutylene tubing and replace meters with ECUA standard meters and f) upgrade approximately 3,000 linear feet of existing 4” water main on North Shore Drive to 6”. The estimated cost for water related improvements is approximately $0.59 million. Sanitary sewer system improvements would consist primarily of the construction of a low pressure sewer system to replace all gravity collection on the island leaving only the relatively new gravity collection in the Russell Bayou development in service. The existing gravity sewer collection system was found to be prone to excessively heavy infiltration/inflow and to have many line segments laid at insufficient slope. Full replacement of the gravity sewer system was eliminated from consideration due to excessive cost. The estimated cost for sewer related improvements is $2.73 million for installation of a low pressure system on the island and upgrade of the existing Russell Bayou lift station. It is estimated that the development time for these improvements allowing for design, permitting, bidding, and construction could be in the range of eighteen to thirty months.

2015-24 Page 3
DETAILED FINDINGS Water System The water system provides domestic water to 198 customers via a distribution system consisting of approximately 41,300 linear feet of water main in sizes from 8” down to 2”, see Table 1 below. Water purchased from the ECUA is metered through a 6” meter located at the east end of the causeway to Innerarity Island.
Table 1 Water Distribution System
Water Main
Size Total Length (LF)
2 inch 3,484 3 inch 3,332 4 inch 7,356 6 inch 24,208 8 inch 2,919 Total 41,299
There are currently a total of 612 single family detached residential platted lots within the various development phases of Innerarity Island and Russell Bayou. Fifteen (15) of the platted lots are not currently served by the existing water distribution system. These are located in the Seascape Cove area. In addition to the 612 single family detached residential lots, there are 68 Townhome style units on the north side of Innerarity Point Road just across the causeway. Of the 612 single family detached residential lots, approximately 198 are currently developed and approximately 414 are undeveloped. See Exhibit B for graphical depiction. A summary of the existing and projected water demand for the Island based upon both current water customers and the potential number of customers should all of the lots be built out is provided in Table 2. Minimum design flow rate has been calculated based on ECUA Engineering Manual, Section 556, ”Water Distribution System” paragraph 3.1.1.

2015-24 Page 4
Table 2 Domestic Water Demand
No. of Average Gallons per minute Usage per month (30 days)
Users at 1.5 gpm/house
and 1.4 gpm/townhome Million g/month
Current Houses 198 297 12.8
Townhomes 68 95 4.1
Build Out 680 1020 44.1
Given the existing projected and metered flow data to the island, it is the writer’s opinion that the existing water distribution infrastructure is sufficient to meet the domestic demand for current and foreseeable short term growth needs. It is possible, that system demands might warrant main size increases to ensure sufficient pressure at peak demand times at some point in time between current development density and buildout density. The results of fire flow testing for selected fire hydrants within the IIDC franchise are provided in Table 4.
Table 4 Innerarity Island Development Corporation
Fire Hydrant Test Results
Hydrant Test Date Nozzle Size Pitot Reading GPM
Ref Hydrant Static B Residual B
* Projected @ 20 psig
2 7/22/2015 2.5 20 1060 4 70 22 1080 4 7/22/2015 2.5 20 1060 13 75 38 1310
11 7/22/2015 2.5 20 1060 13 75 20 1060 13 7/22/2015 2.5 16 960 16 76 15 915 16 7/22/2015 2.5 16 960 15 76 22 980 20 7/22/2015 2.5 16 960 15 76 20 960 28 7/22/2015 2.5 16 960 30 76 15 915 30 7/22/2015 2.5 20 1060 28 76 20 1060
*Projected value calculated from test data.

2015-24 Page 5
Water System Deficiencies and Possible Corrections Identified
1) Deficiency: Utility Encroachments Beyond Right-of-Way and/or Easement Lines. Exhibit C provides graphic representation of the locations where water distribution and sewer collection lines are installed outside the right-way per the survey. Table 5 below provides a quantitative summary of these encroachments.
Table 5 Quantitative Summary of Water and Sewer Line Encroachments
Mark Street Size Water
(LF) Force
Main (LF) Sewer (LF)
Manholes (EA)
Asphalt (SY) Private Developed
1 Shores Circle 4" 60 P U 2* Red Cedar Street 3" 150 P U-D
3* Red Cedar Street (East) 8" PVC 170 1 P D
4* Innerarity Circle 8" Clay 100 2 P D 5 Innerarity Circle No Size 100 33 P D 6 Innerarity Circle 3" 170 P U-D 7 Greenway No Size 40 P D 8* Innerarity Road 4" 150 P D 9 Atoll Drive 6" 110 P U-D
10 Atoll Drive 6" 40 P U 11 Boca Ciega Drive 8" PVC 210 3 P U 12 Bocaccio Drive 6" 120 P U 13 Bocaccio Drive 3" 10 P U 14 Bocaccio Drive 3" 30 P U 15 Boca Ciega Drive 6" 60 P U 16 Boca Ciega Drive 6" 60 P U 17 Boca Ciega Drive 6" 100 RBHOA RETENTION 18 Narwhal Drive 6" 60 P U 19 Narwhal Drive 6" 160 P U 20 Narwhal Drive 3" 20 RBHOA POOL 21 Narwhal Drive 6" 250 P U 22 Narwhal Drive 6" 100 RBHOA LIFT STAT 23 Tarpon Drive 3" 40 P U 24 Innerarity Road 8" PVC 70 3 P D 25 Innerarity Road 8" PVC 200 1 P U 26 Innerarity Road 6" 30 ITHA D 27* North Shore Road 3" 30 P U 28 Seascape Circle 2" 25 IIDC U 29 North Shore Road 6" 210 P U
TOTAL 1795 330 750 10 33 * Eliminated with installation of the low pressure sewer system RBHOA – Russell Bayou Home Owners Association ITHA – Innerarity Town Home Association IIDC – Innerarity Island Development Corporation

2015-24 Page 6
Solution: The encroachments could be eliminated by removal and replacement of the encroaching utilities to a location within the existing right-of-way. As an alternative to relocation, these encroachments may be mitigated by securing easements allowing the mains to remain in place. This item has been zeroed out of the estimated cost on the assumption the II HOA will assist in securing the necessary easements.
2) Deficiency: System Isolation/Flushing. ECUA Standard Section 556, “Water Distribution System” specifies that isolation valves shall be provided at a maximum distance of 1,000 feet on main lines for maintenance. The existing water system valve and flush valve installation was evaluated with ECUA staff and was found deficient in a limited number of locations. Solution: These deficiencies can be resolved by adding isolation valves at seven locations and flush stands or circulation loops at 17 locations. The proposed valve locations are shown in Exhibit E. The estimated cost of the isolation valve effort ($8,400) is documented in line item 6 in Table 6. The estimated cost of the flush valve/circulation loop ($28,900) is documented in line item 8 in Table 6.
3) Deficiency: Fire Protection. The Florida Fire Code (2010) requires a minimum of 1,000 gpm fire protection water flow to one and two family dwellings (Section 18.4.5.1.1). This value can be reduced by 50% if dwellings are provided with sprinkler protection and by 25% if the residences are spaced 30 feet apart. Sprinkler protection is not provided to the dwellings, however the residences are generally 30’ apart. The desired fire flow at each hydrant is therefore 750gpm. The Ten States Standards for water distribution systems states that the minimum acceptable pressure in the water distribution is 20 psig (Part 8, paragraph 2.1). The Escambia County “Land Development Code” requires a 500 feet maximum distance from a residence to a fire hydrant (Part II, Article 4, Section 4.04.12). As documented in Table 4 above, the retest of selected fire hydrants with the supply system set up to simulate the system after installation of ECUA residential water meters and removal of the main meter indicate adequate fire flow capacity and associated residual pressure will be met or exceeded at all locations. Exhibit D provides a graphic representation of the areas of the development currently within the required 500 feet of a fire hydrant. Note that there are two areas of current residential development outside the 500 foot radius.

2015-24 Page 7
Solution: Add three fire hydrants to meet the 500 foot radius requirement. The estimated cost of this effort ($10,500) is documented in line item 5 in Table 6.
4) Deficiency: Material of Residential Water Services. The originally installed water service tubing was determined to be primarily of polybutylene material. This material has since been discovered to have a short life span. Therefore, ECUA and other utility providers have ongoing programs to eliminate its use within distribution systems. While some services within the IIDC franchise area have already been replaced or partially repaired, it is believed that most of the services still contain some segments of polybutylene tubing. ECUA staff has also noted that the meter boxes and meter types must be upgraded to meet their current standard. Solution: Replacement of the water services from the main tap through the meter and box will be required for ECUA acceptance. Therefore, line item #3 of Table 6 below includes cost allowances ($76,230) for these replacements. The estimated cost of a new meter at each existing service is $550 and the allowance for the replacement of the service line is an estimated average of $385.
5) Deficiency: Lack of Water Service to Seascape Cove. This is an area in the heart of the island along Seascape Cove that lacks water service to the existing platted lots. Solution: After consultation with Escambia County, this item has been eliminated as none of these lots are currently developed. Should the current owner or a future developer wish to add utility service to these lots, it will be treated as a new and independent development with the developer funding all design and construction costs. Thus, this item is also zeroed out in the cost estimate (Table 6).
6) Deficiency: 4” Water Main on North Shore Drive. The existing 4” water main does not meet the minimum line size for fire hydrant service to the three existing fire hydrants. The length of this line is approximately 3,000 linear feet. Solution: Item 10 of Table 6 depicts the estimated cost of replacing the existing 4” water main with a 6” water main.

2015-24 Page 8
* Assuming Innerarity Island HOA can obtain easements to cover the locations with minor encroachments of water mains on private property.
Table 6 Water System Probable Cost Estimate
Item Description Quantity Unit Unit Price Amount
1 WATER MAIN RELOCATES 0* LF $45 $0
2 CONNECT TO EXISTING TOWNHOMES 68 EA $225 $15,300
3 WATER SERVICE RENEWALS 198 EA $385 $76,230
4 REPLACE WATER METERS 266 EA $550 $146,300
5 NEW FIRE HYDRANTS 3 EA $3,500 $10,500
6 INSTALL 7 6” ISOLATION VALVES 7 EA $1,200 $8,400
7 REPLACE NON-STANDARD PIPE MAIN 100 LF $50 $5,000
8 INSTALL FLUSH VALVES/CIRCULATION LOOPS 17 EA $1,700 $28,900
9 WATER SERVICE TO SEASCAPE COVE 0 LF $40 $0
10 UPGRADE 4” MAIN ON NORTH SHORE DR. TO 6”. 3000 LF $45 $135,000
SUB TOTAL $425,630
CONTINGENCY @ 15% $63,844
CONSTRUCTION TOTAL $489,475
10% ADMINISTRATIVE $48,947
8% DESIGN $39,158
PREVIOUS EFFORT DESIGN CREDIT -$6,000
3.5% CA $17,132
PROJECT TOTAL $588,712 NOTE: EACH HOMEOWNER WILL BE REQUIRED TO SIGN SERVICE AGREEMENT AND PAY A $21.50 DEPOSIT.

2015-24 Page 9
Sewer System The existing sanitary sewer system provides waste water collection and conveyance to 154 customers via a gravity collection system consisting of approximately 27,600 linear feet of 8” gravity sewer, three secondary lift stations and two primary lift stations, see Table 7 below. The survey, provided separately, documents the location of each system feature including line size and material of construction.
Table #7 Waste Water Collection System
Gravity Sewer Size Material Total Length (LF)
8 inch PVC 25,817 8 inch VCP 1,741
TOTAL 27,558 Sewer Forcemain
Size Total Length (LF) 2 inch 917 3 inch 1,636 4 inch 1,955 6 inch 3,599
TOTAL 8,107 Liftstations
Sta. Diameter Depth Pump* Russell Bayou 6' 20.40' Submersible
1 6' 20.46' Submersible 2 4' 16.51' Grinder 3 4' 11.54' Grinder 4 4' 12.78' Grinder
* All pumps are duplex. Russell Bayou Pumps are Hydromatic S-4P 7.5 HP
The two primary lift stations transfer the collected waste water to the existing ECUA lift station at the east end of the island. The ECUA lift station transfers the waste water to the ECUA waste water collection system via an existing eight-inch force main on Innerarity Point Road. This waste water flow is measured by a flow meter located in the discharge line at the ECUA lift station site. Waste water billing is based upon the flow recorded at the waste water meter and is independent of the quantity of potable water purchased from ECUA.

2015-24 Page 10
Sewer System Deficiencies and Possible Corrections Identified The sewer lines were cleaned and camera inspected to determine the condition of each line segment. Visual inspections of all manholes were also completed by KHA in collaboration with ECUA staff. A table summarizing the results of these inspections is attached as Exhibit F. The list below provides a detailed description of the deficiencies noted.
1) Utility Encroachments Beyond Right-of-Way and/or Easement Lines. Similar to the water system mentioned above, there are several sewer collection line segments that appear to encroach upon private property according to the survey. Exhibit C provides graphic representation of the locations where sewer system lines, gravity and force mains, are installed outside the right-way. Table 5 provides a quantitative summary of these encroachments.
2) Insufficient Slopes. Many of the gravity sewer system segments between manholes do not have adequate slope to support gravity flow in accordance with industry standards. While no history of chronic chokes or clogs exists, the industry standard and ECUA standard both require a minimum of 0.4% slope for 8” gravity lines. Exhibit G shows the location of line segments that do not meet the minimum slope.
3) Infiltration/Inflow. A comparison of the 2012 flow data (as estimated from run time
reports at the ECUA lift station) to rainfall for the same period indicates two occurrences of distinct correlation between rainfall and run-time spikes. The video reports as completed by SBP and the manhole inspections revealed several infiltration/inflow points in the existing sewer system excluding the newer Russell Bayou system. Some of these may warrant immediate attention as a cost saving measure. It was also observed that numerous manholes are constructed at or below surrounding grade and lack inflow seals. The Russell Bayou gravity sewer system was checked for infiltration/inflow by flow monitoring the lines to the lift station over a six week period. The study revealed I/I figures of less than 1 GPF of inflow and less than 200 Gallons per inch diameter mile of infiltration. Typically values of 10 GPF or greater and/or 1,500 Gal/inch-mile or greater are considered excessive in most systems. This system would have very negligible I/I by most standards. The monitoring report is attached as Exhibit I.
4) Lift Stations: The following are individual evaluations and required corrections for each of the system’s lift stations.

2015-24 Page 11
a. Russell Bayou Lift Station: The existing lift station was built to meet the ECUA Lift Station Standards in effect at the time of construction. The electrical system does not, however, meet current electrical requirements. The following ECUA requirements will need to be completed before this station would be acceptable by ECUA. 1.) Replace electrical control system with a current ECUA design panel and wiring system including the installation of a SCADA system with antenna. New panel to be a minimum of 12" above FEMA flood level. 2.) Install guide rails for pump removal. 3.) Replace the wet well top with a hatch designed for guide rail pump removal. (Raise top of lift station to above FEMA flood level.) 4.) Replace wet well piping with stainless steel and install above grade valve system based on ECUA Standards. 5.) Line wet well for corrosion resistance.
b. Lift Station #1: The existing lift station does not meet ECUA Design Standards.
The following ECUA requirements would need to be completed before this station would be acceptable by ECUA. 1.) Replace electrical with a current 3 phase ECUA design panel and wiring system including the installation of a SCADA system with antenna. New panel to be a minimum of 12" above FEMA flood level. 2.) Install new 3 phase pumps with guide rails for pump removal. 3.) Replace the wet well top with a hatch designed for guide rail pump removal. 4.) Replace wet well piping with stainless steel and install above grade valve system based on ECUA Standards. 5.) Line wet well for corrosion resistance.
c. Lift Station # 2: The existing lift station utilizes a deep 4' diameter manhole in the
roadway for the wet well and a 1 phase duplex grinder pump system. The existing lift station does not meet ECUA Standards. The following ECUA requirements would need to be completed before this station would be acceptable by ECUA. 1.) Install a new minimum 6' diameter wet well outside the roadway right-of-way. 2.) Replace electrical with a current 3 phase ECUA design panel and wiring system including the installation of a SCADA system with antenna. New panel to be a minimum of 12" above FEMA flood level. 3.) Install new 3 phase pumps with guide rails for pump removal. Pumps to be at least 5 HP - 3 phase. 3 phase may be accomplished using a VFD system if 3 phase power is unavailable. 4.) The wet well top shall have a hatch designed for guide rail pump removal. (Raise top of lift station to above FEMA flood level.) 5.) Replace wet well piping with stainless steel and install above grade valve system based on ECUA Standards. 6.) Line wet well for corrosion resistance.
d. Lift Station # 3: The existing lift station utilizes a deep 4' diameter manhole in the
roadway for the wet well and a 1 phase duplex grinder pump system. The existing lift station does not meet ECUA Standards. The following ECUA requirements would need to be completed before this station would be acceptable by ECUA. 1.) Install a new minimum 6' diameter wet well outside the roadway right-of-way. 2.) Replace electrical with a current 3 phase ECUA design panel and wiring system including the installation of a SCADA system with

2015-24 Page 12
antenna. New panel to be a minimum of 12" above FEMA flood level. 3.) Install new 3 phase pumps with guide rails for pump removal. Pumps to be at least 5 HP - 3 phase. 3 phase may be accomplished using a VFD system if 3 phase power is unavailable. 4.) The wet well top shall have a hatch designed for guide rail pump removal. (Raise top of lift station to above FEMA flood level.) 5.) Replace wet well piping with stainless steel and install above grade valve system based on ECUA Standards. 6.) Line wet well for corrosion resistance.
e. Lift Station # 4: The existing lift station utilizes a deep 4' diameter manhole in the
roadway for the wet well and a 1 phase duplex grinder pump system. The existing lift station does not meet ECUA Standards. The following ECUA requirements would need to be completed before this station would be acceptable by ECUA. 1.) Install a new minimum 6' diameter wet well outside the roadway right-of-way. 2.) Replace electrical with a current 3 phase ECUA design panel and wiring system including the installation of a SCADA system with antenna. New panel to be a minimum of 12" above FEMA flood level. 3.) Install new 3 phase pumps with guide rails for pump removal. Pumps to be at least 5 HP - 3 phase. 3 phase may be accomplished using a VFD system if 3 phase power is unavailable. 4.) The wet well top shall have a hatch designed for guide rail pump removal. (Raise top of lift station to above FEMA flood level.) 5.) Replace wet well piping with stainless steel and install above grade valve system based on ECUA Standards. 6.) Line wet well for corrosion resistance.
5) System Capacity: The gravity sewer system comprised of 8” gravity sewer line segments, manholes and lift stations have adequate capacity for the current population and potential future growth with the following limitations. 1) The gravity lines, although sufficient in placement and size, have many segments of inadequate slope for proper operation. 2) The lift stations transferring the waste water from the community are adequate in size for the current population but do not meet all FDEP and ECUA guidelines.
6) Lack of Sewer Service to North Shore Drive Area: There are 45 residences and 53 platted lots on North Shore Drive that currently served by septic tank due to the absence of a sewage collection system. Solution: The low pressure system design and cost estimate includes providing low pressure sewer service infrastructure to this area. The costs of septic tank abandonment and grinder pump installation for these lots is not included in the estimate as the current assumption is these residents will determine if and when they connect to the low pressure sewer system.
Proposed Solution to Sanitary Sewer System Issues: The repair of the sewer system by replacement of lift stations and low slope lines has been determined to be cost prohibitive. Replacement of the bulk of the collection system on the

2015-24 Page 13
island with a low pressure system provides a more cost effective solution (see Exhibit H for graphical depiction of low pressure system). Note there could be substantial resistance from the existing customer base to the low pressure alternative. Having had gravity sewer service for many years, the customers may be averse to the reliability and aesthetic issues associated with individual grinder stations. The proposed low pressure sewer system was conceptually designed for compliance with Florida Department of Environmental Protection Low Pressure Sewer Guidelines. The design was based on the use of Environmental One Corporation grinder pump stations and utilized the eONE design software. The design data file or printout of the design results is available for review. A conceptual cost estimate for the alternate is presented below. See Table 9.

2015-24 Page 14
Table 9 Low Pressure Sewer System Probable Cost Estimate
Item Description Quantity Unit Unit Price Amount
1 MH REMOVAL & STREET PATCH 96 EA $1,500 $144,000
2 GROUT EXISTING. SANITARY SEWER 20,500 LF $5 $102,500
3 1.5" PVC FORCE MAIN 1,000 LF $11 $11,000
4 2" PVC FORCE MAIN 7,200 LF $13 $93,600
5 3" PVC FORCE MAIN 15,200 LF $15 $228,000
6 4" PVC FORCE MAIN 2,000 LF $18 $36,000
7 6" PVC FORCE MAIN 3,000 LF $20 $60,000
8 2" GATE VALVE 7 EA $350 $2,450
9 3" GATE VALVE 20 EA $650 $13,000
10 4" GATE VALVE 4 EA $660 $2,640
11 6" GATE VALVE 4 EA $820 $3,280
12 STREET CUT & PATCH FOR FM 960 SY $55 $52,800
13 SERVICE CONNECTIONS 121 EA $1,100 $133,100
14 GRINDER INSTALLATION 121 EA $6,500 $786,500
15 RUSSELL BAYOU LS IMPROVEMENTS 1 LS $255,000 $255,000
16 INSERTS FOR RUSSELL BAYOU MHS 26 EA $175 $4,550
17 RUSSELL BAYOU SWR MH (116-118) 451 LF $125 $56,375
SUBTOTAL $1,984,795
CONTINGENCY AT 15% $297,719
CONSTRUCTION TOTAL $2,282,514
10% ADMINISTRATIVE $228,251
6.6% DESIGN $150,646
PREVIOUS EFFORT DESIGN CREDIT -$9,750
3.5% CA $79,888
PROJECT TOTAL $2,731,550

2015-24 Page 15
CONCLUSION Assuming ECUA concurrence with the remedial measures recommended herein, the estimated cost for rehabilitation of the water system is $0.59 million and the estimated cost for rehabilitation of the sewer collection system is $2.73 million. Therefore, the total estimated cost for completion of these remedial measures is $3.32 million with the low pressure sewer alternative. It is estimated that once initiated, the design-permitting-bidding phase for the recommended improvements would be eight to twelve months and construction could take twelve to eighteen months. Therefore, total time from commencement to completion is estimated to be in the range of eighteen to thirty months.


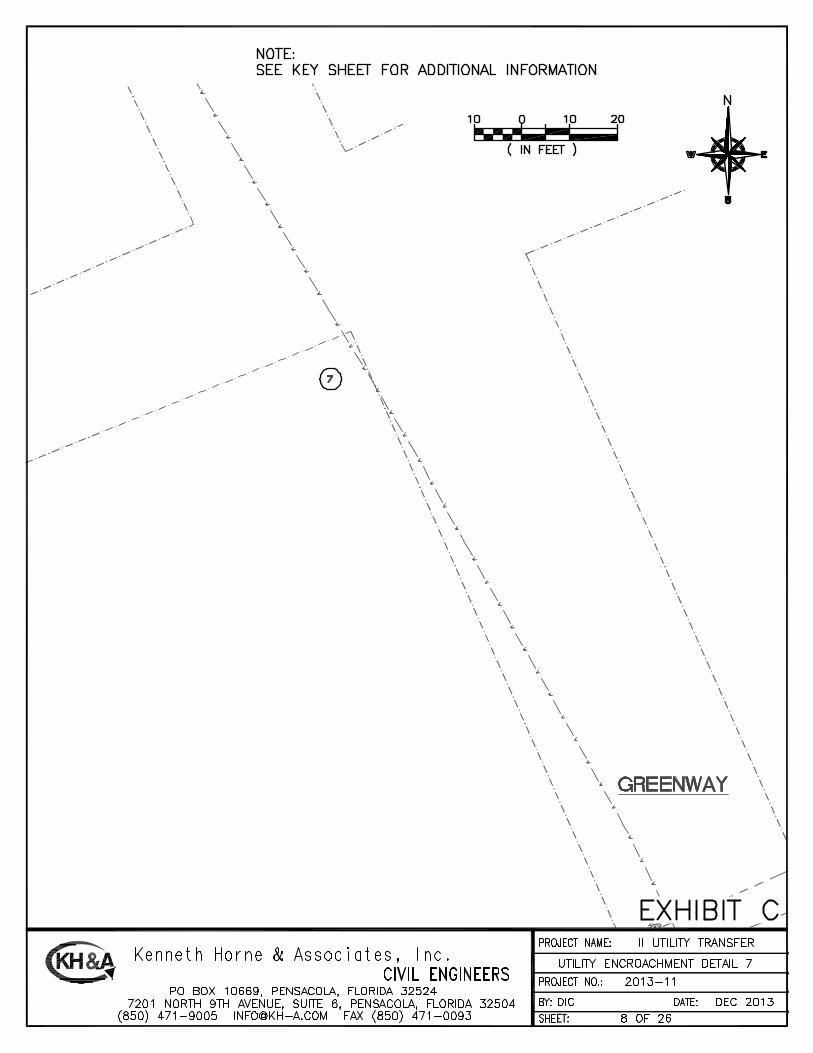


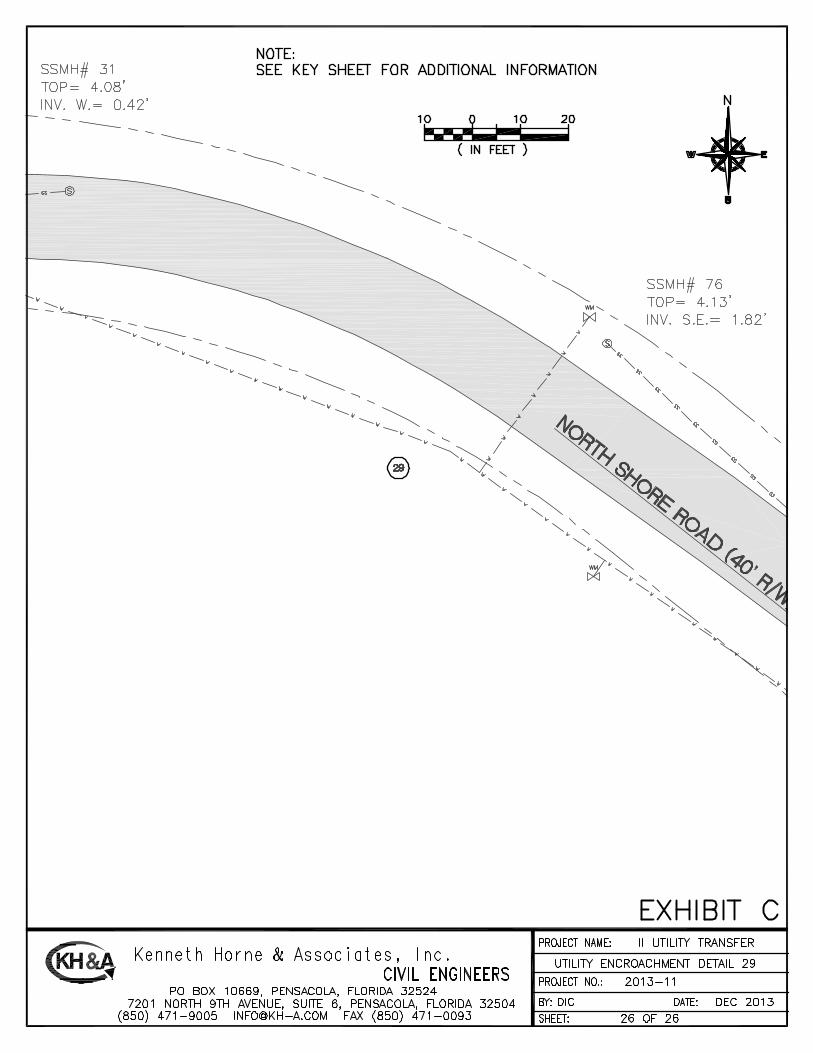


EXHIBIT I Temporary Flow Monitoring Study
Russell Bayou Subdivision
Innerarity Island
August 19, 2015
1300 Meridian Street, Suite 3000 // Huntsville, AL 35801 // www.adsenv.com
PROJECT NUMBER 25175.11
Temporary Flow Monitoring StudyRussell Bayou Subdivision
PREPARED FOR
Kenneth Horne & Associates, Inc.7201 North 9th Avenue, Suite 6Pensacola, FL 32504
SUBMITTED
August 19, 2015

i
Temporary Flow Monitoring Study
Table of Contents
Introduction .....................................................................................................................1
Methodology....................................................................................................................1
Flow Monitor Locations ...................................................................................................1
Flow Monitor Equipment..................................................................................................3
Flow Monitor Study Period ..............................................................................................3
Flow Monitor Data Format ...............................................................................................3
Results ..............................................................................................................................4
Flow Rates and Peaking Factors.....................................................................................4
Depth-to-Diameter Ratio .................................................................................................6
Rain-Dependent Inflow and Infiltration.............................................................................7
Conclusions ....................................................................................................................9
Definitions ........................................................................................................................9
References .......................................................................................................................9
Appendix A – Flow Monitor Site Installation Details
Appendix B – Flow Monitor Equipment Specifications
Appendix C – Flow Monitor Data
CD-ROM with electronic copy of report and associated data accompanies this report.

1
Temporary Flow Monitoring Study
Introduction
ADS Environmental Services (ADS) was retained by Kenneth Horne & Associates, Inc.
(Engineer) to gather and evaluate sanitary sewer flow monitor data obtained from the Russell
Bayou Subdivision on Innerarity Island in Pensacola, Florida. The scope of this study is to
observe and characterize flow conditions in this subdivision prior to a proposed transfer of these
sewers from a private developer to the Emerald Coast Utility Authority (ECUA).
Methodology
Flow conditions within the existing sewers were observed by installing sewer flow monitors at
three locations. Existing flow conditions were characterized, and the results are provided in this
report. A description of the flow monitor locations, equipment, study period, and data format are
detailed in the following sections.
Flow Monitor Locations
Preliminary flow monitor locations were selected by the Engineer, and final locations were
determined by ADS, in consultation with the Engineer, based on observed flow conditions, site
access, and site safety considerations. Brief descriptions of each flow monitor location are
provided in Table 1, and flow monitor locations are depicted on the map provided in Figure 1.
TABLE 1: Flow Monitor Locations
Monitor Latitude Longitude Diameter MH Depth
(degrees) (degrees) (inches) (inches)
RB01 30.31158 -87.47968 8 169.2
RB02 30.31140 -87.47958 8 165.6
RB03 30.31140 -87.47958 8 165.6

2
Temporary Flow Monitoring Study
FIGURE 1: Flow Monitor Locations
All three flow monitors measure wastewater flow conveyed to a sewer pump station located
near the intersection of Norwhal Drive and Tarpon Drive. Flow Monitor RB01 measures
wastewater flow from residences located to the north of the pump station. Flow Monitor RB02
measures wastewater flow from residences located on Tarpon Drive east of the intersection with
Norwhal Drive, while Flow Monitor RB03 measures wastewater flow from residences located on
Tarpon Drive west of the intersection with Norhal Drive. Site installation photographs for each
flow monitor are provided in the attached appendices.

3
Temporary Flow Monitoring Study
Flow Monitor Equipment
Sewer flow monitoring was performed using FlowShark® Triton area-velocity flow monitors
manufactured, installed, and maintained by ADS. Each flow monitor was mounted near the top
of a manhole and was connected to flow depth and velocity sensors positioned in an incoming
sewer. Detailed specifications of the flow monitor equipment used for this project are provided
in the attached appendices.
Flow Monitor Study Period
The temporary flow monitors were installed on May 6, 2015. The study period was
commissioned on May 9, 2015 and continued through July 21, 2015 for a total duration of 74
days.
Flow Monitor Data Format
Flow depth (d), flow velocity (v), and flow rate (Q) data from each sewer flow monitor, as well as
associated rainfall depth data are provided in hydrograph and scattergraph formats in the
attached appendices. An electronic copy of the flow monitor and rain gauge data is provided in
Microsoft Excel format on a CD-ROM accompanying this report.

4
Temporary Flow Monitoring Study
Results
Flow monitor data provide insight into sewer performance – revealing important information
about how the existing sewer system accommodates observed flow rates. The following
sections evaluate the observed flow monitor data using a variety of key performance indicators
(KPIs).
Flow Rates and Peaking Factors
Dry weather flow conditions are characterized by evaluating flow monitor data observed during
normal conditions, excluding wet weather events and the periods associated with the recovery
from these events. The average dry day pattern is identified as a diurnal pattern and results
from the collective sewer use of residential users located upstream from a given flow monitor.
Land use within a particular area affects the shape of the diurnal pattern. An example of a
representative diurnal pattern observed during this study period is shown in Figure 2.
FIGURE 2: Dry Weather Hydrograph – Residential Land Use
Wet weather flow conditions are characterized by evaluating flow monitor data observed during
significant storm events that occurred during the study period. An example of a representative
wet weather storm decomposition hydrograph observed during the study period is provided in
Figure 3 and shows the observed flow rate during a storm event compared to the average dry
day diurnal pattern. The difference between the two is the rain-dependent inflow and infiltration
(RDII) measured by the flow monitor. The storm event is depicted by the purple bands, and a
precompensation period prior to the storm is depicted by the light gray band. Precompensation
0.002
0.003
0.004
0.005
0.006
0.007
0.008
0.009
0.010
0.011
0.012
0 3 6 9 12 15 18 21
Dry Weather FlowRB01
MG
D
Hours
Weekdays Weekends

5
Temporary Flow Monitoring Study
is used when needed to adjust the average dry day diurnal pattern to more closely match
observed conditions prior to each storm event for proper RDII analysis.
FIGURE 3: Wet Weather Storm Decomposition Hydrograph
The minimum, average, and maximum dry weather flow rates (Qmin-D, Qavg-D, and Qmax-D) are
determined from the dry weather diurnal pattern for each flow monitor location and are provided
in Table 2, along with the resulting dry weather peaking factor (PFD). The maximum wet
weather flow rate (Qmax-W) determined for each flow monitor location is also provided, along with
the resulting wet weather peaking factor (PFW).
TABLE 2: Dry and Wet Weather Flow Rates and Peaking Factors
Monitor Qmin-D Qavg-D Qmax-D Qmax-W Peaking Factor Peaking Factor
(MGD) (MGD) (MGD) (MGD) PFD PFW
RB01 0.004 0.007 0.010 0.021 1.43 02.38
RB02 0.000 0.000 0.000 0.009 ― ―
RB03 0.000 0.001 0.003 0.022 3.99 22.00
Note that while intermittent wastewater flow is present at Flow Monitor RB02 during dry weather
conditions, it is below the detection limit of standard area-velocity flow monitor equipment.
Therefore, dry weather flow rates for Flow Monitor RB02 are reported as 0.000 MGD in Table 2,
and no corresponding peaking factors are calculated. Observed maximum wet weather flow
rates indicate the presence of some RDII at each flow monitor location, with short-term
maximum hourly average flow rates of up to 0.022 MGD.
StormEvent - 7/17/2015 2:00:00 PMRB01
Ra
infa
ll(in)F
low
(MG
D)
Sto
rms
Date16 Thu
Jul 201517 Fri 18 Sat 19 Sun
0.0
0.2
0.4
0.6
0.8
1.0
1.2
1.4
0.000
0.002
0.004
0.006
0.008
0.010
0.012
0.014
0.016
0.018
0.020
0.00.51.0
Rainfall Gross Q Gross I/I Weekdays Weekends

6
Temporary Flow Monitoring Study
Depth-to-Diameter Ratios
Once dry weather and wet weather flow rates are characterized, the hydraulic conditions under
which they occur are evaluated. The maximum flow depth observed during dry weather (dmax-D)
and wet weather (dmax-W) and their corresponding flow depth-to-diameter (d/D) ratios observed
during the study period are provided in Table 3. The maximum dry weather flow depth is the
flow depth associated with the maximum dry weather flow rate and is the maximum flow depth
that is consistently observed each day during normal dry weather conditions. The maximum
wet weather flow depth may or may not be directly associated with the maximum wet weather
flow rate, depending on the hydraulic conditions observed at a given flow monitor location.
TABLE 3: Dry and Wet Weather Depth-to-Diameter Ratios
Monitor D dmax-D dmax-D / D dmax-W dmax-W / D
(inches) (inches) (%) (inches) (%)
RB01 8 1.31 16% 1.63 20%
RB02 8 0.00 00% 0.58 07%
RB03 8 0.31 04% 0.90 11%
The d/D ratio is a performance indicator used to assess sewer capacity. Sewers are often
designed to flow under open channel flow conditions with some reserve capacity. As a result,
ASCE and WEF recommend that sewers with diameters up to 15 inches be designed to flow
with dry weather d/D ratios of 50%. Sewers are not generally designed to operate under
surcharge conditions with wet weather d/D ratios greater than 100%. During both dry weather
and wet weather conditions, all of the observed d/D ratios are well within design criteria
recommended by ASCE and WEF, indicating that there is sufficient capacity to accommodate
observed dry weather and wet weather flows at these locations.

7
Temporary Flow Monitoring Study
Rain-Dependent Inflow and Infiltration
During wet weather events, significant amounts of extraneous water can enter a sewer system,
resulting in sanitary sewer overflows (SSOs), basement backups, and/or problems at the
wastewater treatment plant (WWTP). A comparison of flow monitor data from dry weather and
wet weather periods provides a quantification of rain-dependent inflow and infiltration (RDII),
which is calculated by subtracting the measured flow during a rainfall event from the flow during
an average dry day. A wet weather storm decomposition hydrograph from a storm event that
occurred during the study period is provided in Figure 4.
FIGURE 4: Storm Decomposition Hydrograph
Up to six storm events of interest were observed, but resulted in little to no RDII response in the
sewer system. RDII responses from three storm events were disregarded, since they were
generally indistinguishable from typical dry weather flow. RDII results from the remaining three
storm events are plotted as a function of rainfall total. An example is shown in Figure 5 in which
the relationship between the Storm Period RDII (MG) is plotted with respect to the Storm Period
rainfall (inches). These relationships can then be used to evaluate the consistency of rainfall
responses within the sanitary sewer system and estimate the RDII response for various rainfall
amounts.
StormEvent - 7/17/2015 2:00:00 PMRB01
Ra
infa
ll(in)F
low
(MG
D)
Sto
rms
Date16 Thu
Jul 201517 Fri 18 Sat 19 Sun
0.0
0.2
0.4
0.6
0.8
1.0
1.2
1.4
0.000
0.002
0.004
0.006
0.008
0.010
0.012
0.014
0.016
0.018
0.020
0.00.51.0
Rainfall Gross Q Gross I/I Weekdays Weekends

8
Temporary Flow Monitoring Study
FIGURE 5: RDII Response vs. Rainfall Depth
Based on the results obtained during the study, Net RDII are reported for each basin for a
projected 1.5-inch storm event and are summarized in Table 4. Normalized Net RDII is then
calculated by dividing the net RDII volume by the associated basin size.
TABLE 4: Estimated RDII for a Projected 1.5-inch Storm
Basin Net RDII Length Net RDII Ranking
(gal) (LF) (gpd/LF)
RB01 1,100 3,858 0.29 1
RB02 0,000 0,843 0.00 3
RB03 0500 1,979 0.25 2
Based on this analysis, little to no RDII was detected at any of the three flow monitor locations.
(7/17/2015)
(5/21/2015)
(6/11/2015)
0.0000
0.0002
0.0004
0.0006
0.0008
0.0010
0.0012
0.0014
0.0016
0.0018
0.0 0.2 0.4 0.6 0.8 1.0 1.2 1.4 1.6 1.8 2.0
Qvs i - RB01Storm Period Net RDII Volume vs. Rainfall Depth
Sto
rmP
erio
dN
etR
DII
Volu
me
(mg)
Storm Period Rainfall Depth (in)
AllStorms

9
Temporary Flow Monitoring Study
Conclusions
ADS performed temporary sewer flow monitoring at three locations in the Russell Bayou
Subdivision located on Innerarity Island in Pensacola, Florida to provide information on existing
flow conditions prior to a proposed transfer of these sewers from a private developer to ECUA.
Dry weather flow rates were measured and are conveyed at flow depth-to-diameter ratios of
16% or less. Wet weather flow rates were also measured and demonstrated little to no
evidence of RDII.
Definitions
Depth-to-Diameter (d/D) Ratio – a ratio of maximum flow depth to sewer diameter. d/D ratios
are often calculated to describe both dry weather and wet weather periods and are one measure
used to assess sewer capacity utilization. In this study, d/D ratios are computed using hourly
average data.
Infiltration – water that enters a sanitary sewer system from the ground through defective system
components including, but not limited to, defective sewers, manholes, service connections, or
other system appurtenances. Infiltration is primarily dependent upon groundwater elevations, but
may also be influenced by storm events and leaking water mains.
Inflow – storm water runoff that enters a sanitary sewer system from direct connections including,
but not limited to, building downspouts, clean-outs, foundation drains, sump pumps, basement
and area drains, and cross connections with storm sewer systems.
Peaking Factor (PF) – a ratio of maximum flow rate to average flow rate. Peaking factors are
often calculated to describe both dry weather and wet weather periods, where maximum flow
rates are compared to average dry weather flow rates. In this study, peaking factors are
computed using hourly average data.
Rain-Dependent Inflow and Infiltration (RDII) – the collective inflow and infiltration that enter a
sewer system as a direct result of rainfall.
References
1. Bizier, Paul, Editor (2007). Gravity Sanitary Sewer Design and Construction, ASCE
Manuals and Reports on Engineering Practice No. 60, American Society of Civil
Engineers: Reston, VA.

Temporary Flow Monitoring Study
Appendix A – Flow Monitor Site Installation Details

Temporary Flow Monitoring Study
Flow Monitor RB01 – General Area
Flow Monitor RB01 – Manhole Interior and Pipe Installation

Temporary Flow Monitoring Study
Flow Monitor RB02 – General Area
Flow Monitor RB02 – Manhole Interior and Pipe Installation

Temporary Flow Monitoring Study
Flow Monitor RB03 – General Area
Flow Monitor RB03 – Manhole Interior and Pipe Installation

Temporary Flow Monitoring Study
Appendix B – Flow Monitor Equipment Specifications

H A R D W A R E
This multiple technology flow monitor will power almost every available sensor technology that is used in wastewater applications today. It is the most versatile and competitively-priced, multiple-technology flow monitor on the market. The three multiple technology sensor options available in the FlowShark Triton include a Peak Combo Sensor, a Surface Combo Sensor, and an Ultrasonic Level Sensor (see in-side for technology and specifications). This array of monitoring technologies provides a fit-for-purpose monitoring platform.
The FlowShark Triton is also adaptable to a wide range of customer applications and budgets. It can be configured as an economical single sensor monitor or dual sensor monitor. It offers a longer battery life and fewer parts for a more reliable system. This provides a lower purchase price and a lower lifetime ownership cost. The FlowShark Triton has the lowest power cost per data sample of any Intrinsically Safe flow monitor available.
FlowShark Triton
The new FlowShark® Triton from ADS is a “Fit-for-Purpose” open channel flow monitor for use in sanitary, combined, and storm sewers. It is designed to be the most adaptable and versatile flow monitoring device available for collection systems. It is a single pipe or dual pipe flow measurement system and is certified to the highest level of Intrinsic Safety.
FlowShark Triton Features
About
A leading technology
and service provider, ADS
Environmental Services®
has established the industry
standard for open channel flow
monitoring and has the only
ETV-verified flow monitoring
technology for wastewater
collection systems. These
battery-powered monitors are
specially designed to operate
with reliability, durability, and
accuracy in sewer environments.
A Division of ADS LLC
• Versatile and durable multiple technology sensors• Two sensor ports supporting 3 interchangeable sensors providing up to 6 sensor readings at a time • Single or dual pipe/monitoring point measurement capabilities• Wireless or serial communication for field versatility• Industry-leading battery life with a GSM/GPRS wireless connection providing up to 15
months at the standard 15-minute sample rate (varies with sensor configuration)• External power option available with an ADS External Modem Unit (EMU) or External Modem Unit/Multiplexer (EMUX) and 12-
volt DC power supply
• Modbus protocol enabling Telog® RU-33 units and RTUs, such as those supporting SCADA systems, to obtain available data• Monitor-Level Intelligence (MLI®) to improve accuracy and allow the FlowShark Triton to operate in a wide range of hydraulic
conditions• Superior noise reduction design for maximizing acoustic signal detection from depth and velocity sensors• Five software packages for accessing flow information: Qstart™ (configuration and activation); Profile® (configuration, data collection, analysis, and reporting); IntelliServe® (web-based alarming); Sliicer.com® (I/I analysis); and FlowView Portal® (online data presentation and reporting)• Intrinsically-Safe (IS) certification by IECEx for use in Zone 0/Class I, Division 1, Groups C & D, ATEX Zone 0, and CSA Class 2258 03• Thick, seamless, high-impact, ABS plastic canister with aluminum end cap (meets IP68 standard) • Protective dome for circuit board to limit exposure of electronics when opening the canister or changing the battery

Multiple Technology SensorsThe FlowShark Triton features three depths and two velocities with three sensor options. Each sensor provides multiple technologies for continuous running of comparisons.
Dimensions: 10.61 inches (269 mm) long x 2.03 inches (52 mm) wide x 2.45 inches (62 mm) highThis revolutionary new sensor features four technologies including surface velocity, ultrasonic depth, surcharge continuous wave velocity, and pressure depth.
Surface Velocity *Minimum air range: 3 inches (76 mm) from the bottom of the rear, descended portion of the sensorMaximum air range: 42 inches (107 cm)Range: 1.00 to 15 feet per second (0.30 to 4.57 m/s)Resolution: 0.01 feet per second (0.003 m/s)Accuracy: +/-0.25 feet per second (0.08 m/s) or 5% of actual reading (whichever is greater) in flow velocities between 1.00 and 15 ft/sec (0.30 and 4.57 m/s)
* The flow conditions existing in some applications may prevent the surface velocity technology from being used.
Ultrasonic Depth (Does not require electronic offsets)Minimum dead band: 1.0 inches (25.4 mm) from the face of the sensor or 5% of the maximum range, whichever is greaterMaximum operating air range: 10 feet (3.05 m)Resolution: 0.01 inches (0.25 mm) Accuracy: +/- 0.125 inches (3.2 mm) with 0.0 inches (0 mm) drift, compensating for variations in air temperature
Surcharge Continuous Wave Velocity (Under submerged conditions, this technology provides the same accuracy and range as Continuous Wave Velocity for Peak Combo Sensors)
Surcharge Pressure Depth (Under submerged conditions, this technology provides the same accuracy and range as Pressure Depth for Peak Com-bo Sensors)
Surface Combo Sensor
Dimensions: 6.76 inches (172 mm) long x 1.23 inches (31 mm) wide x 0.83 inches (21 mm) high
This versatile and economical sensor includes three measurement technologies in a single housing: ADS-patented continuous wave peak velocity, uplooking ultrasonic depth, and pressure depth.
Continuous Wave Velocity Range: -30 feet per second (-9.1 m/s) to +30 ft/sec (9.1 m/s) Resolution: 0.01 feet per second (0.003 m/s) Accuracy: +/- 0.2 feet per second (0.06 m/s) or 4% of actual peak velocity (whichever is greater) in flow velocities between -5 and 20 ft/sec (-1.52 and 6.10 m/s)
Uplooking Ultrasonic DepthPerforms with rotation of up to 15 degrees from the center of the invert; up to 30 degrees rotation with Silt Mount AdapterOperating Range: 1.0 inch (25 mm) to 5 feet (152 cm)Resolution: 0.01 inches (0.254 mm)Accuracy: 0.5% of reading or 0.125 inches (3.2 mm), whichever is greater
Pressure DepthRange: 0-5 PSI up to 11.5 feet (3.5 m); 0-15 PSI up to 34.5 feet (10.5 m); or 0-30 PSI up to 69 feet (21.0 m)Accuracy: +/-1.0% of full scaleResolution: 0.01 inches (0.25 mm)
Peak Combo Sensor
Dimensions: 10.61 inches (269 mm) long x 2.03 inches (52 mm) wide x 2.45 inches (62 mm) high
This non-intrusive, zero-drift sensing method results in a stable, accurate, and reliable flow depth calculation. Two independent ultrasonic transducers allow for independent cross-checking.
Ultrasonic Depth (See Ultrasonic Depth Specifications Above)
Ultrasonic Level Sensor

Investing approximately $650,000 in flow monitoring and $1 million in rehabilitation saved Indi-anapolis over $7 million in proposed relief line construction costs. This also reduced the contract period by 3 years and virtually eliminated basement floodings.
Saved $7 million in proposed relief line construction costs
Belmont North, Indianapolis, Indiana
Investing $5.5 million in an updated strategic plan based on comprehensive flow and rainfall moni-toring saved OCSD $46.5 million, a net savings of $41 million. The savings resulted from an improved flow monitoring plan that, acknowledging the impact of RDII, involved locating 150 flow monitors in equivalent-sized basins with proper hydraulic isolation.
Orange County, California
Investing $4.5 million calibrating its hydraulic model during wet weather and then recal-ibrating during dry weather flow conditions saved the city $498 million in capital project eliminations and deferments, generating a 100-fold return on investment.
Saved $498 million in capital project eliminations and deferments costs
City of Los Angeles, California
Examples of Return on Investment Using ADS Products and Services
ConnectorsU.S. Military specification MIL-C 26482 series 1, forenvironmental sealing, with gold-plated contacts
Communications Options- Quad band GSM/GPRS wireless modem- Direct connection to PC using serial communication cable
Monitor InterfacesSupports simultaneous interfaces with up to two combo sensors
PowerInternal - Battery life with a GPRS modem:- Over 15 months at a 15-minute sample rate* - Over 6 months at a 5-minute sample rate*External - Optional external power available with ADS External Modem Unit (EMU) or External Multiplexer (EMUX) with an ADS- or customer-supplied 12-volt DC power supply
* Rate based on collecting data once a day and varies according to sensor configuration
Connectivity- Modbus ASCII- Modbus RTU- Telog RU-33
Intrinsic Safety Certification- Certified under the ATEX European Intrinsic Safety standards for Zone 0 rated hazardous areas- Certified under IECEx (International Electrotechnical Commission Explosion Proof) Intrinsic Safety standards for use in Zone 0/Class I, Division 1, Groups C&D rated hazardous areas- CSA Certified to CLASS 2258 03 - Process Control Equipment, Intrinsically Safe and Non-Incendive Systems - For Hazardous Locations, Ex ia IIB T4 Ga
Other Certifications/Compliances- FCC Part 15 and Part 68 compliant- Carries the EU CE mark- ROHS (lead-free) compliant- Canada IC CS-03 compliant
Product Specifications
Saved $41 million using a strategic monitoring plan
ADS FLOW MONITORING APPLICATIONS• Combined Sewer Overflows (CSOs)• Stormwater Monitoring• Capacity Analysis
• Billing • Inflow/Infiltration• Model Calibration
• Spill Notification
Operating and Storage Temperature-4 degrees to 140 degrees F (-20 degrees to 60 degrees C)

© 2014 ADS LLC. All Rights Reserved. Specifications subject to change without notice. DS-TRIT-03-26-14
1300 Meridian Street, Suite 3000 - Huntsville, AL 35801 Phone: 256.430.3366/ Fax: 256.430.6633Toll Free: 1.800.633.7246
A Division of ADS LLC
ADS. An IDEX Water & Wastewater Business.
www.adsenv.com
Comprehensive flow monitoring involves subdividing a sewershed into small and uniformly-sized meter basins to facil-itate RDII volume and sewer operational capacity measurement at each metering point. This allows for distinguishing the causes from the symptoms. If the basin size is small enough, RDII in collection systems can follow Pareto’s 80/20 principle. This principle indicates that 80% of the total volume of RDII entering a collection system will enter into just 20% of the system. Therefore, rehabilitation can be performed on a smaller portion of the system, saving time and expense.
ADS Flow Monitoring Software
IntelliServe is web-hosted software providing real-time operational intelligence on the status of flow activity throughout the wastewater collection system. IntelliServe utilizes dynamic (or smart) alarming to inform clients about the occurrence of rain events, flow performance abnormalities, and data anomalies at the flow monitoring locations.
Sliicer.com is web-hosted software providing a powerful set of engineering tools de-signed for both the consulting and municipal engineer. Sliicer.com’s inflow and infiltration tools examine wastewater collection system dry and wet weather flow data and provide rigorous performance measurements in one-tenth the time of other analysis tools.
FlowView Portal is web-hosted software providing robust report delivery, enabling the user to manage data, customize reports, and select viewing parameters. FlowView Portal has a virtually unlimited database for storing and accessing historical data, using data for comparison and trend analysis purposes, and sharing information electronically.
Profile is desktop software providing the industry’s best data analysis tools, from basic flow monitoring data to complex hydraulic analysis. Profile is intuitive software that saves time and improves data quality by compiling project data into one location for analysis and reporting.
Qstart is desktop software providing field crews with a simple, easy-to-use tool for quickly activating and configuring ADS flow monitors. Qstart enables the user to collect and review the monitor’s depth and velocity data in hydrograph and tabular views simultaneously.
All ADS sensors are mounted within the pipe section where depth and velocity are uniform as the flow passes the sensors. This ensures accurate flow quantification.
FLOW
INSTALLATIONRING
ULTRASONIC DEPTH SENSOROR
SURFACE COMBO SENSOR
PEAK COMBO SENSOR
FLOWSHARK TRITON
FLOW MONITOR
Comprehensive Flow Monitoring from ADS

Temporary Flow Monitoring Study
Appendix C – Flow Monitor Data
Temporary Flow Monitoring Study
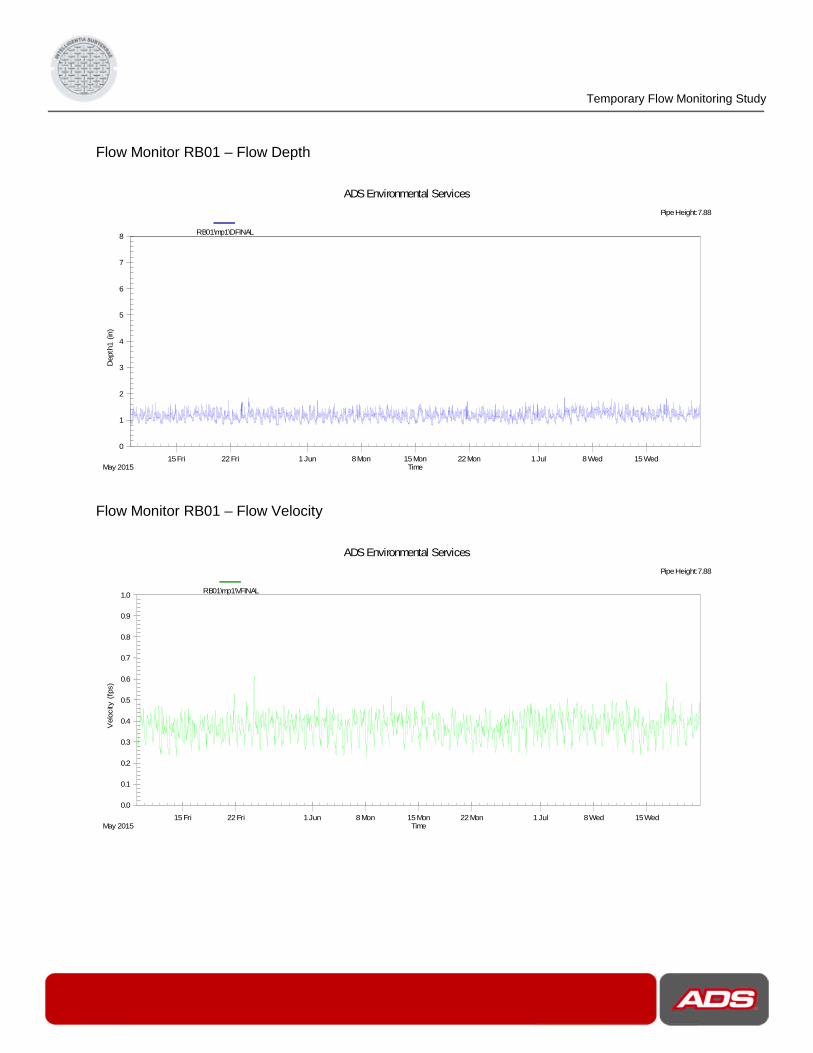
Flow Monitor RB01 – Flow Depth
Flow Monitor RB01 – Flow Velocity
0
1
2
3
4
5
6
7
8
15FriMay 2015
22Fri 1Jun 8Mon 15Mon 22Mon 1Jul 8Wed 15Wed
ADSEnvironmental Services
PipeHeight:7.88
Depth
1(in)
Time
RB01\mp1\DFINAL
0.0
0.1
0.2
0.3
0.4
0.5
0.6
0.7
0.8
0.9
1.0
15FriMay 2015
22Fri 1Jun 8Mon 15Mon 22Mon 1Jul 8Wed 15Wed
ADSEnvironmental Services
PipeHeight:7.88
Velo
city
(fps)
Time
RB01\mp1\VFINAL

Temporary Flow Monitoring Study
Flow Monitor RB01 – Flow Rate and Rainfall
0.00
0.01
0.02
0.03
0.04
0.05
0.06
0.07
0.08
0.09
0.10
0.0
0.1
0.2
0.3
0.4
0.5
0.6
0.7
0.8
0.9
1.0
15FriMay 2015
22Fri 1Jun 8Mon 15Mon 22Mon 1Jul 8Wed 15Wed
ADSEnvironmental Services
PipeHeight:7.88
Flo
w1
(MG
D)
Rain
(in)
Time
RB01\mp1\QFINAL RBRG\mp1\RAIN

Temporary Flow Monitoring Study
Flow Monitor RB02 – Flow Depth
Flow Monitor RB02 – Flow Velocity
0
1
2
3
4
5
6
7
8
15FriMay 2015
22Fri 1Jun 8Mon 15Mon 22Mon 1Jul 8Wed 15Wed
ADSEnvironmental Services
PipeHeight:7.75
Depth
1(in)
Time
RB02\mp1\DFINAL
0.0
0.5
1.0
1.5
2.0
2.5
3.0
15FriMay 2015
22Fri 1Jun 8Mon 15Mon 22Mon 1Jul 8Wed 15Wed
ADSEnvironmental Services
PipeHeight:7.75
Velo
city
(fps)
Time
RB02\mp1\VFINAL

Temporary Flow Monitoring Study
Flow Monitor RB02 – Flow Rate and Rainfall
0.000
0.005
0.010
0.015
0.020
0.025
0.030
0.035
0.040
0.045
0.050
0.0
0.1
0.2
0.3
0.4
0.5
0.6
0.7
0.8
0.9
1.0
15FriMay 2015
22Fri 1Jun 8Mon 15Mon 22Mon 1Jul 8Wed 15Wed
ADSEnvironmental Services
PipeHeight:7.75
Flo
w1
(MG
D)
Rain
(in)
Time
RB02\mp1\QFINAL RBRG\mp1\RAIN

Temporary Flow Monitoring Study
Flow Monitor RB03 – Flow Depth
Flow Monitor RB03 – Flow Velocity
0
1
2
3
4
5
6
7
8
15FriMay 2015
22Fri 1Jun 8Mon 15Mon 22Mon 1Jul 8Wed 15Wed
ADSEnvironmental Services
PipeHeight:7.88
Depth
1(in)
Time
RB03\mp1\DFINAL
0
1
2
3
4
5
6
7
8
9
10
15FriMay 2015
22Fri 1Jun 8Mon 15Mon 22Mon 1Jul 8Wed 15Wed
ADSEnvironmental Services
PipeHeight:7.88
Velo
city
(fps)
Time
RB03\mp1\VFINAL

Temporary Flow Monitoring Study
Flow Monitor RB03 – Flow Rate and Rainfall
0.00
0.01
0.02
0.03
0.04
0.05
0.06
0.07
0.08
0.09
0.10
0.0
0.1
0.2
0.3
0.4
0.5
0.6
0.7
0.8
0.9
1.0
15FriMay 2015
22Fri 1Jun 8Mon 15Mon 22Mon 1Jul 8Wed 15Wed
ADSEnvironmental Services
PipeHeight:7.88
Flo
w1
(MG
D)
Rain
(in)
Time
RB03\mp1\QFINAL RBRG\mp1\RAIN