inneerrnnaattiioonnaall mpprrooggrraamm ccoommmiittt eee chairman:dr.h.c. prof. dsc petar kolev, bg...
TRANSCRIPT

- 2 0 1 8 -- 2 0 1 8 -
XXVI INTERNATIONAL SCIENTIFIC CONFERENCEON TRANSPORT, ROAD-BUILDING, AGRICULTURAL,
HOISTING & HAULINGAND MILITARY TECHNICS AND TECHNOLOGIES
PROCEEDINGSV O L U M E 1 ISSN 1313-5031 (Print) ISSN 2535-0307 (Online)
TRANSPORT TECHNIQUES. INVESTIGATION OF ELEMENTS. VEHICLE ENGINES.
SCIENTIFIC-TECHNICAL UNION OF MECHANICAL ENGINEERING - INDUSTRY 4.0
BULGARIA

XXVI INTERNATIONAL SCIENTIFIC CONFERENCE
ttrraannss && MMOOTTAAUUTTOO ’’1188
PROCEEDINGS ISSN 1313-5031 (Print), ISSN 2535-0307(Online)
YEAR I, USSUE 1 (3), SOFIA, BULGARIA 2018
SECTION I
TRANSPORT TECHNIQUES.
INVESTIGATION OF
ELEMENTS. VEHICLE
ENGINES.
27.06. – 30.06.2018
BURGAS, BULGARIA
Publisher: Scientific-technical union of mechanical engineering
„Industry-4.0”

IINNEERRNNAATTIIOONNAALL PPRROOGGRRAAMM CCOOMMMMIITTTTEEEE
CHAIRMAN:Dr.h.c. Prof. DSc Petar Kolev, BG
Assoc. Prof. Aleksandar Kostikj, MK
Prof. Massimo Borghi, IT
Assoc. Prof. Andrey Ferenets, RU
Prof. Miho Mihov, BG
Prof. Angel Dimitrov, BG
Prof. Murat Dogruel, TR
Assoc. Prof. Beti Angelevska, MK
Assoc. Prof. Naser Lajqi, KO
Assoc. Prof. Boyko Gigov, BG
Assoc. Prof. Natalia Sidenko, LV
Prof. Dainis Berjoza, LV
Assoc. Prof. Natasa Tomic-Petrovic, RS
Prof. Dan Scarpete, RO
Prof. Nikolay Georgiev, BG
Prof. Daniela Todorova, BG
Prof. Nikolay Ovchenkov, RU
Prof. Emilia Andreeva-Moschen, AT
Prof. Oleg Sharkov, RU
Prof. Gordana Marunic, HR
Assoc. Prof. Pepo Yordanov, BG
Prof. Hristo Stanchev, BG
Acad. Polatbeg Zhunisbekov, KZ
Assoc. Prof. Igor Penkov, EE
Assoc. Prof. Rinat Kurmaev, RU
Prof. Igor Smirnov, UA
Prof. Rosen Ivanov, BG
Prof. Igor Taratorkin, RU
Prof. Teymuraz Kochadze, GE
Colonel Prof. Iliyan Lilov, BG
Prof. Vadim Zhmud, RU
Prof. Lech Sitnik, PL
Prof. Valyo Nikolov, BG
Prof. Ljudmila Boyko, UA
Prof. Wolfgang Fengler, DE
Prof. Madaminjon Aripdzanov, UZ
Assoc. Prof. Zoran Jovanovic, RS
Assoc. Prof. Martin Kendra, SK
Assoc. Prof. Ahmet H. Ertas, TR
C O N T E N T S
TRANSPORT TECHNIQUES. INVESTIGATION OF ELEMENTS. VEHICLE ENGINES
CALIBRATION OF AN ARTICULATED VEHICLE MODEL
Prof. dr hab. n.t. Adamiec-Wójcik I., Prof. dr hab. n.t. Wojciech S. .................................................................................................................. .. 4
ДИНАМИЧЕСКАЯ НАГРУЖЕННОСТЬ ЭНЕРГОСИЛОВОГО БЛОКА ПРИ ПУСКЕ ДВИГАТЕЛЯ ВНУТРЕННЕГО
СГОРАНИЯ, ОСНАЩЕННОГО СИСТЕМОЙ
Prof. Dsc. Taratorkin I., Prof. Dsc. Derzhanskii V., PhD Taratorkin A. , postgraduate Volkov A., Corresponding author - Taratorkin I. ........ 8
AN ALTERNATIVE DESIGN OF TESTING BENCH FOR DYNAMIC WHEEL CORNERING FATIGUE TESTS
Sakota Zeljko PhD., Kostic Dimitrije .................................................................................................. ............................................................... 11
DESIGN AND ANALYSIS OF THE PROTECTIVE STRUCTURE OF AN INTERCITY BUS DURING A ROLLOVER
ACCIDENT
M.Sc. Çolak N., M.Sc. Şahin U., M.Sc. Candaş A., Prof. M.Sc. İmrak C.E. PhD. ..................................................................................... ...... 14
О КЛИНОВОМ СОПРЯЖЕНИИ ВО ВРАЩАТЕЛЬНОЙ КИНЕМАТИЧЕСКОЙ ПАРЕ
Assoc. Prof., Dr.Sc.(Eng.) Sharkov O.V., Prof., Dr.Sc.(Eng.) Koryagin S.I., Prof., Dr.Sc.(Eng.) Velikanov N.L. .......................................... 18
THE METHOD OF NUMERICAL MODELING OF HYDRODYNAMICS AND HEAT EXCHANGE IN A CHANNEL WITH
DISCRETE ROUGHNESS Dr.sc.ing. Sidenko N., Dr. sc.ing. hab. prof. Dzelzitis E. ............................................................................................... .................................... 21
DEVELOPMENT AND RESEARCH OF TEMPERATURE CONTROL SYSTEM OF A HIGH-VOLTAGE BATTERY OF A
PERSPECTIVE ELECTRIC VEHICLE
Ph.D., Ass. Prof. Kurmaev R.Kh., Umnitsyn A.A., Struchkov V.S., Ph.D., Ass. Prof. Karpukhin K.E., Liubimov I.A. ................................. 25
MODELING AND SIMULATION OF VEHICLE AIRBAG BEHAVIOUR IN CRASH
Associate Prof. J. Marzbanrad, PhD student - V. Rastegar ......................................................................................................................... ....... 29
ПОВЫШЕНИЕ СКОРОСТНЫХ КАЧЕСТВ ТРАНСПОРТНОЙ ГУСЕНИЧНОЙ МАШИНЫ СОВЕРШЕНСТВОВАНИЕМ
ДИНАМИЧЕСКИХ СВОЙСТВ СИСТЕМЫ УПРАВЛЕНИЯ ПОВОРОТОМ
PhD Gizatullin U. Prof. Dsc. Taratorkin I., Prof. Dsc. Derzhanskii V., PhD Taratorkin A. , postgraduate Volkov A.,
Corresponding author - Gizatullin U. ............................................................................................................. .................................................... 33

MATHEMATICAL MODELING AND SIMULATION OF POWER UNIT WORKING ON MOTOR FUELS DERIVED FROM
NATURAL GAS IN TOTAL LIFE CYCLE
Eng. Mirenkova E., Assoc. Prof. D.Sc. Kozlov A., Assoc. Prof. Ph.D. Terenchenko A. .................................................................................. 37
A RESEARCH ON THE STATIC STABILITY OF THE MAVS USING VIRTUAL TUNNELS
M.Sc. Kambushev M. PhD., M.Sc. Biliderov S. PhD. .............................................................................................................................. ......... 41
ANALYTICAL AND FINITE ELEMENT IN-PLANE VIBRATION ANALYSIS OF A GANTRY CRANE
M.Sc. Şahin T., M.Sc. Candaş A., Prof. İmrak C.E. PhD. ................................................................................................................................. 45
MECHANICAL DESIGN AND FINITE ELEMENT ANALYSIS OF A 3 UNIT CUBESAT STRUCTURE
BsC. Güvenç, C. C., BsC. Topcu B., and Ph.D. Tola C. .......................................................................................................................... .......... 48
EFFECTS OF PROPELLANT PROPERTIES ON INTERNAL BALLISTIC PERFORMANCE RESULTS OF SOLID ROCKET
MOTORS
Ceyhun Tola, Ph.D. ...................................................................................................................................................................................... ...... 52
THREE-DIMENSIONAL SIMULATION OF THERMAL STRESSES IN DISCS DURING AN AUTOMOTIVE BRAKING
CYCLE
M.Sc. Rouhi Moghanlou M., Assist. Prof. Saeidi Googarchin H. PhD. .................................................................................................... ........ 56
NATURALLY ASPIRATED GASOLINE ENGINE UPGRADE WITH TURBOCHARGER - NUMERICAL INVESTIGATION OF
CHANGE IN OPERATING PARAMETERS
PhD. Mrzljak Vedran, Student Žarković Božica ................................................................................................................................................ 60
LIQUID FUEL TEMPERATURE, PRESSURE AND INJECTION RATE INFLUENCE ON INJECTOR NOZZLE REYNOLDS
NUMBER AND CONTRACTION COEFFICIENT
PhD. Mrzljak Vedran, Student Žarković Božica, Prof. PhD. Prpić-Oršić Jasna ........................................................................................ ........ 64
THE ANALYTICAL RESEARCH OF THE DYNAMIC LOADING EFFECT ON THE ROAD-HOLDING ABILITY
CHARACTERISTIC SIGNS OF EARTH-MOVING MACHINE
Cand. Eng. Sc., Associate Professor Shevchenko V., Post-graduate student Chaplygina A., Cand. Eng. Sc., Krasnokutsky V.,
Associate Professor Logvinov E. .............................................................................................................................................. .......................... 68
РЕГИСТРАЦИЯ И КОНТРОЛ НА ИНФРАЧЕРВЕНОТО ИЗЛЪЧВАНЕ ЕМИТИРАНО ОТ АВИАЦИОННИТЕ
ДВИГАТЕЛИ
Инженер-физик Ташев В. Л, Главен асистент Манев А. П. ............................................................................................................... .......... 73
VEHICLES FOR THE FUTURE – DILLEMAS AND PERSPECTIVES
Prof. Dr Nataša Tomić-Petrović ....................................................................................................................................... .................................. 76
COMPARATIVE ANALYSIS OF LITHIUM-ION BATTERIES FOR EV/HEV APPLICATIONS
M.Sc. Velev B. PhD. .................................................................................................................................... ...................................................... 79
CONSTRUCTIVE DESIGN OF A BELT CONVEYOR FOR A COAL MINE
M.Sc. Solak A., M.Sc. Kalay E., Prof. Dr. Imrak E. ....................................................................................... ................................................... 83
ВАКУУМНЫЕ ПОКРЫТИЯ ДЛЯ АЭРОКОСМИЧЕСКОЙ И АВИАЦИОННОЙ ТЕХНИКИ
Канд.физ.-мат. наук Чекан Н.М., доц., док.техн.наук Овчинников Е.В., канд.техн.наук Акула И.П., доц.,
канд.техн.наук Эйсымонт Е.И. ........................................................................................................................................... ............................. 86
МЕТОД ЗА ОРАЗМЕРЯВАНЕ И ИЗБОР НА ЕЛАСТИЧЕН СЪЕДИНИТЕЛ
Assoc. Prof. M.Sc. Pandev G. PhD. ............................................................................. ...................................................................................... 91
EXPERIMENTAL SIMULATION OF COMMON RAIL ELECTROMAGNETIC INJECTORS WEARING
Dipl. eng. Yordanov N., Assoc. Prof. Kiril Hadjiev, PhD ,Assoc. Prof. Emiliyan Stankov, PhD ..................................................................... 95

CALIBRATION OF AN ARTICULATED VEHICLE MODEL
Prof. dr hab. n.t. Adamiec-Wójcik I. 1, Prof. dr hab. n.t. Wojciech S. 1 Faculty of Management and Transport – University of Bielsko-Biala, Poland 1
Abstract: A model of an articulated vehicle (tractor with a trailer and/or semitrailer) formulated using joint coordinates and homogenous transformations is presented. Experimental measurements of yawing velocities of the vehicle units have been carried out for a sharp turn manoeuvre. These results are used to calibrate the mathematical models. Using optimisation methods the parameters of tires for the Dugoff-Uffelman model are chosen in such a way that the results of calculations and measurements are compatible.
Keywords: ARTICULATED VEHICLE, MULTIBODY MODEL, MODEL CALIBRATION, OPTIMISATION
1. Introduction
Articulated vehicles are vehicles which consist of two or more units, the first one of which is a tractor and the others are trailers connected by pivot joints, which enable the vehicle to perform a sharp turn. Due to the trends in the world economy the use of articulated vehicles plays a significant role in transport systems. Development of unmanned and automotive transportation systems requires much research in control and analysis of dynamics of articulated vehicles.
Safety is one of the main issues in analysis of behavior of the articulated vehicles especially in respect of stability of motion. There is a considerable amount of research devoted to the analysis of rollover and jack-knifing problems [1-4]. Control strategies are usually proposed on the basis of simplified dynamic models [5,6]. On the other hand the dynamic model has to take into account as many parameters as possible in order to reflect real motion but numerical efficiency is also a very important factor.
In this paper the dynamic model of an articulated vehicle is derived using multibody methods [7]. Joint coordinates are used to describe kinematics of the vehicle which makes the model to be derived with the smallest number of generalized coordinates. In order to define the geometry of the system we use homogenous transformations which are very popular in robotics [8].
Tire models play an important role in every model of a vehicle. The most popular models are Pacejka’s magic formula [9] and the Dugoff-Uffelman model [10]. Both of them depend on parameters which have to be determined experimentally and the results of numerical simulations strongly depend on the values chosen. In this paper the Dugoff-Uffelman model is used and in order to choose the parameters of the model calibration procedure based on solution of an optimization problem is proposed. The optimization problem is defined so that the parameters of the tire are chosen in such a way that the results of experimental measurements are compatible with those from numerical simulations.
2. Mathematical model of an articulated vehicle
Mathematical models of vehicles are derived with a different level of detail depending on the purpose of the model. Very often the equations of motion are formulated analytically. Multibody methods are useful especially in the description of articulated vehicles consisting of 𝑛 vehicle units, where each unit is treated as a separate rigid body connected with others in the kinematic chain by means of rotary joints. When joint coordinates and homogenous transformations developed in robotics are applied, the motion of each link (unit) in the chain is described with respect to the preceding link. The main difference, as far as vehicles are concerned, is that the additive units (suspension, wheels, steering system) are coupled to the link (vehicle unit) and thus a tree shape of the whole system is obtained (Fig.1).
Fig. 1 System of vehicle units (links) in the tree like shape.
The procedure of generating the equations of motion is general and a single vehicle can be considered (𝑛 = 1) as a special case. In order to describe kinematics of the articulated vehicle, the coordinate systems are assigned to each vehicle unit. If the first link (tractor or a single vehicle) is considered, the respective coordinate system is placed in the center of mass of the unit and its motion is described by six coordinates which are three displacements 𝑥( ), 𝑦( ), 𝑧( ) and three ZYX Euler angles 𝜓( ), 𝜃( ), 𝜑( ). The motion of vehicle unit 𝑝 (𝑝 = 1, … , 𝑛) is described with respect to preceding unit 𝑝-1 in the kinematic chain by means of one to three rotary degrees of freedom depending on the kind of the coupling between those units.
For the purpose of the paper let us consider a truck with a trailer (Fig.2).
Fig. 2 Truck with a trailer.
In this case the whole vehicle is treated as a system of four vehicle units: a truck, a drawbar, a dolly and a trailer. Some of the units have wheels and thus the generalized coordinates describing the motion of the unit consist of the main unit generalized coordinates and rotation angles of wheels. A simplified model of suspension which reduces its flexibility to the contact point between the tire and the road is considered. Thus the model of the truck with a trailer shown in Fig.2 is described by the following generalized coordinates:
1) tractor with four wheels:
(1.1) 𝐪(𝟏) = 𝐪(𝟏) = 𝐪𝐛(𝟏)𝐓
𝐪𝐬(𝟏)𝐓 𝐓
where 𝐪( )= 𝑥( ) 𝑦( ) 𝑧( ) 𝜓( ) 𝜃( ) 𝜑( ) ,
𝐪( )
= 𝜑( )
𝜑( )
𝜑( )
𝜑( )
X
YZ
X1
Y1
Z1
θ( )1
ψ( )1
1
φ( )1x ,y ,z1 1 1
X2
Y2
Z2
θ( )2ψ( )2
2
φ( )2
X3
Y3
Z3
θ( )3
3
X4
Y4
Z4
ψ( )4
4
4

2) drawbar:
(1.2) 𝐪( ) = 𝐪( )
𝐪( ) = 𝐪
( ) 𝜓( ) 𝜃( ) 𝜑( )
3) dolly with two wheels:
(1.3) 𝐪( ) = 𝐪( )
𝐪( ) = 𝐪
( )𝐪
( )𝐪
( )
where 𝐪( )= 𝜃( ) , 𝐪( )
= 𝜑( )
𝜑( )
4) trailer with two wheels:
(1.4) 𝐪( ) = 𝐪( )
𝐪( ) = 𝐪
( )𝐪
( )𝐪
( ) 𝐓
where 𝐪( )= 𝜓( ) , 𝐪( )
= 𝜑( )
𝜑( )
The equations of motion of the whole vehicle can be formulated in the partitioned form as follows:
(2) 𝐀 = 𝐟
where 𝐀 =
⎣⎢⎢⎢⎢⎢⎢⎢⎢⎢⎡
𝐀 ,( )
+ 𝐀 ,( )
+ 𝐀 ,( )
+ 𝐀 ,( )
𝐀 ,( )
+ 𝐀 ,( )
+ 𝐀 ,( )
𝐀 ,( )
+ 𝐀 ,( )
+ 𝐀 ,( )
𝐀 ,( )
+ 𝐀 ,( )
+ 𝐀 ,( )
𝐀 ,( )
+ 𝐀 ,( )
𝐀 ,( )
𝐀 ,( )
+ 𝐀 ,( )
𝐀 ,( )
𝐀 ,( )
𝐀 ,( )
𝐀 ,( )
𝟎 𝟎 𝟎
𝐀 ,( )
+ 𝐀 ,( )
𝐀 ,( )
+ 𝐀 ,( )
𝐀 ,( )
𝐀 ,( )
𝐀 ,( )
+ 𝐀 ,( )
𝐀 ,( )
𝐀 ,( )
𝐀 ,( )
𝟎 𝟎 𝐀 ,( )
𝟎 𝟎 𝐀 ,( )
𝐀 ,( )
𝟎
𝐀 ,( )
𝟎
𝐀 ,( )
𝟎
𝟎 𝟎
𝟎 𝟎
𝐀 ,( )
𝐀 ,( )
𝐀 ,( )
𝟎 𝟎
𝟎 𝐀 ,( )
𝟎
𝟎 𝐀 ,( )
⎦⎥⎥⎥⎥⎥⎥⎥⎥⎥⎤
𝐪 =
⎣⎢⎢⎢⎢⎢⎢⎢⎢⎡𝐪
( )
𝐪( )
𝐪( )
𝐪( )
𝐪( )
𝐪( )
𝐪( )
⎦⎥⎥⎥⎥⎥⎥⎥⎥⎤
, 𝐟 =
⎣⎢⎢⎢⎢⎢⎢⎢⎢⎡𝐟
( )+ 𝐟
( )+ 𝐟
( )+ 𝐟
( )
𝐟( )
+ 𝐟( )
+ 𝐟( )
𝐟( )
+ 𝐟( )
𝐟( )
𝐟( )
𝐟( )
𝐟( )
⎦⎥⎥⎥⎥⎥⎥⎥⎥⎤
.
The number of degrees of freedom of the tractor with a trailer is:
(3) 𝑛 = 𝑛
( )+ 𝑛
( )+ 𝑛
( )+ 𝑛
( )+ 𝑛
( )+ 𝑛
( )+ 𝑛
( )
= 6 + 4 + 3 + 1 + 2 + 1 + 2 = 19
The above is just an example of generating the equations of motion of an articulated vehicle. Using this procedure the model can be easily extended with more bodies such as other trailers. In the formulae presented the general notation is assumed in which sign ~ above a coordinate means that the coordinate is defined in the local coordinate system while a coordinate without this sign is defined in global coordinate system.
3. Tire model
In order to consider forces acting between the tire and the road we use the Dugoff-Uffelman tire model. It is simpler and requires smaller number of coefficients than the most popular model called ’Pacejka magic formula’. The forces and moments acting at wheel 𝑘 of unit 𝑝 shown in Fig.3 can be calculated as functions of
normal force 𝐹 ,( ) according to the formulae:
Fig. 3 Forces acting on wheel j of unit p.
(4.1) 𝐹 ,( )
= 𝜒 , ,( )
𝐹 ,( )
(4.2) 𝐹 ,( )
= 𝜒 , ,( )
𝐹 ,( )
(4.3) 𝑀 ,( )
= 𝑀 ,( )
𝐹 ,( )
where 𝑘 = 1, … , 𝑛( )is the number of a wheel in unit𝑝 𝜒 ,
( ), 𝜒 ,
( ) are coefficients.
Coefficients 𝜒 ,( )
, 𝜒 ,( ) and function 𝑀 ,
( ) depend on tire and road parameters (stiffness, material characteristics, geometry) and vehicle motion. One of those parameters is basic lateral stiffness coefficient
𝐿 ,( ), which will be used in the optimization problem described in the
next section. Formulae for calculation of coefficients 𝜒 ,( )
, 𝜒 ,( ) and
moment 𝑀 ,( ) are presented in [11].
4. Optimisation problem
Validation is an important stage of development of a model. In order to validate the model presented in section 2 experimental measurements have been carried out for a truck with a trailer shown in Fig.4.
5

Fig. 4 Articulated vehicle used in experiments.
Measurements were taken during the motion of the vehicle with constant speed v =60 km/h which was performed for a sharp turn of the steering wheel. Both the steering angle of the steering wheel and yawing velocity of the tractor (value ( )) and the trailer ( ( ) +
( ) + ( )) were measured. When parameters for the tire were assumed equal to those given in literature the results of numerical simulations for yawing velocities differed from experimental measurements. Thus a dynamic optimization problem has been formulated as minimization of the functional:
(5)
𝛺 = 𝛺(𝑝 , … , 𝑝 ) = 𝑐1
𝑇
( )−
( )𝑑𝑡
+ 𝑐1
𝑇
( )−
( )𝑑𝑡
where: 𝑐 , 𝑐 are assumed constants, 𝑇 is the simulation time,
( )
, ( ) are measured yawing velocity of the tractor and trailer
respectively and ( )
, ( ) are calculated yawing velocity of the
tractor and the trailer respectively. The parameters 𝑝 , … , 𝑝 of the minimized functional represent values of basic lateral stiffness
coefficient 𝐿 ,( ) for all the tires. It is assumed that these stiffness
coefficients are the same for the right and left wheels and thus the following is assumed:
(6)
𝑝 = 𝐿 ,( )
= 𝐿 ,( )
for front wheels of the tractor,
𝑝 = 𝐿 ,( )
= 𝐿 ,( ) for rear wheels of the tractor,
𝑝 = 𝐿 ,( )
= 𝐿 ,( ) for the wheels of the dolly,
𝑝 = 𝐿 ,( )
= 𝐿 ,( ) for the trailer wheels.
It has to be noted that when solving this task in order to calculate the value of Ω for a given combination of parameters 𝑝 , … , 𝑝 , it is necessary to integrate the equations of motion (3), which now depend not only on the generalized coordinates but also on parameters 𝑝 , … , 𝑝 over the interval < 0, 𝑇 >; this means that the equations of motion (3) have to be integrated at each optimization step. The boundary conditions for the task are formulated in the form:
(7) 𝑝 , ≤ 𝑝 ≤ 𝑝 , 𝑓𝑜𝑟 𝑖 = 1, … ,4
where 𝑝 , , 𝑝 , are minimum and maximum admissible values of parameter 𝑝 .
The nonlinear optimization task (5), (7) was solved using the
downhill simplex method. Table 1 presents the values of 𝐿 ,( )
= 𝐿 ,( )
obtained as a solution of this task.
Table 1: Initial (before optimization) and calculated (after optimization) values of parameters 𝑝 , … , 𝑝 ..
Before
optimization After
optimization 𝑝 15 20.96
𝑝 15 16.29
𝑝 13 14.39
𝑝 13 14.97
These values are obtained when it is assumed that there is viscous friction in the connection between the dolly and the trailer and the friction coefficient equals 0.04. Figures 5 and 6 present yawing velocity of the tractor and trailer respectively.
Fig. 5 Yawing velocity of the tractor
Fig. 6 Yawing velocity of the trailer
It can be seen that the courses of yawing velocities obtained for values of the lateral stiffness coefficient taken from literature (broken line) differ from those from the experiment although the form of the course is similar. When tire parameters are calculated as a result of optimization procedure the results of experimental measurements and numerical simulations are compatible.
5. Final remarks
This paper presents a procedure which enables us to improve the accuracy of the articulated vehicle model elaborated. The tire parameters obtained on the test stands should be adjusted by comparing of the results of the real tests of truck behavior with the results of the calculations. The application of dynamic optimization enables the modified tire parameters to be quickly determined. The method of modelling by means of joint coordinates and homogenous transformations seems very advantageous for mathematical modeling of a truck combination.
Finally, it can be concluded that calibration of a dynamic model of a truck combination ensures that we achieve good qualitative and
6
quantitative compatibility between the results of the real test and results of calculations.
References
1. Bouteldja M., V.Cerezo. Jackknifing warning for articulated vehicles based on a detection and prediction system, in Proceedings of the 3rd International Conference on Road Safety and Simulation, Indianapolis, 2011.
2. Fencher P.S., Winkler C., Ervin R., Zhang H., Using braking to control the lateral motion of full trailers Supplement to Vehicle System Dynamics 29, 462-468, 1998
3. Hussain K., Stein W., Day A. J. Modelling commercial vehicle handling and rolling stability Proc. IMechE Part K: J. Multi-body Dynamics 219, pp. 357-369, 2005.
4. Kaneko T., Kageyama I., A study on the braking stability of articulated heavy vehicles, JSAE Review 24, 157-164, 2003.
5. Bolzern P., DeSantis R.M., Locatelli A. An input-output linearization approach to the control of an n-body articulated vehicle. Journal of Dynamic Systems, Measurement, and Control. 123, 309-316, 2001.
6. Yang X., Song J., Gao J., Fuzzy Logic Based Control of the Lateral Stability of Tractor Semitrailer, Mathematical Problems in Engineering Volume 2015, Article ID 692912
7. Adamiec-Wójcik I., Awrejcewicz J., Grzegożek W., Wojciech S., Dynamics of articulated vehicles by means of multibody methods, in J. Awrejcewicz, M. Kaźmierczak, J. Mrozowski, P. Olejnik editors: Dynamical systems: mathematical and numerical approaches, Łódź, 2015.
8. Craig J.J. Introduction to robotics, Massachusetts, Addison-Wesley 1988.
9. Pacejka H.B., Bakker E.,The Magic Formula Tyre Model. Suppl. to Vehicle System Dynamics, vol.21, pp.1-18, 1993.
10. Dugoff H., Fancher P.S., Segel L., An Analysis of Tire Traction Properties and Their Influence on Vehicle Dynamics Performance. SAE Technical Paper 700377, 1970.
11. Grzegożek W., Adamiec-Wójcik I., Wojciech S., Komputerowe modelowanie dynamiki pojazdów samochodowych (Computer modelling of vehicle dynamics) Kraków: Cracow University of Technology Press, 2003.
7

ДИНАМИЧЕСКАЯ НАГРУЖЕННОСТЬ ЭНЕРГОСИЛОВОГО БЛОКА ПРИ ПУСКЕ
ДВИГАТЕЛЯ ВНУТРЕННЕГО СГОРАНИЯ, ОСНАЩЕННОГО СИСТЕМОЙ
COMMON RAIL
DYNAMIC LOADING OF THE ENERGY-SILIC BLOCK AT THE START OF THE INTERNAL
COMBUSTION ENGINE, EQUIPPED WITH THE COMMON RAIL SYSTEM
Prof. Dsc. Taratorkin I.1, Prof. Dsc. Derzhanskii V.1, PhD Taratorkin A.1 , postgraduate Volkov A.1 – Institute of Engineering Science of the
Ural Branch of the Russian Academy of Sciences (IES UB RAS), Russia
Corresponding author - Taratorkin I.
E-mail: [email protected]
Аннотация: Исследуется процесс формирования динамической нагруженности элементов энерго-силового блока при пуске дви-
гателя, оснащенного системой Common Rail. Приводятся результаты экспериментов, имитационного моделирования и обосно-
вываются пути снижения динамической нагруженности рассматриваемой механической системы.
КЛЮЧЕВЫЕ СЛОВА: ДВИГАТЕЛЬ, ПУСК, ТОРСИОН, ГАСИТЕЛЬ, КОЛЕБАНИЯ, СОБСТВЕННАЯ ЧАСТОТА, РЕЗОНАНС.
Abstract: The investigated process of formation of dynamic loading of power-power unit elements at engine start-up, equipping the
Common Rail system. The results of experiments, simulation simulation and justified ways to reduce the dynamic loading of the mechanical
system under consideration are presented.
KEYWORDS: ENGINE, START, TORSION, ABSORBER, OSCILLATIONS, NATURAL FREQUENCY, RESONANCE.
Динамическая нагруженность энерго-силовых блоков
(ЭСБ) транспортных машин на установившихся режимах рабо-
ты определяется резонансными колебаниями, возбуждаемыми
гармоническими составляющими момента двигателя при сов-
падении частот возмущений и собственных механической сис-
темы. Вывод резонансных колебаний за пределы рабочего диа-
пазона частот вращения вала двигателя может быть обеспечен
выбором жесткости или момента инерции . В энерго-
силовом блоке многих транспортных машин с гидро-
механической трансмиссией, с литыми колесами ГТ, функцию
упругого элемента - гасителя крутильных колебаний, выполня-
ет торсионный вал. Торсионный вал устанавливается между
маховиком двигателя и насосным колесом гидротрансформа-
тора. Такое решение позволяет увеличить удельную объемную
мощность моторно-трансмиссионного отделения по сравнению
с зарубежными конструкциями. Однако вывод резонансных
колебаний за пределы рабочего диапазона оборотов двигателя
не исключает их возбуждения на низких частотах - при пуске и
заглохании двигателя [1]. Учитывая высокую энергоемкость
процесса встает проблема обеспечения прочности упругого
элемента - торсионного вала. Расчетные исследования кру-
тильных колебаний в трансмиссиях транспортных машин в
нашей стране начались в 50-60-е годы прошлого столетия. За
основу были приняты работы Терских В.П. [2], Бурцева С.Е.
[3], Вейца В.Л., Кочуры А.Е. [4], Гришкевича А.И. [5] и др. Эти
работы явились основой для разработки метода расчета ста-
ционарных крутильных колебаний, возбуждаемых двигателем
внутреннего сгорания. На их основе во ВНИИТранмаш был
разработан отраслевой стандарт ОСТ В3-5300, который широ-
ко применяется и в настоящее время. Вопросам исследования,
прогнозирования и снижения динамической нагруженности,
обеспечения долговечности торсионных валов для машин с
традиционными двигателями, конструирования гасителей кру-
тильных колебаний трансмиссий транспортных машин посвя-
щены научные работы Зайцева В.А., Жучкова М.Г. и др.
Особенно остро эффект возбуждения резонансных колеба-
ний проявляется при пуске двигателя с современными интел-
лектуальными мехатронными системами управления подачей
топлива (Common Rail). Создание перспективных энерго-
силовых установок требует разработки новых алгоритмов
управления и их программной реализации.
В соответствии с приведенным выше объектом исследо-
вания является ЭСБ включающий ГМТ и дизельный двигатель
с интеллектуальной мехатронной системой управления пода-
чей топлива Common Rail.
Цель работы состоит в исследовании процесса формиро-
вания динамической нагруженности элементов ЭСБ при пуске
двигателя и разработке рекомендаций по ее уменьшению.
Для оценки и анализа динамических нагрузок в режиме
пуска двигателя необходима модель, учитывающая реальное
состояние, свойства элементов системы, в том числе нелиней-
ность упруго-диссипативных характеристик гасителей колеба-
ний. Учитывая неопределенность параметров при численном
моделировании процесса пуска необходимо применение боль-
шого количества допущений. В связи с этим временные функ-
ции кинематических и силовых параметров определяются экс-
периментально по кодам диагностического разъема информа-
ционно-измерительной и управляющей системы управления
двигателем. На рис. 1, 2 приведены характер изменения пара-
метров двигателя, оснащенного указанной системой: угловой
скорости вала, его расчетного момента, цикловой топливопо-
дачи и угла опережения впрыска.
Рис. 1 – Фрагмент осциллограммы с записью действующего
момента (1) и оборотов коленчатого вала (2) на режиме пуска
и холостого хода
В период времени от 0 до t1 (рис. 1) стартер вращает вал двига-
теля до достижения пусковой частоты (18 ... 22 рад/с) без пода-
чи топлива. После этого при начинается подача
топлива для осуществления пуска двигателя и в течение 0,7 …
8

0,8с происходит интенсивное нарастание угловой скорости
вала двигателя. Далее, при совпадении третьей моторной гар-
моники момента двигателя с собственной частотой механиче-
ской системы возбуждаются резонансные колебания вала дви-
гателя на частоте 26 … 28 Гц., что приводит к замедлению ус-
корения разгона двигателя. Следует отметить, что частота оп-
роса датчика угловой скорости вращения вала по протоколу
SAE J1939-71 составляет 20 Гц при требуемой минимальной
частоте опроса, в соответствии с теоремой Котельникова 60 Гц
[6]. В связи с этим колебательный процесс можно рассматри-
вать как качественную иллюстрацию. Для корректного опреде-
ления частоты колебательного процесса в диапазоне превы-
шающем возможности CAN-шины (по частоте опроса) парал-
лельно CAN-шине в аналоговом режиме фиксировались коле-
бания выходных импульсов штатного индукционного датчика
оборотов вращения коленчатого вала двигателя.
Рис. 2 – Фрагмент осциллограммы с записью угла опережения
впрыска основного импульса (1) и цикловой топливоподачи (2)
на режиме пуска и холостого хода
Высокая частота опроса позволяет фиксировать не-
равномерность вращения коленчатого вала и с использованием
циклических функций прикладного программного обеспечения
[7,8] осуществлять выделение гармонических составляющих
исследуемого колебательного процесса. В рассматриваемом
случае это резонансные колебания на собственной частоте ме-
ханической системы при совпадении с третьей моторной гар-
моникой. Описываемый процесс продолжается в течение 1,5 …
2,0 с до момента времени . При этом на момент сопротивле-
ния вращению накладывается динамический момент со значи-
тельной амплитудой (при
составляет ), а
угловое ускорение достигает величин 1500 … 3000 рад/с2.
Во время колебаний цикловая подача топлива остает-
ся неизменной (рис. 2) и, недостаточной для продолжения раз-
гона двигателя. Из-за повышения требуемого уровня энергоза-
трат среднее значение скорости вала двигателя на данном ре-
жиме увеличивается недостаточно быстро (ускорение прохож-
дения резонансной зоны не превышает 8,5 рад/с2.) После выхо-
да угловой скорости за пределы резонансной зоны ее значение
резко возрастает и достигает величины холостого хода
( ). Из-за нестабильности частоты враще-
ния вала двигателя алгоритм работы системы подачи топлива
нарушается. При этом со смещением по фазе система регули-
рует угол впрыска и цикловую подачу топлива, что дополни-
тельно дестабилизирует процесс. В дальнейшем цикловая по-
дача стабилизируется на уровне, соответствующем режиму
холостого хода.
Возбуждение энергоемких резонансных колебаний
торсионного вала в процессе пуска двигателя с современной
интеллектуальной мехатронной системой растягивает процесс
пуска в результате зависания электронной системы - возникно-
вения так называемого «конфликта задач» [9]. При этом проис-
ходит накопление числа циклов нагружения механической
системы на резонансном режиме, в том числе и упругого эле-
мента – торсионного вала. Этот режим является нерасчетным и
приводит к разрушению торсиона. В работе [1] подробно ис-
следован процесс пуска классического дизеля (с традиционной
системой подачи топлива). Автором установлена зависимость
максимальных динамических нагрузок на торсионном вале от
ускорения прохода через резонанс. Как следует из результатов
автора, при увеличении ускорения прохода через резонансную
зону уровень максимальных динамических нагрузок на торси-
онном вале снижается на 10 … 20 % по сравнению со стацио-
нарным режимом резонансных колебаний (при полном совпа-
дении собственной частоты системы с третьей гармоникой
дизеля). При этом исследуется диапазон от 50 до 200 рад/с2. В
рассматриваемом нами случае ускорение прохода резонансной
зоны находится в диапазоне от 6 до 8,5 рад/с2, т.е. пуск проис-
ходит в крайне не благоприятных условиях (в интервале вре-
мени от ) и механическая система находится, по су-
ществу, в состоянии резонанса на установившемся режиме.
Следует отметить, что уровень реализуемых резонансных на-
грузок существенно зависит от ускорения механической систе-
мы и колеблется в широких пределах, определяемых тепловым
состоянием двигателя, способом его пуска (электростартером
или пневмосистемой).
Полученные результаты позволяют построить мате-
матическую модель для анализа возможностей снижения ди-
намической нагруженности упругого вала. На рис. 3 приведена
расчетная схема. Расчетная схема представлена в виде двух
сосредоточенных масс – маховика с моментом инерции и
момента инерции насосного колеса с моментом инерции ,
соединенных между собой упруго-диссипативной нелинейной
связью с жесткостью и моментами
предварительного поджатия и моментом
трения . Движение двухмассовой систе-
мы описывается дифференциальными уравнениями второго
порядка:
(1)
где – упругий момент, являющийся функ-
цией угла закрутки вала и направления скорости относи-
тельного перемещения , учитывающий явление нелинеаризо-
ванного «сухого» трения гасителя колебаний; - полигар-
монический возмущающий момент двигателя. Имитационная
модель, выполненная в пакете LMS Amesim, приведена на рис.
4.
Рис. 3 – Расчетная схема динамической системы
9

Рис. 4 – Имитационная модель динамической системы для
исследования процесса пуска двигателя
Модель включает в себя блок формирования управ-
ляющего воздействия (позволяет задавать ускорение разгона
двигателя в процессе пуска), блок двигателя – источника
возмущающего момента, позволяющего задавать пе-
риодическую и постоянную составляющие; блок гасителя кру-
тильных колебаний и собственно инерционные массы динами-
ческой системы. Результаты моделирования для различных
алгоритмов разгона в процессе запуска сведены в таблицу 1 и
приведены на рис. 6.
Таблица 1
Результаты моделирования динамической нагруженности
механической системы при пуске двигателя
пп
Параметры
динамической
системы Амплитуда момента кНм
Угловое ускорение
при пуске , рад/с2 6 50 100
1
Жесткость
кНм/рад
Параметры петли
гистерезиса
3,0 2,5 2.0
2
Жесткость
кНм/рад
Параметры петли
гистерезиса
1,0 0,88 0,8
Результаты вычислительного эксперимента, выпол-
ненного для исследуемой механической системы, показывают,
что снижение динамического момента может быть еще более
значительным по сравнению с приведенным в [1]. Это объяс-
няется более низкими значениями резонансной частоты и по-
рядком основной моторной гармоники двигателя (резонансная
частота 26 … 28 Гц вместо 52 … 56 Гц и третья основная мо-
торная гармоника вместо шестой).
Таким образом, из результатов выполненной работы
следует, что основным способом снижения динамической на-
груженности механической системы при пуске двигателя с
современной системой управления подачей топлива является
обоснованная корректировка алгоритма работы системы
управления в режиме «пуск», обеспечивающая быстрый разгон
при прохождении через опасную резонансную зону.
В процессе экспериментальных исследований уста-
новлено, что после наработки ресурса гусениц 8 000 км, в том
числе по бетонной трассе – 3 000 км, высота грунтозацепов
уменьшилась на 10,5 мм. Это приводит к ограничению скоро-
сти движении в процессе поворота по деформируемому грунту
вследствие повышенного буксования движителя (скорость
прохождения «змейки» снижается на 20…25 %).
Выводы.
1) Одним из возможных направлений снижения динами-
ческой нагруженности механической системы при пуске
двигателя с современной системой управления подачей
топлива является обоснованная корректировка алгоритма
работы системы управления в режиме «пуск», обеспечи-
вающая быстрый разгон при прохождении через опасную
резонансную зону.
2) Снижение динамической нагруженности энерго-
силового блока при пуске двигателя может быть достигну-
то введением в конструкцию демпфирующего устройства,
например, в виде фрикциона, располагаемого между махо-
виком и насосным колесом гидротрансформатора. Так же
требуемый эффект может быть достигнут смещением ре-
зонансной частоты до величины 23 … 24 Гц (450 … 460
об/мин). Это может быть достигнуто уменьшением диа-
метра торсионного вала при исключении «конфликта за-
дач».
3) Учитывая, что при пуске двигателя требуются суще-
ственные затраты мощности на привод системы моторной
установки и других потребителей, представляется целесо-
образным их отключение в период пуска. При этом, необ-
ходимо принять во внимание увеличение собственной час-
тоты механической системы и соответственно опасность
смещения собственной частоты в зону холостых оборотов
двигателя.
Список, использованных источников
1. Белоутов Г.С., Быков И.В. Математическая модель
расчета динамических нагрузок во входных элементах
трансмиссии при проходе резонансной зоны в процессе за-
пуска двигателя / Актуальные проблемы защиты и безопас-
ности: Труды XVII Всероссийской научно-практической
конференции РАРАН (1-4 апреля 2014 г.). Издание ФБГУ
«Российской академии ракетных и артиллерийских наук»,
Москва – 2014 с. 142 – 149.
2. Терских В.П. Крутильные колебания валопровода си-
ловых установок / Л.: Судостроение, 1970.
3. Бурцев С.Е. Расчет опасных режимов вынужденных
колебаний крутильных систем гусеничных машин. – М.: Изд-
во ВА БТВ, 1967.
4. Вейц В.Л., Кочура А.Е. Динамика машинных агрега-
тов с двигателями внутреннего сгорания – Л.: Машинострое-
ние, 1976.
5. Гришкевич А.И. Проектирование трансмиссий авто-
мобиля / под ред. А.И. Гришкевича. М.: Машиностроение,
1983. 263 с.
6. Ричард, Л. Цифровая обработка сигналов [Текст]: пер
с англ. / Л. Ричард. 2-е изд. М.: ООО «Бином-Пресс», 2007.
7. PowerGraph. Руководство пользователя. URL:
http://www.powergraph.ru
8. Измайлов Д.Ю. PowerGraph. Часть 2 - проведение из-
мерений ПиКАД. 2008, 2, C. 42-46.
9. Системы управления дизельными двигателями. Пере-
вод с немецкого. С40 Первое русское издание. – М.: ЗАО
«КЖИ «За рулем», 2004. – 480 с.: ил.
10

AN ALTERNATIVE DESIGN OF TESTING BENCH FOR DYNAMIC WHEEL
CORNERING FATIGUE TESTS
Sakota Zeljko PhD., Kostic Dimitrije
Institute "VINCA", Center for IC Engine and Motor Vehicles, University of Belgrade, Serbia
Abstract: Worldwide test laboratories use complex equipment with high level of automated testing processes due to the larger quantity
of samples processed. In order to facilitate the testing of products in domestic, accredited test laboratories, the Center for IC Engine and
Vehicles of Vinca Institute developed a testing bench adapted to requirements of the domestic producers. This article presents an
examination device designed for cornering fatigue testing of wheels in laboratory conditions. Furthermore, this testing bench allows testing
of a wide range of elements and systems associated with the wheel, e.g. hubs, bearings, screw connectors, axles etc. Upon construction, the
test bench was evaluated through a number of tests of various wheel specimens. The obtained results confirm the pertinence of this method in
the development of the vehicle suspension systems.
Keywords: WHEELS, CORNERING FATIGUE TEST
1. Introduction
Testing of vehicle elements and assemblies is one of the
unavoidable stages in the development of automotive industry,
whereby this activity is given a special attention. In Şerbia, a
number of vehicle elements is produced, among which are wheels,
which require verification in terms of meeting the quality, i.e.
harmonization with relevant world standards in this field.
Worldwide test laboratories use complex equipment with high
level of automated testing processes due to the larger quantity of
samples processed. In order to facilitate the testing of products in
domestic, accredited test laboratories, the Center for IC Engine and
Vehicles of Vinca Institute developed a testing bench adapted to
requirements of the domestic producers.
Apart from the aforementioned primary purpose, this testing
bench allows testing of a wide range of elements and systems
associated with the wheel, e.g. hubs, bearings, screw connectors,
axles etc.
Technical solution of this test bench was evaluated through a
number of tests of various wheel specimens and obtained results
confirm the pertinence of this method in the development of the
vehicle suspension systems.
2. About wheel testing
The problem is in what way to maximally speed up the
dynamic wheel testing by incurring minimum costs. Solutions are
usually sought either in the increase of wheel load or in the
frequency of load change. Testing conditions need to be true to
realistic exploitation conditions, which imposes certain limitations,
especially when the wheel testing is performed with a tire where the
overload capabilities are of limited nature. An alternative to this is
an increase in the wheel rpm up to velocities of close exploitation
maximum, which, when the lateral strength of the wheel is
concerned, is most easily achieved by affect of load of centrifugal
force. Most often, the wheel axis is placed vertically to reduce the
effect of gravity on the elements that transmit the lateral force. One
of those solutions, such as the one shown in Figure 1 (CFT-5 testing
bench [4]), although it possesses the best characteristics in terms of
centrifugal force effect on the wheel load, is still not ideal since the
weight of the shaft coupled with additional load (axial load on the
wheel) is the cause of deviation from the real conditions when
exploiting the wheel.
Fig. 1 CFT-5 testing bench with a detailed overview of the rotating weight
When performing wheel testing on commercial vehicles, it is
not easy to implement a solution together with a vertically
postioned testing bench axis due to high testing installation height
complete with all the accompanying effects such as high vibrations,
which require massive stands or some other adequate mechanism.
3. Some shared experiences as regards wheel
testing
In a number of countries, wheel testing has already been
regulated in the adequate standards (such s USA[3], Japan, UK) and
as such has mainly been based on the dynamic wheel testing
performed either under lateral or radial load conditions. Apart from
the abovementioned tests, tests such as torsional strength and testing
of resistance to lateral impact are also present.
The stiffness testing by means of radial load is carried out on
the wheel on which the recommended tire is mounted and and
which rolls on the roller either on the outside or inside, or perhaps
on several smaller rollers that simulate a flat surface. The surface on
which the wheel is placed must reflect a smooth road as realistically
as possible due to reduced deformations of tires. This kind of
dynamic testing entails an overload (up to 70%) in the radial
direction, which significantly reduces the lifespan of a tire.
Rollers of various diameters are used for wheel testing in
commercial vehicles, but the most common value that we come
across is d = 1.7m (SAE), which is also common when performing
tire testing. In case when the wheel sits on the inside of the roller,
diameter of roller is only slightly bigger compared to a wheel
diameter.
Stiffness testing through application of lateral force is carried
out either with or without a wheel fitted with a tire. When
performing tests on a complete wheel, the load is usually achieved
by changing a wheel slope compared to its supporting surface, but
this is also possible in a number of different ways. Figure 2 shows
11

the ZWARP testing bench of MAKRA company [5] with a variable
wheel tilting point that sits on the drum on the inside.
Fig. 2 ZWARP testing bench by MAKRA company
Wheel testing without tires is most often used when applying
lateral force, for which reason only two types of construction,
shown in the Figures 3 and 4 below, are mainly used. The first
picture shows a testing bench with a turning wheel attached to the
rotating stand. A simulation of the lateral force (torque) is achieved
by placing weights or in some other way.
Fig. 3 Cornering fatigue test
Figure 4 show a more frequently used testing bench that is based
on the principle of using centrifugal force that is generated by
rotation of eccentrically arranged mass. The wheel is fixed to the
stand, whilst the load change reaches the frequency of up to
100,000 changes per hour. In this way, the testing in question lasts
significantly shorter.
Fig. 4 Centrifugal force testing
When testing a wheel with no tire on it, a real-life simulation of
workloads on the wheel disk is enabled, but not on the entire wheel.
Knowing the fact that fractures occur almost exclusively on the
central disk, this method provides a quality assessment in terms of
wheel endurance relative to lateral forces.
The determination of the load by applying a bending moment
is, for example, performed according to formula below (SAE J267):
М= L*(rst * µ + d)* К
Where:
М – means a bending moment
L– means a vertical wheel load
rst – means a static wheel radius
µ – means an adhesion coefficient (0.7)
К – means a testing velocity coefficient (1,1 – 1,6)
d – means a wheel disk eccentricity
The requirement of the mentioned standard is that cracking may
occur, naturally depending on the material used, only after a certain
number of cycles (most often 60,000). Allowed variation of the
bending moment totals +/- 3%.
4. Explanation of essence in the proposed solution
When we tried to tackle this technical solution, the key task was
to make a testing bench for the lateral force of wheels of various
dimensions, as well as for other associated elements (hubs,
bearings, screws, etc.), with the maximum use of existing
assemblies, which proved impossible in commercial solutions. We
also decided to implement the lateral force over the course of
testing, which is one of the main causes of wheel damage.
The essence of the technical solution is to simplify the testing
installation in terms of using universal large mass surcafe for
dynamic loads without substantially affecting the variation of a
wheel bending moment. A relatively simple calculation suggests
that when using the centrifugal force of rotational mass (n = 1440
rpm), we can avoid complicated solutions to testing benches for
special purposes with vertical positioning of wheel rotation axis.
The analysis further suggests that the following load ratio of
weights and centrifugal force is as follows:
Fg/Fcf= m*g/m*r*ω2=0.3%
Where:
- r=150mm
- ω=n*π/30=150s-1
The influence of the weight of other elements in the system
(shaft, articulated joint, etc.) can be minimized by an optimal
selection of dimensions for each sample being tested, but it is easy
to see that the moment change is within the allowed +/- 3% (SAE
J267) .
Effectively measured values indicate that deviations in the
bending moment occur due to lateral force that appears during the
cycle at the level from 1 to 2% (when testing a wheel of a
commercial vehicle rim size 16“, therefore the torque variation is
5daNm).
Figure 5 shows a schematic drawing of a testing bench used
for examining the impact of the lateral force on the wheel where the
rotation axis is set horizontally. The key elements of the testing
bench are as follows:
1 – electric motor drive
2 – articulated joint
3 – centrifugal weights (F=m*r*ω2)
4 – rotary shaft with bearings
5 – wheel stand
6 – tested wheel
Fig. 5 Schematic drawing of the test bench
When appliying solutions based on the use of the effects of the
centrifugal force, special attention should be paid to safety systems
( see Fig.6) that provide an immediate stoppage in the event of
12

enlargement of diameter in a rotating mass (once the cracking
occurs).
Fig. 6 Position of load weights and automatic shutting down system in the
event of increased amplitudes of oscilation
5. Detailed description of technical solution
As already mentioned, a universal large mass stand on elastic
supports was used (see Fig 7) as a basis for the testing bench. The
wheel itself is positioned over an adequate stand, which is intended
for a nominal wheel diameter of up to 24 ", attached to six points.
Fig. 7 Testing bench for wheel testing complete with measurement-control
unit
Testing device consists of the following below:
Base structure complete with the supporting elements
The basic construction has a purpose to fix the testing objects
(a wheel). At the same time the construction serves as a carrier of
motor drive. The very construction is of a dismantling type,
therefore it is possible to provide transfer and repositioning onto
another location should the need occur.
Measuring and control equipment
The measurement of the bending moment on the wheel is done
by using strain gauges mounted on the rotary shaft (the "half-
bridge" circuit), and whose calibration is performed by
implementation of HBM U1 force transducer (see Fig. 8) that
operates on the weight carrier. The signal is closely monitored,
digitized and stored on a portable computer over the course of
testing bench operation by means of a SK6 slip-ring and "HPSC
3502" amplifier of carrier frequency.
Fig. 8 Calibration of strain gauges in the shaft using HBM force transducer
Figure 9 shows a typical fracture detected over the course of
wheel testing performed on a delivery vehicle of domestic
production.
Fig. 9 Typical fracture on a wheel disk
6. Conclusion
The described testing bench technical solution with horizontal
direction of rotation axis intended for wheel cornering fatigue tests,
meets the requirements of the relevant standards and can be
successfully used for vehicles and trailers wheel testing. It can also
be widely used when testting other wheel elements such as hubs,
shafts, screw connectors, etc.
7. References
[1] Fischer G.,Grubisic V.: Test Equipment for Fatigue Evaluation
of Automotive Wheels, ATZ 84 (1982) 6, pp. 307-316
[2] Naundorf H., Angerer S., Hutmann P.: The Biaxial Wheel Test
Rig, SAE Paper 851633, 1986, pp5.996-5.1005
[3] SAE-J267a : Wheels/Rims – Trucks Test Procedures and
Performance Requirements
[4] Truck and Bus Wheel Dynamic Cornering Fatigue Test
Machine (CFT-5)
http://jiurongwheel.com/Product_Show.asp?ID=144
[5] ZWARP biaxial wheel test machine
www.alpinemetaltech.com/.../zwarp-biaxial-wheel-test.html.
13

DESIGN AND ANALYSIS OF THE PROTECTIVE STRUCTURE OF AN
INTERCITY BUS DURING A ROLLOVER ACCIDENT
M.Sc. Çolak N.1, M.Sc. Şahin U.2, M.Sc2. Candaş A.2, Prof. M.Sc. İmrak C.E. PhD.2
Istanbul Technical University, Graduate School of Science Engineering and Technology, Turkey1
Istanbul Technical University, Faculty of Mechanical Engineering, Turkey2
Abstract: Vehicles, such as buses which are massive and have a very high centre of gravity, they have a lower resistance to overturning
than other vehicles. The studies have shown that deformations can especially occur in the body structure. Some deformations that can occur
in carrier elements during an accident make the vehicle a vital danger area for drivers and passengers. The aim of this study is to examine
the protection of the passengers in the bus by means of constructive developments to be made within the body structure. ECE R66 legal
regulations which are issued by the European Union (EU) and (Economic Commission for Europe Regulation 66- Provisions on the
Approval of Major Passenger Vehicles for Resistance to the Construction of the Skeleton) for the buses were developed to protect
passengers' habitats in overturning accidents. This work focuses to reach constructive solutions for costing, manufacturing and, safety which
provided conditions for the body structure during rollover behaviour of the vehicle. Computer simulations and analysis have been performed
to examine the strength of the cross-section of the body structure. The methods specified in the standard for calculating the rollover
behaviour of the vehicle have been implemented and concluded. The results obtained from all these analyses produced constructive solutions
and optimizations for the design of intercity buses.
Keywords: BUSES, ROLLOVER, ECE R66, DESIGN OPTIMIZATION
1. Introduction
The fact that they have a large mass and that the center of
gravity is located at a very high point on the ground significantly
reduces the resistance of the buses and similar vehicles against
overturning. Especially considering that buses are used for
passenger transportation, it is seen that the loss of life and the
amount of damage that can happen in case of a possible accident are
quite high. Turkey Statistics Institute (TUIK) when the road traffic
accident statistics are examined, it emerges outstanding data related
accidents. For example, in 2013, a total of 1207354 casualties lost
3685 people's lives and 274829 people were injured. When we look
at the distribution of these accidents by vehicle types, it emerges
that 7230 of them were built by buses [1]. Tipping accidents usually
take place in the form of step / roll. The wheel interrupts the lateral
forces that interact with the object to create the stage, causing it to
roll on the axis of that object. Sidewalk edges, ramps, contact with
stones make up 90% of the overturns in this category [2]. It may,
however, follow an accident such as a frontal collision [3].
In this study, a study was carried out to contribute to the
protection of the passengers in a bus by means of constructive
developments to be carried out in the body in case of an accident
that occurred during the overturning and overturning of these
conditions. The carrying elements of the vehicles were subjected to
the overturning test specified in the legal regulation by simulation
and various reinforcements were made in the sidewall columns,
ceiling width wraps, and infrastructural connections in order to
provide the determined living area in the calculation.
2. ECE R66 STANDARD AND DESIGN
REQUIRMENTS
ECE R66 regulation was first published by the United Nations
Economic Commission for Europe in 1986, with the aim of
preventing the consequences of overturning and protecting the
living area of passengers. Many countries take the bus rollover test
as a mandatory certification program of the imported bus, requiring
the superstructure of the bus have sufficient strength [4]. The ECE
R66 regulation has been issued to prevent the consequences of
overturning and to protect the living space of passengers and offers
five ways to detect the superstructure strength when the bus
rollovers: (1) rollover test; (2) rollover test using body sections; (3)
quasi-static loading test of body sections; (4) quasi-static calculation
based on testing of components; (5) computer simulation of rollover
test of complete vehicles [4].
ECE-R66-02, It entered into force on August 19, 2010. The
scope has been expanded to include minibuses (M2). Application to
other vehicles in the M2 and M3 categories (e.g. double-decker bus)
is optional. The requirements of R 66-01 apply. Valid from 9
November 2017 for all vehicles on transit in the class specified in
this standard. TSE ECE R66 was issued by TSE (Turkish Standards
Institute) on 01.01.1996 and TSE ECE R 66
(Revision 1) on 31.12.2008 issued the "Provisions on approval
of large passenger vehicles on the strength of skeleton structure"
standards. However, these standards were removal on 10.08.2016.
Requirements of ECE R66
“The worst situation case” describes the type of vehicle that at
least fulfills the ECE R 66 requirements for superstructure strength
within a vehicle type. The three parameters that define the worst
case are structural strength, reference energy, and residual space.
"Empty vehicle mass" (Mk) is the mass calculated with the weight
of the vehicle in addition to the empty weight of 75 kg, weight of
the fuel tank when 90% full, refrigerant gas, oil, spare wheel if the
vehicle is used. For "total vehicle mass" (Mt) passenger and hostess
weights are added to empty vehicle weight. The weight of the
seated passengers is assumed to be 34 kg, the weight of the standing
passengers is 68 kg, assuming that the seats are connected with the
seat belt.
𝐸𝑅 = 𝑀.𝑔. ℎ1 = 𝑀.𝑔[0.8 + ℎ02 + 𝐵 ± 𝑡 2] (1)
The reference energy is calculated as follows; Figure 1 shows
the starting position of the vehicle, the moment it begins to topple,
and the positions of the final center of gravity. The parameters to be
used in the reference energy calculation are again shown on Figure
1.
Fig. 1 The centre of gravity positions for rollover test in ECE R66 [4].
14

The application methods specified in the standard to calculate
the rollover behavior of the vehicle are as follows (Figure 2). Basic
approval method: Overturn of a completed vehicle under specified
conditions and evaluation of the results. Equivalent validation
method: Tilt test on trunk section, semi-static loading test on trunk
section, semi-static calculation based on component tests, numerical
simulation based on roll-over test the vehicle is placed on the
tipping stand with the suspensions removed and slowly rotated to
the axis of rotation of the stand until the equilibrium equilibrium
point. The test begins with zero angular velocity at the equilibrium
point and the rotation axis will be the wheel ground touch point.
The energy of this vehicle is reference energy given in Eq. 1. The
car is tilted to a dry and flat concrete floor over a step of 800 mm
height.
Fig. 2 Rollover test of a passenger bus.
3. MODELING AND ANALYSIS OF THE
STRUCTURE
The precise criterion for meeting the standard requirements is
the protection of the criterion habitat. At this point; during the
change of shape the bus superstructure carrier elements should be
checked to see if they are attempting to this area which protects the
passengers. The living area is defined between two boundary points
(Figure 3). Reference point for these boundary points; the
intersection of the inner surface of the side wall and the floor. The
upper and lower limit points are determined from this reference
point.
Fig. 3 Living area.
During the pre-processing fillets and small holes have been
deleted in the modeling program (Catia and Siemens NX). After the
profiles' middle surfaces were created, weld relationships were
modeled, material and thickness information were processed and
converted to model "step" (*.stp) file format (Figure 4). LS-DYNA
was used to analyze the structure.
Fig. 4 A model of a three-axle interurban vehicle.
The same outer contour and the same loading direction but
different constructions. In the following figures (Figure 5), three
comparative examples are shown.
Fig. 5 Different profiles of structures after rollover.
The deformations determined in the reference model simulation
are shown in Figure 6.
Fig. 6 Structure deformations.
4. RESULTS AND DISCUSSION
The main goal of the work is to reach constructive solutions for
cost, weight and production optimizations, ensuring safety
conditions within the body. Modeling is done in computer
environment by using the data obtained from experimental studies
focused on section and weight optimization. The methods specified
in the standard were applied and finalized to calculate the rollover
behavior of the vehicle. The results obtained by applying the
rollover test specified in the legal regulations to the vehicle by
simulation are calculated. Through these obtained data, the
possibilities of developing different solutions have been searched
and the protection of the residual space by supporting elements has
been tried to be provided by strengthening the sidewall columns,
roof cross bows and body connections. This results fulfill both ECE
R66 requirements and keep weight increase on vehicle below the
targeted level.
Below are examples (Figure 7) of retrofit studies made on a 14
m long 4 m high 3-axle intercity vehicle. Considering the standard
requirements 30, the substructure is considered to be rigid. Vehicle
weight is calculated with 50 passengers.
Fig. 7 a) Base model b) Reference deformation model.
Considering the weight and dimensions in the selection of the
vehicle to be calculated, a three-axis interurban vehicle was first
modeled and reinforcement studies were carried out on the
reference model to produce solutions that would protect the living
area in case of overturning (Figure 8).
15

Fig. 8 The effects of different connection points, cross section and material
change.
The explanations for Figure 8 are as follows:
a) Additional triangular reinforcement piece in podest and side wall
connection
b) Use of high strength steel S500 MC in side wall pillar
c) 70x30x2 curved support pieces between the ceiling sidewall
d) Side wall column between bottom of window and top of luggage
6 mm wall thickness
e) Side wall column between bottom of window and top of luggage
6 mm wall thickness + 2 mm bottom triangular reinforcements
f) Side-wall column between the bottom of the window and the top
of the luggage.
g) 6 mm sheet metal support in the side wall pipe
h) Cast parts connections
i) 8 mm thick casting pipe piece on the side wall
j) t reinforcement piece in the glassy tube
k) Side wall - podest under coupling pipes
l) 8 mm die casting on the side wall.
Energy time graph of the profiles in different cross sections
shown in Figure 9. When evaluated the 60x50x4 mm sections
shown in V19 of the circles with side wall column sections of
70x40x3 mm and 60x50x3 mm used in the reference model show
about 40% less energy damped.
Fig. 9 Deformation behaviors under load of pipes in different sections.
Examination of an intercity vehicle, it was observed that the
first overturn test was not able to pass the test and reinforcement
measures were investigated (Figure 10).
Fig. 10 The overturn test was not able to pass the test in some sections.
U-profilers (S590 MC 5mm) were placed on both sides of the
column first to prevent interference in column 7 (Figure 11).
Fig. 11 U profiles
16

In addition to the U-profiles, the sheet pieces shown in Figure 11,
V8 (6 mm - S420) are added to the 7th column. Column 8 is
reinforced with 4 mm sheet metal parts in the rear skeleton roof
joint and 2 mm composite sheet under the glass (Figure 12).
Fig. 12 The reinforced U profiles.
U-Profiler S 420 has been replaced with 6 mm sheets of steel
and V8 parts have been canceled during the optimization work for
manufacturing.
5. CONCLUSION
As a result of all these experimental studies, constructive solutions
were produced with the data obtained. The results and optimizations
obtained by applying all reinforcements to the vehicles are shown.
In this way, solutions can be produced to contribute to the
protection of passengers in buses resulting from rollover accidents.
12 different designs applied to the safety circle were analyzed
and energy fading rates were taken as evaluation criterion. The
different materials and sections were compared, the most suitable
options were determined in terms of the amount of elasticity energy
provided and the amount of additional weight added.
The applications in the vehicle safety circle were extended to
two different intercity buses, and after the standard requirements
were met, optimizations were made to ease manufacturing and
reduce weight. At the end of the study, both the ECE R66
requirements and the vehicle weight difference were kept below the
targeted 200 kg level.
5. REFERENCES
[1] Trafik kaza istatistikleri: karayolu 2013. (2014). Ankara,
Türkiye İstatistik Kurumu.
[2] Rahman, M. K., Johari, M. H., Abu Kassım, K., A. &
Wong, S. V. (2011). Body section analysis in bus rollover
simulation, Journal of the Eastern Asia Society for Transportation
Studies, 23, (Vol. 9, pp.1967-81). doi: 10.1007/s12206-009-0731-7.
[3] Martinez, L., Aparicio, F., Garcia, A., Paez, J.,
Ferichola, G. (2003), Improving occupant safety in coach rollover,
Internationa journal of crashworthiness, vol.8, no 2, pp. 121-132
[4] ECE-Regulation 66 Revision 1 (2006) Uniform provisions
concerning the approval of large passenger vehicles with regard to
the strength of their superstructure Corr.3, 13 June 2007, Amend.
02, 19 August 2010, United Nations Economic Commition for
Europe
17

О КЛИНОВОМ СОПРЯЖЕНИИ ВО ВРАЩАТЕЛЬНОЙ КИНЕМАТИЧЕСКОЙ ПАРЕ
ABOUT WEDGE CONJUGATION IN THE TURNING PAIR
Assoc. Prof., Dr.Sc.(Eng.) Sharkov O.V., Prof., Dr.Sc.(Eng.) Koryagin S.I., Prof., Dr.Sc.(Eng.) Velikanov N.L.
Immanuel Kant Baltic Federal University – Russia, Kaliningrad [email protected], [email protected], [email protected]
Abstract: The possibility of obtaining the reduced friction coefficient in the turning pair with cylindrical working surfaces is considered in the article. Theoretical dependences are obtained to determine the value of the reduced friction coefficient, realized in conjugation of run-in cylindrical surfaces for different laws of distribution of pressure: cosine, parabolic and elliptical. It is shown that the smallest discrepancy between the theoretical and experimental values of the reduced friction coefficients is observed for the cosine law of pressure distribution over cylindrical surfaces. It was experimentally confirmed that that the value of the reduced friction coefficient in the proposed type of turning pair increases by 2.5...5.0 times in comparison with the actual sliding friction coefficient.
Keywords: KINEMATIC PAIR, REDUCED FRICTION COEFFICIENT, FRICTION DRIVE
1. Введение Передачи нагрузки силами трения широко применяется в
различных механических устройствах: ременных передачах [1–7]; механизмах свободного хода [2, 8–11]; фрикционных тормозах [12–16] и др. Нагрузочная способность таких устройств определяется величиной силы трения, возникающей в контакте их рабочих поверхностей.
Для увеличения силы трения можно придавать контактирующим поверхностям специальную форму. Например, выполнять желоб клиновой (рис. 1,а) или цилиндрической формы (рис. 1,б). В этом случае, за счет клинового сопряжения рабочих поверхностей, будет реализовываться приведенный коэффициент трения, который определяется соответственно по формулам [1, 2, 17, 18]
α=∗
sinff , (1)
ffπ
=∗ 4 , (2)
где f – действительный коэффициент трения; α – половина угла при вершине призмы.
Рис. 1. Возможные типы сопряжения контактирующих трущихся поверхностей.
Однако в ряде случаев, например, в механизмах свободного
хода, такое конструктивное решение усложняет технологию изготовления и монтажа, а также увеличивает потери на трение в период свободного хода, из-за постоянного контакта их рабочих поверхностей.
Предлагается получить эффект клинового сопряжения более простым и технологическим способом во вращательной кинематической паре, элементы которой контактируют по гладким цилиндрическим поверхностям.
В этом случае использование формул (1) или (2) будет некорректно. Получим формулу для определения приведенного коэффициента трения в предлагаемой кинематической паре.
2. Расчетная схема и математическая модель Рассмотрим вращательную кинематическую пару (рис. 2),
образованную внешним кольцом 1 с внутренней цилиндрической поверхностью и внутренним кольцом 2, выполненным с дуговыми выступами 3 и 4 на внешней цилиндрической поверхности, расположенными под углом α . Тогда контактирование в такой кинематической паре происходит по поверхностям дуговых выступов.
Рис. 2. Расчетная схема кинематической пары.
В общем случае на внутреннее кольцо действует нагрузки в
виде силы прижатия RF и давления )(ϕp . Под действием этих нагрузок кольцо находится в равновесии.
Выделим элементарную площадку на поверхности контакта внешней обоймы и кольца
ϕ= lrdds , (3)
где l – длина поверхности контакта; r – радиус поверхности контакта.
Элементарная сила нормального давления на элементе ds , с учетом выражения (3) определяется как
ϕϕ=ϕ= dlrpdspdFN )()( , (4)
где )(ϕp – функция, характеризующая закон распределения давления на поверхности контакта.
Элементарная сила трения на элементе ds , с учетом выражения (3), определяется как
ϕϕ== dflrpfdFdF NT )( . (5)
18

Выражение для определения результирующей силы нормального давления можно найти из условия равновесия кольца
∫
π
α−π
ϕϕϕ==2
2
cos)(2 dplrFF RN . (6)
Выражение для определения результирующей силы трения можно записать как
∫
π
α−π
ϕϕ=2
2
)(2 dpflrFT . (7)
Тогда приведенный коэффициент трения в такой кинематической паре можно определить как
N
T
FFf =∗ . (8)
Из выражений (6) и (7) видно, что функция )(ϕp оказывает существенное влияние на величину приведенного коэффициента трения.
С достаточной для практических расчетов точностью характер распределения давления для приработавшихся цилиндрических поверхностей можно аппроксимировать несколькими типами зависимостей: косинусоидальной; параболической; эллиптической [1, 2, 16–18]. Получены формулы для определения приведенного коэффициента трения для этих законов распределения давления (табл. 1).
Таблица 1: Зависимости для определения приведенного коэффициента трения.
Закон распределения давления Формула
Косинусоидальный ϕ=ϕ cos)( maxpp α−α
α−=∗
2sin2)cos1(4 ff (9)
Параболический
ϕ=ϕ 2max cos)( pp α+α⋅−
α−α=∗
3coscos32)2sin2(75.0 ff (10)
Эллиптический
2
2
max41)(πϕ
−=ϕ pp 234.149.1061.0
)2(
α+α+
α+π=∗ f
f (11)
Корректность выбора характера распределения давления
необходимо проверять экспериментально.
3. Экспериментальная проверка теоретических положений
Проведено экспериментальное исследование приведенных коэффициентов трения в предлагаемой кинематической паре для получения их опытных величин и проверки достоверности полученных формул (9)–(11).
Исследования приведенных коэффициентов трения скольжения проводили на специально разработанной экспериментальной установке.
Экспериментальная установка (рис. 3) состоит из электродвигателя 1, соединенного клиноременной передачей 2 с валом 3. На валу 3 установлена испытательная головка 4, в которой при помощи кинематической пары, состоящей из цилиндрической втулки 5 и полукольца 6, выполненного с радиальными дуговыми выступами, расположенными под углом α , создается эффект клинового сопряжения.
Испытательная головка 4 установлена на шарикоподшипниках и может свободно поворачиваться относительно вала 3.
Нагружение полукольца радиальной силой RF осуществляется с помощью винта 7. При этом возникающий в кинематической паре втулка-полукольцо момент сил трения
TT поворачивает корпус испытательной головки, и закрепленная на нем штанга 8 действует на тензорезисторный силоизмеритель 9. Величина радиальной силы RF измеряется тензорезисторным силоизмерителем 10.
Рис. 3. Кинематическая схема экспериментальной установки.
Способ измерения силы RF и момента трения TT с
помощью тензорезисторных силоизмерителей был выбран как наиболее удобный.
Тензорезисторные силоизмерители предварительно тарировали при помощи динамометрического кольца и индикатора часового типа (цена деления 0.002 мм) для получения зависимости выходного сигнала от величины действующей силы.
Для регистрации сигнала тензорезисторных силоизмерителей применяли регистрирующую аппаратуру – тензометрический усилитель и измерительный блок с микроамперметром.
При проведении эксперимента была использована втулка, одно полукольцо с гладкой цилиндрической поверхностью α =90º и полукольца с углами α = 15º, 25º и 35º. Радиус сопряжения поверхностей втулки и полукольца r =28 мм, длина сопряжения l =10 мм. Экспериментальные образцы втулки и полуколец были изготовлены из материала сталь 14NiCr10 с последующей термообработкой до 58...62 HRC..
Эксперименты проводились в условии смазки маслом SAE30, при установившемся тепловом режиме с температурой масла t = (55±5) oC и скорости скольжения v = 2 м/с.
В качестве исследуемого фактора принимали приведенный коэффициент трения скольжения ∗f , в качестве независимого
фактора – среднее контактное давление mp . Перед проведением экспериментальных измерений все
образцы проходили приработку под нагрузкой mp = 0.5 МПа в течение 15 часов.
В процессе эксперимента применяли метод ступенчатого нагружения полукольца давлением от mp =0.5 до 5.5 МПа
через 1 МПа и измеряли момент сил трения TT в паре сопряжения. Нагружение проводили до критической величины давления, при которой появлялись признаки заедания.
Экспериментальные значения приведенных коэффициентов трения находили по формуле
19

R
T
rFTf =∗ . (12)
4. Экспериментальные результаты
На рис. 4 показаны графики зависимости приведенного коэффициента трения ∗f от контурного давления mp и углов α для приработавшихся поверхностей при эллиптическом, косинусоидальном и параболическом законах распределения давления по дуговым выступам.
Сплошные и пунктирные линии соответствуют теоретическим значениям, полученным на основании формул (9)–(11), где f принимался по результатам опытов полукольца с гладкой цилиндрической поверхностью.
Рис. 4. Зависимость приведенного коэффициента трения от контактного давления для α =15º ( ), α =25º( ∆ ) и α =35º ( О )
Анализ полученных результатов показывает достаточно
хорошее качественное и количественное совпадение экспериментальных и теоретических значений приведенного коэффициента трения.
Количественная оценка величин экспериментальных и теоретических значений приведенного коэффициента трения, проводилась с применение метода наименьших квадратов и их относительной погрешности
На основании результатов количественной оценки можно сделать вывод, что наименьшее расхождение теоретических и экспериментальных значений ∗f наблюдается при косинусоидальном и параболическом законах распределения давления по дуговым выступам, для которых относительная погрешность соответственно находится в диапазоне 1.1...15 % и 0.5...17.7 %.
5. Выводы Теоретически обоснована и экспериментально
подтверждена возможность получения эффект клинового сопряжения простым и технологическим способом – в контакте гладких цилиндрических поверхностей.
На основании анализа теоретических и экспериментальных значений приведенных коэффициентов трения определено, что их наименьшее расхождение наблюдается при косинусоидальном и параболическом законах распределения давления по дуговым выступам. Окончательно выбираем косинусоидальный закон распределения давления, т.к. в этом случае ни для одной точки относительная погрешность не превышает 15%, и, кроме того, он описывает распределение давления в простой аналитической форме.
Показано, что использование такого эффекта для пары трения «сталь-сталь» с действительным коэффициентом трения f =0.04…0.05 [1, 2, 17, 18] величина приведенного коэффициента трения увеличивается в 2.5…5.0 раз и может составлять ∗f =0.10…0.25.
6. Литература [1] Stolarski T.A. Tribology in Machine Design. Amsterdam:
Elsevier, 2016. 310 p. [2] Neale M.J. The tribology handbook. Oxford: Butterworth-
Heinemann, 1996. 640 p. [3] Богданович П.Н., Прушак В.Я. Трение и износ в
машинах. Мн.: Высшая школа, 1999. 374 с. [4] Ovchinnikov A.S., Ryadnov A.I., Fedorova O.A., Fomin
S.D., Sharipov R.V. Evaluation of reliability of sorghum harvester. ARPN Journal of Engineering and Applied Sciences, 2017. No12(7) P. 2277–2284.
[5] Dukkipati R.V., Qie G., Zhu J., Qatu M. Vibrations and instability in automotive front end accessory drive belt system. SAE International Journal of Passenger Cars - Mechanical Systems, 2009. Vol.2. No1. P. 1222–1236.
[6] Пожбелко В.И. Расчет предельных тяговых показателей и оптимальных габаритных параметров плоско-, кругло- и клиноременных передач. Вестник машиностроения, 2015. 4. С. 20–24.
[7] Чупрынин Ю.В., Рехлицкий О.В., Калиновский А.А. Сравнительный анализ предельной тяговой способности клиноременных передач с различными способами натяжения ремня, применяемых в сельскохозяйственном машиностроении. Механика машин, механизмов и материалов, 2015. 4(33). С. 36–41.
[8] Mammono G.S., Dragoni E. Modelling and Validation of a Rotary Motor Combining Shape Memory Wires and Overrunning Clutches. ASME Proceedings: Modeling, Simulation and Control of Adaptive Systems. No SMASIS2014-7406.
[9] Aliukov S., Keller A., Alyukov A. Dynamics of Overrunning Clutches of Relay Type. SAE Technical Paper 2015-01-1130.
[10] Гончаров А.А. Расчет предельных нагрузок на самотормозящиеся клиновые механизмы свободного хода. Вестник машиностроения, 2017. 10. С. 3–9.
[11] Попов А.В. Анализ распределения напряжений в механизме свободного хода клинового типа повышенной нагрузочной способности. Известия Волгоградского государственного технического университета, 2015. 8(168). С. 110–112.
[12] Kang J., Krousgrill C.M., Sadeghi F. Comprehensive stability analysis of disc brake vibrations including gyroscopic, negative friction slope and mode-coupling mechanisms. Journal of Sound and Vibration, 2009. Vol. 324. No 1–2. P. 387–407.
[13] Orłowicz A.W., Mróz M., Wnuk G., Markowska O., Homik W., Kolbusz B. Coefficient of friction of a brake disc-brake pad friction couple. Archives of Foundry Engineering, 2016. Vol. 16. No 4. P. 196–200.
[14] Осенин Ю.Ю., Соснов И.И., Сергиенко О.В., Чесноков А.В., Осенин Ю.И., Доума М.А. Повышение коэффициента трения дискового тормоза подвижного состава путем жидкостного охлаждения его фрикционных элементов. Трение и износ, 2016. Т.37. 6. С. 677–684.
[15] Мамити Г.И., Кочиев З.Т. Определение момента трения дискового тормоза (функциональный расчёт). Труды НАМИ, 2017. 3(270). С. 61–65.
[16] Шарков О.В., Корягин С.И. Определение приведённого коэффициента трения в контакте рабочих поверхностей барабанных тормозов. Автомобильная промышленность, 2017. 8. С. 14–17.
[17] Дроздов Ю.Н., Юдин Е.Г., Белов А.И. Прикладная трибология (трение, износ, смазка в технических системах). Москва: Эко-Пресс, 2010. 604 с.
[18] Мышкин Н.К., Петроковец М.И. Трение, смазка, износ. Физические основы и технические приложения трибологии. Москва: Физматлит, 2007. 367 с.
20

THE METHOD OF NUMERICAL MODELING OF HYDRODYNAMICS AND HEAT
EXCHANGE IN A CHANNEL WITH DISCRETE ROUGHNESS
МЕТОДИКА ЧИСЛЕННОГО МОДЕЛИРОВАНИЯ ГИДРОДИНАМИКИ И ТЕПЛООБМЕНА В КАНАЛЕ
С ДИСКРЕТНОЙ ШЕРОХОВАТОСТЬЮ
Dr.sc.ing. Sidenko N., Dr. sc.ing. hab. prof. Dzelzitis E.
Riga Technical University, Faculty of Civil Engineering, Institute of Heat, Gas and Water Technology.
[email protected], [email protected]
Abstract: Basic methodology has been developed for a numerical modeling and heat exchange in a smooth channel and in a channel with a
discrete roughness in the form of semispherical dimples. The methodology provides a possibility of computerized parametric calculations
that adequately enough model the examined physical phenomena and allow to determine their characteristics being of practical interest. The
efficiency of the examined discretely rough surface was estimated based on the coefficients of heat transfer and hydraulic resistance.
KEYWORDS: HEAT TRANSFER ENHANCEMENT, DISCRETE ROUGHNESS, COMPUTER MODELING, NUMERICAL CALCULATION.
1. Introduction
In modern heat-and-power devices based on alternative energy
sources, heat-exchange equipment is mainly a major part and
largely determines their overall technical and economic indicators.
And in the future, one of the main ways to increase the efficiency of
heat-and-power devices is to improve the heat exchange equipment,
which can be realized by introducing the efficient methods of
enhancing the heat transfer.
By means of heat transfer enhancement, the amount of heat
transferred through a unit of the heat exchange surface increases,
and a more favorable ratio between the transmitted heat quantity
and the heat coolant pumping capacity is achieved.
For industrial use, the most promising is the heat transfer
enhancement in the channels due to the artificial discrete roughness
of the wall.
But the issue of the intensification and efficiency of this method
remains open, since there is a little knowledge of the mechanism of
these processes and changes, in particular for reliable calculation of
the heat exchange and hydraulic losses therein, which are necessary
for the design of power devices.
Therefore, the study of the processes of heat exchange and
hydrodynamics of heat coolants in channels with discrete roughness
and the development of a method for calculating them represent an
actual task for the engineering practice.
The purpose of the present work is to develop a basic
methodology for a computer modeling and numerical calculation of
hydrothermodynamic parameters in a channel with discrete
roughness in the form of spherical dimples.
2. Prerequisites and means for solving the problem
In recent years, interest has increased in the study of heat exchange
and flow structure in channels in the presence of depressions in the
form of hemispheres (dimples). It is explained by the fact that the
dimples have proved to be an efficient intensifier of heat transfer
when they are flown around [1]. Studies of the flow in channels
with intensifiers in the form of dimples were examined in works [2-
5].
In a number of works, it has been experimentally established
that heat exchange surfaces with spherical depressions allow a
significant increase (by 1.5-4.5 times) in heat exchange at a
moderate growth in the hydraulic resistance. And at this stage, it is
an efficient way of intensification from the standpoint of the ratio in
the increments of heat transfer and hydraulic resistance.
The thermohydraulic characteristics of surfaces formed by spherical
depressions depend on the shape of the dimples (with sharp edges
or smooth outlines), their density on the surface, the longitudinal
and transverse spacing of the dimples, their relative depth, the
relative height of the channel. In addition to these parameters, the
relative location of the dimples on adjacent channel surfaces has a
considerable impact on the hydraulic resistance and heat transfer in
heat exchangers.
At present time, no complete clarity exists about the ratios
between the coefficients of heat transfer Nu2/Nu1 and resistance
ξ2/ξ1 for surfaces with dimples [6].
In this paper, an attempt is made to perfect the basic methodology
for numerical modeling of hydrodynamics and heat transfer in a
channel with discrete roughness in the form of hemispherical
dimples with a sharp entry edge.
The main phases of the basic methodology for the numerical
solution of the problem under consideration can be represented as
follows:
Physical formulation of the study task.
Development of a simplified model of the initial study
subject.
Construction of the geometric electronic model of the subject.
Mathematical formulation of the problem, boundary and
initial conditions.
Selection of necessary CAD/CAE programs.
Creation of a discrete calculation model, optimization of the
computational grid.
Development of a strategy for solution of the task:
• formulation of calculation purposes and criteria for
completion of the calculation;
• methodology for monitoring and control of the calculation
process;
• technique for data visualization and processing of digital
calculation data.
Solution of check problems, comparison with known data,
evaluation of the accuracy of solutions obtained.
Interpretation of calculation data in order to optimize the
properties of the subject under study.
The developed methodology should provide the possibility of
computer parametric calculations that adequately simulate the
examined physical phenomena and allow to determine their
characteristics being of interest in practice.
The verification of the developed method for calculation of the
coefficients of heat transfer and hydraulic resistance was carried out
under forced turbulent flow of cold liquid (water) in smooth and
discretely rough channels (pipes) with a relative length L/d > 50.
Aluminum pipe walls were heated up to a certain constant
temperature.
Computer modeling was performed using the selected package
of CAD/CFD programs SolidWorks/FlowSimulation. The complete
system of Navier-Stokes equations and the energy equation were
solved using the k-ε model of turbulence.
The velocity at the entrance to the channel varied within the
Vinlet range 0.3 m/s and 1 m/s. With the initial Reynolds numbers
21
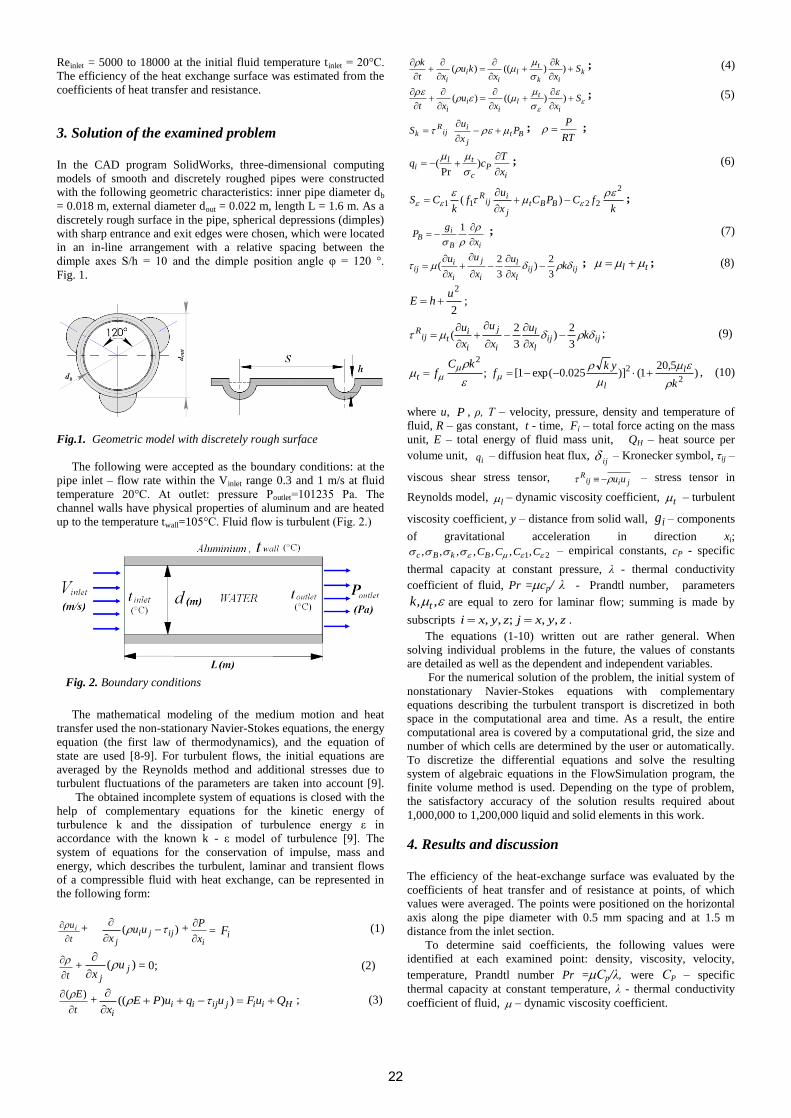
Reinlet = 5000 to 18000 at the initial fluid temperature tinlet = 20°C.
The efficiency of the heat exchange surface was estimated from the
coefficients of heat transfer and resistance.
3. Solution of the examined problem
In the CAD program SolidWorks, three-dimensional computing
models of smooth and discretely roughed pipes were constructed
with the following geometric characteristics: inner pipe diameter db
= 0.018 m, external diameter dout = 0.022 m, length L = 1.6 m. As a
discretely rough surface in the pipe, spherical depressions (dimples)
with sharp entrance and exit edges were chosen, which were located
in an in-line arrangement with a relative spacing between the
dimple axes S/h = 10 and the dimple position angle φ = 120 °.
Fig. 1.
Fig.1. Geometric model with discretely rough surface
The following were accepted as the boundary conditions: at the
pipe inlet – flow rate within the Vinlet range 0.3 and 1 m/s at fluid
temperature 20°С. At outlet: pressure Рoutlet=101235 Ра. The
channel walls have physical properties of aluminum and are heated
up to the temperature twall=105°С. Fluid flow is turbulent (Fig. 2.)
Fig. 2. Boundary conditions
The mathematical modeling of the medium motion and heat
transfer used the non-stationary Navier-Stokes equations, the energy
equation (the first law of thermodynamics), and the equation of
state are used [8-9]. For turbulent flows, the initial equations are
averaged by the Reynolds method and additional stresses due to
turbulent fluctuations of the parameters are taken into account [9].
The obtained incomplete system of equations is closed with the
help of complementary equations for the kinetic energy of
turbulence k and the dissipation of turbulence energy ε in
accordance with the known k - ε model of turbulence [9]. The
system of equations for the conservation of impulse, mass and
energy, which describes the turbulent, laminar and transient flows
of a compressible fluid with heat exchange, can be represented in
the following form:
t
u i
+ )( ijjij
uux
+
ix
PiF (1)
t
+ )( j
j
ux
= 0; (2)
t
E
)(+ Hiijijii
i
QuFuquPEx
))(( ; (3)
kik
tl
ii
i
Sx
k
xku
xt
k
))(()(
; (4)
S
xxu
xt i
tl
ii
i
))(()( ; (5)
Btj
iij
Rk P
x
uS
;
RT
P ;
iP
c
tli
x
Tcq
)
Pr(
; (6)
kfCPC
x
uf
kCS BBt
j
iij
R2
2211 )(
;
iB
iB
x
gP
1 ; (7)
ijijl
l
i
j
i
iij k
x
u
x
u
x
u
3
2)
3
2(
; tl ; (8)
2
2uhE ;
ijijl
l
i
j
i
itij
R kx
u
x
u
x
u
3
2)
3
2(
; (9)
;
2
kCft )
5,201()]025.0exp(1[
2
2
k
ykf l
l
, (10)
where u, P , ρ, T – velocity, pressure, density and temperature of
fluid, R – gas constant, t - time, Fi – total force acting on the mass
unit, E – total energy of fluid mass unit, QH – heat source per
volume unit, iq – diffusion heat flux,
ij – Kronecker symbol, τij –
viscous shear stress tensor, jiij
R uu – stress tensor in
Reynolds model, l – dynamic viscosity coefficient, t – turbulent
viscosity coefficient, y – distance from solid wall, ig – components
of gravitational acceleration in direction xi;
21,,,,,,, CCCCBkBc – empirical constants, сP - specific
thermal capacity at constant pressure, λ - thermal conductivity
coefficient of fluid, Pr =сp/ λ - Prandtl number, parameters
,, tk are equal to zero for laminar flow; summing is made by
subscripts zyxjzyxi ,,;,, .
The equations (1-10) written out are rather general. When
solving individual problems in the future, the values of constants
are detailed as well as the dependent and independent variables.
For the numerical solution of the problem, the initial system of
nonstationary Navier-Stokes equations with complementary
equations describing the turbulent transport is discretized in both
space in the computational area and time. As a result, the entire
computational area is covered by a computational grid, the size and
number of which cells are determined by the user or automatically.
To discretize the differential equations and solve the resulting
system of algebraic equations in the FlowSimulation program, the
finite volume method is used. Depending on the type of problem,
the satisfactory accuracy of the solution results required about
1,000,000 to 1,200,000 liquid and solid elements in this work.
4. Results and discussion
The efficiency of the heat-exchange surface was evaluated by the
coefficients of heat transfer and of resistance at points, of which
values were averaged. The points were positioned on the horizontal
axis along the pipe diameter with 0.5 mm spacing and at 1.5 m
distance from the inlet section.
To determine said coefficients, the following values were
identified at each examined point: density, viscosity, velocity,
temperature, Prandtl number Pr =Сp/λ, were СP – specific
thermal capacity at constant temperature, λ - thermal conductivity
coefficient of fluid, – dynamic viscosity coefficient.
22

Based on the results of the numerical calculation, the Reynolds
number (Re) at the examined points was calculated from the known
dependence [11]:
2,1
02,12,1Re
dV (11)
where Re - Reynolds number, d – equivalent pipe diameter
(m), V0 – mean velocity of fluid flow (m/s), 1,2 – dynamic
viscosity coefficient (Pa*s) , ρ1,2 – flow density (kg/m^3),
subscripts throughout the paper have the following meaning: 1 -
smooth, 2 – discretely rough (tubes).
The result has demonstrated that for mean flow velocities in the
examined range Vinlet= 0,3-1 m/s the Reynolds numbers Re2 in a
discretely rough pipe in relation to a smooth one grow
approximately by 10-20%. Dependence of Reynolds numbers Re1,
Re2 on the mean flow velocities Vinlet m/s for the examined channels
is shown on Fig. 4. Variation of number Re2 value at the examined points is
associated with the increase of temperature Т2°С in a discretely
rough channel in comparison with temperature Т1°С in a smooth
pipe (Т2°С)>(Т1°С). Accordingly, temperature variation is
accompanied by changes in physical properties of fluid, such as
density and viscosity, which are included in the nondimensional
velocity parameter Re. Variation of the mean flow velocity V0 at the
examined points compared to the mean initial velocity Vinlet Was
also taken into consideration. Dependence diagrams of outlet
temperature Т1, Т2 versus mean flow velocity in a channel Vinlet are
shown on Fig. 3.
T(Vinlet)
0
10
20
30
40
50
60
70
0,2 0,3 0,4 0,5 0,6 0,7 0,8 0,9 1 1,1
Vinlet
T
T1(V inlet) T2(V inlet)
Fig. 3. Dependence diagrams of temperature Т°С on mean velocity
Vinlet m/s of flows Т1 (Vinlet) и Т2(Vinlet).
Re(Vinlet)
0
5000
10000
15000
20000
25000
30000
35000
40000
0,2
0,3
0,4
0,5
0,6
0,7
0,8
0,9 1
1,1
Vinlet
Re
Re1(V inlet) Re2(V inlet)
Fig. 4. Dependence diagram of Reynolds numbers Re1, Re2 on
mean flow velocities Vinlet m/s for smooth and discretely rough tube.
Validity check of solution of the problem under consideration
was carried out by comparison of theoretical solution [7, 10, 11] to
the results of numerical experiment with use of dependencies (12,
13).
2,1
25,0
Pr
PrPrRe021,0 43,08,0
2,1
wall
waterwaterwaterNu (12)
where, Nu1 – heat transfer coefficient for a smooth channel, Nu2
– for a discretely rough channel, Pr – Prandtl number.
ε1 – correction for the initial flow section for a smooth pipe, of
which value is equal to 1 at L/d >50.
ε2 – correction taking into account the growth in the heat transfer
coefficient as a consequence of artificial roughness:
hs
hsf
opt
water /
)/(85.0expPr04,1 04,0
2 (13)
where opt
h
s
h
s
opths
hs
h
sf
)/(
/
where s – distance between axes of dimples, h – inner radius of dimple (Fig. 1), (s/h)opt=13±1
Nu(Re2/Re1)
0
20
40
60
80
100
120
140
160
180
200
1,0
9
1,1
1,1
1
1,1
2
1,1
3
1,1
4
1,1
5
1,1
6
1,1
7
1,1
8
1,1
9
1,2
1,2
1
1,2
2
1,2
3
Nu t Nu1 Nu2 (Re2/Re1)
Nu
Fig. 5. Dependence of Nusselt number Nu on relative Reynolds
number without correction ε. Nut – theory, Nu1 – numerical
calculation (smooth channel), Nu2 – numerical calculation
(discretely rough channel).
Comparison between the results of theoretical solution and
numerical calculation for a smooth channel has demonstrated a
satisfactory matching not exceeding the allowable range 5-10%.
In case of discretely rough channel at Reynolds numbers
Re2/Re1 =1.1-1.2, which corresponds to the flow velocity range V=
0.3-1 m/s, physical properties of medium included in the left-hand
member of equation (12) do not have a significant impact on the
value of number Nu2.
Dependencies of numbers Nu on the relative Reynolds number
Re2/Re1 for the examined channels are shown on Fig. 5.
Nu2/Nu1(Re2/Re1)
1
1,11,2
1,3
1,41,5
1,6
1,71,8
1,9
22,1
2,2
2,32,4
2,5
1,1
1,1
1
1,1
2
1,1
3
1,1
4
1,1
5
1,1
6
1,1
7
1,1
8
1,1
9
1,2
1,2
1
1,2
2
1,2
3
Re2/Re1
Nu2/Nu1
Nu2/Nu(Re2/Re1)
Fig. 6. Dependence of relative numbers Nu2/Nu1 on Reynolds
number Re2/Re1.
23
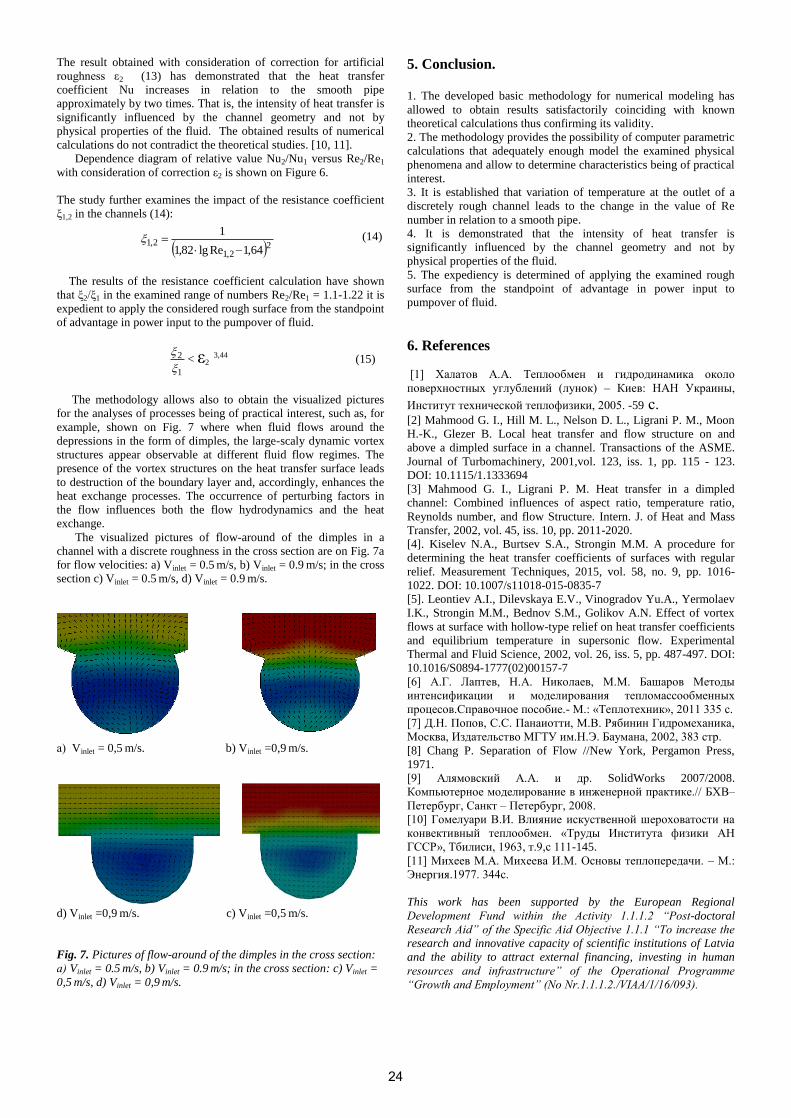
The result obtained with consideration of correction for artificial
roughness ε2 (13) has demonstrated that the heat transfer
coefficient Nu increases in relation to the smooth pipe
approximately by two times. That is, the intensity of heat transfer is
significantly influenced by the channel geometry and not by
physical properties of the fluid. The obtained results of numerical
calculations do not contradict the theoretical studies. [10, 11].
Dependence diagram of relative value Nu2/Nu1 versus Re2/Re1
with consideration of correction ε2 is shown on Figure 6.
The study further examines the impact of the resistance coefficient
ξ1,2 in the channels (14):
22,1
2,164,1Relg82,1
1
(14)
The results of the resistance coefficient calculation have shown
that ξ2/ξ1 in the examined range of numbers Re2/Re1 = 1.1-1.22 it is
expedient to apply the considered rough surface from the standpoint
of advantage in power input to the pumpover of fluid.
1
2
< ε2 3,44 (15)
The methodology allows also to obtain the visualized pictures
for the analyses of processes being of practical interest, such as, for
example, shown on Fig. 7 where when fluid flows around the
depressions in the form of dimples, the large-scaly dynamic vortex
structures appear observable at different fluid flow regimes. The
presence of the vortex structures on the heat transfer surface leads
to destruction of the boundary layer and, accordingly, enhances the
heat exchange processes. The occurrence of perturbing factors in
the flow influences both the flow hydrodynamics and the heat
exchange.
The visualized pictures of flow-around of the dimples in a
channel with a discrete roughness in the cross section are on Fig. 7a
for flow velocities: a) Vinlet = 0.5 m/s, b) Vinlet = 0.9 m/s; in the cross
section c) Vinlet = 0.5 m/s, d) Vinlet = 0.9 m/s.
а) Vinlet = 0,5 m/s. b) Vinlet =0,9 m/s.
d) Vinlet =0,9 m/s. c) Vinlet =0,5 m/s.
Fig. 7. Pictures of flow-around of the dimples in the cross section:
а) Vinlet = 0.5 m/s, b) Vinlet = 0.9 m/s; in the cross section: c) Vinlet =
0,5 m/s, d) Vinlet = 0,9 m/s.
5. Conclusion.
1. The developed basic methodology for numerical modeling has
allowed to obtain results satisfactorily coinciding with known
theoretical calculations thus confirming its validity.
2. The methodology provides the possibility of computer parametric
calculations that adequately enough model the examined physical
phenomena and allow to determine characteristics being of practical
interest.
3. It is established that variation of temperature at the outlet of a
discretely rough channel leads to the change in the value of Re
number in relation to a smooth pipe.
4. It is demonstrated that the intensity of heat transfer is
significantly influenced by the channel geometry and not by
physical properties of the fluid.
5. The expediency is determined of applying the examined rough
surface from the standpoint of advantage in power input to
pumpover of fluid.
6. References
[1] Халатов А.А. Теплообмен и гидродинамика около
поверхностных углублений (лунок) – Киев: НАН Украины,
Институт технической теплофизики, 2005. -59 с. [2] Mahmood G. I., Hill M. L., Nelson D. L., Ligrani P. M., Moon
H.-K., Glezer B. Local heat transfer and flow structure on and
above a dimpled surface in a channel. Transactions of the ASME.
Journal of Turbomachinery, 2001,vol. 123, iss. 1, pp. 115 - 123.
DOI: 10.1115/1.1333694
[3] Mahmood G. I., Ligrani P. M. Heat transfer in a dimpled
channel: Combined influences of aspect ratio, temperature ratio,
Reynolds number, and flow Structure. Intern. J. of Heat and Mass
Transfer, 2002, vol. 45, iss. 10, pp. 2011-2020.
[4]. Kiselev N.A., Burtsev S.A., Strongin M.M. A procedure for
determining the heat transfer coefficients of surfaces with regular
relief. Measurement Techniques, 2015, vol. 58, no. 9, pp. 1016-
1022. DOI: 10.1007/s11018-015-0835-7
[5]. Leontiev A.I., Dilevskaya E.V., Vinogradov Yu.A., Yermolaev
I.K., Strongin M.M., Bednov S.M., Golikov A.N. Effect of vortex
flows at surface with hollow-type relief on heat transfer coefficients
and equilibrium temperature in supersonic flow. Experimental
Thermal and Fluid Science, 2002, vol. 26, iss. 5, pp. 487-497. DOI:
10.1016/S0894-1777(02)00157-7
[6] А.Г. Лаптев, Н.А. Николаев, М.М. Башаров Методы
интенсификации и моделирования тепломассообменных
процесов.Справочное пособие.- М.: «Теплотехник», 2011 335 с.
[7] Д.Н. Попов, С.С. Панаиотти, М.В. Рябинин Гидромеханика,
Москва, Издательство МГТУ им.Н.Э. Баумана, 2002, 383 стр.
[8] Chang P. Separation of Flow //New York, Pergamon Press,
1971.
[9] Алямовский А.А. и др. SolidWorks 2007/2008.
Компьютерное моделирование в инженерной практике.// БХВ–
Петербург, Санкт – Петербург, 2008.
[10] Гомелуари В.И. Влияние искуственной шероховатости на
конвективный теплообмен. «Труды Института физики АН
ГССР», Тбилиси, 1963, т.9,с 111-145.
[11] Михеев М.А. Михеева И.М. Основы теплопередачи. – М.:
Энергия.1977. 344с.
This work has been supported by the European Regional
Development Fund within the Activity 1.1.1.2 “Post-doctoral
Research Aid” of the Specific Aid Objective 1.1.1 “To increase the
research and innovative capacity of scientific institutions of Latvia
and the ability to attract external financing, investing in human
resources and infrastructure” of the Operational Programme
“Growth and Employment” (No Nr.1.1.1.2./VIAA/1/16/093).
24

DEVELOPMENT AND RESEARCH OF TEMPERATURE CONTROL SYSTEM OF A HIGH-VOLTAGE BATTERY OF A PERSPECTIVE ELECTRIC VEHICLE
РАЗРАБОТКА И ИССЛЕДОВАНИЕ СИСТЕМЫ ТЕРМОСТАТИРОВАНИЯ
ВЫСОКОВОЛЬТНОЙ АККУМУЛЯТОРНОЙ БАТАРЕИ ПЕРСПЕКТИВНОГО ЭЛЕКТРИЧЕСКОГО ТРАНСПОРТНОГО СРЕДСТВА
Ph.D., Ass. Prof. Kurmaev R.Kh.1, Umnitsyn A.A. 2, Struchkov V.S. 3, Ph.D., Ass. Prof. Karpukhin K.E. 4, Liubimov I.A. 5
Head of Department 1,4, Head of sector 3, Design Engineer 2,5 – Federal State Unitary Enterprise “Central Scientific Research Automobile and Automotive Engines Institute” (FSUE “NAMI”), the Russian Federation
Abstract: The development of temperature control system of high-voltage batteries is an actual and important task in the development of modern electric and hybrid vehicles. There are a large number of designs and types of temperature control systems. In this article, we propose to consider a temperature control system based on a liquid cooling system and designed for both cooling and heating the battery in a wide range of ambient temperatures. In the development process of temperature control system for high-voltage batteries were carried calculations, 3D modelling of the design and tests.
Keywords: VEHICLE, ELECTRIC VEHICLE, TEMPERATURE CONTROL SYSTEM, COOLING SYSTEM, HIGH-VOLTAGE BATTERY
1. Introduction The development of electric transport in the European Union
has become one of the three priority areas of the European economy, and in Russia energy efficiency is declared the main direction of the country's development in the coming years. According to the forecasts of the Subcommittee on Strategic Innovations in the Automotive Industry of the Chamber of Commerce and Industry of the Russian Federation, by 2025 at least 50% of the world's produced vehicles will be on electric traction [1, 4]. Already, all major automobile plants are developing or producing such vehicles. Developments in the field of electromobile transport are engaged in the largest universities, scientific organizations, and enterprises of the Russian Federation. However, in our country now, electric vehicles is not very popular. This is due not only to the underdeveloped infrastructure, but also to climatic conditions. In the greater territory of the Russian Federation is prevailed the cold climate [3, 4, 5 and 6]. Studies show that the mileage of electric vehicles depends strongly on the temperature conditions of the high-voltage battery, which is one of the main elements of the functioning of such vehicles. At low temperatures, the mileage of electric vehicles falls sharply (to 30…40%), and at high temperatures, the high voltage battery can overheat, which can lead to degradation of battery cells. Thus, the task of thermostating high-voltage battery is very important for our country.
Consider the design of high-voltage batteries with thermostating systems of commercially produced vehicles on electric traction.
The Chevrolet Volt T-shaped lithium-ion high-voltage battery, shown in Figure 1, is installed under the car and passes through the central tunnel and under the rear seats.
Fig. 1 T-shaped lithium-ion high-voltage car battery Chevrolet Volt with aluminum cooling plate.
Through the quick-release couplings, the coolant enters into the of the high-voltage battery. Inside the housing of battery, there are thermal channels that allow the coolant to flow through the cooling plates between the flat cells of the lithium-ion batteries. These channels allow cooling or heating of the cells depending on operational requirements. If the temperature of the battery is lower
than the operating temperature, the heating element located on the input channel of the cell is activated directly from the 360 V of lithium-ion battery.
The high-voltage battery of the hybrid Toyota Prius, shown in Figure 2, is located in the trunk above the rear axle of the car. Battery in the car has an air cooling. This type of cooling has a disadvantage, since in this case the air must be cleaned. Therefore, the battery is located inside the car and the air intake comes from the cabin.
Fig. 2 High-voltage car battery Toyota Prius.
The high-voltage battery of the Audi A3 e-tron PHEV-20, shown in Figure 3, has a complex liquid cooling system in which four cooling plates regulate the temperature of the eight modules. Cooling is carried out using a separate controlled low-temperature circuit. To warm up the battery using a thermoelectric heating element and gasoline preheater.
Fig. 3 High-voltage car battery Audi A3 e-tron PHEV-20.
The high-voltage battery of the Tesla Model S, shown in Figure 4, is arranged under the bottom of the car and consists of 16 battery modules with liquid cooling system. As a coolant in the cooling system, a solution of glycol is used. The battery module consists of a flat curved tube with battery cells, as shown in the figure, which evenly distribute the coolant between the cells. Further heat is diverted to the cooling circuit and is used by the climate system to heat the car's cabin.
25

Fig. 4 High-voltage car battery Tesla Model S.
Based on the analysis of the thermostating systems for high-voltage batteries produced vehicles, we can conclude that the liquid cooling system is mainly used. In addition, the thermostating system is influenced by the type and design of the battery cells used in the car.
2. Solution of the examined problem Now, FSUE NAMI conducts research on the topic «Creation of
new technologies and systems in the field of increasing the level of use of alternative energy sources for vehicles, based on the introduction of new scientific and technical solutions aimed at the use of electric and renewable (solar) energy for the movement of vehicles». As a model of an electric vehicle, the Russian electric vehicle LADA Ellada was used. This car uses the air-cooling system of the high-voltage battery (Figure 5) (the incoming airflow to the battery housing is supplied through the front bumper and radiator). On this vehicle, there is no battery heating system.
Fig. 5 High-voltage car battery LADA Ellada.
One of the main tasks of the project was the development of a high-voltage battery with thermostating system, which allows increasing the temperature range of vehicle operation and maintaining the temperature of the high-voltage battery in the operating range. The operating range of the battery cell without a significant decrease in its life 0 ... 50 ºС. Such a temperature range is most suitable for the careful operation of the battery [2, 5, 7 and 8]. With the existing form of battery cells and the limited layout space, an air-water thermostating system for a high-voltage battery was developed. In addition, it was required to rework the concept of a system for the thermostating of a car. The result is shown in Figure 6.
Fig. 6 Schematic diagram of the thermostating car LADA Ellada.
A schematic diagram of the car thermostating system comprises an electric pump 16 for supplying coolant from the radiator 18 along the pressure main to the housing of the high-voltage battery 10. To regulate the flow of the pump 16, the system has valves 4, 7, 8, 15, 17 with an electromechanical drive, which are controlled respectively by temperature sensors 1, 5, 11 and 13. The thermostating system has a cooler 12 and an electric heater 14, from where, depending on the operating mode (cooling or heating), the coolant flows through the check valve 9 to the battery housing 10 and then through the drain line 3 to the radiator 18. Also in the thermostating system there is a heater 6 and an expansion tank 2.
3. Results and discussion The main stages in the development of a high-voltage battery
with a thermostating system were:
- 3D modeling;
- calculation of heat and mass transfer.
Based on the car's engine compartment (Figure 7), and technical requirements for the high-voltage battery, it was decided to use 26 cells Winston WB-LYP90AHA as the battery cells.
Fig. 7 The layout of a high-voltage battery in the car's engine compartment.
The high-voltage battery is a closed box with a thermal insulation layer, which significantly reduces the temperature effects of the environment. The housing of high-voltage battery has two sections. In the upper section, where the battery cells are located, there is a system of air circulation inside the closed volume (Figure 8). The movement of air inside the volume of the high-voltage battery is organized as follows. In the upper cavity of the closed volume, a depression is created, and in the lower cavity, a zone of increased pressure is obtained. These cavities are connected by channels formed by the shape of battery cells. The pressure difference is explained by the use of the fan SPAL VA32-A101-62S. The position of the high-voltage battery cells and the characteristics of the fan have been optimized to ensure sufficient air circulation inside the volume of the high-voltage battery.
In the lower section, there is a heat exchanger, which is a curved tube with many copper plates.
Fig. 8 3D-model of high-voltage battery.
26

The calculation of the efficiency of the system of thermostating of a high-voltage battery was carried out in two modes:
1) Loaded battery operation mode. The ambient temperature is + 40 ° C.
2) The battery is inactive. The ambient temperature is -25 ° С.
The main task of the calculations was to determine the flow rate and temperature of the coolant through the heat exchanger, to provide the target temperature values of the battery cells (0…50°C).
Figures 9-10 show the results of calculations for the first mode.
Fig. 9 Distribution of airflow and temperature in the battery.
Fig. 10 Section through a radiator.
Figures 11-12 show the results of calculations for the second mode.
Fig. 11 Distribution of airflow and temperature in the battery.
Fig. 12 Section through a radiator.
According to the figures, it can be seen that the developed thermostating system has optimal characteristics and allows maintaining the temperature inside the high-voltage battery within operating limits. This design of thermostating system of the high-voltage battery requires a small flow of coolant through the heat exchanger 3 l / min. The coolant temperature measured at the inlet to the heat exchanger + 10 ° C is constant both during cooling and heating. This shows a good level of thermal insulation of the battery volume from the environment.
After the manufacture of a high-voltage battery with a thermostating system, tests were carried out in the temperature test chamber of FSUE NAMI. Tests showed that in a loaded high-voltage battery at a temperature of + 40°C inside n the temperature test chamber and a coolant temperature of + 10°C, which is supplied to the heat exchanger of the battery housing with a flow rate of 3 l/min, a temperature of + 49°C is maintained.
In turn, at a temperature of -25°C inside the temperature test chamber and a coolant temperature of + 10 ° C, which is supplied to the heat exchanger of the battery housing with a flow rate of 3 l / min, the cells of the high-voltage battery warm up above 5°C. This is enough for quickly heat the internal volume of cells of battery, safely activate the car and charge the battery when the car is parked.
A sufficient accuracy of the calculated results with the results of laboratory studies is obtained.
4. Conclusion Currently, the car with a developed high-voltage battery with a
thermostating system is preparing for road tests, which must confirm the effectiveness of the developed design.
This paper is made within the applied research under Agreement No. 14.624.21.0047 dd. 26 October 2017 for the following: “Creation of new technologies and systems in the field of increasing the level of use of alternative energy sources for vehicles, based on the introduction of new scientific and technical solutions aimed at the use of electric and renewable (solar) energy for the movement of vehicles” (unique project identifier RFMEFI62417X0047), made with the Ministry of Education and Science of the Russian Federation.
5. References 1. Rodrigo Garcia-Valle, João A. Peças Lopes. Electric Vehicle
Integration into Modern Power Networks. Springer Science & Business Media, 2012, pp. 1-6.
2. Angelo Greco, Dongpu Cao, Xi Jiang, Hong Yang, A theoretical and computational study of lithium-ion battery thermal management for electric vehicles using heat pipes, Journal of Power Sources, Volume 257, 2014, pp. 344-355
3. Terenchenko A., Karpukhin K., Kurmaev R. Features of operation of electromobile transport in the conditions of Russia. Paper of EVS 28 International Electric Vehicle Symposium and Exibition, KINTEX, Korea, 2015.
27

4. Kurmaev R.H., Terenchenko A.S., Karpukhin K.E., Struchkov V.S., Zinov’ev E.V. Maintaining the required temperature of high-voltage batteries in electric cars and hybrid vehicles. Russian engineering research, 2015, vol. 35, No. 9, pp. 666-669.
5. Karpukhin K.E., Kurmaev R.Kh., Terenchenko A.S., Struchkov V.S., Tsimbaluk M.A. Aspects of construction of combined thermo-statics system for electric vehicle. ARPN Journal of Engineering and Applied Sciences, 2016. Т. 11. 23. pp. 13674-13680.
6. Karpukhin K. E., Shorin A. A., Terenchenko A. S., Umnitsyn A. A., Kondrashov V. N. Research of effectiveness of accumulator systems of hybrid motorcars and electromobiles in conditions of negative temperatures, Russian Engineering Research, 2016, 8 pp. 26-29. (In Russian).
7. Guodong Xia, Lei Cao, Guanglong Bi. A review on battery thermal management in electric vehicle application. Journal of Power Sources, Vol. 367, 11 November 2017, pp. 90-105.
8. Maan Al-Zareer, Ibrahim Dincer, Marc A.Rosen. Novel thermal management system using boiling cooling for high-powered lithium-ion battery packs for hybrid electric vehicles. Journal of Power Sources, Vol. 363, 11 September 2017, pp. 291-303.
28

MODELING AND SIMULATION OF VEHICLE AIRBAG BEHAVIOUR IN CRASH Associate Prof. J. Marzbanrad1, PhD student - V. Rastegar2
School of Automotive Engineering, Iran University of Science and Technology
Abstract: Since safe transportation is one of the biggest concerns of vehicle manufactures, occupant safety in vehicle accidents becomes a great challenge.
The severity of the crash reflects the energy absorption of the car's structure during the accident and also has a close relationship with the amount of energy absorbed by the restraint system. Among components involved in restraint system, airbags are the most complex ones. The simulation and modelling of this system due to the nonlinear behaviour of the passenger and the vehicle add more complexity to its design and fabrication. Airbag system, which is a subsystem of the restraint system, is very important due to the nature of its multi-physical problem and the direct connection with passenger safety.
Therefore, in this paper, different approaches to develop airbag dynamics equations has been reviewed. Further a fast design and simulation method for airbag parameters in the concept design phase by an impact problem has been investigated to contribute to a comprehension of the relation between occupants and airbags.
Keywords: VEHICLE CRASH, RESTRIANT SYSTEM, AIRBAG, LS-DYNA
1. IntroductionOccupant safety is one of the principal objectives in the design
of vehicles. Numerous innovations have appeared aimed at increasing safety in vehicles [1–3]. As is known, airbags, like safety belts are now devices designed to provide protection to the users of vehicles during crash events, minimizing the loads necessary to adapt their movement to the movement of the car [4, 5]. The airbag acts to cushion any impact with vehicle structure and has positive internal pressure, which can exert distributed restraining forces over the head and face. Furthermore, the airbag can act on a wider body area including the chest and head, thus minimizing the body articulations, which cause injury [6]. These safety elements can so reduce the death rates on the roads, and its protection effects have been widely approved [7, 8]. Thus, new types of airbag products are being developed to handle different collision scenarios.
Airbags have been in construction since the late 1940s, when they had first been manufactured and investigated by automobile engineers. The first airbag to be installed in a vehicle appeared in 1971, in the 831 Mercury models that were manufactured by Ford [9], followed by General Mo- tors offering frontal airbags as an optional extra between 1974 and 1976 [10]. In the 1980s, airbags were being mass- produced and by the 1990s they were accepted as an effec- tive supplemental restraining system, along with seatbelts.
Airbag is a primary component of the occupant restraint system, and its protection is widely accepted and analyzed [11]. NHTSA pointed out in a recent data report of traffic accidents that barrier/sled-certified airbags reduce about 20% fatality risk in frontal crashes of cars [12]. Braver et al [13], used Poisson marginal structural model to calculate standardized mortality rate ratios (MRRs), and found that advanced airbag features appeared protective for some occupants, but further study is needed.
While a vehicle is crashing heavily in the front, the forward movement of the front passengers can be perceived as an acceleration process towards the instrument panel starting with a zero speed in a reference coordinate system on a moving vehicle. During this process, airbags are inflated to tolerate parts of the initial kinetic energies of occupants, and compressed to absorb these energies [14]. Meanwhile, the gas in airbags discharges from vents due to the high pressure of airbag chamber compared with the atmosphere pressure, and this drastic venting process releases the energies absorbed by airbags. Based on the above overview, the mechanics relationship between occupants and airbags can be regarded as a simplified model, in which an impactor impacts an airbag with vents on at a given speed.
As an elementary module test method to investigate the performance of airbags, the drop tower test has been widely used in the product development phase of airbags [15–16]. Generally,
before suitable airbags matches a certain vehicle, many times of drop tower test could be conducted by suppliers. This process can not only test the reliability of an airbag’s deployment process, but also verify the correctness of preliminary defined parameters.
Traditionally, airbags have been simulated using the control volume (CV) approach. In the CV model, the pressure inside the airbag is calcu- lated using the mass flow and temperature curves obtained from a tank test. This pressure is assumed to be uniform inside the airbag, and thus a uniform force is applied on all the surfaces of the airbag, including those surfaces which are yet not unfolded. CV approach is hence analogous to a lumped parameter model in which the flow of inflating gases inside the airbag is not discretized. The effect of the gas jet from the inflator is not taken into account in these models. To overcome this shortcoming, jetting is added to CV models to add a momentum to the airbag in the direction of the jet from the inflator [17-18].
In this paper, first the the governing equation on airbag dynamics has been investigated, after that a specified airbag has beed simulated under development and drop test by using LS-dyna.
2. Modelling2.1. System equation
Different approaches in modeling of an airbag can be used. In adrop tower test, the basic mechanics relationship between the impactor and the airbag is expressed as follows [19]:
𝑀𝑀𝑀𝑀 − (𝑃𝑃 − 𝑃𝑃𝑎𝑎𝑎𝑎𝑎𝑎 )𝐴𝐴𝑒𝑒 = 𝑀𝑀𝑎𝑎 (1)
Another model has been used for an external airbag. As shown in Fig. 1, in this model airbag will work like a static air spring and so there is a necessity to know the spring coefficient and the damping coefficient for the external airbag.
Fig. 1 Air spring – damper/spring model. 𝐹𝐹𝑥𝑥 = 𝑃𝑃.𝐴𝐴𝑒𝑒 (2)
29

𝐾𝐾 =𝑑𝑑𝑃𝑃𝑑𝑑𝑥𝑥 .𝐴𝐴𝑒𝑒 + 𝑃𝑃.
𝑑𝑑𝐴𝐴𝑒𝑒𝑑𝑑𝑥𝑥
(3)
𝐾𝐾𝑥𝑥1 =𝑑𝑑𝑃𝑃𝑑𝑑𝑥𝑥 .
𝐴𝐴𝑒𝑒𝑥
(4)
𝐾𝐾𝑥𝑥2 = 𝑃𝑃.𝑑𝑑𝐴𝐴𝑒𝑒𝑑𝑑𝑥𝑥
(5)
By assuming an inviscid flow, the damping coefficient can be found as follows:
𝐶𝐶 =𝐹𝐹𝑥 =
𝜌𝜌.𝑀𝑀 𝑣𝑣𝐵𝐵2 + 𝑣𝑣𝐴𝐴2
2𝑀𝑀 + 32𝜇𝜇𝜇𝜇𝑣𝑣𝐵𝐵𝜌𝜌𝑀𝑀𝑑𝑑2 .𝐴𝐴𝑒𝑒
𝑥
(6)
Based on the original dynamics model used to develop the airbag system for the Mars Pathfinder, another governing equation can be developed as follows:
𝑀𝑀𝑥 + (𝑃𝑃 − 𝑃𝑃𝑎𝑎𝑎𝑎𝑎𝑎 )𝐴𝐴𝐹𝐹𝑃𝑃 = 𝑀𝑀𝑀𝑀 (7)
In this model the airbags hit the ground and AFP shows the area of the airbags which is in contact with surface.
2.2. Geometry
There is a tendency to assume a two-dimensional design to analysis the airbag behavior. In Fig. 2 a schematic of an airbag system is shown.
Fig. 2 Airbag schematics
In this paper, a three-dimensional analysis in regards to volumetric changes in airbag has been studied. A predefined airbag geometry is shown in Fig 3. Relations of volume changes are divided in two sections, V1 shows the volume of the cylindrical volume in the middle and V2 is related to torus around the cylinder.
Fig. 3 Airbag geometry
𝑉𝑉2 = 4𝜋𝜋𝑥𝑥𝑋𝑋2
2− 𝑥𝑥 −
𝑙𝑙2
2𝑙𝑙+𝑋𝑋2
𝑙𝑙2
𝑑𝑑𝑥𝑥 (8)
𝑉𝑉1 = 𝜋𝜋 𝑙𝑙2
2
𝑋𝑋 (9)
𝑉𝑉 = 𝑉𝑉1 + 𝑉𝑉2 (10)
According to Wang and Nefske, the relationship between the pressure (P2) and the volume (V2) of the airbag will be expressed as:
𝑉𝑉2 = 𝑉𝑉20(1 + 𝑐𝑐𝛽𝛽(𝑃𝑃2 − 𝑃𝑃𝑎𝑎𝑎𝑎𝑎𝑎 )) (11)
𝑐𝑐𝛽𝛽 is bag stretch factor and P2 and V2 are pressure and volume of airbag [20]
2.3. Ventilation
For the leakage or venting in the airbag, the Bernoulli equation can be used. It is assumed that the flow between location inside the airbag and location outside the airbag is inviscid, incompressible, free from heat transfer, and steady. Thus the Bernoulli equation between these two locations is derived according to head loss from inside and outside of the airbag after traveling through the vents:
𝐻𝐻 =32𝜇𝜇𝜇𝜇𝑣𝑣𝐵𝐵𝜌𝜌𝑀𝑀𝑑𝑑2
(12)
Also standard gas dynamics equations can be used to determine the conditions required for the airbag venting mechanism by using a standard nozzle flow equation to relate the flow velocity through the vent:
𝑑𝑑𝑑𝑑𝑑𝑑𝑎𝑎
= 𝐶𝐶𝐷𝐷𝐴𝐴𝑎𝑎ℎ𝑃𝑃𝑎𝑎𝑎𝑎𝑎𝑎 1𝑅𝑅𝑅𝑅
1
2
[2𝛾𝛾𝛾𝛾 − 1
𝑃𝑃
𝑃𝑃𝑎𝑎𝑎𝑎𝑎𝑎𝛾𝛾−1
𝛾𝛾
]12 [
𝑃𝑃𝑃𝑃𝑎𝑎𝑎𝑎𝑎𝑎
𝛾𝛾−1
𝛾𝛾
− 1]12
(13)
Another approche is to assume a vent on an airbag is a circular hollowed-out region, which acts as a channel for the gas in the airbag chamber exhausts from the inside to the outside. Thus, the vent area directly affects the exhausted gas mass of an airbag. Based on the momentum theorem, mass of the exiting gas can be found as follows:
ℎ = 𝑃𝑃 − 𝑃𝑃𝑎𝑎𝑎𝑎𝑎𝑎
𝜌𝜌
(14)
𝑎𝑎 = 𝑎𝑎(𝑎𝑎) − 2 𝜌𝜌𝐴𝐴ℎ𝑑𝑑𝑎𝑎𝑎𝑎
0
(15)
2.4. Solution algorithm
A time stepping scheme is employed where at each time increment, the change in airbag geometry is calculated based on the position of the supported mass as shown in the Fig. 4. This is then
30

used to obtain the pressure, volume, and mass of the operating medium, which is in turn used to determine conditions for venting of the airbag.
Fig 4. Overview of iterative process
3. Simulation
In the area of numerical simulations involving the use of airbags to absorb impact energy, passively or actively, accurate definitions of airbag leakage parameters play a crucial role in predicting the response of impacting objects. LS-DYNA is a software package for dynamic analysis and study of fluid structure interactions can widely be investigated.
Base on the geometry of a common driver airbag, the basic test conditions are described as follows: the diameter of the airbag is 610 mm, two vents on the airbag with the same diameter of about 30 mm, two straps in the airbag have the same length of 200 mm, the volume of the airbag chamber is about 45 L when the inflator has just finished its inflating process, the mass of the impactor is 4.8 kg with initial velocity of 14 m/s2.
The impact problem has been imported in LS-dyna solver and the graphical view is shown in Fig. 5.
Fig. 5 Graphical view of main LS-dyna simulation window
Inflator mass flow pressure rate is dependent on the inflator function, but a common inflator is selected [19] and imported in software as Fig. 6:
Fig. 6 Mass flow pressure
4. Result and Discussions
The airbag system is part of the passenger car restraint system. Therefore, the exact design of the airbag is very important. In this
article it has been tried to review on different mathematical modelling and Ls-dyna simulation.
As of that, the results generated by coding in Matlab and Ls-dyna has been shown in Fig. 7 and Fig. 8.
From analytical approach, Fig 7. shows the acceleration changes of the impactor after dropping with initial acceleration (g) and contacting the airbag surface.
Acc
eler
atio
n (g
)
Time s
Fig. 7 Impactor acceleration
The same drop test has been simulated in Ls-dyan and acceleration changes of impactor is shown in Fig. 8.
Fig. 8 Impactor acc. (Ls-dyna)
5. Conclusion
Since in the crashworthiness studies the head acceleration is one of the important parameters to determine the occupant injury, in this paper investigation of the acceleration of the impactor has been chosen as an important factor.
By comparing the results developed for the impactor acceleration from analytical and simulation, it was cleared that the results showed a similar trend almost same extreme points.
It should be noted that the proposed theoretical model cannot solve the situation in which the impactor contacts the airbag before it is fully inflated.
Since ventilation has a great impact on the airbag behavior, on the premise of reasonable simplifications and assumptions, the momentum theorem (which was proposed by formula 14 and 15) did not reflect a good relation between different design parameters and the impactor response. On the other hand, Bernoulli and dynamic gas equations showed better results.
In this paper three different approaches to analytically solve an impact problem has been studied. In all of them an impactor has been dropped on a fully developed airbag and the acceleration of the impactor has been investigated. After that in order to compare the accuracy of the results, a simulation with the same scenario has been developed in Ls-dyna.
31
5. Symbols and Signs
P Pressure
h Velocity (Gas flow)
V Volume
ρ Density
M Mass
T Temperature
d Vent diameter
C Damping coefficient
H Head loss
v Impactor velocity
K Coefficient
V20 Volume of fully Inflated airbag
6. Reference1. Zhang, H., CAE-based side curtain airbag design. In: SAE 2004-
01-0841, SAE World Congress, 8–11 March 2004, Detroit,Michigan, 8–11 March (2004)
2. Soongu, H., A study on the modeling technique of airbag cushionfabric. In: SAE 2003-01-0512, SAE World Congress, 3–6March 2003, Detroit, Michigan, 3–6 March (2003)
3. Canaple, B., Impact model development for the reconstruction ofcurrent motorcycle accidents. Int. J. Crash 7, pp. 307–320(2002)
4. Freesmeier, J.J., Butler, P.B., Analysis of a hybrid dual-combustion-chamber solid propellant gas generator. J. Propuls.Power 15, 552–561 (1999)
5. Schmitt, R.G., Butler, P., Freesmeier, J., Performance and COproduction of a non-azide airbag propellant in a pre-pressurizedgas generator. Combust. Sci. Technol. 122, pp. 305–350 (1997)
6. Gabauer, D.J., Gabler, H.C., The effects of airbags and seatbeltson occupant injury in longitudinal barrier crashes. J. Saf. Res.41, pp. 9–15 (2010)
7. Crandall, C.S., Olson, L., Sklar, D.P., Mortality reduction withair bag and seat belt use in head-on passenger car collisions.Am. J. Epidemiol. 153, pp. 219–224 (2001)
8. Teru, I., Ishikawa, T., The effect of occupant protection bycontrolling airbag and seatbelt. In: Proceedings of the 18thInternational Technical Conference on the Enhanced Safety ofVehicles. NHTSA, Nagoya, Japan (2003)
9. Thompson, K.M., Segui-Gomez, M. and Graham, J.D.,Validating analytical judgements: the case of airbag’s lifesavingeffectiveness, Reliability Eng. System Safety 66, pp. 57–68.(1999)
10. Chan, C.-Y., Crash Sensing in Automotive Airbag Systems,Warrendale, Society of Automotive Engineers (2000)
11. Greenwell, N K. Evaluation of the certified-advanced airbags[R]. Washington, DC: National Highway Traffic SafetyAdministration, Report No. DOT HS 811 834.
12. Kahane, C J., Injury vulnerability and effectiveness of occupantprotection technologies for older occupants and women.Washington, DC: National Highway Traffic SafetyAdministration, Report No. DOT HS 811 766.
13. Braver, E. R., Shardell, M., Teoh E. R., How have changes inair bag designs affected frontal crash mortality. Annals ofEpidemiology, 20(7): pp. 499–510 (2010)
14. Shi, L., Cao, L., Weixiong, Y., Test and simulation study on theperformance improvement of SUV airbag. Chinese Journal ofAutomotive Engineering, 2(5): pp. 334–340 (2012)
15. Keun, L., Hyun, L., Hyung, L., Validation methodology onairbag deployment process of driver side airbag, 21th EnhancedSafety of Vehicles (ES) Conference, Stuttgart, Gernany, June15–18, Paper No. 09-0363 (2009)
16. Bok, L., Gu, H., Parametric study on mid-mounted passengerairbag cushion using design of experiments[R]. SAE TechnicalPaper, (2003).
17. Cirak, F., Radovitzky, R., ‘A new Lagrangian Eulerian shellfluid coupling algorithm based on level sets’, Proceedings of the44th AIAA/ASCE/ASME/AHS Structures, StructuralDynamics, and Materials Conference, Norfolk, Virginia, USA,(2003).
18. Marklund, P., Nilsson, L., ‘Simulation of airbag deploymentusing a coupled fluid structure approach’, 7th International LS-DYNA Users Conference, Detroit, MI, USA, (2002).
19. Zhang, J., Jin, Y., Xie, L., and Chen, C., Establishment andValidation for the Theoretical Model of the Vehicle Airbag,Chinese Journal Of Mechanical Engineering, Vol. 28,No. 3,(2015)
20. Wang, J.T., Nefske, D.J., A New CAL3D Airbag InflationModel, SAE Technical Paper Number 880654, (1972)
32

ПОВЫШЕНИЕ СКОРОСТНЫХ КАЧЕСТВ ТРАНСПОРТНОЙ ГУСЕНИЧНОЙ
МАШИНЫ СОВЕРШЕНСТВОВАНИЕМ ДИНАМИЧЕСКИХ СВОЙСТВ СИСТЕМЫ
УПРАВЛЕНИЯ ПОВОРОТОМ
INCREASE OF HIGH-SPEED QUALITY OF A TRANSPORT CRAWLER MACHINE BY IMPROVING THE
DYNAMIC PROPERTIES OF THE CONTROL SYSTEM OF A TURN
PhD Gizatullin U.1 Prof. Dsc. Taratorkin I.1, Prof. Dsc. Derzhanskii V.1, PhD Taratorkin A.1 , postgraduate Volkov A.1 – Institute of
Engineering Science of the Ural Branch of the Russian Academy of Sciences (IES UB RAS), Russia
Corresponding author - Gizatullin U.
E-mail: [email protected]
Abstract: Based on the analysis of the mobility of high-speed crawler vehicles on the dynamic properties of the hydraulic drive of the steer-
ing control system, the directions for their improvement based on the synthesis of the PID regulator are determined, which makes it possible
to realize the potential high-speed qualities of the machines while reducing the level of requirements for driver qualification.
KEYWORDS: PID, REGULATOR, CRAWLER, VEHICLES, CONTROL, SYSTEM, DRIVER QUALIFICATION
В работе [1], посвященной исследованию динамики
управляемого движения быстроходных гусеничных машин
(БГМ) установлено, что скоростные качества на трассах с ин-
тенсивным изменением кривизны траектории во многом огра-
ничиваются удельной мощностью и величиной поворачиваю-
щего момента, создаваемого гидроприводом системы управле-
ния поворотом (СУП). Для реализации потенциальных скоро-
стных качеств машин поворачивающий момент должен быть
достаточным для преодоления момента сопротивления поворо-
ту, формируемого грунтом и инерционной составляющей. В
противном случае проявляется действие нелинейности харак-
теристики гидропривода, вызванной ограничением давления
или расхода рабочей жидкости. В этих условиях не обеспечи-
вается не только динамическая устойчивость, но и статическая.
При ограничении поворачивающего момента гидропривода
введение обратной связи в СУП не повышает управляемости.
Следовательно, движение замкнутой нелинейной динамиче-
ской системы не только не устойчиво, но и не управляемо. На
основе анализа мирового опыта разработки конструктивных
решений, обеспечивающих требуемые скоростные качества
при ограниченной мощности гидропривода системы управле-
ния поворотом, делается вывод о наличии существенных огра-
ничений [1], затрудняющих их реализацию.
Из приведенного анализа следует вывод, что основным
направлением повышения скоростных качеств машин при по-
вороте является не только повышение ее удельной мощности
машины, но и гидропривода системы управления поворотом,
обеспечивающих регулирование направления движения с тре-
буемой угловой скоростью и ускорением.
Однако, из результатов экспериментального исследова-
ния динамики управляемого движения машины с увеличенны-
ми удельной мощностью на 33 % и поворачивающим момен-
том гидропривода, обеспечивающим рост угловых ускорений
при повороте на малодеформируемом грунте от 0,7 до
1,1 рад/с2, то есть в 1,4 раза, следует, что средняя скорость
движения на тестовой змейке с интенсивным изменением кри-
визны траектории (длина полуволны направляющей синусоиды
20…30 м) гораздо ниже расчетной по силовым условиям пово-
рота при движении по влажному бетону и дернистому грунту.
Реализация потенциальных скоростных качеств ограничивает-
ся следующими динамическими явлениями:
условием вписываемости в ограниченный коридор из-
за отклонения траектории движения от заданной, вызванного
фазовым отставанием реакции на управляющее воздействие
при интенсивном изменении кривизны и ее знака, особенно на
участках с ограниченной дальностью видимости поворотов
дороги;
скорость криво- и прямолинейного движения ограни-
чивается случайными «быстрыми», не компенсируемыми во-
дителем, отклонениями направляющего угла;
снижением управляемости в процессе движения с
разблокированным гидротрансформатором при перегрузке
двигателя;
повышенным буксованием движителя при износе
грунтозацепов траков.
Анализ перечисленных динамических явлений, путей
уменьшения их действия приводится ниже.
При движении по дорогам с интенсивным изменени-
ем кривизны точность траектории во многом определяется
фазовым отставанием реакции на управляющее воздействие
[1]. Из-за фазового отставания машина не успевает развернуть-
ся на требуемый угол относительно касательной заданной тра-
ектории движения центра масс и она не вписывается в ограни-
ченную ширину дороги. Возможность сокращения фазового
отставания на первом этапе определяется на основе качествен-
ного анализа упрощенной модели управляемого движения БГМ
не только как сплошного твердого тела, но и с учетом упруго-
демпфирующих свойств движителя. В частности, учитывается
нелинейная податливость гусениц с резино-металлическим
шарниром (РМШ), которыми оснащаются большинство совре-
менных БГМ. Такие конструкции обеспечивают требуемый
ресурс при ограниченной погонной массе. В тоже время, про-
цесс криво – и прямолинейного движения сопровождается су-
щественными колебаниями корпуса машины относительно
вертикальной оси. На деформируемом грунте колебания кор-
пуса происходят относительно гусениц без перемещения тра-
ков в боковом направлении. При движении по дорогам с мало-
деформируемым основанием и низкими сцепными свойствами
связи гусениц с грунтом являются неудерживающими. В этих
условиях наблюдаются угловые перемещения траков с сущест-
венной амплитудой случайного характера, что приводит к от-
клонению направляющего угла. Росту амплитуд способствует
также снижение сцепных свойств высокий уровень вибронаг-
руженности движителя в спектре частот до 140 Гц. Можно
указать множество факторов, от которых зависит формирова-
ние указанных колебаний, в том числе, такие как присущие
системе нелинейности, случайные возмущения со стороны
дороги и другие. Наиболее вероятной причиной может быть
асинхронность зацепления ведущих колес с эластичными гусе-
ницами, повышенная асимметричность периодически изменяе-
мой линейной, изгибной и винтовой податливости гусениц с
РМШ отдельных бортов. При входе в поворот асимметрич-
ность системы возрастает, так как длина рабочей ветви гусени-
цы отстающего борта, соответственно и податливость, увели-
чивается в 6…7 раз [2]. Периодическое изменение жесткости
механической системы может быть причиной возбуждения
параметрических колебаний. В этом случае левая часть диффе-
ренциального уравнения вращательного движения в зависимо-
сти от вида некоторой периодической функции Ф(t) может
быть представлена в форме Мейснера или Матье-Хилла [3]:
33

)()(21 ШТППMПMПZ MtФCkJ ,
JZ – момент инерции машины относительно вертикальной оси;
kМ – коэффициент момента сопротивления; СМ – механическая
жесткость; μ – параметр модуляции; МП(αШТ) – поворачиваю-
щий момент в функции угла поворота штурвала, развиваемый
гидроприводом.
Дифференциальное уравнение в изображении по Лап-
ласу (s) при нулевых начальных условиях может быть пред-
ставлено в виде:
)()1( 1
22
2
ШТПП ksTsT ,
где: T2 – постоянная времени, Т2 = JZ/CM, Т1 = kМ/CМ , kП – ко-
эффициент момента поворачивающего, kП = MП/СМ.
Амплитудная H(ω) и фазовая φ(ω) частотные харак-
теристики системы определяются уравнениями:
21
2222
2 )1()(
TT
kH П
22
2
1
1)(
T
Tarctg .
Из приведенных зависимостей следует, что интенсив-
ность разгона – амплитуда реакции H(ω) при входе в поворот
зависит от поворачивающего момента kП, фазовая частотная
характеристика φ(ω) инвариантна, что объясняет эксперимен-
тальные данные, приведенные выше. Величина поворачиваю-
щего момента гидропривода СУП является необходимым, но не
достаточным условием повышения скоростных качеств машин.
При достаточном его значении представляется возможным
сократить фазовое отставание реакции введением в СУП фор-
сирующего элемента, например, последовательным включени-
ем дифференцирующего звена с передаточной функцией
(ТКs + 1). При включении форсирующего элемента после уст-
ройства сравнения СУП реакция на гармоническое возмущение
с частотой ω на выходе дифференцирующего устройства также
будет гармонической, но с опережающей фазой ψК:
)sin()( KKК tt
где: ψК – амплитуда реакции, ψК = kKz/cos(K), z – амплитуда
гармонического возмущения, K – фаза, K = arctg(TK).
Выбором постоянной TK можно обеспечить необхо-
димое упреждение сигнала поворачивающего момента, дейст-
вующего на входе электронного блока второго канала управле-
ния гидропривода, например фирмы Sauer (S&SMB), которая
выполняется с двумя каналами управления – механическим и
электронным с пропорциональным регулированием. Последнее
позволяет осуществлять регулирование гидропривода по сиг-
налу обратной связи АСУ, дублирующего и дистанционного
управления.
Скорость прямолинейного движения по дороге с ог-
раниченными шириной и сцепными свойствами (влажный бе-
тон, обледенелая дорога) ограничивается вписываемостью при
«быстрых» отклонениях угловой скорости. Установившаяся
ошибка регулирования, в полосе частот 0…6 Гц (см. рис. 1), не
компенсируется водителем (допустимая В 1 Гц). Числовые
характеристики величины отклонения определяются по экспе-
риментальным данным.
Рисунок 1
Фрагменты реализации отклонения угловой скорости (вверху),
соответствующего компенсирующего управления (внизу) и
спектральные плотности процессов: 1 – угловой скорости, 2 –
угла поворота штурвала
В процессе движения машины наиболее точно изме-
ряется отклонение угловой скорости. При сходимости спектров
координаты и ее производной среднеквадратическое отклоне-
ние направляющего угла определяется по формуле:
0
2
2 1
dS , а 3 ,
где Sω(ω) – спектральная плотность процесса отклонения угло-
вой скорости.
При большой скорости движения, управляющие действия во-
дителя являются ошибочными и приводят к росту отклонения
направляющего угла (рис. 2) и соответствующему снижению
скорости движения по условиям вписываемости в ограничен-
ный коридор.
Рисунок 2
Зависимость среднеквадратического отклонения направляю-
щего угла от скорости движения (1, 2 – некорректируемое и
корректируемое водителем движение соответственно)
Эти отклонения траектории можно минимизировать
введением корректирующего устройства – интегрирующего
звена.
В пределе установившаяся ошибка регулирования в
такой системе имеет конечную величину = ВХ/(1+КР) и
уменьшается при увеличении КР(МП) разомкнутой системы.
34

Однако введение интегрирующего звена в закон
управления уменьшает устойчивость системы автоматического
регулирования и увеличивает запаздывание в действии резуль-
тирующего сигнала (поворачивающего момента). Для сокра-
щения запаздывания в закон регулирования вводится одновре-
менно и производная рассогласования, то есть синтезируется
пропорциональноинтегродифференцирующий контур. В такой
системе сигнал на выходе содержит составляющие, пропор-
циональные рассогласованию и интегралу от рассогласования:
t
ВХ
K
ВХKК dttT
tk0
1
На основе результатов анализа упрощенной модели
движения машины при детерминированном характере возму-
щений установлена принципиальная возможность уменьшения
действия ограничений и реализации потенциальных скорост-
ных качеств при совершенствовании динамических свойств
гидропривода СУП.
Синтез оптимального управления реальной много-
мерной системой при действии стохастических возмущений
осуществляется на основе теории аналитического конструиро-
вания оптимальных регуляторов при не полностью известных
возмущениях [4]. В процессе управляемого движения машина
рассматривается как динамическая система с двумя коррелиро-
ванными входами – возмущениями управления и внешней сре-
ды. Взаимная корреляция определяется тем, что возмущения
внешней среды через опорные катки воздействуют на корпус и
зависят от кривизны траектории k, угловой скорости ω, а сле-
довательно, и от управляющего воздействия ШТ . Этим вы-
звано совпадение диапазона частот (0…1,0 Гц) локальных экс-
тремумов спектральных плотностей процессов отклонения Sω
угловой скорости и компенсирующего управления Sα при пря-
молинейном движении (рис. 1). Значимость взаимной корреля-
ции определяется составляющей боковой силы, действующей
на i-ю пару опорных катков [2]:
n
i
iiii lkQy1
0 sin ,
где Q0i, li – вертикальная нагрузка i-ой пары опорных катков и
продольная координата i-ой пары опорных катков относитель-
но поперечной оси симметрии, проходящей через центр масс
машины, соответственно, k – кривизна траектории, – про-
дольное смещение полюса поворота, i – угол между направ-
лением абсолютной скорости и касательной к заданной траек-
тории. По экспериментальным данным с ростом скорости до 20
м/с и кривизне траектории 0,01 м-1, i = 0…10.
Для исключения когерентности спектров управляю-
щего воздействия S() и возмущений внешней среды SХ()
предусматривается в процессе слежения (управления поворо-
том) учет управляющих воздействий. В режиме стабилизации
прямолинейного движения – компенсация угловой скорости
поворота реакции машины на действия возмущений внешней
среды при нулевом управляющем воздействии.
Решение задачи оптимального управления заключает-
ся в определении экстремали уравнения упрощенного регуля-
тора, то есть представлением плоскопараллельного движения
как вращательного, u(t) = WР∙x(t), обеспечивающего минимум
функционала, определяющего точность траектории П(t) и
затрат мощности на компенсацию отклонений, пропорцио-
нальных управлению u(t):
min)(1
0
22 T
dttutT
J ,
где: – множитель Лагранжа, подлежащий определению.
При устойчивости полинома A(), входящего в диф-
ференциальное уравнение вращательного движения машины,
средний квадрат общего решения равен среднему квадрату его
частного решения:
022aббсmi
)(
)(
A
dSI .
Спектральная плотность возмущений S() может из-
меняться в широких пределах. Для наиболее неблагоприятных,
«худших», возмущений критерий качества не должен превос-
ходить некоторого предельного гарантированного уровня.
Наиболее опасной является спектральная плотность, сосредо-
точенная на частоте М, на которой достигает максимума со-
множитель 22
2
)(
A. В этом случае спектральная плот-
ность является импульсной -функцией Дирака S() = N(–
М), что соответствует гармоническому возмущению. Уравне-
ние оптимального регулятора для наиболее неблагоприятного
воздействия определяется непосредственно из вариационного
уравнения Эйлера – Пуассона:
22
2
)(
)()(
1
A
xAxA
k
ku .
Когда условия устойчивости разомкнутой системы не выпол-
няется, то полученное управление не обеспечивает требуемого
качества. Хотя при неустойчивом движении затраты мощности
на компенсацию отклонений значительно меньше, чем при
устойчивом. Однако из-за ограниченного быстродействия су-
ществующих гидроприводов систем управления поворотом
гусеничных машин реализация такого управления является
неприемлемой. Дополнительному требованию устойчивости
удовлетворяет ограниченное подсемейство уравнений Эйлера-
Пуассона, в которые не входят экспоненциально возрастающие
члены. Это же относится к режиму стабилизации прямолиней-
ного движения. В режиме слежения необходимо обеспечить
качество переходных процессов, а также сокращение фазового
отставания реакции на управляющее воздействие, как при сто-
хастическом характере возмущения управления, так и при де-
терминированном – на тестовых трассах «змейка», «перестав-
ка», «вход в поворот» и другие. Таким образом, уравнение оп-
тимального управления может быть представлено в виде:
22
2
A
SAu ;
.0,),(
,0 ,)()(
ШТНЧ
ШТ
ШТШТ
ШТНЧ
S
SS
Требуемый режим определяется управляющим воздействием
ШТ: 0 ШТ ШТНЧ и соответствует режиму стабилизации
(индекс «НЧ» означает зону нечувствительности), ШТ > ШТНЧ
и 'ШТ ≠ 0 – соответствует режиму слежения.
При движении на высших передачах, особенно на за-
тяжных поворотах, снижается управляемость из-за падения
частоты вращения вала двигателя при его перегрузке, что при-
водит к разблокировке гидротрансформатора и снижению про-
изводительности насоса гидропривода. В этом режиме движе-
ния кривизна траектории увеличивается до значения 2/В м-1, ее
35

значение не пропорционально углу поворота штурвала. При
несвоевременном переключении передач вниз скорость посту-
пательного движения и угловая в этих условиях снижается до
минимума, а движения центра масс происходит по спирале-
видной траектории (рис. 3).
Рисунок 3
Изменение траектории движения с разблокированным гидро-
трансформатором
Движение по траектории со стабильной кривизной
обеспечивается алгоритмом управления – переключением пе-
редачи на номер ниже. Такое решение повышает управляе-
мость предотвращением разблокировки ГТ при перегрузке
двигателя. Для повышения динамических и скоростных ка-
честв БГМ в процессе поворота в сложных дорожных условиях
с непрерывным изменением направления движения целесооб-
разно обеспечить работу двигателя на повышенных оборотах.
Снижать скорость движения за счет уменьшения подачи топ-
лива для вписывания в поворот нецелесообразно, т.к. это при-
водит к уменьшению производительности насоса гидроприво-
да.
В процессе экспериментальных исследований уста-
новлено, что после наработки ресурса гусениц 8 000 км, в том
числе по бетонной трассе – 3 000 км, высота грунтозацепов
уменьшилась на 10,5 мм. Это приводит к ограничению скоро-
сти движении в процессе поворота по деформируемому грунту
вследствие повышенного буксования движителя (скорость
прохождения «змейки» снижается на 20…25 %).
Выводы:
1. Повышение поворачивающего момента, обеспечи-
вающего поворот машины с требуемым ускорением, является
необходимым, но не достаточным условием для сокращения
фазового отставания реакции на управляющее воздействии и
компенсации установившейся ошибки регулирования – «быст-
рых», не компенсируемых водителем, отклонений, ограничи-
вающих подвижность машин по условиям вписываемости на
дорогах недостаточной ширины с низкими сцепными свойст-
вами. Повышение подвижности машин в повороте при доста-
точном значении поворачивающего момента (при детермини-
рованном возмущении) может быть достигнуто совершенство-
ванием динамических свойств СУП – синтезом пропорцио-
нально интегродифференцирующих корректирующих уст-
ройств. В общем случае движения – при действии возмущений
стохастического характера, качество переходных процессов,
сокращение фазы реакции на управляющее воздействие и точ-
ность траектории при ограничении затрат мощности на ком-
пенсацию отклонений достигаются синтезированным опти-
мальным управлением при не полностью известных возму-
щающих силах.
2. Реализация потенциальных скоростных качеств ог-
раничивается не учитываемыми ранее факторами: повышен-
ным буксованием движителя в процессе поворота из-за износа
грунтозацепов гусеницы (скорость прохождения «змейки»
снижается на 20…25 %), а также снижением управляемости из-
за разблокировки гидротрансформатора при перегрузке двига-
теля на поворотах.
Литература
1. Держанский В.Б., Жебелев К.С., Тараторкин И.А.,
Наумов В.Н., Харитонов С.А. Исследование динамики управ-
ляемого движения быстроходных гусеничных машин / Вестник
МГТУ им. Н.Э. Баумана, 3(72) 2008, М.: Изд-во МГТУ им. Н.Э.
Баумана, с. 86 – 99.
2. Благонравов А.А., Держанский В.Б. Динамика
управляемого движения – Курган: Изд-во КМИ, 1995, 162 с.
3. Ильин М.М., Колесников К.С., Саратов Ю.С. Тео-
рия колебаний. Учеб. для вузов / Под общ. ред. К.С. Колесни-
кова. – М.: Изд-во МГТУ им. Н.Э. Баумана, 2003 – 272 с.
4. Петров Ю.П. Синтез оптимального управления при
неполностью известных возмущающих силах – Л.: Изд-во Ле-
нингр. ун-та, 1987 – 292 с.
36

MATHEMATICAL MODELING AND SIMULATION OF POWER UNIT WORKING
ON MOTOR FUELS DERIVED FROM NATURAL GAS IN TOTAL LIFE CYCLE
МАТЕМАТИЧЕСКОЕ МОДЕЛИРОВАНИЕ И РАСЧЕТНЫЕ ИССЛЕДОВАНИЯ
ПОКАЗАТЕЛЕЙ СИЛОВОЙ УСТАНОВКИ, РАБОТАЮЩЕЙ НА МОТОРНЫХ ТОПЛИВАХ,
ПОЛУЧЕННЫХ ИЗ ПРИРОДНОГО ГАЗА, В ПОЛНОМ ЖИЗНЕННОМ ЦИКЛЕ
Eng. Mirenkova E., Assoc. Prof. D.Sc. Kozlov A., Assoc. Prof. Ph.D. Terenchenko A.
Federal State Unitary Enterprise “Central Scientific Research Automobile and Automotive Engines Institute” (FSUE “NAMI”), the Russian
Federation
Abstract: The article is devoted to the problem of comprehensive evaluation of the efficiency of the use of various alternative fuels
obtained from natural gas (NG) in a total life cycle (TLC). Despite the fact that all types of motor fuel under consideration are produced
from NG, the energy and environmental consequences of their use may vary significantly. Goals of this research are: developing TLC
mathematical models of a power unit operating on motor fuels obtained from NG (compressed NG, liquefied NG, methanol, dimethyl ether,
synthetic diesel fuel and hydrogen) and conducting a simulation in order to determine energy and environmental indicators for the use of the
considered fuel types. The results of simulation allow to choose the most promising types of alternative fuels according to the criteria of
energy efficiency and a level of environmental pollution by harmful substances and greenhouse gases.
Key words: TOTAL LIFE CYCLE, MATHEMATICAL MODEL, ALTERNATIVE FUELS, NATURAL GAS, POWER UNIT
1. Introduction
Effective use of natural energy resources is important for the
development of different industries and lowering of anthropogenic
loads on environment and climate by lowering of emission of
polluting substances and greenhouse gases. A special role in the
solution of this problem is assigned to vehicles with engines
powered by alternative types of fuel, first of all – by the natural gas
(NG). [1,2,3]
Direct NG use, as well as obtaining other alternative motor fuels
from NG, allows to increase the engine durability and the vehicle
operation life by 1.3 - 1.5 times, to reduce the transportation prime
cost by 15 - 25% due to a lower price of gas motor fuel, as well as
to reduce essentially the harmful substance emissions to
environment (carbon oxide – by 2.5 times, nitrogen oxides – by 2
times, hydrocarbons – by 3 times, smoke – by 9 times).
In many countries, the large-scale transport development
programs are implemented in the direction of energy efficiency and
environmental safety. The European Union (EU) is a leader on the
matter. Thus, in 2011, the White Paper / Roadmap to a Single
European Transport Area – Towards a Competitive and Resource
Efficient Transport System (COM/2011/0144) was adopted
suggesting that a share of used “standard-fueled vehicles” in public
transport should be halved by 2030 and phased out in the cities by
2050.
The EU 2030 Climate and Energy Framework adopted in
October 2014 sets the goals of lowering of greenhouse gas
emissions by 40% in comparison with the level of 1990,
achievement of renewable energy share up to 27%, as well as the
resumption of activities aimed at the energy efficiency increase.
In the Russian Federation (RF), the main operating packages of
legislation governing and providing to increase the use of motor
fuels obtained from NG are as follows: the Russian Federation
Government Order of 13.11.2009 No. 1715-r “Energy Strategy of
Russia for the Period till 2030 (ES-2030)”; the Russian Federation
Presidential Order of 17.12.2009 No. 861-rp “Climate Doctrine of
the Russian Federation”; the Russian Federation Government Order
of 13.05.2013 No. 767-r “On Expansion of Use of Natural Gas as
Motor Fuel” (“On Regulation of the Relations in the Sphere of the
Use of Gas Motor Fuel including NG as Motor Fuel”); the List of
Instructions of Vladimir Putin, the President of the Russian
Federation, following the meeting on prospects for using gas motor
fuel of 24.06.2013 No. PR-1923; the Russian Federation
Government Decree of 15.04.2014 No. 328 “On Approval of the
State Program of the Russian Federation “The Development of
Industry and Increase of its Competitiveness” (Main activity 1.7
“Expansion of Use of Natural Gas as a Motor Fuel”); the Russian
Federation Government Decree of 07.12.2015 No. 1339 “On
Amendments to the State Program of the Russian Federation
“Energy Efficiency and Energy Development” and the Decree of
the President of the Russian Federation of 01.12.2016 No. 642 “On
the Scientific and Technological Development Strategy of the
Russian Federation”.
Thus, a main goal of this research is the comprehensive
evaluation of the efficiency of the use of various alternative fuels
obtained from natural gas (NG) in a total life cycle (TLC) by
development of TLC mathematical models of the power unit and
carrying out of numerical analyses in order to determine energy and
environmental indicators or parameters of the use of the considered
fuel types.
At the TLC evaluation, the following fuel types are accepted:
compressed natural gas (CNG), liquefied natural gas (LNG),
methanol, dimethyl ether (DME), synthetic diesel fuel (DT) and
hydrogen. It should be noted that environmental and energy
consequences of the use of these types of motor fuels obtained from
NG are different. It is explained by the fact that technologies of
extraction of the fuels and routes of their distribution are
significantly different.
2. The solution of the examined problem
Taking into account the known procedures for evaluation of
power unit and fuel indicators or parameters in TLC and according
to requirements of ISO 14040, ISO 14041, ISO 14042, ISO 14043
(in the Russian Federation - GOST R ISO 14040 - 14043)
international standards, the mathematical models describing
material and energy flows of the abovementioned motor fuels
obtained from NG for stages of the power unit TLC were
developed. At mathematical modeling, the following unit processes
were considered: NG extraction, its transportation, NG
compression, NG liquefaction, obtaining of synthesis gas, methanol,
DME, synthetic DT, hydrogen, as well as obtaining of auxiliary
fuels and electric energy necessary for the life cycle and the process
of fuel use.
TLC of the power unit operating on the considered fuels
includes three stages: fuel production, auxiliary processes and fuel
use. For different types of motor fuels, the stages of auxiliary
processes and fuel use, as well as a part of unit processes (NG
37

extraction, NG transportation), will be identical as to the
mathematical description.
This article shows the mathematical model of TLC of the power
unit fueled by CNG in more detail. Mathematical models for other
motor fuels considered in this research are not presented due to the
limited volume of the article.
NG extraction process
Input flows
Amount of extracted NG (raw material) necessary for TLC, kg:
(1) EXT
NG TRAN,
EXT
NGEXT,
in
NG EXT,М1
η
1g1М
,
whereNGEXT
g,
is the NG consumption ratio for NG extraction
process;EXT
is the NG extraction process efficiency
factor;EXT
NGTRANМ
, is the NG amount at NG transportation process
input, kg (see Formula 8).
Amount of auxiliary fuels at NG extraction process input, kg:
(2)
i
EXT
NG TRAN,
ifuel. aux.
NG
ifuel. aux., EXT
EXT
FUELAUX.
fuel aux. EXT,М
Hu
Hug1
η
1М ,
where ifuelauxEXT
g.,
is the i auxiliary fuel consumption ratio for NG
extraction process; NG
Hu is the NG low heat value, MJ/kg;
ifuelauxHu
.is the i auxiliary fuel low heat value, MJ/kg.
Heat energy of NG (raw material) for NG extraction process,
MJ:
(3)in
NG EXT,NG
in
NG EXT,МHuЕ .
Heat energy of auxiliary fuels for NG extraction process, MJ:
(4) i
ifuel. aux.
FUELAUX.
ifuel aux. EXT,
FUELAUX.
fuel aux. EXT,HuМЕ .
Electric energy for NG extraction process, MJ:
(5)EXT
NG TRAN,NG en. el.EXT,
EXT
EL
en. el. EXT,МHu
.g1
η
1Е
,
where.., enelEXT
g is the electric energy consumption ratio for NG
extraction process.
Output flows
Amount of harmful substance environmental emissions at NG
extraction process, kg:
(6)
k iEXT
4CH out,kEXT,NGEXT,EXT
in
NGEXT,
ki,
FUELAUX.
ifuel aux. EXT,
НЕout,
Мegη1Е
eЕМ
EXT,
where kie , is the k harmful substance specific emission at i auxiliary
fuel burning in technological unit, kg/MJ; kEXT
e,
is the k harmful
substance specific emission at NG burning at NG extraction
process, kg/MJ; EXT
CHoutМ
4,is the methane emission at NG extraction
process, kg:
(7) NG
EXT
NG TRAN,4CH EXT,
EXT
4CH out,HuМeМ .
Here,4,CHEXT
e is the specific methane emission caused by
process features and leaks, kg/MJ.
Amount of NG at NG transportation process input, kg:
(8) TRAN
NG EL.,
TRAN
NG FUEL,AUX.
TRAN
NG COMP,
TRAN
NG TRAN,
EXT
NGTRAN, МММ1η
1g1М
,
where NGTRAN
g,
is the NG consumption ratio for NG transportation
process;TRAN
is the NG transportation process efficiency factor;
TRAN
NGCOMPМ
, is the NG amount at compression process input, kg (see
Formula 19); TRAN
NGFUELAUXМ
,.is the NG amount at auxiliary fuel
obtaining process input, kg (see Formula 16);TRAN
NGELМ
.is the NG
amount at electric energy obtaining process input, kg.
NG heat energy for transportation process, MJ:
(9) EXT
NG TRAN,NG
EXT
NG TRAN,МHuE .
Heat energy environmental dissipation due to use of electric
energy, the energy of combustion of auxiliary fuels and natural gas
for NG extraction process, MJ:
(10) NGEXT,EXT
in
NG EXT,
FUELAUX.
fuel aux. EXT,
EL
en. el., EXT
EXT
env. to en. out,gη1ЕЕEE .
NG transportation process
Amount of natural gas at NG transportation process input, kg, is
determined from Formula 8.
Amount of auxiliary fuels at NG transportation process input,
kg:
(11)
i
TRAN
NG COMP,
ifuel. aux.
NG
ifuel aux. TRAN,
TRAN
FUELAUX.
fuel aux. TRAN,М
Hu
Hug1
η
1М ,
whereifuelauxTRAN
g.,
is the i auxiliary fuel consumption ratio for NG
transportation process.
NG heat energy for transportation process, MJ, is determined
from Formula 9.
Electric energy for NG transportation process, MJ:
(12) TRAN
NG COMP,NGen. el. TRAN,
TRAN
EL
en. el. TRAN,МHug1
η
1Е
,
where.., enelTRAN
g is the electric energy consumption ratio for NG
transportation process.
Heat energy of auxiliary fuels for NG transportation process,
MJ:
(13) i
ifuel aux.
FUELAUX.
ifuel aux. TRAN,
FUELAUX.
fuel. aux. TRAN,HuМЕ .
Output flows
Amount of harmful substance environmental emissions at NG
transportation process, kg:
(14)
k iTRAN
4CH out,kTRAN,NG TRAN,TRAN
EXT
NG TRAN,
ki,
FUELAUX.
ifuel aux. TRAN,TRAN
HE out,
Мegη1Е
eЕМ ,
where kTRAN
e,
is the k harmful substance specific emission at NG
burning at NG transportation process, kg/MJ; TRAN
CHoutМ
4,is the
methane emission at NG transportation process, kg:
38

(15) NG
TRAN
NG COMP,4CH TRAN,
TRAN
4CH out,HuМeМ .
Here,4,CHTRAN
e a specific methane emission caused by process
features and leaks, kg/MJ.
Amount of NG at auxiliary fuel obtaining process input, kg:
(16)
iNG
j
FUELAUX.
ifuel aux. j,
iFUELAUX.
NG FUEL,AUX.
TRAN
NG FUEL,AUX.Hu
E
1η
1g1М ,
whereNGFUELAUX
g,.
is the NG consumption ratio for auxiliary fuel
obtaining process;iFUELAUX .
is the i auxiliary fuel obtaining process
efficiency factor;FUELAUX
ifuelauxjE .
.,is the i auxiliary fuel heat energy for j
process input, MJ:
(17) i
FUELAUX.
ifuel. aux. EL,
FUELAUX.
ifuel aux. TRAN,
FUELAUX.
ifuel aux. EXT,
FUELAUX.
fuel aux. j,)ЕЕ(ЕЕ ,
whereFUELAUX
ifuelauxELE .
., is the i auxiliary fuel heat energy for electric
energy obtaining process input, MJ:
(18) i
ifuel aux.
FUELAUX.
ifuel aux. EL,
FUELAUX.
fuel aux. EL,HuМЕ .
Amount of auxiliary fuels for electric energy obtaining process
input, including NG, kg:
(19)
i
ifuel aux.
EXT
ifuel aux. EL,
iELifuel aux. EL,
FUELAUX.
fuel aux. EL,
Hu
Еη1g1М ,
whereifuelauxEL
g.,
is the i auxiliary fuel consumption ratio for
electric energy obtaining process;iEL
is the efficiency factor of
electric energy obtaining process from i auxiliary fuel.
Amount of natural gas at NG compression and refueling process
input, kg:
(20) COMP
fuel mot. FU,
COMP
NG COMP,
TRAN
NG COMP,М1
η
1g1М
,
where is the NG consumption ratio for NG compression and
refueling process; COMP
is the efficiency factor of NG compression
and refueling process; COMP
fuelmotFUМ
., is the amount of CNG at fuel use
process, kg (see Formula 27).
Heat energy of NG at natural gas compression and refueling
process, MJ:
(21) TRAN
NG COMP,NG
TRAN
NG COMP,МHuE .
Heat energy environmental dissipation due to use of electric
energy, the energy of combustion of auxiliary fuels and NG for NG
transportation process, MJ:
(22)
NG TRAN,TRAN
EXT
NG TRAN,
FUELAUX.
fuel aux. TRAN,
EL
en. el. TRAN,
TRAN
env. to en., out
gη1Е
ЕEE
.
NG compression and refueling process
Input flows
Amount of NG and heat energy of NG at NG compression and
refueling process input shall be calculated according to Formula 20
and Formula 21 respectively.
Electric energy for NG compression and refueling process, MJ:
(23) COMP
fuel mot. FU,NGen. el. COMP,
EL
en. el. COMP,МHug1
η
1Е
COMP
,
where .., enelCOMP
g is the electric energy consumption ratio for NG
compression and refueling process.
Output flows
Amount of harmful substance environmental emissions at NG
compression and refueling process, kg:
(24) k i
COMP
4CH out,kCOMP,NG COMP,COMP
TRAN
NG COMP,
COMP
HE out,Мegη1ЕМ ,
where kCOMP
e,
is the k harmful substance specific emission at NG
burning at NG compression and refueling process, kg/MJ; COMP
CHoutМ
4,
is the methane emission at NG compression and refueling process,
kg:
(25) NG
COMP
fuel mot. FU,4CH COMP,
COMP
4CH out,HuМeМ .
Here,4,CHCOMP
e a specific methane emission caused by process
features and leaks, kg/MJ.
Amount of CNG and heat energy of NG at fuel use process
input shall be calculated according to Formula 27 and Formula 28
respectively.
Heat energy environmental dissipation due to use of electric
energy, the energy of combustion and NG for NG compression and
refueling process, MJ:
(26) NG COMP,COMP
TRAN
NG COMP,
EL
en. el. COMP,
COMP
env. to en. out,gη1ЕEE .
Fuel use process
Input flows
Amount of CNG at fuel use process input, kg:
(27) CNG FU,
COMP
fuel mot. FU,WmМ ,
where W is the engine work, kWh; CNGFU
m,
is the specific CNG
consumption per 1 kWh of a power unit operation, kg/kWh.
Heat energy of CNG, MJ:
(28) COMP
fuel mot. FU,CNG
COMP
fue; mot. FU,МHuE .
Output flows
Amount of harmful substance environmental emissions at fuel
use process, kg:
(29) k
k FU,
FU
HE out,WeМ ,
where kFU
e,
is the k harmful substance specific emission at fuel use
process per 1 kWh of power unit operation, kg/kWh.
Net energy (work) obtained from CNG use, MJ:
(30) 3,6WEFU
workout, .
Heat energy environmental dissipation due to use of CNG, MJ:
(31) FU
workout,
COMP
fuel mot. FU,
FU
env. to en. out,ЕEE .
39

A mathematic model of TLC of the power unit working on
CNG in total
Input flows
Raw material resources, kg:
(32) in
raw APS,
in
NG FPS,
in
TLCМММ .
Energy, MJ:
(33) in
raw APS,
in
NG FPS,
in
TLCЕЕЕ .
Output flows
Harmful substances, kg:
(34) FUS
HE out,
APS
HE out,
FPS
HE out,
TLC
outММММ .
Energy to the environment, MJ:
(35) FUS
env. to en out,
APS
env. to en. out,
FPS
env. to en. out,
TLC
env. to en. out,ЕЕЕЕ .
Energy (useful work), MJ:
(36) FUS
workout,
TLC
workout,ЕЕ .
3. Results and discussion
There were numerical studies carried out based on the published
inventory data and using the developed TLC mathematic model.
[4,5] The calculation results for CNG are given in Figures 1-3. The
TLC analyses for other motor fuel types are currently under
development.
Fig. 1 Structure of energy consumption throughout TLC by stages.
Fig. 2 Structure of harmful substances emissions throughout TLC.
Fig. 3 Structure of CO2 emissions throughout TLC.
4. Conclusion
Following the comprehensive effectiveness evaluation of the
application of different alternative motor fuels obtained from NG,
the following may be noted for the TLC:
- the developed mathematic models consider energy and
material flows in the power unit TLC, consumption of natural
resources and energy, harmful substances emissions to the
environment;
- results of numerical analyses carried out using the
developed mathematical model allow to compare and select the
most promising types of alternative fuels according to the criteria of
energy efficiency and a level of environmental pollution by harmful
substances and greenhouse gases emission.
This paper is made within the applied research and experimental
developments under Agreement No. 14.626.21.0005 dd. 23 October
2017 for the following: “Creation of family of single fuel gas
engines and dual fuel gas and diesel engines on the basis of
KAMAZ-910 diesel engine having high energy and economy
performance indicators” (unique project identifier
RFMEFI62617X0005), made with the Ministry of Education and
Science of the Russian Federation.
5. References
1. Ou, X. Scenario Analysis on Alternative Fuel/Vehicle for
China’s Future Road Transport: Life-Cycle Energy Demand and
GHG Emissions.- Energy Policy, Vol. 38, No. 8, 2010, pp. 3943-
3956.
2. Rose, L. A comparative life cycle assessment of diesel and
compressed natural gas powered refuse collection vehicles in a
Canadian city.- Energy Policy, Vol. 52, 2013, pp. 453-461.
3. Sánchez, JAG. Comparison of Life Cycle energy
consumption and GHG emissions of natural gas, biodiesel and
diesel buses of the Madrid transportation system.- Energy, Vol. 47,
Issue 1, 2012, pp. 174-198.
4. Kozlov, A.V., Mirenkova, E.A. Mathematical models of the
total life cycle of a power unit operating on alternative motor fuels
derived from natural gas. Trudy NAMI, 2017, no. 4 (271), pp. 14–
24. (In Russian).
5. http://greet.es.anl.gov/
40

A RESEARCH ON THE STATIC STABILITY OF THE MAVS USING VIRTUAL
TUNNELS
M.Sc. Kambushev M. PhD.1, M.Sc. Biliderov S. PhD.1
Faculty of Aviation, Dolna Mitropolia – National Military University, Veliko Turnovo, Bulgaria 1
[email protected], [email protected]
Abstract: This report discusses the using of a free software to determine the aerodynamic coefficients of a developed MAV. The
coefficients obtained, as well as the aerodynamic forces and moments, have been investigated for their applicability in the balancing and
static stability of this type of aircraft. The results of the work are used to synthesize a suitable autopilot.
Keywords: MINI UNMANNED AIR VEHICLES (MAVs), AERODYNAMIC COEFFICIENTS, BALANCING, STATIC STABILITY, FREE
SOFTWARE, AUTOPILOT
1. Introduction
In the development of MAVs, it is necessary to select an
appropriate control system to perform the tasks which are to be
carried out by this type of aircrafts.
The synthesis of such kind of control system is directly related
to the properties and characteristics of the MAVs. In this case, it is
necessary to study in advance the object which is to be controlled in
order to introduce characteristics close to the real ones in the
algorithms of the MAVs flight-navigation complex.
A big challenge for the designers of the control system is the
handling of non-standard airfoils, for which it is not known what the
flying characteristics of the MAVs will be.
In order to reduce this uncertainty in the present work, the
characteristics of static stability in the vertical and horizontal flying
planes of non-standard airfoils for MAVs flying wing type were
investigated.
For achieving this goal, it is necessary to observe the conditions
of longitudinal and lateral equilibrium, to obtain the balancing
diagrams and hence to determine the static stability of the
longitudinal and lateral direction.
2. Stability research of a prototype of the developed
MAV
For the development MAV, the equilibrium conditions in the
longitudinal and lateral channels were first found, and then
balancing diagrams were researched. Static stability in the vertical
plane at glide angle has been established at 0oβ = and at
balancing deflecting angle бδ as well as in the horizontal plane at a
balancing angle of attack o
бα= α . For the purpose of the study,
velocity was selected in the longitudinal direction 3xV = m/s.
The software product to be used as a virtual aerodynamic tunnel
is XFLR5 [1, 2]. This product has its advantages and disadvantages.
Its biggest advantage is that it is free and many developers prefer to
work with it to study the characteristics of MAVs.
2.1. Stability research of a prototipe of the developed
MAV in longitudinal direction
The general case of longitudinal equilibrium of the MAVs is
given by the expressions:
(1)
.cos .sin 0
.sin .cos 0
0
x p a
z p a
y
F=P α XG θ=
F=P α+ZG θ=
M=
where the force indexes are aligned with the XFLR5 coordinate
system designations [4, 5, 6] and pα is the angle of mounting of
the engine.
Equilibrium of the Forces by:
the tangent to the trajectory is provided by the engine
operating modes;
the normal to the trajectory is ensured by the choice of the
angle of attack.
In the longitudinal movement for balancing of the MAVs the
pitching moment is determinative. The coefficient of this moment is
given by the expression [3]:
(2) . . .0y yozaTFxaTym=m+cXX+cz+m=
It can be seen from (2) that for equilibration of the longitudinal
moment four methods of balancing the MAVs in the vertical
channel are used:
1. to use self-stabilizing airfoils for wing construction (first
member of (2));
2. to move the masses in the MAVs so that it gets balanced
(second member of (2));
3. to change the V-shape of the wing (third member of (2));
4. to change the angle of the elevator from zero to the
balancing бδ (fourth member of the(2)).
The first method is inapplicable to this study because the
airfoils were obtained when making a MAV from readymade
templates. The second method produces a result within the range
4o± at negative attack angles, which is not acceptable.
The variation of the V-shape of the wing within the frame
10o± yields a result similar to the method described above.
For the purposes of the study, the result gives the last one that is
the fourth method. In this balancing test is used only the elevator of
MAV.
Figure 1 shows the longitudinal motion picture in the vertical
plane in the environment of the XFLR5.
Fig. 1. Stability research of the developed MAV in longitudinal direction.
41

For the purpose of the survey, the angle of attack changes in the
range 20 60o
α= ÷ . The results obtained for the pitching
moment coefficient mc =f α and the lift force coefficient
L mc =f c are shown in Figure 2.
Fig. 2. Coefficients of the pitching moment and lift force.
From this figure (Figure 2) it can be seen that when 0mc =
the angle of attack and the coefficient of lifting force are negative.
This means that the model can not fly even though it is statically
stable. In other words, it must be balanced in the vertical plane.
Another parameter which monitors the balance of the MAV in
the longitudinal movement is the position of the center of pressures
on the X axis (Figure 3).
Fig. 3 The position of the center of the pressures on axis X.
Figure 4 shows the dependence of the coefficient of the pitching
moment from the angle of attack after balancing deflection of the
elevator.
Fig. 4 Coefficient of the pitching moment in a function of the angle of attack
The results shown in Figure 4 are obtained at a balancing angle
7,3o
бδ = , which for the XFLR5 product means an upward
deflection of the elevator. For the balancing angle of the attack is
obtained 32,85.10o
бα=
which is close to the
computational error.
After balancing of the MAV on the pitch movement, it is
checked for the lifting force coefficient (Figure5).
Fig. 5 Coefficient of the lifting force in a function of the angle of attack.
For the balancing angle of the attack, the coefficient of the
lifting force is 0Lc > , which means that the balanced in the
vertical plane MAV can fly.
The picture of the position of the center of pressure on the X
axis (Figure 6) is now different from Figure 3.
Fig. 6 The position of the center of the pressure on axis X after balancing
In Fig. 7, it is shown the change of the application point of the
pressure center in the direction of the axis X in function of the angle
of attack.
Fig. 7 Changing position of the point of the pressure in X-direction
42

From this graph (Figure 7) it becomes clear that there is no
singularity at the angle of attack because the pressure point remains
on the X axis and the pitch reference point coincides with the point
of application of the pressures.
Fig. 8 The quality of the wing in a function of the angle of attack
The quality of the wing for this type of MAVs at angles of
attack close to the balancing one approaches its best (Figure 8).
For MAVs operating at low Reynolds numbers with
comparatively small variations in flight velocity, the balancing
diagrams give a single value for the deflection angle of the elevator.
Then, for the static stability of these aircrafts to the angle of attack,
it is judged by Figure 4 and Figure 5. Based on these figures it can
be concluded that the aerodynamic focus is behind the center of the
gravity, which creates an additional pitching moment, striving to
reduce the angle of attack - or the plane is statically stable to the
angle of attack.
As the speed increases, the lift force of the investigated aircraft
also increases. From there, the plane has a tendency to increase the
angle of the trajectory slope and hence decrease its speed. At the
expense of this trend, there is an extra pitching moment that seeks
to counter the rise in the lift power. It follows that the aircraft is
statically stable in speed.
2.2. Stability research of a prototype of the developed
MAV in latitudinal direction
The conditions for static stability in the lateral channel are given
by the equations [3]:
(3)
.cos .cos 0
. . 0
. . 0
y a
δβ еx x x е
δβ еz z z е
F=Y+G =
M=Mβ+Mδ=
M=Mβ+Mδ=
,
which conform to the designations accepted in product XFLR5 [4,
5].
The exploration in the environment of the XFLR5 of the MAVs
in the horizontal plane of the lateral movement is shown in Figure
9.
Fig. 9 Stability research of the developed MAV in lateral direction.
Consideration type MAVs are balanced in lateral movement
only with ailerons. Then for the coefficients of the heading and
lateral moment are gotton the following expression:
(4) 0
0
δβ ex x e
β
z
m.β+m.δ=
m.β=
.
When performing a flight with sliding angle, an aerodynamic
force are appeared and applaed to the lateral aerodynamic focus. In
Figure 10 it is shown the dependence of the lateral force on the
sliding angle.
Fig. 10 Coefficient of the lateral force in a function of the angle of sideslip.
From Figure 10 it can be seen that, within the limits of the small
sliding angles, the lateral force attempts to damping the fluctuation
of the nose of the aircraft, but, as the sliding angle rises, this
tendency is lost.
Fig. 11 Coefficient of the moment of rolling as function of the angle of
sideslip.
As a result of the lateral force, a thrust moment is appeared. Its
coefficient is shown in Figure 11 and a lateral torque has a
coefficient shown in Figure 12.
43

Fig. 12 Coefficient of the moment of heading as function of the angle of sideslip.
The rolling moment seeks to roll the plane and heading moment
has tendency to remove the sliding.
The displacement of the lateral center of pressure relative to the
sliding angle is shown in Figure13.
Fig. 13 Changing position of the point of the pressure in Y-direction
For static heading stability it is judged from the results in Figure
11. It becomes clear that the center of gravity of the MAV lies in
the front of the side aerodynamic focus, which is why the
coefficient of the heading moment is negative. Therefore, this MAV
is static stable in the heading.
Lateral static stability is established with results shown in
Figure 13. In this figure it can be seen that the investigated MAV is
statically unstable laterally.
3. Conclusions and results
1. MAV in longitudinal and lateral motion was investigated.
2. In the longitudinal movement MAV is statically stable in
velocity and angle of attack.
3. In the lateral movement, studied MAV is statically stable in
heading, but it is statically unstable laterally.
4. Bibliography
[1] Горбунов А.А., Синютин С.А. Математическая модель
беспилотного летательного аппарата с эллипсным крылом.
ИНЖЕНЕРНЫЙ ВЕСТНИК ДОНА. ISSN: 2073-8633.
[2] Николаев Н.В. Оптимизация контуров профилей в
разных сечениях крыла большого удлинения. XXVI
Научно-техническая конференция по аэродинамике 2015.
Центральный аэрогидродинамический институт им.
профессора Н.Е. Жуковского.
[3] Лысенко Н. М. Динамика полета. София, 1977, 638с
[4] A. Deperrois: About performance and stability analysis
using XFLR5 (November 201)
<https://www.scribd.com/doc/101229735/XFLR5-and-Stability-
Analysis> 01.04.2018
[5] Martin Willner: A tutorial for XFLR5 version 1
<https://www.scribd.com/document/40661331/XFLR5-Tut-v1>
01.04.2018
[6] Guidelines for XFLR5
<https://osdn.net/projects/sfnet_xflr5/downloads/Guidelines.pdf
> 01.04.2018
44

ANALYTICAL AND FINITE ELEMENT IN-PLANE VIBRATION ANALYSIS OF A
GANTRY CRANE M.Sc. Şahin T.1, M.Sc. Candaş A.2, Prof. İmrak C.E. PhD.2
Istanbul Technical University, Graduate School of Science Engineering and Technology, Turkey1
Istanbul Technical University, Faculty of Mechanical Engineering, Turkey2
Abstract: Every object in nature has an infinite number of vibration frequency and amplitude as called “Natural Vibration Frequency”.
Developing computer capacities allow calculating of natural frequencies and shapes of complex structures more accurate and
understandable. In this study, a dual-trolley (2x400 tons) heavy-duty overhead gantry crane that can carry loads up to 800 tons was
analysed by mathematical and finite element methods. The mathematical method is based on Euler-Bernoulli transverse vibration approach.
On the other hand, finite element method is one of the most common numerical methods that can solve many engineering problems in a
range from solid mechanics to acoustic. The generated solid model was analysed by the finite element method with the help of ANSYS
Workbench 14.5 which is a commonly used analysis program. The obtained values of natural frequencies at mathematical calculations and
finite element analysis were compared and presented.
Keywords: GANTRY CRANE, EULER-BERNOULLI TRANSVERSE VIBRATION, VIBRATION ANALYSIS, FINITE ELEMENT
ANALYSIS
1. Introduction
The cause of environmental impact and other reasons, vibration
is a problem in gantry crane constructions. Vibrations can lead to
serious consequences, sometimes leading up to the collapse of a
crane. Concepts of “Natural Frequency” and “Resonance” should be
examined firstly when determination of mentioned vibrations. The
calculation of “Natural Vibration Frequencies” and to know the
amplitudes of them are essential in solving of the vibration-induced
engineering problems. Natural frequency is a frequency which
depends on mass and flexibility of a structure and if it is induced at
that frequency, it will vibrate continuously at high amplitude. If an
object is excited by a frequency coincides with the natural
frequency of that object, a resonance occurs and it vibrates structure
excessively. Different methods can be used to avoid the resonance
problem during the design of structures. Analytical approaches for
non-complex system makes it easy such as verifying by numerical
methods for detecting errors in the calculations and preventing the
problems that may be encountered. Although analytical calculations
can be made, for calculating of complex shapes numerical methods
should be applied, such as finite element method [1].
In this study a dual-trolley, 2×400 tons, heavy duty overhead
gantry crane (Fig. 1) that can carry loads up to 800 tons was
analyzed by mathematical and finite element methods.
Fig. 1Vibration model of the crane
In this figure, dimensions and other parameters are L = 103.85
m; H = h =74.27 m; A1 = 1.04 m2; I1 = 2.078 m4; ρ = 7850 kg/m3;
E=210 GPa and the relation of this parameters with unknown
parameters for α=0,332; β=75,643; 𝜉=0,8846; η=1,1663 are;
𝑠 =𝐻
𝐿 , 𝑝 =
ℎ
𝐿 , 𝛼 =
𝐼1
𝐼2 , 𝛽 =
𝐼1
𝐼3, 𝜉 = 𝛼
𝐴2
𝐴1
4 , 𝜂 = 𝛽
𝐴3
𝐴1
4
The more precise dynamical analysis of engineering structure is
based on the assumption that a structure has distributed masses. In
this case, the structure has infinite number degrees of freedom and
mathematical model is presented with a partial differential equation.
Additional assumptions allow construction of the different
mathematical models of transversal vibration of the beam. The
simplest mathematical models consider a plane vibration of a
uniform beam with, taking into account only, bending moments;
shear and inertia of rotation of the cross sections are neglected. The
beam upon these assumptions is called as Bernoulli-Euler beam.
2. Mathematical Modelling
The mathematical method is based on Euler-Bernoulli
transverse vibration approach [2]. Early researchers recognized that
that the bending effect is the single most important factor in a
transversely vibrating beam. The Euler Bernoulli model includes
the strain energy due to the bending and the kinetic energy due to
the lateral displacement. The Euler-Bernoulli model dates back to
the 18th century. Jacob Bernoulli (1654-1705) first discovered that
the curvature of an elastic beam at any point is proportional to the
bending moment at that point. Daniel Bernoulli (1700-1782),
nephew of Jacob Bernoulli formulated the differential equation of
motion of a vibrating beam. Later, Jacob Bernoulli's theory was
accepted by Leonhard Euler (1707-1783) in his investigation of the
shape of elastic beams under various loading conditions. Many
advances on the elastic curves were made by Euler. The Euler-
Bernoulli beam theory, sometimes called the classical beam theory,
Euler beam theory, Bernoulli beam theory, or Bernoulli-Euler beam
theory, is the most commonly used because it is simple and
provides reasonable engineering approximations for many
problems. The differential equation of a uniform beam [2]:
𝐸𝐼𝑑4𝑦
𝑑𝑥4 = 𝑞
The elastic modulus is E; the moment of inertia is I, the
transverse load that applied on a unit length of the beam is q. The
load that applied on a unit length in case of free vibration:
𝑞 = −𝜌𝐴𝑑2𝑦
𝑑𝑡2
Here, ρ is density of the material and A is the sectional area. The
mathematical model of plane vibration of Euler-Bernoulli Beam
when the beam is under a force f(x,t).
𝐸𝐼𝑑4𝑦
𝑑𝑥4 + 𝜌𝐴𝑑2𝑦
𝑑𝑡2 = 𝑓(𝑥, 𝑡)
Here, y(x,t) is the lateral displacement and x and t are x-axis and
time respectively. The initial and boundary conditions are:
𝑦 𝑥, 0 = 𝑢 𝑥 ; 𝑑𝑦
𝑑𝑥 𝑥, 0 = 𝑣(𝑥)
The lateral displacement of the beam when t = 0 is u(x) and the
first derivative of the displacement is v(x). However, the Euler
Bernoulli model tends to slightly overestimate the natural
frequencies. The procedure of determining Eigen frequencies at
complex systems (systems with large number of the freedom
45

degrees) is the most crucial phase of dynamic analysis. Accurate
determination of Eigen frequencies was limited to the simple
supporting structure (simple beam and console). Finding out
solutions of frequent equation for complex elastic bodies is very
difficult, because it contained the trigonometric and hyperbolic
functions. Mathematica software enables routine solving of
frequency equations for complex elastic bodies oscillation.
3. Finite Element Analysis
By Finite Element Method (FEM), structural analyzes can be
made rapidly, reliably and nondestructively. Its popularity comes
from his realistic results which were taken from the comparisons
between FEM and analytical approaches. A variety of
specializations such as mechanical, aeronautical, biomechanical
engineering commonly use integrated finite element method in
design and development of their products. As finite element method
software, ANSYS helps tremendously in visualization of stiffness
and strength and also in minimizing weight, materials, and costs. In
this study, ANSYS is used to determine the natural frequencies with
modal analysis. In analysis, 260991 meshed elements and 666104
nodes were used. Finite element method allows entire designs to be
constructed, refined, and optimized before the design is
manufactured.
4. Results
The maximum displacements in different mods are shown in
Figure 2. The natural frequencies and relative error between
mathematical and finite element analysis are shown in Table 2. The
maximum difference is 7.02%. In modal analysis of a crane, the
reliable results can be obtained by using of finite element analysis.
It can be used in the design stage of a crane to avoid the resonance
situations.
Fig. 2 Maximum Displacements in Different Mods: a, b) Front and Top View in Mod 1; c, d) Front and Top View in Mod 2; e, f) Front and Top View in Mod 3; g, h) Front and Top View in Mod 4.
46

Table 1: Comparison of Mathematical and Finite Element Analysis Natural Frequencies [Hz]
Mod Natural Frequency [Hz]
Mathematical Analysis
Natural Frequency [Hz]
Finite Element Analysis
% Relative
Error
1 0.1908 0.2052 7.02
2 1.4526 1.5758 7.81
3 2.3861 2.4432 2.33
4 3.3048 3.3249 0.60
5. Conclusion
In the first chapter, historical development of cranes and crane
types are introduced primarily. Then, according to Euler-Bernoulli
transverse vibration approach, the applied method for the creation
of the mathematical model of the in-plane vibration of a gantry
crane is introduced. For the mathematical model, the differential
equations are prepared by using Fourier and Krylov-Duncan
Methods. By the methods Fourier and Krylov-Duncan, the
differential equation of the transverse vibration of the uniform
Bernoulli-Euler beam changed to uncoupled ordinary differential
equations with respect to unknown functions which are depend on
coordinate and time. Eigen functions and eigenvalues, the natural
frequencies of this crane was obtained. In the same section, the
modal analysis of the crane made by using finite element method
and natural frequencies are obtained. Before running the program,
the general settings of modal analysis were prepared. Most
important parts of the settings are, entering the engineering data,
sizing and the tolerance value. After the settings, meshing was
generated.
In the next section, the finite element method and the modal
analysis has described. In order to apply this method to the problem,
firstly, all parts creating the crane were 3-D modeled by using the
SOLIDWORKS drawing program.3-D modeled parts were
assembled by using the same drawing program. All 3-D models
were created with the help of the draft drawings which were formed
by mechanical calculations and the selection of the structural
elements. The generated solid model was analyzed by the finite
element method with the help of ANSYS Workbench 14.5. Mesh
quality is the most important factor that affects the finite element
results. Increasing mesh quality increases the accuracy of the finite
element method. Although minimizing size of the meshes can be an
effective method to increase mesh quality, the solving capacity of
the computers limit us. Then, the boundary conditions were applied.
It was applied by fix support and displacement commands.
In the last section, the obtained values of natural frequencies at
previous section are compared and the results of comparison are
presented.
5. References
[1] Akgün G. (2013) Design and analysis with numerical method of
2x400 ton gantry crane, MSc Thesis, ITU Graduate School of
Science, Engineering and Technology, Istanbul Technical
University, Turkey.
[2] Karnovsky İ.A. ve Lebed O. (2009) Advance Method of
Structural Analysis, Springer, New York, USA.
47

MECHANICAL DESIGN AND FINITE ELEMENT ANALYSIS OF A 3 UNIT CUBESAT
STRUCTURE
BsC. Güvenç, C. C., BsC. Topcu B., and Ph.D. Tola C.
Faculty of Aeronautics and Astronautics – University of Turkish Aeronautical Association, Turkey
Abstract: The aim of this study is to design a 3 Unit CubeSat structure performing finite element analysis under static, dynamic and
thermal loads. The main idea of this process is to construct a 3U CubeSat main frame that can structurally endure launching process and
space environment. To accomplish the task, a 3U CubeSat structure is designed and standard loads that a 3 unit CubeSat structure has to
endure are obtained. After the selection of a suitable material, modal analysis, quasi-static launch analysis and thermal stress analysis
coupled with heat transfer analysis are accomplished in Abaqus environment. Finally, the results are evaluatedand endurance level of the
design is determined.
Keywords : 3U CUBESAT, STRUCTURAL DESIGN, FINITE ELEMENT ANALYSIS
1. Introduction
Cubesat is a cubic shaped small satellite which has a
dimension of 10x10x10 cm for a 1 Unit. However, some cubesats
are in the dimensions of 10x10x20cm which are called 2 Units,
10x10x30 cm are called 3 Units. The difference of its dimensions
is related about their specifications according to their missions.
Studies on cubesats started in 2001, but until 2013, most of
the universities studied on 1 Unit Cubesats to initiate their
subsystem development research on relatively small models.
Cihan, et. al. designed an innovative cubesat structure provides
flexibility for designers during the design, development and test
processes of 1U cubesats at 2011 [1]. Oh, et. al. peformed the
structural design and performed modal and quasi-static analysis
of a 1U cubesat [2]. Sekerere et. al. examined the structural
strength of a 1U cubesat and performed the modal analysis of it
[3]. After 2013, along with the increase in the work carried out
and change of wishes, multi-unit cube satellites began to be used,
especially 3U. As known, the studies of space are costly and the
environment of space is risky. As an engineer, the aim should be
both reduce of this cost and risk. To do this the choice of small
satellites are standing out.
In this study, by considering that the importance of cubesats
for space applications and subsystem development, a 3U cubesat
structure is designed and analyzed using finite element method to
determine its natural frequencies and mode shapes, its stress level
during the launch period, its temperature distribution at the space
environment and thermal stress distribution of the satellite
governing from the temperature distribution.
2. Geometry and Material Properties
A 3U cubesat shown in Fig. 1 is designed in SolidWorks
environment. Cubesat panels are designed from Al7075 T651
material having 3mm thickness. Properties of the Al7075 T651 is
summarized in Table 1.
Fig. 1 Structural Geometry of the 3U cubesat.
Table 1: Material Properties of Al7075 T651 [4, 5].
Symbol Definition Value Unit
E Young’s Modulus 71.7 GPa
ν Poisson’s Ratio 0.33 -
ρ Density 2810 kg/m3
k Conductivity 130 W/(m.K)
α Coefficient of Thermal
Expansion 25.2 μm/(m.oC)
cp Specific Heat 960 J/(kg. oC)
σyield_std Yield Stress at 24 oC 503 MPa
σyield_hot Yield Stress at 316 oC 45 MPa
ε Emissivity 0.81 -
3. Finite Element Model
The finite element model of the cubesat geometry consisting
of 226271 nodes and 33764 hexagonal quadratic elements is
prepared in Abaqus 6.12 as it is seen from Fig. 2.
Fig. 2 Mesh structure of the 3U cubesat.
The model consists of assembly of the different panels so,
they are attached to each other from the certain locations in the
finite element model as it is in reality.
4. Modal Analysis
Natural frequencies of the 3 unit cubesat structure is designed
considering the excitation frequencies of the Polar Satellite
Launch Vehicle (PSLV). According to the vehicle’s
specifications, natural frequencies of the cubesat should not be
less than 35 Hz in longitudinal axis and 20 Hz in lateral axis [1].
At the same time, there will be high amplitude harmonic
frequencies are under the 100 Hz during the launching process
48

so, cubesat natural frequencies of the cubesat has to be more than
100 Hz in order to prevent resonance [6].
Modal analysis are performed using empty cubesat structure
in order to make a convervative analyse preventing extra stiffness
governing from the card structures. Results of the modal analysis
excluding the free body motion modes are summarized in Table
2.
Table 2: Modal Analysis Results.
Mode Frequency [Hz]
1 232.13
2 326.54
3 461.72
4 546.04
5 645.17
Accortding to the results, the lowest mode is approximately
232.13 Hz (Fig. 3) and since this value is far beyond the crticial
treshold (100 Hz) it is acceptable.
Fig. 3 Mode-1 (232.13 Hz).
5. Quasi-Static Launch Analysis
During the launch phase, the cubesat has to endure the
acceleration loading governing from the launching process. In
order to determine the stress level on the cubesat due to these
acceleration loads, quasi static launch analysis are performed.
Polar Satellite Launch Vehicle, quasi-static launch loads are 11 g
in “z” axis and 6 g in both for “x” and “y” axes [7].
Within the content of the quasi-static launch analysis, masses
of the cards and the equipments belonging to each unit (1U) of
the cubesat are modeled as point mass assuming that the satellite
is fully loaded and they are conneted to the related portions of the
cubesat frame via couplings as illustrated in Fig. 4.
Fig. 4 Locations of the point masses and connection of them.
The structure’s top face has been fixed in Z axis to analyze
the worst case scenario and quasi static accelerations are applied
on the system (Fig. 5).
Fig. 5 Boundary conditions and loads for quasi-static launch analysis.
According to the finite element analysis results, the highest
stress level on the cubesat structure governing from the launching
loads is determined as 453.548 MPa (Fig. 6). Detailed results can
be further examined from Fig. 7 and Fig. 8.
Fig. 6 Von Misses stress distribution due to launch [MPa].
Fig. 7 Von Misses stress distribution on upper panels due to launch
[MPa].
Fig. 8 Von Misses stress distribution on a panel due to launch [MPa].
49

Considering the yield stress of the material is 503 MPa for
standard atmospheric conditions, factor of safety value for the
quasi-static launch analysis is found as 503/453.548 = 1.1
approximately that is acceptable.
6. Heat Transfer Analysis
Cubesat subsystems and structures have to endure harsh
space environment conditions such as radiation incoming from
the Sun, albedo reflecting from the Earth, and infrared energy
emitting from the Earth (Fig. 9). To determine the temperature
distribution of the satellite during its mission it is required to
perform a heat transfer analysis considering the worst case
scenario.
Fig. 9 Low Earth Orbit (LEO) heat fluxes [8].
Selecting the orbital altitude of the cubesat as 600 km and
referencing the orbital calculations on Ref [8], period of the
cubsat is determined as 5801 s and total exposed time for solar
radiation coupled with albedo during a period is calculated as
2127 s. Heat fluxes corresponding to the solar radiation, the
albedo and the Earth infrared energy are taken into account as
1363 𝑊/𝑚2, 406 𝑊/𝑚2 and 237 𝑊/𝑚2 respectively. Therefore,
the heat flux loading illustrated in Fig. 10 is applied to the
cubesat.
Fig. 10 Variation of heat fluxes with time.
Application regions of the heat fluxes are selected as in Fig.
11 to simulate the worst case for the cubesat. In addition to the
heat fluxes on the cubesat surfaces, the satellite is emitting
radiation as a result of its temperature from its outer surfaces.
Fig. 10 Heat flux application surfaces on the cubesat.
Assuming that the initial temperature of the cubesat is 25 oC,
a transient heat transfer analyse having a resolution of 60 seconds
is performed to find out the highest temperature that may be
encountered during a period considering the worst case scenario.
According to analysis results, highest temperature
distribution on the cubesat is encountered at t=2040s as it is
illustrated in Fig. 11.
Fig. 11 Temperature distribution on the cubesat at t=2040s [oC].
Tempterature variation of the hottest node during an orbital
period can be examined from Fig. 12.
Fig. 12 Temperature variation of the hottest node.
7. Thermal Stress Analysis
Thermal stress analyses are performed using the outputs of
the heat transfer analysis in order to find out the stress levels on
the cubesat frame governing from the thermal loads. Quasi-static
thermal stress analyse is performed within the content of this
work assuming that the cubesat temperature is increased from 25 oC to the temperature distribution was shown in Fig. 11.
According the analyse results, thermal stresses govering from
the temperature variation is shown in Fig. 13.
Fig. 13 Von Misses stress distribution due to temperature load [MPa].
50

Detailed results can be further examined from Fig. 14 and
Fig. 15.
Fig. 14 Von Misses stress distribution on a due to temperature load
[MPa].
Fig. 15 Von Misses stress distribution on another due to temperature
load [MPa].
Temperature variation of the node having the highest thermal
stress is also illustrated in Fig 16 to make an evaluation
considering the endurance limit of the material at high
temperatures.
Fig. 16 Temperature variation of the node having the highest thermal
stress.
According to the material properties, yield stress of the Al-
7075 T651 material is 45 MPa at 316 oC. Considering the highest
thermal stress value on the cubesat frame is 15.446 MPa, the
factor of safety for the thermal stress analysis is calculated as
2.91 that is also acceptable.
8. Conclusion
Within the content of this work, structural frame for a 3U
cubesat is designed and analyzed using finite element method via
Abaqus commercial software. Modal analysis, quasi-static launch
analysis, heat transfer analysis and thermal stress analyses are
performed and evaluation methodology of the results are
explained.
According to the results, cubesat’s modal frequency values
are sufficiently higher than the excitation frequency values of the
launch vehicle (PSLV) and factor of safety value of the cubesat
structure governing from launching process is approximately 1.1
that is acceptable. According to the heat transfer analysis results
that are determined considering the worst case scenario, the
highest temperature value on the cubesat frame will be at most
approximately 329 oC. The temperature distribution values may
change and probably decrease according to the orbital position
and also according to the axial rotation motion of the satellite
itself. On the other hand, the structural factor of safety value of
the cubesat is calculated as 2.91 according to the thermal stress
analysis results that are conducted using the temperature
distribution results of the heat transfer analysis. Under these
circrumstances it can be stated that analysis results of the
preliminary design of the 3U cubesat structure is satisfactory and
detail design process can be initiated.
As a future work, it is planned to add further details such as
card structures, connection parts and other kinds of subsystem
elements to the finite element model to perform a detailed
analysis for both quasi-static launch and heat transfer analysis. It
will be better to use an orbital simation software to increase the
accuracy of the heat transfer and thermal stress analysis for the
future work.
9. References
[1] M. Cihan, A. Çetin, A., M. O. Kaya, and Inalhan, G., “Design and analysis of an innovative modular cubesat structure for ITU-pSAT II,” 5th International Conference on Recent Advances in Space Technologies, Istanbul, Turkey, 2011.
[2] H. Oh, S. Jeon, and S. Kwon, “Structural Design and Analysis of 1U Standardized STEP Cube Lab for On-Orbit Vertification of Fundamental Space Technologies,” International Journal of Materials, Mechanisms and Manufacturing, vol. 2, no. 3, pp. 239-244, 2014.
[3] K. Sekerere, and T. Mushiri, “Finite element analysis of a cubesat,” International Symposium on Industrial Engineering and Operations Management, Bristol, UK, 2017.
[4] Matweb Material Property Data, retrieved from: http://www.matweb.com/search/DataSheet.aspx?MatGUID=4f19a42be94546b686bbf43f79c51b7d on 05.03.2018.
[5] N. Khalifa, and T. E. Sharaf-Eldin, “Earth Albedo perturbations on Low Earth Orbit Cubesats,” International Journal of Aeronautical and Space Sciences, vol. 14, no. 2, pp. 193-199, 2013.
[6] M. Süer, E. Yakut, C. Oran, and A. R. Aslan, “NART – Nano Küp Uydular için Boyutlandırılabilir Modüler Uydu Yapısı Alt Sistemi,” V. Ulusal Havacılık ve Uzay Konferansı, Kayseri, Turkey.
[7] S. Raviprasad and N. S. Nayak, “Dynamic Analysis and Verification of Structurally Optimized Nano-Satellite Systems,” Journal of Aerospace Science and Technology, , vol. 1, no. 2, pp. 78-90, 2015.
[8] A. Lahrichi, “Heat Transfer Modeling and Simulation of MASAT1”, M.Sc. Thesis, Al Akhawayn University, 2017.
51

EFFECTS OF PROPELLANT PROPERTIES ON INTERNAL BALLISTIC
PERFORMANCE RESULTS OF SOLID ROCKET MOTORS
Ceyhun Tola, Ph.D.
Faculty of Aerospace Engineering – University of Turkish Aeronautical Association, Turkey
Abstract: The aim of this research is to examine the effects of propellant properties such as: combustion temperature, propellant density,
characteristic velocity, reference burning rate and burning rate pressure exponent on internal ballistic performance of solid rocket motors. A
zero dimensional internal ballistic solver is developed and internal ballistic performance analyses of solid rocket motors having slotted cross
section are performed. Thus, different internal ballistic results such as maximum combustion pressure, burning time, specific impulse and
total impulse are determined. Finally, variation of these response variables according to solid propellant properties are determined
constructing different response surfaces. Graphical results represented in this work makes easier to select solid propellants for a certain
kind of geometrical configuration.
Keywords: SOLID ROCKET MOTOR, INTERNAL BALLISTIC PERFORMANCE, PROPELLANT, RESPONSE SURFACE
1. Introduction
During the design phase of a solid rocket motor (SRM),
determination of the internal ballistic performance of the system has
a special importance since this process enables to check whether the
system requirements are satisfied or not. In order to analyze the
performance of the system and to meet these requirements in a
fastest manner, different researches on SRM design have been
conducted so far. Açık, developed a tool to optimize thrust – time
profile of a SRM by changing sectional parameters of the propellant
coupled with nozzle dimensions [1]. Celegern developed a code to
select best parameters providing desired internal ballistic
performance with lowest possible mass [2]. In addition to geometric
optimization studies which are conducted to find out the best
propellant or SRM geometry, solid propellant selection process has
also be taken into account meticulously. Therefore, effects of
propellant properties on pressure – thrust curve and performance
results based on this curve are examined for a constant SRM
geometry using the response surface method. Internal ballistic
performance analyses required to construct response surfaces are
conducted using a zero dimensional (0D) internal ballistic solver
which is developed in Matlab environment. Graphical results
summarizing the effects of combustion temperature, propellant
density, characteristic velocity, reference burning rate and burning
rate pressure exponent on maximum combustion pressure, burning
time, specific impulse, total impulse provide useful information that
can be used during the design phase of the SRMs.
2. Solid Rocket Motors
SRMs are consist of motor case, insulation, igniter, nozzle and
solid propellant. Sectional geometry of the propellant determines
the burning behavior of it and so, shape of the propellant is selected
in accordance with mission type of the system. Fig. 1 shows thrust –
time profiles belonging to different propellant sections.
Fig. 1 Variation of thrust profiles according to propellant section [3].
Propellant type also affects the combustion pressure and thrust
history of the system. Therefore, during preliminary design phase,
propellant have to be selected so that its burning characteristics will
satisfy the performance requirements of the mission without
compromising from structural integrity of the propellant. It is
significant to examine the effects of propellant properties on
internal ballistic performance results to make better selections.
3. Internal Ballistic Performance Analysis
Development of Zero Dimensional Internal Ballistic Solver
Performance of a SRM can be analyzed using a zero
dimensional (0D) internal ballistic solver. Thus, it is possible to
determine pressure – time and thrust – time histories coupled with
total impulse and specific impulse in the fastest manner. These
kinds of practical solvers are widely used for optimization processes
and they can also be used to provide results required to construct
response surfaces.
In this work, a 0D internal ballistic solver is developed under
the following assumptions. Combustion gasses are assumed as ideal
gasses. Properties of combustion gases are not varying throughout
the motor. Effects of erosive burning is neglected since aspect ratio
of the analyzed propellant geometry is less than 5. Inertia of the
combustion gasses is neglected. The flow through the nozzle is
assumed as one dimensional, steady and isentropic. It is also
assumed that burning rate (rb) is varying in accordance with Saint
Robert’s burn rate law shown in equation (1) [4].
(1) n
b cr a P
Where, Pc is chamber pressure, a is burn rate coefficient and n is burn rate exponent. For a certain type of solid propellant, a and n are constant.
The 0D internal ballistic solver is based on the conservation of
mass principle. Application of the principle constructs equation (2).
(2)
dt
dVP
c
APPaATR
Vdt
dP ic
tcn
cbpc
i
c
*
1
Where dVi/dt = Ab.rb = Ab.a.Pcn. Additionally, Tc is chamber
temperature, R is universal gas constant, ρp is density of the
propellant, Ab is burning surface of the propellant, At is throat area
of the nozzle, c* is characteristic velocity of the propellant and Vi is
port volume. Since Ab and Vi are varying with time, these
parameters are calculated performing burn-back analysis.
Solution of the equation (2) provides chamber pressure – time
history of the SRM. In order to calculate thrust – time history,
nozzle exit pressure (Pe) is calculated from equation (3) using
nozzle dimensions and thrust coefficient (CF) is calculated from
equation (4) [4].
52

(3)
11
1
1
11
1
2
1
c
e
c
e
e
t
P
P
P
P
A
A
(4)
c
ambe
c
eF
P
PP
P
PC
1
1
12
11
2
1
2
Where, 𝛾 represents the ratio of specific heats, Pamb denotes
ambient pressure, and ε represents the ratio of nozzle exit area to
nozzle throat area (Ae/At). Finally, thrust (F), total impulse (Itotal)
and specific impulse (Isp) are calculated using equations (5), (6) and
(7) respectively [4].
(5) tcF APCF
(6)
t
total dtFI0
(7)
0
*
g
CcI Fsp
Where, g0 denotes gravitational constant.
Area under the thrust – time curve corresponds the total impulse
which designates range of the system. On the other hand, the
specific impulse is measurement of efficiency of the SRM.
Therefore, during the design phase, it is crucial to satisfy the total
impulse requirements with a motor having higher specific impulse.
Grain Burn-back Analysis
This study only investigates the effects of propellant properties
on internal ballistic performance results. To do this, it is required to
perform analyzes on a constant SRM geometry by changing
propellant data. Fig. 2. represents the propellant geometry having
slotted cross section and Table 1 contains geometrical dimensions
of the propellant and the nozzle that are analyzed in this work.
Fig. 2 Geometry of the analyzed slotted grain.
Grain burn-back analysis are required to determine the variation
of Ab and Vi values with time. This information is required to solve
the equation (2). Analytical, numerical and drafting techniques can
be used to solve burn-back process. Since analytical method is the
best method to calculate exact solution in the fastest manner for
simple and some of the complex geometries, usage of analytical
techniques are preferred during the burn-back solutions within the
content of this work. Therefore, analytical burn-back equations are
derived for the slotted grain geometry making geometrical
calculations. Then, a solver working in Matlab environment is
developed and validated with drafting techniques using a CAD
software. Since derivation and validation of the burn-back solutions
are beyond the scope of this work, further details are not presented
in this research.
Table 1: Dimensions of the propellant and nozzle.
Symbol Definition Value Unit
N Number of slots 4 -
L Propellant length 500 mm
Rport Port radius 65 mm
Rout Outer radius 100 mm
Rtip-center Slot length 80 mm
Rtip Tip radius of slot 5 mm
Ae/At Ratio of nozzle exit area
to nozzle throat area 4 -
At Nozzle throat area 2800 mm2
Validation of 0D Internal Ballistic Solver
Validation of the developed 0D internal ballistic solver is accomplished using both experimental and analytical results presented in Shekhar’s work [5]. Same geometry is solved applying the same propellant data and geometry with Shekhar and results of the 0D internal ballistic solver is compared with Shekhar’s analytical and experimental results (see Fig. 3).
0
1
2
3
4
5
6
7
8
9
10
0 0.5 1 1.5 2 2.5 3 3.5
Pre
ssu
re [
MP
a]
Time [s]
Comparison of Internal Ballistic Performance Analysis Results
Shekhar's Analytical Results Experimental Results
0D Internal Ballistic Solver Results
Fig. 3 Validation of 0D internal ballistic solver [5].
As it can be seen from the comparison that 0D internal ballistic
solver results are same with Shekhar’s analytical solutions which
are quite good agreement with experimental results [5].
According to Sheikholeslam’s work, if the aspect ratio (L/D) of
a SRM is equal to 5 or lower than this value, neglection of erosive
burning does not affect the accuracy of the solution [6]. Therefore,
the aspect ratio of the design is set as approximately 3.85.
4. Response Surface Analysis
Response surface is a method used to determine detailed
information about variation of a response variable with design
variables. Response surface results has a special importance during
preliminary design phase since they illustrate summarized
information about which of the design variables have great
importance on the response variable and how they are varying it.
The aim of the study is to examine the effects of propellant
properties on internal ballistic performance results; so, combustion
temperature, propellant density, characteristic velocity, reference
burning rate and burning rate pressure exponent are defined as
design variables and maximum pressure value during the burning
process, burning time, total impulse and specific impulse are
defined as response variables. Table 2 summarizes the boundaries
of the design variables.
53

Table 2: Boundaries of the design variables.
Symbol Definition Lower
Boundary
Upper
Boundary Unit
Tc Combustion temperature 2000 4000 K
ρp Propellant density 1500 2000 kg/m3
c* Characteristic velocity 1300 1700 m/s
n Burning rate pressure
exponent 0.3 0.4 -
rb-ref Reference burning rate at
7 MPa combustion
pressure
10 20 mm/s
Four different response surface analyses are performed. Each of
them are constructed preparing full composite models consisting of
52 cases.
Response Surface of Maximum Pressure Value
Maximum pressure value (max. Pc) has a special importance on
the SRM design since this parameter both designates thickness of
the motor case and stress level on the propellant. Fig. 4 shows the
percentage effects of propellant properties and interactions of them
on maximum pressure value.
Fig. 4 Percentage effects of propellant properties on max. Pc.
According to the figure, rb-ref has the greatest effect on
maximum pressure value. Density of the propellant and c* has also
considerable amount of effect on it. Fig. 5 illustrates how these
critical design parameters affect the magnitude of maximum
pressure value.
Fig. 5 Response surface results of max. Pc parameter.
According to the results, increment of reference burning rate,
propellant density and characteristic velocity leads to increment of
the maximum pressure value.
Response Surface of Burning Time
Duration of the thrust generation is another important issue, so,
burning time of the propellant is a significant parameter. Fig. 6
shows the percentage effects of propellant properties and
interactions of them on burning time.
Fig. 6 Percentage effects of propellant properties on burning time.
According to the results, rb-ref has the greatest effect on
maximum pressure value. Additionally, burning rate pressure
exponent (n) has also minor effects on the burning time. Fig. 7
illustrates the relationship among rb-ref, n, and burning time.
Fig. 7 Response surface results of burning time.
Results indicates that, increment of burning rate exponent
increases the duration of the burning process. On the other hand,
increment of reference burning rate leads to decrement of the
burning time as expected.
Response Surface of Specific Impulse (Isp)
Specific impulse is main performance parameter that determines
efficiency of a SRM. Therefore, this parameter is also quite
significant. Fig. 8 illustrates the percentage effects of propellant
properties and interactions of them on specific impulse.
Fig. 8 Percentage effects of propellant properties on Isp.
According to the results, characteristic velocity (c*) has the
greatest effect on the specific impulse. Additionally, reference
burning rate (rb-ref) has also considerable amount of effect on it.
Finally, density of the propellant has minor effect on Isp. Fig. 9
illustrates how these critical design parameters affect the magnitude
of the specific impulse.
54

Fig. 9 Response surface results of Isp.
According to the results, increment of c*, rb-ref and propellant
density leads to more efficient designs by increasing the specific
impulse of the system.
Response Surface of Total Impulse (Itotal)
Total impulse corresponds to area under the thrust – time curve.
This parameter is quite important since there is a strong relation
between the range of the rocket motor and itself. Fig. 10 illustrates
the percentage effects of propellant properties and interactions of
them on total impulse.
Fig. 10 Percentage effects of propellant properties on Itotal.
According to the graph, propellant density and characteristic
velocity (c*) dominates the magnitude of the total impulse coupled
with reference burning rate (rb-ref) value. Fig. 11 shows how these
critical design parameters affect the magnitude of the specific
impulse.
Fig. 11 Response surface results of Itotal.
According to the results, increment of the propellant density, c*
and rb-ref increases the total impulse value.
5. Conclusion
Within the content of this research, effects of propellant
properties on internal ballistic performance results are examined
performing response surface analysis. Performance analysis are
accomplished using a zero dimensional internal ballistic
performance solver that uses analytical burn-back equations.
According to the response surface results, reference burning rate
(rb-ref) has a great significance on burning time and maximum
encountered combustion pressure value. Specific impulse that
designates the effectivity of the propellant is strongly depend on
characteristic velocity. On the other hand, total impulse of the
system is dominated by propellant density and characteristic
velocity of the propellant (c*).
In addition to the main results, this work showed that usage of
zero dimensional internal ballistic solver coupled with analytical
burn-back solutions provides accurate results with very short
amount of time that enables to accomplish many analyses required
for construction of response surfaces. Finally, this study also
revealed that designers could have detailed information about the
behavior of design variables on response variables and it is possible
to gain time during the preliminary design phase constructing
response surfaces.
6. References
[1] S. Açık, “Internal ballistic design optimization of a solid rocket motor,” M.Sc. Dissertation, Mechanical Engineering Department, Middle East Technical University, Ankara, 2010.
[2] J.B. Clegern, “Solid rocket motor conceptual design – The development of a design optimization expert system with a hypertext user interface,” 29th Joint Propulsion Conference and Exhibit, Monterey, CA, USA, 1993.
[3] T. Ward, Aerospace Propulsion Systems. John Wiley & Sons (Asia) Pte. Ltd., Singapore, 2010.
[4] G.P. Sutton and O. Biblarz, Rocket Propulsion Elements, 7th Ed., John Wiley & Sons, New York, 2001.
[5] H. Shekhar, “Effects of burning rate index on the pressure time profile of progressive burning tubular rocket propellant configurations,” Central European Journal of Energetic Materials, vol. 12, no. 2, pp. 347-357, 2015.
[6] M.R. Sheikholeslam Z., D. Kazemi, and H. Amiri, “Exprerimental analysis of the influence of length to diameter ratio on erosive burning in a solid tubular propellant grain,” Applied Mechanics and Materials, Trans Tech Publications, Switzerland, vol. 110-116, pp. 3394-3399, 2012.
55

THREE-DIMENSIONAL SIMULATION OF THERMAL STRESSES
IN DISCS DURING AN AUTOMOTIVE BRAKING CYCLE
M.Sc. Rouhi Moghanlou M., Assist. Prof. Saeidi Googarchin H. PhD.
School of Automotive Engineering – Iran University of Science and Technology, Iran
Abstract: In this study, a 3-Dimensional finite element simulation of a braking cycle including braking and cooling steps is presented. In
order to induce thermal stresses, thermo-mechanical material behaviour and interactions between pad and discs are considered in the
simulation. The results reveal that compressive and tensile stresses are happening in the braking and cooling steps respectively. Cyclic
tensile stresses in the disc of heavy trucks would lead to the initiation of superficial radial cracks in them. The occurrence of hot spot
phenomenon in the discs are also observed and discussed thoroughly. The proposed model could be utilized to estimate fatigue life of the
braking discs in the automobiles and heavy vehicles..
Keywords: AUTOMOTIVE BRAKING, FINITE ELEMENT METHOD, THERMAL STRESS
1. Introduction
The components of duty vehicles such as trucks, due to their
heavy weights endure large mechanical loads during their life-span,
hence a proper maintenance and repair of them is essential. Brake
disks, for instance, goes thorough very large braking loads which
consequently shorten its life-time. Due to the friction on the contact
surfaces of the pad and disc, kinetic energy of vehicle transforms
into heat1. A great deal of the heat is transferred to the brake system
components. Therefore, the components of brake system would be
exposed to high temperatures, leading to less favorable conditions
for brake system such as reduction of friction coefficient, plastic
deformation of disc, and thermal cracking in disc surface which
subsequently weakens braking performance. Moreover, variations
of stresses and strains during the cyclic heating and cooling cause
the initiation and growth of cracks on the surface of brake discs2.
Hence, calculations of temperatures and thermal stresses during a
braking cycle are very important for design and improve of brake
system3.
Due to the overheating in the friction surfaces, deformation
occurs in the discs and results in the change of contact state, so it
leads to a local temperature increase (which is known as hot spots
and hot bands in the literature)4. Therefore, in order to have more
accurate predictions, the temperature and stress fields must be
considered simultaneously. Fig. 1 shows a sample of thermal cracks
on the brake disc surface after several hard braking cycles.
Fig. 1 Radial thermal cracks due to hard braking in heavy vehicles1.
In order to solve the coupled field problems like temperature
and stress in disc brakes, generally there are two ways: sequential
coupling and direct coupling. Most of previous studies considered
friction heat as a prior known heat flow over the contact surface, so
as to save on computational costs and avoid complexity in the
simulation. For example, Gigan5 studied a non-rotational heavy
vehicle brake disc with a non-uniform heat flow distribution over
the surfaces. However, their results were slightly different from the
experimental observations. Some researchers are also using three-
dimensional models to simulate uncoupled temperature and stress
fields, resulting in less accurate solutions due to the nonlinearity
and large displacements during hard braking6.
The explicit coupled temperature-displacement algorithm is
used in this paper, as the closest module to the real situation in hard
braking.
2. Simulation
Geometry: a straight vaned type of commercial heavy vehicle
brake disc is chosen to be studied here which consists of a hat, a
neck, and two friction surfaces. Simplified cross-section model of a
commercial truck brake disc is shown in Fig. 2. It has 36 straight
vanes, each acquire an angle of 3 degrees, and spaced every 7
degrees in a 360 degrees cycle. Total thickness of discs is 48mm
which includes two frictional surfaces along with a 18mm space for
ventilation. Outer radius and inner radius of discs are respectively
218mm and 128mm. Each radial vane has a 77mm length. Overall
dimensions of the disc and pad are summarized in Table 1.
Table 1: Overall dimensions of brake disc and pad
Item Disc[mm] Pad[mm]
Height 45 15
Inner radius 128 134.5
Outer radius 218 211.5
Fig. 2 Cross-section of a brake disc.
A longitudinal cross-section of brake pad and its dimensions are
shown in Fig. 3. The pad is covering 60 degree of disc surface.
Modelling of brake disc associated with brake pad is carried out in
ABAQUS finite element commercial software.
56

Fig. 3 Brake pad geometries
Mesh: A sample of mesh generation for the assembled brake
disc and pads is shown in Fig. 4. The utilized element for the mesh
is C3D8T type with a size of 3-4mm.
Fig. 4 A sample of mesh generation for brake disc and pads
Material model: Thermal properties of the pad, made from
organic friction materials, is given in Table 23.
Table 2: Brake pad material properties3
Item Brake pad
Young's modulus(Gpa) 28
Poisson's ratio 0.29
Density(Kg/m^3) 2700
Conductivity 2.36
Specific heat 4000
Thermal diffusivity and the thermal conductivity are important
material parameters for heat transfer in brake discs. Brake rotors in
trucks, compared to passenger cars, are subjected to larger amounts
of stresses, so they require materials with high thermal fatigue
strength. Besides, high strength and durability is necessary to
withstand high torque loads during braking. On the other hand, high
thermal conductivity helps quick transportation of frictional heat
away from the frictional surfaces. The studied brake disc is made of
grey cast iron with a pearlitic microstructure. Grey cast iron is
widely used as truck brake disc material because of its superior
thermal fatigue strength, low squeal and good wear resistance which
is important for a safe performance during its life time. Table 3
shows temperature-dependent parameters of brake disc material4.
Table 3: temperature-dependent parameters of brake disc material4
Parameter 25°C 100°C 200°C 300°C 400°C 500°C
Young's modulus[GPa] 101 98.5 96.8 96.3 81.3 80.3
Poisson's ratio 0.3 0.3 0.3 0.3 0.3 0.3
Density[Kg/m3] 7293 7272 7243 7213 7182 7152
Conductivity [W/m.°C] 53.2 51.3 47.1 42.9 39.1 36.2
Specific heat [J] 488 532 563 599 631 669
Expansion [1/°C] 1.22e-5 1.26e-5 1.31e-5 1.37e-5 1.39e-5 1.4e-5
Plastic hardening model used in this paper is a non-linear
kinematic, isotropic one. Table 4 shows material constants for the
prediction of plastic hardening in the brake disc material.
Table 4: Material constants of plastic hardening model for brake disc
material
Temperature C1[GPa] Gamma1 C2[GPa] Gamma2
25 98.5 627 368 9220
300 95.5 607 361 9390
400 79.5 546 341 9690
500 60.2 474 319 101000
600 41.5 417 270 111000
Boundary Conditions: Different types of braking are defined,
three types of which are explained here. In “stop braking”, the
initial angular velocity of the brake disc is a predefined value and
would be reduced to zero through a constant or non-constant
deceleration. Another type is the ordinary braking, known as “snub
braking”, where speed is decreased to a certain value (for safety
reasons, e.g. speed control limits). The last one, “drag braking”, also
known as “downhill braking”, is the use of brakes for preserving a
specific speed while moving downwards a hill.
The third type is the one used in this paper due to its frequent
repetition in heavy trucks. Moreover, initial temperature of the
brake disc and pads is assumed to be 25°C. The speed of vehicle is
assumed as 80 km/h which results in a constant angular velocity of
425r/min (44.46 rad/s) on brake discs during 10 seconds of braking
cycle. A brake cycle is composed of two parts: A 10 seconds of
uniform braking, and a cooling phase assumed to be 300 seconds (5
minutes). The following assumptions are made in the modelling of
brake rotor in the finite element simulation:
1- Brake pressure is uniformly distributed all over the back
side of the pads.
2- Friction coefficient remains constant during a braking
cycle.
Table 5 illustrates braking parameters used in this study. A
schematics of prescribed boundary conditions are also depicted in
Fig. 5.
Table 5: Braking parameters
Braking time (s) 10
Braking pressure (kPa) 1000
Disc brake rotational velocity (rad/s) 44.46
Fig. 5 Schematics of prescribed boundary conditions
57

In order to simulate a more accurate solution for the cooling
process of the brake system components, both convection and
radiation are accounted. Convection coefficient is computed in [7]
for various brake disc velocities. Fig. 6 illustrates heat transfer
coefficient at brake disc surfaces in terms of temperature, while the
vehicle has an 80 km/h speed. As can be seen, convection
coefficient increases gradually by the rise of temperature.
Since temperature is different on various sides of disc surface,
for gaining a more reliable solution, the surface of disc is
partitioned to three sub-region; each has a different value of
convection coefficient (see Fig. 7). In order to use a constant
coefficient value on both sides of the disc, Bio number must be less
than 0.1.
Bio number is determined as Bio=h*L/k, where h is the heat
transfer coefficient, L is the characteristic length (or thickness of
frictional layer), and k is the thermal conductivity of the material.
Using the thickness of each piece of brake disc (L=13.5mm) and
temperature-dependent values of h and k, it would be determined
that for a temperature range of [25°C-800°C], Bio number would be
less than 0.1, thus a constant value of convection heat transfer
coefficient can be used for solving the cooling phase of brake cycle.
Fig. 6 The variation of convection heat transfer coefficient in terms of
temperature at 80km/h
Fig. 7 Three defined regions of brake disc surface for convection
3. Results
Variation of stresses in braking and cooling phases of a brake
disc would be presented and discussed in this section. Fig. 8 (a)
shows the temperature distribution of front and back surfaces of
brake disc during braking cycle. As can be seen, the temperature
field is not symmetrical on both sides of the disc. Maximum
temperature of the surfaces appears to happen in the inner ring of
the frictional region, while maximum temperature of the back
frictional surface occurs in the outer ring. Due to the cross-
displacement of the neck and hub, known as coning, the contact
conditions on both sides of the rotor would not be similar to each
other. In addition, non-friction region almost has no temperature
elevation. As can be seen in Figure 8 (b), it is clear that temperature
distribution on the surface is non-constant, so that a non-uniform
wear occurs on the pad and leads to an overheat on the pads.
(a) (b)
Fig. 8 Temperature distribution on a) a cross section of brake disc and pads
at the end of braking (10s) and b) the surface of pad at the end of braking
(t=10s)
Fig. 9 shows a cross-section of disc in addition to a series of
points in radial direction, named as path-1. Temperature diagram
over path-1 at different moments, i.e. 2, 4, 6, 8, and 10s, is shown in
Fig. 10. As can be seen, initially the temperature in all points is
equal to 25°C (room temperature); during the braking, it rises non-
uniformly. Hence, the temperature on a specific radius of the brake
disc surface would be maximum and is called a hot band in which it
is most likely for fatigue cracks initiation over the surface of brake
discs. Schematics of hot bands formation according to the pass of
time is shown in Fig. 11.
Fig. 9 Cross-section of brake disc and the definition of path-1 (red dots)
Fig. 10 Temperature diagram over the surface path-1 at t=2,4,6,8,10s
Circumferential stresses, also called hoop stresses, are the main
component of developed thermal stresses, the variations of which
during braking and cooling cycles would be the major cause in the
initiation and propagation of surface radial cracks. As can be seen in
Fig. 12, at the first couple of seconds in braking cycle, the
distribution of circumferential stresses is relatively uniform, due to
the uniform distribution of braking pressure and temperature over
the frictional surfaces. However, over the time, coning on the hat of
the disc leads to a non-uniform distribution, creating hot bands and
hotspots on the surface. After 6s of braking, a hot band of frictional
heat causes an intense change in the hoop stresses.
Distribution of circumferential stresses on the upper surface of
brake discs is shown in Fig. 13. As can be seen, while at 10s the
highest compressive stresses have been occurred in the location of
hot band, proceeding to the cooling cycle (t=300s), the same place
undergoes the highest tensions. This phenomena results in the
initiation of cracks in the hot bands.
58

t=4s
t=2s
t=8s
t=6s
t=10s
Fig. 11 Schematics of hot bands formation by passing the time (hot bands
are depicted in red)
Fig. 12 Circumferential (hoop) stresses over the path-1 at t=2,4,6,8,10s
4. Conclusion
In this paper, a three-dimensional simulation of a braking cycle
(including braking and cooling) carried out which causes high
circumferential cyclic thermal stresses in brake discs. The
simulation identified that the interaction of frictional heat
generation, thermal distortion, and effect of coning in brake disc
would create a “hot band”, which occurs at the working-surface of
the disk. Moreover, the results show that critical stresses also
occurred in the hot band. Therefore, the model used in this paper
can be further used for examination of the geometry and material
developments as well as fatigue analysis.
t=4s
t=8s
t=300s
t=2s
t=6s
t=10s
Fig. 13 Circumferential stresses for brake disc surface at t=4, 6, 8, 10, 300s
5. Referencs
[1] Mackin, T.J., et al., Thermal cracking in disc brakes.
Engineering Failure Analysis, 2002. 9(1): p. 63-76.
[2] Yevtushenko, A., P. Grzes, and A. Adamowicz, Numerical
analysis of thermal stresses in disk brakes and clutches (a review).
Numerical Heat Transfer, Part A: Applications, 2015. 67(2): p. 170-
188.
[3] Le Gigan, G., et al., Disc brakes for heavy vehicles: an
experimental study of temperatures and cracks. Proceedings of the
Institution of Mechanical Engineers, Part D: Journal of Automobile
Engineering, 2015. 229(6): p. 684-707.
[4] Collignon, M., et al., Failure of truck brake discs: A coupled
numerical–experimental approach to identifying critical
thermomechanical loadings. Tribology International, 2013. 59: p.
114-120.
[5] Le Gigan, G., Improvement in the brake disc design for heavy
vehicles by parametric evaluation. Proceedings of the Institution of
Mechanical Engineers, Part D: Journal of Automobile Engineering,
2017. 231(14): p. 1989-2004.
[6] Gao, C., et al., Stress analysis of thermal fatigue fracture of
brake disks based on thermomechanical coupling. Journal of
tribology, 2007. 129(3): p. 536-543.
[7] Pevec, M., et al., Prediction of the cooling factors of a vehicle
brake disc and its influence on the results of a thermal numerical
simulation. International Journal of Automotive Technology, 2012.
13(5): p. 725-733.
59

NATURALLY ASPIRATED GASOLINE ENGINE UPGRADE WITH TURBOCHARGER - NUMERICAL INVESTIGATION OF CHANGE IN OPERATING
PARAMETERS
PhD. Mrzljak Vedran, Student Žarković Božica Faculty of Engineering, University of Rijeka, Vukovarska 58, 51000 Rijeka, Croatia
E-mail: [email protected], [email protected]
Abstract: Numerical investigation of naturally aspirated gasoline engine main operating parameters and engine upgrade with a turbocharger is presented in this paper. Analysis is performed by using numerical 0D (zero-dimensional) simulation model. Turbocharging process with a selected turbocharger increases engine maximum torque for 62.58 % and also increases maximum engine effective power for 58.82 %. One of the main reasons of turbocharging process usage is reduction of engine brake specific fuel consumption. The highest decrease in brake specific fuel consumption for a turbocharged engine, in comparison with naturally aspirated one, is obtained at 4000 rpm and amounts 8.83 g/kWh (from 239.01 g/kWh for naturally aspirated engine to 230.18 g/kWh for a turbocharged engine). Turbocharging process brings several useful benefits to the analyzed gasoline engine, which is also a valid conclusion for internal combustion engines in general. KEYWORDS: GASOLINE ENGINE, TURBOCHARGER, NUMERICAL SIMULATION, ENGINE UPGRADE 1. Introduction
Internal combustion gasoline engines with spark ignition were developed as a counterweight to diesel engines in which fuel and air mixture combust due to high in-cylinder pressures and temperatures. Both internal combustion engine types have many advantages and disadvantages [1] which are dependable on several elements and characteristics. Researchers are currently investigating various phenomena related to gasoline engines. Kilicarslan and Qatu [2] performed an exhaust gas analysis of gasoline engine based on engine speed, while Elsemary et al. [3] investigated spark timing influence on performance of a gasoline engine fueled with a mixture of hydrogen-gasoline. Effect of spark timing on the performance of a hydrogen-gasoline rotary engine (Wankel engine) was also investigated by Su et al. [4]. Alternative fuels for gasoline engines, or gasoline mixtures with an alternative fuel and its influences on engine performance and characteristics are analyzed by many authors. Alptekin and Canakci [5] analyzed performance and emission characteristics of solketal-gasoline fuel blends in a vehicle with gasoline engine. Optimized ethanol-gasoline blends for turbocharged engines were investigated by Zhang and Sarathy [6]. Turbocharging process which uses the energy of engine exhaust gases is one of the best methods for improving naturally aspirated engine operating parameters and characteristics, as well as to reduce engine brake specific fuel consumption [7]. Turbocharging system diagnosis for a large power engine presented and analyzed Barelli et al. [8]. Investigation of the influences of turbocharging process on the gasoline engine exhaust emission levels performed Mahmoudi et al. [9]. Modeling and control of the air system of a turbocharged gasoline engine investigated Moulin and Chauvin [10]. In this paper were firstly investigated main operating parameters of naturally aspirated gasoline engine for automotive usage. Investigations were performed by numerical analysis with 0D (zero-dimensional) simulation model. After obtaining the results of numerical simulation for a naturally aspirated engine, the same engine was upgraded with a turbocharger. During the engine upgrade, engine main operating and geometrical characteristics remain unchanged. Turbocharging process increases engine torque and engine effective power in each engine rotational speed, but the increases in those two parameters are significant for higher engine rotational speeds. Turbocharging increases maximum cylinder pressure, but maximum cylinder pressure limits were not reached in any observed engine operating point. Engine with turbocharger has significant lower brake specific fuel consumption in comparison with naturally aspirated. Turbocharging process increases pressures and temperatures at intake and exhaust manifolds, what is significantly noticeable at higher engine rotational speeds where the turbocharger reaches its optimal operating parameters.
2. Basic equations of 0D numerical model for internal combustion engine simulations
Numerical model used for simulation in this study is 0D (zero-dimensional) model presented by prof. Medica in [11]. Numerical model is basically developed for simulation of diesel engines and a few years later is upgraded on QD (quasi-dimensional) numerical model presented in [12] and [13]. To be able to simulate the operating parameters of a gasoline engine with the mentioned 0D model, the model is modified in necessary elements which present main differences in operating characteristics between gasoline and diesel engines. Modified 0D model is tested on a few gasoline engines which measurements were obtained from the manufacturers. For all analyzed gasoline engines and its operating parameters were obtained deviations between measurements and numerical model results in the range of ± 3 %. The basic 0D model equations are related to the temperature and pressure change for each engine control volume (engine cylinder, intake and exhaust manifolds, turbine and compressor - if turbocharger applied, air cooler - if applied, etc.). Equation for temperature change in each engine control volume is:
ii
i
i
i
i
iii
ii
ii
iii
i
dd
dd
dd
dd1
dd
∂∂
+
∂∂
−
∂∂
−
−
−
=
pu
Tp
BA
Tu
CummuVpQmT ϕ
λλϕϕϕ
ϕ
(1)
where the coefficients Ai, Bi and Ci are defined as:
ii
ii 1
∂∂
+=TR
RTA (1a)
ii
ii 1
∂∂
−=pR
RpB (1b)
∂∂
+
−
∂∂
=iiiiiiiii
ii d
d1dd1
dd1
ϕλ
λϕϕR
RV
Vm
mpu
BpC
(1c)
Pressure change in each engine control volume is calculated by using ideal gas state equation:
i
iiii V
TRmp = (2)
In the equations (1), (1a), (1b), (1c) and (2), used symbols are: T = operating medium temperature, φ = engine crankshaft angle, m = operating medium mass, Q = heat amount, p = operating medium pressure, V = operating area volume,
60

u = operating medium specific internal energy, λ = excess air ratio, R = operating medium gas constant, i = index for any engine control volume.
Calorific gas properties (u, ∂u/∂λ, ∂u/∂T, ∂u/∂p, ∂R/∂λ, ∂R/∂T, ∂R/∂p) are modeled from the analytical expressions relating the temperature and gas composition [14]. To make the simulation as fast as possible, it is assumed that in each engine cylinder happens the same change of pressure and temperature (phase-shifted). Because of the simplicity of the numerical model, this assumption presents the inability of such numerical model to investigate the processes within each engine cylinder individually.
3. Engine and turbocharger characteristics
Investigated engine is a four stroke, high speed gasoline engine with direct fuel injection. The engine is designed for application in passenger road vehicles. The first version of the analyzed engine was designed without any upgrades known from automotive industry (turbocharging, air cooling after turbocharging, usage of west-gate valve or usage of EGR - Exhaust Gas Recirculation valve). Main operating parameters and specifications of the basic, naturally aspirated engine are presented in Table 1. In Table 1 are also presented used cylinder materials and fuel specifications in order to provide a proper calculation of heat exchange for the in-cylinder process.
Table 1. Main operating parameters of investigated naturally aspirated engine
Fuel Gasoline Fuel lower calorific value 43 MJ/kg Fuel density 0.75 kg/l Cylinder bore 84 mm Stroke 86 mm Number of cylinders 4 Cylinder clearance volume 0.0477 l Connecting rod length 129.8 mm Compression ratio 11 Ignition order 1-3-4-2 Intake manifold volume 2.0 l Exhaust manifold volume 2.5 l Engine cooling With water Materials: Cylinder head Aluminum Piston Aluminum Cylinder liner Cast Iron
After obtaining the results of numerical simulation for a naturally aspirated engine, the same engine, which main operating parameters are presented in Table 1, is upgraded with a turbocharger. Usually, during the upgrade of naturally aspirated gasoline engine numerical model with a turbocharger, it is usual to change some engine geometric and operating parameters such as intake and exhaust manifold volumes or valves opening/closing periods. During the engine upgrade with turbocharger presented in this paper, engine main operating and geometrical characteristics remain unchanged. One of the author’s intentions was to investigate the possibility and quality of engine operation with selected turbocharger, without any engine modifications. The main geometrical characteristics of selected turbocharger KKK 30.60/13.21 are presented in Table 2 and in Fig. 1:
Table 2. Main geometrical parameters of selected turbocharger KKK 30.60/13.21 [15]
Description Variable Dimension Charger intake diameter d 0.0457 m Charger outlet diameter D 0.0762 m
Intake turbine flowing surface A 0.0013 m2
Fig. 1. Geometrical characteristics of charger and turbine [15]
Much more information’s and features for similar turbochargers, used in automotive engines such as engine analyzed in this paper, can be found in [16].
4. Numerical model results and discussion
Change in engine torque for the analyzed engine with and without turbocharger, at different engine rotational speeds is presented in Fig. 2. At each engine rotational speed engine torque obtained with turbocharger is higher. At a rotational speed of 1000 rpm, engine torque obtained with turbocharger is slightly higher in comparison with a naturally aspirated engine. During the increase in the engine rotational speed, the difference in engine torque between turbocharged and naturally aspirated engine increases. The highest difference in engine torque was obtained at engine rotational speed of 5000 rpm where turbocharged engine obtains torque of 307.45 Nm, while at the same engine rotational speed naturally aspirated engine obtained torque of 189.11 Nm. A decrease in engine torque can be seen only in the rotational speeds from 5000 rpm to 6000 rpm. At the highest engine rotational speeds, there is no need for high torque, so it decreases. The introduction of turbocharging on the analyzed gasoline naturally aspirated engine can increase engine torque up to 62.58 % (obtained at 5000 rpm).
Fig. 2. Change in engine torque for the analyzed engine with and without turbocharger
Increase in engine torque of turbocharged engine when compared to naturally aspirate in any observed rotational speed, resulted also with an increase in engine power. During the increase in the engine rotational speed, engine power continuously increases for both naturally aspirated and turbocharged engine, Fig. 3. In Fig. 3 can also be seen that increase in engine power of a turbocharged engine is low at lower rotational speeds (at 1000 rpm and 2000 rpm). As the engine rotational speed increase, engine power of turbocharged engine when compared to naturally aspirate significantly increases. At the highest engine rotational speed (6000 rpm) naturally aspirated engine develops output power of 111.44 kW, while at the same rotational speed turbocharged engine develops power of 176.99 kW, what is the highest difference in engine power for the entire field of engine rotational speeds. The engine effective power is obtained by multiplication of engine torque and angular velocity. On Fig. 2 can be seen that between rotational speeds 5000 rpm and 6000 rpm engine torque
61

decrease for each observed engine. Simultaneously, engine power between the same rotational speed increases. It can be concluded that engine power is more influenced with an increase in the engine rotational speed from 5000 rpm to 6000 rpm than with decrease in engine torque at the highest rotational speeds.
Fig. 3. Change in engine power for the analyzed engine with and without turbocharger
Upgrade of naturally aspirated gasoline engine with turbocharger resulted in a significant increase in maximum cylinder pressure, as presented in Fig. 4. Maximum cylinder pressure for both observed engines was obtained at the 5000 rpm and amounts 72.38 bars for a naturally aspirated engine and 121.7 bars for turbocharged engine. Turbocharger usage is usually limited with maximum cylinder pressure. For similar automotive gasoline engines with turbocharger, it is common to set a maximum cylinder pressure limit between 150 bars and 170 bars in order to avoid any damage which can occur at very high maximum pressures. The selected turbocharging process of the analyzed engine did not reach common maximum cylinder pressure limits in any observed operating point.
Fig. 4. Change in cylinder maximum pressure for the analyzed engine with and without turbocharger
One of the essential reasons for turbocharging process usage is reduction of engine brake specific fuel consumption (injected fuel mass per unit of produced power). As presented in Fig. 5, the analyzed gasoline engine with turbocharger has significant lower brake specific fuel consumption in comparison with a naturally aspirated engine, for the most engine rotational speeds. Only at the lowest and the highest engine rotational speeds (1000 rpm and 6000 rpm) brake specific fuel consumption of an engine with turbocharger is lower in comparison with naturally aspirated one, but not significantly. The highest differences in brake specific fuel consumption between two analyzed engines can be seen at engine rotational speeds of 3000 rpm, 4000 rpm and 5000 rpm. Turbocharged engine, in comparison with naturally aspirated one, saves 5.10 g/kWh of fuel at 3000 rpm, 8.83 g/kWh of fuel at 4000 rpm and 6.95 g/kWh of fuel at 5000 rpm. Engine volumetric efficiency is defined as a ratio of air mass brought to engine cylinders and air mass which can be brought to engine cylinders at the environment state. For naturally aspirated gasoline engine, volumetric efficiency is always lower than 100 % because of air pressure losses and temperature increase during the air supply to the cylinders, Fig. 6.
Turbocharging process resulted with volumetric efficiency significantly higher than 100 % at the higher engine rotational speeds, because in the engine cylinder, air charger compresses the higher air mass than those which can be brought at the environment state, Fig. 6. At lower engine rotational speeds (lower than 3000 rpm) volumetric efficiency of a turbocharged engine is lower than 100 % because at that engine rotational speeds turbocharger is unable to develop optimal operating parameters. The highest volumetric efficiency of a turbocharged engine is obtained at 5000 rpm and amounts 154.2 %.
Fig. 5. Brake specific fuel consumption change for the analyzed engine with and without turbocharger
Fig. 6. Change in volumetric efficiency for the analyzed engine with and without turbocharger
At the lower engine rotational speeds of the naturally aspirated engine (1000 rpm and 2000 rpm) air pressure in the intake manifold is slightly lower than ambient pressure (ambient pressure is 1.01 bars), Fig. 7. As naturally aspirated engine rotational speed increases, intake manifold pressure decreases to ensure smooth flow of air from the atmosphere to the engine cylinders. Decrease in air pressure is as higher as the rotational speed increases and lowest intake manifold pressure of 0.96 bar is obtained at 6000 rpm. Intake manifold pressure of turbocharged gasoline engine is higher than ambient pressure and it continuously increases during the increase in the engine rotational speed, Fig. 7. The highest increase in intake manifold pressure of turbocharged engine can be seen at rotational speeds higher than 4000 rpm. The highest intake manifold pressure of turbocharged engine amounts 1.23 bars and is obtained at 6000 rpm.
Fig. 7. Change in intake manifold pressure for the analyzed engine with and without turbocharger
62

Exhaust manifold pressure of naturally aspirated engine increases very slightly during the increase in the engine rotational speed, Fig. 8. The exhaust manifold pressure of turbocharged engine increases notably during the increase in the engine rotational speed. The highest increase in exhaust manifold pressure of turbocharged engine can be seen at rotational speeds higher than 4000 rpm, where the turbocharger reaches its satisfactory operating conditions. The highest exhaust manifold pressure of turbocharged engine amounts 3.14 bars and is reached at the highest engine rotational speed of 6000 rpm.
Fig. 8. Change in exhaust manifold pressure for the analyzed engine with and without turbocharger
Exhaust manifold temperature continuously increases during the increase in the engine rotational speed for both naturally aspirated and turbocharged engine, Fig. 9. From the lowest to the highest engine rotational speed, exhaust manifold temperature increases from 761.2 °C to 951.9 °C for a naturally aspirated engine and from 801.8 °C to 1051.1 °C for turbocharged engine. At any observed rotational speed, turbocharged engine has a higher exhaust manifold temperature in comparison with a naturally aspirated engine. When compared analyzed two engines, the highest differences in exhaust manifold temperatures can be seen at rotational speeds of 5000 rpm and 6000 rpm and amounts 98.3 °C and 99.2 °C.
Fig. 9. Change in exhaust manifold temperature for the analyzed engine with and without turbocharger
5. Conclusions
The paper presents an investigation of main operating parameters of naturally aspirated gasoline engine for automotive usage and its upgrade with a turbocharger. Analysis is performed by numerical 0D (zero-dimensional) simulation model. During the engine upgrade, engine main operating and geometrical characteristics remain unchanged. Selected turbocharger inclusion into the gasoline engine operation resulted with an increase in engine maximum torque for 62.58 % (from 189.11 Nm to 307.45 Nm) and with an increase in engine maximum effective power for 58.82 % (from 111.44 kW to 176.99 kW). Turbocharging process also resulted with an increase in maximum cylinder pressure, but the limits were not reached with a usage of selected turbocharger. One of the main reasons of turbocharging process usage is reduction of engine brake specific fuel consumption. The highest decrease in brake specific fuel consumption for a turbocharged engine, in comparison with naturally aspirated one, is obtained at
4000 rpm and amounts 8.83 g/kWh (from 239.01 g/kWh for naturally aspirated engine to 230.18 g/kWh for a turbocharged engine). Pressures and temperatures in intake and exhaust engine manifolds also increase when the turbocharger is used. Therefore, it would be advisable for the intake and exhaust manifolds to be dimensioned more robustly with better thermal insulation, in order to be able to withstand the introduction of turbocharger on the naturally aspirated engine without any modifications.
6. Acknowledgment
A retired professor Vladimir Medica, Faculty of Engineering, University of Rijeka is gratefully acknowledged for the ceded numerical model as well as for helpful suggestions and discussions.
7. References
[1] Stone, R.: Introduction to Internal Combustion Engines, Fourth edition, Palgrave Macmillan, 2012. [2] Kilicarslan, A., Qatu, M.: Exhaust gas analysis of an eight cylinder gasoline engine based on engine speed, Energy Procedia 110, p. 459 – 464, 2017. (doi: 10.1016/j.egypro.2017.03.169) [3] Elsemary, I. M. M., Attia, A. A. A., Elnagar, K. H., Elsaleh, M. S.: Spark timing effect on performance of gasoline engine fueled with mixture of hydrogen-gasoline, International Journal of Hydrogen Energy, In Press, 2017. (doi: 10.1016/j.ijhydene.2017.10.125) [4] Su, T., Ji, C., Wang, S., Shi, L., Yang, J., Cong, X.: Effect of spark timing on performance of a hydrogen-gasoline rotary engine, Energy Conversion and Management 148, p. 120–127, 2017. (doi: 10.1016/j.enconman.2017.05.064) [5] Alptekin, E., Canakci, M.: Performance and emission characteristics of solketal-gasoline fuel blend in a vehicle with spark ignition engine, Applied Thermal Engineering 124, p. 504-509, 2017. (doi: 10.1016/j.applthermaleng.2017.06.064) [6] Zhang, B., Sarathy, M.: Lifecycle optimized ethanol-gasoline blends for turbocharged engines, Applied Energy 181, p. 38- 53, 2016. (doi: 10.1016/j.apenergy.2016.08.052) [7] Garrett, T. K., Newton, K., Steeds, W.: The Motor Vehicle, Thirteenth edition, Butterworth-Heinemann, 2001. [8] Barelli, L., Bidini, G., Bonucci, F.: Diagnosis of a turbocharging system of 1 MW internal combustion engine, Energy Conversion and Management 68, p. 28–39, 2013. (doi: 10.1016/j.enconman.2012.12.013) [9] Mahmoudi, A. R., Khazaee, I., Ghazikhani, M.: Simulating the effects of turbocharging on the emission levels of a gasoline engine, Alexandria Engineering Journal, In Press, 2017. (doi: 10.1016/j.aej.2017.03.005) [10]Moulin, P., Chauvin, J.: Modeling and control of the air system of a turbocharged gasoline engine, Control Engineering Practice 19, p. 287–297, 2011. (doi: 10.1016/j.conengprac.2009.11.006) [11]Medica, V.: Simulation of turbocharged diesel engine driving
electrical generator under dynamic working conditions, Doctoral Thesis, University of Rijeka, Rijeka, 1988.
[12]Mrzljak, V., Medica, V., Bukovac, O.: Volume agglomeration process in quasi-dimensional direct injection diesel engine numerical model, Energy 115, p. 658-667, 2016. (doi: 10.1016/j.energy.2016.09.055) [13]Mrzljak, V., Medica, V., Bukovac, O.: Simulation of a Two Stroke Slow Speed Diesel Engine Using a Quasi-Dimensional Model, Transactions of Famena, 2, p. 35-44, 2016. (doi: 10.21278/TOF.40203) [14]Jankov, R.: Mathematical modeling of flow, thermodynamic processes and engine operation characteristics, Naučna knjiga, Beograd, Part 1 and Part 2, 1984. [15]Škifić, N.: Influence analysis of engine equipment parameters on diesel engine characteristics, Doctoral Thesis, Rijeka, University of Rijeka, 2003. [16] http://www.aet-turbos.co.uk (accessed: 14.12.2017.)
63

LIQUID FUEL TEMPERATURE, PRESSURE AND INJECTION RATE INFLUENCE ON INJECTOR NOZZLE REYNOLDS NUMBER AND CONTRACTION
COEFFICIENT
PhD. Mrzljak Vedran, Student Žarković Božica, Prof. PhD. Prpić-Oršić Jasna Faculty of Engineering, University of Rijeka, Vukovarska 58, 51000 Rijeka, Croatia
E-mail: [email protected], [email protected], [email protected]
Abstract: The influences of liquid fuel temperature, pressure and injection rate on fuel contraction coefficient and Reynolds number during a fuel injection were investigated in this paper. Nozzle geometry parameters remained constant during the whole numerical analysis. Calculations were performed with a standard diesel fuel D2. Increase in liquid fuel temperature cause increase in fuel contraction coefficient. Fuel temperature increase resulted in a slight increase in contraction coefficient at low fuel pressures, while at high fuel pressures increase in fuel temperature causes significant increase in fuel contraction coefficient. Increase of fuel pressure resulted in a decrease in liquid fuel contraction coefficient, for every fuel injection rate and for every fuel temperature. Reynolds number increases with an increase in fuel temperature and also with an increase in fuel injection rate. The main goal of presented analysis is to be usable not only for one fuel injector and its nozzles, but for a large number of the fuel injectors and for many liquid fuels. KEYWORDS: LIQUID FUEL, FUEL INJECTOR NOZZLE, CONTRACTION COEFFICIENT, REYNOLDS NUMBER 1. Introduction
In internal combustion engine fuel temperature, pressure and injection rate as well as the injector nozzle geometry strongly affect the fuel atomization process. A liquid fuel atomization process has a strong influence on the engine combustion process and on exhaust emissions. However, due to the small length and time scales during the fuel injection process, it is still a challenge to capture and explain the physics and influences behind those processes. Internal nozzle flow influence on spray atomization along with fuel properties and injection rates was investigated by several authors in the past [1], [2]. Newer investigations about this topic is presented by Madero and Axelbaum [3] which was investigated fuel spray breakup and structure of spray flames for low-volatility wet fuels. Greenberg [4] investigated the impact of the initial droplet size distribution on the behavior of an edge flame. Nozzle configuration effects on internal flow and primary spray breakup for flash boiling fuel sprays was analyzed by Wu et al. [5] while Abianeh et al. [6] investigated the nozzle flow influence and characteristics on multi-component fuel spray evaporation process. Experimental study on fuel spray characteristics under atmospheric and pressurized cross-flow conditions presented Guo et al. [7]. The impact of the injector nozzle geometry and fuel properties on fuel injection, fuel atomization and evaporation processes must be involved in any detail internal combustion engine simulation, as the one presented in [8] for a high speed direct injection turbocharged diesel engine. The same impact is inevitable in simulations of large marine two-stroke slow speed diesel engines [9].
2. Liquid fuel contraction coefficient
Liquid fuel contraction is liquid stream constriction which occurs because the fluid streamlines cannot abruptly change direction. For the fuel injector nozzle, the fluid streamlines are unable to closely follow the sharp angle in the nozzle wall. Maximum contraction is the place in a liquid fuel stream where the diameter of the stream is the lowest. The maximum contraction takes place slightly downstream of the fuel injector nozzle, Fig. 1.
Fig. 1. Liquid fuel contraction coefficient definition for fuel injector nozzle
According to Fig. 1, the liquid fuel contraction coefficient for the fuel injector nozzle is defined as a ratio of liquid fuel stream diameter at maximum contraction point and the nozzle diameter:
ddC MC
d (1)
where: Cd = liquid fuel contraction coefficient, dMC = liquid fuel stream diameter at maximum contraction point, d = nozzle diameter.
Liquid fuel contraction coefficient value is always lower than 1 and depends on the fuel stream parameters (pressure, temperature and injection rate) as well as on nozzle geometry.
3. Injector nozzle geometry parameters
The main goal of presented mathematical model in this analysis is to be usable not only for one fuel injector and its nozzles, but for a large number of the fuel injectors and for many liquid fuels. As analysis baseline is used fuel injector DLLA 775 from [10]. Three fuel injector nozzle geometry parameters which influenced liquid fuel contraction and Reynolds number are nozzle diameter (d), nozzle length (l) and nozzle inlet radius (r). The nozzle inlet radius value is usually shown as a ratio of nozzle diameter (r/d), what was also adopted in presented analysis. In analysis were selected nozzle geometry parameters similar to ones for fuel injector DLLA 775 [10], which are the most used in practice. Selected nozzle geometry parameters remain unchanged throughout the analysis. The variables which strongly influenced fuel contraction coefficient and Reynolds number are fuel pressure, fuel temperature and fuel injection rate. Those variables were varied.
4. Liquid diesel fuel used in the analysis
In analysis was used diesel fuel D2, which main characteristics and specifications are presented in Table 1. Although the analysis is made with diesel fuel D2, the mathematical description of the liquid fuel contraction coefficient and the Reynolds number allows the usage of any standard or alternative liquid fuel.
Table 1. Main specifications of diesel fuel D2 [11] Liquid diesel fuel D2 property Value Sulfur content 0.3 percentage of mass Molecular mass 198 kg/kmol Density at 15.5 °C 0.842 g/cm3 Kinematic viscosity at 38 °C 2.84 · 10-6 m2/s Critical pressure 20.9 bar Critical temperature 453 °C Boiling point 266 °C Flash point 75 °C Aniline point 71.7 °C
64

5. Liquid diesel fuel D2 thermodynamics properties necessary for analysis
5.1. Density of liquid diesel fuel D2
Liquid diesel fuel D2 density dependence on the fuel pressure and temperature is given by the following equation [11]:
At
Ep10 (2)
where: = liquid fuel current density (g/cm3), 0 = 0.845 g/cm3 (liquid fuel density on the environmental pressure = 1 bar and temperature = 25 °C), p = liquid fuel current pressure (Pa), 8106.19 E Pa (liquid fuel elasticity module), t = liquid fuel temperature above the environment temperature, A = 1350 °C (reciprocal value of the liquid fuel thermal expansion coefficient).
5.2. Dynamic viscosity of liquid diesel fuel D2
Liquid diesel fuel D2 dynamic viscosity change can be calculated by a second degree polynomial [11]:
221 )()()( ptBptBtA (3)
77.7745789.17exp0036761.0
98351.1345789.17exp0030803.01092723.5)( 5
t
ttA (4)
312
210761
1030035.1
1082129.31017256.11002964.8)(
t
tttB
(5)
453.5120exp1085318.5
126829.920exp1021756.2)(
9
82
t
ttB (6)
where: p = liquid fuel current pressure (bar), t = liquid fuel current temperature (°C), = liquid fuel current dynamic viscosity (kg/m·s).
6. Liquid fuel Reynolds number and contraction coefficient
The Reynolds number for the fuel injector nozzle is defined by the expression:
3
i 10Re
dv (7)
where: = liquid fuel density (kg/m3), vi = liquid fuel injection rate (m/s), d = nozzle diameter (mm), = liquid fuel dynamic viscosity (kg/m·s).
Reynolds number coefficient f used in the contraction coefficient equation was calculated by the equation:
)Re64,Re316.0(Max 25.0f (8)
Contraction loss coefficient Kin is a function of nozzle inlet radius r and nozzle diameter d ratio. According to [12] contraction loss coefficient Kin can be defined by the following polynomial:
drdr
drdrK
/·/·
/·/·162.52076 in (9)
where: Kin = contraction loss coefficient (-), r = nozzle inlet radius (mm), d = nozzle diameter (mm).
Flow in the fuel injector nozzle is turbulent with the possibility of cavitation occurrence. Taking into account the turbulent flow in the fuel injector nozzle without the occurrence of cavitation [12], the liquid fuel contraction coefficient can be defined as:
1
1
in
d
dlfK
C (10)
where: Cd = liquid fuel contraction coefficient (-), Kin = contraction loss coefficient (-), f = Reynolds number coefficient (-), l = nozzle length (mm), d = nozzle diameter (mm).
7. Mathematical model results and discussion
Change in liquid fuel contraction coefficient for different fuel injection rates and temperatures, at fuel pressure of 800 bars, was presented in Fig. 2. This figure, as all the other figures through this paper, was obtained by using nozzle geometry and fuel characteristics presented in boldface legend in the figure. From Fig. 2 can be seen that contraction coefficient increases with the increase in fuel temperature. During the injection rate increase, at any fuel temperature, increase in contraction coefficient is significant for low injection rates (from 10 m/s to 100 m/s). Further increase in the fuel injection rate (above 100 m/s) causes low, almost negligible increase in contraction coefficient, for any fuel temperature.
Fig. 2. Change in liquid fuel contraction coefficient for different fuel injection rates and temperatures (p = 800 bars)
For the same fuel injector nozzle operating parameters and fuel pressure as in Fig. 2, change in Reynolds number which is calculated according to equation (7) is presented in Fig. 3. For any fuel injection rate, Reynolds number increases with an increase in fuel temperature. Increase in fuel injection rate also increases Reynolds number, for every fuel temperature. During the increase in injection rate, the increase in Reynolds number is as higher as the fuel temperature increase, so the highest Reynolds numbers were obtained for the highest observed fuel temperature and injection rate. Dispersion of Reynolds numbers for a various fuel temperatures became as higher as fuel injection rate increases.
Fig. 3. Change in Reynolds number for different fuel injection rates and temperatures (p = 800 bars)
Change in liquid fuel contraction coefficient for different fuel injection rates and temperatures, for the same fuel injector nozzle operating parameters as in Fig. 2, but with increased fuel pressure (from 800 bars to 2000 bar) is presented in Fig. 4.
65

For any fuel pressure is valid a fact that the increase in fuel temperature causes an increase in contraction coefficient, for any fuel injection rate. Increase in fuel injection rate causes a different change of contraction coefficient for low fuel pressures (Fig. 2) in comparison with high fuel pressures (Fig. 4). At high fuel pressures, increases in the fuel injection rate (from 10 m/s to 500 m/s) causes a continuous and significant increase in contraction coefficient, when the fuel is on environmental temperature (25 °C). For higher fuel temperatures, an increase in contraction coefficient during the increase in injection rate is significant only for lower injection rates (from 10 m/s to 250 m/s).
Fig. 4. Change in liquid fuel contraction coefficient for different fuel injection rates and temperatures (p = 2000 bar)
Change in Reynolds number for different fuel injection rates and temperatures at fuel pressure of 2000 bar is presented in Fig. 5. When compared Fig. 5 (fuel pressure 2000 bar) and Fig. 3 (fuel pressure 800 bar) it can be concluded that a change in Reynolds number during the change in the fuel injection rate and fuel temperature has the same trend for every fuel pressure. The only significant influence of fuel pressure on Reynolds number can be seen in the Reynolds number value. Increase in fuel pressure causes decrease in Reynolds number, for the same fuel injector nozzle operating parameters. At fuel pressure of 2000 bar, Fig. 5, maximum Reynolds number does not exceed Re = 7500, while at fuel pressure of 800 bars, Fig. 3, maximum Reynolds number reaches almost Re = 21000. Again, for both fuel pressures, the maximum Reynolds number was obtained at the highest fuel temperature and at the highest injection rate.
Fig. 5. Change in Reynolds number for different fuel injection rates and temperatures (p = 2000 bar)
Change in liquid fuel contraction coefficient for different fuel pressures and injection rates at a fuel temperature of 25 °C, is presented in Fig. 6. Increase in fuel pressure resulted with a decrease in liquid fuel contraction coefficient, for every fuel injection rate, but the decrease trends are not the same at each injection rate. For the lowest observed injection rate (100 m/s) decrease in contraction coefficient, during the increase in fuel pressure is the sharpest. Increase in fuel injection rate causes that decrease in contraction coefficient, during the fuel pressure increase, becomes less and less sharp. For low fuel pressures, dispersion of contraction coefficients for every observed injection rate is low, while it becomes bigger and bigger as fuel pressure increases.
Fig. 6. Change in liquid fuel contraction coefficient for different fuel pressures and injection rates (t = 25 °C)
Change in liquid fuel contraction coefficient for different fuel pressures and injection rates, for the same fuel injector nozzle operating parameters, but for increased fuel temperatures was presented in Fig. 7 for fuel temperature of 40 °C and in Fig. 8 for fuel temperature of 70 °C. As in Fig. 6, increase of fuel pressure resulted in a decrease in liquid fuel contraction coefficient, for every fuel injection rate, and the decrease is the highest for the lowest observed fuel injection rate (100 m/s). When compared Fig. 6 and Fig. 7, it can be noted that the increase in fuel temperature from 25 °C to 40 °C resulted in a slight increase in contraction coefficient at low fuel pressures, while at high fuel pressures increase in fuel temperature causes significant increase in fuel contraction coefficient, for any injection rate. This conclusion and comparison with lower fuel temperature is also valid when fuel temperature is the highest observed (70 °C, Fig. 8).
Fig. 7. Change in liquid fuel contraction coefficient for different fuel pressures and injection rates (t = 40 °C)
Fig. 8. Change in liquid fuel contraction coefficient for different fuel pressures and injection rates (t = 70 °C)
Change in Reynolds number for different fuel pressures and injection rates is presented in Fig. 9 and Fig. 10. Injector nozzle geometry parameters remains the same in all figures, while the fuel temperature was varied and amounts 25 °C - Fig. 9 and 70 °C - Fig. 10. The most of the conclusions for Reynolds number change are the same at each fuel temperature. Increase in fuel pressure causes decrease in Reynolds number for every fuel temperature and injection rate. The decrease in Reynolds number during the fuel pressure increase is the highest for the highest fuel injection rates, at
66

any fuel temperature. Dispersion of Reynolds numbers for different fuel injection rates are the highest at the lowest fuel pressures while the same dispersion is the lowest for the highest observed fuel pressures, what is a valid conclusion for every fuel temperature. Change in fuel temperature influences only the Reynolds number value. For every fuel temperature, the highest Reynolds numbers were obtained at the lowest fuel pressure and at the highest fuel injection rate. Increase in fuel temperature resulted in an increase in Reynolds number.
Fig. 9. Change in Reynolds number for different fuel pressures and injection rates (t = 25 °C)
Fig. 10. Change in Reynolds number for different fuel pressures and injection rates (t = 70 °C)
8. Conclusion
In this paper were investigated influences of liquid fuel temperature, pressure and injection rate on fuel contraction coefficient and Reynolds number during fuel injection. Nozzle geometry parameters remained constant during the whole numerical analysis. As expected, fuel temperature, pressure and injection rate are very influential parameters which can significantly change the fuel contraction coefficient and Reynolds number. Calculations were performed with a standard diesel fuel D2. Increase in liquid fuel temperature cause increase in fuel contraction coefficient. Fuel temperature increase resulted in a slight increase in contraction coefficient at low fuel pressures, while at high fuel pressures increase in fuel temperature causes significant increase in fuel contraction coefficient. To obtain contraction coefficient as high as possible, for low fuel pressures is advisable to increase the fuel injection rate, but not much higher than 100 m/s. At high fuel pressures, increases in the fuel injection rate causes a continuous and significant increase in contraction coefficient when the fuel is on environmental temperature (25 °C), while for higher fuel temperatures increase in contraction coefficient during the increase in injection rate is significant only for lower injection rates. Increase of fuel pressure resulted in a decrease in liquid fuel contraction coefficient, for every fuel injection rate and for every fuel temperature. Reynolds number increases with an increase in fuel temperature and also with an increase in fuel injection rate. During the increase in injection rate, the increase in Reynolds number is as high as the fuel temperature increase, so the highest Reynolds numbers were obtained for the highest observed fuel temperature and injection rate. Change in Reynolds number during the change in the fuel injection rate and fuel temperature has the same trend for every fuel
pressure. For every fuel temperature, the highest Reynolds numbers were obtained at the lowest fuel pressure and at the highest fuel injection rate. Increase in fuel pressure causes decrease in Reynolds number for every fuel temperature and injection rate. The main goal of presented analysis is to be usable not only for one fuel injector and its nozzles, but for a large number of the fuel injectors and for many liquid fuels. Future research will be based on investigations of the same fuel and fuel injector operating parameters for alternative fuels and its comparison with presented ones for a standard diesel fuel.
9. Acknowledgment
This work was supported by the University of Rijeka (contract no. 13.09.1.1.05) and Croatian Science Foundation-project 8722.
10. References [1] Knox-Kelecy, A.L., Farrell, P.V.: Internal Flow in a Scale
Model of a Diesel Fuel Injector nozzle, SAE Paper 922308, 1992. (doi:10.4271/922308)
[2] Chaves, H., Knapp, M., Kubitzek, A., Obermeier, F., Schneider, T.: Experimental Study of Cavitation in the Nozzle Hole of Diesel Injectors Using Transparent nozzles, SAE Technical paper 950290, 1995.
(doi:10.4271/950290) [3] Madero, J. E., Axelbaum, R. L.: Spray breakup and
structure of spray flames for low-volatility wet fuels, Combustion and Flame, 180, p. 102–109, 2017. (doi:10.1016/j.combustflame.2017.02.029)
[4] Greenberg, J. B.: Droplet size distribution effects in an edge flame with a fuel spray, Combustion and Flame, 179, p. 228–237, 2017. (doi:10.1016/j.combustflame.2017.02.002)
[5] Wu, S., Xu, M., Hung, D. L. S., Pan, H.: Effects of nozzle configuration on internal flow and primary jet breakup of flash boiling fuel sprays, International Journal of Heat and Mass Transfer, 110, p. 730–738, 2017.
(doi:10.1016/j.ijheatmasstransfer.2017.03.073) [6] Abianeh, O. S., Chen, C. P., Mahalingam, S.: Numerical
modeling of multi-component fuel spray evaporation process, International Journal of Heat and Mass Transfer, 69, p. 44–53, 2014.
(doi:10.1016/j.ijheatmasstransfer.2013.10.007) [7] Guo, M., Nishida, K., Ogata, Y., Wu, C., Fan, Q.:
Experimental study on fuel spray characteristics under atmospheric and pressurized cross-flow conditions, second report: Spray distortion, spray area, and spray volume, Fuel, 206, p. 401–408, 2017. (doi:10.1016/j.fuel.2017.05.088)
[8] Mrzljak, V., Medica, V., Bukovac, O.: Volume agglomeration process in quasi-dimensional direct injection diesel engine numerical model, Energy, 115, p. 658-667, 2016. (doi:10.1016/j.energy.2016.09.055)
[9] Mrzljak, V., Medica, V., Bukovac, O.: Simulation of a Two-Stroke Slow Speed Diesel Engine Using a Quasi-Dimensional Model, Transactions of Famena, 2, p. 35-44, 2016. (doi:10.21278/TOF.40203)
[10] Škifić, N.: Influence analysis of engine equipment parameters on diesel engine characteristics, Doctoral Thesis, Rijeka, University of Rijeka, 2003.
[11] Cvetić, M.: Combustion modeling in direct injection diesel engine based on fuel injection rate, Doctoral thesis, University of Belgrade, Belgrade, 2000.
[12] Von Kuensberg Sarre, C., Song-Charng, K., D. Reitz, R.: Modeling the effects of injector nozzle geometry on diesel sprays, SAE paper 1999-01-0912, 1999. (doi:10.4271/1999-01-0912)
67

THE ANALYTICAL RESEARCH OF THE DYNAMIC LOADING EFFECT ON THE
ROAD-HOLDING ABILITY CHARACTERISTIC SIGNS OF EARTH-MOVING
MACHINE
Cand. Eng. Sc., Associate Professor Shevchenko V. 1, Post-graduate student Chaplygina A. 1, Cand. Eng. Sc., Krasnokutsky V2,
Associate Professor Logvinov E. 3
Faculty of Mechanical – Kharkiv National Automobile and Highway University, Ukraine 1
Educational and Scientific Institute of Mechanical Engineering and Transport – National Technical University "Kharkiv Polytechnic
University", Ukraine 2
Faculty of International Education – National Technical University "Kharkiv Polytechnic University", Ukraine 3
Abstract: In the process of performing of technological operations motor-graders are undergone severe loading conditions. The
process of working medium development is accompanied by the action of time-varying parameters reluctances on the working equipment. At
the situation of operative bodies blocking which are accompanied by intensive vehicle braking loads on working equipment are of shock
character and can exceed considerably neutral layer of usual loads. Such loading can lead to the crabbing of the vehicle from projected path
of motion. The developed dynamic model of earth-moving machine allows to take into consideration dynamic loads effect on the path
configuration of its motion and formulate prompts to stabilize the characteristic signs of earth-moving machine road-holding ability.
Keywords: EARTH-MOVING MACHINES (EMM), MOTOR GRADER, ROAD-HOLDING ABILITY CHARACTERISTIC
SIGNS, DYNAMIC LOADING, PATH OF MOTION.
1. Introduction
One of the characteristic sings of earth-moving machines
(EMM) road holding ability are parameters characterising the
quality of the work performed. In particular for machines realizing
earth fill building one of the main parameters is a holding ability
characteristic sing shoving the crabbing of operating trajectory of
working unit path of motion from the projected trajectory. In the
cases if EMM path of motion crabs considerably from the projected
trajectory the need arises to perform additional passage ways that
inevitably leads to productivity decrease and energy requirement
increase. Taking into consideration the general trend in the EMM
development in the direction of global automatisation of carrying
out technological operations up to excluding ―man-operator‖ from
regulating system problems of pilot operation of motion path under
conditions of severe external power action become burning.
Peculiar features of EMM behavioral analysis in the process of
carrying out technological operations are important for investigation
of algorithm designs allowing machine regulating problems turn
over on-board computer.
2. Analysis of publications
The review of scientific researches devoted to the problem
of road holding ability loss in the process of technological
operations showed that the greatest attention to this problem is
devoted by the experts in the field of transport engineering, farm
machine industry and earthmoving engineering. Among them:
Podrygalo M. A., Pevsner Ya. M., Farobin Ya. Ye., Litvinov A. S.,
Knoroz V. I., Sevrov K. T., Alekseeva T. A., Artemiev K. F.,
Bromberg A. A., Malinovsky Ye. Yu., Koval A. B., Dontsov I. Ye.,
Bulgakov V. M., Usenko M. V., Prishlyak V. M., Tsygankov T. V.,
Artemov N. P., Huskov V. V., Ksenevich I. P., Petrov A. B. and
others.
The loss of road-holding ability of vehicles (passenger cars
and trucks) is linked first of all with the phenomenon of wheels drift
which is caused by its elastic deflection in lateral direction while
moving on turn. The reason of road-holding ability loss become
centrifugal forces emerging at vehicle curvilinear motion [1, 2]. As
a characteristic signs demonstrating the given process it is
recommended to consider wheels coefficient.
.y
dk
d
(1)
Or vehicle drift coefficient
1y
2
,Rà
kb R
(2)
where
– transversal force acting along the wheel axle;
– slip angle; ,а b – projection coordinates of vehicle mass center
into a horizontal plane; 1 2,R R – road cornering force affecting
wheels of front and rear axles.
As researches show the main reasons of road-holding ability
loss are transversal efforts acting on working units, knee joint
deformation between operating equipment and tool carrier as well
as transverse grade of seating.
As a criterion of road-holding ability the authors use usually
allowable transversal deflection in relation to initial trajectory [3].
Maximum allowable values of transversal deflections are assigned
depending upon the kind of the technological operation performed.
To estimate the mentioned parameters dynamic models of plane
motion of articulated systems are considered. Comparison of the
projected trajectory with the assigned one permits to estimate
vehicle transversal deflection and offer actions excluding drift from
the assigned trajectory.
The peculiar feature of the total drag formation acting on
the operating equipment is the main reason of the EMM drift from
path of motion. One can single out here two specific situations.
When operating equipment has possibility of positioning in space as
for example at motor-graders the resultant vector of external
resistance may be positioned asymmetrically in relation to vehicle
longitude axis [4, 5]. This phenomenon causes the emerging of the
additional disturbing moments capable to drift the vehicle relatively
the assigned path of motion. In this case the situation of static
loading is considered most often. Herewith the characteristic sign of
road-holding ability is estimated by means of coefficient:
1,2,s
d
Mk
M (3)
where sM – stabilizing moment; dM – disturbing
moment.
The situation when operating mobile equipment is installed
on the machine besides static loadings it is offered to take into
consideration fatigue stressing [6]. Estimation of the road-holding
parameters is carried out according to dependency (3), and as a
68

main parameter determining the value of the stabilizing moment the
coefficient of adhesion with supporting surface is applied.
All approaches considered as a rule don’t take into
consideration peculiar features of EMM lading, in particular motor
graders, and correspondently don’t determine exactly parameters
value which characterise formation process of machine path of
motion during technological operation realization.
The purpose and objectives
The development of motor grader motion mathematical
model allowing to estimate objectively reasons of machine
misalignment from initially assigned path of motion.
Factors affecting the formation of motor grader
path of motion
Experimental studies carried out at the testing ground of the
department of building and road machines of the Kharkiv National
Automobile and Highway University allowed to single out a
number of factors affecting the formation of motor grader path of
motion at carrying out technological operations [7, 8, 9]. Firstly,
one must stress that the motor grader path of motion is affected
mostly by the peculiar features forming power pattern of machine
landing namely:
- coefficient of application of resultant vector external
impedances resultant vector on working equipment;
- direction of external impedances resultant vector;
- time variation character of external impedances.
All mentioned above parameters are variable and depend on
type of technological operation performed and geometric
parameters characterising operating unit position relatively medium
developed.
For example at carrying out seating planning and profiling
the expected application coordinate of external impedances vector
W falls at blade midpoint (fig. 1, a). Soil gouging operations the
point of application W misaligns to the blade edge (fig. 1, b).
As the resultant vector of external impedances is directed on
the mitre to the machine longitudal axis it causes the emergence of
the additional lateral loading sW and misalignment of the resultant
impedances vector W in relation to longitudal axis emergence
of additional torques in horizontal plane. Both these factors may
lead to the variation of machine path of motion.
Fig.1 Application coordinate variation impedances resultant vector determining upon the type of the operation performed: а – seating
planning and profiling; b – soil gouging
The performed experimental studies [7, 8] showed that in case of
road cut in accordance with the scheme presented on the fig. 1, b,
the possibility of misalignment of the real trajectory from the
planned one will increase considerably. One must mark especially
path configuration of motion which consists of linear selections.
From the physical viewpoint motor graders motion is implemented
in the following way (fig. 2). At the section of AB trajectory soil
gouging and formation from it the prism in front of blade. This
leads to the growth of W values. At the point A it machine
stops and simultaneously turn about the point of the blade barring
69

which coincides with the application coordinate of the resultant
vector external impedances W . While motor grader turning the
volume of soil prisms decreases and consequently decreases the
W value.
Fig.2 Motor grader path of motion
Machine turn is realized by means of wheels transversal motion.
Herewith practically 100% of driving wheels spinning is registered.
After turn the motor grader shifting along linear path of motion
occurs. The given process may repeat further.
As the load on the operating equipment from the part of the
developed medium may change in the function of motor grader
misalignment for analytical studies of its path of motion it is
necessary to consider the dynamic model taking into consideration
the results of the experimental researches carried out.
In the process of compiling dynamic model the following
simplifications were adopted:
- road cut is carried out on the horizontal
location without top and side rakes;
- tractive efforts are developed by motor
grader balance truck. Herewith the front axle is driven. This
arrangement is characteristic for 70% of motor graders produced;
- cut soil homogeneous and possesses
isotropy properties. This simplifications permits to use the
determined dependencies for resistance forces description.
While developing motor grader’s dynamic model the
authors were coming to conclusion that the formation process of the
path of motion may be described objectively by means of two
different dynamic models:
1. at the initial stage of motion motor grader may be
considered as the body performing plane motion along
surface (fig. 3);
2. at the moment of barring operating equipment (blade) the
application coordinate of resultant vector external
impedances may be considered as unique point of
attachment. Herewith motor grader perform rotating
motion around this point (fig. 4).
Fig.3 calculation model corresponds to the plane motion of
motor grader. As all the forces acting in the system are functions
, y, , , y, ,x x then the path of motion can be determined in terms
of shell’s equation [10, 11]:
1
1
1
( )
ne
c kx
k
ne
c ky
k
me
c c kx
k
mx F
my F
m m F
(4),
where m - motor grader’s mass; cy - motor grader inertia about
axis passing over its mass center C;
1
nekx
k
F
- the sums of
projections of all external forces on the axis Ох;
1
neky
k
F
- the sums
of projections of all external forces on the axis Оy;
1
( )
me
c kx
k
m F
- -
the sums of torques of all external forces in relation to C.
So, to describe path of motion three generic coordinates
are used: misalignment along axis , yx and turn around
machine mass center.
We receive the following system of the second power differential
equations:
1 2 1 2 0
1 2 0
1 2 1 2 0
1 2 0
1 2 1 2 1 2 1
2 3 3
( ) cos( )
( ) sin( )
( ) sin( )
( ) cos( )
( ) ( )2
c f f n fn
á á s án
c f f n fn
á á s án
ác f f á á
s n án
mx T T W W W W
P P W P
my T T W W W W
P P W P
lm T T W W P P l
W l W l P l
(5),
where 1 2,T T - tractive efforts developed by right and left sides
correspondently; 1 2,f fW W - the forces resisting the rolling of the
right and left balance truck; fnW - the forces resisting the rolling of
the front axle wheels; 1 2, ,á á ánP P P - the forces resisting the
skidding of the right and left balance truck wheels as well as front
axle; 0 - start angle of motor grader longitudinal axis.
70

Fig.3 Calculation model for the case of motor grader motion at the initial stage.
Fig.4 Calculation model for the second stage of motor grader motion (turn around O1)
71

At the second stage of motion while crossing over motor
grader in the 100% mode of skidding the turn of machine in relation
to blade О1 blocking point may start. In this case the equation of
motion is described by the equation:
1 11
1
( ),
me
O O k
k
I m F
(6),
Or after transformations
2
22
1 1 1 3
2 2 3 1 2 1 2
4 2 3
( ) ( ) ( )4 2
( ) ( ) ( ) ( )2
( )
á ác f
áf á á
án fn
l lI m l T W l
lT W l P P l l
P l l W l
(7).
Transition from equations system (5) to the dependence
(7) occurs in the case when the total force of traction
1 2T T T will be equal tractive force according to the
conditions of greaten wheeled move with s.
Each of the forces compelling equations (5) and (7)
depends upon are the velocity or motor grader acceleration [12]. In
the process in machine motions this parameters will change. In the
context of problem decide sold by us the estimations of the
possibility of misalignment of the motor grader real path of motions
from the planned one remains current.
The study cases of the comp roost dynamic models to
needs to put down the conditions of motor grader road-holding
ability loss:
at the first stage of motion
1 2 1 2 1 4
1
2 1 3 2
( )2 2 1;
2 2
á áf á á án
á áf n s
l lT W P P l P l
kl l
T W W l W l
(8)
at the second stage of motion
2
1 2 1 2 1 3 2 3 4 2 3
2 2
21 1 3 2 3
( ) ( ) ( ) ( ) ( )2 2 1;
( ) ( ) ( )4 2 2
á
á áá á f f án fn
á ác
l lP P l l W l W l P l l W l
kl l l
I m l T l T l
(9)
As causations when wraith wield performed technological
operating by the motor grader it is necessary to carry out their
recalculation during the whole operating period.
Conclusions
In terms of the carried out researches one can conclusions:
1. For the period of technological operating
realization motor graders path of motion can be described by means
of two dynamic models: plane motion of machine in the surface
plane and rotary motion in relation to blade blocking point;
2. The calculus of the numerical values of motion
stability coefficient k1 and k2 permits on the basis of analytical
calculation determine if would occur the misalignment of motor
grader real path of motion from planned one
References
1. Устойчивость колесных машин при заносе и способы
ее повышения / [Подригало М.А., Волков В.П., Доброгорский
М.В., Степанов В.Ю.]. – Харьков: Изд-во ХНАДУ, 2006. –
335 с.
2. Литвинов А.С. Автомобиль: Теория
эксплуатационных свойств [учебник для вузов]/Литвинов А. С,
Фаробин Я.Е — М.: Машиностроение, 1989. – 240 с.
3 Артемов Н.П. Повышение устойчивости движения
піхотного агрегата при изменении технических параметров
системы управления : автореф. дис. на здобуття наук. ступеня
канд. техн. наук : спец. 05.05.11 «Машины и средства
механизации сельскохозяйственного производства» / Н.П.
Артемов. – Х., 2006. – 179 с.
4. Севров К.П. Автогрейдеры. Конструкции, теория,
расчет / К.П. Севров, Б.В. Горячко, А.А. Покровский. – М. –
Машиностроение, 1970. – С. 95–121
5. Дорожные машины. Машины для земляных работ /
[Алексеева Т.В., Артемьев К.А., Бромберг А.А. и др.]; [Изд. 3-
е, перераб. и доп.]. — М.: Машиностроение, 1972. — 504с.
6. Коваль А.Б. Визначення умов забезпечення курсової
стійкості універсальних землерийних машин : автореф. дис. на
здобуття наук. ступеня канд. техн. наук : спец. 05.05.04
«Машини для земляних, дорожніх і лісотехнічних робіт» / А.Б.
Коваль. – Дніпропетровськ, 2014. – 21 с.
7. Чаплыгина А.М Экспериментальное оценка
показателей курсовой устойчивости автогрейдера/ А.М
Чаплыгина // Вестник НУВГП. – Рівне: Изд-во НУВГП, 2015. –
2(70) – С. 342 – 353.
8. Chaplygina О. Methods to determine measures providing
a motor-grader road-holding ability/ О. Chaplygina,
V. Shevchenko, Zh. Beztsennaya // "Machines, Technologies,
Materials "INTERNATIONAL JOURNAL, issue 12/2015, ISSN
1313-0226 – Sofia, Bulgaria: Publisher scientific technical union of
mechanical engineering, 2015 p.78-83
9. Chaplygina A.M. Road-holding ability of the motor
grader in the process of performing work operations /
A.M.Chaplygina, V.O.Shevchenko, Zh.P. Beztsennaya // VIII
International Conference. Heavy Machinery-HM 2014 Proceedings
– Zlatibor, 2014 – С. 59–67.
10. Курс теоретической механики. Том 2. Динамика (2-е
издание). / [Бутенин Н.В., Лунц Я.Л., Меркин Д.Р.] – М.: Наука.
Физматлит, 1979. – 544 с.
11. Бать М. И. Теоретическая механика в примерах
и задачах: в 3 т./ М. И. Бать, Г.Ю Джанелидзе., А.С.
Кельзон/. Изд. 9. – М.: Наука, 1990. -1309 с.
12. Shevchenko V. The analitical research of the
process of forming the motor-grader motion path at
implementation of working operations / V. Shevchenko, A.
Chaplygina, Zh. Beztsennaya // International scientific
journal trans & motauto world, issue 2/2017, ISSN 2367-
8399 – Scientific technical union of mechanical engineering
industry-4.0, Sofia, Bulgaria, 2017 – С. 81–84.
72

РЕГИСТРАЦИЯ И КОНТРОЛ НА ИНФРАЧЕРВЕНОТО ИЗЛЪЧВАНЕ
ЕМИТИРАНО ОТ АВИАЦИОННИТЕ ДВИГАТЕЛИ
Инженер-физик Ташев В. Л, Главен асистент Манев А. П.
Институт за космически изледвания и технологии – Българска академия на науките, филиал Стара Загора, България
REGISTRATION AND CONTROL OF THE INFRARED RADIATION EMITTED BY AIRCRAFT
ENGINES
1Space Research and Technology Institute (SRTI), Bulgarian Academy of Sciences (BAS), Stara Zagora Department, P.O.Box 103, 6000
Stara Zagora, Bulgaria;
Abstract: The detection and destruction of military aircraft is carried out by missiles that contain an electronic head highly sensitive to
infrared rays. These rays are emitted from the engines of war and other aircraft. The main reason for this issue are the hot gases flowing out
of the nozzles of the engines. There are different methods for reducing and suppressing emissions from infrared rays. To measure the
effectiveness of the emission suppression, special device with a high-sensitivity infrared sensor is built. This sensor is the instrument S9295.
He consists of a measuring photodiode with a wide spectral range and a high sensitivity precision operational amplifier with a field-effect
transistors at the entrance. The device includes also a TE-cooler and a thermistor for temperature control so the photodiode can be cooled
for more stable operation and lowering the noise. All the components are built as а single package placed on a low current leakage sapphire
plate. The package itself is enclosed in airtight container.
Keywords: photodiodes, infrared rays
1. Увод
Известно е, че зенитните ракети съдържат високо
чувствителна електронна глава, която засича източниците на
инфрачервени лъчи. Такива лъчи се емитират от двигателите на
военни самолети и други летателни апарати. Основна причина
за тази емисия са горещите газове изтичащи от соплата на
двигателите. За противодействие на такъв вид проследяване се
вземат редица мерки за намаляване на инфрачервените
излъчвания. Ефективността на едно такова техническо
решение, обаче може да се измери само с прецизен фотометър.
Последните високотехнологични разработки в областта на
фотодиодите ги прави силно конкурентни по-отношение на
важни технически характеристики спрямо останалите сензори.
Такъв е приборът S9295, който е усъвършенстван вариант на
S8785, производство на фирмата Hamamatsu.[1] Той съдържа
измерителен фотодиод с висока чувствителност, който се
използва като сензор за първично преобразуване на светлината
в електричен сигнал както и прецизен операционен усилвател с
полеви транзистори на входа за неговото усилване. Високата
чувствителност в инфрачервената област на прибора S9295 го
превръща в много подходящ сензор за измерване на подобни
сигнали.
2. Прибор за измерване на много слаби
светлинии потоци в инфрачервената област.
Схемата на прибора S9295 е показана на фиг. 1.
Фиг. 1 Схема на прибора S9295.
Освен фотодиод и усилвател приборът съдържа и резистор
Rf = 10 GΩ, термистор за измерване на температурата и
електронен охладител за поддържане на температура от -25 °C.
Всичко това е изградено върху един чип със сапфирена
подложка, която е с много голямо съпротивление и за това
токовете на утечка са практически равни на нула.
Чипът S9295 има следните по-важни параметри:
- Голяма активна площ във вид на прозорче с размери 10
х 10 мм.
- Силициев фотодиод, който е оптимизиран за прецизна
фотометрия от ултравиолетовия до близкия инфрачервен
диапазон и по-точно от 190 до 1100 nm.
- Компактен херметизиран корпус със сапфирен прозорец.
- Вграден прецизен операционен усилвател с много голямо
входно съпротивление и FET транзистори на входа.
- Много високо усилване обезпечено от вградения
високоомен резистор Rf = 10 GΩ, включен в обратната връзка
на операционния усилвател.
- Ниско ниво на шум.
73

- Високоефективно охлаждане вградено на самия чип с
температурна разлика от 50 °C.
- Вграден термистор с висока стабилност.
Тези параметри гарантират, че могат да бъдат измерени
потоци светлина с много слаба интензивност.
3. Предназначение и описание на прибора
S9295.
Основното предназначение на прибора е измерване на
светлинни потоци, предимно в инфрачервената област с много
ниска амплитуда. Това се постига благодарение на високата му
чувствителност, която е -5.1V/nW. За да покажем какво
означава тази чувствителност на практика, ще направим едно
сравнение между фотодиодния прибор S9295 от една страна и
един фотоелектронен умножител (ФЕУ), прибор който е лидер
в това отношение.
За целта можем да пресметнем, какво е изходното
напрежение при предположение, че на фотокатода на ФЕУ
попадне един фотон. В режим на броене на фотони единичния
фотоелектрон, който се емитира от фотокатода има заряд q=
1.6*10-19 [C]. Ако усилването на електронния фотоумножител
е μ = 5*106 , тогава анодния изходен заряд се дава от:
(1) ][108105][106.1 13619 CCqQ Ако широчината на изходния импулс на изхода на
фотоелектронния умножител е t=10 ns тогава за пика на
изходния ток IP се получава:
(2) ][80][10
][1089
13
As
C
t
qIp
Ако товарното съпротивление или входния импеданс на
прилежащия усилвател е 50 Ω , то изходния импулс има пиково
напрежение :
(3) ][4][50][80][][ mvAZAIpVo
Импулсния усилвател след изхода на ФЕУ има усилване от
36 dB или 63 пъти.
(4) VmVmVVout 252.0][25263][4
От характеристиките на фотодиода виждаме, че той има
чувствителност от 5.1 V/nW, включително вградения
операционен усилвател и вградения високоомен резистор.
Енергията, която пренася един фотон е :
(5) evnm
smsJhcE 22.2
555
)/10998.2().10626.6( 834
Или в джаули получаваме:
(6) ][1056.3][10602.122.2 1919 JJeVE
Ако предположим теоретично, че времето на действие на
фотона е същото както на ФЕУ, т.е. 10 nS, то за мощността
получаваме:
(7) ][0356.0][1056.3][1010
][1056.3 11
9
19
nWWs
J
t
EP
а за изходното напрежение се получава:
(8) ][182.0][
][1.5][0356.0 V
nW
VnWVout
Тези изчисления показват, че доколкото стойностите
0.252V форм.(4) и 0.182V форм. (8) кореспондират една с
друга, то по отношение на регистрация и усилване на слабите
светлинни сигнали специализираните измерителни фотодиоди
все повече настигат характеристиките на ФЕУ. Фотодиодите
обаче работят само в аналогов режим, което в случая не е от
значение. Голямото предимство на фотодиода е, че той е
смного малки габарити, захранва се с ниско напрежение, има
вграден охладител и е много по-надежден.
Фотодиодите са прибори, които преобразуват директно
попадналата светлина в техния p–n преход в електрическа
енергия под формата на електрически ток. Много важно e да се
знае, че генерирания ток е правопропорционален на
количеството светлина попаднала върху p-n преходa.
Генерирания от фотодиода ток показан на фиг. 1, минава
през резистора Rf , преобразува се в напрежение и се усилва от
операционния усилвател. Той е с много високо входно
съпротивление, гарантирано от полевите транзистори на входа,
така че консумацията на ток практически е равна на нула. В
самия чип има вграден термоохладител, който ефективно може
да намали температурата с 50 ºC и тя да достигне до -25 ºC, при
ефективна температура на околната среда +25 ºC. При тези
ниски температури на охлаждане токът на тъмно силно
намалява. Наличието на термистор върху самия чип, дава
възможност да се измери температурата на фотодиода. Ако има
разлика между текущата температура на фотодиода и
зададената, автоматично се включва терморегулатора, който
охлажда чипа до необходимата температура. Това на практика
означава, че ако се зададе работна температура от -25 ºC тя
може да се поддържа автоматично до +25 ºC на околната среда.
4. По-важни електрически и оптически
характеристики на прибора S9295 [1].
4.1. Максимални характеристики. Те са
показани в таблица 1.
Табл. 1 Максимални характеристики на прибора S9295
4.2 Типични характеристики.
Типичните характеристиките при Vcc=±15V, RL = 1MΩ са
показани в таблица 2.
Табл. 2 Типични характеристики на прибора S9295.
74

4.3 Спектрална характеристика.
Спектралната характеристика на прибора е показана на фиг.
2. От нея се вижда, че чувствителността на фотодиода е в
диапазона от 200 до 1100 nm, като пика е на 960 nm.
Фиг. 2 Спектрална характеристика на прибора S9295
4.4. Механична конструкция на прибора
S9295. Механичната конструкция е показана на фиг. 3
Фиг. 3 Механична конструкция на прибора S9295
5. Електрическа схема на фотометъра.
Електрическата схема на фотометъра е показана на фиг. 4.
Освен прибора S9295, който е показан с пунктир на
чертежа, фотометърът съдържа още няколко усилвателя.
Изходния сигнал от прибора се усилва допълнително от
инвертиращ операционен усилвател ИОУ, показан на фиг. 4.
Този усилвател трябва да бъде с високо входно съпротивление,
защото той представлява товар за полезния сигнал. Според
техническите изисквания неговата стойност трябва да е по-
голяма от 1 MΩ.
Термисторът Term е включен в мостова схема, където се
изработва сигнал на грешката между зададената и текущата
температура. Този сигнал се усилва от диференциален
усилвател ДОУ и се подава към нискочестотен драйвер НЧД.
Фиг.4 Електрическата схема на фотометъра.
Мощния диференциален усилвател ДОУ и се подава към
нискочестотен драйвер НЧД. Мощния НЧД подава достатъчно
силен ток от порядъка на 0.8[А] за да работи термо охладителя
в режим на охлаждане или затопляне в зависимост от околната
температура и най-вече от температурата на чипа S9295. Най-
често тази температура се поддържа на стойност -25º C, за да се
получи максимално ниска величина на тока на тъмно. При тези
ниски стойността на температурата тока на тъмно е от
порядъка на няколко пикоампера. Тъй като минималния
полезен сигнал е от порядъка на 10 наноампера, това осигурява
много добро съотношение между сигнал и шум.
6. Извод.
От разгледаните характеристики става ясно, че
съвременните фотодиоди специализирани за измервателни
приложения на слаби сигнали са силно конкурентни на
фотоелектронните умножители, които традиционно се
използват. Те притежават висока чувствителност, широка
спектрална характеристика, много добра линейност, нисък ток
на тъмно, висока квантова ефективност, непретенциозно
захранване и не на последно място здрав корпус и устойчивост
към механични натоварвания.
Към слабостите могат да се причислят сравнително
ниското бързодействие на измерителните фотодиоди,
невъзможност да работят в режим с броене на фотони, както и
други по-маловажни характеристики.
Една от областите, където фотодиодите с интегриран
операционен усилвател имат предимство е за откриване и
регистрация на слаби излъчвания в широк светлинен диапазон.
Литература.
1. HAMAMATSU “Measurement with Silicon photodiode,
which contains the preamplifier and TE-cooler”
75

VEHICLES FOR THE FUTURE – DILLEMAS AND PERSPECTIVES
Prof. Dr Nataša Tomić-Petrović, Faculty of Transport and Traffic Engineering, University of Belgrade, Serbia
Abstract: The homeland of the first modern electrical car is Greece. Legendary Enfild 8000 is one of the first electrical cars in the world, and that small two-seater was also extremely economical. It originated from the Greek island of Syros, where it is exhibited today at the Industrial Museum in Hermoupolis.It is believed that electrical cars are the real small revolution, because we replaced one type of engine with the other, while the autonomous vehicles resistant to human errors will represent the first real big transport revolution of the 21st century. Experts believe that new models of cars will have the best test in Norway1, where during the last year drivers mostly (52%) voted for electric cars and hybrids. Electrified icons: Ford Mustang and Ford F-150 hybrids are coming by 2020. Porsche plans to sell 20,000 cars E mission per year. Also the French are planning to present 8 new electric cars (record holder is the model "zoe"2, and soon the EV version of the "Quid", a small SUV that is sold on developing markets should join) before year 2022. In Serbia there is a plan to set up more charging stations for electrical vehicles. It will be initially only 3 stations within the project "Green Balkanica", while it is cited that in China there are even 5 million of these stations.
Keywords: ELECTRICAL CAR, FUTURE, ECOLOGY, SERBIA, WORLD.
1. Introductory considerations
Would you be in a car that is driving instead of you? Many car manufacturers and other companies that are not part of the auto industry, have been working on the development of autonomous vehicles for years. So far they have mainly been focused on solving the problems that may occur when these cars find themselves in real traffic conditions and did not think too much about the future customers and their attitudes towards self-driving vehicles.
Real struggle is led in the world for new technologies between China and the United States, i.e. the race to develop the first "egzaskejl“1 computer, as previously Russia and the United States fought for the development of space technology. The biggest problem in its development will be to ensure sufficient electricity, because its work requires the capacity of a small nuclear power plant. We should mention the supercomputer 'Sunway TaihuLight" and computer "The Summit". Building the "Summit" America could for the first time after year 2013 again take over the primacy in the development of supercomputers. China then launched the computer "Tianhe-2" and took over the primacy in the development of the fastest computers in the world. In this race participate also Japan and the European Union (EU) and promote the development of various scientific disciplines, industrial technology, defense.
According to the data of "France Press" the European Automobile Manufacturers Association (ACEA) announced that in March 2007 in EU the number of registered passenger cars increased by a significant 11.2%. Today, the European car market is growing2 and returns to the level before the economic crisis of 2008.
The question is "if your vehicle is fully autonomous (there is no steering wheel or steering commands) do you need auto insurance? Do you need a driver's license? Are you responsible in the event of a collision, or the manufacturer? Should a car manufacturer or its owner have insurance in the case of an accident? Should the liability coverage be included in the purchase price of the car? These are important legal issues that need to be answered.3
1 China has announced that this computer will be completed by 2020. 2 Better results were observed in all 5 major markets, so that in March in Italy, the
number of newly registered cars increased for 18.2%, in Spain for 12.6%, in Germany for 11.4%, in the UK for 8, 4% and in France for 7%. /Tanjug/
3 Poitras Colin, The rise of self-driving cars, March 2017. https://phys.org/news/2017-03-self-driving-cars.html
Greece is the home of the first modern electric car. Enfield 8000 was one of the first electric cars in the world, and a small two-seater was also extremely economical. It is interesting that it just originated at the Greek island of Syros (Syra island archipelago), where it is exibited today at the Museum of Industry in Hermoupolis. The owner of the British company Enfield Automotive, Mr. Janis Goulandris in early seventies, contacted Mr. Jorgos Mikhail who was dealing with the construction of space shuttles for NASA. Specifically, he wanted that the first electric car is produced just in Greece, but its further production will take the company Enfield in the UK. For the Greeks themselves was of the great importance to continue the relationship with the company of Gulardis in Britain since it is precisely the one that produced vehicles used for the struggle against the Germans in the Second World War.
A small car was great and the most convenient discovery for the time when it was manufactured as evidenced by the interest in it from the whole world. A small two-seater battery was more popular beyond the borders of Greece, especially in London, where its 123 copies were sold, a few hundred were also sold in Sweden, where it was used as the primary mean of transport in the mines. Automobile worked on eight batteries and after seven hours of charging it was able to hold out the next 24 hours. It reached speed of 80 kilometers per hour and it was perfect car for the city in which it ran about 70 kilometers daily.
2. Serbia and World Experience
"Superchargers" connections that fill in "Tesla" vehicles in six countries of South-Eastern Europe by the end of 2017 have been set in our country at three locations: - near Belgrade, - Požega and - the city of Niš. The founder of the "Tesla" expects that fully autonomous "Tesla" will be ready in 2018, but it is clear that legal approval will take another one to three years more. Meanwhile the first electrocharger started to work on Corridor 10, and in Serbia the first device for charging electric cars began to work at the toll station of Preševo, on the border with Macedonia. Testing has shown that it works excellent and that it is possible to simultaneously charge three cars.
The production of the new “Fiat 500 L“ has started on 25th of May 2017 year, and it is the best-selling model in its category in Europe. About 40% of built in parts are new. On one chassis can be made at least four models, and Italian partners are trying to keep the Serbian car factory from Kragujevac under its auspices mostly because of cheap labor. Unfortunately, the wages of workers in
76

factory based in Kragujevac and today are 3-4 times lower than than those of "Fiat"’s workers in Italy, Turkey and in Brasil. The term contract of Italian-American group "Fiat-Chrysler" with Serbia for 10 years expires at the end of year 2018. It is believed that the car factory in Kragujevac can not survive if we do not produce a totaly new car soon.
For the first time in March 2015, the autonomous car drove from San Francisco to New York. Mining company “Rio Tinto“ already operates a fleet of self-driving garbage trucks in the mine in Western Australia.
During the spring 2015, the Federal Department of Environment, Transport, Energy and Communications
in Switzerland has given permission to the company "Swisscom" to test "Volkswagen Passat" without a driver on the streets of Zurich. But still "Volkswagen" remained the largest European manufacturer with regard to the new registrations of its "BMW", "Audi", "Porsche", "Seat" and "Scoda," there is an increase of 6.5%, so that this manufacturer dominates on the market with a share of 21.3%.
Since the summer in 2015 the French Government allowed to "Peugeot Citroen" to perform testing under real conditions in the area of Paris. These experiments were extended to other French cities such as Bordeaux and Strasbourg in 2016, and the first demonstration of autonomous vehicles on the open road in France was performed in Bordeaux in October 2015. Also, the French are planning to present 8 new electric cars till 2022-year. (Record holder is model "Zoe" and very soon the EV version of "Quid", an small SUV, that is sold in developing markets should join.) In mid-October 2017, the French car company "Renault" published that half of its models will be hybrid or electric till 2022. These "robotic" vehicles will have an elevated degree of autonomy and "Renault" will offer 8 fully electric and 12 hybrid vehicles before year 2022 and strategic plans anticipate the doubling of vehicle sales in the markets of Russia and China.
At the end of October 2017 it was announced that it was a successful first testing of vehicles in Bavaria, i.e. smart bus without the driver was the first pickup truck without driver4 presented by the German railway "Deutsche ban". And related to railroad, probably that is why once is said that where there are no trains - there is no life. The testing was conducted in the spa Bad Birnbach, in Bavaria on the south of Germany, and this electric mini bus can carry 12 passengers and represents a new era of public transport. So the first public transport line with autonomous vehicles was opened. Since 2018, "Deutsche ban" who founded the branch "Joki" dedicated to electric mobility and transport of the future, intends to test his pickup truck in several German cities, including Hamburg. Paris, Lyon, Las Vegas and Dubai already have such vehicles, but in smaller proportions. The new German law also contains a special provision that allows for self-driving cars in certain limited areas, such as parking areas in shopping malls.5
Company "NuTonomy" is planning to place commercially self-driving taxis in Singapore during 2018, with the intention to be operational with the fleet of self-driving taxis in 10 world cities till
4 This pickup truck was projected by the French start-up company „Easy mail“.
5 See: Hetzner C, “German industry welcomes self-driving vehicles law”, Automotive News Europe, May 15, 2017, http://europe.autonews.com/article/20170515/ANE/170519866/german-industry-welcomes-self-driving-vehicles-law, 22.09.2017.
2020. Electrified icons: Ford Mustang and Ford F-150 Hybrids are coming by 2020 and Porsche plans to sell 20.000 mission E cars a year.
"BMW" has already announced that by 2025 it is planning to put on the market 12 electric models and 13 versions of hybrid cars. The first "BMW" electric car "mini" will come off the production line in year 2019, according to the report of the British public Service BBC. "General Motors" is testing 50 self-driving vehicles "Chevrolet Bolt Sedan“ in several states including California and Michigan.
During January 2018 in town Jeddah (Saudi Arabia) was opened the first Car Show dedicated to women – customers. Also manufacturers have prepared many novelties for Geneva Motor Show, the most influential automotive event in Europe on the 8th of March 2018. Thus, in "Merecedes" A class now new trunk will be larger, of 370 liters and aerodynamics and performance have been improved. While the "Opel" will not show up at this event in 2018, "Škoda" has prepared redesigned "Fabia" which is improved and with a screen of 6.5 inches impresses at first glance. Sales of this model should begin in mid-March this year. It was expected that the "Hyndai" in Geneva exposes the fourth generation of the car "Santa Fe" with more modern design. 6
Romanian brand "Dacia" continues to develop under the control of "Renault". This reliable and safe car, "Duster" got all it could from the "Renault" and "Nissan". But also the leaders in the "Maserati", who were planning that SUV "Levante" becomes a pillar of financial stability of this Italian brand, have failed, during the 2017 production has been stopped for several days due to the weaker demand. "Fiat-Chrysler cars" will reduce working hours until June 2018 and the factory "Mirafiori" will produce less 'Levante“. Yet the contracts of solidarity for workers were introduced, so workers will not receive temporary layoffs, but they will be earning less. Thus, a little more than 2000 jobs have been rescued.
3. Importance of Safety Issues
Industry of self-driving cars has experienced that regulators prevented innovations that could improve public safety. In the USA, 30 000 people die every year on the roads, and over a million are injured. 94% of these accidents are caused by human factor.7 Self-driving cars could eliminate human error as the cause of 90% of collisions and they could make people more mobile, may be reduce emissions and set in motion economy.
These days in Serbia new stricter regulations on traffic safety were adopted. Harsher penalties are provided for speeding and also the mandatory installation of video surveillance during the inspection, which will be associated with the Ministry of Internal Affairs by a special program, is predicted.
During July 2017 year more than 5.3 million vehicles passed along highways in Serbia. (statement of the Public Enterprise "Roads of Serbia"). Unfortunately, there are also thefts8 of traffic
6 Koreans have changed the interior and set a high central touchscreen. 7 Draxler B, Who’s Responsible When A Self-Driving Car Crashes ? June 2015,
Bryant Walker Smith talks shop, https://www.popsci.com/whos-responsible-when-self-driving-car-crashes
8 About 120 million dinars or around one million euros.
77

signs and other traffic signalization and equipment along our roads, and that directly reduces security and directly endangers the lives of participants in traffic.
At the same time the authorities in France have decided to tighten laws on road safety, all in order to help reduction of the number of fatalities on the roads and improve safety. So in the future the drivers will not be able to stand on the side in order to check the phone9; even though the engine is shut down. If drivers are caught by the authorities with a mobile phone in their hands, for that they will pay a fine of 135 euros. The law now provides for an obligation for the driver to park the vehicle in the parking place, turn off the engine and then check the mobile device.
And in China at every more significant crossroads in Beijing, the teams of emergency services are stationed and ready to react in the case of traffic accidents. Traffic violations are charged for immediately after the execution, on-site, and police has devices in which data of the offender are entered and issues the proof of payment of such penalty.
Researchers from the Serbian Institute of Nuclear Energy "Vinča" in cooperation with colleagues from the Croatian Institute "Ruđer Bosković" and the Swiss Federal Institute EMPA already for two years are working on the project of hydrogen energetics with the title "New materials for saving energy." It is about development of methods for storing hydrogen that would be applied as fuel and energy source. The authors develop complex hybrids (which contain large quantities of hydrogen) capable of releasing or receiving hydrogen according to our need.
In the final version of the Climate Action Plan, the Government in Germany lowered the aims on reducing emissions of carbon-dioxide for industrial sector, however, the industrial sector calls for reducing carbon dioxide emissions for only 20% by year 2030, comparing to year 2014.
It is stated that "Audi" is buying the technology for cars using hydrogen. "Numbers are the language to confirm the truth." From the company "Folkswagen“ we are notified that Germany should reduce subsidies for diesel cars and ban vehicles that are big polluters. It is also pointed out that the gradual tax relief should be directed towards the promotion of environmentally friendly technologies. The scandal that broke out in 2015 indicated that the diesel cars of this manufacturer are to blame for the problems of air pollution in Germany and abroad. Calls for a ban on diesel cars already have full support in some major German cities.
The wider European project Central European Green Corridors (CEGC) included Slovakia, Germany, Austria, Croatia and Slovenia where the dense network of 115 modern fast chargers for electric cars was placed.
9 The only exception is in the case of a traffic accident or some similar situation when the use of a mobile phone is allowed, in order to realize an urgent call.
4. Conclusion
The first modern electrical car was great and the most practical discovery for the time in which it was produced what testifies the interest in it from the whole world. It is believed that electric cars are the real small revolution, because we replaced one type of the engine with another, while the autonomous vehicles resistant to human errors will represent the first real big transport revolution of the 21st century. Be ready for any surprise - it is a sign of culture, wrote the Indian philosopher and poet Rabindranath Tagore.
Having in mind that electric cars have become our future, on this path Serbia is still lagging behind, but on the way of electrification the most advanced is Scandinavia, especially Norway. The primary objectives are of economic - environmental nature with regard to electrical vehicles which produce significantly less carbon dioxide and in Serbia the setting up charging stations for electric vehicles is planned. As it was mentioned the first electrical charger on the Corridor 10 started to work, i.e. in Serbia the first device for charging electrical cars began to work at the toll station of Presevo, on the border with Macedonia. It will be initially only 3 stations within the project "Green Balkanika", while the cited data show that China has even 5 millions of these stations.
Expecting news from the area of self-driving cars this paper represents my contribution to the vehicles for the future for the generations to come.
References
1. Draxler Breanna, Who’s Responsible When A Self-Driving Car Crashes? June 2015, Bryant Walker Smith talks shop, https://www.popsci.com/whos-responsible-when-self-driving-car-crashes
2. Hetzner Christiaan., “German industry welcomes self-driving vehicles law”, Automotive News Europe, May 15, 2017, http://europe.autonews.com/article/20170515/ANE/170519866/german-industry-welcomes-self-driving-vehicles-law, 22.09.2017.
3. Poitras Colin, The rise of self-driving cars, March 2017,
https://phys.org/news/2017-03-self-driving-cars.html
78

COMPARATIVE ANALYSIS OF LITHIUM-ION BATTERIES FOR EV/HEV
APPLICATIONS
M.Sc. Velev B. PhD.,
Institute of Mechanics - BAS , Bulgaria
Abstract: For the serial production of electric cars, the development of Li-Ion cell technology to achieve high energy density of
packaging batteries is critical and is subject to great research and development. This paper reviews the latest developments in cell
technology and cathode chemistry for the production of traction lithium-ion batteries. Are made non-destructive testing and comparative
analysis of the most important characteristics of the batteries with the known Li-Ion cell electrochemistry. The advantages and
disadvantages of different types of Li-Ion cells are presented. Conclusions were made on the degree of applicability of the respective types of
lithium-ion batteries in EV / HEV applications.
Keywords: LI-ION - LITHIUM-ION BATTERY; EV/HEV- ELECTRIC AND HYBRID VEHICLES; BMS-BATTERY
MANAGEMENT SYSTEM.
1. Introduction
Enhanced EV / HEV production depends on the
development of lithium-ion batteries to store and manage energy.
Although lithium-ion technology is relatively young, it has
significant potential for both reducing costs and increasing energy
density (specific Wh / kg energy) by rationalizing the
manufacturing process. Specific energy is a key indicator in the
production of Li-Ion cells for EV. The advantage of energy density
lies in the fact that less electrolyte is required, which allows faster
transfer of ions from the anode to the cathode which, when
assembled, results in a lower cell weight and hence lower total
weight of the battery pack for EV. In recent years, great progress
has been made in the development of Li-Ion cell technology to
achieve high energy density.
2. Purpose of the work
To review the cell characteristics and chemistry of
cathode materials for the production of traction lithium-ion
batteries. Perform battery tests with the most popular Li-Ion cell
electrochemies, analyzing the advantages and disadvantages of
different cell types. To draw conclusions on the degree of
applicability of the respective types of lithium-ion batteries in EV /
HEVapplications.
3. Characteristics of the most used battery cells for
EV / HEV
Largest distribution in EV / HEV battery production has
received the following types of Li-Ion cells: LFP, NCA and NMC
[4,5]. The most common classical LCO cell with LiCoO2 cathode
material has a high specific energy (240Wh / kg) but is not suitable
for EV / HEV applications because of its propensity for ignition and
harmfulness. The main cell characteristics are as follows:
- Specific energy. This feature has recently proven to be
the most important, due to the development of battery management
systems, the BMS, which has helped remove major flaws in
increased density (heating, ignition, etc.).
- Chemical composition of the cathode material. It
depends on the specific energy of the cell, and hence the maximum
EV range with one charge [4,5].
- Cell size. Until recently, prismatic design of cells was
considered to be the most suitable for EV. However, it is only
suitable for LFP cells that are fire-safe but have low energy density.
The reason is that in this design there is a greater probability of
microscopic "short-circuits" between the electrodes in the folding
zones and causing the "fugitive heat" effect (spontaneous
temperature rise and cell destruction) [6]. Therefore, most of the
NCA and NMC for EV cells are cylindrical, where there are no
sharp folds between the electrodes and the heat-fugitive effect is
less likely. The most widespread in EV are the cells of size 18650
[11].
- Internal resistance (impedance). This is an important
functional feature of the cell. It is necessary to know the impedance
of the cell to calculate the generation of Jaw heat or the loss of
power in the cell. With cell aging, its internal resistance increases.
This reduces the ability to receive and hold charge, but the OCV
will still display as normal and even higher, despite the reduced
battery capacity. Periodic comparison of actual internal resistance
with new battery resistance will show any deterioration in battery
functionality [8].
- Charging / dilution characteristic curve. Another main
functional characteristic is the charge / dilution curve. It depends
mainly on the choice of anode and cathode materials. This is an
important feature that determines cell behavior during charging /
discharging and is fundamental in the development of algorithms
and software for battery management and monitoring systems.
4. Subject of research, equipment and
methodology
In order to determine the most promising cells for EV /
HEV applications, non-destructive tests of the basic functional
characteristics have been performed - internal impedance and
charging / discharging characteristics of cells of different design
and different cellular electrochemies of the most popular types of
Li- Ion batteries for EV / HEV applications.
4.1. Object of the study
The object of the study is LFP, NCA and NMC type 18650 Li-
Ion cylindrical cells, and a large LFP prismatic LFP cell line with
LiFeYPO4 cathode material. Cylinder cells are new, commercially
purchased by different distributors [1,2,3]. From a used battery
pack for EV, two large prismatic cells with the largest difference in
nominal voltage at OCV were tested (Table 1). Cells are tested
without protectors and control systems. Tests are subject to at least
two cages of the species.
79

Table1: Commercial characteristics of the species
Lithium - ion cells used for EV / HEV
Type
Format,
mm
Commercial
name
Nominal
V
LFP Ф18х65 LFP18650
Zelle
3,2
NCA Ф18х65 NCR18650A 3,6
NMC Ф18х65 INR18650-
29E
3,7
LFP 179x62x218 LYP100AHA 3,3
4.2. Apparatus for research
For the experimental tests a modern safety device was developed,
working together with the LabVIEW software package and LabJack
U12 test card. It can work with different type and format Li-Ion
cells [8]. Photographs of the unit in action are shown in Fig. In Fig.
1.a) shows a large prismatic cell test and Fig. 1.b) cylindrical cell
test format 18650.
4.3. Experimental Research Methodology
1. Preliminary testing
The objectives of the preliminary test are:
- Determine the charge / dilution curve and assess to what extent
the characteristics of the new cells meet the characteristics of the
manufacturer;
- Make a comparative analysis of the charging / dilution curves of
three types of the most common in the practice of EV applications
lithium-ion cells with different electrochemistry to identify
differences in their behavioral patterns during charging / dilution.
All cells must be fully charged to the allowable level before
testing begins. The cell format 18650 is then diluted with a current
of 0.25 C, with C being the battery capacity taken from the
manufacturer's data. Dilute for 1 to 4 hours (up to 250 minutes)
depending on the capacity of the cell types. The test is carried out
with the apparatus shown in Figure 1 (b). The test results are shown
in Figure 2.
a b
Fig.1 Images of the impedance measurement unit and the charging /
dilution characteristics of lithium-ion cells. Fig. 1a) for large prismatic
cells; FIG. 2.b) - For cylindrical cells format 18650.
Fig.2. Load / discharge curves of cylindrical cell format 18650 with
different cathode materials
2. Full cycle with 0.25C DC charging / discharging current.
Fig. 3. shows cell voltage during a pre-test cycle with a 25 A charge
/ discharge current of a large LFP cell and a 0.8 A charging /
discharging current of a small NCA cell. The cell voltages are
displayed as a function of the charge state (SOC). This allows direct
comparison of voltage levels between charge and discharge in the
same charge state of the two cell types. At the large prismatic cell,
the charging and dilution time is halted for a short time for each
10% change in capacity to measure the voltage and analyze the
relaxation at OCV [11]. In the NCA type cell, relaxation is not
necessary because the charging curve matches the dilution curve,
i.e., no special charging / dilution cycle is required as in the large
cell.
Fig. 3. Cellular voltage development in a 0.25C charge / discharge
current with a large LFP cell break and a small NCA cell.
3. Determine the internal resistance
An electrical method [8] is used to determine the impedance. In
order to determine the internal resistance, it is first necessary to
measure the OCV of the cell. Then a load must be connected
through the cell, which will cause a current to flow. This will
reduce the cell voltage due to the drop in IR voltage across the cell,
which corresponds to the cell's internal resistance. Then the cell
voltage must be measured again when the current is running. The
80

Rin impedance is calculated according to the law of Om by the V
cell between the two measurements and the Vcell difference in
voltage current I flowing through the cell according to formula (1).
Rin = Vcell/I , mΩ (1)
For the test, an impulse current of 1.5 ° C is applied for
each individual cell for 2 seconds. Using a 2 second pulse time is
sufficient to allow cell voltage to stabilize but has a negligible effect
on SOC. The pulse current for the large LFP cells is 150A and the
current for the small NSA is 4.5A.
5. Analysis of experimental results and discussions
The average values of the impedance test data and the
specific energy of the cell types calculated from the charging /
dilution curves are presented in Table 2.
The analysis of the experimental results of Fig. indicates that the
charging / dilution curves of different types of cylindrical cells
differ.
Table2: Test results
Type Cathode materials Capac.
Аh
Imp.
mΩ
Energ
Wh/kg
LFP LiFePO4 1,4 40 110
NCA Li(NiCoAl)O2 3,1 79 260
NMC Li(NiCoMn)O2 2,9 75 220
LFP LiFeYPO4 100 39 90
The nominal (working) area of the LFP cells is seen to be
rectilinear with a very small slope, i. E. the voltage changes very
little over the charge / discharge time. It is also seen that the
characteristics of NCA and NMC cells resemble and differ only in
capacity [4]. Therefore, the actual charging curve characteristics
match the performance characteristics given by the manufacturer
and the next tests can be performed.
In FIG. represents the cell voltage charge / discharge
curve during testing at a 0.25C DC charge / discharge with large
LFP cell breaks and no pause (continuous cycle) on a small NCA
cell. The difference from the graph in Fig. 2 is that the voltage on
this graph depends on the SOC and not on the time that the
maximum capacity is reached. The upper cut-off curve of the LFP
cell cycles represents a charge (brown), and the lower cut-off curve
(red) represents the break with one-minute break when OCV is
counted. Measurements of cell voltage during the test cycle indicate
that the cell does not reach balance at the end of the pauses if the
response step is paused for 1 minute which is very small. This
makes the test more difficult and neglects because it extends the test
cycle time to several days. It is necessary to accelerate the cycle
time. This is done with a special algorithm where continuous
averages (purple line) are interpolation between voltage levels at the
end of 1 minute long pauses. This allows the test cycle to run in a
very short time, with no great relaxation pauses [4,10]. Also from
the analysis of the charge / dilution curves of the two cells, it is
confirmed that the nominal area of the NCA cell curve has a non-
linear character and the nominal curve region of the LFP cell has a
linear characteristic. This means that the load state (SOC)
assessment in NCA cells becomes much easier by measuring
voltage only, whereas for LFP cells, due to the small slope of the
dilution curve, the SOC measurement with voltage measurement
only is imprecise . It is also necessary to measure the amount of
electricity (Coulon count), which complicates the algorithm and the
software of the respective management system (BMS).
Figure 1 (a) of the monitor graphically shows the
impulses impulses of two large LFP (LiFeYPO4) cells, and in
Figure 1 (b) the impulses of two small NCA cells. There is a slower
relaxation of OCV in large cells than small cells. See also, the larger
internal resistance of one LFP cell having a higher OCV. Therefore,
bigger cells with higher voltages have a higher internal resistance or
are not well balanced. Small NCA cells have exactly the same
impedance and relax immediately, which means their high quality.
From the data in tab. 2 shows the smaller impedance of LFP cells
compared to other species. This means longer life and more
charging / discharging cycles of this cell type.
6. Conclusions
- LFP cells are of great fire safety and security. Their functionality
is very good, they have a large number of charge / discharge cycles
and up to 1-2 years ago they were considered the most suitable for
EV / HEV applications [8,10]. However, they have one major
disadvantage - low specific energy, making this battery unpopular
for modern EVs. Especially difficult to balance and require
complex software to determine SOC, large prismatic LFP cells.
- NCA cells offer high energy density and are widely used in
consumer electronics. They form the basis of Panasonic's battery
packs in the current EV models of Tesla motors [11,12].
- NMC cells are also suitable for use in EV. NMC Chemistry is
used by Renault and BMW for EV. According to Samsung, the
current specific power of its NMC is 130Wh / kg (about half of
Panasonic's NCA, but by 2019/2020 it would be 250-300 Wh / kg.)
The cost of producing NMC cells for the time being is 12-19%
higher than NCA [9,11,13].
In the near future, intelligent BMS developed by leading
companies, specifically for NCA and NMC cells, will contribute to
the formation of EW battery packs with power over 100KWh and
specific energy over 350Wh / kg with high quality and high safety.
7. Literature
1.www.ev-power.eu/.../WB-LYP100AHA-LiFeYPO4-3-2V-
100Ah.html.
2.https://batteryservice.bg/kategoria/baterii/li-ion-
baterii/visokorazryadni-li-ion-baterii/.
3. https://www.liontecshop.com/shop/18650.
4. H.Popp, J.Attia, F. Delcorso, A.Trifonova, Lifetime analysis
of four different lithium ion batteries for (plug–in) electric vehicle,
Transport Research Arena (TRA) 5th Conference: Transport
Solutions from Research to Deployment, Paris , France, 2014-4-14
to 2014-4-17(2014).
5.http://batteryuniversity.com/learn/article/types_of_lithium_io
6. https://electrotransport.ru/ussr/index.php?board=48.0
7. Meng Wang, Anh Le, Daniel J Noelle and other, Effects of
electrode pattern on thermal runaway of lithium-ion battery,
International Journal of Damage Mechanics 0(0) 1–8,
DOI:10.1177/ 1056789516660176 (2016).
81

8. Zhu Wei, A Smart BMS for Large Format Lithium Ion Cells ,
utdr .utoledo. edu/cgi/ viewcontent .cgi? article...dissertations,
(2011).
9. M. Brand, S. Glaser and other, Electrical safety of
commercial Li-ion cells based on NMC and NCA technology
compared to LFP technology/ World Electric Vehicle Symposium
EVS27(2013).
10. Doerffel, Dennis (2007) Testing and characterisation of
large high-energy lithium-ion batteries for electric and hybrid
electric vehicles. University of Southampton, School of Engineering
Sciences, Doctoral Thesis, (2007) .
11.G. Hawley, https://evannex.com /blogs/news/ understanding-
teslas-lithium-ion-batteries (2017).
12.C.Arcus ,https://cleantechnica.com/2018/03/04/exciting-
developments-nmc-811-lithium-battery-technology (2018).
13.https://cleantechnica.com/2016/07/16/bmwsamsung-
batteries-vs-teslapanasonic-batteries-better (2016).
82

CONSTRUCTIVE DESIGN OF A BELT CONVEYOR FOR A COAL MINE
M.Sc. Solak A.1, M.Sc. Kalay E. 1, Prof. Dr. Imrak E.2
Faculty of Mechanical Engineering – Yildiz Technical University, Turkey 1
Faculty of Mechanical Engineering – Istanbul Technical University, Turkey 1
Faculty of Mechanical Engineering – Istanbul Technical University, Turkey 2
[email protected], [email protected] , [email protected]
Abstract: At the present time, mines, power plants, ports are more complicated and more functional compared to the past therefore raw
material processing, production, and amount of transportation material have increased. In this paper it is calculated with using necessary
equations with standard charts that a stone cargo construction with 500 t/h in the line which is formed by two conveyors with 500 m straight
and 100 m which has 30o slope.
Keywords: BELT CONVEYOR, CONSTRUCTIVE DESIGN, TRANSPORTATION,
1. Introduction
Transportation means movement of people or goods from one
place to another with consuming minimum energy in shortest way.
Belt conveyors are a kind of transportation system that serves for
this purpose. Handling with natural conditions is another important
property of belt conveyors also. It can be settled down easily
through the mountains and over the rivers. While it is so difficult
carrying stuff in inclined places with truck or rig, easy with belt
conveyors at the same conditions.
Fig 1 Belt conveyor1
Beside carrying goods in shortest way, belt conveyors also save
up time, labor cost and economy. If tons of material will be
transported through complex ways, belt conveyors are an exact
solution cause of its continuity. In this paper it is aimed to calculate
the constructive properties of belt conveyor that has 500 m length
straight and 100 m that inclined 30. Weight of the parts, engine
power, friction forces and bent forces are some of the calculated
constructive properties of the conveyor. After specifying the
characteristics of the conveyor, the values of engine power and bent
forces are showed on the graphic according to the changing slope of
the belt conveyor first, and then same values are showed on the
other graphic according to the changing angle between tambours.
2. Inclined Belt Conveyor
At this section calculation will be done for only inclined part of
the belt conveyor. The length of the belt conveyor is 100 m and it
has 30o slope. Designing parameter could change according to the
heap material mostly cause of the pile angle. The heap material for
the conveyor is coal, so some properties of the coal are given in
Table 1.
Table 1: Some mechanical properties of coal2
Pile
mater.
Density
of coal
[t/m3]
Maximu
m slope
Pile
angle
Static
Slope
Resistance
Coefficient
Particle
Size
a [mm]
Coal 0,9 15 40 1,85 80
Transportation capacity of the belt conveyor is 500 tons per
hour and velocity is 1,75 meter per second and also specific weight
of the heap has given 0,9 t/m3. According to these values from
Table 2, bent width can be chosen 2 meters.
Table 2: Weight of the pile2 [daN/m]
Bent width
[mm]
Specific weight of the pile [t/m3]
0,45-1,20 1,2-2,00 2,00-3,00
1000 15,0 16,0 19,2
1400 22,5 25,5 29,2
1600 27,6 30,3 33,5
1800 30,0 35,0 38,0
2000 33,0 40,0 42,0
Belt conveyor can consist of two parts that are tail pulley and
carrying pulley. In order to increase stability tension pulley can be
added to the system. As it seen in the Fig. 2.1, the number of
tension pulley can be one or two. In this project two tension pulley
is used. The angle between tension pulley and ben gives as the
deflection angle that mentioned forward again to see the power
changing related to the this angle.
Fig 2 Belt conveyor with tension pulley1
Bent width is one of the major parameter at design step. The
other values are shaped according to bent width. The next step is
specifying the distance between tail pulley and carrying roller. After
deciding the bent width, the distance can be chosen from Table 3 as
1000 mm and 2500 mm corresponding to LT and LD.
Table 3: Distance between tail pulley and carrying roller2 Bent
width
[mm]
LT [mm]
Specific weight of the material [t/m3]
0,5 0,8 1,2 1,6 2,0
Tail
Pulley
LD
1000 1400 1400 1200 1000 1000 900 2700
1200 1200 1200 1000 1000 900 900 2700
1400 1200 1200 1000 1000 900 900 2700
1600 1200 1000 1000 900 900 900 2500
83

2000 1200 1000 1000 900 900 900 2500
Rough sketch is showed up after specifying the distance and
bent width of the conveyor. In order to calculate the power specific
weights are needed. Specific weight of the movable parts of the belt
conveyor can be calculated from the equation (2.1).
(2.1)
The values GT and GD are given in Table 4 and the value of GB
can be reached from Table 2.
Table 4: Tail pulley and dual group2
Bent
width B
[mm]
Pulley Dia
D [mm]
Triad
L GT
Dual Group
L GT
Tail Pulley
L GT
500 89 108
200 200
7,5 9,8
315 315
7,2 9,2
600 600
6,4 7,8
650 108
133
250
250
9,0
11,4
-
-
-
-
750
750
8,0
9,6
800 108 133
315 315
13,8 18,6
- -
- -
750 950
12,7 12,0
1000 133
133
315
380
18,6
21,6
-
-
-
-
950
1150
16,0
19,0
1200 133 465 25,4 - - 1400 23,0
1400 133 530 28,3 - - 1600 26,0
It has given the length of the inclined conveyor is 100 m. But in
calculation it is preferred to use the equivalent length rather than its
own length. Equivalent length can be find from the equation 2.2.
(2.2)
The main dimensional parameters are cleared until now. Next
step is determining the engine power. Engine power is total value of
the required power for horizontal transport, vertical transport,
without pile etc. First, required power for the transporting with no
pile will be calculated as is given in equation 2.3. The value of the
can be taken between 0,015 and 0,04, it is taken 0,03 for this
situation.
(2.3)
Required power to transport horizontally is as given below. The
point to be emphasized is that despite calculation are done for
horizontal transportation the length of the conveyor is still
equivalent length of the conveyor belt.
(2.4)
Required power to transport vertically is can be calculated with
the equation 2.5.
(2.5)
In calculation, flow rate has to be divided to the capacity
reducing factor as is shown in Table 5.
Table 5: Capacity reducing factor related to the slope2
Slope of the conveyor belt
φ
k
8o 0,96
12o 0,93
16o 0,87
20o 0,79
24o 0,71
26o 0,66
30o 0,56
Required power for dumper car can be identified by using Table
6 instead of calculating. As it seen below, it should be iterated to
determine the value. It has been chosen 9,41 horse power after
iterating.
Table 6: Power for dumper car2
Bent width
[mm]
800 1000 1200 1400 1600
Required
power [hp]
2,5 3,5 5,0 6,0 8,0
Total power is;
(2.6)
The value of P5 corresponds to acceleration power but it is
neglected generally and so, it has been neglected for this situation
also.
Engine power should be over the total power because of that
power loss occurs while transferring the engine power to the shaft
and also in order to ease first movement of the engine power should
be increased in proportion to between 1.1 and 1.4.
(2.7)
Table 7: The power of the engine2
Power [hp]
P1 10,92
P2 14,38
P3 165,34
P4 9,41
P5 -
Total power 200,6
Engine power 287,004
After determining the powers, friction forces of the tail pulley
and jockey pulley will be calculated. First, friction force of the tail
pulley is calculated as is given below.
(2.8)
84

We can choose µ1 as 0,0253 and then the tension pulley
(2.9)
After obtaining the friction force values of the tension pulley
and tail pulley the belt forces are can be calculated with the given
equations.
(2.10)
The deflection angle can be taken4 between 260-2700, in this
problem it has taken 2650 and the value of µ has taken as 0,3.
(2.11)
TE corresponds to the difference between T1 and T2. From equation
(2.12) tensed bent force can be found. The relationship between the
bent forces T1 and T2 can be found from equation (2.11).
(2.12)
Table 8: The bent forces
Bent Forces [daN]
T1 16390
T2 4090
3. Conclusion
The result of these calculated values are for only 30o which is
the slope of the bent conveyor. If we want to see the results for the
angles between 0o and 30o it can be shown graphically.
Fig 3 Force and power values related to the slope
The horizontal line on the axis shows the slope of the belt conveyor
and the vertical one is the the value of the forces and power of the
conveyor. First, it can be seen that increasing value of the slope
leads to the increasing power and the belt forces and also it can be
claimed that required power and the belt forces increasing
exponantially. In order to avoid high costs and catastrophic failures
the slope of the belt conveyor should be kept lower.
Fig 4 Force and power values related to the deflection angle
In figure 3.2 it is shown that the relationship between results and
deflection angle. As it is seen, deflection angle has no effect on the
power but the forces on the belt decrease. Increasing value of the
deflection angle has positive effect because stress value decreases
as the force decreases on the belt.
REFERENCES
[1] Gerdemeli, I. & Imrak C. E. & Kesikci M. K. (2005).
Continuous Transport Systems. (Lecture Book). Istanbul, Publisher
of Birsen.
[2] Lucas, J. D. (2008). Improving conveyor belt safety training
through the use of virtual reality. (Master Thesis). State University,
Virginia Polytechnic Institute, Virginia.
[3] Erkayaoglu, M. (2011). Life cycle assessment of off-highway
trucks and belt conveyors for sustainable mining. (Master Thesis).
Middle East Technical University, Institute of Science, Ankara.
[4] Solak, A. (2016). Belt conveyor design for coal minerals and
optimization of design parameters. (Master Thesis). Istanbul
Technical University, Institute of Science, Istanbul.
85

ВАКУУМНЫЕ ПОКРЫТИЯ ДЛЯ АЭРОКОСМИЧЕСКОЙ И АВИАЦИОННОЙ
ТЕХНИКИ
VACUUM COATINGS FOR AEROSPACE AND AVIATION TECHNICS
Канд.физ.-мат. наук Чекан Н.М.1, доц., док.техн.наук Овчинников Е.В.
2, канд.техн.наук Акула И.П.
1, доц.,
канд.техн.наук Эйсымонт Е.И.2,
Физико-технический институт НАН Беларуси1, Минск, Беларусь
Гродненский государственный университет им. Янки Купалы2-
Гродно, Беларусь,
E-mail: [email protected], [email protected]
Abstract The structure and properties of thin-film coatings formed on metal substrates are studied. The application of diamond-like coatings
(DLC) changes the adsorption activity of the surface layers of metal substrates, which in the future allows the formation of stable "sandwich"
coatings, regardless of the structures of the subsequent layers being formed. These coatings remain stable in the processes of interaction
with operating environments. The presence of low-dimensional phases in the substrate coating structure enhances the ordering effect of the
substrate on texturization in the surface layers of the coating. It is established that the number of crystalline formations with different
degrees of perfection formed on metal substrates depends on the formation conditions. Formation of composite coatings for DLC and
fluorine-containing compounds to reduce the friction coefficient in DLC-FСO-metal vapor, including under the influence of microwave
radiation. In the course of the conducted studies, the formation of composite coatings based on DLC and fluorine-containing oligomers with
increased tribotechnical characteristics was established.
KEYWORDS: oligomers, diamond-like coatings, structure, properties
1.Введение. Эффективно применение
плазмохимических покрытий при модифицировании
инструмента, изготавливаемого из твердых сплавов
методами порошковой металлургии, для создания
различного вида сложно-профильных конструкций для
авиационной и космической техники. В ряде случаев
данные вакуумные покрытия применяются в качестве
защитных и антифрикционных слоев летательных
аппаратов. Однако не всегда применение тонкослойных
вакуумных покрытий для изделий аэрокосмической
техники дает ожидаемый эксплуатационный и
экономический результат. В ряде случаев для
увеличения служебных характеристик изделий,
модифицированных вакуумными тонкослойными
покрытиями, используют дополнительно различного
типа энергетические воздействия (термообработку,
лазерное, гамма-излучение, высокотемпературную и
низкотемпературную плазму). Применение выше
перечисленных энергетических воздействий может
приводить в структуре плазмохимических покрытий к
формированию нанодисперсных структур. Таким
образом, вследствие развития нанотехнологий появились
возможности получения нанофаз в матрице самого
тонкослойного покрытия. Одними из перспективных
покрытий, содержащих в своей структуре нанофазные
объекты, являются алмазоподобные покрытия.
Применение нанотехнологий в области создания
тонкослойных антифрикционных покрытий позволило
получить покрытия с улучшенными физико-
механическими характеристиками (высокой твердостью,
химической стойкостью, низким коэффициентом трения,
высокой износостойкостью). Наличие вышеприведенных
физико-механических характеристик позволило
применять алмазоподобные покрытия для решения
следующих задач: создание сверхтвердых покрытий,
химической защиты деталей при работе в агрессивных
средах, повышение триботехнических характеристик
изделий [1-4]. Следует отметить, что в настоящее время
достаточно полно разработаны физико-химические
основы процессов формирования покрытий из
порошковых материалов, расплавов и растворов
полимеров; полимеризацией мономеров в газовой фазе.
Предложены высокоэффективные технологии
формирования покрытий различного назначения,
получена обширная информация о физико-химических и
механических свойствах тонкопленочных материалов, их
связи и зависимости от технологических режимов и
условий формирования. Основными особенностями
тонких покрытий являются их достаточно высокая
структурная неоднородность, зависимость свойств от
толщины слоя и природы материала подложки, на
поверхность которой они осаждаются. Под действием
поля твердой поверхности в слоях покрытий,
находящихся в контакте с подложкой (граничных слоях),
протекают специфические процессы структурной
перестройки, имеет место изменение подвижности
кинетических элементов атомов и молекул. Если
толщина покрытия соизмерима с толщиной граничного
слоя, то возникает ряд эффектов, обусловленных
термодинамической неустойчивостью пленочных
систем.
Проведенными ранее исследованиями показано,
что в алмазоподобных покрытиях (АПП) в зависимости
от режимов формирования наблюдается образование как
низкоразмерных образований, так и крупнодисперсных
кластерных структур, что в конечном счете сказывается
на физико-механических и прочностных
характеристиках. Так, в работах [1-8] показано, что
проведение термической обработки приводит к
существенным визуальным изменениям поверхности.
Алмазоподобная пленка, полученная электролитическим
способом и отожженная при 300 °С в вакууме меняет
цвет со светло-коричневого на темный, почти черный,
оставаясь при этом сплошной. Отжиг при 600 °С
приводит к более значительному потемнению пленки:
она становится черной, глянцево-блестящей. После
отжига при 900 °С пленка становится прозрачной.
Согласно данных работ [4-8], в ИК-спектре
алмазоподобных углеродных пленок, сформированных
электролитическим способом, наблюдаются две широкие
полосы поглощения в области 1580 см-1
и 1350 см-1
. При
проведении термообработки при 300 °С ИК-спектр
86

отожженного образца мало чем отличается от ИК-
спектра исходного покрытия. Увеличение температуры
до 600 °С также не приводит к существенным
структурным изменениям. Проведение термообработки
алмазоподобных покрытий при 393 К в течение одного
часа приводит к исчезновению полос в области
1100-1300 см-1
и образованию размытого пика,
находящегося в области 1000-1400 см-1
.
2.Результаты исследований. Исcледование покрытий сформированных
физическим (PVD) или химическим осаждением (CVD)
показали наличие столбчатой структуры в покрытии.
Данные покрытия обладают высокой коррозионной
стойкостью, в том числе при повышенных температурах.
Существенное влияние на физико-механические
свойства оказывает содержание азота в покрытии.
Низкое содержание азота в покрытии приводит к
формированию крупной столбчатой структуры, что
существенно снижает твердость покрытия и его
износостойкость. Считается оптимальным соотношения
циркония к углероду и азоту как 1,3:1. Твердость
покрытия достигает значений 28-32 ГПа. Данной
твердостью обладают покрытия на базе аллотропных
модификаций углерода.
Алмазоподобные покрытия обладают достаточно
высокими физико-механическими характеристиками,
низким коэффициентом трения и высокой
износостойкостью. Значения микротвердости
алмазоподобных покрытий находятся в пределах от 49-
62 ГПа, коэффициент трения в паре покрытие-сталь
находится в диапазоне от 0,06-0,11, что соответствует
жикостному диапазону режима трения. На данные
характеристики оказывает существенное влияние
содержание водорода. С увеличением концентрации
водорода физико-механические характеристики
алмазоподобных покрытий ухудшаются. Одним из
технологических приемов улучшающих свойства АПП
является формирование их в среде азота. Данные
покрытия являются новым классом алмазоподобных
соединений.
Для улучшения триботехнических и
антиадгезионных характеристик металлических,
керамических, полимерных материалов широко
применяются фторсодержащие соединения (ФСО). В
частности широко известен способ формирования
покрытий полимеров и олигомеров фторсодержащихь
соединений из растворов. В качестве растворителя
применяются хладосодержащиеся жидкости.
Согласно устоявшимся представлениям
поверхностный потенциал субстрата оказывает
существенное влияние на ориентацию молекул
фторсодержащих соединений. Одновременно с
ориентационными эффектами, в большинстве случаев на
металлических и металлосодержащих подложках,
происходит химическое взаимодействие олигомерных
поверхностно-активных фторсодержащих с
поверхностными активными центрами металла. Наличие
активных центров на поверхности металлических,
интерметаллических подложках показано в работе [9].
Для исследований структуры покрытий на базе
АПП, фторорганики применяли методы
рентгеноструктурного анализа, ИК-спектроскопии
НПВО; растровых, оптической и атомно-силовой
микроскопии. Поверхностную активность покрытий
изучали с помощью прямотеневого метода по величине
изменения краевого угла смачивания. Для определения
поверхностной энергии покрытий использовали
полярные и неполярные жидкости. Микротвердость
модифицированных АПП покрытий определяли на
микротвердометре ПМТ-3 при нагрузках от 10 до 150 г.
а б
в г
д е
ж з
а - 2D-изображение, б - 3D-изображение
Рисунок 1 – Морфология вакуумных алмазоподобных
покрытий, сформированных на стальной подложке и
подвергнутых воздействию СВЧ-излучения.
а,в,д,ж-2D-изображение; б,г,е,з-3D-изображение; а,б-
алмазоподобные покрытия толщиной ~ 1-1,5 мкм; в,г-
алмазоподобные покрытия толщиной ~ 0,2 мкм; д,е-
алмазоподобные покрытия толщиной ~ 1-1,5 мкм,
подвергнутые воздействию СВЧ-излучения в течение
120 с; ж,з- алмазоподобные покрытия толщиной ~ 0,2
мкм, подвергнутые воздействию СВЧ-излучения в
течение 120 с
87

а б
в г
Рисунок 2 – Морфология композиционных покрытий на
базе АПП, модифицированных фторсодержащими
олигомерами .
а,в-2D-изображение; б,г-3D-изображение; а,б-толщина
АПП ~0,2 мкм, покрытие предварительно
обрабатывалось СВЧ-излучением в течение 120 секунд;
в,г- толщина АПП ~1,5 мкм, покрытие предварительно
обрабатывалось СВЧ-излучением в течение 120 секунд.
Алмазоподобные покрытия после обработки СВЧ-
излучением трехкратно обрабатывались в растворе
фторсодержащего олигомера.
Морфология, шероховатость, волнистость
являются одними из основных параметров, которые
позволяют в дальнейшем спрогнозировать физико-
механические характеритики покрытий, в особенности
трибологические. Форму и размер образований в
покрытии условно можно классифицировать
следующим образом: отклонения первого рода –
макроотклоения, отклонения второго рода –
волнистость, отклонения третьего рода-шероховатость,
отклонения четвертого рода-микрошероховатость,
отклонения пятого рода- субмикрошерховатость,
отклонения шестого рода – наношероховатость.
Оценку параметров поверхности осуществляют
путем определения профиля, представляющим собой
сечение поверхности плоскостью, перпендикулярной к
этой поверхности и ориентированной в некотором
заданном направлении. Методом атомно-силовой
микроскопии определяют следующие характеристики
профиля: Ra- среднее арифметическое отклонение
профиля-среднее арифметическое абсолютных значений
отклонений профиля в пределах базовой длины:
𝑅𝑎 =1
𝑙 𝑦 𝑑𝑥 ≈
𝑦𝑖 𝑛1
𝑛
𝑙
0.
Rq-среднее квадратическое отклонение профиля – корень
квадратный из суммы квадратов расстояний точек
профиля средней линии.
𝑅𝑞 = 1
𝑙 𝑦𝑖
2𝑑𝑥 ≈ 𝑦𝑖
2𝑛𝑙
𝑛
𝑙
0.
Амплитуда (Rmaх) – наибольшая высота
неровностей профиля –расстояние между линией
выступов и линией впадин в пределах базовой длины.
В таблице приведены значения данных
параметров для многослойных покрытий на базе
алмазоподобых соединений. Данные покрытия
подвергались предварительной обработке СВЧ-
излучением, а также модифицировались
фторсодержащими соединениями.
Таблица1
Значения параметров профиля поверхности для
различных типов покрытий
Вид покрытия
Параметры профиля
поверхности
А, нм Ra,
нм
Rq,нм
АПП (толщина 1-1,5 мкм) 821 40,1 63,5
АПП (толщина 1-1,5 мкм),
модифицирована СВЧ-
излучением в течение 120 с
502 19,8 29,5
АПП (толщина 1-1,5 мкм),
модифицирована СВЧ-
излучением в течение 120 с + 3
слоя ФСО Ф1
604,9 22,6 36,3
АПП (толщина 0,2 мкм) 597 19,2 29,3
АПП (толщина 0,2 мкм),
модифицирована СВЧ-
излучением в течение 120 с
263,7 19,2 25
АПП (толщина 0,2 мкм),
модифицирована СВЧ-
излучением в течение 120 с + 3
слоя ФСО Ф1
223,6 16,1 21,2
Исходя из представленных в таблице 1 данных, видно,
что применение СВЧ-излучения при времени
воздействия свыше 120 с приводит к сглаживанию
исходного рельефа. Данный эффект характерен для
алмазоподобных соединений. Формирование
фторсодержащих покрытий на поверхности
алмазоподобных покрытий приводит к дальнейшему
сглаживанию исходного рельефа. Для алмазоподобных
покрытий толщиной 1 - 1,5 мкм, подвергнутых
воздействию СВЧ-излучения при последующем
формировании фторорганических покрытий
наблюдается формирование глобулярных объектов
латеральным размером до 1,5 - 2 мкм. Данный факт
может свидетельствовать о преварительной активации
поверхности АПП СВЧ-излучением. В результате этого
на поверхности покрытия возникают активные центры,
которые оказывают превалирующее влияние на
процессы кристаллобразования в покрытиях
фторсодержащих соединений. Аналогичные процессы
происходят для покрытий АПП толщиной 0,2 мкм.
Одним из параметров, характерезующим
распределение материала для всей исследуемой
поверхности является опорная кривая. Опорная кривая
поверхности определяет распределение материалов по
высоте шероховатого слое. Данная кривая
характеризуется тремя участкам: I - соответствует
ределению материала вдоль распределению материала в
области линии выступов; II - соответствует
распределению материала в области средней линии; III –
соответствует распределению материала в области линии
впадин. Исходя из полученных данных следует, что в
зависимости от вида технологической обработки
88

(воздействие сверхвысоким частотным излучением,
формированием покрытий по растворной технологии)
распределение материала в приповерхностном слое
будет различа.
Формирование покрытий фторсодержащих
соединений на подложках алмазоподобного соединения,
модифицированного СВЧ-излучением приводит к
увеличению количества материала в I и III участках.
Распределние материала для алмазоподобных покрытий
толщиной 0,2 мкм аналогично, как и для первых двух
случаев. Воздействие СВЧ-излучения приводит к
уменьшению количества материала в I участке,
увеличению количества материала во II и III участках.
Представляет интерес провести фрактальный
анализ получаемых многослойных покрытий. Согласно
существующих представлений, фрактальный анализ
может на качественном и количественном уровне
определить изменения морфологии поверхностных
слоев материала, изменяющихся в процессе
формирования и при воздействии различных внешних
факторов. Применение методов сканирующей зондовой
микроскопии в сочетании с фрактальным анализом
может дать дополнительную информацию для оценки
топографии тонких многослойных покрытий, а также
является оптимальным методом контроля состояния их
на нано- и микроуровне. В ходе проведенных
исследований показана зависимость фрактальной
размерности от видов технологической обработки
вакуумных покрытий (таблица 2).
Таблица 2
Значения фрактальной размерности для
вакуумных покрытий, модифицированных СВЧ-
излучением
Вид
покрытия
АПП
(толщина
1-1,5
мкм)
АПП+СВЧ АПП+СВЧ+ФСО
Значения
фрактальной
размерности
2,35 2,34 2,34
Вид
покрытия
АПП
(толщина
0,2 мкм)
АПП+СВЧ АПП+СВЧ+ФСО
Значения
фрактальной
размерности
2,35 2,36 2.36
Установлен эффект увеличения физико-
механических характеристик алмазоподобных покрытий,
модифицированных СВЧ-излучением. Данный эффект
объясняется с точки зрения структурной
морфологической трансформации поверхностных слоев
АПП под воздействием СВЧ-излучения. Данный процесс
сопровождается увеличением поверхностной энергии,
что затрудняет выход на поверхность точечных и
линейных дефектов и, в конечном счете, увеличивает
физико-механические характеристики.
Возрастание значений поверхностной энергии
граничных слоев АПП на разделе фаз «газ-твердое тело»
также может свидетельствовать об увеличении
адгезионного взаимодействия на границе раздела
«покрытие-подложка» [1-8]. Воздействие энергетических
факторов вызывает изменение структуры
фторсодержащих олигомеров и морфологии пленок,
нанесенных на подложки различного состава [1-9].
Небольшие дозы СВЧ-излучения приводят к
процессам структурирования и упорядочения во
фторсодержащих покрытиях. В результате в тонких
олигомерных пленках появляются чешуйчатые
образования со сравнительно глубоким рельефом.
Увеличение дозы приводит к существенным
морфологическим изменениям покрытий. Обнаруженные
изменения строения морфологии покрытий характерны
для всех исследованных подложек, сформированных на
металлах, что свидетельствует о преимущественном
влиянии СВЧ-излучения на процессы
перекристаллизации.
Формирование композиционных покрытий
приводит к снижению коэффициента трения пары
“АПП+ФСО-ШХ15”, в том числе и при воздействии
СВЧ-излучения. В ходе проведенных исследований
установлено формирование композиционных покрытий
на базе АПП и фторсодержащих олигомеров с
повышенными триботехническими характеристиками.
Заключение.
Исследованы структура и свойства
тонкопленочных покрытий, сформированных на
металлических подложках. Нанесение алмазоподобных
покрытий изменяет адсорбционную активность
поверхностных слоев металлических подложек, что
позволяет в последующем сформировать устойчивые
«sandwich»-покрытия не зависимо от структур
последующих формируемых слоев. Данные покрытия
остаются устойчивыми в процессах взаимодействия с
эксплуатационными средами. Наличие низкоразмерных
фаз в структуре покрытия подложки усиливает
упорядочивающее действие субстрата на
текстурированность в поверхностных слоях покрытия.
Установлено, что количество кристаллических
образований с различной степенью совершенства,
образованных на металлических подложках, зависит от
условий формирования. Формирование
композиционных покрытий АПП и фторсодержащих
соединений к снижению коэффициента трения в парах
АПП-ФСО - металл, в том числе и при воздействии СВЧ-
излучения. В ходе проведенных исследований
установлено формирование композиционных покрытий
на базе АПП и фторсодержащих олигомеров с
повышенными триботехническими характеристиками.
Список литературы: 1. Шевченко, С.В.
Наноструктурные состояния в металлах, сплавах и
интерметаллических соединениях: методы получения,
структура, свойства / С.В. Шевченко, Н.Н. Стеценко //
Успехи физики металлов. - 2004. - Т.4. - С. 219-254.2.
Структурно-морфологические трансформации
алмазоподобных покрытий, подвергнутых
энергетическому воздействию / Е.В. Овчинников [и др.]
// Поверхность. Рентгеновские, синхротронные и
нейтронные исследования. - 2014. - 9. - С. 58-65. 3.
Прогрессивные технологии нанесения покрытий / С.В.
Авдейчик [и др.]; под ред. А.В. Киричека. – Москва: Изд.
дом «Спектр», 2012. – 272 с. 4.Структурно-
морфологические особенности алмазоподобных
покрытий, модифицированных СВЧ-излучением / Е.В.
Овчинников [и др.] // Прогрессивные технологии и
89

системы машиностроения: Международный сборник
научных трудов / ДонНТУ. - Донецк, 2011. – Выпуск 42.
– С. 230-238. 5.Овчинников, Е.В. СВЧ-модифицирование
алмазоподобных покрытий / Е.В. Овчинников, Е.И.
Эйсымонт, Н.М. Чекан // Горная механика и
машиностроение. – 2011. - 3. - С. 84-93. 6.Морфология
алмазоподобных покрытий / А.Р. Радион [и др.]//
Наноструктурные материалы-2008: Беларусь-Россия-
Украина: материалы Первой международной научной
конференции, Минск, 22-25 апр. 2008г. / НПЦ НАН
Беларуси по материаловедению; редкол.: П.А. Витязь [и
др.]. – Минск, 2008. – с.438-439. 7.Смит, А. Прикладная
ИК-спектроскопия / А. Смит – М.: Мир, 1965. – 328с.
8.Влияние активации газовой среды на осаждение
алмазоподобных пленок / Д. В. Федосеев [и др.] // ДАН. -
1995. – 4. – С. 498–500. 9. Лиопо, В.А. Физические
основы возникновения активных зарядовых центров на
наночастицах металлов и диэлектриков / В.А. Лиопо,
В.А. Струк, Е.В. Овчинников // Веснік ГрДУ, сер. 6. –
2013. – 2 (154). – С. 12-23
90

МЕТОД ЗА ОРАЗМЕРЯВАНЕ И ИЗБОР НА ЕЛАСТИЧЕН СЪЕДИНИТЕЛ
METHOD FOR DIMENSIONNING AND CHOICE OF THE ELASTIC COUPLING
МЕТОД ДЛЯ ВЫЧИСЛЕНИЯ И ВЫБОР ЭЛАСТИЧНЫХ СОЕДИНИТЕЛЕЙ
Assoc. Prof. M.Sc. Pandev G. PhD.,
Faculty of Applied Mechanics – University of Chemical Technology and Metallurgy,
Sofia, Republic Bulgaria
Abstract: Couplings /couplers/ are drive elements that serve to create an immediate kinematic and power connection between the
different parts of a machine. They also perform a number of other important functions. In modern machine-building, there have been used a
large number of coupling, which differ in their operation, management, design and construction. Some of the most commonly used couplings
are the elastic ones. The preliminary analyzes of the literary sources indicate that the most important parameter for dimensioning of an
elastic coupling is the nominal torque. At the same time, it turned out that the problem of a reasonable choice of this type of coupling has not
been stidied, depending on the influence of the various factors on the nominal transmitted torque, as well as the influence of the operating
conditions. The purpose of the proposed article is to examine the factors that have the greatest impact on transmission nominal torque by an
elastic coupling, and on this basis to create a methodology for dimensionning, and selecting the appropriate coupling, also reporting the
relevant conditions under which it will work. Dependencies have been developed to calculate the nominal torque, according to the nominal
transmit power and the number of turnovers, by using coefficients to account for the operating conditions: type of propulsion and the
machine being driven, number of starts, duration of operation per day, etc. On the basis of these calculations it can be made a reasonable
choice of a suitable elastic coupling.
Keywords: METHOD, DIMENSIONNING, CHOICE, COUPLING ELASIC,
1. Въведение
Съединителите са елементи на задвижването, които служат
за създаване на непосредствена кинематична и силова връзка
между отделните части на една машина – например между
задвижващия агрегат (двигателя) и работната й част.
Основното им предназначение е да предават въртящ момент
при определена ъглова скорост от един вал на друг [1,3].
Освен за създаването на кинематична и силова връзка
между отделните части на машината съединителите изпълняват
и редица други важни функции, а именно :
компенсиране на вредното влияние на несъосността
на съединяваните валове, породена от неточно изработване,
сглобяване и други причини ;
гасене на възникналите при работа вибрации и удари ;
предпазване на елементите на задвижването от
разрушаване при претоварване ;
бързо свързване и разделяне на съединяваните
елементи ;
ограничаване на ъгловата скорост и други.
В съвременното машиностроене се използват голям брой
съединители, които се различават помежду си по принципа на
действието, управлението, предназначението и конструкцията
си. Според принципа на действието си съединителите могат да
се класифицират на механични, електрически и хидравлични.
Механичните съединители от своя страна се делят на
следните три основни групи :
1. Неуправляеми (с постоянно действие) – неподвижни
съединители; твърди компенсиращи съединители; еластични
съединители.
2. Управляеми съединители – включващи (изключващи)
съединители; триещи съединители.
3. Самоуправляеми (автоматични) съединители –
центробежни; предпазни и съединители със свободен
ход.
Еластичните съединители са едни от най-често
използваните и служат за свързване на валовете по такъв
начин, че при пренасяне на въртящ момент двата вала се
завъртат на значително по-голям ъгъл, отколкото ако връзката
между тях се осъществява твърдо.
Еластичните съединители, освен посочените по-горе важни
функции, притежават и някои специфични особености в
сравнение с останалите конструкции съединители :
абсорбират неравномерностите на въртящия момент
по време на работа ;
предотвратяват деформации в шасито на двигателя
или работната машина ;
поемат възникващите паразитни напрежения ;
конструират се по-лесно, с по-големи допуски, което
ги прави по-икономични ;
по-тихи са при работа, без хлабини, без триене между
отделните им части, не изискват гресиране или друга
периодична техническа поддръжка.
Всеки еластичен съединител, независимо от
конструктивните си особености, се състои от следните
задължителни елементи : водеща част, водима част и
еластичен елемент, поставен между водещата и водимата част
(Фиг. 1). Еластичният елемент осигурява основните свойства
на съединителя.
Фиг. 1. Принципна конструкция на еластичен съединител
В зависимост от вложените материали еластичните
съединители се разделят на такива с метални еластични
елементи и с неметални еластични елементи.
91

А според преобладаващото напрежение в еластичния
елемент при работа на съединителя те се подразделят на :
с елементи, подложени на натиск (опън) ;
с елементи, подложени на огъване ;
с елементи, подложени на усукване ;
с елементи, подложени предимно на срязване.
От направеното проучване в специализираната литература
[1,3,4] се установи, че въпреки доказаните предимства на
еластичните съединители и все по-широкото им използване в
съвременната машиностроителна практика, липсва методика за
оразмеряването им и съответно избор на подходящ тип такъв
съединител. Предварителните анализи на литературните
източници показват, че най-важният параметър за
оразмеряване на еластичен съединител е номиналният въртящ
момент. В същото време се оказа, че не е изследван проблемът
за обоснован избор на такъв тип съединител в зависимост от
влиянието на различните фактори върху номиналния предаван
въртящ момент, както и влиянието на условията на работа.
Целта на предлаганата статия е да се изследват факторите,
които оказват най-голямо влияние върху предавания
номинален въртящ момент от еластичен съединител и на тази
основа да се създаде методика за оразмеряването му и избор на
подходящ съединител с отчитане и на съответните условия,
при които ще работи.
2. Методика за оразмеряване на еластичен
съединител
2.1. Номинален въртящ момент
Номиналният въртящ момент е основният фактор за
оразмеряване на еластичния съединител, свързващ валовете на
двигателя и работната машина.
Номиналният въртящ момент Мвн зависи от номиналната
предавана мощност Рн и от честотата на въртене n :
(1) Мвн = 973,5 . Р/n , daN.m
където Р - kW, n – min-1,
или
(2) Мвн = 716 . Р/n , daN.m
където Р – к.с., n – min-1.
Производителите на еластични съединители [2]
препоръчват предаваната номинална мощност да е между 1 kW
и малко над 2000 kW.
Честотата на въртене n е тази на задвижващия агрегат и тя
трябва да бъде по-ниска от максимално допустимата честота на
въртене на еластичния съединител. Обикновено произвеждани-
те еластични съединители са със сравнително висока
допустима честота на въртене – около 10 000 min-1 [2].
2.2. Коефициент на сигурност
При определяне на номиналния въртящ момент Мвн трябва
да се вземат под внимание и следните фактори :
Неравномерност на въртящия момент в зависимост от
типа на задвижващия агрегат и работната машина. Количестве-
но тази неравномерност се определя с коефициента К1;
Честотата на стартиранията – коефициент К2;
Работа в часове на ден – коефициент К3.
Произведението от тези три коефициента представлява
коефициентът на сигурност К
(3) К = К1 . К2 . К3
С коефициента на сигурност може да се определи
коригираният номинален въртящ момент Мквн, който ще
отчита посочените по-горе фактори
(4) Мквн = Мвн . К
В специализираната литература са посочени стойностите на
трите коефициента К1, К2 и К3 за различни случаи [2,4]. Част от
тези данни са показани в табличен вид по-долу.
Таблица 1. Стойности на коефициента К1 в зависимост от вида на
задвижващия агрегат и работната машина
Вид на задвижващия агрегат Характеристика
на работната
машина
Електро-
двигател
ДВГ с 4 до 6
цилиндъра
ДВГ с 1 до 3
цилиндъра
1
1,2
1,4
1. Равномерен ход,
много малка инерционност
1,2
1,4
1,7
2. Равномерен ход,
малка инерционност
1,7
2
2,4
3. Цикличен
неравномерен ход, средна
инерционност
2
2,4
2,8
4. Неравномерен
ход, голяма инерционност
2,4
2,8
3,3
5. Неравномерен
ход, много голяма инерционност
Таблица 2. Стойности на коефициента К2 в зависимост от
работната машина и броя стартирания на час
Работна
машина
(от Таблица 1)
Брой стартирания на час
1 10 30 60 120
1. 1 1,2 1,3 1,5 1,6
2. и 3. 1 1,1 1,2 1,3 1,4
4. и 5. 1 1,05 1,1 1,2 1,2
Таблица 3. Стойности на коефициента К3 в зависимост от
натоварването на машината на ден
Работа на ден,ч 0 - 2 2 - 8 8 - 16 16 - 24
Коефициент К3 0,9 1 1,1 1,2
2.3. Коравина на еластичен съединител
Еластичните съединители, в зависимост от своя вид,
структура и оразмеряване, притежават способността да поемат
следните четири вида деформации – аксиални, радиални,
конични и на усукване. За всяка от тях може да се изчисли
съответната коравина, която обуславя реакциите на
съединителя, когато е подложен на различни възможни
деформации.
Коравина при работа на усукване (Фиг. 2.)
(5) Кθ = Мθ/θ
Фиг. 2. Еластичен съединител, работещ на усукване
92

Коравина в радиално направление (Фиг. 3.)
(6) Ку = Fу/у
Фиг. 3. Еластичен съединител с радиално изместване
Коравина при аксиално изместване (Фиг. 4.)
(7) Кх = Fх/х
Фиг. 4. Еластичен съединител с аксиално изместване
Коравина при конично изместване (Фиг. 5.)
(8) Кα = Мα/α
Фиг. 5. Еластичен съединител с конично изместване
Еластичните съединители понасят добре грешките от
несъосност между водещата и водимата част. Това от своя
страна не изисква висока прецизност при сглобяването им в
сравнение с неподвижните и твърди съединители.
2.4. Влияние на температурата и външните
въздействия
В повечето случаи материалът на еластичния елемент на
съединителя е неметален, най-често изработен от специална
каучукова смес. Тя може да работи при температура до около
70°С без да се влошат еластичните й качества. Някои
каучукови смеси осигуряват работа на еластичния съединител
при агресивни външни въздействия – например на киселини и
основи или в атмосфера, наситена с изпарения на хлор и други
газове.
2.5. Избор на еластичен съединител
При избор на еластичен съединител трябва да се вземат
предвид следните фактори :
размерите (диаметър и дължина) на валовете, върху които
ще се монтират водещата и водимата част на еластичния
съединител;
разполагаемото място (като диаметър и дължина) между
задвижващия агрегат и работната машина;
точните стойности и вида на изместването, което позволява
определяне на коравината, както и допустимата несъосност.
2.6. Пример за оразмеряване и избор на еластичен
съединител
В примера се разглежда оразмеряването и избора на
еластичен съединител за задвижване на компресор с помощта
на електродвигател.
Данни за задвижващия агрегат :
Стандартен електродвигател
Мощност : Р = 30 kW
Честота на въртене : 1500 min-1
Размери на вала : диаметър Ø55 mm, дължина 110 mm.
Данни за работната машина :
Компресор за въздух с 2 цилиндъра
Брой стартирания на час : по-малко от 1
Работа на ден : 8 часа
Размери на вала : диаметър Ø60 mm, дължина 110 mm.
Номиналният въртящ момент Мвн, определен по формула
(1) ще бъде
Мвн = 973,5 . 30/1500 = 195 N.m
За намиране на коефициента на сигурност К от Таблици 1,
2 и 3 се определят стойностите на коефициентите К1 = 1,7,
К2 = 1 и К3 = 1. От умножението им се получава К = 1,7.
Тогава коригираният номинален въртящ момент Мквн ще
бъде
Мквн = 195 . 1,7 = 330 N.m
По тази стойност може да се подбере подходящ еластичен
съединител от каталога на фирмата PAULSTRA (Таблица 4) – този
с референтен номер 632031. Тъй като работната машина предполага циклично
неравномерен ход по време на работа за неговото абсорбиране
е необходимо съединителят да притежава висока еластичност
на усукване.
На Фигура 6 е показана конструкцията на еластичен
съединител и размерните му характеристики.
93

Изводи
1. Анализирана е конструкцията на еластичните
съединители и са уточнени техните предимства. В зависимост
от вида на преобладаващите напрежения, възникващи по време
на работа, е направена класификация на еластичните
съединители.
2. Разработена е методика за оразмеряване на еластичен
съединител, която включва като основен параметър предавания
номинален въртящ момент, който зависи от предаваната
мощност и честотата на въртене на задвижващия агрегат. В
методиката чрез коефициент на сигурност се взема предвид и
влиянието на други фактори – неравномерност на въртящия
момент, честота на стартиранията и работа на ден в часове.
Посочени са конкретни стойности. Показани са зависимости за
определяне на коравината на еластичен съединител в
зависимост от четири вида възможни деформации.
3. Представени са факторите, въз основа на които трябва
да се прави обоснован избор на съответен вид и размер
еластичен съединител.
4. С помощта на разработената методика е решен
конкретен пример за оразмеряване на еластичен съединител и е
направен избор на подходяща за случая конструкция от
продуктов каталог на фирма-производител.
Литература
1. АРНАУДОВ К., И.Димитров, П.Йорданов, Л.Лефтеров. Машинни елементи. Техника, София, 1980.
2. ПРОСПЕКТ на фирмата PAULSTRA, 2014 г.
3. CHEVALIER A. Guide du dessinateur industriel. Edition HACHETTE Technique, 2004.
4. CORBET J.-Cl., A. Ducruet, L. Huchet. Le CoDoTec. 1996.
.
Таблица 4. Избор на еластичен съединител [2]
Фиг. 6. Конструктивно изпълнение и размерни характеристики на еластичен съединител [2]
94

EXPERIMENTAL SIMULATION OF COMMON RAIL ELECTROMAGNETIC
INJECTORS WEARING
ЕКСПЕРИМЕНТАЛНО СИМУЛИРАНЕ НА ИЗНОСВАНЕ ПРИ ЕЛЕКТРОХИДРАВЛИЧНИ ДЮЗИ
ОТ СИСТЕМАТА COMMON RAIL
Dipl. eng. Yordanov N., Assoc. Prof. Kiril Hadjiev, PhD ,Assoc. Prof. Emiliyan Stankov, PhD
University of Ruse, Facilty of Transport, Department of Engines & Automotive Engineering, Ruse, Bulgaria
e-mail: [email protected], [email protected], [email protected]
Abstract: At the time of exploitation, the geometrical position of the control valve changes as a result of wearing, which leads to a change of residual
electromagnetic gap stroke and force of control valve spring. The following study measures the hydraulic characteristic changes, based only
on common rail injector increased stroke of control valve and residual electromagnetic gap. The results show that the increasing of control
valve stroke and residual electromagnetic gap increase the fuel flow rate and return fuel flow. Increased fuel flow rate and return fuel flow
are presented with short injector signal time and lower levels of working pressure. The increasing is lower with longer injector signal time
and high level of working pressure. The follow-up results are practically significant by common rail electromagnetic injector diagnosing and
repairing.
KEY WORDS: SIMULATION, VALVE SEAT, WEARING, RESIDUAL ELECTROMAGNETIC GAP, HYDRAULIC
CHARACTERISTICS
1. Introduction
Volumetric capacity of injection with electronic control
depends on fuel pressure in the fuel accumulator and the duration of
signal, energizing the electromagnetic coil of electromagnetic valve.
The use of hydromechanics injector with electromagnetic control
allows changing the start of injection and fuel flow rate of injection
process.
Electromagnetic injectors used in first generation Bosch
system, use fast switching electromagnetic ball control valve,
controlling the fuel pressure of injector control piston chamber.
The movement speed of injector nozzle needle depends on the
speed of pressure alteration in control piston chamber.
The dropping speed of control piston chamber pressure is a
function of closing throttle cross section and control valve stroke.
In the process of continuous exploitation, the control valve
stroke increases as a result of the impact load on the valve seat [1].
Passing through the control valve, fuel causes further erosion
of the sealing surfaces of the saddle and the ball valve.
In the present study, the change in the hydraulic characteristic
of the nozzle is taken into account only as a result of the increased
control valve stroke and residual electromagnetic gap [7].
As a result of the change in the rate of these main control
valve parameters, the fuel flow rate of both, the injected fuel and the
fuel required to control the hydro-mechanical part of the injector is
changed.
2. Discussion and results
With control valve stroke increasing, as a result of wearing,
control valve goes down in the sealing surfaces of the saddle.
This alteration of control valve geometrical position leads to
alteration in residual electromagnetic gap and the pressure force of
control valve spring fig. 1.
fig. 1 Solenoid valve Bosch CRI1
1 - Ball valve washer, 2 - Electromagnetic gap washer, hreg -
Electromagnetic gap, hv - Ball valve stroke.
Fuel flow rate, injected by electrohydraulic injector, depends
not only on fuel pressure and signal duration, but also on
geometrical position of elements.
By manufacturing of injector elements, the actual geometrical
size differs from the specific size to the limit values.
There are differences in the geometrical position between its
elements also as a result of assembling technologies including the
tightening torque of the threaded connection.
These differences lead to alterations in registered fuel flow
rates of injectors with constant fuel pressure and signal duration.
In order to maintain constant values of fuel flow rate of
electronically managed electromagnetic hydromechanical injector it
is necessary not only high precision of elements manufacturing, but
also high accuracy of regulation parameters measuring.
95

In the experimental simulation of wearing influence of control
valve are used calibrated regulating shims, that set control valve
stroke hv and residual electromagnetic gap hreg.
Four experimental series were undertaken, first of which with
a specific value according to the technical manual for the certain
injector model.
An increase of the stroke h - 0.05 ÷ 0.08 ± 0.003 mm of the
ball valve and the corresponding change of the residual
electromagnetic gap was simulated due to the change of the
geometric position of the elements in the baseline dimension.
The research was conducted in a laboratory at the Department
of Engines & Automotive Engineering at the Faculty of Transport
of the University of Ruse "Angel Kanchev".
A modified "Star 8" test bench was used, refitted with more
powerfull motor and variable-frequency drive of the AC motor.
A high pressure pump, a common rail with pressure sensor
and pressure regulator, fuel temperature controllers, injector
controller were added. A two-channel oscilloscope for the injector
control was used.
The testing of the hydraulic characteristics of the injector was
carried out using fuel pressures throughout the system operating
range of 30, 50, 80, 100 and 135 MPa and a duration of the control
signals 150, 200, 250, 300, 400, 500, 600, 700 and 800 μS.
Graphics with results at typical manufacturing test pressures
are presented, in which the injectors are functionally tested.
The temperature mode of the fuel in the test bench tank is
maintained by a pipe cooler and the drive shaft rotation speed is
maintained constant when performing all the tests.
Fig. 2 Alteration of the fuel flow rate, defined by the stroke of the
control ball valve hv = 0.05 ÷ 0.08 mm at 30 MPa
The value of the fuel flow rate as a function of the control signal
duration fig 2 at the various levels of wearing of the ball valve hv
and the corresponding variation of the residual electromagnetic gap
hreg.
Fig. 3 Alteration of the return fuel flow rate, defined by the stroke
of the control ball valve hv = 0.05 ÷ 0.08 mm at 30 MPa
With an increase in wear, a corresponding increase in the
fuel flow rate in each mode is observed. It is noteworthy that the
greatest increase observed is the percentage of the short injections
time that correspond to the preinjections.
Fig. 4 Alteration of the fuel flow rate at 150 µS, defined by the
stroke of the control ball valve hv = 0.05 ÷ 0.08 mm
Fig . 5 Alteration of the fuel flow rate at 200 µS, defined by the
stroke of the control ball valve hv = 0.05 ÷ 0.08 mm
96

Fig. 6 Alteration of the fuel flow rate, defined by the stroke of the
control ball valve hv = 0.05 ÷ 0.08 mm at 80 MPa
Fig. 7 Alteration of the return fuel flow rate, defined by the stroke
of the control ball valve hv = 0.05 ÷ 0.08 mm at 80 MPa
Fig. 8 Alteration of the fuel flow rate, defined by the stroke of the
control ball valve hv = 0.05 ÷ 0.08 mm at 135 MPa
Fig. 9 Alteration of the fuel flow rate, in range of preinjection time,
defined by the signal duration at 30 MPa
Fig. 10 Alteration of the fuel flow rate, defined by the signal duration t = 150 ÷ 800 µS at 30 MPa
Fig. 11 Alteration of the return fuel flow rate, defined by the signal duration t = 150 ÷ 800 µS at 30 MPa
97

Фиг. 12 Alteration of the fuel flow rate, defined by the signal duration t = 150 ÷ 800 µS at 135 MPa
Fig. 13 Trend of fuel flow rate in percent (%), depending of control
valve stroke
Fig. 14 Trend of return fuel flow rate in percent (%), depending of
control valve stroke
3. Conclusions Concerning the experiment, the following can be stated:
1. The study shows an increase in the fuel flow rate in all
levels of simulated wearing.
2. With short duration of signals, corresponding to the
preinjection rate, the percentage increase of the hydraulic
characteristic is significant, and at 150 μS the fuel flow
rate increase reaches 700%. With an increase in working
pressure to 135 MPa this is up to 220%.
3. With the increase of the control signal duration, the trend
of increasing in the percentage ratio decreases, having an
increase of only 110% with 800 µS. With an increase in
the working pressure to the maximum value for this
system, 135 MPa, at the same signal duration, the impact
of wearing on the fuel rate decreases to 107%.
4. Concerning the fuel flow rate, the increase in function of
the signal duration at 150 μS is 133% and at 800 µS is
112%. As a function of the wearing, pressure at 30 MPa,
the control portion increased to 117%, while at 135 MPa
the increase was 124%.
5. With the return fuel rate as a function of the pressure, the
alteration rate due to wear at 30 MPa increases to 117%,
while at 135 MPa the increase is 124%.
6. By increasing fuel pressure the trend shows reduction of
the impact of wear on the fuel rate, whereas for the return
fuel rate this trend is reversed.
4. References
[1] Трифон Узунтонев, Сергей Киров, Сергей Белчев,
Изменения в хидравличните характеристики на дюзите и
якостните
качества на разпръсквачи от горивна уредба Common Rail при
продължителна експлоатация, Научни трудове на Русенския
университет - 2013, том 52, серия 4
[2] Белчев С., Узунтонев Тр. „Диагностични параметри за
оценка състоянието на електромагнитни дюзи от системата
Common Rail”, Научни трудове на РУ „Ангел Кънчев” 2007,
Сборник доклади стр. 204 - 208, ISSN 1311-3321
[3] Трифон Узунтонев, Горивни уредби на дизелови двигатели,
Варна 2015
[4] Л.Илиев, В.Костов, Д.Пилев, Горивни уредби и
автоматично регулиране на двигатели с вътрешно горене,
Държавно издателство „Техника“ 1985
[5] Атанас Митков, Теория на експеримента, „Дунав прес“ Русе
2011
[6] Атанас Митков, Теория на експеримента, Русе 2010
[7] Сергей Белчев, Трифон Узунтонев „Исследование влияния
конструктивных параметров на работу электромагнитной
форсунки Common Rail”, XII Международная научно-
практическая конференция фундаментальные и прикладные
проблемы совершенствования поршневых двигателей,
Владимир 29-30 юни 2010 год.,
Dipl. eng. Yordanov N., Assoc. Prof. Kiril Hadjiev, PhD
,Assoc. Prof. Emiliyan Stankov, PhD
University of Ruse, Facilty of Transport, Department of Engines &
Automotive Engineering, Ruse, Bulgaria
The report has been reviewed.
98