injectivity of carbon dioxide in the st. lawrence platform, quebec (canada): a sensitivity study
TRANSCRIPT
516 © 2013 Society of Chemical Industry and John Wiley & Sons, Ltd | Greenhouse Gas Sci Technol. 3:516–540 (2013); DOI: 10.1002/ghg
Correspondence to: T. D. Tran Ngoc, Institut national de la recherche scientifi que, Centre Eau Terre Environnement (INRS-ETE), 490 rue de la
Couronne, Québec, QC, G1K 9A9, Canada. E-mail: [email protected] ([email protected])
Received April 19, 2013; revised September 27, 2013; accepted October 3, 2013
Published online at Wiley Online Library (wileyonlinelibrary.com). DOI: 10.1002/ghg.1387
Modeling and Analysis
Injectivity of carbon dioxide in the St. Lawrence Platform, Quebec (Canada): A sensitivity studyT. D. Tran Ngoc,* Institut national de la recherche scientifi que, Centre Eau Terre Environnement (INRS-ETE), Québec, CanadaChristine Doughty, Lawrence Berkeley National Laboratory (LBNL), Berkeley, CA, USA René Lefebvre and Michel Malo, Institut national de la recherche scientifi que, Centre Eau Terre Environnement (INRS-ETE), Québec, Canada
Abstract: Injectivity of CO2 in the Bécancour deep saline aquifers, St. Lawrence Platform (Québec), was investigated using 2D radial numerical simulations with TOUGH2/ECO2N. In order to have an appropri-ate choice for the CO2 injection rate and the duration of injection, sensitivity analyses were carried out, considering different values of hydrodynamic, chemical-petrophysical, and geometric parameters affecting CO2 injection in a brine reservoir. The parameterization analysis for capillary pressure and relative permeability models indicated large uncertainty for this case study. Simulations took into ac-count Bécancour reservoir conditions in which the maximum pressure was limited to the fracturing pressure. The sensitivity analysis provides guidance on potential injection scenarios. To remain below fracturing pressure, intermittent 5-year injection periods can be used, with a mass injection rate up to ~ 20 kg/s, alternating with half-year periods without injection. This scenario could give maximum CO2 storage in the aquifer. CO2 storage capacities in different phases were calculated versus time. This study shows that the northeastern reservoir block of the Bécancour area could host about 10 Mt CO2, which represents 15% to 50% of regional yearly CO2 emissions during about 60 and 20 years for the case of the injection formation permeability of 0.89 × 10⁻¹⁵ m2 and 4.17 × 10⁻¹⁵ m2, respectively. Finally, this modeling study will also be the basis for the design of a pilot CO2 injection test at the study site. © 2013 Society of Chemical Industry and John Wiley & Sons, Ltd
Keywords: Bécancour; CO2 geologic sequestration; numerical modeling; injectivity; deep saline aquifer; sensitivity analysis; storage capacity
Introduction
Scientists have recently discussed whether the United Nation (UN) target for limiting global mean temperature to 2 °C above pre-industrial
background levels (~ 13.5 °C in ~ 1850) can still be
met or has been passed.1–4 It can be said that a global environmental ‘cliff ’ faces us in the twenty-fi rst century. Now more than ever, we must focus our eff orts on reducing emissions of greenhouse gases (of which the largest contributor is carbon dioxide (CO2) emitted from fossil fuel use). To halt this increased warming trend, one of the solutions is to capture and permanently store CO2 emissions in deep saline *Read ‘Tran Ngoc’ as last name (Tran Ngoc T. D. for reference).
Modeling and Analysis: Injectivity of carbon dioxide in the St. Lawrence Platform, Quebec (Canada): A sensitivity study T. D. Tran Ngoc et al.
517© 2013 Society of Chemical Industry and John Wiley & Sons, Ltd | Greenhouse Gas Sci Technol. 3:516–540 (2013); DOI: 10.1002/ghg
aquifers (DSA). Th e storage capacity in DSA is huge due to their widespread occurrence.5 Geologic carbon storage (GCS) has been launched in industrial projects (Sleipner and Snovhit, Norway, off shore; In Salah, Algeria, onshore) and investigated in pilot projects (such as Frio, USA; Ketzin, Germany).6–9 Th ese projects show the possibility of injecting CO2 into brine reservoirs and encourage us to test this tech-nology at other appropriate sites.
Both CO2 injectivity (the rate at which CO2 can be safely injected without fracturing reservoir rocks) and DSA storage capacity (the amount of CO2 that can be stored in a given volume of the subsurface) are required to make a successful sequestration project.10 However, the injectivity and capacity assessment faces a number of uncertainties,11,12 because input data from measurements of the host geological medium, presenting inherent complexity, are not entirely complete and available. Moreover, CO2 injection into a DSA forms a multiphase-multicomponent system, which is challenging to analyze.
Injectivity and storage capacity are coupled con-cepts, and we essentially combine the two by defi ning storage capacity as the capacity of a reservoir to host a given amount of injected CO2 (injected continuously or during several distinct periods) without fracturing reservoir rocks.13 It is infl uenced by three classes of factors: reservoir parameters such as formation permeability (with isotropy vs. anisotropy), porosity, compressibility, thickness, pressure, temperature, and salinity; multiphase hydrodynamic parameters like capillary pressure (CP) and relative permeability (RP); and technical design parameters for injection well diameter, number of injection wells, vertical or horizontal completion length/orientation, and injec-tion strategy during project lifetime.14–18 Almost all parameter sensitivity analyses have been generic studies.15,19,20 Th ere are mutual correlations between these factors, yet the permeability of the geological setting has been shown to have the highest impact on the CO2 injection rate.18 Burton et al.20 stated that RP matters as much as absolute permeability and that the uncertainty in RP curves leads to a four-fold variation in injectivity, all other reservoir parameters being equal. Investigating the role of RP by varying absolute permeability, porosity and compressibility, Mathias et al.21 found that injectivity uncertainty is as high as ± 57% for open aquifers and low-permeability closed aquifers, but is reduced to ± 6% for high-permeability closed aquifers. It must be said that RP uncertainty
not only resides in measurement data, but also in choosing empirical models for performance assess-ment through mathematical modeling.22–25 Further-more, we must ensure that the model parameters of RP and CP used in numerical simulators are as compatible as possible. Regarding the uncertainty of the cited parameters, a sensitivity study evaluating the CO2 injectivity over a range of possible param-eters consistent with techno-economic conditions of sites can provide critical information for decision-makers.
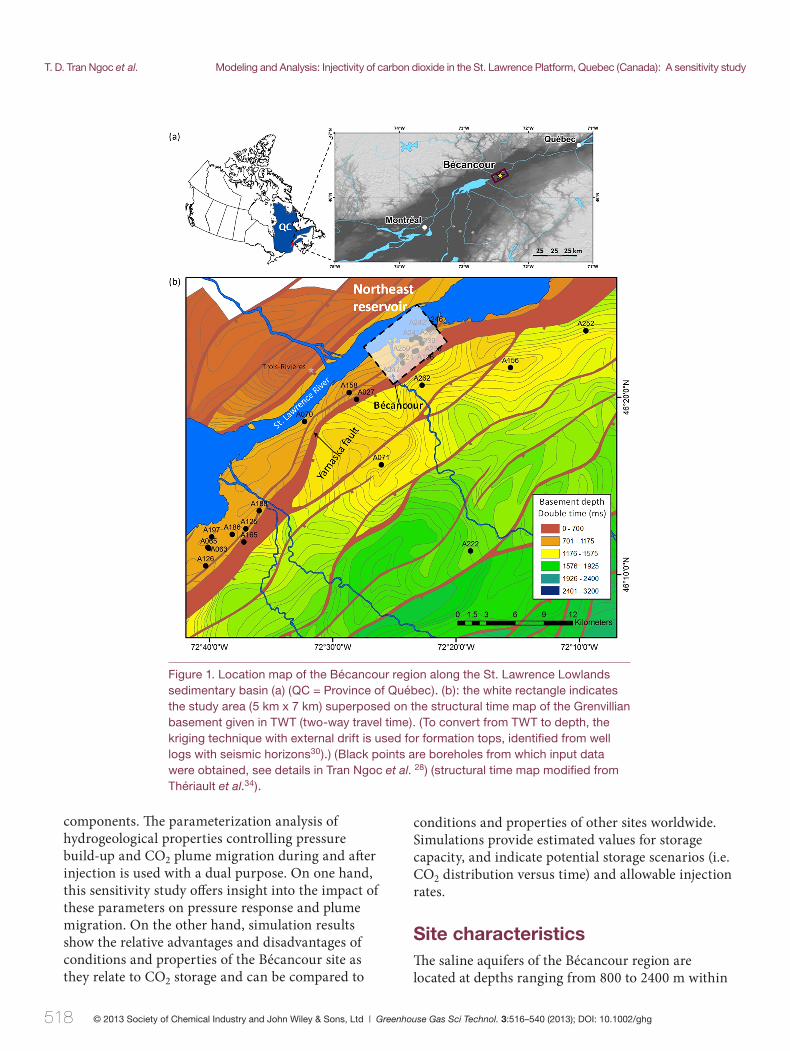
Recently, the onshore sedimentary basin of the St. Lawrence Platform has been shown to have the best potential for CO2 storage in Québec, according to a basin-scale assessment for diff erent onshore and off shore basins in Southern Québec, Canada.26 Within the St. Lawrence basin, the Bécancour area located between Montréal and Québec City along the St. Lawrence River was selected for a study at the site-scale (Fig. 1), according to data availability obtained from hydrocarbon exploration and because of signifi cant CO2 production in the area of about 1Mt per year (equivalent to 32 kg/s) from a cluster of stationary emitters. Deep saline aquifers in this region were characterized in terms of hydrogeology and petrophysics to assess their potential use for CO2 sequestration. Th e brine-bearing sandstones of the Potsdam Group were recognized as the most favorable unit for CO2 injection.27–29 Th e results of this charac-terization are summarized in this paper. A qualitative investigation showed that it is possible to inject CO2 into the Bécancour aquifers, based on a geological model with diff erent realizations constrained by known porosity-permeability data.30
Numerical simulations are oft en used for injectivity studies of GCS at every scale: laboratory experiment, pilot site, and basin-wide reservoir.31,32 A CO2 injec-tion performance assessment via diff erent parameter uncertainty scenarios was carried out for the Nisku (Wabamun Lake Area, Alberta, Canada),15 Ketzin (Germany),18 and Scania (Sweden) saline aquifers.33 To our knowledge, DSA with low matrix permeability on the order of O(1 × 10⁻¹⁵) m2 such as the Bécancour aquifers have very seldom been assessed for GCS. Based on a framework for the feasibility assessment of injectivity and storage capacity of specifi c sites, this paper addresses the injectivity of supercritical CO2 into the northeast reservoir of the Bécancour area, using a series of 2D radial numerical simulations of multiphase fl ow and transport of H2O-NaCl-CO2
T. D. Tran Ngoc et al. Modeling and Analysis: Injectivity of carbon dioxide in the St. Lawrence Platform, Quebec (Canada): A sensitivity study
518 © 2013 Society of Chemical Industry and John Wiley & Sons, Ltd | Greenhouse Gas Sci Technol. 3:516–540 (2013); DOI: 10.1002/ghg
components. Th e parameterization analysis of hydrogeological properties controlling pressure build-up and CO2 plume migration during and aft er injection is used with a dual purpose. On one hand, this sensitivity study off ers insight into the impact of these parameters on pressure response and plume migration. On the other hand, simulation results show the relative advantages and disadvantages of conditions and properties of the Bécancour site as they relate to CO2 storage and can be compared to
conditions and properties of other sites worldwide. Simulations provide estimated values for storage capacity, and indicate potential storage scenarios (i.e. CO2 distribution versus time) and allowable injection rates.
Site characteristicsTh e saline aquifers of the Bécancour region are located at depths ranging from 800 to 2400 m within
Figure 1. Location map of the Bécancour region along the St. Lawrence Lowlands sedimentary basin (a) (QC = Province of Québec). (b): the white rectangle indicates the study area (5 km x 7 km) superposed on the structural time map of the Grenvillian basement given in TWT (two-way travel time). (To convert from TWT to depth, the kriging technique with external drift is used for formation tops, identifi ed from well logs with seismic horizons30).) (Black points are boreholes from which input data were obtained, see details in Tran Ngoc et al. 28) (structural time map modifi ed from Thériault et al.34).
Modeling and Analysis: Injectivity of carbon dioxide in the St. Lawrence Platform, Quebec (Canada): A sensitivity study T. D. Tran Ngoc et al.
519© 2013 Society of Chemical Industry and John Wiley & Sons, Ltd | Greenhouse Gas Sci Technol. 3:516–540 (2013); DOI: 10.1002/ghg
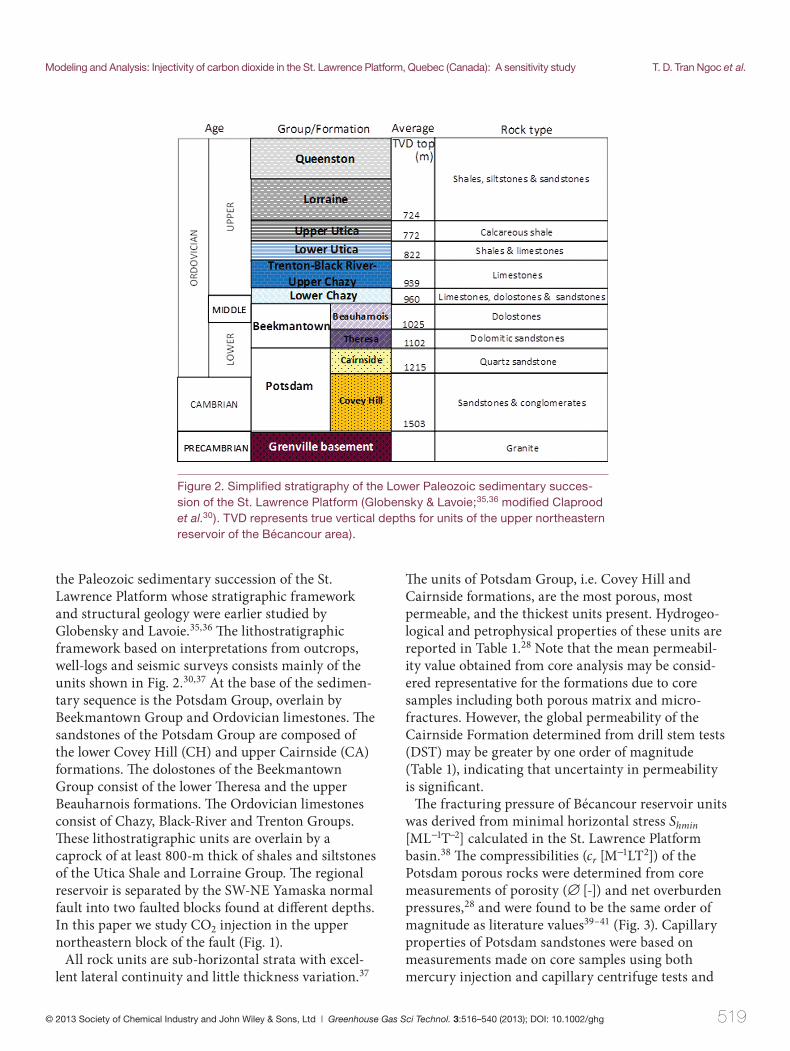
the Paleozoic sedimentary succession of the St. Lawrence Platform whose stratigraphic framework and structural geology were earlier studied by Globensky and Lavoie.35,36 Th e lithostratigraphic framework based on interpretations from outcrops, well-logs and seismic surveys consists mainly of the units shown in Fig. 2.30,37 At the base of the sedimen-tary sequence is the Potsdam Group, overlain by Beekmantown Group and Ordovician limestones. Th e sandstones of the Potsdam Group are composed of the lower Covey Hill (CH) and upper Cairnside (CA) formations. Th e dolostones of the Beekmantown Group consist of the lower Th eresa and the upper Beauharnois formations. Th e Ordovician limestones consist of Chazy, Black-River and Trenton Groups. Th ese lithostratigraphic units are overlain by a caprock of at least 800-m thick of shales and siltstones of the Utica Shale and Lorraine Group. Th e regional reservoir is separated by the SW-NE Yamaska normal fault into two faulted blocks found at diff erent depths. In this paper we study CO2 injection in the upper northeastern block of the fault (Fig. 1).
All rock units are sub-horizontal strata with excel-lent lateral continuity and little thickness variation.37
Th e units of Potsdam Group, i.e. Covey Hill and Cairnside formations, are the most porous, most permeable, and the thickest units present. Hydrogeo-logical and petrophysical properties of these units are reported in Table 1.28 Note that the mean permeabil-ity value obtained from core analysis may be consid-ered representative for the formations due to core samples including both porous matrix and micro-fractures. However, the global permeability of the Cairnside Formation determined from drill stem tests (DST) may be greater by one order of magnitude (Table 1), indicating that uncertainty in permeability is signifi cant.
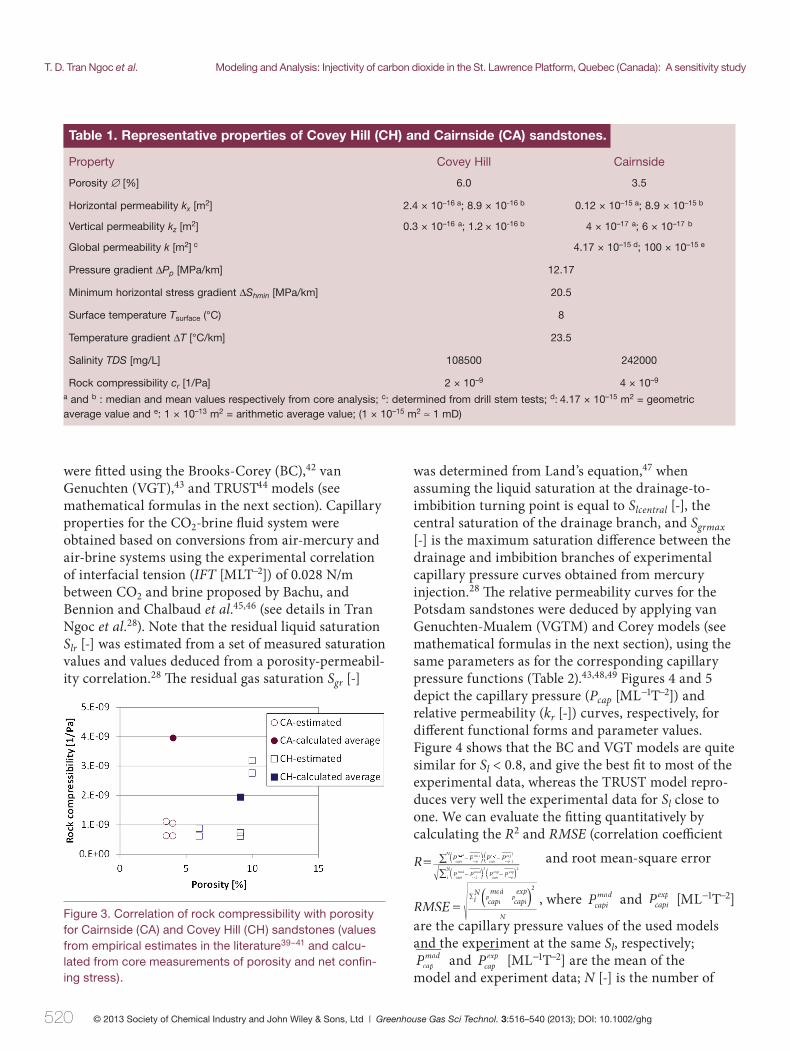
Th e fracturing pressure of Bécancour reservoir units was derived from minimal horizontal stress Shmin [ML−1T−2] calculated in the St. Lawrence Platform basin.38 Th e compressibilities (cr [M−1LT2]) of the Potsdam porous rocks were determined from core measurements of porosity (∅ [-]) and net overburden pressures,28 and were found to be the same order of magnitude as literature values39–41 (Fig. 3). Capillary properties of Potsdam sandstones were based on measurements made on core samples using both mercury injection and capillary centrifuge tests and
Figure 2. Simplifi ed stratigraphy of the Lower Paleozoic sedimentary succes-sion of the St. Lawrence Platform (Globensky & Lavoie;35,36 modifi ed Claprood et al.30). TVD represents true vertical depths for units of the upper northeastern reservoir of the Bécancour area).
T. D. Tran Ngoc et al. Modeling and Analysis: Injectivity of carbon dioxide in the St. Lawrence Platform, Quebec (Canada): A sensitivity study
520 © 2013 Society of Chemical Industry and John Wiley & Sons, Ltd | Greenhouse Gas Sci Technol. 3:516–540 (2013); DOI: 10.1002/ghg
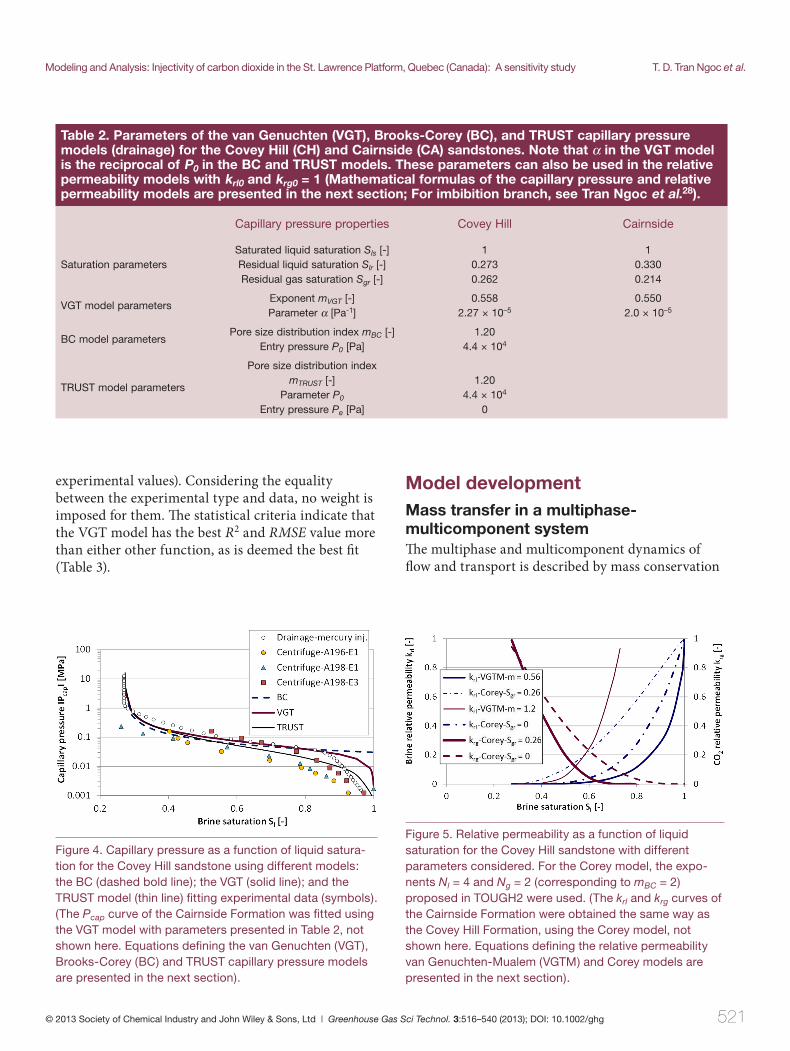
were fi tted using the Brooks-Corey (BC),42 van Genuchten (VGT),43 and TRUST44 models (see mathematical formulas in the next section). Capillary properties for the CO2-brine fl uid system were obtained based on conversions from air-mercury and air-brine systems using the experimental correlation of interfacial tension (IFT [MLT−2]) of 0.028 N/m between CO2 and brine proposed by Bachu, and Bennion and Chalbaud et al.45,46 (see details in Tran Ngoc et al.28). Note that the residual liquid saturation Slr [-] was estimated from a set of measured saturation values and values deduced from a porosity-permeabil-ity correlation.28 Th e residual gas saturation Sgr [-]
was determined from Land’s equation,47 when assuming the liquid saturation at the drainage-to-imbibition turning point is equal to Slcentral [-], the central saturation of the drainage branch, and Sgrmax [-] is the maximum saturation diff erence between the drainage and imbibition branches of experimental capillary pressure curves obtained from mercury injection.28 Th e relative permeability curves for the Potsdam sandstones were deduced by applying van Genuchten-Mualem (VGTM) and Corey models (see mathematical formulas in the next section), using the same parameters as for the corresponding capillary pressure functions (Table 2).43,48,49 Figures 4 and 5 depict the capillary pressure (Pcap [ML−1T−2]) and relative permeability (kr [-]) curves, respectively, for diff erent functional forms and parameter values. Figure 4 shows that the BC and VGT models are quite similar for Sl < 0.8, and give the best fi t to most of the experimental data, whereas the TRUST model repro-duces very well the experimental data for Sl close to one. We can evaluate the fi tting quantitatively by calculating the R2 and RMSE (correlation coeffi cient
R p
p
p
p
p
p
p
p
iN
= ( )P PcapiPmodcapamodP ( )P PcapiPexpx
capaexpxP∑N
iN( )PcapiP mod mod
capa
NP pPmod− P ( )capi
expxcapaexpxPP P−P∑N 2 2
and root mean-square error
RMSEd
iN
N= ( )PcapiP
modPcapiP
expx∑
2
, where PcapiPPmod and PcapiPexpx [ML−1T−2]
are the capillary pressure values of the used models and the experiment at the same Sl, respectively; PcaPP pa
mod and pPcaPP pa
expx [ML−1T−2] are the mean of the model and experiment data; N [-] is the number of
Property Covey Hill Cairnside
Porosity ∅ [%] 6.0 3.5
Horizontal permeability kx [m2] 2.4 × 10⁻¹⁶ a; 8.9 × 10⁻¹⁶ b 0.12 × 10⁻¹⁵ a; 8.9 × 10⁻¹⁵ b
Vertical permeability kz [m2] 0.3 × 10⁻¹⁶ a; 1.2 × 10⁻¹⁶ b 4 × 10–17 a; 6 × 10–17 b
Global permeability k [m2] c 4.17 × 10⁻¹⁵ d; 100 × 10–15 e
Pressure gradient ΔPp [MPa/km] 12.17
Minimum horizontal stress gradient ΔShmin [MPa/km] 20.5
Surface temperature Tsurface (°C) 8
Temperature gradient ΔT [°C/km] 23.5
Salinity TDS [mg/L] 108500 242000
Rock compressibility cr [1/Pa] 2 × 10⁻⁹ 4 × 10⁻⁹
a and b : median and mean values respectively from core analysis; c: determined from drill stem tests; d: 4.17 × 10⁻¹⁵ m2 = geometric average value and e: 1 × 10–13 m2 = arithmetic average value; (1 × 10–15 m2 ≈ 1 mD)
Table 1. Representative properties of Covey Hill (CH) and Cairnside (CA) sandstones.
Figure 3. Correlation of rock compressibility with porosity for Cairnside (CA) and Covey Hill (CH) sandstones (values from empirical estimates in the literature39–41 and calcu-lated from core measurements of porosity and net confi n-ing stress).
Modeling and Analysis: Injectivity of carbon dioxide in the St. Lawrence Platform, Quebec (Canada): A sensitivity study T. D. Tran Ngoc et al.
521© 2013 Society of Chemical Industry and John Wiley & Sons, Ltd | Greenhouse Gas Sci Technol. 3:516–540 (2013); DOI: 10.1002/ghg
Model developmentMass transfer in a multiphase-multicomponent systemTh e multiphase and multicomponent dynamics of fl ow and transport is described by mass conservation
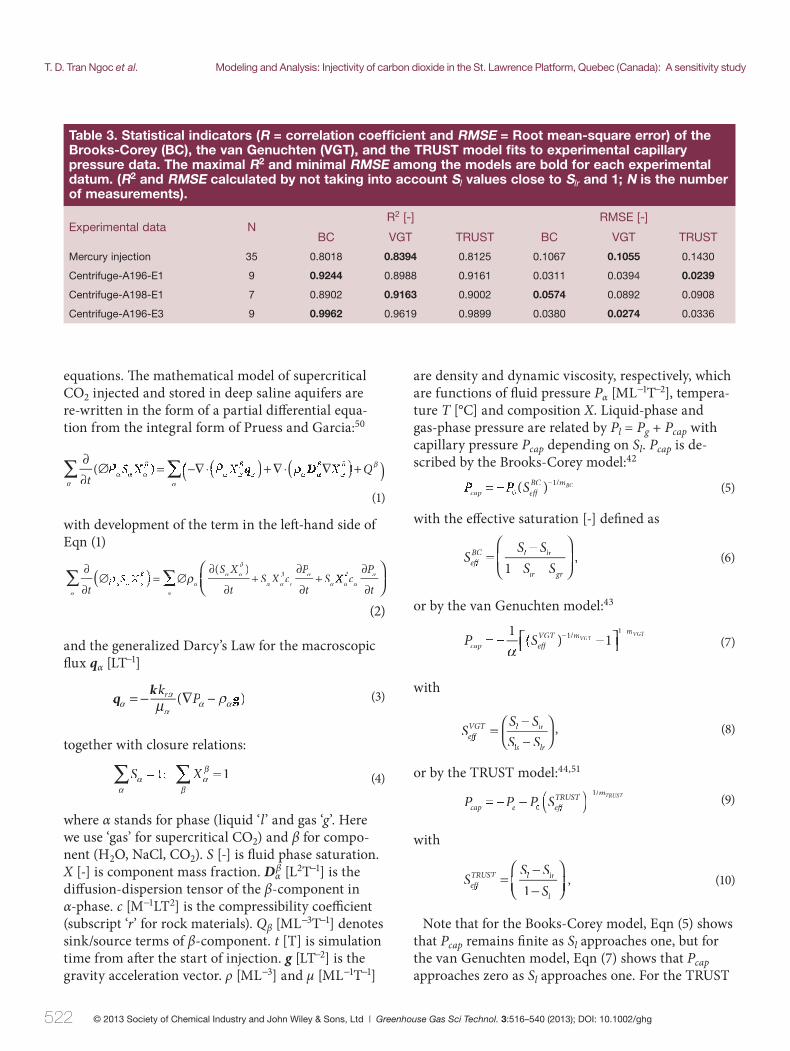
experimental values). Considering the equality between the experimental type and data, no weight is imposed for them. Th e statistical criteria indicate that the VGT model has the best R2 and RMSE value more than either other function, as is deemed the best fi t (Table 3).
Table 2. Parameters of the van Genuchten (VGT), Brooks-Corey (BC), and TRUST capillary pressure models (drainage) for the Covey Hill (CH) and Cairnside (CA) sandstones. Note that α in the VGT model is the reciprocal of P0 in the BC and TRUST models. These parameters can also be used in the relative permeability models with krl0 and krg0 = 1 (Mathematical formulas of the capillary pressure and relative permeability models are presented in the next section; For imbibition branch, see Tran Ngoc et al.28).
Capillary pressure properties Covey Hill Cairnside
Saturation parametersSaturated liquid saturation Sls [-]Residual liquid saturation Slr [-]Residual gas saturation Sgr [-]
10.2730.262
10.3300.214
VGT model parametersExponent mVGT [-]Parameter α [Pa-1]
0.5582.27 × 10–5
0.5502.0 × 10–5
BC model parametersPore size distribution index mBC [-]
Entry pressure P0 [Pa]1.20
4.4 × 10⁴
TRUST model parameters
Pore size distribution index mTRUST [-]
Parameter P0
Entry pressure Pe [Pa]
1.204.4 × 104
0
Figure 4. Capillary pressure as a function of liquid satura-tion for the Covey Hill sandstone using different models: the BC (dashed bold line); the VGT (solid line); and the TRUST model (thin line) fi tting experimental data (symbols). (The Pcap curve of the Cairnside Formation was fi tted using the VGT model with parameters presented in Table 2, not shown here. Equations defi ning the van Genuchten (VGT), Brooks-Corey (BC) and TRUST capillary pressure models are presented in the next section).
Figure 5. Relative permeability as a function of liquid saturation for the Covey Hill sandstone with different parameters considered. For the Corey model, the expo-nents Nl = 4 and Ng = 2 (corresponding to mBC = 2) proposed in TOUGH2 were used. (The krl and krg curves of the Cairnside Formation were obtained the same way as the Covey Hill Formation, using the Corey model, not shown here. Equations defi ning the relative permeability van Genuchten-Mualem (VGTM) and Corey models are presented in the next section).
T. D. Tran Ngoc et al. Modeling and Analysis: Injectivity of carbon dioxide in the St. Lawrence Platform, Quebec (Canada): A sensitivity study
522 © 2013 Society of Chemical Industry and John Wiley & Sons, Ltd | Greenhouse Gas Sci Technol. 3:516–540 (2013); DOI: 10.1002/ghg
equations. Th e mathematical model of supercritical CO2 injected and stored in deep saline aquifers are re-written in the form of a partial diff erential equa-tion from the integral form of Pruess and Garcia:50
∂∂
∅ = ( ) ( )t
( )∅ =ρα α α
β β)( )∇⋅ + ∇⋅( ) ( )∇ Q+)−∇⋅( ∇) ( β) Q+∑∑αα
(1)
with development of the term in the left -hand side of Eqn (1)
∂
∂∅
∂
∂+
∂
∂+( )∅
t tS X c
P
tSrρ= ∅) α
α α
β
α α
β α
α
( )S Xα α
β
X cXXP
tα
β
α
α
αα
∂
∂
⎛⎝⎜⎛⎛⎝⎝
⎞⎠⎟⎞⎞⎠⎠∑∑
(2)
and the generalized Darcy’s Law for the macroscopic fl ux qα [LT−1]
q kkrkkα
αr
αα αμ= − ∇( )α αρ∇ −PαPP g
(3)
together with closure relations:
Xα
αβ
β∑ ∑Sα 1Xα
β =X β
(4)
where α stands for phase (liquid ‘l’ and gas ‘g’. Here we use ‘gas’ for supercritical CO2) and β for compo-nent (H2O, NaCl, CO2). S [-] is fl uid phase saturation. X [-] is component mass fraction. Dα
β [L2T−1] is the diff usion-dispersion tensor of the β-component in α-phase. c [M−1LT2] is the compressibility coeffi cient (subscript ‘r’ for rock materials). Qβ [ML−3T−1] denotes sink/source terms of β-component. t [T] is simulation time from aft er the start of injection. g [LT−2] is the gravity acceleration vector. ρ [ML−3] and μ [ML−1T−1]
are density and dynamic viscosity, respectively, which are functions of fl uid pressure Pα [ML−1T−2], tempera-ture T [°C] and composition X. Liquid-phase and gas-phase pressure are related by Pl = Pg + Pcap with capillary pressure Pcap depending on Sl. Pcap is de-scribed by the Brooks-Corey model:42
caPP p ePa ffeBC mBC−
0PPPP 1( )SeS ffeBC /
(5)
with the eff ective saturation [-] defi ned as
SS SS Seffff
BC l lS r
lr gr
=− S
⎛
⎝⎜⎛⎛
⎝⎝
⎞
⎠⎟⎞⎞
⎠⎠1,
(6)
or by the van Genuchten model:43
PcaPP p ea ffeVGT m m
VGTVGT−⎡⎣ ⎤⎦⎤⎤
− −1 11 1
α( )SeS ffe
VGT /
(7)
with
= ⎛⎛⎝⎛⎛ ⎞
⎠⎞⎞S
S S−S S−effff
VGT l lS r
ls lr
, (8)
or by the TRUST model:44,51
P P PcaP p ePPa
mTRUST− ( )SeffffTRUST −
0PP1/
(9)
with
SS S
SeffffTRUST l lS r
l
=−
⎛⎝⎜⎛⎛⎝⎝
⎞⎠⎟⎞⎞⎠⎠1
, (10)
Note that for the Books-Corey model, Eqn (5) shows that Pcap remains fi nite as Sl approaches one, but for the van Genuchten model, Eqn (7) shows that Pcap approaches zero as Sl approaches one. For the TRUST
Table 3. Statistical indicators (R = correlation coeffi cient and RMSE = Root mean-square error) of the Brooks-Corey (BC), the van Genuchten (VGT), and the TRUST model fi ts to experimental capillary pressure data. The maximal R2 and minimal RMSE among the models are bold for each experimental datum. (R2 and RMSE calculated by not taking into account Sl values close to Slr and 1; N is the number of measurements).
Experimental data NR2 [-] RMSE [-]
BC VGT TRUST BC VGT TRUST
Mercury injection 35 0.8018 0.8394 0.8125 0.1067 0.1055 0.1430
Centrifuge-A196-E1 9 0.9244 0.8988 0.9161 0.0311 0.0394 0.0239
Centrifuge-A198-E1 7 0.8902 0.9163 0.9002 0.0574 0.0892 0.0908
Centrifuge-A196-E3 9 0.9962 0.9619 0.9899 0.0380 0.0274 0.0336
Modeling and Analysis: Injectivity of carbon dioxide in the St. Lawrence Platform, Quebec (Canada): A sensitivity study T. D. Tran Ngoc et al.
523© 2013 Society of Chemical Industry and John Wiley & Sons, Ltd | Greenhouse Gas Sci Technol. 3:516–540 (2013); DOI: 10.1002/ghg
model, Eqn (9) shows that Pcap can approach either a fi nite value or zero as Sl approaches one, depending on the value of –Pe.k [L2] is the intrinsic permeability tensor. krα [-],
relative permeability to α-phase, can be modelled by Corey’s function:48
k k= Srl rl effffBC
0
Nl
and (11)
)()((k k= S S() −1− S ()rg rg0 e( S1 Sgg ffeBC
effffBC2 N g
(12)
where krl0 and krg0 [-] are the end-point relative permeabilities for the liquid and gas phases, respec-tively. In Corey’s original work, krl0 = krg0 = 1 and the exponents Nl and Ng were taken to be 4 and 2, respec-tively. However, it is also possible to connect the capillary pressure and relative permeability functions by taking Nl = 3 + 2/mBC and Ng = 1 + 2/mBC, where mBC is taken from the Brooks-Corey capillary pres-sure function (Eqn (5)). In the present work, we take krl0 and krg0 = 1 and Nl = 4 and Ng = 2, which would imply (mBC = 2 in Eqn (5)). For consistency with the mBC value obtained by fi tting experimental capillary pressure data (mBC = 1.2, Table 2), we would need to use Nl = 4.7 and Ng = 2.7, but these exponents produce relative permeability curves little changed from those shown in Fig. 5.
A mixed function of the VGTM-Corey model is also used for relative permeability:43,48,49
k Srl effffVGT
mVGT
S fff ( )SeffffVGT mVGT−⎡
⎣⎣⎣⎤⎦⎥⎤⎤⎦⎦
1−(2
(13)
for liquid and Eqn (12) for gas with krg0 = 1 and Ng = 2. Th e mathematical model above is implemented in
TOUGH2/ECO2N using the integral fi nite diff erence method.51,52 Our numerical simulations are carried out under isothermal conditions (supercritical CO2 is pre-heated to the temperature of the Bécancour aquifers) and in non-hysteretic mode. Certain pro-cesses that are expected to be small or occur very slowly were neglected, such as molecular diff usion, hydrodynamic dispersion, permeability from salt precipitation or rock dissolution and mineral carbon-ation. Th e hydrodynamic, hydrogeological, petrophys-ical and geometrical parameters that appear in Eqns (1)–(13) will be analyzed for their impact on CO2 injection, according to their uncertainty. Note that the Brooks-Corey capillary pressure function (Eqn (5)) is not implemented in this version of TOUGH2,
so the capillary pressure analysis is limited to the van Genuchten and TRUST functions.
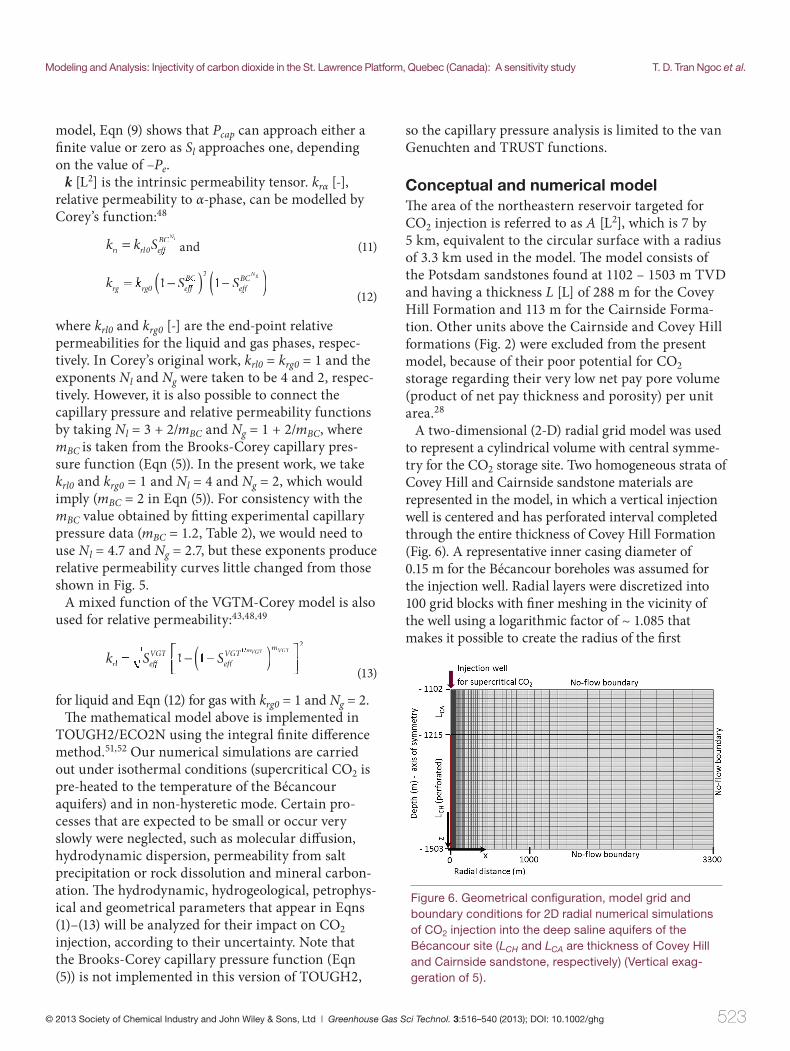
Conceptual and numerical modelTh e area of the northeastern reservoir targeted for CO2 injection is referred to as A [L2], which is 7 by 5 km, equivalent to the circular surface with a radius of 3.3 km used in the model. Th e model consists of the Potsdam sandstones found at 1102 – 1503 m TVD and having a thickness L [L] of 288 m for the Covey Hill Formation and 113 m for the Cairnside Forma-tion. Other units above the Cairnside and Covey Hill formations (Fig. 2) were excluded from the present model, because of their poor potential for CO2 storage regarding their very low net pay pore volume (product of net pay thickness and porosity) per unit area.28
A two-dimensional (2-D) radial grid model was used to represent a cylindrical volume with central symme-try for the CO2 storage site. Two homogeneous strata of Covey Hill and Cairnside sandstone materials are represented in the model, in which a vertical injection well is centered and has perforated interval completed through the entire thickness of Covey Hill Formation (Fig. 6). A representative inner casing diameter of 0.15 m for the Bécancour boreholes was assumed for the injection well. Radial layers were discretized into 100 grid blocks with fi ner meshing in the vicinity of the well using a logarithmic factor of ~ 1.085 that makes it possible to create the radius of the fi rst
Figure 6. Geometrical confi guration, model grid and boundary conditions for 2D radial numerical simulations of CO2 injection into the deep saline aquifers of the Bécancour site (LCH and LCA are thickness of Covey Hill and Cairnside sandstone, respectively) (Vertical exag-geration of 5).
T. D. Tran Ngoc et al. Modeling and Analysis: Injectivity of carbon dioxide in the St. Lawrence Platform, Quebec (Canada): A sensitivity study
524 © 2013 Society of Chemical Industry and John Wiley & Sons, Ltd | Greenhouse Gas Sci Technol. 3:516–540 (2013); DOI: 10.1002/ghg
grid-block size equal to that of the injection well. Th e vertical computational domain has a grid resolution of 25 layers for the Covey Hill Formation and 10 layers for the Cairnside Formation. All layers are about 11 m thick (Fig. 6).
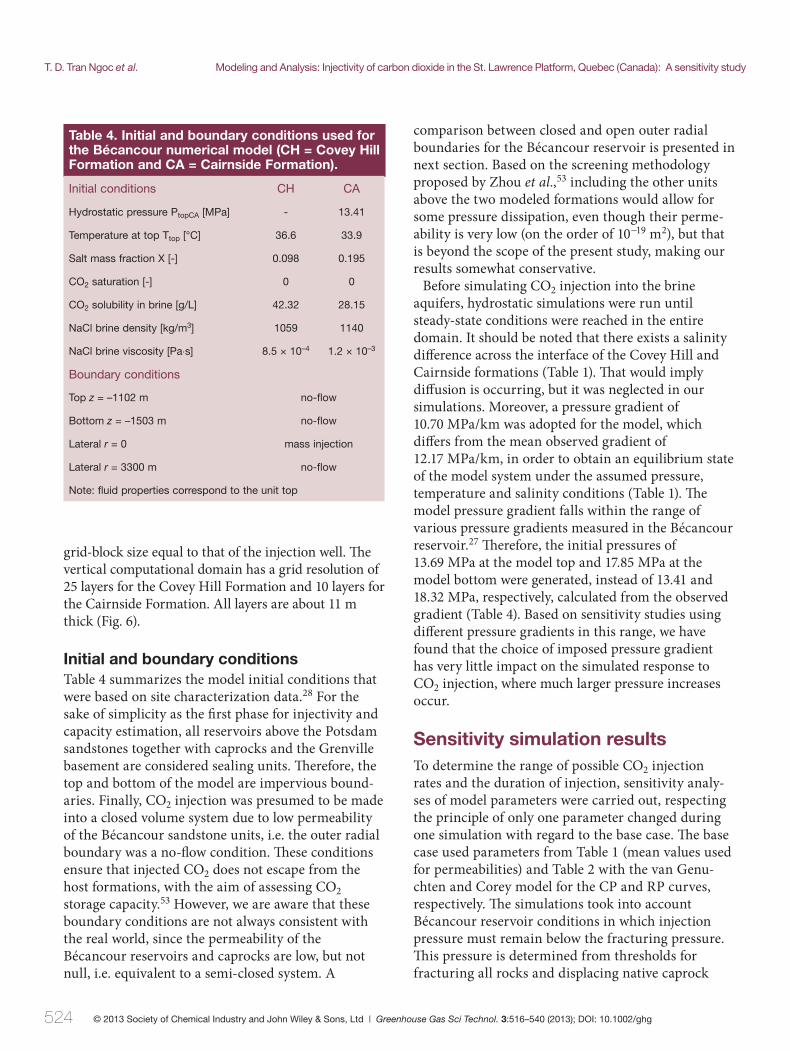
Initial and boundary conditionsTable 4 summarizes the model initial conditions that were based on site characterization data.28 For the sake of simplicity as the fi rst phase for injectivity and capacity estimation, all reservoirs above the Potsdam sandstones together with caprocks and the Grenville basement are considered sealing units. Th erefore, the top and bottom of the model are impervious bound-aries. Finally, CO2 injection was presumed to be made into a closed volume system due to low permeability of the Bécancour sandstone units, i.e. the outer radial boundary was a no-fl ow condition. Th ese conditions ensure that injected CO2 does not escape from the host formations, with the aim of assessing CO2 storage capacity.53 However, we are aware that these boundary conditions are not always consistent with the real world, since the permeability of the Bécancour reservoirs and caprocks are low, but not null, i.e. equivalent to a semi-closed system. A
comparison between closed and open outer radial boundaries for the Bécancour reservoir is presented in next section. Based on the screening methodology proposed by Zhou et al.,53 including the other units above the two modeled formations would allow for some pressure dissipation, even though their perme-ability is very low (on the order of 10−19 m2), but that is beyond the scope of the present study, making our results somewhat conservative.
Before simulating CO2 injection into the brine aquifers, hydrostatic simulations were run until steady-state conditions were reached in the entire domain. It should be noted that there exists a salinity diff erence across the interface of the Covey Hill and Cairnside formations (Table 1). Th at would imply diff usion is occurring, but it was neglected in our simulations. Moreover, a pressure gradient of 10.70 MPa/km was adopted for the model, which diff ers from the mean observed gradient of 12.17 MPa/km, in order to obtain an equilibrium state of the model system under the assumed pressure, temperature and salinity conditions (Table 1). Th e model pressure gradient falls within the range of various pressure gradients measured in the Bécancour reservoir.27 Th erefore, the initial pressures of 13.69 MPa at the model top and 17.85 MPa at the model bottom were generated, instead of 13.41 and 18.32 MPa, respectively, calculated from the observed gradient (Table 4). Based on sensitivity studies using diff erent pressure gradients in this range, we have found that the choice of imposed pressure gradient has very little impact on the simulated response to CO2 injection, where much larger pressure increases occur.
Sensitivity simulation resultsTo determine the range of possible CO2 injection rates and the duration of injection, sensitivity analy-ses of model parameters were carried out, respecting the principle of only one parameter changed during one simulation with regard to the base case. Th e base case used parameters from Table 1 (mean values used for permeabilities) and Table 2 with the van Genu-chten and Corey model for the CP and RP curves, respectively. Th e simulations took into account Bécancour reservoir conditions in which injection pressure must remain below the fracturing pressure. Th is pressure is determined from thresholds for fracturing all rocks and displacing native caprock
Table 4. Initial and boundary conditions used for the Bécancour numerical model (CH = Covey Hill Formation and CA = Cairnside Formation).
Initial conditions CH CA
Hydrostatic pressure PtopCA [MPa] - 13.41
Temperature at top Ttop [°C] 36.6 33.9
Salt mass fraction X [-] 0.098 0.195
CO2 saturation [-] 0 0
CO2 solubility in brine [g/L] 42.32 28.15
NaCl brine density [kg/m3] 1059 1140
NaCl brine viscosity [Pa⋅s] 8.5 × 10⁻⁴ 1.2 × 10⁻³
Boundary conditions
Top z = –1102 m no-fl ow
Bottom z = –1503 m no-fl ow
Lateral r = 0 mass injection
Lateral r = 3300 m no-fl ow
Note: fl uid properties correspond to the unit top
Modeling and Analysis: Injectivity of carbon dioxide in the St. Lawrence Platform, Quebec (Canada): A sensitivity study T. D. Tran Ngoc et al.
525© 2013 Society of Chemical Industry and John Wiley & Sons, Ltd | Greenhouse Gas Sci Technol. 3:516–540 (2013); DOI: 10.1002/ghg
fl uid by CO2 (i.e. capillary pressure strength of caprocks).13 Th e injection pressure must also be greater than the entry pressure of the Potsdam sandstones to enable the native brine displacement. Here, the maximum sustainable injection pressure Pmax (= 1.5 Pp_initial) (Pmax = 27.6 MPa calculated at the well bottom) was based on only Shmin with a factor of 0.9 according to regulatory agencies, due to a lack of data on caprock units. In the simulations, injection rates are imposed in a controlled manner to not exceed pressure build-up (= 0.5 Pp_initial), instead of imposing the maximum injection pressure. Th is Neumann boundary application is preferred, in order to facilitate the aim of this study which focuses on possible CO2 injection rates. Sensitivity analyses were carried out by varying only the Covey Hill param-eters. Simulations considered injection periods of 5 to 50 years and a few hundred years aft er injection ceases. We used the Petrasim interface for TOUGH2 simulations.54
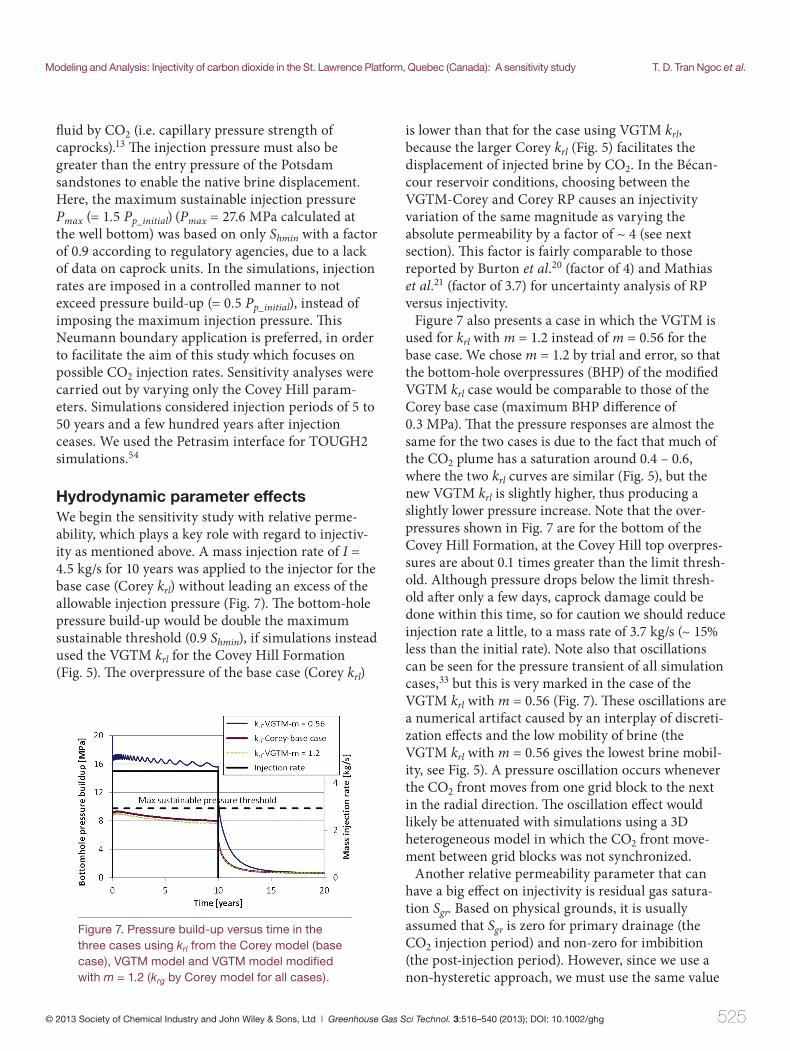
Hydrodynamic parameter effectsWe begin the sensitivity study with relative perme-ability, which plays a key role with regard to injectiv-ity as mentioned above. A mass injection rate of I = 4.5 kg/s for 10 years was applied to the injector for the base case (Corey krl) without leading an excess of the allowable injection pressure (Fig. 7). Th e bottom-hole pressure build-up would be double the maximum sustainable threshold (0.9 Shmin), if simulations instead used the VGTM krl for the Covey Hill Formation (Fig. 5). Th e overpressure of the base case (Corey krl)
is lower than that for the case using VGTM krl, because the larger Corey krl (Fig. 5) facilitates the displacement of injected brine by CO2. In the Bécan-cour reservoir conditions, choosing between the VGTM-Corey and Corey RP causes an injectivity variation of the same magnitude as varying the absolute permeability by a factor of ~ 4 (see next section). Th is factor is fairly comparable to those reported by Burton et al.20 (factor of 4) and Mathias et al.21 (factor of 3.7) for uncertainty analysis of RP versus injectivity.
Figure 7 also presents a case in which the VGTM is used for krl with m = 1.2 instead of m = 0.56 for the base case. We chose m = 1.2 by trial and error, so that the bottom-hole overpressures (BHP) of the modifi ed VGTM krl case would be comparable to those of the Corey base case (maximum BHP diff erence of 0.3 MPa). Th at the pressure responses are almost the same for the two cases is due to the fact that much of the CO2 plume has a saturation around 0.4 – 0.6, where the two krl curves are similar (Fig. 5), but the new VGTM krl is slightly higher, thus producing a slightly lower pressure increase. Note that the over-pressures shown in Fig. 7 are for the bottom of the Covey Hill Formation, at the Covey Hill top overpres-sures are about 0.1 times greater than the limit thresh-old. Although pressure drops below the limit thresh-old aft er only a few days, caprock damage could be done within this time, so for caution we should reduce injection rate a little, to a mass rate of 3.7 kg/s (~ 15% less than the initial rate). Note also that oscillations can be seen for the pressure transient of all simulation cases,33 but this is very marked in the case of the VGTM krl with m = 0.56 (Fig. 7). Th ese oscillations are a numerical artifact caused by an interplay of discreti-zation eff ects and the low mobility of brine (the VGTM krl with m = 0.56 gives the lowest brine mobil-ity, see Fig. 5). A pressure oscillation occurs whenever the CO2 front moves from one grid block to the next in the radial direction. Th e oscillation eff ect would likely be attenuated with simulations using a 3D heterogeneous model in which the CO2 front move-ment between grid blocks was not synchronized.
Another relative permeability parameter that can have a big eff ect on injectivity is residual gas satura-tion Sgr. Based on physical grounds, it is usually assumed that Sgr is zero for primary drainage (the CO2 injection period) and non-zero for imbibition (the post-injection period). However, since we use a non-hysteretic approach, we must use the same value
Figure 7. Pressure build-up versus time in the three cases using krl from the Corey model (base case), VGTM model and VGTM model modifi ed with m = 1.2 (krg by Corey model for all cases).
T. D. Tran Ngoc et al. Modeling and Analysis: Injectivity of carbon dioxide in the St. Lawrence Platform, Quebec (Canada): A sensitivity study
526 © 2013 Society of Chemical Industry and John Wiley & Sons, Ltd | Greenhouse Gas Sci Technol. 3:516–540 (2013); DOI: 10.1002/ghg
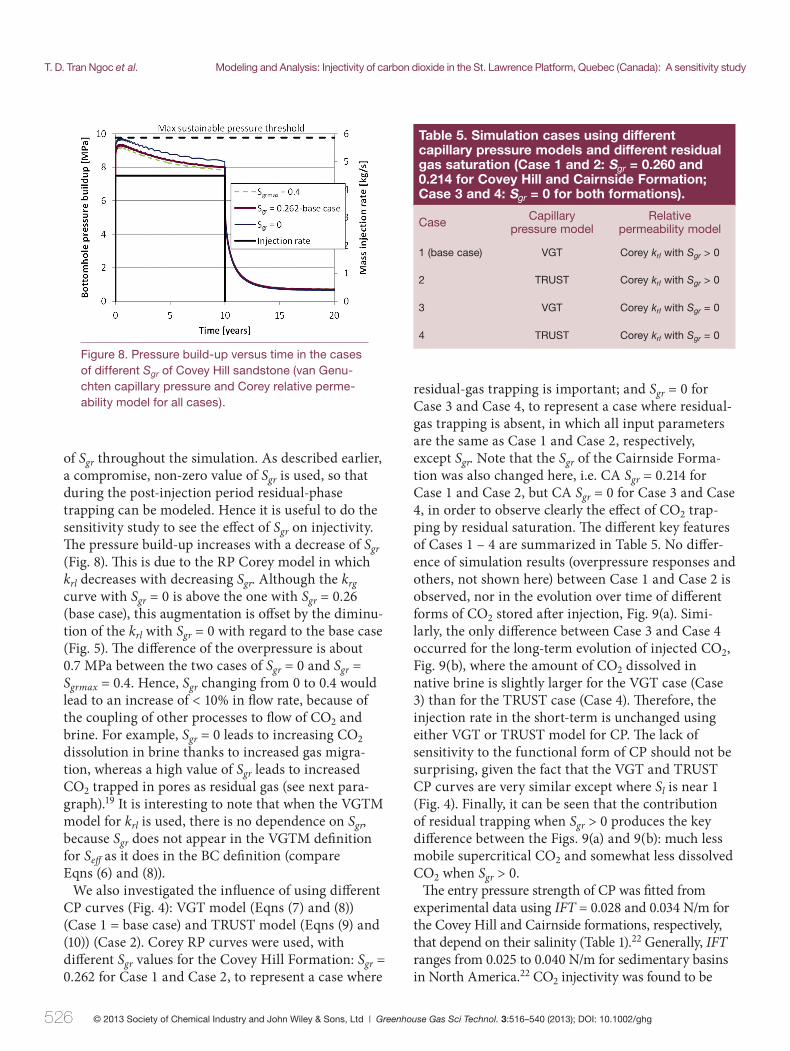
of Sgr throughout the simulation. As described earlier, a compromise, non-zero value of Sgr is used, so that during the post-injection period residual-phase trapping can be modeled. Hence it is useful to do the sensitivity study to see the eff ect of Sgr on injectivity. Th e pressure build-up increases with a decrease of Sgr (Fig. 8). Th is is due to the RP Corey model in which krl decreases with decreasing Sgr. Although the krg curve with Sgr = 0 is above the one with Sgr = 0.26 (base case), this augmentation is off set by the diminu-tion of the krl with Sgr = 0 with regard to the base case (Fig. 5). Th e diff erence of the overpressure is about 0.7 MPa between the two cases of Sgr = 0 and Sgr = Sgrmax = 0.4. Hence, Sgr changing from 0 to 0.4 would lead to an increase of < 10% in fl ow rate, because of the coupling of other processes to fl ow of CO2 and brine. For example, Sgr = 0 leads to increasing CO2 dissolution in brine thanks to increased gas migra-tion, whereas a high value of Sgr leads to increased CO2 trapped in pores as residual gas (see next para-graph).19 It is interesting to note that when the VGTM model for krl is used, there is no dependence on Sgr, because Sgr does not appear in the VGTM defi nition for Seff as it does in the BC defi nition (compare Eqns (6) and (8)).
We also investigated the infl uence of using diff erent CP curves (Fig. 4): VGT model (Eqns (7) and (8)) (Case 1 = base case) and TRUST model (Eqns (9) and (10)) (Case 2). Corey RP curves were used, with diff erent Sgr values for the Covey Hill Formation: Sgr = 0.262 for Case 1 and Case 2, to represent a case where
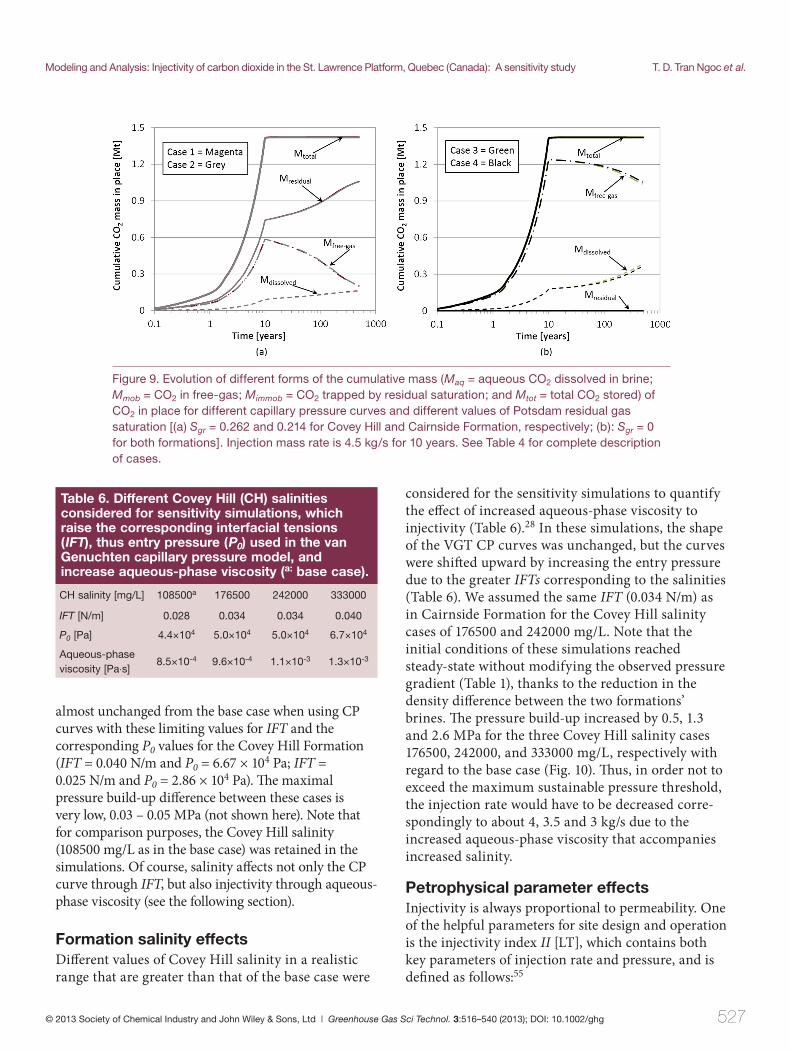
residual-gas trapping is important; and Sgr = 0 for Case 3 and Case 4, to represent a case where residual-gas trapping is absent, in which all input parameters are the same as Case 1 and Case 2, respectively, except Sgr. Note that the Sgr of the Cairnside Forma-tion was also changed here, i.e. CA Sgr = 0.214 for Case 1 and Case 2, but CA Sgr = 0 for Case 3 and Case 4, in order to observe clearly the eff ect of CO2 trap-ping by residual saturation. Th e diff erent key features of Cases 1 – 4 are summarized in Table 5. No diff er-ence of simulation results (overpressure responses and others, not shown here) between Case 1 and Case 2 is observed, nor in the evolution over time of diff erent forms of CO2 stored aft er injection, Fig. 9(a). Simi-larly, the only diff erence between Case 3 and Case 4 occurred for the long-term evolution of injected CO2, Fig. 9(b), where the amount of CO2 dissolved in native brine is slightly larger for the VGT case (Case 3) than for the TRUST case (Case 4). Th erefore, the injection rate in the short-term is unchanged using either VGT or TRUST model for CP. Th e lack of sensitivity to the functional form of CP should not be surprising, given the fact that the VGT and TRUST CP curves are very similar except where Sl is near 1 (Fig. 4). Finally, it can be seen that the contribution of residual trapping when Sgr > 0 produces the key diff erence between the Figs. 9(a) and 9(b): much less mobile supercritical CO2 and somewhat less dissolved CO2 when Sgr > 0.
Th e entry pressure strength of CP was fi tted from experimental data using IFT = 0.028 and 0.034 N/m for the Covey Hill and Cairnside formations, respectively, that depend on their salinity (Table 1).22 Generally, IFT ranges from 0.025 to 0.040 N/m for sedimentary basins in North America.22 CO2 injectivity was found to be
Figure 8. Pressure build-up versus time in the cases of different Sgr of Covey Hill sandstone (van Genu-chten capillary pressure and Corey relative perme-ability model for all cases).
Table 5. Simulation cases using different capillary pressure models and different residual gas saturation (Case 1 and 2: Sgr = 0.260 and 0.214 for Covey Hill and Cairnside Formation; Case 3 and 4: Sgr = 0 for both formations).
Case Capillary pressure model
Relative permeability model
1 (base case) VGT Corey krl with Sgr > 0
2 TRUST Corey krl with Sgr > 0
3 VGT Corey krl with Sgr = 0
4 TRUST Corey krl with Sgr = 0
Modeling and Analysis: Injectivity of carbon dioxide in the St. Lawrence Platform, Quebec (Canada): A sensitivity study T. D. Tran Ngoc et al.
527© 2013 Society of Chemical Industry and John Wiley & Sons, Ltd | Greenhouse Gas Sci Technol. 3:516–540 (2013); DOI: 10.1002/ghg
almost unchanged from the base case when using CP curves with these limiting values for IFT and the corresponding P0 values for the Covey Hill Formation (IFT = 0.040 N/m and P0 = 6.67 × 10⁴ Pa; IFT = 0.025 N/m and P0 = 2.86 × 10⁴ Pa). Th e maximal pressure build-up diff erence between these cases is very low, 0.03 – 0.05 MPa (not shown here). Note that for comparison purposes, the Covey Hill salinity (108500 mg/L as in the base case) was retained in the simulations. Of course, salinity aff ects not only the CP curve through IFT, but also injectivity through aqueous-phase viscosity (see the following section).
Formation salinity effectsDiff erent values of Covey Hill salinity in a realistic range that are greater than that of the base case were
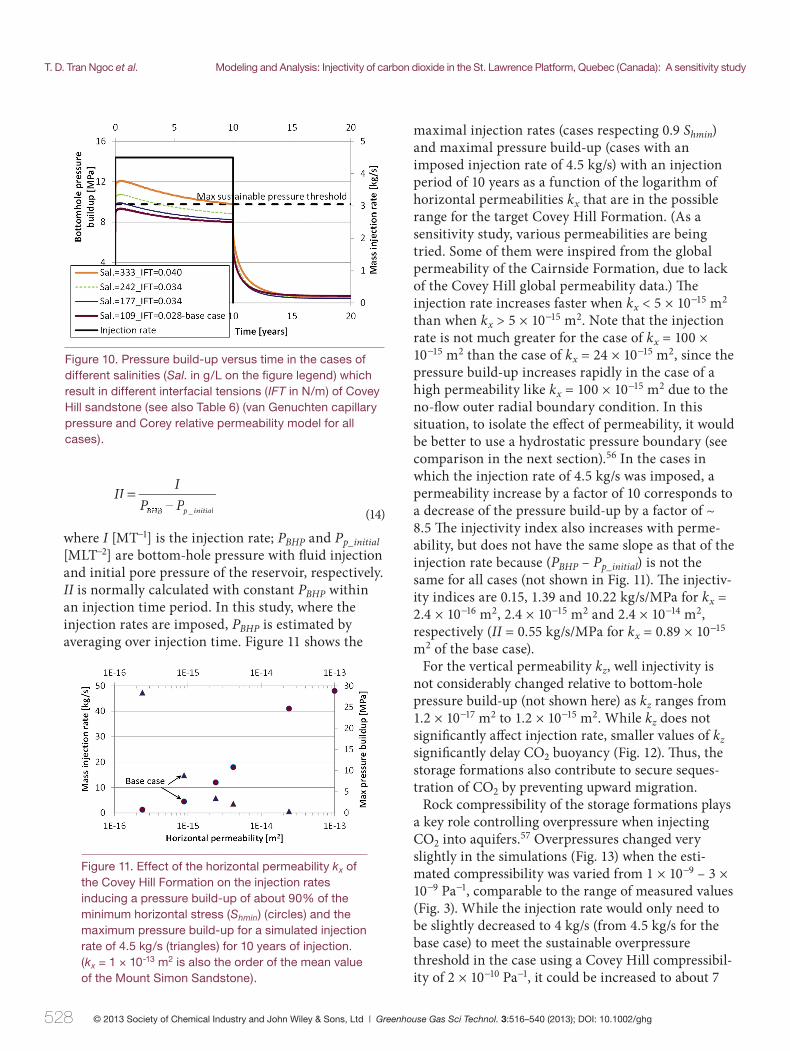
considered for the sensitivity simulations to quantify the eff ect of increased aqueous-phase viscosity to injectivity (Table 6).28 In these simulations, the shape of the VGT CP curves was unchanged, but the curves were shift ed upward by increasing the entry pressure due to the greater IFTs corresponding to the salinities (Table 6). We assumed the same IFT (0.034 N/m) as in Cairnside Formation for the Covey Hill salinity cases of 176500 and 242000 mg/L. Note that the initial conditions of these simulations reached steady-state without modifying the observed pressure gradient (Table 1), thanks to the reduction in the density diff erence between the two formations’ brines. Th e pressure build-up increased by 0.5, 1.3 and 2.6 MPa for the three Covey Hill salinity cases 176500, 242000, and 333000 mg/L, respectively with regard to the base case (Fig. 10). Th us, in order not to exceed the maximum sustainable pressure threshold, the injection rate would have to be decreased corre-spondingly to about 4, 3.5 and 3 kg/s due to the increased aqueous-phase viscosity that accompanies increased salinity.
Petrophysical parameter effectsInjectivity is always proportional to permeability. One of the helpful parameters for site design and operation is the injectivity index II [LT], which contains both key parameters of injection rate and pressure, and is defi ned as follows:55
CH salinity [mg/L] 108500a 176500 242000 333000
IFT [N/m] 0.028 0.034 0.034 0.040
P0 [Pa] 4.4×10⁴ 5.0×10⁴ 5.0×10⁴ 6.7×10⁴
Aqueous-phase viscosity [Pa⋅s]
8.5×10⁻⁴ 9.6×10⁻⁴ 1.1×10⁻³ 1.3×10⁻³
Table 6. Different Covey Hill (CH) salinities considered for sensitivity simulations, which raise the corresponding interfacial tensions (IFT), thus entry pressure (P0) used in the van Genuchten capillary pressure model, and increase aqueous-phase viscosity (a: base case).
Figure 9. Evolution of different forms of the cumulative mass (Maq = aqueous CO2 dissolved in brine; Mmob = CO2 in free-gas; Mimmob = CO2 trapped by residual saturation; and Mtot = total CO2 stored) of CO2 in place for different capillary pressure curves and different values of Potsdam residual gas saturation [(a) Sgr = 0.262 and 0.214 for Covey Hill and Cairnside Formation, respectively; (b): Sgr = 0 for both formations]. Injection mass rate is 4.5 kg/s for 10 years. See Table 4 for complete description of cases.
T. D. Tran Ngoc et al. Modeling and Analysis: Injectivity of carbon dioxide in the St. Lawrence Platform, Quebec (Canada): A sensitivity study
528 © 2013 Society of Chemical Industry and John Wiley & Sons, Ltd | Greenhouse Gas Sci Technol. 3:516–540 (2013); DOI: 10.1002/ghg
III
P PBHPP B pPHH initiatt l
=_ (14)
where I [MT−1] is the injection rate; PBHP and Pp_initial [MLT−2] are bottom-hole pressure with fl uid injection and initial pore pressure of the reservoir, respectively. II is normally calculated with constant PBHP within an injection time period. In this study, where the injection rates are imposed, PBHP is estimated by averaging over injection time. Figure 11 shows the
maximal injection rates (cases respecting 0.9 Shmin) and maximal pressure build-up (cases with an imposed injection rate of 4.5 kg/s) with an injection period of 10 years as a function of the logarithm of horizontal permeabilities kx that are in the possible range for the target Covey Hill Formation. (As a sensitivity study, various permeabilities are being tried. Some of them were inspired from the global permeability of the Cairnside Formation, due to lack of the Covey Hill global permeability data.) Th e injection rate increases faster when kx < 5 × 10⁻¹⁵ m2 than when kx > 5 × 10⁻¹⁵ m2. Note that the injection rate is not much greater for the case of kx = 100 × 10−15 m2 than the case of kx = 24 × 10−15 m2, since the pressure build-up increases rapidly in the case of a high permeability like kx = 100 × 10−15 m2 due to the no-fl ow outer radial boundary condition. In this situation, to isolate the eff ect of permeability, it would be better to use a hydrostatic pressure boundary (see comparison in the next section).56 In the cases in which the injection rate of 4.5 kg/s was imposed, a permeability increase by a factor of 10 corresponds to a decrease of the pressure build-up by a factor of ~ 8.5 Th e injectivity index also increases with perme-ability, but does not have the same slope as that of the injection rate because (PBHP – Pp_initial) is not the same for all cases (not shown in Fig. 11). Th e injectiv-ity indices are 0.15, 1.39 and 10.22 kg/s/MPa for kx = 2.4 × 10⁻¹⁶ m2, 2.4 × 10⁻¹⁵ m2 and 2.4 × 10⁻¹⁴ m2, respectively (II = 0.55 kg/s/MPa for kx = 0.89 × 10⁻¹⁵ m2 of the base case).
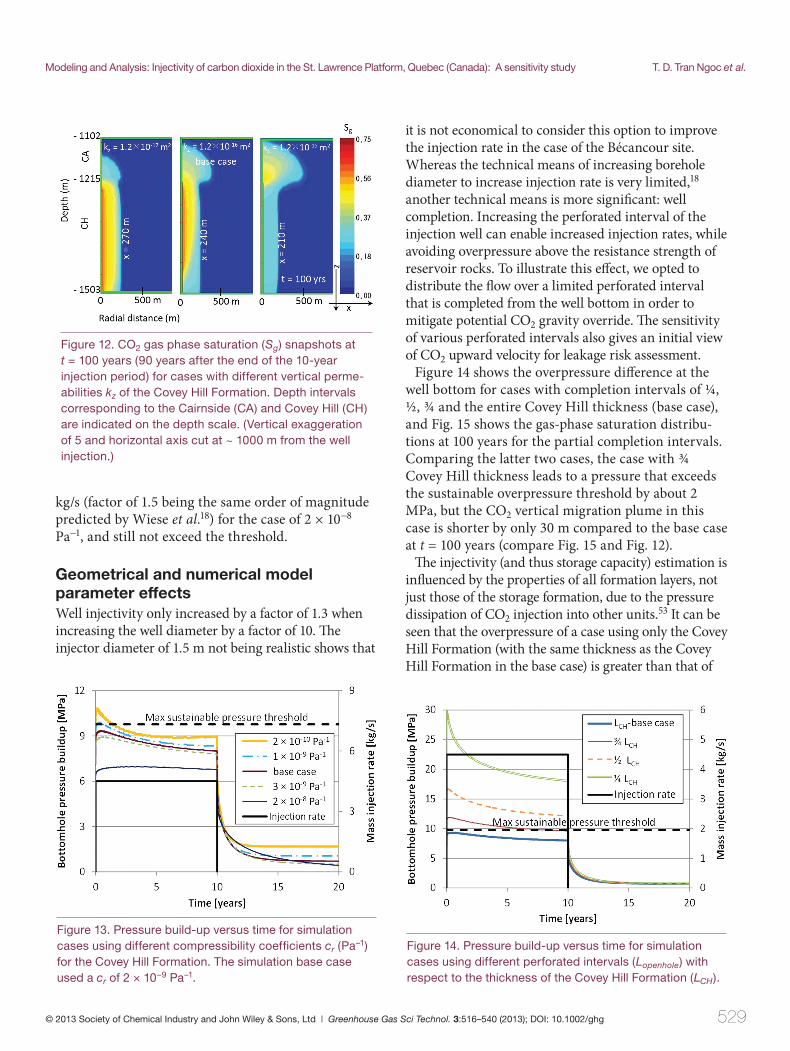
For the vertical permeability kz, well injectivity is not considerably changed relative to bottom-hole pressure build-up (not shown here) as kz ranges from 1.2 × 10⁻¹⁷ m2 to 1.2 × 10⁻¹⁵ m2. While kz does not signifi cantly aff ect injection rate, smaller values of kz signifi cantly delay CO2 buoyancy (Fig. 12). Th us, the storage formations also contribute to secure seques-tration of CO2 by preventing upward migration.
Rock compressibility of the storage formations plays a key role controlling overpressure when injecting CO2 into aquifers.57 Overpressures changed very slightly in the simulations (Fig. 13) when the esti-mated compressibility was varied from 1 × 10⁻⁹ – 3 × 10⁻⁹ Pa−1, comparable to the range of measured values (Fig. 3). While the injection rate would only need to be slightly decreased to 4 kg/s (from 4.5 kg/s for the base case) to meet the sustainable overpressure threshold in the case using a Covey Hill compressibil-ity of 2 × 10⁻¹⁰ Pa−1, it could be increased to about 7
Figure 10. Pressure build-up versus time in the cases of different salinities (Sal. in g/L on the fi gure legend) which result in different interfacial tensions (IFT in N/m) of Covey Hill sandstone (see also Table 6) (van Genuchten capillary pressure and Corey relative permeability model for all cases).
Figure 11. Effect of the horizontal permeability kx of the Covey Hill Formation on the injection rates inducing a pressure build-up of about 90% of the minimum horizontal stress (Shmin) (circles) and the maximum pressure build-up for a simulated injection rate of 4.5 kg/s (triangles) for 10 years of injection. (kx = 1 × 10-13 m2 is also the order of the mean value of the Mount Simon Sandstone).
Modeling and Analysis: Injectivity of carbon dioxide in the St. Lawrence Platform, Quebec (Canada): A sensitivity study T. D. Tran Ngoc et al.
529© 2013 Society of Chemical Industry and John Wiley & Sons, Ltd | Greenhouse Gas Sci Technol. 3:516–540 (2013); DOI: 10.1002/ghg
kg/s (factor of 1.5 being the same order of magnitude predicted by Wiese et al.18) for the case of 2 × 10⁻⁸ Pa−1, and still not exceed the threshold.
Geometrical and numerical model parameter effectsWell injectivity only increased by a factor of 1.3 when increasing the well diameter by a factor of 10. Th e injector diameter of 1.5 m not being realistic shows that
it is not economical to consider this option to improve the injection rate in the case of the Bécancour site. Whereas the technical means of increasing borehole diameter to increase injection rate is very limited,18 another technical means is more signifi cant: well completion. Increasing the perforated interval of the injection well can enable increased injection rates, while avoiding overpressure above the resistance strength of reservoir rocks. To illustrate this eff ect, we opted to distribute the fl ow over a limited perforated interval that is completed from the well bottom in order to mitigate potential CO2 gravity override. Th e sensitivity of various perforated intervals also gives an initial view of CO2 upward velocity for leakage risk assessment.
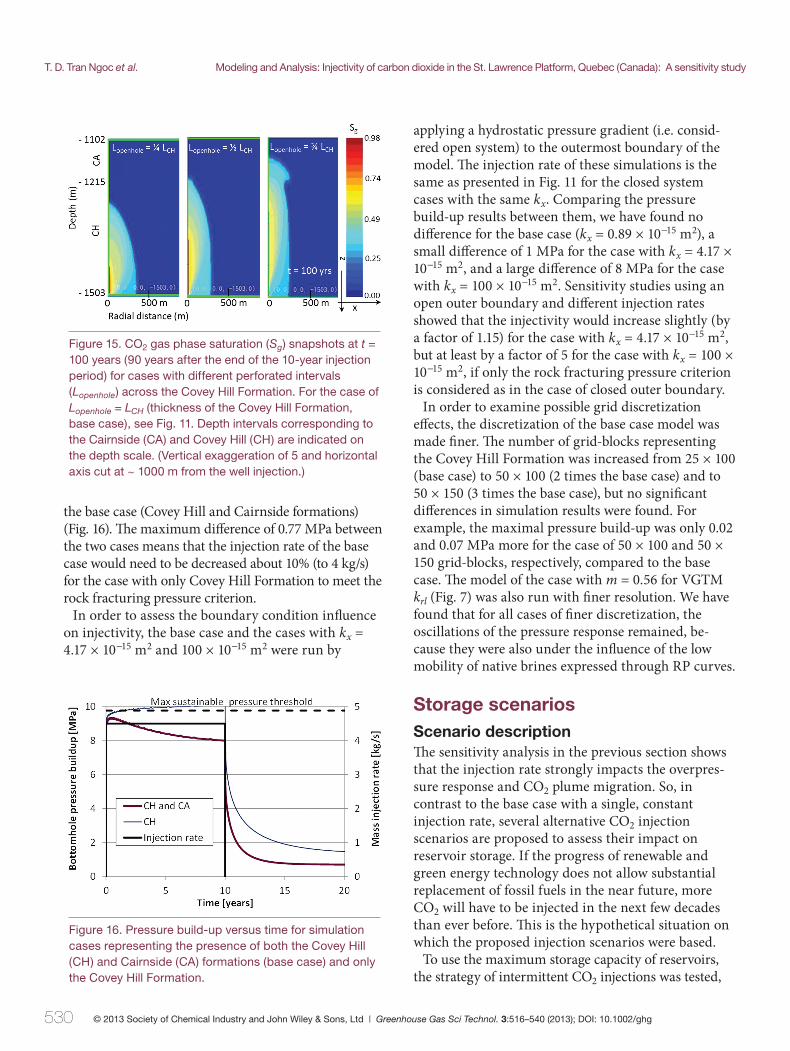
Figure 14 shows the overpressure diff erence at the well bottom for cases with completion intervals of ¼, ½, ¾ and the entire Covey Hill thickness (base case), and Fig. 15 shows the gas-phase saturation distribu-tions at 100 years for the partial completion intervals. Comparing the latter two cases, the case with ¾ Covey Hill thickness leads to a pressure that exceeds the sustainable overpressure threshold by about 2 MPa, but the CO2 vertical migration plume in this case is shorter by only 30 m compared to the base case at t = 100 years (compare Fig. 15 and Fig. 12).
Th e injectivity (and thus storage capacity) estimation is infl uenced by the properties of all formation layers, not just those of the storage formation, due to the pressure dissipation of CO2 injection into other units.53 It can be seen that the overpressure of a case using only the Covey Hill Formation (with the same thickness as the Covey Hill Formation in the base case) is greater than that of
Figure 12. CO2 gas phase saturation (Sg) snapshots at t = 100 years (90 years after the end of the 10-year injection period) for cases with different vertical perme-abilities kz of the Covey Hill Formation. Depth intervals corresponding to the Cairnside (CA) and Covey Hill (CH) are indicated on the depth scale. (Vertical exaggeration of 5 and horizontal axis cut at ~ 1000 m from the well injection.)
Figure 13. Pressure build-up versus time for simulation cases using different compressibility coeffi cients cr (Pa–1) for the Covey Hill Formation. The simulation base case used a cr of 2 × 10⁻⁹ Pa–1.
Figure 14. Pressure build-up versus time for simulation cases using different perforated intervals (Lopenhole) with respect to the thickness of the Covey Hill Formation (LCH).
T. D. Tran Ngoc et al. Modeling and Analysis: Injectivity of carbon dioxide in the St. Lawrence Platform, Quebec (Canada): A sensitivity study
530 © 2013 Society of Chemical Industry and John Wiley & Sons, Ltd | Greenhouse Gas Sci Technol. 3:516–540 (2013); DOI: 10.1002/ghg
the base case (Covey Hill and Cairnside formations) (Fig. 16). Th e maximum diff erence of 0.77 MPa between the two cases means that the injection rate of the base case would need to be decreased about 10% (to 4 kg/s) for the case with only Covey Hill Formation to meet the rock fracturing pressure criterion.
In order to assess the boundary condition infl uence on injectivity, the base case and the cases with kx = 4.17 × 10⁻¹⁵ m2 and 100 × 10−15 m2 were run by
applying a hydrostatic pressure gradient (i.e. consid-ered open system) to the outermost boundary of the model. Th e injection rate of these simulations is the same as presented in Fig. 11 for the closed system cases with the same kx. Comparing the pressure build-up results between them, we have found no diff erence for the base case (kx = 0.89 × 10⁻¹⁵ m2), a small diff erence of 1 MPa for the case with kx = 4.17 × 10⁻¹⁵ m2, and a large diff erence of 8 MPa for the case with kx = 100 × 10−15 m2. Sensitivity studies using an open outer boundary and diff erent injection rates showed that the injectivity would increase slightly (by a factor of 1.15) for the case with kx = 4.17 × 10⁻¹⁵ m2, but at least by a factor of 5 for the case with kx = 100 × 10−15 m2, if only the rock fracturing pressure criterion is considered as in the case of closed outer boundary.
In order to examine possible grid discretization eff ects, the discretization of the base case model was made fi ner. Th e number of grid-blocks representing the Covey Hill Formation was increased from 25 × 100 (base case) to 50 × 100 (2 times the base case) and to 50 × 150 (3 times the base case), but no signifi cant diff erences in simulation results were found. For example, the maximal pressure build-up was only 0.02 and 0.07 MPa more for the case of 50 × 100 and 50 × 150 grid-blocks, respectively, compared to the base case. Th e model of the case with m = 0.56 for VGTM krl (Fig. 7) was also run with fi ner resolution. We have found that for all cases of fi ner discretization, the oscillations of the pressure response remained, be-cause they were also under the infl uence of the low mobility of native brines expressed through RP curves.
Storage scenariosScenario descriptionTh e sensitivity analysis in the previous section shows that the injection rate strongly impacts the overpres-sure response and CO2 plume migration. So, in contrast to the base case with a single, constant injection rate, several alternative CO2 injection scenarios are proposed to assess their impact on reservoir storage. If the progress of renewable and green energy technology does not allow substantial replacement of fossil fuels in the near future, more CO2 will have to be injected in the next few decades than ever before. Th is is the hypothetical situation on which the proposed injection scenarios were based.
To use the maximum storage capacity of reservoirs, the strategy of intermittent CO2 injections was tested,
Figure 15. CO2 gas phase saturation (Sg) snapshots at t = 100 years (90 years after the end of the 10-year injection period) for cases with different perforated intervals (Lopenhole) across the Covey Hill Formation. For the case of Lopenhole = LCH (thickness of the Covey Hill Formation, base case), see Fig. 11. Depth intervals corresponding to the Cairnside (CA) and Covey Hill (CH) are indicated on the depth scale. (Vertical exaggeration of 5 and horizontal axis cut at ~ 1000 m from the well injection.)
Figure 16. Pressure build-up versus time for simulation cases representing the presence of both the Covey Hill (CH) and Cairnside (CA) formations (base case) and only the Covey Hill Formation.
Modeling and Analysis: Injectivity of carbon dioxide in the St. Lawrence Platform, Quebec (Canada): A sensitivity study T. D. Tran Ngoc et al.
531© 2013 Society of Chemical Industry and John Wiley & Sons, Ltd | Greenhouse Gas Sci Technol. 3:516–540 (2013); DOI: 10.1002/ghg
putting off for now any consideration of where captured CO2 would be sent during the non-injection periods. Th e injection rates and durations were estimated so that the induced aquifer pressures would not only be limited to the maximum sustainable pressure threshold of 0.9 Shmin = 1.5 Pp_initial within the injection periods,58 but also would not exceed 1.3 Pp_initial in the non-injection periods and post-injection phase. Th is 1.3 – 1.5 Pp_initial value is used as the maximum injecting pressure by French engineers.14 We imposed this criterion to control the aquifer pressure since there were several injection periods within a long time frame. However, in our study 1.3 Pp_initial was considered as a limit for maximal pressure at the injection well bottom during
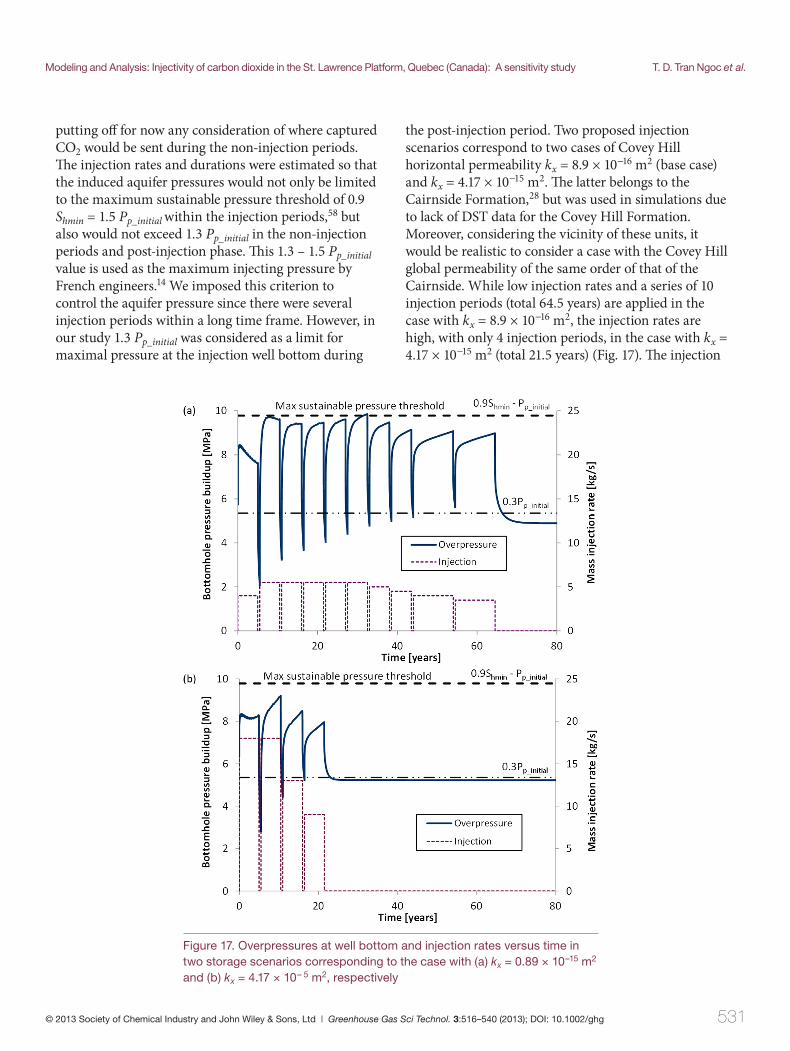
the post-injection period. Two proposed injection scenarios correspond to two cases of Covey Hill horizontal permeability kx = 8.9 × 10⁻¹⁶ m2 (base case) and kx = 4.17 × 10⁻¹⁵ m2. Th e latter belongs to the Cairnside Formation,28 but was used in simulations due to lack of DST data for the Covey Hill Formation. Moreover, considering the vicinity of these units, it would be realistic to consider a case with the Covey Hill global permeability of the same order of that of the Cairnside. While low injection rates and a series of 10 injection periods (total 64.5 years) are applied in the case with kx = 8.9 × 10⁻¹⁶ m2, the injection rates are high, with only 4 injection periods, in the case with kx = 4.17 × 10⁻¹⁵ m2 (total 21.5 years) (Fig. 17). Th e injection
Figure 17. Overpressures at well bottom and injection rates versus time in two storage scenarios corresponding to the case with (a) kx = 0.89 × 10⁻¹⁵ m2 and (b) kx = 4.17 × 10– 5 m2, respectively
T. D. Tran Ngoc et al. Modeling and Analysis: Injectivity of carbon dioxide in the St. Lawrence Platform, Quebec (Canada): A sensitivity study
532 © 2013 Society of Chemical Industry and John Wiley & Sons, Ltd | Greenhouse Gas Sci Technol. 3:516–540 (2013); DOI: 10.1002/ghg
pressure limits were verifi ed not only for the bottom of the injection well (Fig. 17), but also for the top of the perforated interval (not shown here), because the formation pressure induced by CO2 injection does not have the same slope as the Shmin gradient. Th e injection periods are 5 or 10 years long (Fig. 17), and the rest period between intermittent injection periods is 0.5 years in both cases. It is not surprising that the cumula-tive injected CO2 mass is in the same order of magni-tude regardless of the injection scenarios, considering the intrinsic storage capacity of the reservoir site.
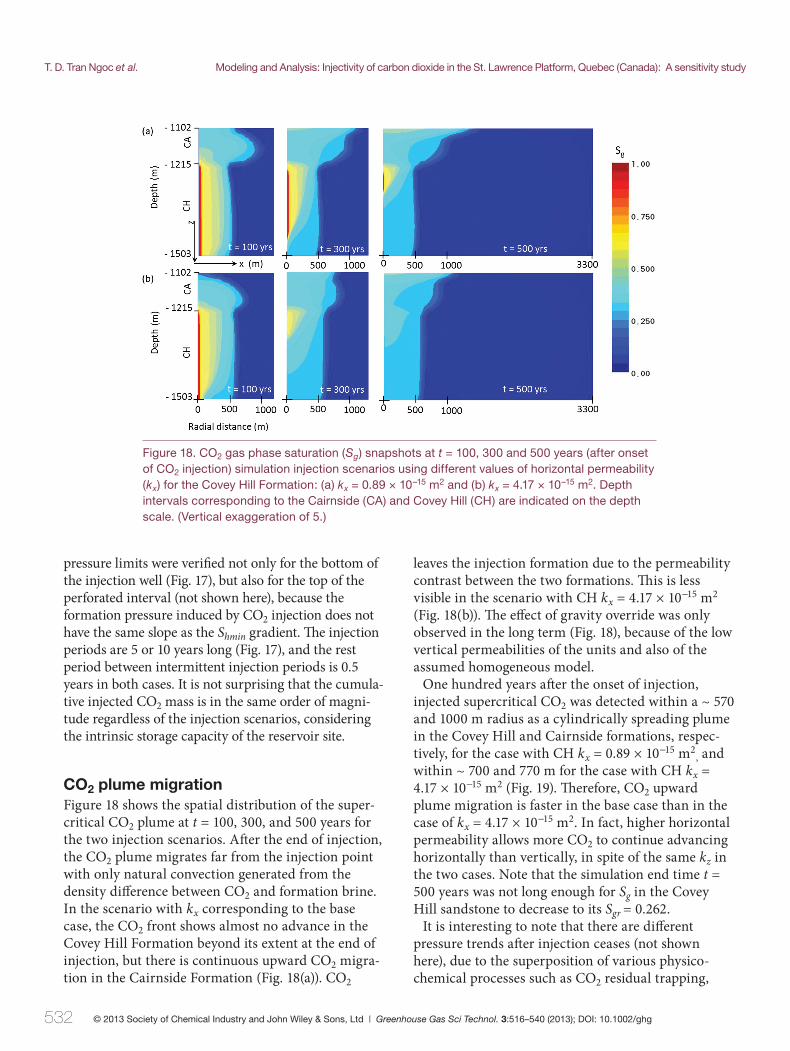
CO2 plume migration Figure 18 shows the spatial distribution of the super-critical CO2 plume at t = 100, 300, and 500 years for the two injection scenarios. Aft er the end of injection, the CO2 plume migrates far from the injection point with only natural convection generated from the density diff erence between CO2 and formation brine. In the scenario with kx corresponding to the base case, the CO2 front shows almost no advance in the Covey Hill Formation beyond its extent at the end of injection, but there is continuous upward CO2 migra-tion in the Cairnside Formation (Fig. 18(a)). CO2
leaves the injection formation due to the permeability contrast between the two formations. Th is is less visible in the scenario with CH kx = 4.17 × 10⁻¹⁵ m2 (Fig. 18(b)). Th e eff ect of gravity override was only observed in the long term (Fig. 18), because of the low vertical permeabilities of the units and also of the assumed homogeneous model.
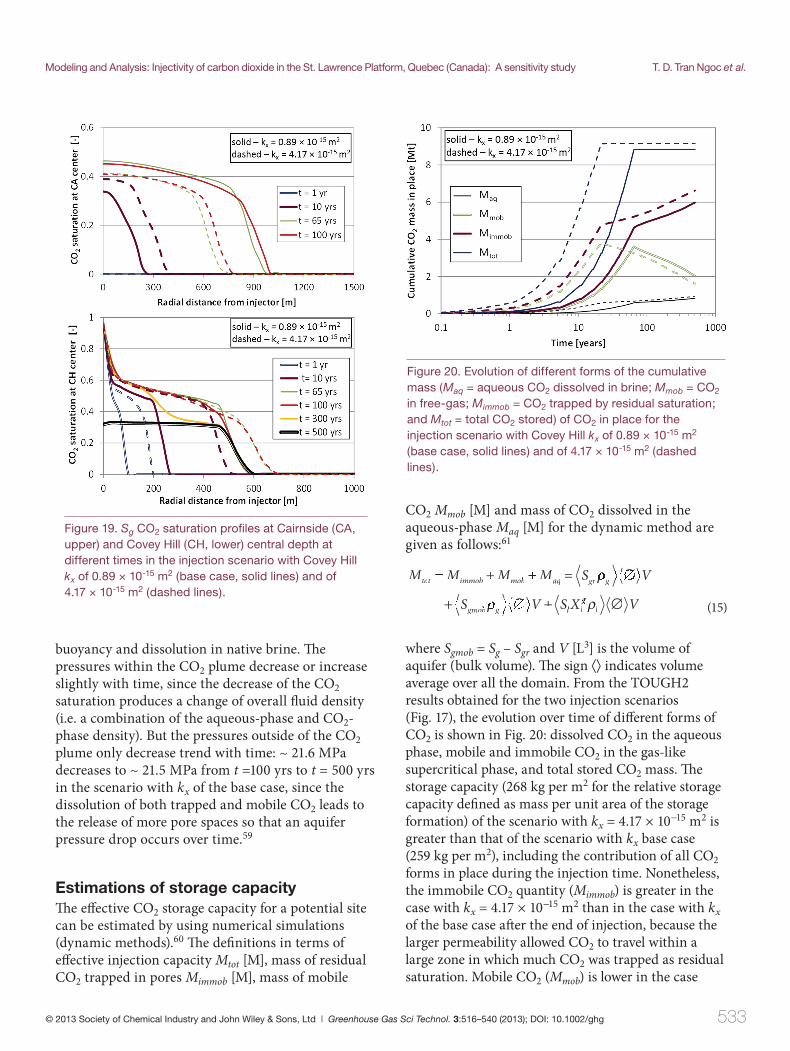
One hundred years aft er the onset of injection, injected supercritical CO2 was detected within a ~ 570 and 1000 m radius as a cylindrically spreading plume in the Covey Hill and Cairnside formations, respec-tively, for the case with CH kx = 0.89 × 10⁻¹⁵ m2
, and within ~ 700 and 770 m for the case with CH kx = 4.17 × 10⁻¹⁵ m2 (Fig. 19). Th erefore, CO2 upward plume migration is faster in the base case than in the case of kx = 4.17 × 10⁻¹⁵ m2. In fact, higher horizontal permeability allows more CO2 to continue advancing horizontally than vertically, in spite of the same kz in the two cases. Note that the simulation end time t = 500 years was not long enough for Sg in the Covey Hill sandstone to decrease to its Sgr = 0.262.
It is interesting to note that there are diff erent pressure trends aft er injection ceases (not shown here), due to the superposition of various physico-chemical processes such as CO2 residual trapping,
Figure 18. CO2 gas phase saturation (Sg) snapshots at t = 100, 300 and 500 years (after onset of CO2 injection) simulation injection scenarios using different values of horizontal permeability (kx) for the Covey Hill Formation: (a) kx = 0.89 × 10⁻¹⁵ m2 and (b) kx = 4.17 × 10⁻¹⁵ m2. Depth intervals corresponding to the Cairnside (CA) and Covey Hill (CH) are indicated on the depth scale. (Vertical exaggeration of 5.)
Modeling and Analysis: Injectivity of carbon dioxide in the St. Lawrence Platform, Quebec (Canada): A sensitivity study T. D. Tran Ngoc et al.
533© 2013 Society of Chemical Industry and John Wiley & Sons, Ltd | Greenhouse Gas Sci Technol. 3:516–540 (2013); DOI: 10.1002/ghg
buoyancy and dissolution in native brine. Th e pressures within the CO2 plume decrease or increase slightly with time, since the decrease of the CO2 saturation produces a change of overall fl uid density (i.e. a combination of the aqueous-phase and CO2-phase density). But the pressures outside of the CO2 plume only decrease trend with time: ~ 21.6 MPa decreases to ~ 21.5 MPa from t =100 yrs to t = 500 yrs in the scenario with kx of the base case, since the dissolution of both trapped and mobile CO2 leads to the release of more pore spaces so that an aquifer pressure drop occurs over time.59
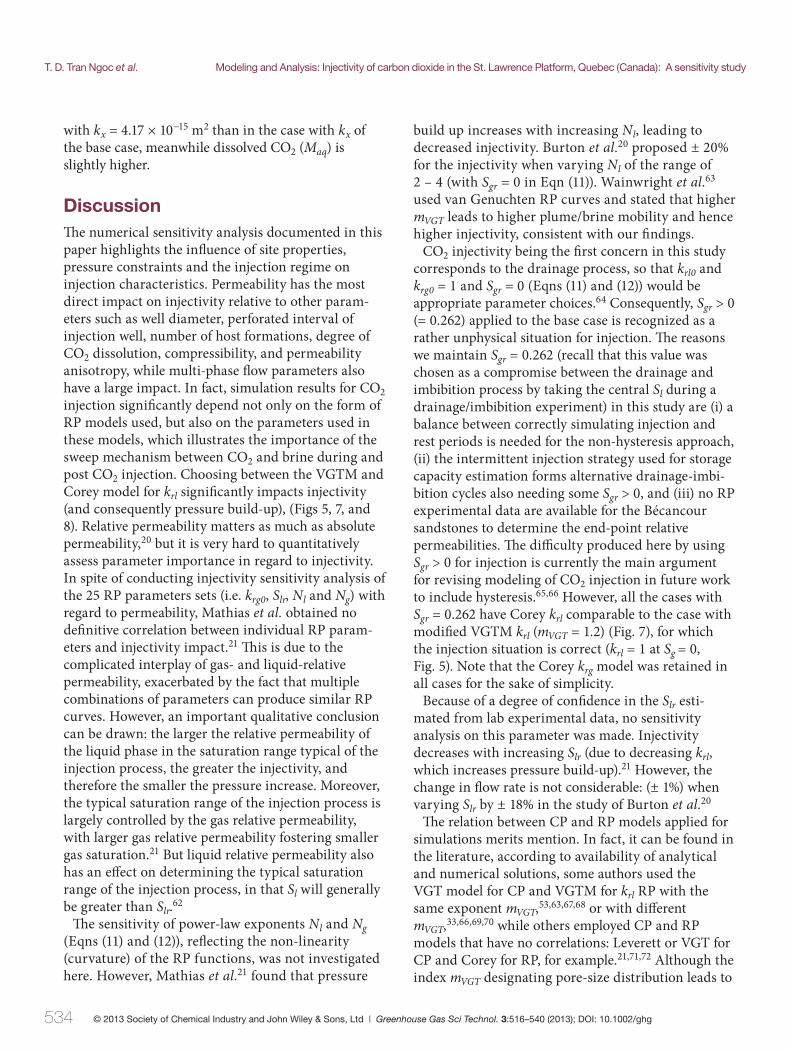
Estimations of storage capacityTh e eff ective CO2 storage capacity for a potential site can be estimated by using numerical simulations (dynamic methods).60 Th e defi nitions in terms of eff ective injection capacity Mtot [M], mass of residual CO2 trapped in pores Mimmob [M], mass of mobile
CO2 Mmob [M] and mass of CO2 dissolved in the aqueous-phase Maq [M] for the dynamic method are given as follows:61
M M M M S V
V S X
tot immob mM ob aq gr g
gmob lSg V l
+MiM mmob + =Maq ∅
+ ∅Sgmob g +
ρ
ρ ggl Vρ ∅
(15)
where Sgmob = Sg – Sgr and V [L3] is the volume of aquifer (bulk volume). Th e sign ⟨⟩ indicates volume average over all the domain. From the TOUGH2 results obtained for the two injection scenarios (Fig. 17), the evolution over time of diff erent forms of CO2 is shown in Fig. 20: dissolved CO2 in the aqueous phase, mobile and immobile CO2 in the gas-like supercritical phase, and total stored CO2 mass. Th e storage capacity (268 kg per m2 for the relative storage capacity defi ned as mass per unit area of the storage formation) of the scenario with kx = 4.17 × 10⁻¹⁵ m2 is greater than that of the scenario with kx base case (259 kg per m2), including the contribution of all CO2 forms in place during the injection time. Nonetheless, the immobile CO2 quantity (Mimmob) is greater in the case with kx = 4.17 × 10⁻¹⁵ m2 than in the case with kx of the base case aft er the end of injection, because the larger permeability allowed CO2 to travel within a large zone in which much CO2 was trapped as residual saturation. Mobile CO2 (Mmob) is lower in the case
Figure 19. Sg CO2 saturation profi les at Cairnside (CA, upper) and Covey Hill (CH, lower) central depth at different times in the injection scenario with Covey Hill kx of 0.89 × 10⁻¹⁵ m2 (base case, solid lines) and of 4.17 × 10⁻¹⁵ m2 (dashed lines).
Figure 20. Evolution of different forms of the cumulative mass (Maq = aqueous CO2 dissolved in brine; Mmob = CO2 in free-gas; Mimmob = CO2 trapped by residual saturation; and Mtot = total CO2 stored) of CO2 in place for the injection scenario with Covey Hill kx of 0.89 × 10⁻¹⁵ m2 (base case, solid lines) and of 4.17 × 10⁻¹⁵ m2 (dashed lines).
T. D. Tran Ngoc et al. Modeling and Analysis: Injectivity of carbon dioxide in the St. Lawrence Platform, Quebec (Canada): A sensitivity study
534 © 2013 Society of Chemical Industry and John Wiley & Sons, Ltd | Greenhouse Gas Sci Technol. 3:516–540 (2013); DOI: 10.1002/ghg
with kx = 4.17 × 10⁻¹⁵ m2 than in the case with kx of the base case, meanwhile dissolved CO2 (Maq) is slightly higher.
DiscussionTh e numerical sensitivity analysis documented in this paper highlights the infl uence of site properties, pressure constraints and the injection regime on injection characteristics. Permeability has the most direct impact on injectivity relative to other param-eters such as well diameter, perforated interval of injection well, number of host formations, degree of CO2 dissolution, compressibility, and permeability anisotropy, while multi-phase fl ow parameters also have a large impact. In fact, simulation results for CO2 injection signifi cantly depend not only on the form of RP models used, but also on the parameters used in these models, which illustrates the importance of the sweep mechanism between CO2 and brine during and post CO2 injection. Choosing between the VGTM and Corey model for krl signifi cantly impacts injectivity (and consequently pressure build-up), (Figs 5, 7, and 8). Relative permeability matters as much as absolute permeability,20 but it is very hard to quantitatively assess parameter importance in regard to injectivity. In spite of conducting injectivity sensitivity analysis of the 25 RP parameters sets (i.e. krg0, Slr, Nl and Ng) with regard to permeability, Mathias et al. obtained no defi nitive correlation between individual RP param-eters and injectivity impact.21 Th is is due to the complicated interplay of gas- and liquid-relative permeability, exacerbated by the fact that multiple combinations of parameters can produce similar RP curves. However, an important qualitative conclusion can be drawn: the larger the relative permeability of the liquid phase in the saturation range typical of the injection process, the greater the injectivity, and therefore the smaller the pressure increase. Moreover, the typical saturation range of the injection process is largely controlled by the gas relative permeability, with larger gas relative permeability fostering smaller gas saturation.21 But liquid relative permeability also has an eff ect on determining the typical saturation range of the injection process, in that Sl will generally be greater than Slr.62
Th e sensitivity of power-law exponents Nl and Ng (Eqns (11) and (12)), refl ecting the non-linearity (curvature) of the RP functions, was not investigated here. However, Mathias et al.21 found that pressure
build up increases with increasing Nl, leading to decreased injectivity. Burton et al.20 proposed ± 20% for the injectivity when varying Nl of the range of 2 – 4 (with Sgr = 0 in Eqn (11)). Wainwright et al.63 used van Genuchten RP curves and stated that higher mVGT leads to higher plume/brine mobility and hence higher injectivity, consistent with our fi ndings.
CO2 injectivity being the fi rst concern in this study corresponds to the drainage process, so that krl0 and krg0 = 1 and Sgr = 0 (Eqns (11) and (12)) would be appropriate parameter choices.64 Consequently, Sgr > 0 (= 0.262) applied to the base case is recognized as a rather unphysical situation for injection. Th e reasons we maintain Sgr = 0.262 (recall that this value was chosen as a compromise between the drainage and imbibition process by taking the central Sl during a drainage/imbibition experiment) in this study are (i) a balance between correctly simulating injection and rest periods is needed for the non-hysteresis approach, (ii) the intermittent injection strategy used for storage capacity estimation forms alternative drainage-imbi-bition cycles also needing some Sgr > 0, and (iii) no RP experimental data are available for the Bécancour sandstones to determine the end-point relative permeabilities. Th e diffi culty produced here by using Sgr > 0 for injection is currently the main argument for revising modeling of CO2 injection in future work to include hysteresis.65,66 However, all the cases with Sgr = 0.262 have Corey krl comparable to the case with modifi ed VGTM krl (mVGT = 1.2) (Fig. 7), for which the injection situation is correct (krl = 1 at Sg = 0, Fig. 5). Note that the Corey krg model was retained in all cases for the sake of simplicity.
Because of a degree of confi dence in the Slr esti-mated from lab experimental data, no sensitivity analysis on this parameter was made. Injectivity decreases with increasing Slr (due to decreasing krl, which increases pressure build-up).21 However, the change in fl ow rate is not considerable: (± 1%) when varying Slr by ± 18% in the study of Burton et al.20
Th e relation between CP and RP models applied for simulations merits mention. In fact, it can be found in the literature, according to availability of analytical and numerical solutions, some authors used the VGT model for CP and VGTM for krl RP with the same exponent mVGT,53,63,67,68 or with diff erent mVGT,33,66,69,70 while others employed CP and RP models that have no correlations: Leverett or VGT for CP and Corey for RP, for example.21,71,72 Although the index mVGT designating pore-size distribution leads to
Modeling and Analysis: Injectivity of carbon dioxide in the St. Lawrence Platform, Quebec (Canada): A sensitivity study T. D. Tran Ngoc et al.
535© 2013 Society of Chemical Industry and John Wiley & Sons, Ltd | Greenhouse Gas Sci Technol. 3:516–540 (2013); DOI: 10.1002/ghg
a physical interpretation for the curvatures of both RP and CP functions, using diff erent m values might provide better fi ts to experimental data.
Similar to the mVGT parameter, the same value of Sgr can exist or not in both CP and RP models according to the associated applications of Eqns (5)–(13). Unfor-tunately, the BC CP model at diff erent Sgr was not tested with the Corey RP used in simulations to enable quantifying its impact on injectivity. In any event, it can be seen that Sgr in the RP models plays a key role on behavior of injected CO2 regardless of the CP model used (Fig. 9). Again, we need to include the hysteresis eff ects in future work in order to properly represent the important role of Sgr in the CO2 injec-tion and sequestration processes.
Although certain CP functions are better calibrated to experimental data than others (Fig. 4 and Table 3), the choice among these CP models has no infl uence on injectivity. However, it does have a small infl uence on the amount of CO2 dissolution in brine (Case 3 vs. Case 4, Fig. 9 (b)) which can be explained by the fact that the CO2 plume is slightly larger and has mi-grated slightly farther into the overlying CA Forma-tion for Case 3 (with VGT CP) than for Case 4 (with TRUST CP) (more CO2 spreading, more CO2-brine contact area, more dissolution). Th e steep slope between Pcap = 0 at Sl = 1 and the plateau of the entry pressure P0 for the VGT model should lead to a smaller CO2 dissolution than for the more gradual slope of the TRUST model,73 but for our considered study this eff ect is small compared to enhanced migration into the CA Formation for Case 3 (not shown here).
Th e capillary pressure increases with IFT and hence with the salinity.45 Furthermore, the increase of the salinity hinders brine displacement (because of greater viscosity) and CO2 dissolution (the salting-out eff ect), and may cause permeability loss due to salt precipitation.19,21 Consequently, injectivity will decrease due to the increase of capillary pressure and decreased effi ciency of other physical chemistry phenomena. If the CH salinity increases as much as twice (= CA salinity), the CO2 injection rate would be reduced ~ 15% and this rate would be decreased signifi cantly (30%) in the case where the CH salinity is three times greater than the base case salinity.
Th e relation between pressure build-up and injectiv-ity may be expressed by the power law I = 26.058 × ΔP−0.818 (I [kg/s] and ΔP [MPa]) deduced from data on kx sensitivity, Fig. 11. Th is relationship could be useful
for rapidly assessing injectivity from pressure build-up produced by a given group of Bécancour reservoir properties. Th e permeability contrast between kx and kz at the site favors preferential horizontal fl ow and impedes the upward migration of CO2. Th e injection rate is insensitive to this permeability anisotropy. From the point of view of security relative to the risk of CO2 leakage, a compromise is needed between the completion interval and the injection rate in relation to vertical permeability.
In this study, we did not investigate sensitivity to the Cairnside parameters, particularly its permeability. Also, we did not study CO2 injection in this formation whose permeability could be higher or lower than the Covey Hill permeability, because there are some disadvantages to CO2 sequestration for its depth, porosity, temperature and salinity, compared with the Covey Hill Formation. For instance, Cairnside kx > Covey Hill kx allowed the CO2 plume to migrate up out of the Covey Hill Formation aft er the end of injections. Th e uncertainty of Covey Hill global permeability leads to a possible alternative scenario in choosing injection formations. If the Covey Hill kx were signifi cantly lower than Cairnside kx, CO2 injectivity would be improved if injection were done into the Cairnside sandstone or both Cairnside and Covey Hill sandstones with certain well completions. But this calls for an integral assessment of advantages (injectivity-storage capacity increase) vs. disadvan-tages (leakage-security level). In fact, the depth of the Cairnside Formation (1102 ± 101 m,30) may not totally provide the supercritical state environment of CO2 due to the cold reservoir temperature gradient (23.5 ± 0.6 °C/km, see in Tran Ngoc et al.28).74 Th e CO2 in the vicinity of the injection well would be supercritical during the injection period. Aft er that, CO2 could rise up to the other units with diff erent phases. Hence, the TOUGH2/ECO2M model, which handles sub-critical phase changes would have to be used, whereas inject-ing in the Covey Hill, supercritical CO2 is ensured at all time in the model with the Cairnside depth considered in this study (1102 m).75 Moreover, greater Cairnside permeability leads to a faster vertical CO2 plume migration. In the case of CO2 injection into the Cairnside sandstone with kx = 8.9 × 10⁻¹⁵ m2 (assume that injected CO2 is pre-heated in order to retain the supercritical state in the formation), preliminary simulation results have shown that injectivity is only improved if the well completion ranges from at least half to the entire formation thickness. Th is injectivity
T. D. Tran Ngoc et al. Modeling and Analysis: Injectivity of carbon dioxide in the St. Lawrence Platform, Quebec (Canada): A sensitivity study
536 © 2013 Society of Chemical Industry and John Wiley & Sons, Ltd | Greenhouse Gas Sci Technol. 3:516–540 (2013); DOI: 10.1002/ghg
is 1.5 – 2.5 times greater than that of the base case. Keep in mind that the CO2 migrates very fast to the top formation within the injection period (results not shown here).
In the present study, homogeneous formations were assumed by considering an averaged value of porosity and permeability in both the matrix and micro-frac-ture domain. For more advanced studies, a double-porosity model describing two overlapping domains of matrix and fractures, equivalent to the Bécancour reservoir, should be applied.76−78 It is clear that greater rock compressibility plays a more important role in aquifer pressure response, especially for a high permeability closed reservoir.21 However, the possible range of the CH rock compressibility does not greatly infl uence injectivity (moderate sensitivity) due to the low permeability of the bounded Bécancour reservoir (Fig. 13).
Although a completion interval smaller than the Covey Hill thickness would increase site security (Fig. 15), the entire Covey Hill thickness should be perforated to improve injectivity, which is propor-tional to the product of k h. Because the aquifer units (~ 300 m thick) of the Bécancour site other than the Potsdam Group can be considered as buff er units, these would be physical/structural traps along with the caprock units (> 800 m thick).
Th e proposed injection scenarios were based on kx. It can be seen that higher kx leads to the injectivity project becoming more feasible. Th e injection strategy with intermittent and step-rates was applied in two proposed injection scenarios representing two cases: 1) kx < 1 × 10⁻¹⁵ m2 with long injection duration, and 2) kx > 1 × 10⁻¹⁵ m2 with short injection duration. Th e imposed lower pressure limit 1.3 Pp_initial lets us control the aquifer pressure in the multiphase realm aft er the injection. Th e radial plume of injected CO2 extended less than 1.2 km around the injection well. Th e total amount of CO2 injection was in the order of 10 Mt for the two scenarios, which could be equiva-lent to regional emissions for a period of ten years (CO2 regional emission of 1Mt per year). Th us, the present geological sequestration option might con-sume about 15 – 50% of regional yearly CO2 emissions in the fi rst few decades from the start of injection. Th is entire annual Bécancour emission would be hosted in its deep saline aquifers by using vertical and/or horizontal multi-injectors, such as deployed at the In Salah site whose injection formation has a low permeability (5 × 10⁻¹⁵ m2).79
One hundred years aft er start of injection, the amount of injected CO2 stored was 7% CO2 dissolved in brine, 33 – 37% CO2 in free-gas and up to 56 – 60% CO2 trapped in capillary pores for two cases of kx. In spite of clear kx diff erences, the ratios of stored CO2 forms are not much diff erent aft er the end of injec-tion. It can be observed that CO2 dissolved in brine and CO2 trapped in capillary pores increases over time, while CO2 in free-gas decreases without taking into account mineralisation (Fig. 20). Th is leads to increased storage security over time in terms of geomechanical risks.5,59 Th e decrease in pressure build-up over time also contributes to security. Even though this pressure decrease is not very great, it should be noted. Finally, a priori from a technical point of view, the CO2 injectivity and storage capacity can be nicely improved for CO2 sequestration perfor-mance in the lower southeastern sub-reservoir (block in the south of the Yamaska fault in which the Pots-dam Group is located at the depth of more than 2.3 km),28,80 by increasing the maximum sustainable injection pressure threshold corresponding to the depth increase of the Covey Hill Formation from 2.3 to 2.7 km.18
ConclusionsTh e sensitivity study of CO2 injection in the deep saline aquifers of the Bécancour area (Québec) was carried out using TOUGH2 2D radial simulations in which the injectivity and storage capacity estimates were investigated by a parameter sensitivity study and by examining alternative injection scenarios. Th ese are the fi rst numerical simulations showing supercriti-cal CO2 behavior injected in the St. Lawrence Low-lands deep saline aquifers. Th is study also provides a base for two ongoing studies: a geomechanical study to assess the potential for seismicity induced by injection and an assessment of the CO2 leakage risk.
Th is work provides the qualitative and quantitative sensitivity focusing on the injection pressure for the CO2 injection rate of the Bécancour site that is close to the fi ndings of previous generic research. Th e sensitiv-ity analysis also pointed out the limitations of available data sets. Th e hydrodynamic parameters aff ecting the non-linear behavior of CO2 injection in the Bécancour brine reservoir are highly uncertain. A comprehensive discussion on the validity of the capillary pressure and relative permeability mathematical models for real systems is beyond the scope of this work. Instead,
Modeling and Analysis: Injectivity of carbon dioxide in the St. Lawrence Platform, Quebec (Canada): A sensitivity study T. D. Tran Ngoc et al.
537© 2013 Society of Chemical Industry and John Wiley & Sons, Ltd | Greenhouse Gas Sci Technol. 3:516–540 (2013); DOI: 10.1002/ghg
commonly used capillary pressure and relative perme-ability models were applied to determine the sensitiv-ity to their parameters. Th e uncertainty in the capil-lary pressure models has less infl uence on injectivity than uncertainty in the relative permeability models. While capillary pressure curves are oft en easily fi tted to available lab data, reliable relative permeability curves are extremely scarce. Th erefore, the application of relative permeability model seems doubly uncertain (functional form and parameters). Among hydrogeo-logical, petrophysical, and geometric parameters, the uncertainty of the permeability has the most signifi -cant infl uence on assessing the CO2 injection in the Potsdam sandstones of the Bécancour saline reservoir. For a pilot project at this site, the CO2 injection can be carried out at a rate of the order of 1 kg/s. For a larger scale project, the injectivity varies from 4 to 18 kg/s per well during about 60 years (for the lower perme-ability of the order of 1 × 10⁻¹⁵ m2) and 20 years (for the higher permeability of the order of 5 × 10⁻¹⁵ m2). Th e estimated storage capacity is of about 10 Mt of CO2 in the northeastern reservoir of the Bécancour region. Th e simulations in this study, which were done under the closed boundary conditions, are expected to be valid for the Covey Hill permeability range of 1 × 10⁻¹⁵ – 10 × 10−15 m2. However, if global permeability is higher than this, the actual system behavior could be somewhere in between the closed boundary case and the hydrostatic pressure boundary case, and that might be a more optimistic conclusion for CO2 storage. Uncertainty will be substantially reduced for the injection characteristics, when the global perme-ability of the Covey Hill Formation is better under-stood by establishing fi eld measurements. Also, the relative permeability curves should be established from laboratory measurement data. Th e Covey Hill salinity is not as important as the permeability, but should be confi rmed by more fi eld measurements for the CO2 injection effi ciency assessment. If salinity were several times (3 times, for example) greater than the base case value, all the results presented in this paper might need to be revised.
A heterogeneous hydrodynamic model for the Bécancour reservoir will be developed on the basis of new data, especially the hydrogeology and petrophysi-cal properties of caprocks. Finally, the other processes involved in multiphase fl ow and transport, such as capillary hysteresis, permeability modifi cation, and diff usion-dispersion, not yet taken into account in this study are planned for future research.
AcknowledgementsTh e authors would like to acknowledge Th e Ministère du Développement durable, de l’Environnement et des Parcs du Québec (MDDEPQ) who fi nanced this research in the framework of the Québec research chair on CO2 geological sequestration. We wish to acknowledge the anonymous reviewers as well as the Editor-in-Chief for their detailed comments and suggestions during the review process, which rein-forced the quality of the manuscript. Th e paper is the result of the collaboration between the INRS-ETE and LNBL under agreement n° WF007555.
References 1. Marshall M and Brahic C, Climate’s dark dawn. New Sci
212(2841):6–7 (2011).
2. GIEC, Bilan 2007 des changements climatiques. Contribution des Groupes de travail I, II et III au quatrième Rapport d’évaluation du Groupe d’experts intergouvernemental sur l’évolution du climat [Équipe de rédaction principale, Pachauri RK et Reisinger A (publié sous la direction de ~)]. GIEC, Genève, Suisse, pp. 103 (2007).
3. Kintisch E. Science-AAAS. [Online]. Available at: http://news.sciencemag.org/sciencenow/2011/04/un-goal-of-limiting-global-warmi.html [10 March 2013].
4. Henson R, Warming World: Impacts by Degree. The National Academy of Sciences, Washington, DC, pp. 40 (2011).
5. IPCC, Intergovernmental Panel on Climate Change (IPCC) Special Report on Carbon Dioxide Capture and Storage, ed by Metz B, Davidson O, de Coninck HC, Loos M and Mayer LA. Cambridge University Press, Cambridge and New York, pp. 431 (2005).
6. Chadwick RA, Arts R, Bernstone C, May F, Thibeau S and Zweigel P, Best Practice for the Storage of CO2 in Saline Aquifers, occasional publication no 14. British Geological Survey, Keyworth, Nottingham, pp. 277 (2008).
7. Riddiford FA, Tourqui A, Bishop CD, Taylor B and Smith M, A cleaner development: The In Salah Gas project, Algeria, in Greenhouse Gas Control Technologies, ed by Gale J and Kaya Y. Pergamon, Amsterdam, pp. 595–600 (2003).
8. Hovorka S, Testing effi ciency of CO2 storage in the subsur-face: Frio Brine pilot project, in 7th International Conference on Greenhouse Gas Control Technologies, Vol 2, ed by Rubin ES, Keith DW, and Gilboy CF. Elsevier, Oxford, pp. 1361–1366 (2005).
9. Martens S, Kempka T, Liebscher A, Luth S, Moller F, Myrttinen A et al., Europe’s longest-operating on-shore CO2 storage site at Ketzin, Germany: A progress report after three years of injection. Environ Earth Sci 67(2):323–334 (2012).
10. Pruess K, Modeling carbon sequestration in saline aquifers, in Forum on Carbon Sequestration. Yale University, New Haven, CT (2006).
11. Keating GN, Middleton RS, Viswanathan HS, Stauffer PH and Pawar RJ, How storage uncertainty will drive CCS infrastruc-ture. Energ Procedia 4:2393–2400 (2011).
12. Nordbotten JM, Flemisch B, Gasda SE, Nilsen HM, Fan Y, Pickup GE et al., Uncertainties in practical simulation of CO2 storage. Int J Greenhouse Gas Control 9:234–242 (2012).
T. D. Tran Ngoc et al. Modeling and Analysis: Injectivity of carbon dioxide in the St. Lawrence Platform, Quebec (Canada): A sensitivity study
538 © 2013 Society of Chemical Industry and John Wiley & Sons, Ltd | Greenhouse Gas Sci Technol. 3:516–540 (2013); DOI: 10.1002/ghg
13. Rutqvist J, Birkholzer J, Cappa F and Tsang CF, Estimating maximum sustainable injection pressure during geological sequestration of CO2 using coupled fl uid fl ow and geome-chanical fault-slip analysis. Energ Convers Manage 48(6):1798–1807 (2007).
14. De Silva PNK and Ranjith PG, A study of methodologies for CO2 storage capacity estimation of saline aquifers. Fuel 93(1):13–27 (2012).
15. Ghaderia SM, Keitha DW and Leonenkob Y, Feasibility of injecting large volumes of CO2 into aquifers. Energ Procedia 1:3113–3120 (2009).
16. Mathias SA, González Martínez de Miguel GJ, Thatcher KE and Zimmerman RW, Pressure build-up during CO2 injection into a closed brine aquifer. Transport Porous Med 89(3):383–397 (2011).
17. Okwen R, Stewart M and Cunningham J, Effect of well orientation (vertical vs. horizontal) and well length on the injection of CO2 in deep saline aquifers. Transport Porous Med 90(1):219–232 (2011).
18. Wiese B, Nimtz M, Klatt M and Kuhn M, Sensitivities of injection rates for single well CO2 injection into saline aquifers. Chem Erde-Geochem 70:165–172 (2010).
19. Kumar A, Noh M, Pope GA, Sepehrnoori K, Bryant S and Lake LW, Resevoir simulation of CO2 storage in deep salin aquifers, SPE/DOE 14th Symposium on Improved Oil Recovery, 17–21 April, Tulsa, Oklahoma, USA (2004).
20. Burton M, Kumar N and Bryant SL, CO2 injectivity into brine aquifers: Why relative permeability matters as much as absolute permeability. Energ Procedia 1(1):3091–3098 (2009).
21. Mathias SA, Gluyas JG, González Martínez de Miguel GJ, Bryant SL and Wilson D, On relative permeability data uncertainty and CO2 injectivity estimation for brine aquifers. Int J Greenhouse Gas Control 12:200–212 (2013).
22. Bachu S and Bennion B, Effects of in-situ conditions on relative permeability characteristics of CO2-brine systems. Environ Geol 54(8):1707–1722 (2008).
23. Krevor SCM, Pini R, Zuo L and Benson SM, Relative perme-ability and trapping of CO2 and water in sandstone rocks at reservoir conditions. Water Resour Res 48(2):1–16 (2012).
24. Muller N, Supercritical CO2-brine relative permeability experiments in reservoir rocks - Literature review and recom-mendations. Transport Porous Med 87(2):367–383 (2011).
25. Moodie N, McPherson B, Lee SY and Mandalaparty P, Fundamental analysis of heterogeneity and relative perme-ability on CO2 storage and plume migration, in TOUGH Symposium 2012, ed. by Finsterle, Hawkes, Moridis, Mukhopadhyay, Oldenburg, Peiffer et al. Berkeley, California, pp. 689–698 (2012).
26. Malo M and Bédard K, Basin-scale assessment for CO2 storage prospectivity in the Province of Québec, Canada. Energ Procedia 23:487–494 (2012).
27. Tran Ngoc TD, Konstantinovskaya E, Lefebvre R, Malo M and Massé L, Geotechnical characterization of deep saline aquifers for CO2 geological storage in the Bécancour region, Québec, Canada, in Geotechnics for Sustainable Develop-ment-Geotec Ha Noi, ed by Phung DL. Construction Publish-ing House, Ha Noi, Viet Nam, pp. 623–632 (2011).
28. Trân Ngo. c TD, Lefebvre R, Konstantinovskaya E and Malo M, Characterization of deep saline aquifers in the Bécancour area, St. Lawrence Lowlands, Québec, Canada: Implications for CO2 geological storage. Environ Earth Sci (accepted for publication), (2013).
29. Tran Ngoc TD, Konstantinovskaya E, Lefebvre R and Malo M, Caractérisation hydrogéologique et pétrophysique des aquifères salins profonds de la région de Bécancour pour leur potentiel de séquestration géologique du CO2. INRS, Québec, Canada (R-1318, in French), pp. 65 (2011).
30. Claprood M, Gloaguen E, Giroux B, Duchesne MJ, Konstanti-novskaya E and Malo M, Workfl ow using sparse vintage data for building a fi rst geological and reservoir model for CO2 storage in deep saline aquifer. A case study in the St Lawrence Platform, Canada. Greenhouse Gas Sci Technol 2:1–19 (2012).
31. Oldenburg CM, Doughty C, Peters CA and Dobson PF, Simulations of long-column fl ow experiments related to geologic carbon sequestration: Effects of outer wall boundary condition on upward fl ow and formation of liquid CO2. Greenhouse Gas Sci Technol 2(4):279–303 (2012).
32. Niemi A, Bensabat J, Fagerlund F, Sauter M, Ghergut J, Licha T et al. Small-scale CO2 injection into a deep geological formation at Heletz, Israel. Energ Procedia 23:504–511 (2012).
33. Chasset C, Jarsjo J, Erlstrom M, Cvetkovic V and Destouni G, Scenario simulations of CO2 injection feasibility, plume migration and storage in a saline aquifer, Scania, Sweden. Int J Greenhouse Gas Conrol 5(5):1303–1318 (2011).
34. Thériault R, Laliberté JY, Brisebois D and Rheault M, Fingerprinting of the Ottawa-Bonnechère and Saguenay grabens under the St. Lawrence Lowlands and Québec Appalachians: Prime targets for hydrocarbon exploration. Geological Association of Canada, Halifax, Nova Scotia, Abstracts (2005).
35. Globensky Y, Géologie des Basses-Terres du Saint-Laurent (in French). Ministère de l’Énergie et des Ressources du Québec, Québec, pp. 63 (1987).
36. Lavoie D, Diachronous tectonic collapse of the Ordovician Continental-Margin, Eastern Canada - Comparison between the Quebec reentrant and St-Lawrence Promontory. Can J Earth Sci 31(8):1309–1319 (1994).
37. Konstantinovskaya E, Claprood M, Duchesne MJ, Malo M and Lefebvre R, Le potentiel de stockage de CO2 expérimental dans les aquifères salins profonds de Bécancour: Partie I, Analyse des diagraphies et des profi ls sismiques (R-1150, in French). INRS, Québec, Canada, pp. 59 (2010).
38. Konstantinovskaya E, Malo M and Castillo DA, Present-day stress analysis of the St. Lawrence Lowlands sedimentary basin (Canada) and implications for caprock integrity during CO2 injection operations. Tectonophysics 518:119–137 (2012).
39. Hall HN, Compressibility of reservoir rocks. Trans AIME 198:309–311 (1953).
40. Fatt I, Pore volume compressibilities of sandstone reservoir rocks. Petroleum Trans AIME 213:362–364 (1958).
41. Jalalh AA, Compressibility of porous rocks: Part II. New relationships. Acta Geophys 54(4):399–412 (2006).
42. Brooks RH and Corey AT, Hydraulic properties of porous media, Hydrogeology papers. Colorado State University, Fort Collins, Colorado, pp. 27 (1964).
43. van Genuchten MT, A closed-form equation for predicting the hydraulic conductivity of unsaturated soils. Soil Sci Soc Am J 44(5):892–898 (1980).
44. Narasimhan TN, Witherspoon PA and Edwards AL, Numerical model for saturated unsaturated fl ow in deformable porous media, Part 2: The Algorithm. Water Resour Res 14(2):255–261 (1978).
Modeling and Analysis: Injectivity of carbon dioxide in the St. Lawrence Platform, Quebec (Canada): A sensitivity study T. D. Tran Ngoc et al.
539© 2013 Society of Chemical Industry and John Wiley & Sons, Ltd | Greenhouse Gas Sci Technol. 3:516–540 (2013); DOI: 10.1002/ghg
45. Bachu S and Bennion DB, Interfacial tension between CO2, freshwater, and brine in the range of pressure from (2 to 27) MPa, temperature from (20 to 125) °C, and water salinity from (0 to 334 000) mg/L. J Chem Eng Data 54(3):765–775 (2009).
46. Chalbaud C, Robin M, Lombard JM, Martin F, Egermann P and Bertin H, Interfacial tension measurements and wettability evaluation for geological CO2 storage. Adv Water Resour 32(1):98–109 (2009).
47. Land CS, Calculation of imbibition relative permeability for two- and three-phase fl ow from rock properties. SPE J 9:149–156 (1969).
48. Corey AT, The interrelation between gas and oil relative permeabilities. Producers Monthly 19(1):38–41 (1954).
49. Mualem YA, New model for predicting the hydraulic conduc-tivity of unsaturated porous media. Water Resour Res 12(3):513–522 (1976).
50. Pruess K and Garcia J, Multiphase fl ow dynamics during CO2 disposal into saline aquifers. Environ Geol 42(2/3):282–295 (2002).
51. Pruess K, Oldenburg C and Moridis G, TOUGH2 User’s Guide, version 2.0 Lawrence Berkeley National Laboratory, Berkeley, Calif., pp. 210 (1999).
52. Pruess K, ECO2N: A TOUGH2 Fluid Property Module for Mixtures of Water, NaCl, and CO2. Lawrence Berkeley National Laboratory, Berkeley, Calif. pp. 66 (2005).
53. Zhou QL, Birkholzer JT, Tsang CF and Rutqvist J, A method for quick assessment of CO2 storage capacity in closed and semi-closed saline formations. Int J Greenhouse Gas Control 2(4):626–639 (2008).
54. Thunderhead-Engineering, Petrasim User Manual, version 5. Thunderhead Engineering, Manhanttan, KS, pp. 124 (2010).
55. Lopez S and Millot R, Problématique de réinjection des fl uides géothermiques dans un réservoir argilo-gréseux: retour d’expériences et apport de l’étude des fl uides du Trias du Bassin de Paris. Rapport BRGM/RP-5630-FR (in French) Orléans, France, pp. 197 (2008).
56. Barnes DA, Bacon DH and Stephen RK, Geological seques-tration of carbon dioxide in the Cambrian Mount Simon Sandstone: Regional storage capacity, site characterization, and large-scale injection feasibility, Michigan Basin. Environ Geosci 16(3):163–183 (2009).
57. Birkholzer JT and Zhou QL, Basin-scale hydrogeologic impacts of CO2 storage: Capacity and regulatory implications. Int J Greenhouse Gas Control 3(6):745–756 (2009).
58. Thibeau S and Mucha V, Have we overestimated saline aquifer CO2 storage capacities? Oil Gas Sci Technol 66(1):81–92 (2011).
59. Bachu S, CO2 storage in geological media: Role, means, status and barriers to deployment. Prog Energ Combust 34(2):254–273 (2008).
60. Doughty C, Pruess K, Benson SM, Hovorka SD, Knox PR and Green CT, Capacity investigation of brine-bearing sands of the Frio formation for geologic sequestration of CO2, First National Conference on Carbon Sequestration, 14–17 May, U.S. Department of Energy, National Energy Technology Lab, Washington DC (2001).
61. Tran Ngoc TD, Lefebvre R, Malo M and Doughty C, Feasibility of CO2 injection in the deep saline aquifers of the Bécancour region, Québec (Canada), in TOUGH Symposium, ed by Finsterle, Hawkes, Moridis, Mukhopadhyay, Oldenburg, Peiffer et al. Berkeley, Calif., pp. 757–766 (2012).
62. Doughty C, Freifeld BM and Trautz RC, Site characterization for CO2 geologic storage and vice versa: The Frio brine pilot,
Texas, USA as a case study. Environ Geol 54(8):1635–1656 (2008).
63. Wainwright H, Finsterle S, Zhou Q and Birkholzer J, Modeling the performance of large-scale CO2 storage systems: A comparison of different sensitivity analysis methods. NRAP-TRS-III-002-2012; NRAP Technical Report Series. US Department of Energy, National Energy Technology Labora-tory, Morgantown, WV, pp. 24 (2012).
64. Bennion B and Bachu S, Drainage and imbibition CO2/brine relative permeability curves at reservoir conditions for carbonate formations, in SPE Annual Technical Conference and Exhibition, 19–22 September, Florence, Italy (2010).
65. Juanes R, Spiteri EJ, Orr FM and Blunt MJ, Impact of relative permeability hysteresis on geological CO2 storage. Water Resour Res 42(12): 1–13 (2006).
66. Doughty C, Modeling geologic storage of carbon dioxide: Comparison of non-hysteretic and hysteretic characteristic curves. Energ Convers Manage 48(6):1768–1781 (2007).
67. Pruess K and Nordbotten J, Numerical simulation studies of the long-term evolution of a CO2 plume in a saline aquifer with a sloping caprock. Transp Porous Med 90(1):135–151 (2011).
68. Zhang W, Xu TF and Li YL, Modeling of fate and transport of co-injection of H2S with CO2 in deep saline formations. J Geophys Res 116:1–13 (2011).
69. Audigane P, Gaus I, Czernichowski-Lauriol I, Pruess K and Xu TF, Two-dimensional reactive transport modeling of CO2 injection in a saline aquifer at the Sleipner site, North Sea. Am J Sci 307(7):974–1008 (2007).
70. Doughty C, Investigation of CO2 plume behavior for a large-scale pilot test of geologic carbon storage in a saline formation. Transp Porous Med 82(1):49–76 (2010).
71. Mouche E, Hayek M and Mugler C, Upscaling of CO2 vertical migration through a periodic layered porous medium: The capillary-free and capillary-dominant cases. Adv Water Resource 33(9):1164–1175 (2010).
72. Leverett MC, Capillary behavior in porous solids. Trans AIME 142:152–169 (1941).
73. Li B, Tchelepi HA and Benson SM, The infl uence of capillary entry-pressure representation on the rate of CO2 solubility trapping, in TOUGH Symposium, ed by Finsterle, Hawkes, Moridis, Mukhopadhyay, Oldenburg, Peiffer et al. Berkeley, Calif., pp. 664–671 (2012).
74. Nordbotten JM, Celia MA and Bachu S, Injection and storage of CO2 in deep saline aquifers: Analytical solution for CO2 plume evolution during injection. Transp Porous Med 58(3):339–360 (2005).
75. Pruess K, ECO2M: A TOUGH2 fl uid property module for mixtures of water, NaCl, and CO2, including super- and sub-critical conditions, and phase change between liquid and gaseous CO2, Report LBNL-4590E. Lawrence Berkeley National Laboratory, Berkeley, CA (2011).
76. Barenblatt G, Zheltov I and Kochina I, Basic concepts in the theory of seepage of homogeneous liquids in the fi ssured rocks. J Appl Math 24(5):1286–1303 (1960).
77. Lewandowska J, Tran Ngoc TD, Vauclin M and Bertin H, Water drainage in double-porosity soils: Experiments and micro-macro modeling. J Geotech Geoenviron 134(2):231–243 (2008).
78. Tran Ngoc TD, Lewandowska J, Vauclin M and Bertin H, Two-scale modeling of solute dispersion in unsaturated double-porosity media: Homogenization and experimental validation. Int J Numer Anal Met 35(14):1536–1559 (2011).

T. D. Tran Ngoc et al. Modeling and Analysis: Injectivity of carbon dioxide in the St. Lawrence Platform, Quebec (Canada): A sensitivity study
540 © 2013 Society of Chemical Industry and John Wiley & Sons, Ltd | Greenhouse Gas Sci Technol. 3:516–540 (2013); DOI: 10.1002/ghg
79. Michael K, Golab A, Shulakova V, Ennis-King J, Allinson G, Sharma S et al., Geological storage of CO2 in saline aquifers - A review of the experience from existing storage operations. Int J Greenhouse Gas Control 4(4):659–667 (2010).
80. Tran Ngoc TD, Lefebvre R, Malo M and Doughty C, Estimating CO2 storage capacity in saline aquifers: Revisited concept and application to the Bécancour area (Québec, Canada). Geophy. Res. Abstracts 15:EGU2013-3622 (2013).
Tien-Dung Tran Ngoc
Tien Dung (TD) Tran Ngoc is a research associate at INRS-ETE. Switching to earth and environment sciences from a civil engineering background, he is interested in hydrogeology/geotechnical applica-tions. He has worked on CO2 geologic sequestration, geothermic exploitation
and waste landfi ll projects. He has a PhD from the Université de Grenoble, and is a member of Ordre des Ingénieurs du Québec.
Christine Doughty
Christine Doughty is a staff scientist at Lawrence Berkeley National Labora-tory, modeling fl uid and heat fl ow in fractured and porous rock, to study geologic storage of CO2 and nuclear waste, remediation of groundwater and vadose-zone contamination, and exploitation of geothermal and
petroleum reservoirs. She has a PhD in Hydrogeology from the University of California, Berkeley.
René Lefebvre
René Lefebvre is a hydrogeology professor at INRS. His research interests are related to multiphase transfer processes (fl uids, heat, mass) and accompanying geochemical processes. He also makes develop-ments on the characterization and modeling of aquifer systems. He holds
an MSc in Geochemistry from the University of Calgary and a PhD in Hydrogeology from Laval University.
Michel Malo
Michel Malo is a professor at INRS and the chairholder of the Research Chair on CO2 geological storage. He specializes in structural geology and Appalachian geology. He is also interested in natural resources contained in sedimentary rocks (hydrocarbon reservoirs and ore
deposits) and, more recently, the geological storage of CO2. He holds a PhD in Geology from Université de Montréal.