inhibitors to rail carload and intermodal market share growth · rail tons originated us ... aar,...
TRANSCRIPT
Inhibitors to Rail Carload and Intermodal Market Share Growth
Industry Study
January, 2009
1
AGENDA
Background
Norbridge Study Approach
Summary of Findings
Intermodal Growth Inhibitors
Carload Growth Inhibitors
2
Introduction
Norbridge, Inc. is a management consulting company that assists clients in making better decisions to improve performance
We have considerable experience in all aspects of transportation and logistics including rail and trucking
We conducted this study because we were interested in understanding why rail did not gain share when fuel prices spiked in the first half of 2008
3
Study Participants
We interviewed 40 transportation buyers to get their opinions on how their modal decisions changed when fuel costs spiked in the first half of 2008
Interviewees were major companies across various industry segments and included both shipper and receiver transport buyers
Interviews were conducted between October and early December, 2008
Interviewees were typically transportation managers
4
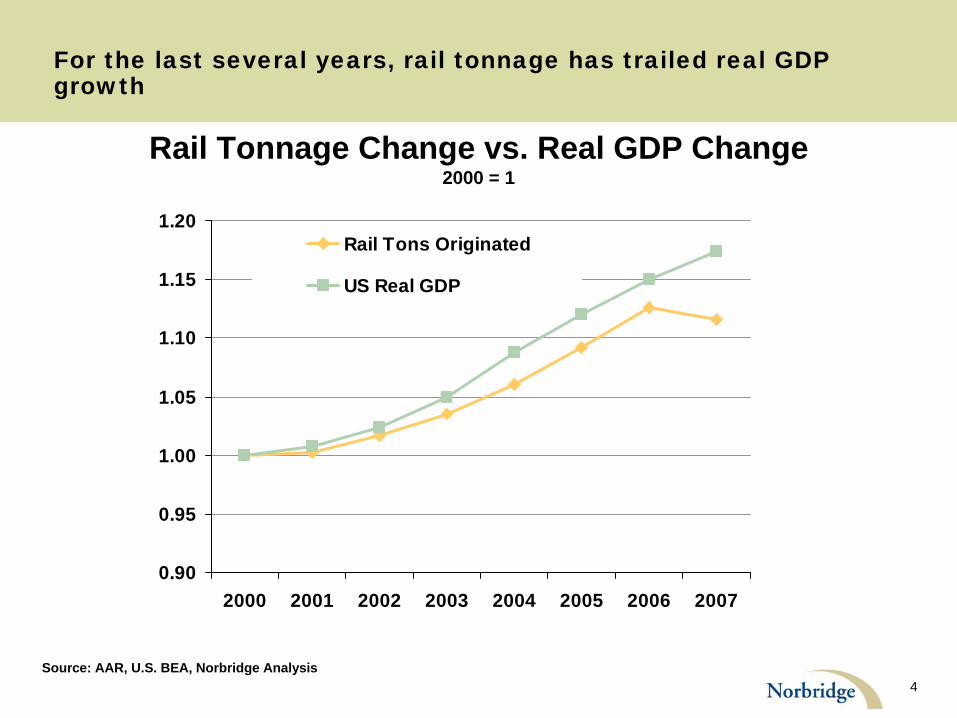
For the last several years, rail tonnage has trailed real GDP growth
0.90
0.95
1.00
1.05
1.10
1.15
1.20
2000 2001 2002 2003 2004 2005 2006 2007
Rail Tons Originated
US Real GDP
Source: AAR, U.S. BEA, Norbridge Analysis
Rail Tonnage Change vs. Real GDP Change 2000 = 1
5
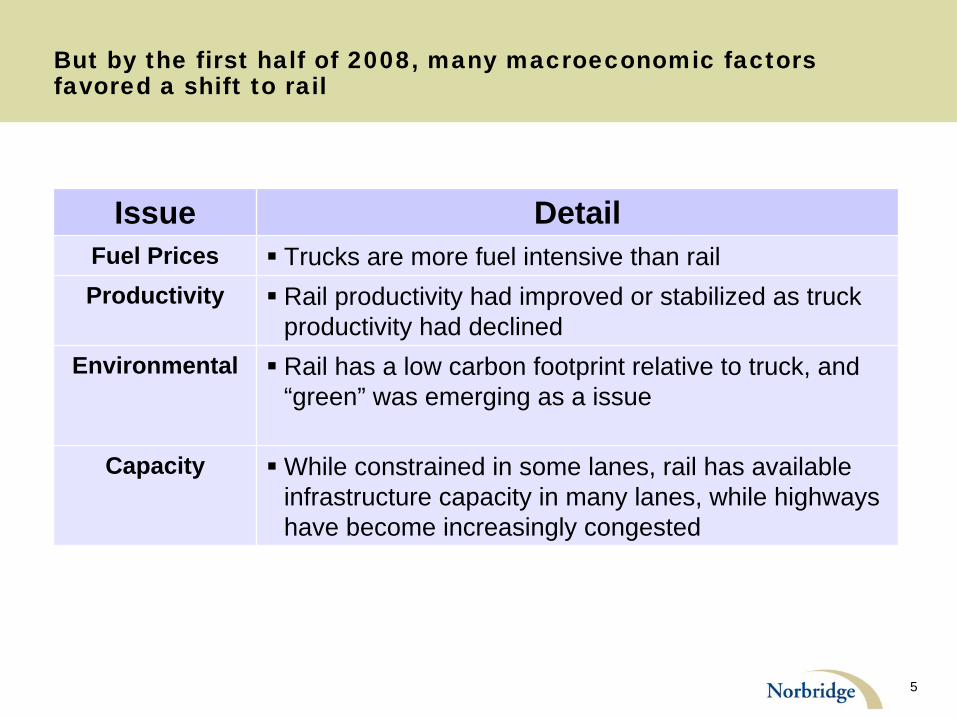
But by the first half of 2008, many macroeconomic factors favored a shift to rail
Issue DetailFuel Prices
Trucks are more fuel intensive than railProductivity
Rail productivity had improved or stabilized as truck productivity had declined
Environmental
Rail has a low carbon footprint relative to truck, and “green” was emerging as a issue
Capacity
While constrained in some lanes, rail has available infrastructure capacity in many lanes, while highways have become increasingly congested
6
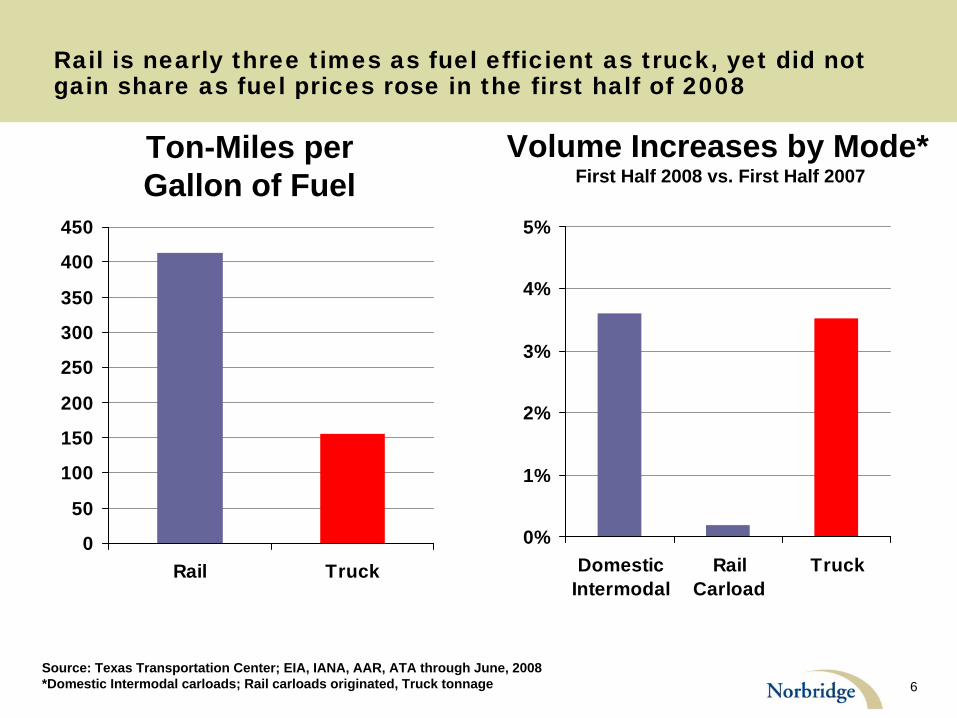
Rail is nearly three times as fuel efficient as truck, yet did not gain share as fuel prices rose in the first half of 2008
Source: Texas Transportation Center; EIA, IANA, AAR, ATA through June, 2008 *Domestic Intermodal carloads; Rail carloads originated, Truck tonnage
0
50
100
150
200
250
300
350
400
450
Rail Truck
Ton-Miles per Gallon of Fuel
0%
1%
2%
3%
4%
5%
DomesticIntermodal
RailCarload
Truck
Volume Increases by Mode* First Half 2008 vs. First Half 2007
7
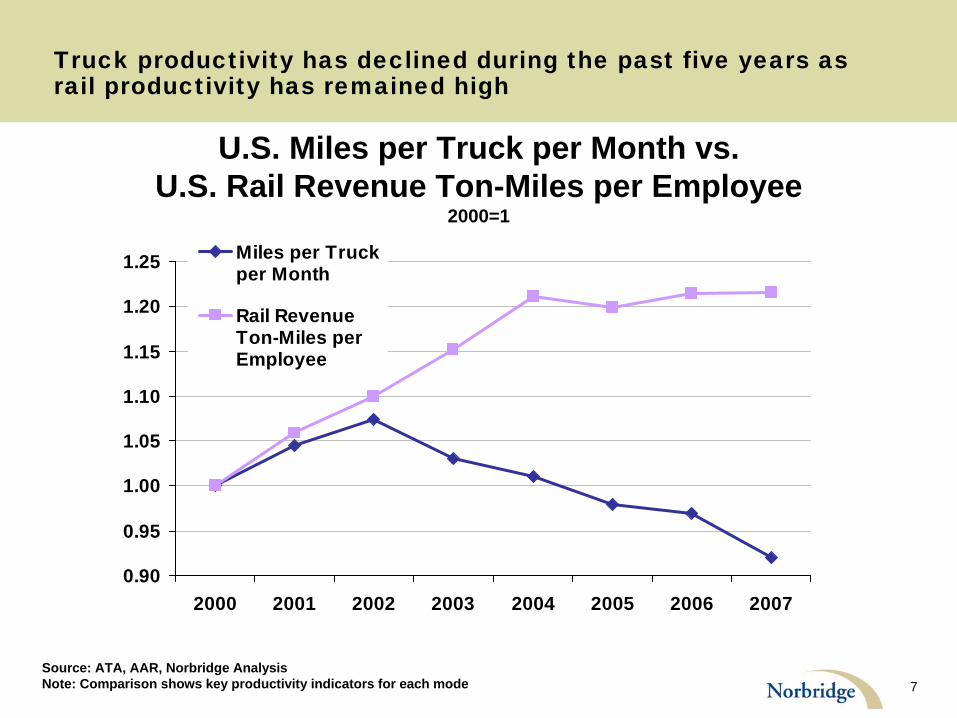
Truck productivity has declined during the past five years as rail productivity has remained high
Source: ATA, AAR, Norbridge Analysis Note: Comparison shows key productivity indicators for each mode
U.S. Miles per Truck per Month vs.U.S. Rail Revenue Ton-Miles per Employee
2000=1
0.90
0.95
1.00
1.05
1.10
1.15
1.20
1.25
2000 2001 2002 2003 2004 2005 2006 2007
Miles per Truckper Month
Rail RevenueTon-Miles perEmployee
8
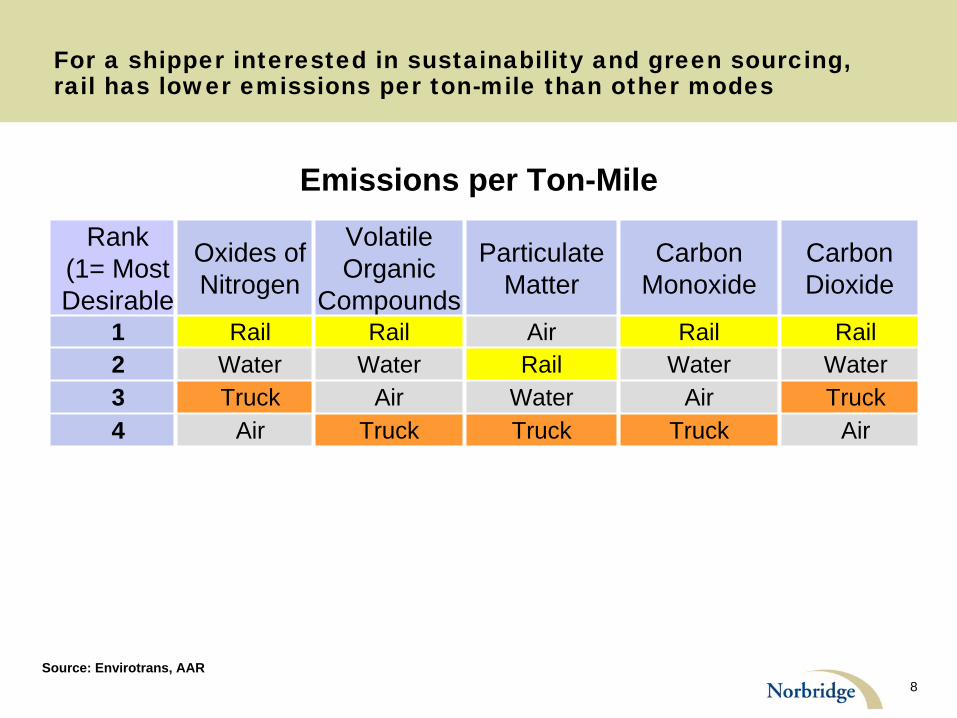
For a shipper interested in sustainability and green sourcing, rail has lower emissions per ton-mile than other modes
Source: Envirotrans, AAR
Emissions per Ton-MileRank
(1= Most Desirable
Oxides of Nitrogen
Volatile Organic
Compounds
Particulate Matter
Carbon Monoxide
Carbon Dioxide
1 Rail Rail Air Rail Rail2 Water Water Rail Water Water3 Truck Air Water Air Truck4 Air Truck Truck Truck Air
9
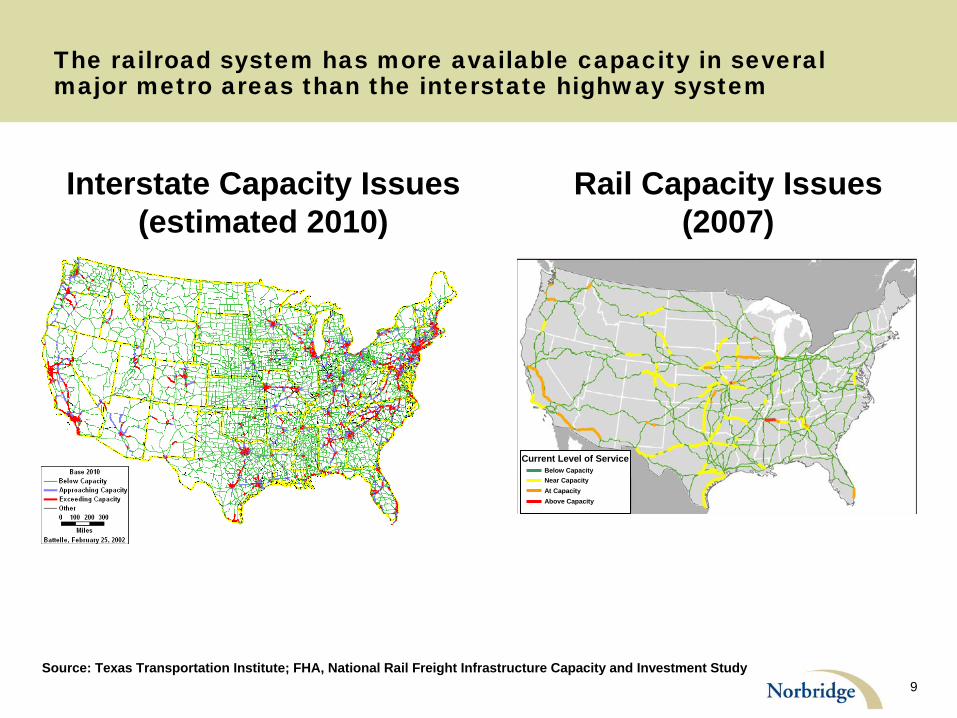
The railroad system has more available capacity in several major metro areas than the interstate highway system
Interstate Capacity Issues(estimated 2010)
Rail Capacity Issues(2007)
Below CapacityNear Capacity
Below CapacityNear CapacityAt CapacityAbove Capacity
Current Level of Service
Source: Texas Transportation Institute; FHA, National Rail Freight Infrastructure Capacity and Investment Study
10
Given these favorable trends, why didn’t rail gain share?
11
AGENDA
Background
Norbridge Study Approach
Summary of Findings
Intermodal Growth Inhibitors
Carload Growth Inhibitors
12
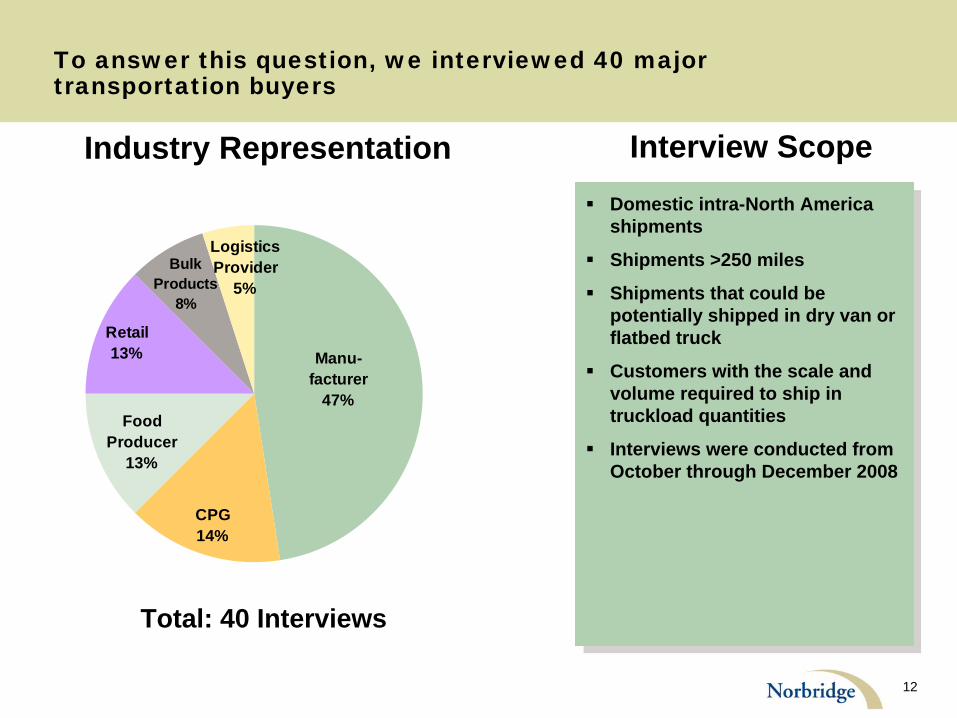
To answer this question, we interviewed 40 major transportation buyers
Industry Representation Interview Scope
CPG14%
Food Producer
13%
Retail13% Manu-
facturer47%
Bulk Products
8%
Logistics Provider
5%
Domestic intra-North America shipments
Shipments >250 miles
Shipments that could be potentially shipped in dry van or flatbed truck
Customers with the scale and volume required to ship in truckload quantities
Interviews were conducted from October through December 2008
Domestic intra-North America shipments
Shipments >250 miles
Shipments that could be potentially shipped in dry van or flatbed truck
Customers with the scale and volume required to ship in truckload quantities
Interviews were conducted from October through December 2008
Total: 40 Interviews
13
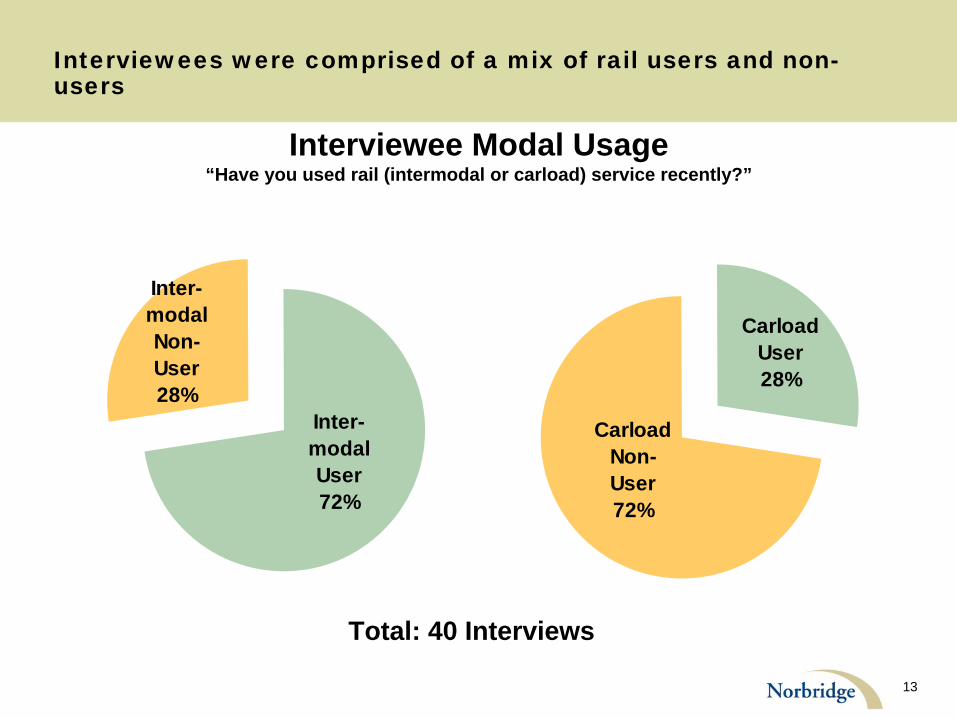
Interviewees were comprised of a mix of rail users and non- users
Inter-modal Non-User28%
Inter-modal User72%
Carload User28%
Carload Non-User72%
Interviewee Modal Usage“Have you used rail (intermodal or carload) service recently?”
Total: 40 Interviews
14
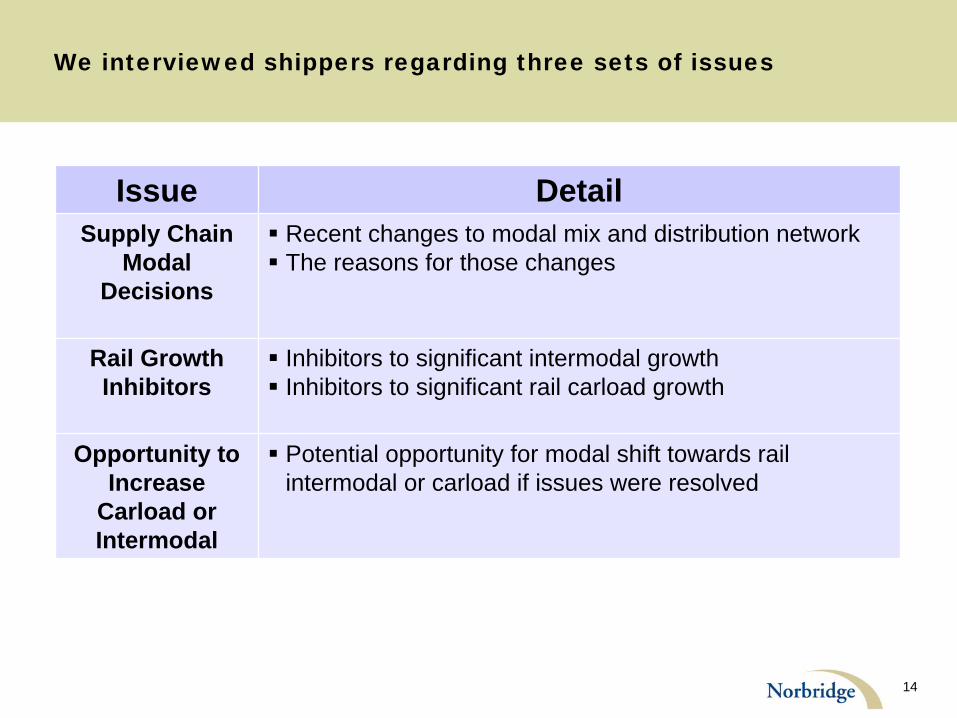
We interviewed shippers regarding three sets of issues
Issue DetailSupply Chain
Modal Decisions
Recent changes to modal mix and distribution network
The reasons for those changes
Rail Growth Inhibitors
Inhibitors to significant intermodal growth
Inhibitors to significant rail carload growth
Opportunity to Increase
Carload or Intermodal
Potential opportunity for modal shift towards rail intermodal or carload if issues were resolved
15
AGENDA
Background
Norbridge Study Approach
Summary of Findings
Intermodal Growth Inhibitors
Carload Growth Inhibitors
16
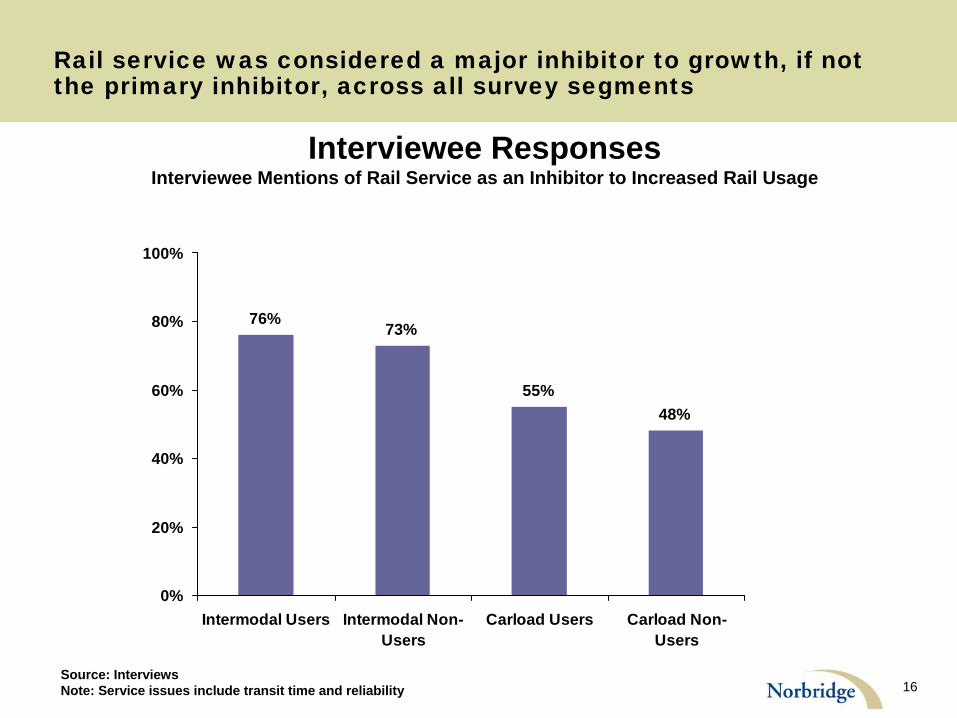
76% 73%
55%48%
0%
20%
40%
60%
80%
100%
Intermodal Users Intermodal Non-Users
Carload Users Carload Non-Users
Rail service was considered a major inhibitor to growth, if not the primary inhibitor, across all survey segments
Interviewee ResponsesInterviewee Mentions of Rail Service as an Inhibitor to Increased Rail Usage
Source: Interviews Note: Service issues include transit time and reliability
17
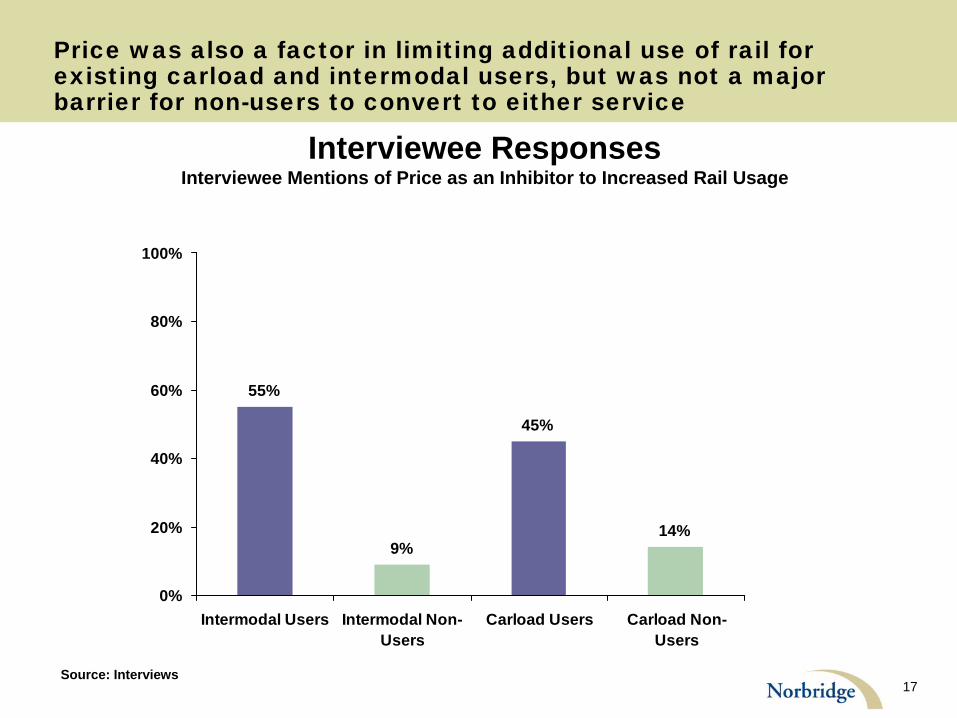
55%
9%
45%
14%
0%
20%
40%
60%
80%
100%
Intermodal Users Intermodal Non-Users
Carload Users Carload Non-Users
Price was also a factor in limiting additional use of rail for existing carload and intermodal users, but was not a major barrier for non-users to convert to either service
Interviewee ResponsesInterviewee Mentions of Price as an Inhibitor to Increased Rail Usage
Source: Interviews
18
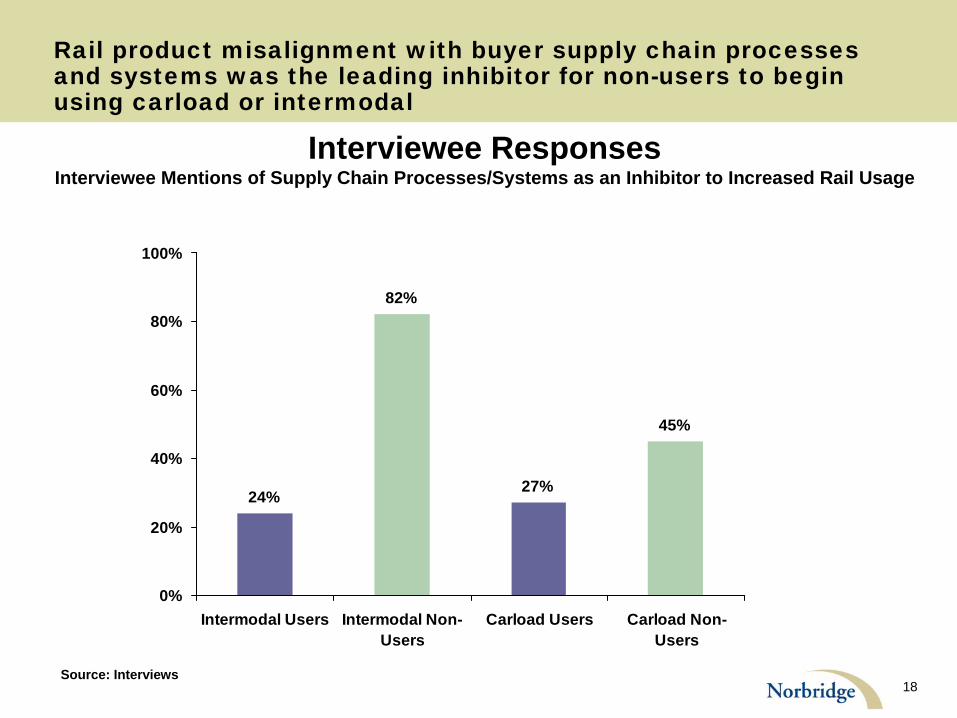
24%
82%
27%
45%
0%
20%
40%
60%
80%
100%
Intermodal Users Intermodal Non-Users
Carload Users Carload Non-Users
Rail product misalignment with buyer supply chain processes and systems was the leading inhibitor for non-users to begin using carload or intermodal
Interviewee ResponsesInterviewee Mentions of Supply Chain Processes/Systems as an Inhibitor to Increased Rail Usage
Source: Interviews
19
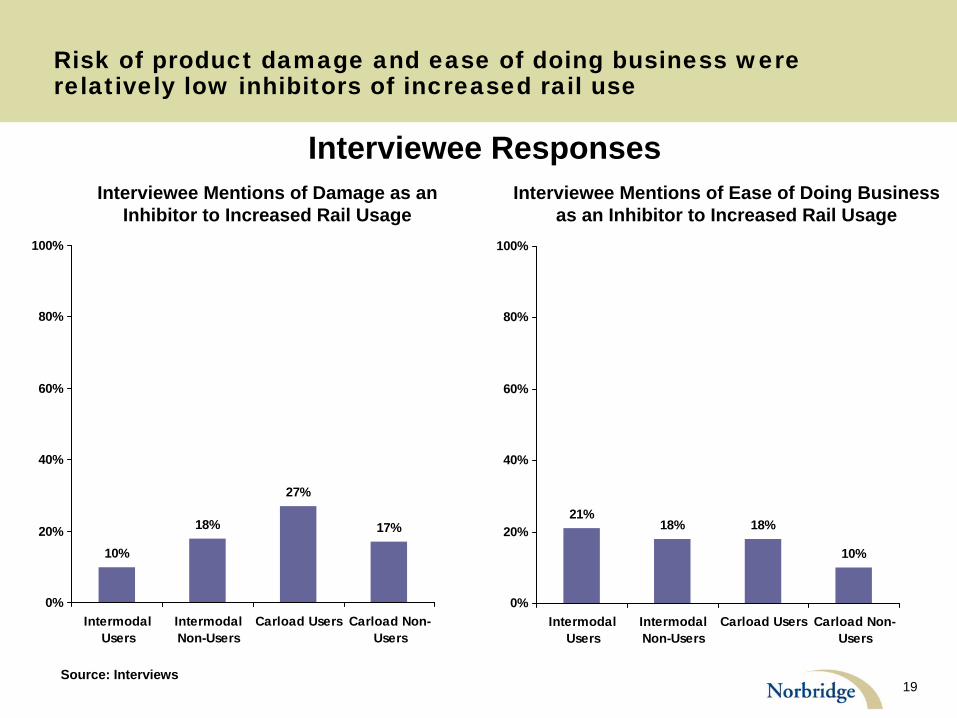
10%
18%
27%
17%
0%
20%
40%
60%
80%
100%
IntermodalUsers
IntermodalNon-Users
Carload Users Carload Non-Users
Risk of product damage and ease of doing business were relatively low inhibitors of increased rail use
Interviewee Responses
Source: Interviews
21%18% 18%
10%
0%
20%
40%
60%
80%
100%
IntermodalUsers
IntermodalNon-Users
Carload Users Carload Non-Users
Interviewee Mentions of Damage as an Inhibitor to Increased Rail Usage
Interviewee Mentions of Ease of Doing Business as an Inhibitor to Increased Rail Usage

20
AGENDA
Background
Norbridge Study Approach
Summary of Findings
Intermodal Growth Inhibitors
Carload Growth Inhibitors
21
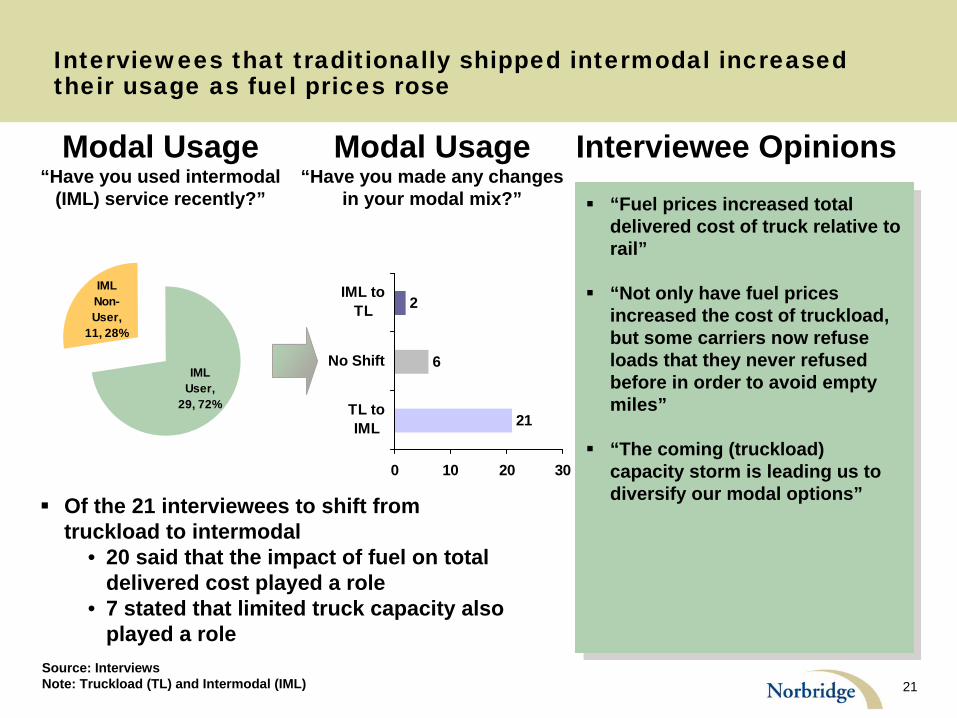
Interviewees that traditionally shipped intermodal increased their usage as fuel prices rose
“Fuel prices increased total delivered cost of truck relative to rail”
“Not only have fuel prices increased the cost of truckload, but some carriers now refuse loads that they never refused before in order to avoid empty miles”
“The coming (truckload) capacity storm is leading us to diversify our modal options”
Interviewee Opinions
IML User,
29, 72%
IML Non-User,
11, 28%
21
6
2
0 10 20 30
TL toIML
No Shift
IML toTL
Modal Usage“Have you made any changes
in your modal mix?”
Of the 21 interviewees to shift from truckload to intermodal
• 20 said that the impact of fuel on total delivered cost played a role
• 7 stated that limited truck capacity also played a role
Source: Interviews Note: Truckload (TL) and Intermodal (IML)
Modal Usage“Have you used intermodal
(IML) service recently?”
22
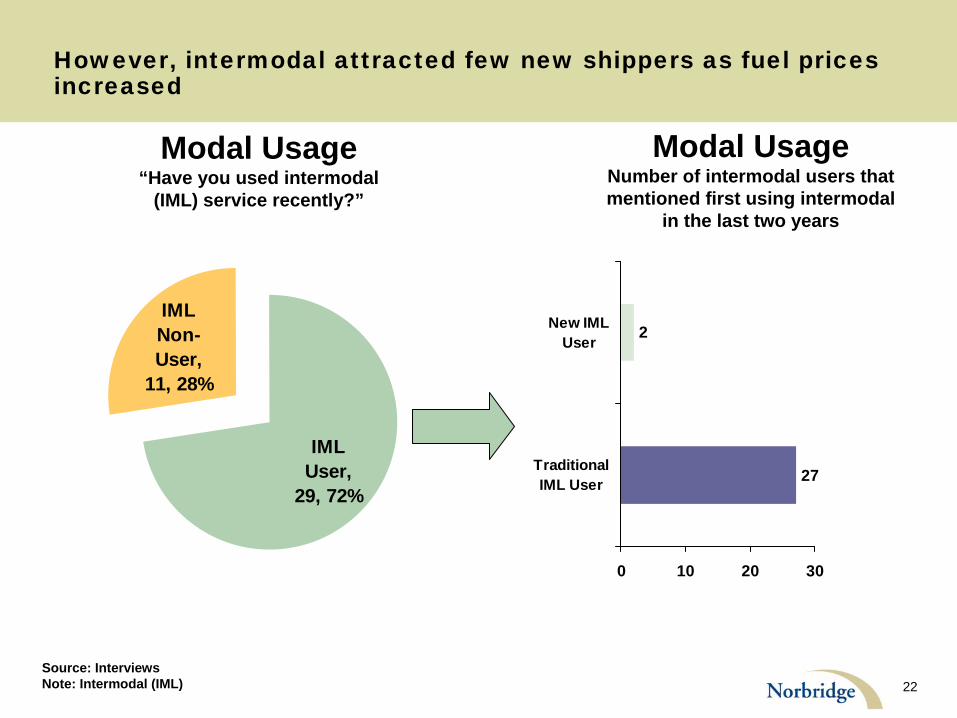
However, intermodal attracted few new shippers as fuel prices increased
IML User,
29, 72%
IML Non-User,
11, 28%
27
2
0 10 20 30
TraditionalIML User
New IMLUser
Modal UsageNumber of intermodal users that mentioned first using intermodal
in the last two years
Modal Usage“Have you used intermodal
(IML) service recently?”
Source: Interviews Note: Intermodal (IML)
23
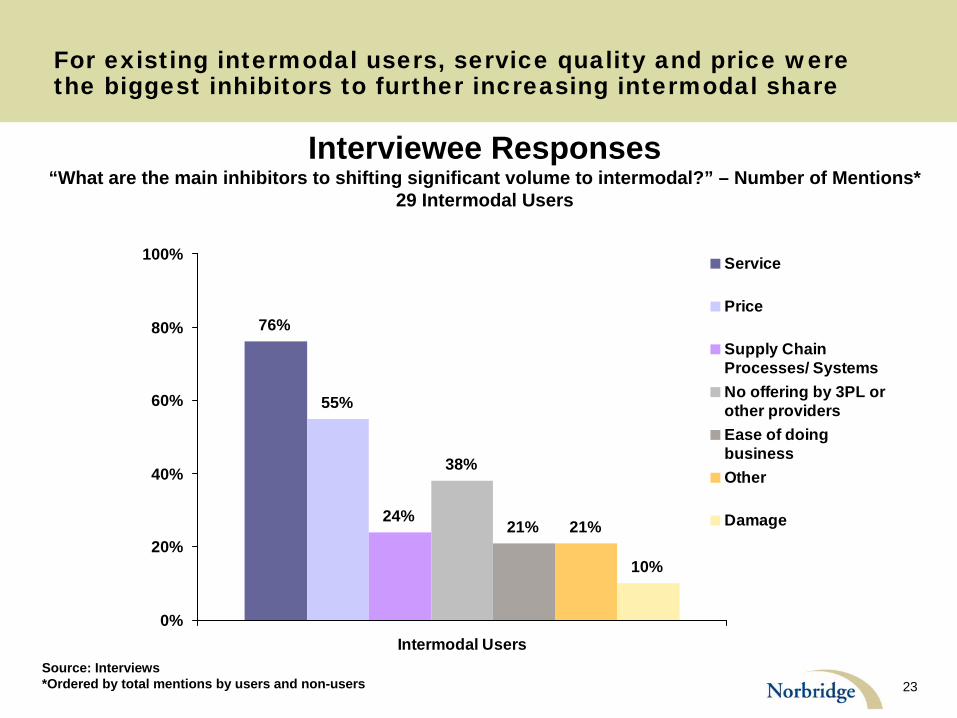
For existing intermodal users, service quality and price were the biggest inhibitors to further increasing intermodal share
Interviewee Responses“What are the main inhibitors to shifting significant volume to intermodal?” – Number of Mentions*
29 Intermodal Users
76%
55%
24%
38%
21% 21%
10%
0%
20%
40%
60%
80%
100%
Intermodal Users
Service
Price
Supply ChainProcesses/ SystemsNo offering by 3PL orother providersEase of doingbusinessOther
Damage
Source: Interviews *Ordered by total mentions by users and non-users
24
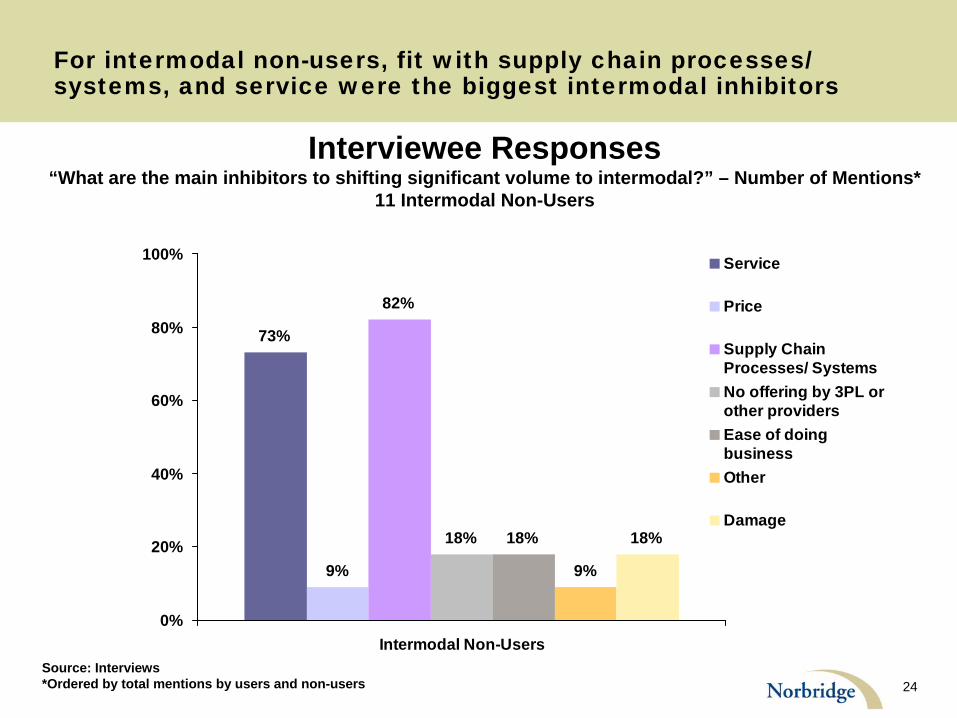
For intermodal non-users, fit with supply chain processes/ systems, and service were the biggest intermodal inhibitors
Interviewee Responses“What are the main inhibitors to shifting significant volume to intermodal?” – Number of Mentions*
11 Intermodal Non-Users
73%
9%
82%
18% 18%
9%
18%
0%
20%
40%
60%
80%
100%
Intermodal Non-Users
Service
Price
Supply ChainProcesses/ SystemsNo offering by 3PL orother providersEase of doingbusinessOther
Damage
Source: Interviews *Ordered by total mentions by users and non-users
25
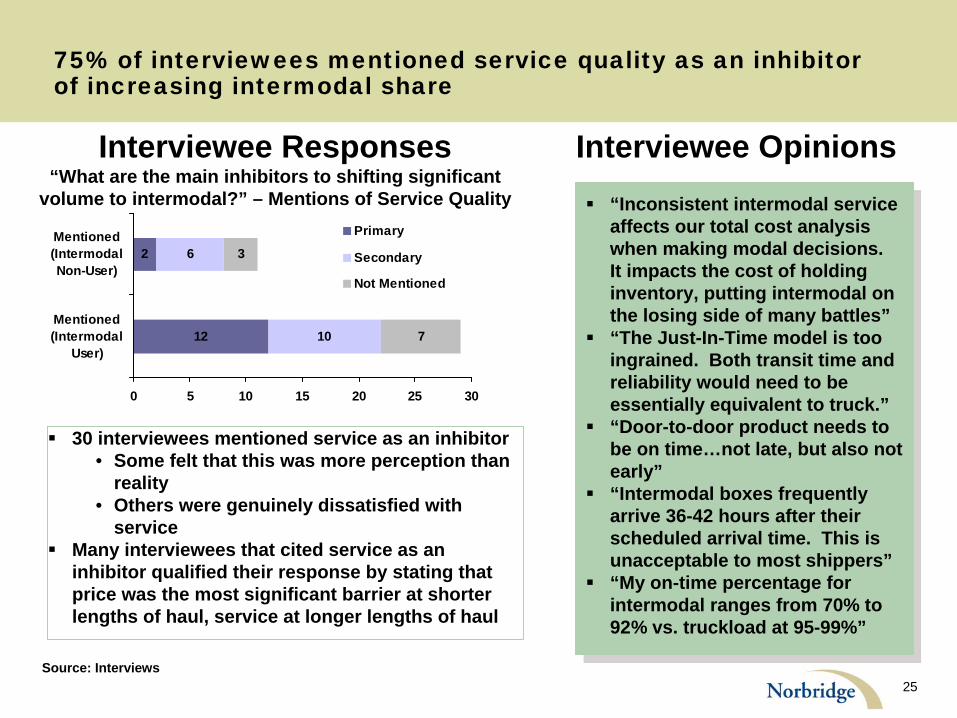
75% of interviewees mentioned service quality as an inhibitor of increasing intermodal share
Source: Interviews
“Inconsistent intermodal service affects our total cost analysis when making modal decisions. It impacts the cost of holding inventory, putting intermodal on the losing side of many battles”
“The Just-In-Time model is too ingrained. Both transit time and reliability would need to be essentially equivalent to truck.”
“Door-to-door product needs to be on time…not late, but also not early”
“Intermodal boxes frequently arrive 36-42 hours after their scheduled arrival time. This is unacceptable to most shippers”
“My on-time percentage for intermodal ranges from 70% to 92% vs. truckload at 95-99%”
Interviewee Responses“What are the main inhibitors to shifting significant
volume to intermodal?” – Mentions of Service Quality
10
6
7
32
12
0 5 10 15 20 25 30
Mentioned(Intermodal
User)
Mentioned(IntermodalNon-User)
Primary
Secondary
Not Mentioned
Interviewee Opinions
30 interviewees mentioned service as an inhibitor • Some felt that this was more perception than
reality• Others were genuinely dissatisfied with
service
Many interviewees that cited service as an inhibitor qualified their response by stating that price was the most significant barrier at shorter lengths of haul, service at longer lengths of haul
26
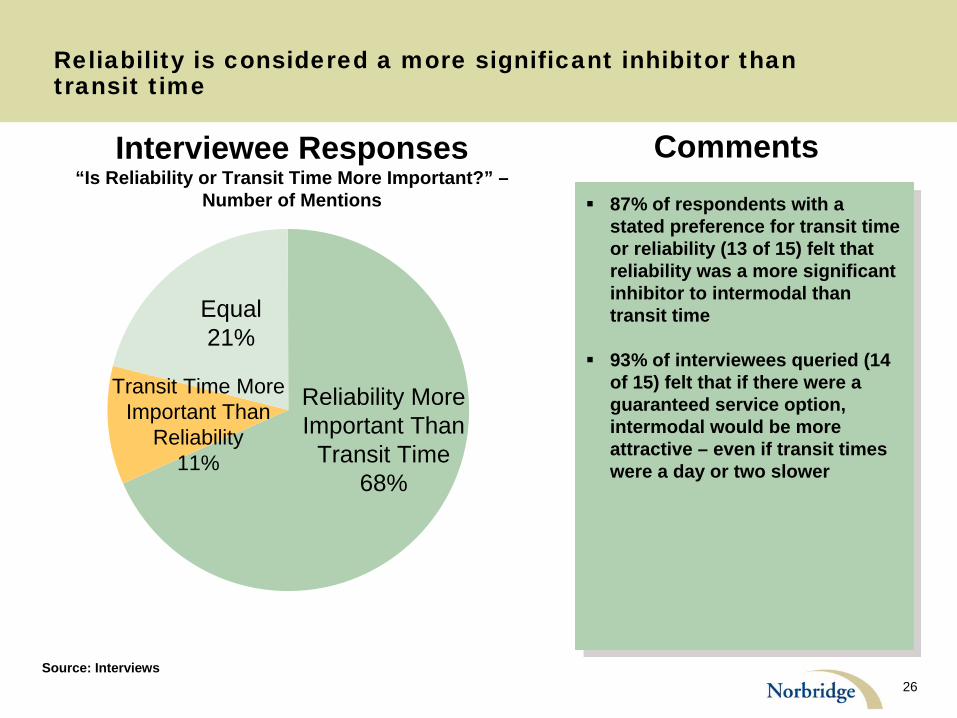
Reliability is considered a more significant inhibitor than transit time
87% of respondents with a stated preference for transit time or reliability (13 of 15) felt that reliability was a more significant inhibitor to intermodal than transit time
93% of interviewees queried (14 of 15) felt that if there were a guaranteed service option, intermodal would be more attractive – even if transit times were a day or two slower
Interviewee Responses“Is Reliability or Transit Time More Important?” –
Number of Mentions
Comments
Source: Interviews
Reliability More Important Than
Transit Time 68%
Equal 21%
Transit Time More Important Than
Reliability 11%
27
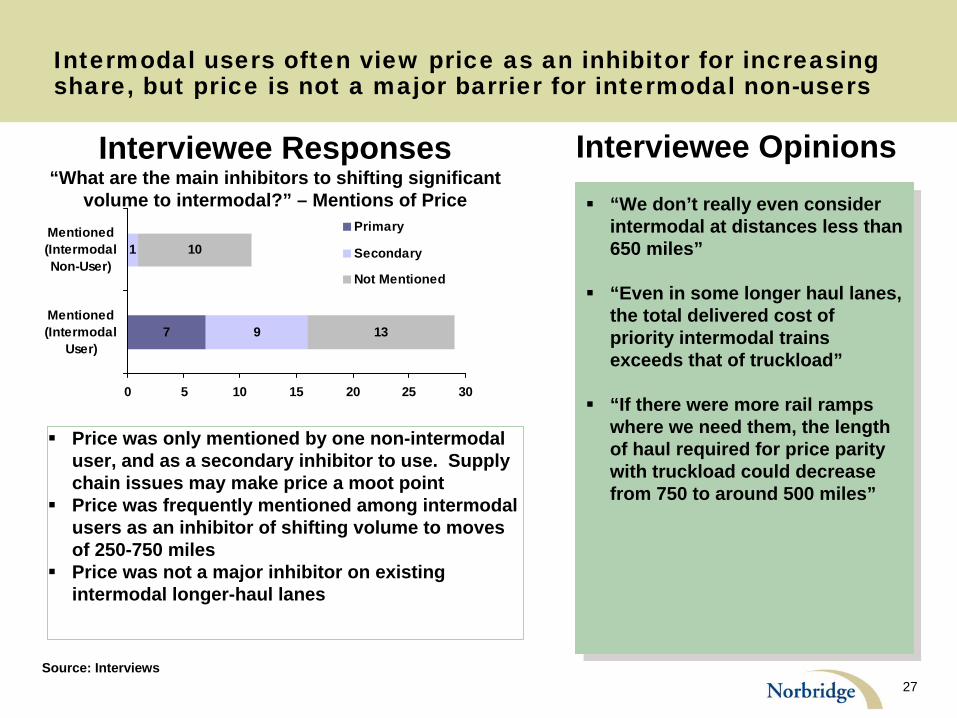
Intermodal users often view price as an inhibitor for increasing share, but price is not a major barrier for intermodal non-users
“We don’t really even consider intermodal at distances less than 650 miles”
“Even in some longer haul lanes, the total delivered cost of priority intermodal trains exceeds that of truckload”
“If there were more rail ramps where we need them, the length of haul required for price parity with truckload could decrease from 750 to around 500 miles”
Source: Interviews
9
1
13
10
7
0 5 10 15 20 25 30
Mentioned(Intermodal
User)
Mentioned(IntermodalNon-User)
Primary
Secondary
Not Mentioned
Interviewee Responses“What are the main inhibitors to shifting significant
volume to intermodal?” – Mentions of Price
Interviewee Opinions
Price was only mentioned by one non-intermodal user, and as a secondary inhibitor to use. Supply chain issues may make price a moot point
Price was frequently mentioned among intermodal users as an inhibitor of shifting volume to moves of 250-750 miles
Price was not a major inhibitor on existing intermodal longer-haul lanes
28
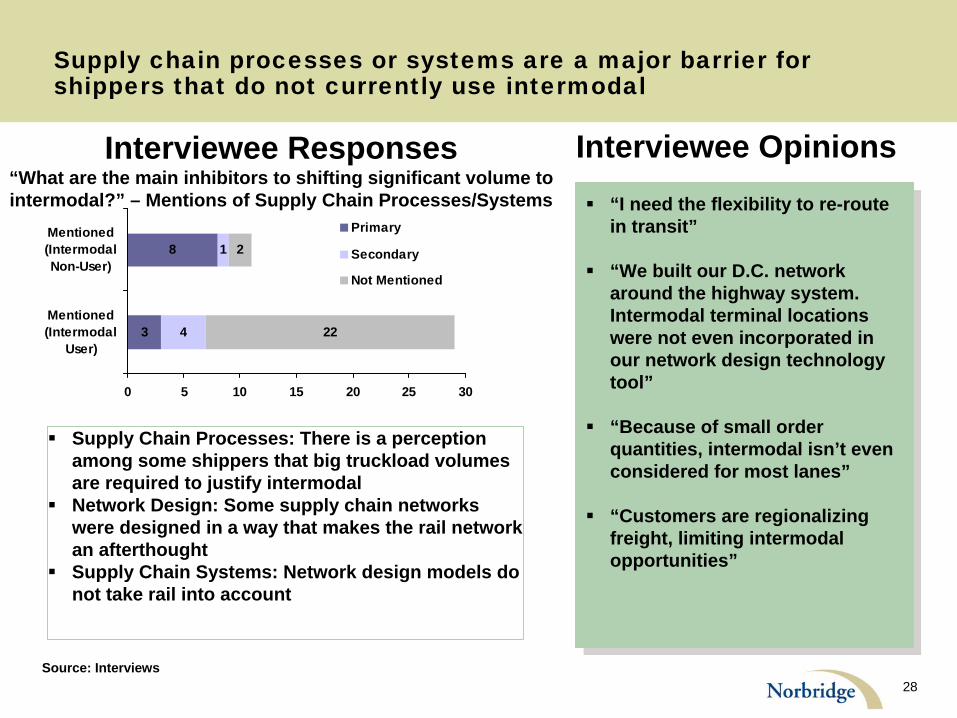
Supply chain processes or systems are a major barrier for shippers that do not currently use intermodal
Source: Interviews
“I need the flexibility to re-route in transit”
“We built our D.C. network around the highway system. Intermodal terminal locations were not even incorporated in our network design technology tool”
“Because of small order quantities, intermodal isn’t even considered for most lanes”
“Customers are regionalizing freight, limiting intermodal opportunities”
3
8
4
1
22
2
0 5 10 15 20 25 30
Mentioned(Intermodal
User)
Mentioned(IntermodalNon-User)
Primary
Secondary
Not Mentioned
Interviewee Responses“What are the main inhibitors to shifting significant volume to intermodal?” – Mentions of Supply Chain Processes/Systems
Interviewee Opinions
Supply Chain Processes: There is a perception among some shippers that big truckload volumes are required to justify intermodal
Network Design: Some supply chain networks were designed in a way that makes the rail network an afterthought
Supply Chain Systems: Network design models do not take rail into account
29
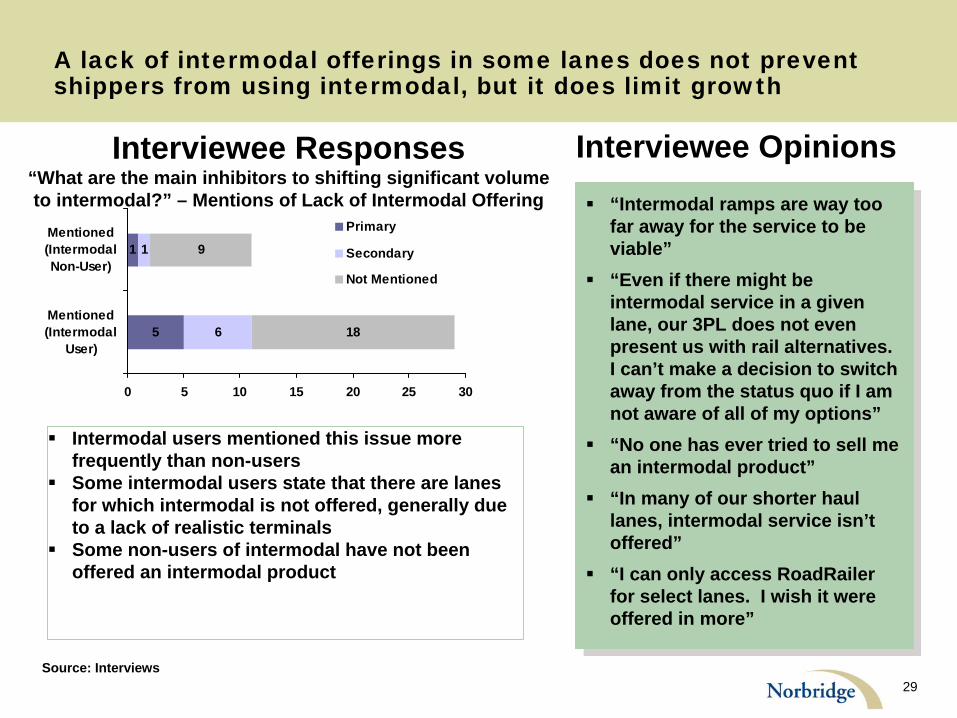
A lack of intermodal offerings in some lanes does not prevent shippers from using intermodal, but it does limit growth
Source: Interviews
“Intermodal ramps are way too far away for the service to be viable”
“Even if there might be intermodal service in a given lane, our 3PL does not even present us with rail alternatives. I can’t make a decision to switch away from the status quo if I am not aware of all of my options”
“No one has ever tried to sell me an intermodal product”
“In many of our shorter haul lanes, intermodal service isn’t offered”
“I can only access RoadRailer for select lanes. I wish it were offered in more”
5
1
6
1
18
9
0 5 10 15 20 25 30
Mentioned(Intermodal
User)
Mentioned(IntermodalNon-User)
Primary
Secondary
Not Mentioned
Interviewee Responses“What are the main inhibitors to shifting significant volume to intermodal?” – Mentions of Lack of Intermodal Offering
Interviewee Opinions
Intermodal users mentioned this issue more frequently than non-users
Some intermodal users state that there are lanes for which intermodal is not offered, generally due to a lack of realistic terminals
Some non-users of intermodal have not been offered an intermodal product
30
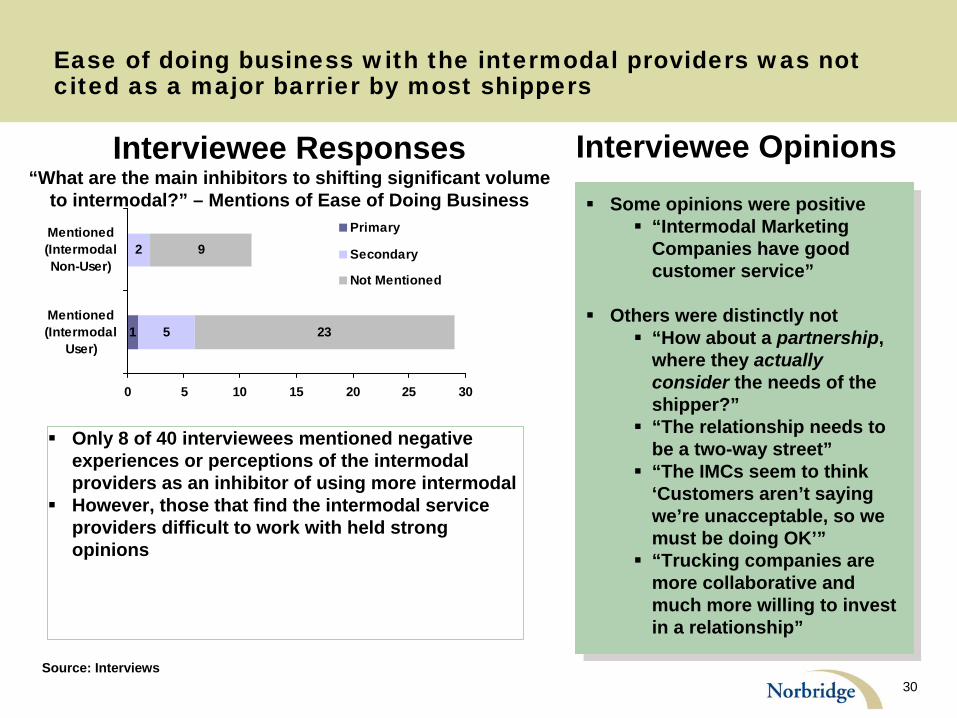
Ease of doing business with the intermodal providers was not cited as a major barrier by most shippers
Source: Interviews
Some opinions were positive
“Intermodal Marketing Companies have good customer service”
Others were distinctly not
“How about a partnership, where they actually consider the needs of the shipper?”
“The relationship needs to be a two-way street”
“The IMCs seem to think ‘Customers aren’t saying we’re unacceptable, so we must be doing OK’”
“Trucking companies are more collaborative and much more willing to invest in a relationship”
5
2
23
9
1
0 5 10 15 20 25 30
Mentioned(Intermodal
User)
Mentioned(IntermodalNon-User)
Primary
Secondary
Not Mentioned
Interviewee Responses“What are the main inhibitors to shifting significant volume
to intermodal?” – Mentions of Ease of Doing Business
Interviewee Opinions
Only 8 of 40 interviewees mentioned negative experiences or perceptions of the intermodal providers as an inhibitor of using more intermodal
However, those that find the intermodal service providers difficult to work with held strong opinions
31
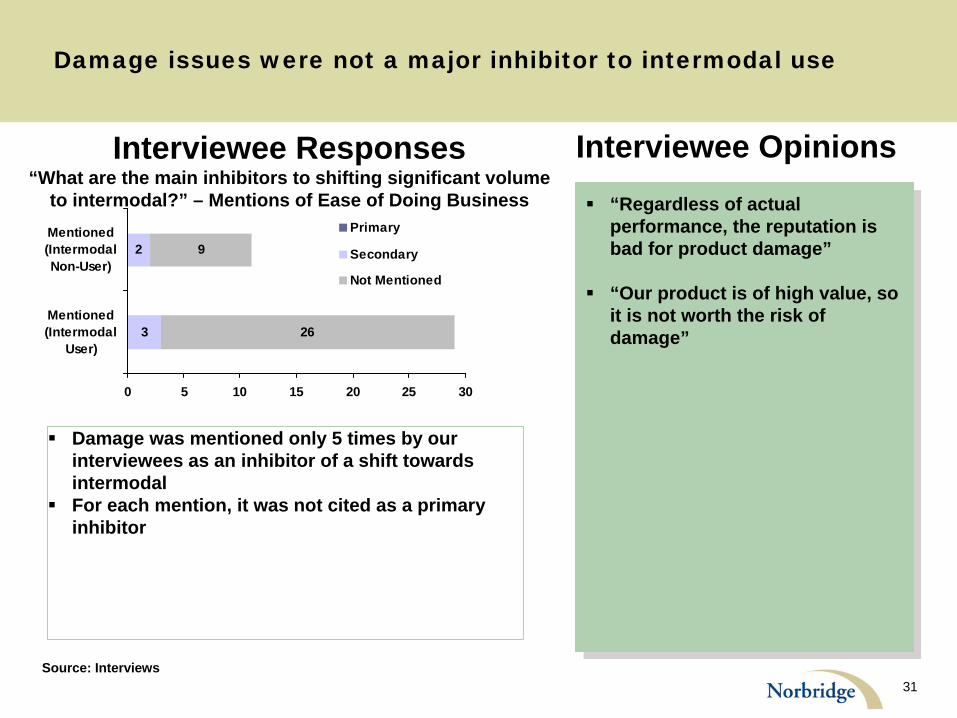
Damage issues were not a major inhibitor to intermodal use
Source: Interviews
“Regardless of actual performance, the reputation is bad for product damage”
“Our product is of high value, so it is not worth the risk of damage”
“Regardless of actual performance, the reputation is bad for product damage”
“Our product is of high value, so it is not worth the risk of damage”3
2
26
9
0 5 10 15 20 25 30
Mentioned(Intermodal
User)
Mentioned(IntermodalNon-User)
Primary
Secondary
Not Mentioned
Interviewee Responses“What are the main inhibitors to shifting significant volume
to intermodal?” – Mentions of Ease of Doing Business
Interviewee Opinions
Damage was mentioned only 5 times by our interviewees as an inhibitor of a shift towards intermodal
For each mention, it was not cited as a primary inhibitor
32
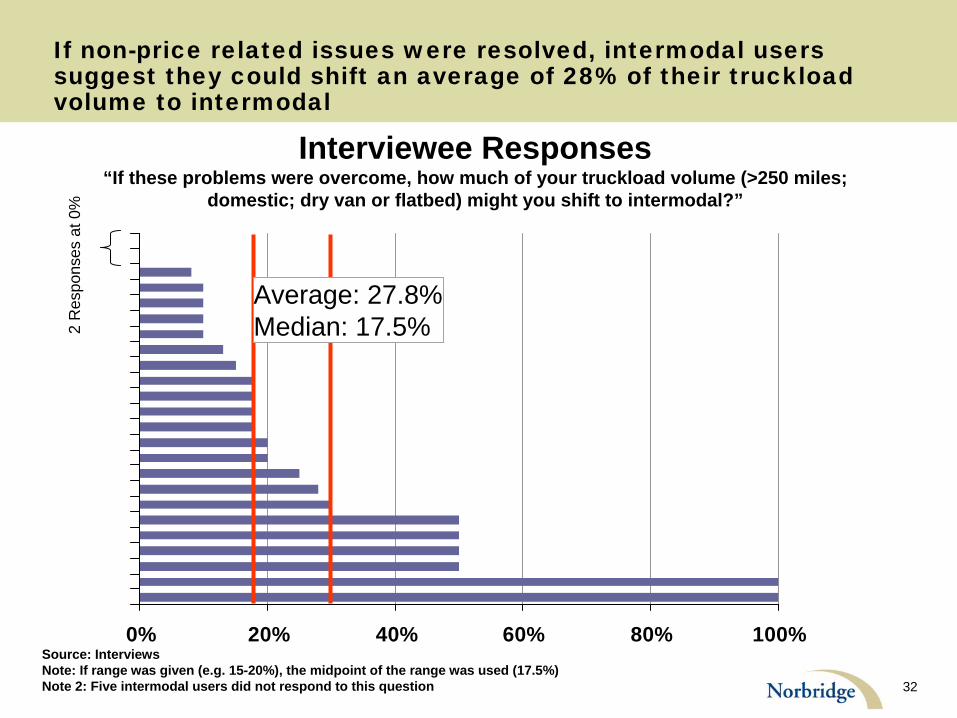
If non-price related issues were resolved, intermodal users suggest they could shift an average of 28% of their truckload volume to intermodal
0% 20% 40% 60% 80% 100%
Interviewee Responses“If these problems were overcome, how much of your truckload volume (>250 miles;
domestic; dry van or flatbed) might you shift to intermodal?”
Source: Interviews Note: If range was given (e.g. 15-20%), the midpoint of the range was used (17.5%) Note 2: Five intermodal users did not respond to this question
Average: 27.8%Median: 17.5%2
Res
pons
es a
t 0%
33
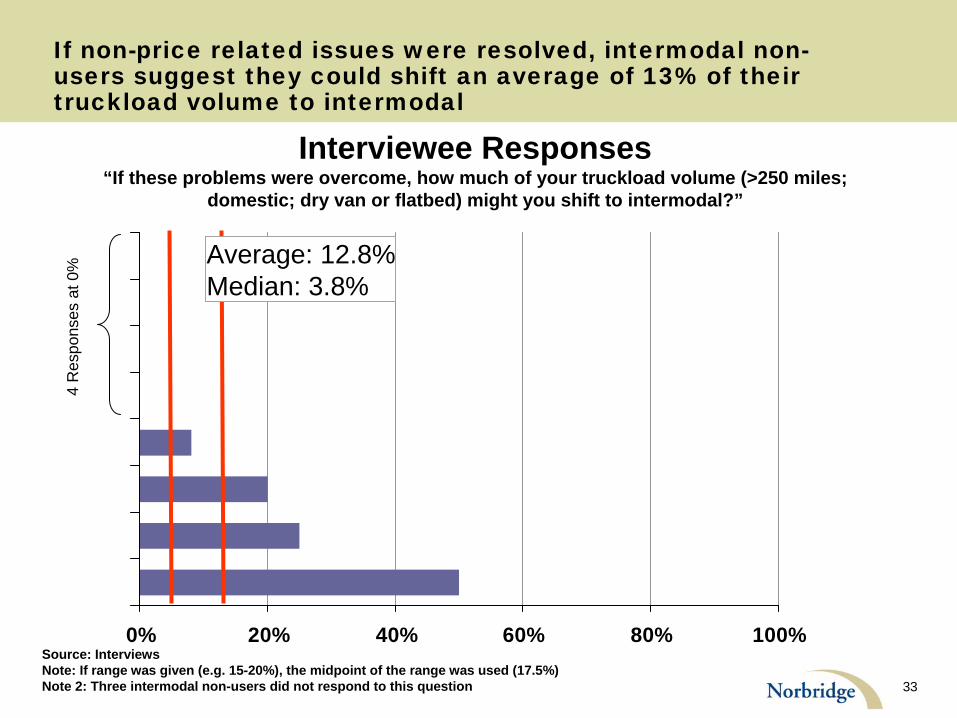
If non-price related issues were resolved, intermodal non- users suggest they could shift an average of 13% of their truckload volume to intermodal
0% 20% 40% 60% 80% 100%
Interviewee Responses“If these problems were overcome, how much of your truckload volume (>250 miles;
domestic; dry van or flatbed) might you shift to intermodal?”
Source: Interviews Note: If range was given (e.g. 15-20%), the midpoint of the range was used (17.5%) Note 2: Three intermodal non-users did not respond to this question
Average: 12.8%Median: 3.8%
4 R
espo
nses
at 0
%

34
AGENDA
Background
Norbridge Study Approach
Summary of Findings
Intermodal Growth Inhibitors
Carload Growth Inhibitors
35
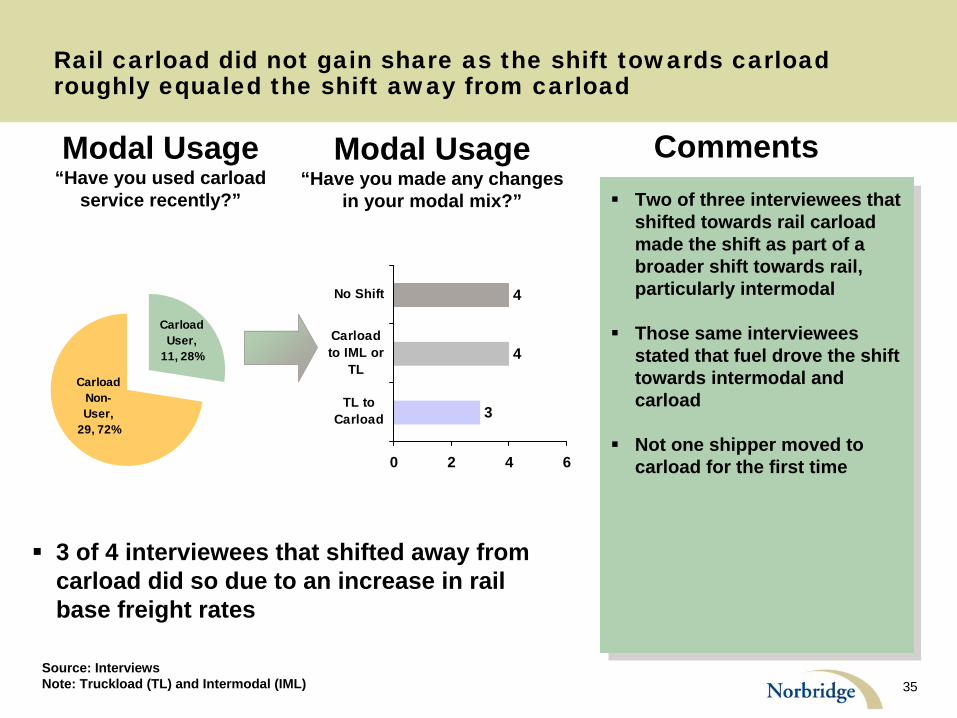
Rail carload did not gain share as the shift towards carload roughly equaled the shift away from carload
Two of three interviewees that shifted towards rail carload made the shift as part of a broader shift towards rail, particularly intermodal
Those same interviewees stated that fuel drove the shift towards intermodal and carload
Not one shipper moved to carload for the first time
Two of three interviewees that shifted towards rail carload made the shift as part of a broader shift towards rail, particularly intermodal
Those same interviewees stated that fuel drove the shift towards intermodal and carload
Not one shipper moved to carload for the first time
Carload User,
11, 28%
Carload Non-User,
29, 72%3
4
4
0 2 4 6
TL toCarload
Carloadto IML or
TL
No Shift
Modal Usage“Have you made any changes
in your modal mix?”
Modal Usage“Have you used carload
service recently?”
Source: Interviews Note: Truckload (TL) and Intermodal (IML)
3 of 4 interviewees that shifted away from carload did so due to an increase in rail base freight rates
Comments
36
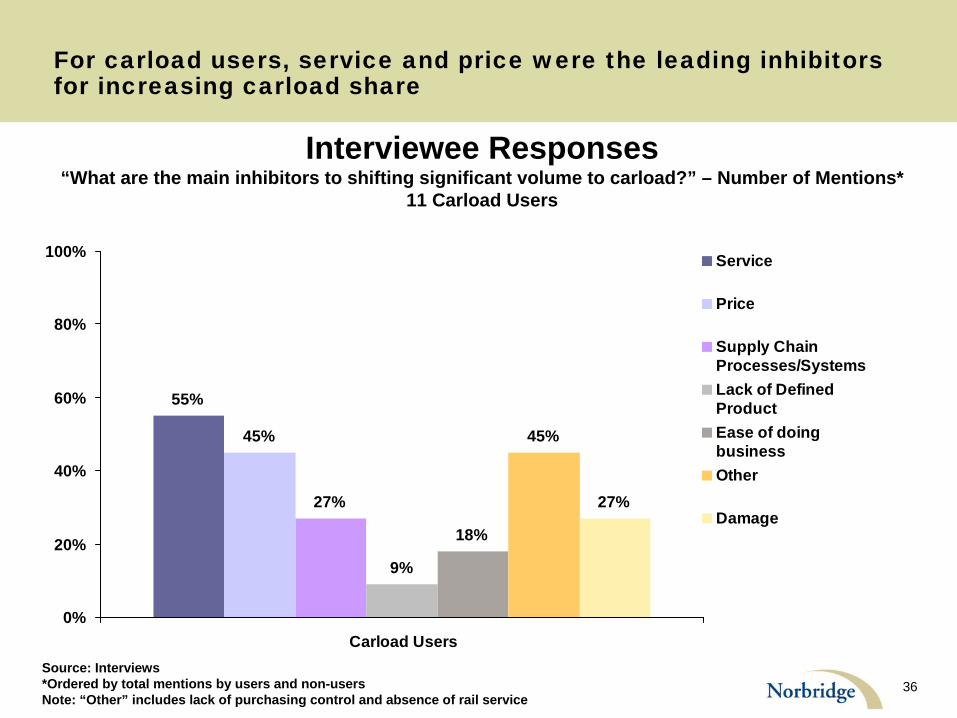
For carload users, service and price were the leading inhibitors for increasing carload share
Interviewee Responses“What are the main inhibitors to shifting significant volume to carload?” – Number of Mentions*
11 Carload Users
55%
45%
27%
9%
18%
45%
27%
0%
20%
40%
60%
80%
100%
Carload Users
Service
Price
Supply ChainProcesses/SystemsLack of DefinedProductEase of doingbusinessOther
Damage
Source: Interviews *Ordered by total mentions by users and non-users Note: “Other” includes lack of purchasing control and absence of rail service
37
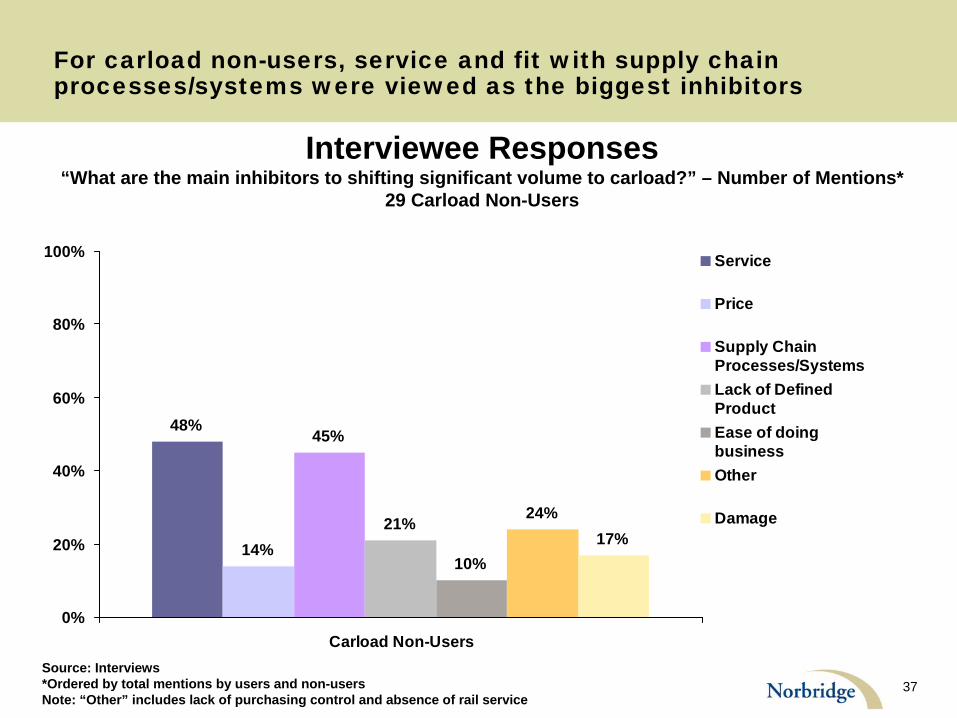
For carload non-users, service and fit with supply chain processes/systems were viewed as the biggest inhibitors
Interviewee Responses“What are the main inhibitors to shifting significant volume to carload?” – Number of Mentions*
29 Carload Non-Users
48%
14%
45%
21%
10%
24%17%
0%
20%
40%
60%
80%
100%
Carload Non-Users
Service
Price
Supply ChainProcesses/SystemsLack of DefinedProductEase of doingbusinessOther
Damage
Source: Interviews *Ordered by total mentions by users and non-users Note: “Other” includes lack of purchasing control and absence of rail service
38
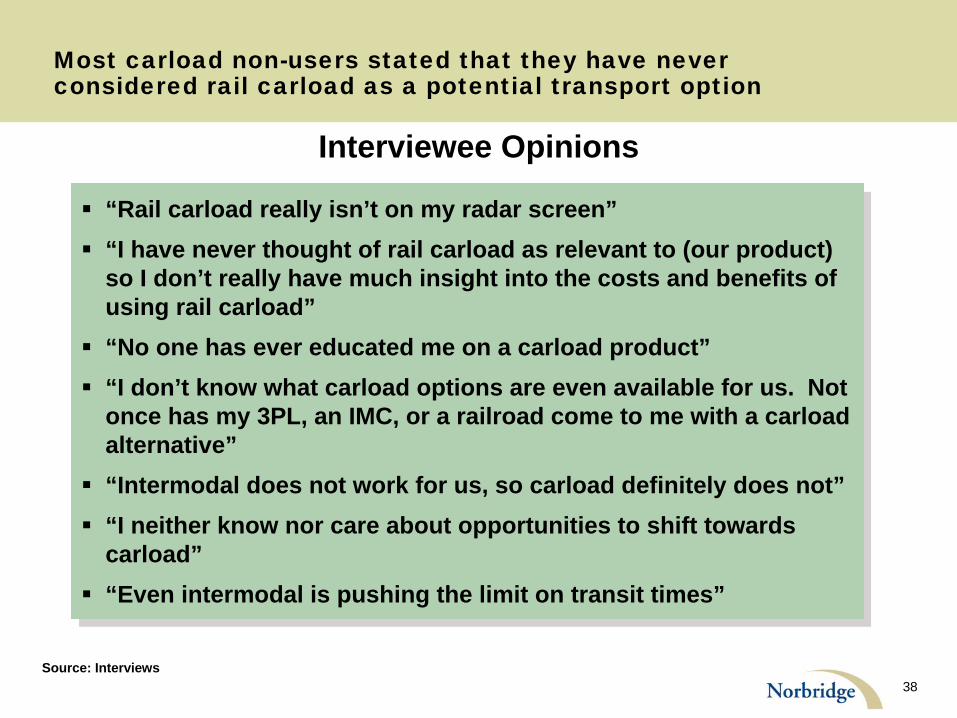
Most carload non-users stated that they have never considered rail carload as a potential transport option
“Rail carload really isn’t on my radar screen”
“I have never thought of rail carload as relevant to (our product) so I don’t really have much insight into the costs and benefits of using rail carload”
“No one has ever educated me on a carload product”
“I don’t know what carload options are even available for us. Not once has my 3PL, an IMC, or a railroad come to me with a carload alternative”
“Intermodal does not work for us, so carload definitely does not”
“I neither know nor care about opportunities to shift towards carload”
“Even intermodal is pushing the limit on transit times”
Interviewee Opinions
Source: Interviews
39
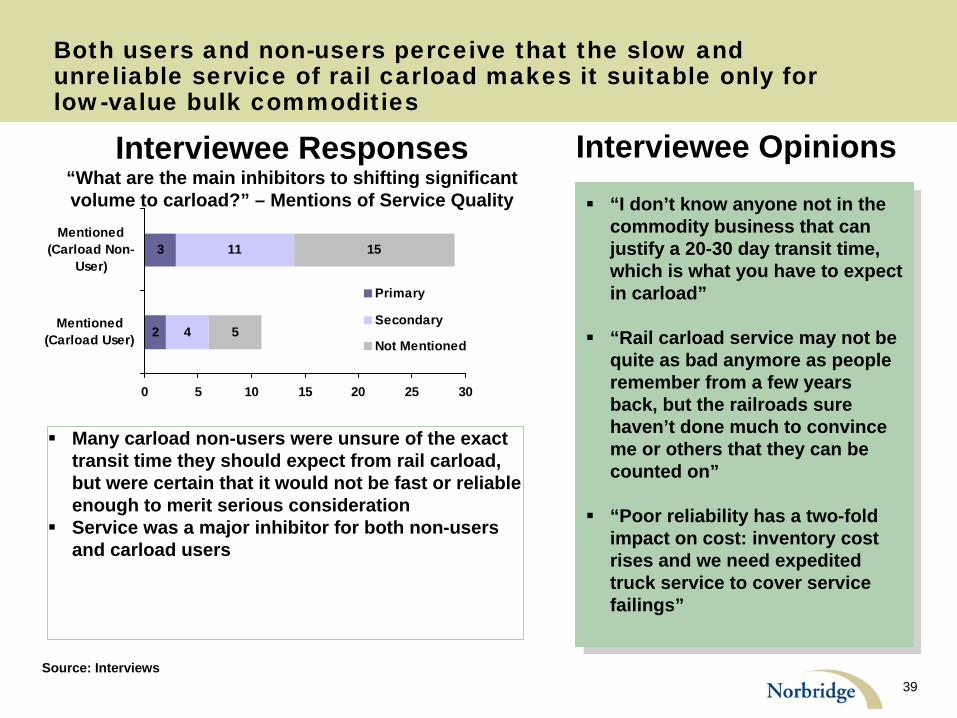
Both users and non-users perceive that the slow and unreliable service of rail carload makes it suitable only for low-value bulk commodities
Source: Interviews
“I don’t know anyone not in the commodity business that can justify a 20-30 day transit time, which is what you have to expect in carload”
“Rail carload service may not be quite as bad anymore as people remember from a few years back, but the railroads sure haven’t done much to convince me or others that they can be counted on”
“Poor reliability has a two-fold impact on cost: inventory cost rises and we need expedited truck service to cover service failings”
2
3
4
11
5
15
0 5 10 15 20 25 30
Mentioned(Carload User)
Mentioned(Carload Non-
User)
Primary
Secondary
Not Mentioned
Interviewee Responses“What are the main inhibitors to shifting significant volume to carload?” – Mentions of Service Quality
Interviewee Opinions
Many carload non-users were unsure of the exact transit time they should expect from rail carload, but were certain that it would not be fast or reliable enough to merit serious consideration
Service was a major inhibitor for both non-users and carload users
40
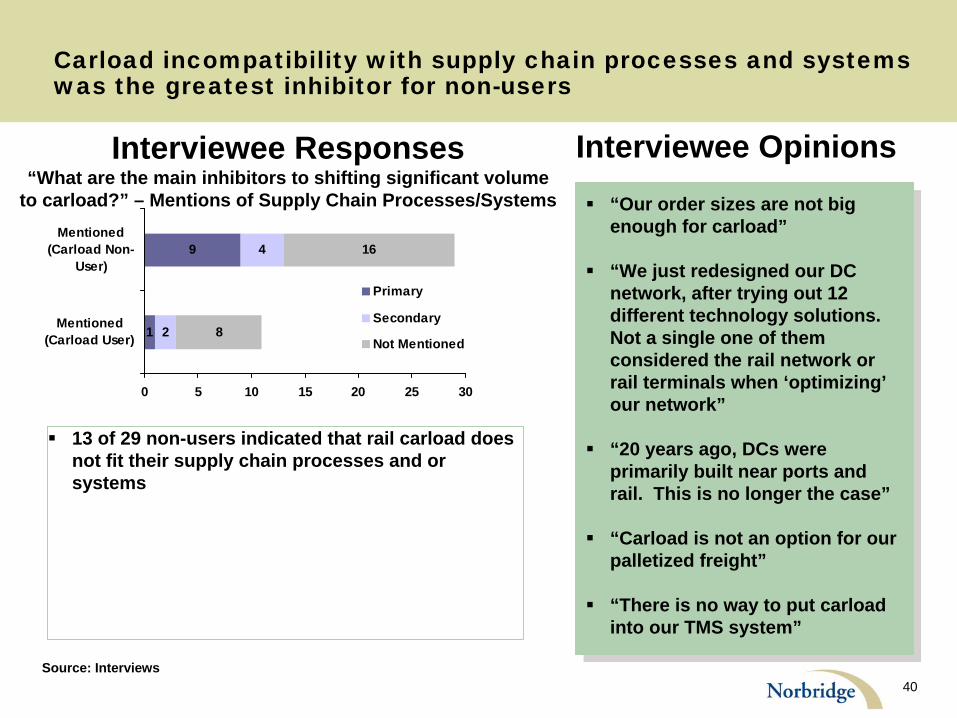
Carload incompatibility with supply chain processes and systems was the greatest inhibitor for non-users
Source: Interviews
“Our order sizes are not big enough for carload”
“We just redesigned our DC network, after trying out 12 different technology solutions. Not a single one of them considered the rail network or rail terminals when ‘optimizing’ our network”
“20 years ago, DCs were primarily built near ports and rail. This is no longer the case”
“Carload is not an option for our palletized freight”
“There is no way to put carload into our TMS system”
1
9
2
4
8
16
0 5 10 15 20 25 30
Mentioned(Carload User)
Mentioned(Carload Non-
User)
Primary
Secondary
Not Mentioned
Interviewee Responses“What are the main inhibitors to shifting significant volume
to carload?” – Mentions of Supply Chain Processes/Systems
Interviewee Opinions
13 of 29 non-users indicated that rail carload does not fit their supply chain processes and or systems
41
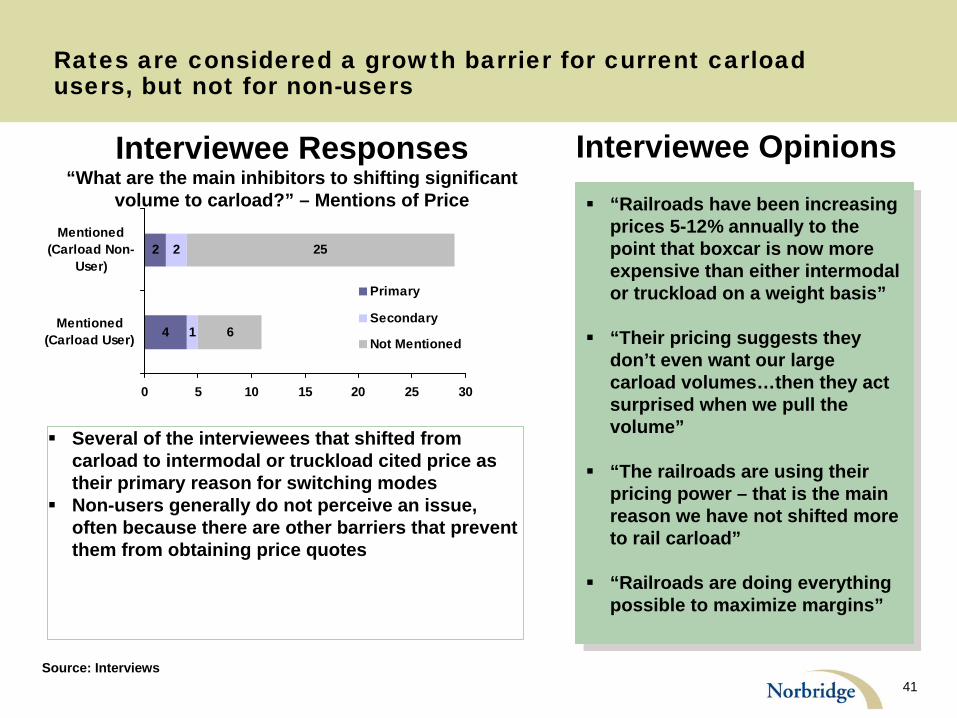
Rates are considered a growth barrier for current carload users, but not for non-users
“Railroads have been increasing prices 5-12% annually to the point that boxcar is now more expensive than either intermodal or truckload on a weight basis”
“Their pricing suggests they don’t even want our large carload volumes…then they act surprised when we pull the volume”
“The railroads are using their pricing power – that is the main reason we have not shifted more to rail carload”
“Railroads are doing everything possible to maximize margins”
Source: Interviews
4
2
6
25
1
2
0 5 10 15 20 25 30
Mentioned(Carload User)
Mentioned(Carload Non-
User)
Primary
Secondary
Not Mentioned
Interviewee Responses“What are the main inhibitors to shifting significant
volume to carload?” – Mentions of Price
Interviewee Opinions
Several of the interviewees that shifted from carload to intermodal or truckload cited price as their primary reason for switching modes
Non-users generally do not perceive an issue, often because there are other barriers that prevent them from obtaining price quotes
42
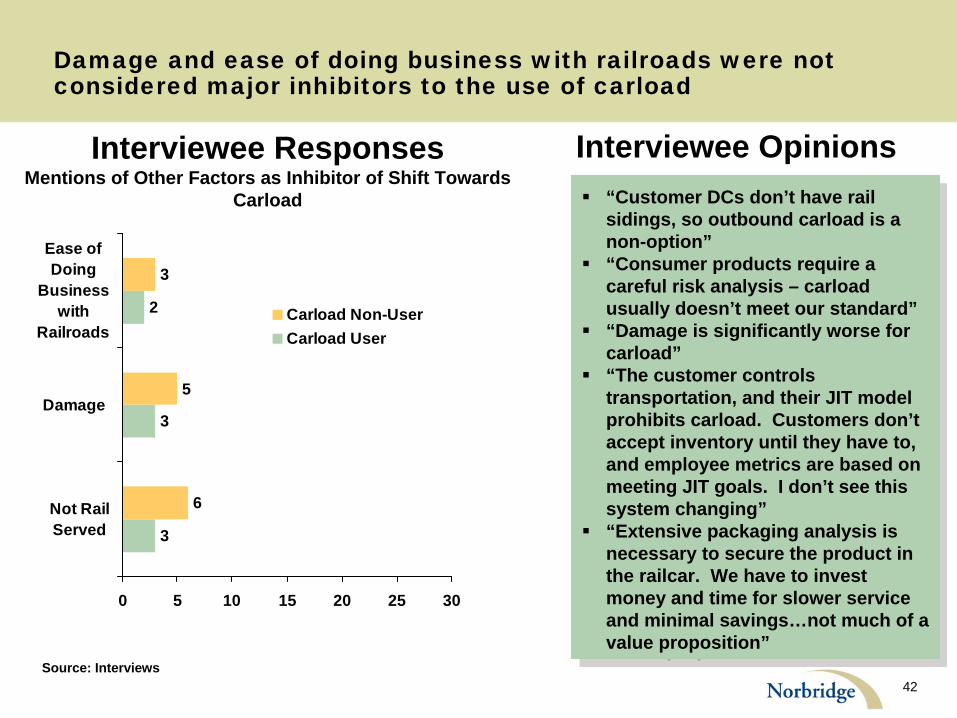
Damage and ease of doing business with railroads were not considered major inhibitors to the use of carload
Source: Interviews
“Customer DCs don’t have rail sidings, so outbound carload is a non-option”
“Consumer products require a careful risk analysis – carload usually doesn’t meet our standard”
“Damage is significantly worse for carload”
“The customer controls transportation, and their JIT model prohibits carload. Customers don’t accept inventory until they have to, and employee metrics are based on meeting JIT goals. I don’t see this system changing”
“Extensive packaging analysis is necessary to secure the product in the railcar. We have to invest money and time for slower service and minimal savings…not much of a value proposition”
Interviewee ResponsesMentions of Other Factors as Inhibitor of Shift Towards
Carload
3
3
2
6
5
3
0 5 10 15 20 25 30
Not RailServed
Damage
Ease ofDoing
Businesswith
RailroadsCarload Non-UserCarload User
Interviewee Opinions
43
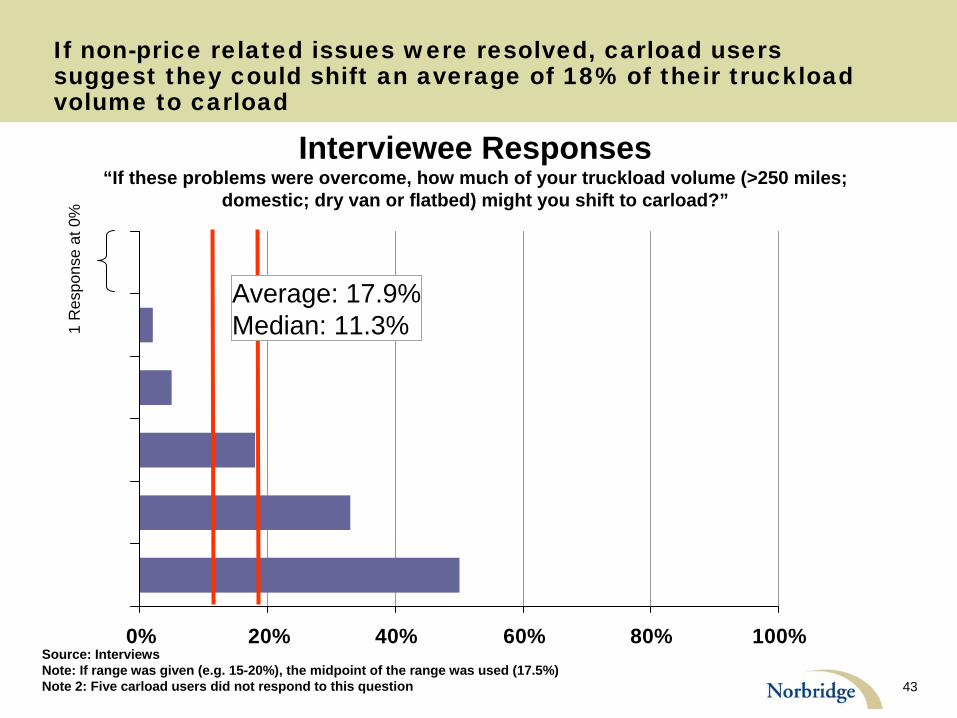
If non-price related issues were resolved, carload users suggest they could shift an average of 18% of their truckload volume to carload
0% 20% 40% 60% 80% 100%
Interviewee Responses“If these problems were overcome, how much of your truckload volume (>250 miles;
domestic; dry van or flatbed) might you shift to carload?”
Source: Interviews Note: If range was given (e.g. 15-20%), the midpoint of the range was used (17.5%) Note 2: Five carload users did not respond to this question
Average: 17.9%Median: 11.3%1
Res
pons
e at
0%
44
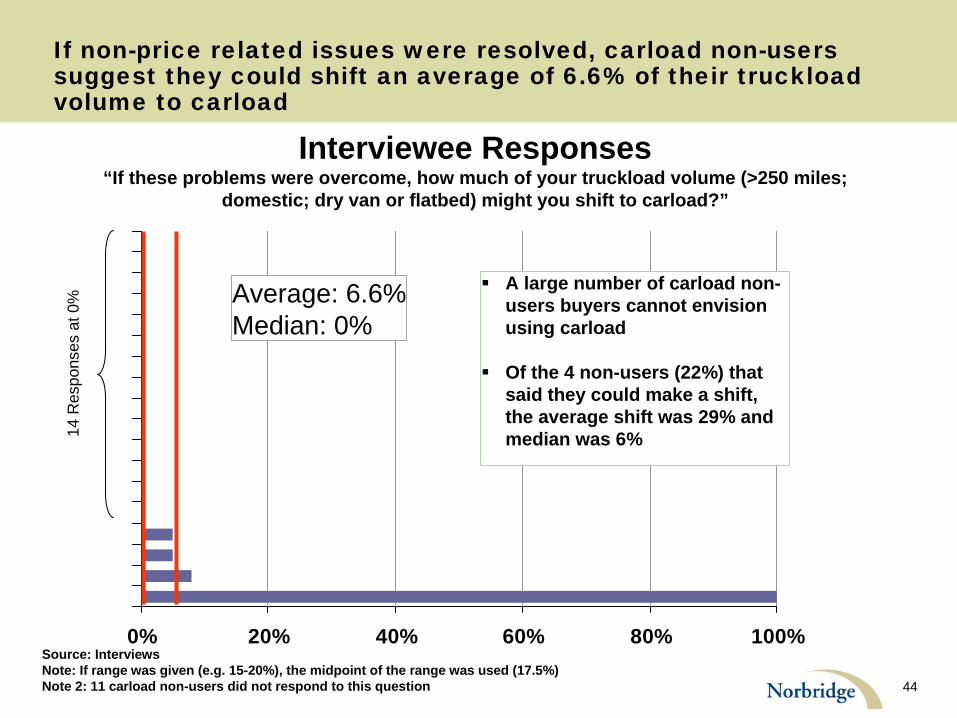
If non-price related issues were resolved, carload non-users suggest they could shift an average of 6.6% of their truckload volume to carload
Interviewee Responses“If these problems were overcome, how much of your truckload volume (>250 miles;
domestic; dry van or flatbed) might you shift to carload?”
0% 20% 40% 60% 80% 100%
Average: 6.6%Median: 0%
A large number of carload non- users buyers cannot envision using carload
Of the 4 non-users (22%) that said they could make a shift, the average shift was 29% and median was 6%
Source: Interviews Note: If range was given (e.g. 15-20%), the midpoint of the range was used (17.5%) Note 2: 11 carload non-users did not respond to this question
14 R
espo
nses
at 0
%

Lee Clair Partner Norbridge, Inc. 570 Lake Cook Rd., Suite 301 Deerfield, IL 60015
(847) 405-9845 [email protected] http://www.norbridgeinc.com