information to users broken or indistinct print,...
TRANSCRIPT
Cocaine detection in hair: Effect of retroviralinfection, age, morphine, and alcohol
Item Type text; Thesis-Reproduction (electronic)
Authors Poet, Torka Sue, 1966-
Publisher The University of Arizona.
Rights Copyright © is held by the author. Digital access to this materialis made possible by the University Libraries, University of Arizona.Further transmission, reproduction or presentation (such aspublic display or performance) of protected items is prohibitedexcept with permission of the author.
Download date 06/06/2018 15:53:33
Link to Item http://hdl.handle.net/10150/291477
INFORMATION TO USERS
This manuscript has been reproduced from the microfilm master. UMI
films the text directly from the original or copy submitted. Thus, some
thesis and dissertation copies are in typewriter face, while others may
be from any type of computer printer.
The quality of this reproduction is dependent upon the quality of the copy submitted. Broken or indistinct print, colored or poor quality
illustrations and photographs, print bleedthrough, substandard margins,
and improper alignment can adversely affect reproduction.
In the unlikely event that the author did not send UMI a complete
manuscript and there are missing pages, these will be noted. Also, if
unauthorized copyright material had to be removed, a note will indicate
the deletion.
Oversize materials (e.g., maps, drawings, charts) are reproduced by
sectioning the original, beginning at the upper left-hand corner and
continuing from left to right in equal sections with small overlaps. Each
original is also photographed in one exposure and is included in
reduced form at the back of the book.
Photographs included in the original manuscript have been reproduced
xerographically in this copy. Higher quality 6" x 9" black and white
photographic prints are available for any photographs or illustrations
appearing in this copy for an additional charge. Contact UMI directly
to order.
University Microfilms International A Bell & Howell Information Company
300 North Zeeb Road, Ann Arbor, Ml 48106-1346 USA 313/761-4700 800/521-0600

Order Number 1345418
Cocaine detection in hair: Effect of retroviral infection, age, morphine, and alcohol
Poet, Torka Sue, M.S.
The University of Arizona, 1991
U'M-I 300 N. ZeebRd. Ann Arbor, MI 48106

COCAINE DETECTION IN HAIR: Effect Of
Retroviral Infection, Age, Morphine, and Alcohol
by
Torka Sue Poet
A Thesis Submitted to the Faculty of the
DEPARTMENT OF PHARMACOLOGY AND TOXICOLOGY
In Partial Fulfillment of the Requirements For the Degree
MASTER OF SCIENCE WITH A MAJOR IN TOXICOLOGY
In the Graduate College
THE UNIVERSITY OF ARIZONA
19 9 1
2
STATEMENT BY AUTHOR
This thesis has been submitted in partial fulfillment of requirements for an advanced degree at The University of Arizona and is deposited in the University Library to be made available to borrowers under rules of the Library.
Brief quotation from this thesis are allowable without special permission, provided that accurate acknowledgment of source is made. Requests for permission for extended quotation from or reproduction of this manuscript in whole or in part may be granted by the head of the major department or the Dean of the Graduate College when in his or her judgment the proposed use of the material is in the interests of scholarship. In all other instances, however, permission must be obtained from the author.
Signed: Sjr-— Torka £f. Poet
APPROVAL BY THESIS DIRECTOR This thesis has been approved on the date shown below:
PmnaJ f,(Jcc£z - 7/ ftohald R. Watson Date Research Professor Dept of Family and Community Medicine
ACKNOWLEDGMENTS
There are a number of people to whom I would like to extend my heartfelt gratitude for their wisdom and guidance. X would like to express my appreciation for their assistance to my committee, Ronald R. Watson, Michael Mayersohn and Paul Consroe. My sincere thanks to everyone in Dr. Watson's lab in Family and Community Medicine, especially Dr. Fransisca Martinez, Dr. Hamid Darban, and Dr. Guan-Jie Chen. I would also like to thank Dr. Bernhard Watzl for his assistance in the translation of German texts.
This thesis is dedicated to my mother for trying to understand and because everyone dedicates their thesis to their mother.
4
TABLE OF CONTENTS
Page
List of Figures 5
List of Tables 6
Abstract 7
Chapter 1: Introduction 8
Chapter 2: Effect of Murine Retroviral Infection on
Hair and Serum Levels of Cocaine and Morphine 20
Chapter 3: Ethanol Induced Changes in Serum and Hair
Cocaine Concentrations 39
Chapter 4: Cocaine Metabolite in Hair end Urine of
Drug Users 52
Chapter 5: Cocaine Associated Abnormalities in
Natural Killer Cell Function in Drug Users 74
Chapter 6: Concluding Discussion 92
References 96
5
LIST OF ILLISTATRIONS
Figure Page
1.1 Diagram of Hair Follicle 17
2.1 Effect of Retroviral Infection on Hair Cocaine
Concentrations 34
2.2 Effect of Retroviral Infection on Hair Morphine
Concentrations 35
3.1 Serum Cocaine Concentrations 2 Hours After
Injection 48
3.2 Serum Cocaine Concentrations 24 Hours After
Injection 49
3.3 Effect of Ethanol on Hair Cocaine Concentrations....50
3.4 Serum Ethanol Concentrations 51
4.1 Detection Limit for Cannabinoids in Urine 67
4.2 Detection Limit for Benzoylecgonine in Urine 68
4.3 Detection Limit for Benzoylecgonine in Hair 69
4.4 Comparison of Hair and Urine Cocaine Calibration
Curves 70
4.5 Cocaine Content of Hair 71
4.6 Last Reported Use of Marijuana and Urine
Concentration 72
5.1 Scatterplot of Ranked Hair Cocaine Levels and
NK Cell Activity 73
6
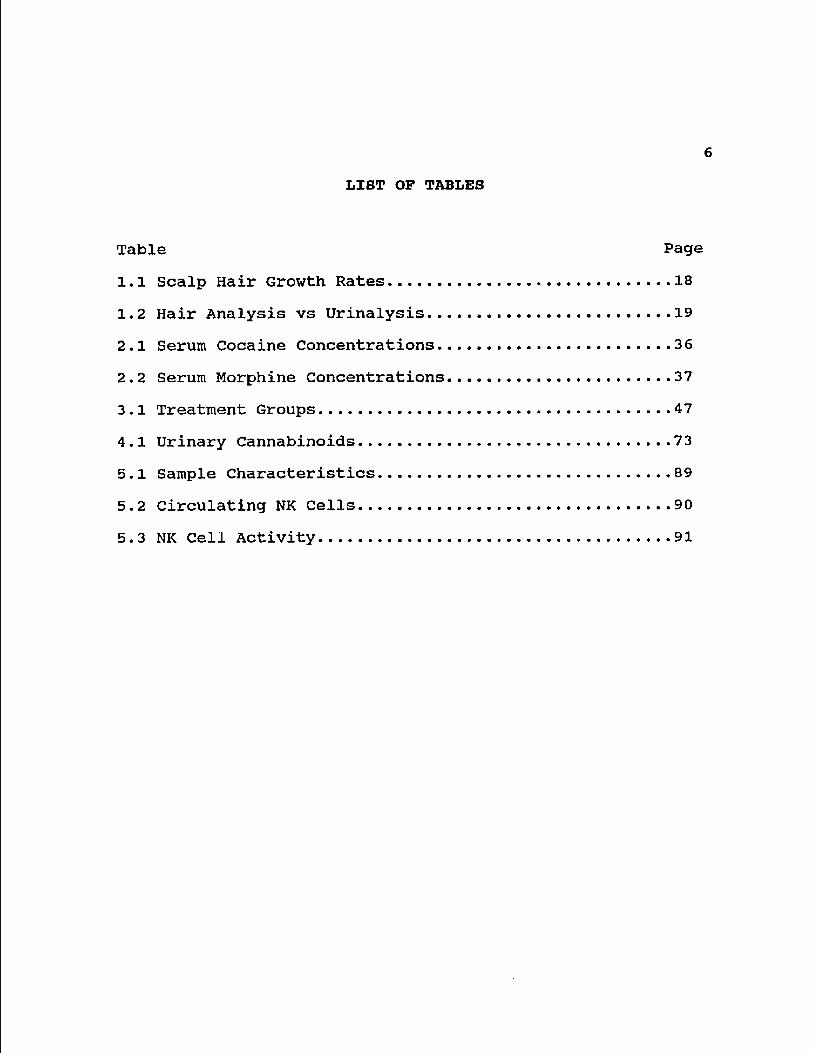
LIST OF TABLES
Table Page
1.1 Scalp Hair Growth Rates 18
1.2 Hair Analysis vs Urinalysis 19
2.1 Serum Cocaine Concentrations 36
2.2 Serum Morphine Concentrations 37
3.1 Treatment Groups 47
4.1 Urinary Cannabinoids 73
5.1 Sample Characteristics 89
5.2 Circulating NK Cells 90
5.3 NK Cell Activity 91
7
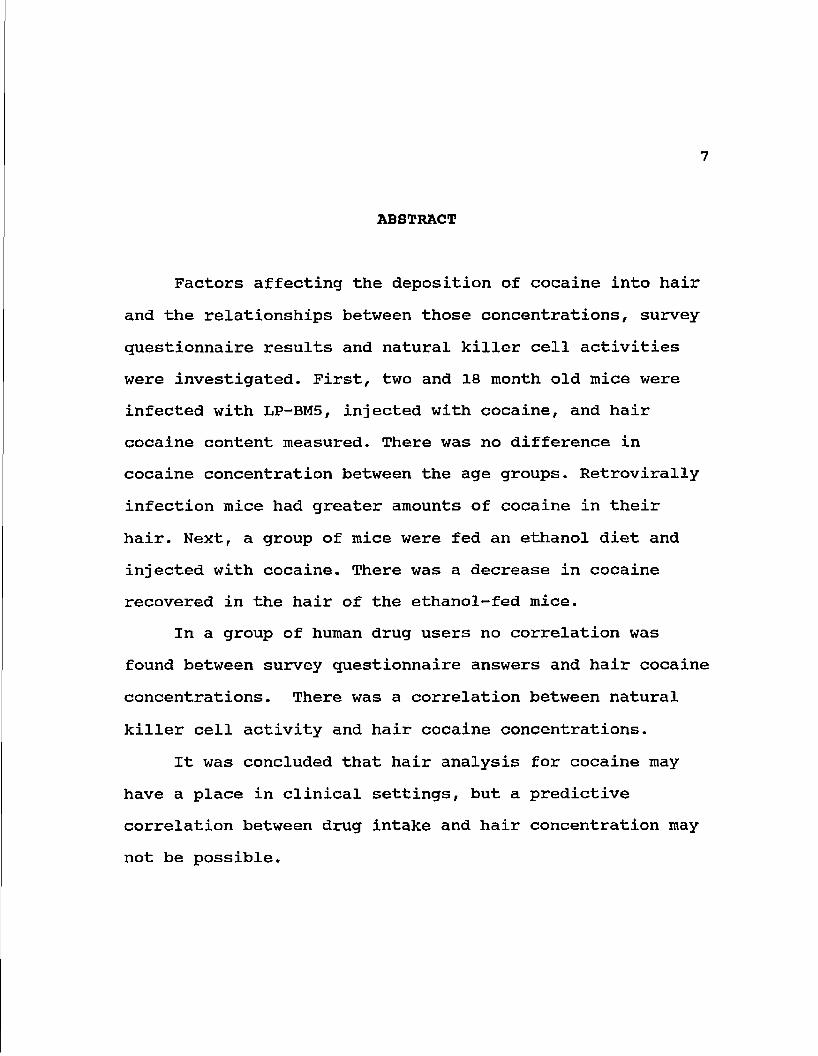
ABSTRACT
Factors affecting the deposition of cocaine into hair
and the relationships between those concentrations, survey
questionnaire results and natural killer cell activities
were investigated. First, two and 18 month old mice were
infected with LP-BM5, injected with cocaine, and hair
cocaine content measured. There was no difference in
cocaine concentration between the age groups. Retrovirally
infection mice had greater amounts of cocaine in their
hair. Next, a group of mice were fed an ethanol diet and
injected with cocaine. There was a decrease in cocaine
recovered in the hair of the ethanol-fed mice.
In a group of human drug users no correlation was
found between survey questionnaire answers and hair cocaine
concentrations. There was a correlation between natural
killer cell activity and hair cocaine concentrations.
It was concluded that hair analysis for cocaine may
have a place in clinical settings, but a predictive
correlation between drug intake and hair concentration may
not be possible.
8
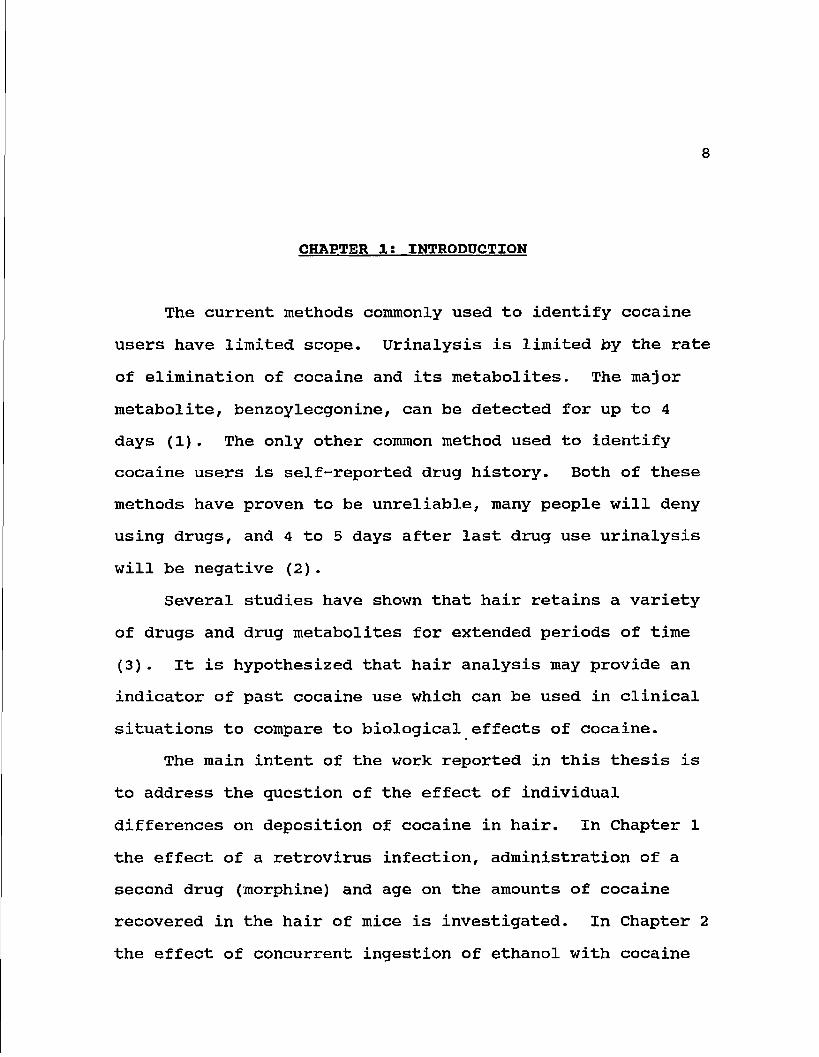
CHAPTER l: INTRODUCTION
The current methods commonly used to identify cocaine
users have limited scope. Urinalysis is limited by the rate
of elimination of cocaine and its metabolites. The major
metabolite, benzoylecgonine, can be detected for up to 4
days (1). The only other common method used to identify
cocaine users is self-reported drug history. Both of these
methods have proven to be unreliable, many people will deny
using drugs, and 4 to 5 days after last drug use urinalysis
will be negative (2).
Several studies have shown that hair retains a variety
of drugs and drug metabolites for extended periods of time
(3). It is hypothesized that hair analysis may provide an
indicator of past cocaine use which can be used in clinical
situations to compare to biological effects of cocaine.
The main intent of the work reported in this thesis is
to address the question of the effect of individual
differences on deposition of cocaine in hair. In Chapter 1
the effect of a retrovirus infection, administration of a
second drug (morphine) and age on the amounts of cocaine
recovered in the hair of mice is investigated. In Chapter 2
the effect of concurrent ingestion of ethanol with cocaine
9
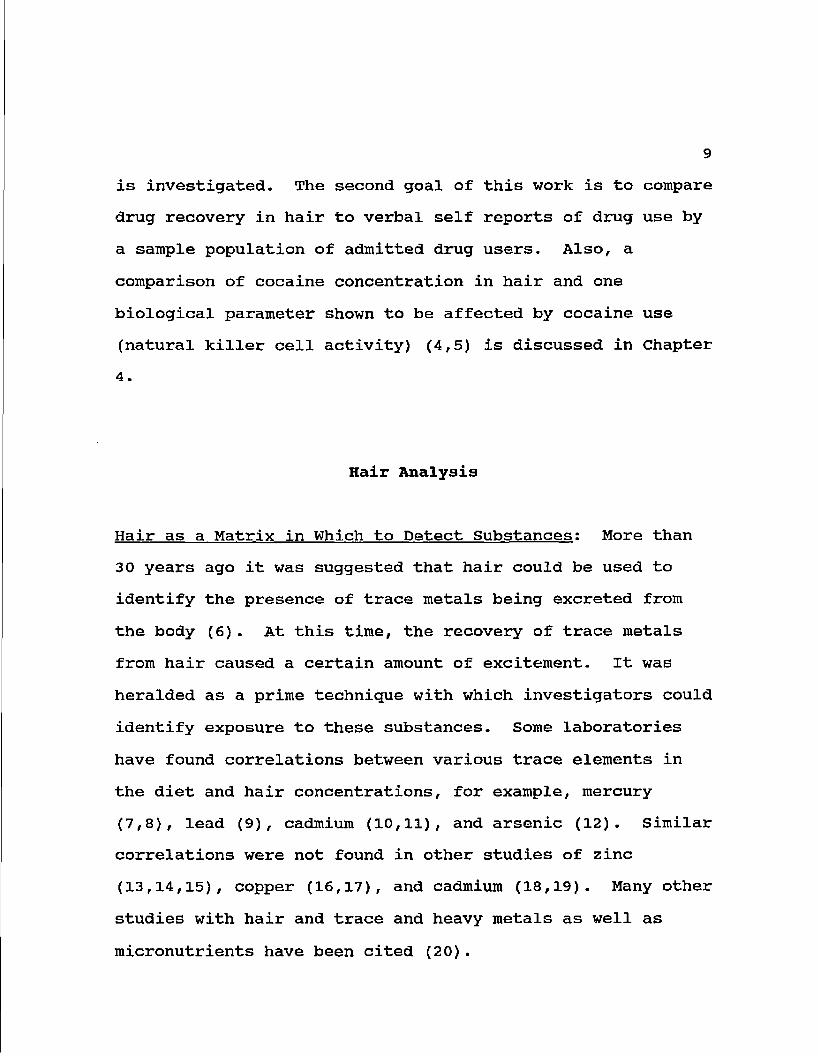
is investigated. The second goal of this work is to compare
drug recovery in hair to verbal self reports of drug use by
a sample population of admitted drug users. Also, a
comparison of cocaine concentration in hair and one
biological parameter shown to be affected by cocaine use
(natural killer cell activity) (4,5) is discussed in Chapter
4 .
Hair Analysis
Hair as a Matrix in Which to Detect Substances: More than
30 years ago it was suggested that hair could be used to
identify the presence of trace metals being excreted from
the body (6). At this time, the recovery of trace metals
from hair caused a certain amount of excitement. It was
heralded as a prime technique with which investigators could
identify exposure to these substances. Some laboratories
have found correlations between various trace elements in
the diet and hair concentrations, for example, mercury
(7,8), lead (9), cadmium (10,11), and arsenic (12). Similar
correlations were not found in other studies of zinc
(13,14,15), copper (16,17), and cadmium (18,19). Many other
studies with hair and trace and heavy metals as well as
micronutrients have been cited (20).
10
The use of hair to detect drugs was first reported in
1954 when Goldblum et al. measured barbiturate
concentrations in the hair of guinea pigs (21). In 1974
Harrison et al. first suggested that hair had the potential
to serve as a "sensitive indicator of past consumption by
humans of amphetamines and related drugs" (22) . In 1979 a
process was described by which hair samples of opiate users
could be screened for the presence of drug metabolites (23).
A correlation was found between the time of opiate use and
the distribution of a drug metabolite (morphine) along the
length of the hair shaft. Subsequent studies indicated that
a variety of other drugs including cocaine (24,25),
phencyclidine (26), amphetamines (27,28), haloperidol (29),
and nicotine (27,30) can also be detected by hair analysis.
Although there have been reports of the detection of
marijuana metabolites in hair (31,32), these remain to be
validated (33).
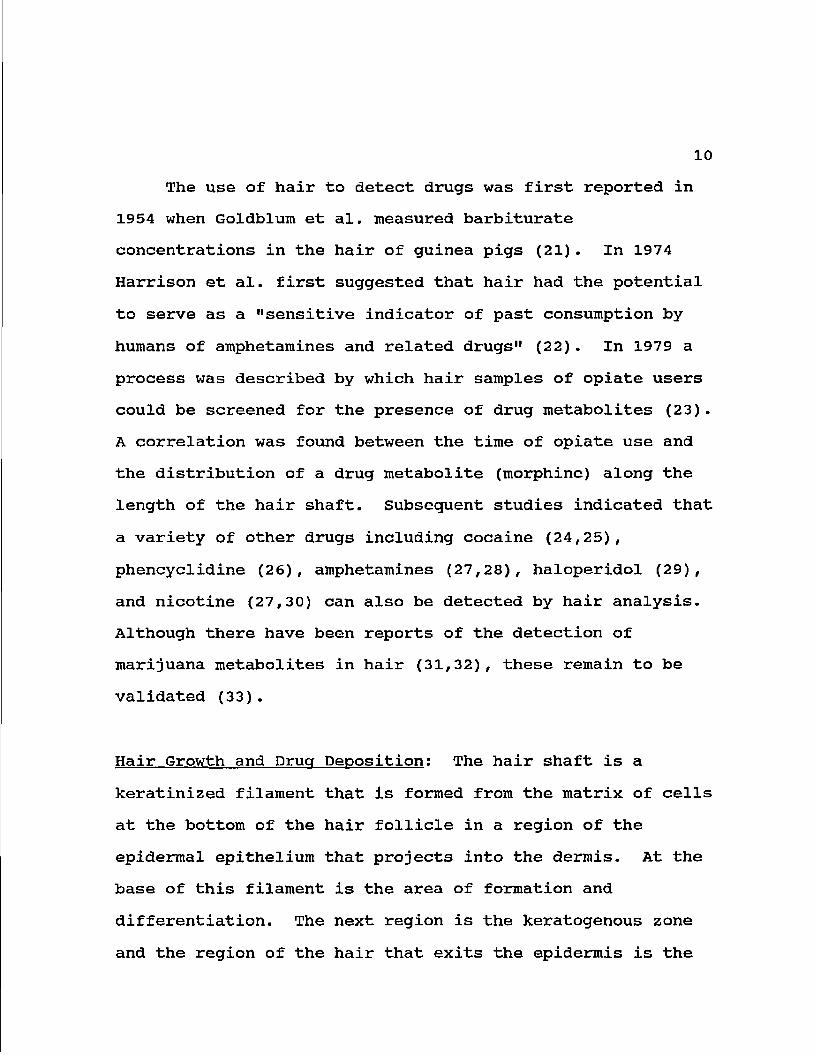
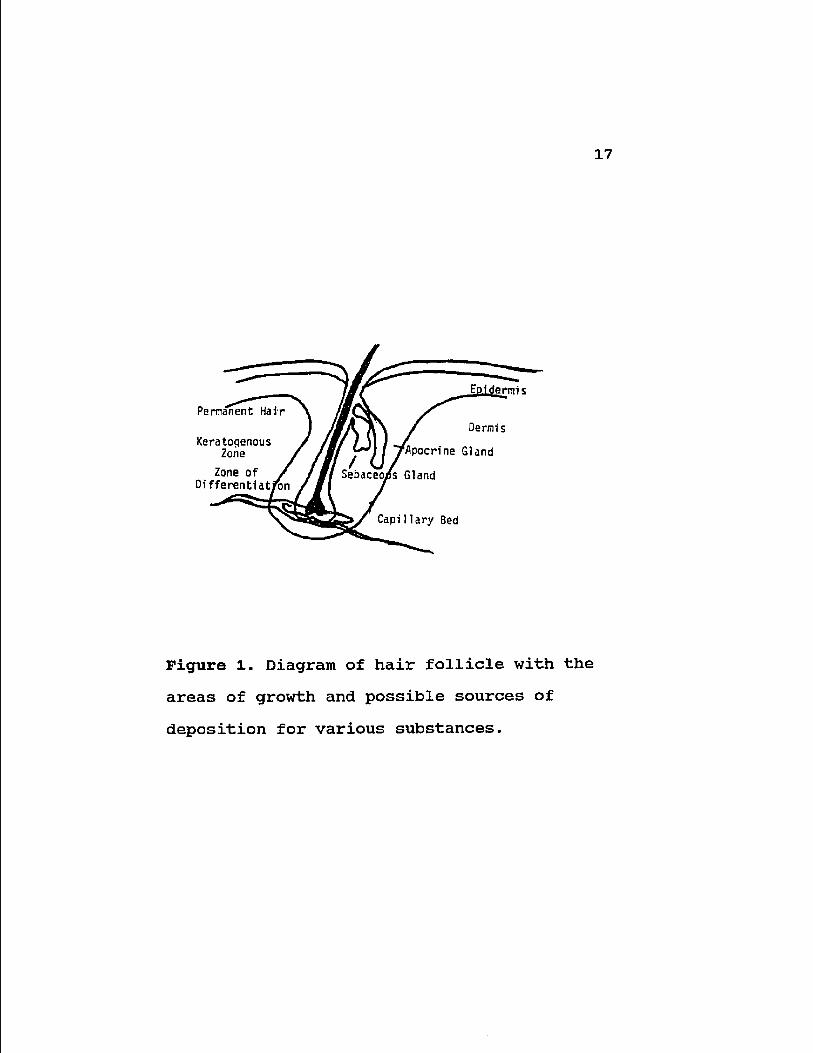
Hair Growth and Drug Deposition: The hair shaft is a
keratinized filament that is formed from the matrix of cells
at the bottom of the hair follicle in a region of the
epidermal epithelium that projects into the dermis. At the
base of this filament is the area of formation and
differentiation. The next region is the keratogenous zone
and the region of the hair that exits the epidermis is the
11
permanent hair that results from these two processes (Fig.
1). The permanent hair fiber is a complex of special,
highly cross-linked proteins that coalesce and condense into
a permanent horny mass. The cross-section of the hair is
divided into three general regions, the outer cuticle, the
cortex and the central medulla (34).
Hair growth rate is highly variable at different body
locations, between different individuals, at different times
and ages, and even for different sexes and races (20,3).
Hair is not continually being produced. Intra- and inter-
individual variation in growth rate is remarkable in the
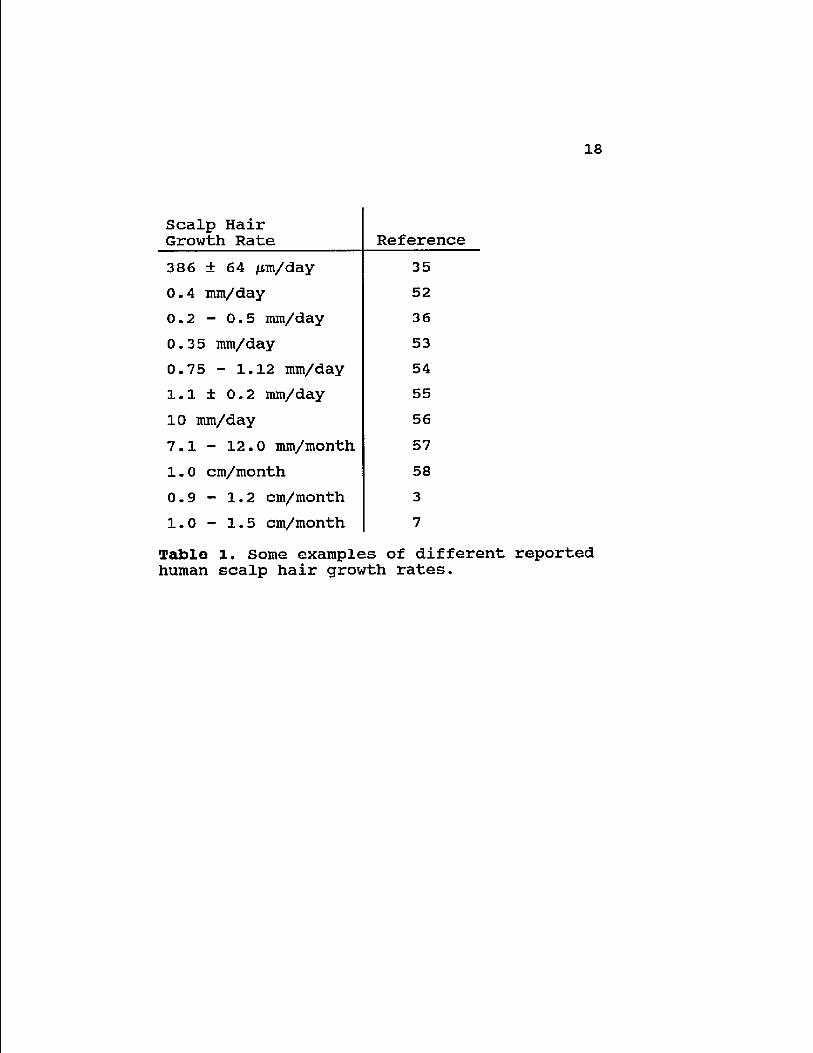
head region alone (3,35). Different investigators have
reported large differences in rates of growth (Table 1).
There are three phases of hair growth which each individual
follicle undergoes; anagen, catagen and telogen. Only
during the actual growth phase, anagen, can substances
become deposited in the hair (3). The normal cycling
through the phases can be altered by disease and nutritional
states (21).
It has never been shown exactly how trace elements are
deposited in hair, but in 1977 Hopps proposed four possible
sources (36): first, uptaken during histogenesis? second,
deposition by sebum; third, absorption from eccrine sweat;
and fourth, those deposition from the external environment
or preparations applied to the scalp (e.g. cosmetics).
12
Various cleaning procedures have been used to
differentiate between endogenous and exogenous sources of
elements or drug metabolites (37). Assuming these methods
to be effective, Hopps' suggestion of external sources of
trace element deposition hair (and by extension drug
metabolites) can be ruled out. During histogenesis
substances can be deposited into the hair from either the
circulating blood or from the sebum which is produced by the
sebaceous gland at the base of the follicular epithelium and
can flow into and impregnate the hair shaft (36,37).
Baumgartner has proposed that drug metabolites are
incorporated into the hair from the vast capillary beds that
surround the growing hair follicle and that the metabolites
are bound to sulfhydryl groups which are prevalent in hair
(38) .
Most methods of extraction of drug metabolites from
hair are relatively mild techniques (39), with one enzymatic
exception (40). This indicates that the drug or its
metabolite are not covalently bound within the hair shaft.
Hair also contains many carboxyl groups and these may also
present possible non-covalent binding sites. Binding to
amino groups has also been proposed (41).
Analysis: The plethora of variables already in existence
makes standardization of the procedures involved with sample
13
collection, extraction, and analysis very important.
Standardization has not been done, although suggestions for
its achievement have been made. The International Atomic
Energy Agency (IAEA) developed a protocol for the analysis
of hair as an indicator of contamination by environmental
trace elements in 1978, which they revised and made less
complicated in 1984 (20,42). The Hair Analysis Standards
Board also proposed a standardized procedure for the
collection of samples (43). The only report specifically
suggesting procedures for drug detection in hair was
published in 1988 by Harkey and Henderson (3). All of these
procedures discuss body location of sample collection in
detail. The original IAEA procedure even suggested the
collection of samples from 5 different specific sites on the
scalp of all subjects. The second report suggests taking
just one sample from the occipital region. Harkey and
Henderson suggest always collecting samples from the vortex
posterior region of the head. The collection of samples
from other body areas has also been discussed, but the Hair
Analysis Standards Board report disputes the
"interpretability" of these data (43), and the suitability
of samples collected from other areas is questioned by
Harkey and Henderson (3). One report on marijuana in hair
did compare pubic to scalp hair and the investigators
concluded that pubic hair was actually a better source (32).
14
A year after this report, however all of their data was
questioned (33).
There is no consistency in any reports on sample size
or for the washing of the sample. It has not even been
proven that any washing procedure removes all external
contamination and at the same time only removes the external
contamination (44). Extraction procedures are similar for
similar drugs, but these also vary.
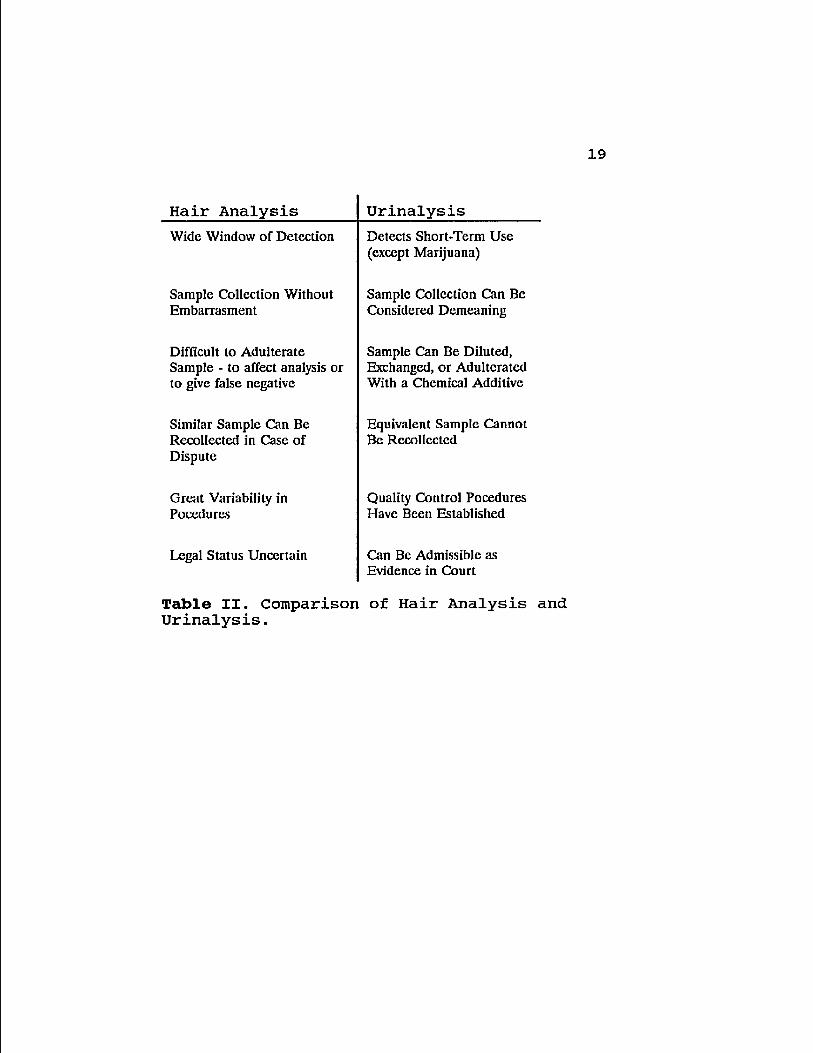
Hair versus Urine: Hair is touted as having many advantages
over urine in which to detect the use of drugs (Table 2).
In the early 1970s hair testing was also thought to be the
key to defining toxic exposure to metals and for the
diagnosis of nutritional deficiencies, however, it has since
been shown that there is substantial variation among exposed
and unexposed individuals (45,46,47) and Cone has gone so
far as to suggest that hair testing for nutritional status
is "quackery" (44) . It seems that this labelling of hair
testing for metals, some vitamins and essential elements has
tainted the reputation of hair analysis and has caused its
use to be questioned for any tests, including drugs.
The major advantage to hair analysis is the window of
detection (37). Urine represents a "momentary look" at the
individuals drug use (44). Drug use can be detected in hair
for the length of time that that hair has been growing. If
an amount of drug is trapped in the keratin during hair cell
growth it remains entrapped indefinitely after the cells die
leaving behind the inert fiber. Thus hair should be able to
give an historical pattern of drug exposure to the growing
hair. The questions concerning drug entry and hair growth
make quantification and validation of this procedure in the
human population impossible to determine.
It has been proposed that hair be used as a "safety
net" for urinalysis. False positives and negatives are said
to occur more rarely (or never) in hair (48). Also, one
positive urine test can be defended with a claim of
external or inadvertent exposure, whereas a positive hair
test can be sectioned and an individual, one exposure, area
can be identified and compared to the rest of the length of
hair. Alternatively, another, more-or-less equivalent,
sample can be obtained.
Current Status of Hair Analysis for Drug Testing; A recent
decision by the United States Food and Drug Administration
(FDA) limits the use of hair analysis in mass screening
procedures for drugs of abuse on the basis that quality
control has not yet been established (49). The FDA issued a
statement which expressed doubt as to the applicability of
radioimmunoassay (the analytical method generally used) to
prove the presence of a drug (50). In May of 1990 a panel

16
of judiciaries and scientists from the National Institute on
Drug Abuse and the Society of Forensic Toxicology held a
conference to evaluate hair analysis for drugs of abuse
(51). This panel outlined a list of factors they believe
must be attended to in order to evaluate any test results
from hair analysis. Included in this list is the suggestion
that hair analysis not stand alone in any diagnosis (i.e.,
should be confirmed by another test) and that
standardizations should be developed. They also stressed
the importance of compiling more information on certain
aspects of drug deposition in hair and hair analysis;
namely, mechanisms of drug incorporation, relationship
between drug use and concentration in hair, minimum dose
required for a positive result, time interval between use
and appearance in hair, effect of various washing
procedures, and how drug incorporation and retention is
affected by individual differences.
17
cfiidernris
Dermis
Apocrine Gland
Sebaceous Gland
Capillary Bed
Permanent Hair
Keratogenous Zone
Zone of Differentiation
Figure 1. Diagram of hair follicle with the
areas of growth and possible sources of
deposition for various substances.
18
Scalp Hair Growth Rate Reference
386 + 64 /m/day 35
0.4 mm/day 52
0.2 - 0.5 mm/day 36
0.35 mm/day 53
0.75 - 1.12 mm/day 54
l.l ± 0.2 mm/day 55
10 mm/day 56
7.1 - 12.0 mm/month 57
1.0 cm/month 58
0.9 - 1.2 cm/month 3
1.0 - 1.5 cm/month 7
Table 1. Some examples of different reported human scalp hair growth rates.
19
Hair Analysis Urinalysis
Wide Window of Detection Detects Short-Term Use (except Marijuana)
Sample Collection Without Embarrasment
Sample Collection Can Be Considered Demeaning
Difficult to Adulterate Sample - to affect analysis or to give false negative
Sample Can Be Diluted, Exchanged, or Adulterated With a Chemical Additive
Similar Sample Can Be Recollected in Case of Dispute
Equivalent Sample Cannot Be Recollected
Great Variability in Pocedures
Quality Control Pocedures Have Been Established
Legal Status Uncertain Can Be Admissible as Evidence in Court
Table II. Comparison of Hair Analysis and Urinalysis.
20
CHAPTER 2: EFFECT OF MPRINE RETROVIRAL INFECTION ON
HAIR AND SERUM CONCENTRATIONS OF COCAINE AND MORPHINE
Introduction: During the last few years the incidence of
drug abuse in the United States has shown a dramatic
increase. The National Institute on Drug Abuse reported at
least a five-fold increase in the use of cocaine over the
last decade (59). These data frequently come from self-
reporting in survey questionnaires, with significant
opportunity for respondent errors and hence inaccuracy of
the numbers obtained (60). Testing for the presence of
drugs of abuse and/or their metabolites in hair may provide
a more reliable clinical measurement which also can be used
to validate surveys (61).
While urine testing is the most common screening method
for estimating drug use, the half-life of elimination of
most narcotic drugs is generally only a few hours, with the
exception of marijuana metabolites, which can be identified
in urine for periods of seven to 30 days after exposure,
results from body fluid analysis generally reveal only
whether the individual has used drugs in the one to three
days prior to sample collection (62). About 90% of the
21
administered dose of morphine, the active metabolite of
heroin (diacetyl morphine), is excreted within 24 hours
(60). Reports on the time limits for the detection in urine
of benzoylecgonine, the major metabolite of cocaine, vary
from 17 to 46 hours after administration (62). Detectable
quantities of cocaine metabolites have been found in urine
120 hours after cessation in only a few cases following
heavy, chronic drug use (63).
The ability to detect drugs in hair may provide an
alternative to conventional urinalysis since, unlike
biological fluids, hair provides a long term record of drug
use. Drug metabolites may be detected in hair for several
months after the last known use of the drug, in contrast to
the few days during which they can be detected in urine
(3,38). However, no information is available regarding the
influence that age or viral infection may have relative to
the amount of cocaine or morphine recovered in hair or
serum.
The influence on drug disposition by viral infections
may be important as studies have shown that many drug users
have had hepatitis infections (64), and increased incidences
of hepatitis B, cytomegalovirus and Epstein-Barr virus
infections (65). In the United States, intravenous drug
users constitute the second largest "at risk" group for
developing AIDS (acquired immune deficiency syndrome) (66).
22
In the present study a mouse model was used to
investigate the effects that age, retroviral infection, and
drug injection have on concentrations of cocaine and
morphine in serum and hair. The retrovirus used was the LP-
BM5 murine leukemia virus, a mixture of ecotropic
recombinant and defective murine leukemia viruses, which
induces an acquired immunodeficiency syndrome in susceptible
mice that has many features in common with human AIDS (67-
69). We show here that retroviral infection influences the
amount of drug incorporated into developing hair follicles
following chronic administration of cocaine or morphine.
MATERIALS AND METHODS
Animals and Retroviral Infection; C57BL/6J female mice
obtained from Charles River Labs (Willington, MA) (ages 2
months and 18 months) were housed in a ventilated animal
room with a 12 hour light cycle. Food and water were
supplied ad libitum. The mice were infected by
intraperitoneal (i.p.) injection with 0.1 ml of the LP-BM5
murine leukemia virus inoculum which had an ecotropic titer
(xc) of 4.5 log10 plaque forming units per ml (70). The
non-infected control group was injected i.p. with 0.1 ml of
the saline vehicle.
Cocaine and Morphine Treatment: After one month of
infection with the virus, the mice were injected i.p. with
0.1 ml of saline, cocaine hydrochloride, morphine sulfate,
or both morphine and cocaine between 8:00 - 10:00 a.m. 5
days a week. Cocaine hydrochloride and morphine sulfate
were kindly provided by the National Institute of Drug
Abuse. The initial dosage of cocaine HC1 was 20 mg/kg/day
(first week), then 3 0 mg/kg/day (second week), and 50
mg/kg/day for the third week and thereafter. Morphine
sulfate was given on the same schedule, beginning with 20
mg/kg/day, then 35 mg/kg/day and 55 mg/kg/day for the third
week and thereafter. Mice that received both drugs were
given half of the dosage of each in a single injection. At
the same time, the saline control group received 0.1 ml of
saline i.p. according to the same schedule. Treatment was
continued for 6 weeks, after which time animals were
sacrificed under ether, and blood was collected from an
axillary vein, allowed to clot and centrifuged at 1500 rpm
to separate the serum. The serum was stored at -70°C for
later analysis.
Hair Sampling and Preparation: One day prior to beginning
the drug schedule, a hair sample was obtained by shaving a
small area (approximately 2 cm x 4 cm) just above the tail
of each mouse using electric clippers (OstarR) . This same
24
area was shaved again 28-30 hours after the last drug
treatment. The clipper blades were swabbed with 70% alcohol
between animals to avoid cross contamination. The hair was
stored at -20°C in sealed plastic bags for later analysis.
Drug Extraction from Hair and Assay: The method of
extraction of cocaine and morphine was modified from
Balabanova et al (71). Each hair sample was thoroughly
washed in 2-5 ml aliquots of a 10% soap solution (Tincture
Green Soap, Medical Chemical Corp.) and rinsed 5 times with
5 ml aliquots of distilled water. Air-dried 25 mg hair
samples were incubated at 37°C for 18 hr in 1.0 ml 0.1 M
hydrochloric acid. Aliquots of 0.4 ml of the acid were
neutralized with 40 fx 1 of 1.0 M sodium hydroxide to
approximately pH 7.5 and made up to 0.5 ml with phosphate-
buffered saline. Fifty microliter samples were analyzed
using a commercial radioimmunoassay kit purchased from
Diagnostic Products Corporation (Los Angeles, CA) according
to the manufacturer's recommended procedure. Twenty-five
microliter serum samples were analyzed using the
radioimmunoassay kit from Diagnostic Products Corporation
according to the manufacurer's recommended procedure.
Statistics: Treatment and age groups were compared using
analysis of variance. Any p value of 0.05 or less was
considered to indicate a significant difference.
25
RESULTS
Drug Recovery From Hair: A standard curve was prepared from
data obtained by dissolving the drugs to achieve
concentrations of 0.0 to 10.0 mg/ml of cocaine hydrochloride
or 0.0 to 1.0 mg/ml morphine sulfate in a 1:1
chloroform:methanol mixture. Aliquots (0.5 ml) were added
to 25 mg samples of drug-free hair and the solvent
evaporated under nitrogen gas at room temperature to achieve
concentrations of 0.0, 250, 500, 1,000, and 5,000 ng/sample
of cocaine, or 0.0, 2.5, 5.0, and 10.0 ng/sample of
morphine. The test calibrators supplied with the
radioimmunoassay (RIA) kit and the standard curve obtained
from the hair prepared in this fashion were compared, and no
appreciable difference was found (data not shown).
Therefore, the standard curve solutions provided in the kit
were used throughout the study. Data were reported as ng
drug/mg of hair extracted.
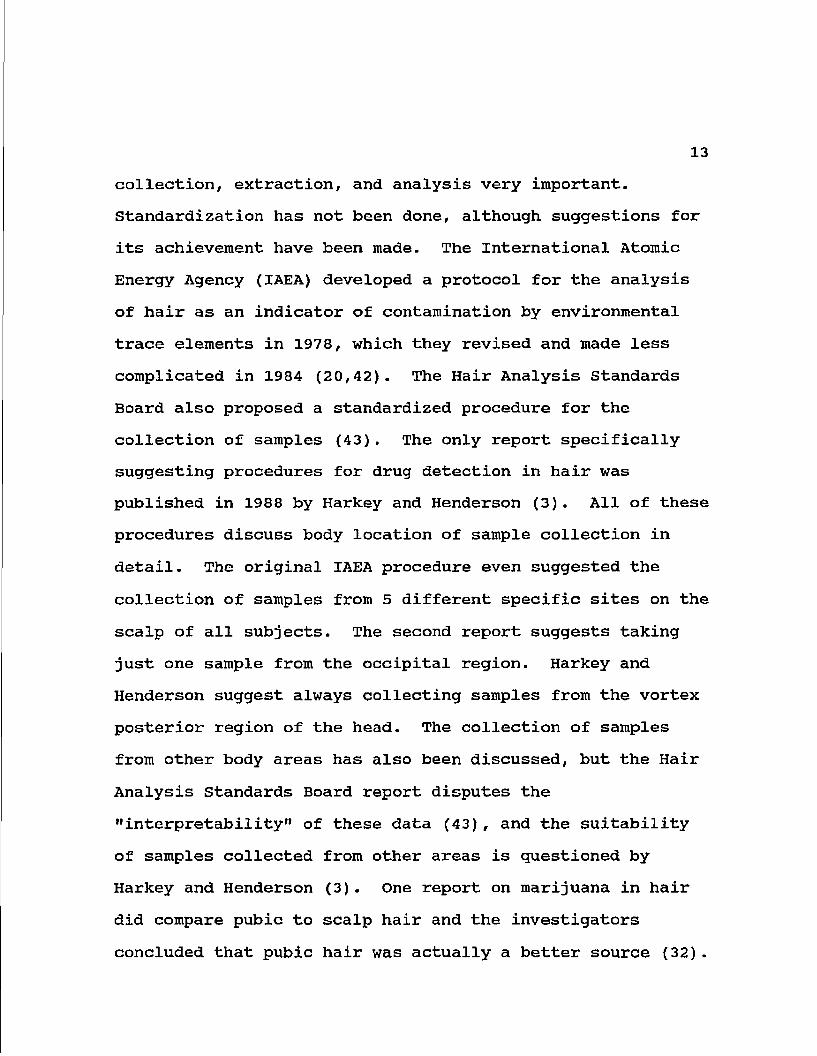
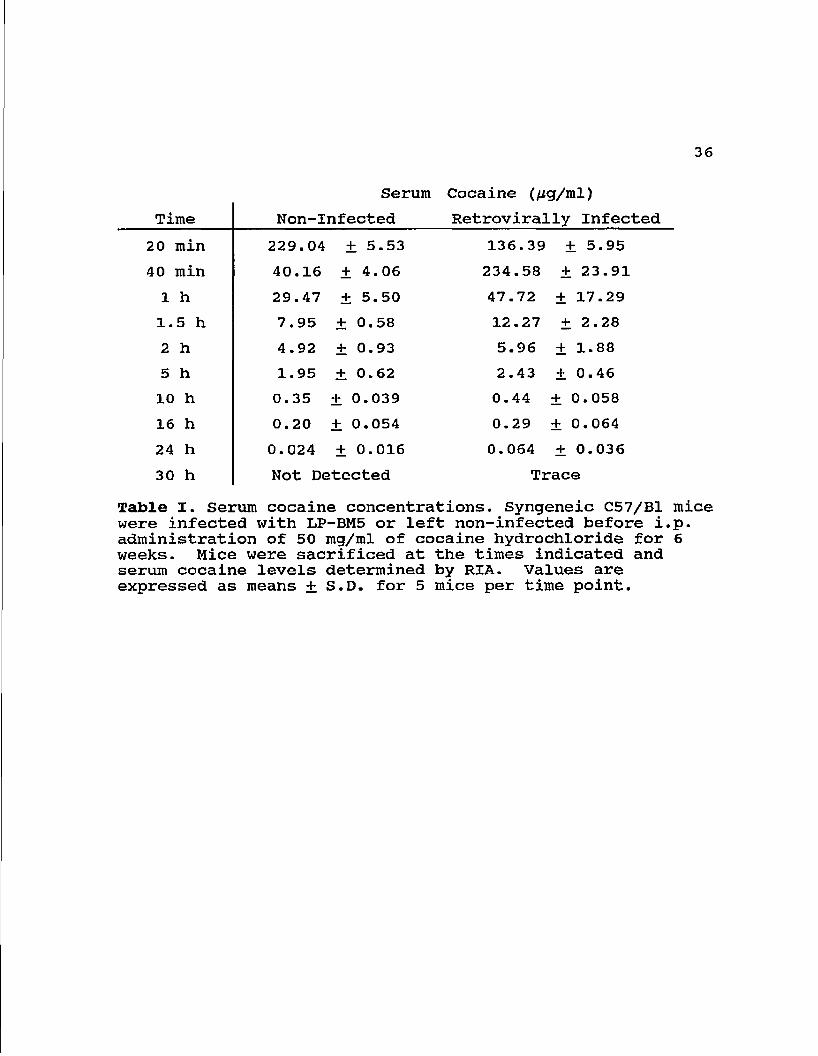
Serum Cocaine and Morphine Concentrations; Serum samples
were taken over a 30 hour period following the last i.p.
injection. At 2 hr the mean cocaine concentration in the
non-virus infected cocaine-treated mice was 4925 ng/ml
serum, after 25 hr the concentration was 24 ng/ml, and no
26
cocaine was detected at 30 hr post injection. The cocaine
serum concentrations from retrovirus infected mice were 5961
ng/ml at 2 hr and 74 ng/ml at 24 hr (Table 1).
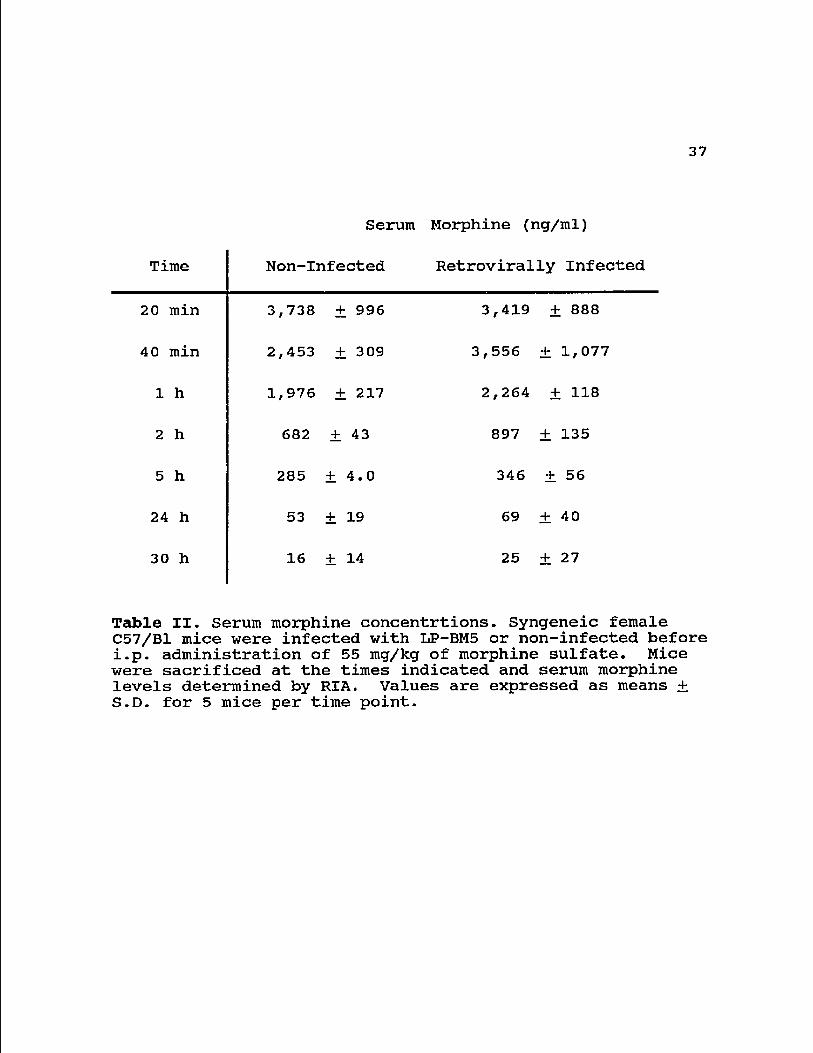
The mean serum value of morphine in non-infected mice
at 2 hr post injection was 682 ng/ml. The mean morphine
concentrations 24 and 30 hr after injection were 53 ng/ml,
and 16 ng/ml, respectively. In the LP-BM5 infected mice,
the concentrations were 897, 69, and 25 ng/ml, respectively
(Table 2). The difference in serum drug concentration
between retrovirally infected and non-infected mice was
significant after 2 hr for both drugs (p < 0.01). Cocaine
and morphine were not detected in the serum of saline-
treated mice.
The area under the plasma concentration versus time
curve (AUC) for a drug is proportional to the total amount
of that drug entering the blood stream and is inversely
related to its clearance from the body. Thus, the AUC can be
used as a measure of systemic availability (72). The AUC
was determined using the trapezoidal rule. The AUC for
cocaine in non-infected mice was 125.6 (fig x hr)/ml and in
the infected mice the AUC was 173.4 (fig x hr)/ml. The AUC
for morphine was 8.59 (fig x hr)/ml in the non-infected while
in the retrovirally infected mice the AUC was 10.37 (fig x
hr)/ml.
27
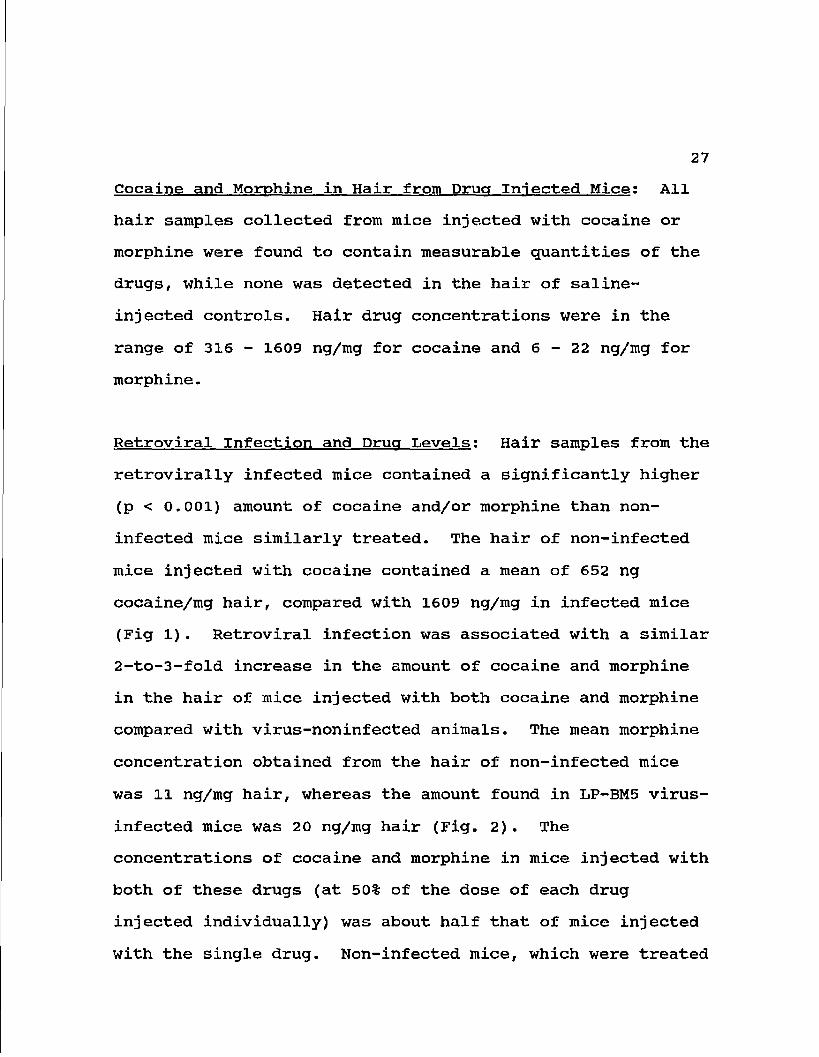
Cocaine and Morphine in Hair from Drug Injected Mice: All
hair samples collected from mice injected with cocaine or
morphine were found to contain measurable quantities of the
drugs, while none was detected in the hair of saline-
injected controls. Hair drug concentrations were in the
range of 316 - 1609 ng/mg for cocaine and 6-22 ng/mg for
morphine.
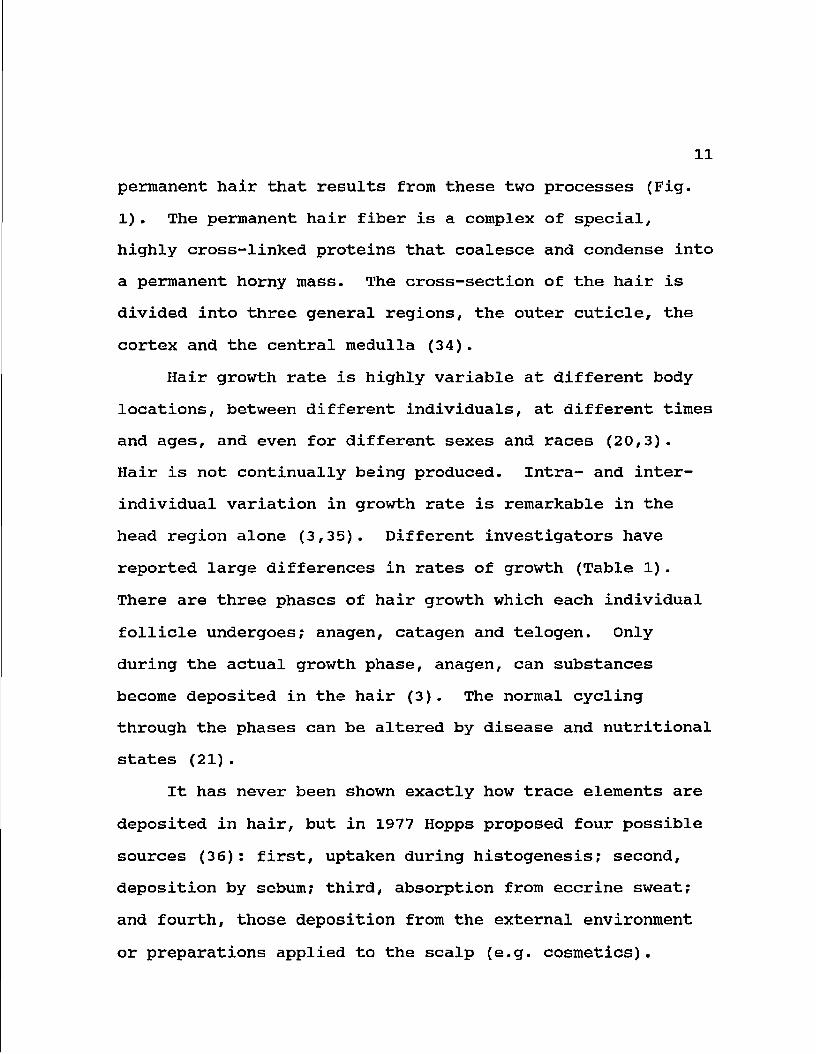
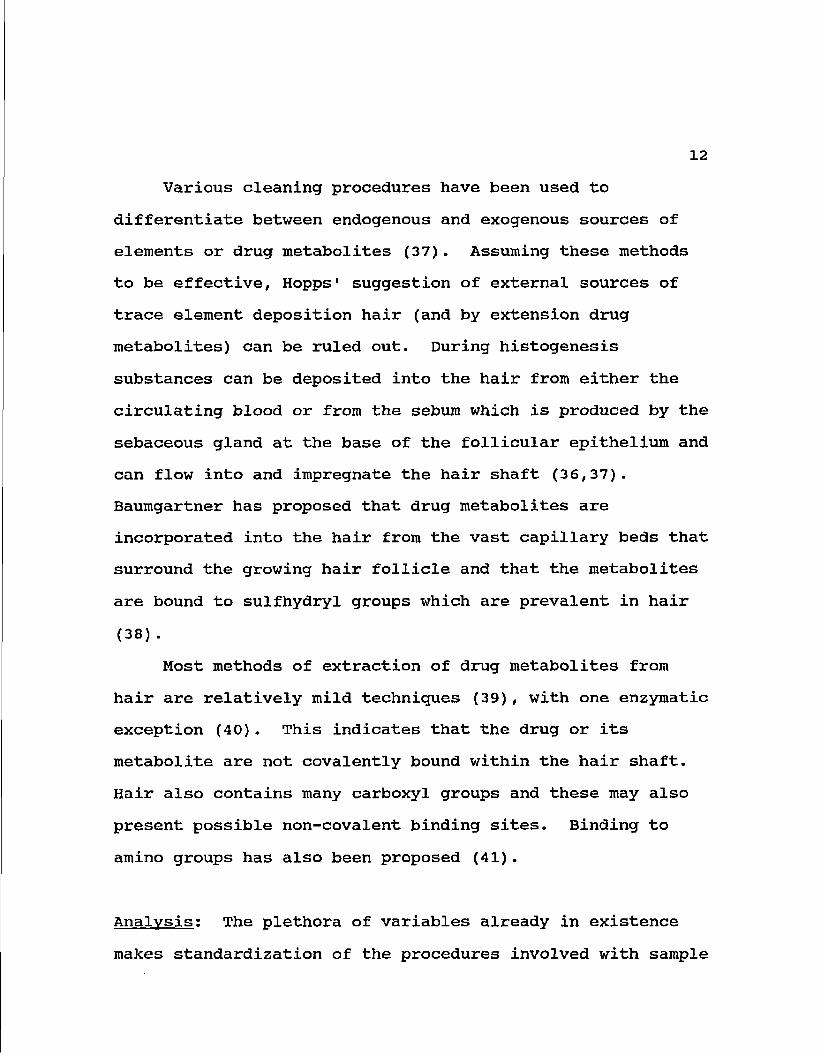
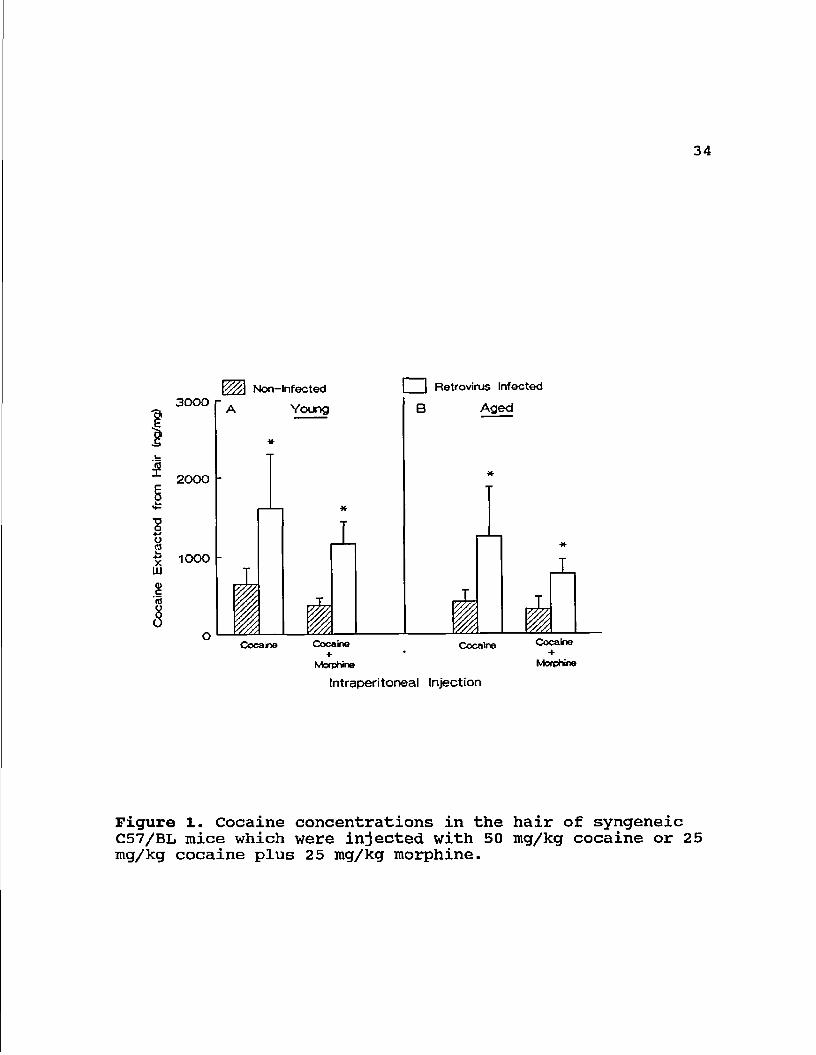
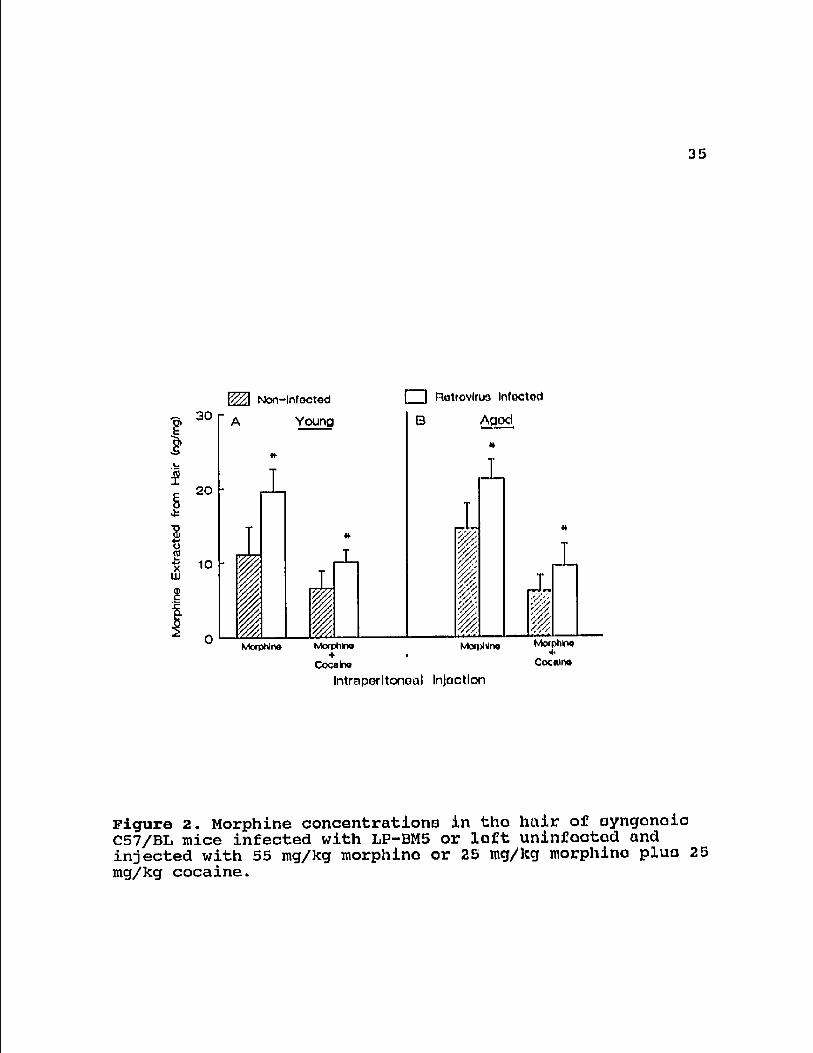
Retroviral Infection and Drug Levels: Hair samples from the
retrovirally infected mice contained a significantly higher
(p < 0.001) amount of cocaine and/or morphine than non-
infected mice similarly treated. The hair of non-infected
mice injected with cocaine contained a mean of 652 ng
cocaine/mg hair, compared with 1609 ng/mg in infected mice
(Fig 1). Retroviral infection was associated with a similar
2-to-3-fold increase in the amount of cocaine and morphine
in the hair of mice injected with both cocaine and morphine
compared with virus-noninfected animals. The mean morphine
concentration obtained from the hair of non-infected mice
was 11 ng/mg hair, whereas the amount found in LP-BM5 virus-
infected mice was 20 ng/mg hair (Fig. 2). The
concentrations of cocaine and morphine in mice injected with
both of these drugs (at 50% of the dose of each drug
injected individually) was about half that of mice injected
with the single drug. Non-infected mice, which were treated
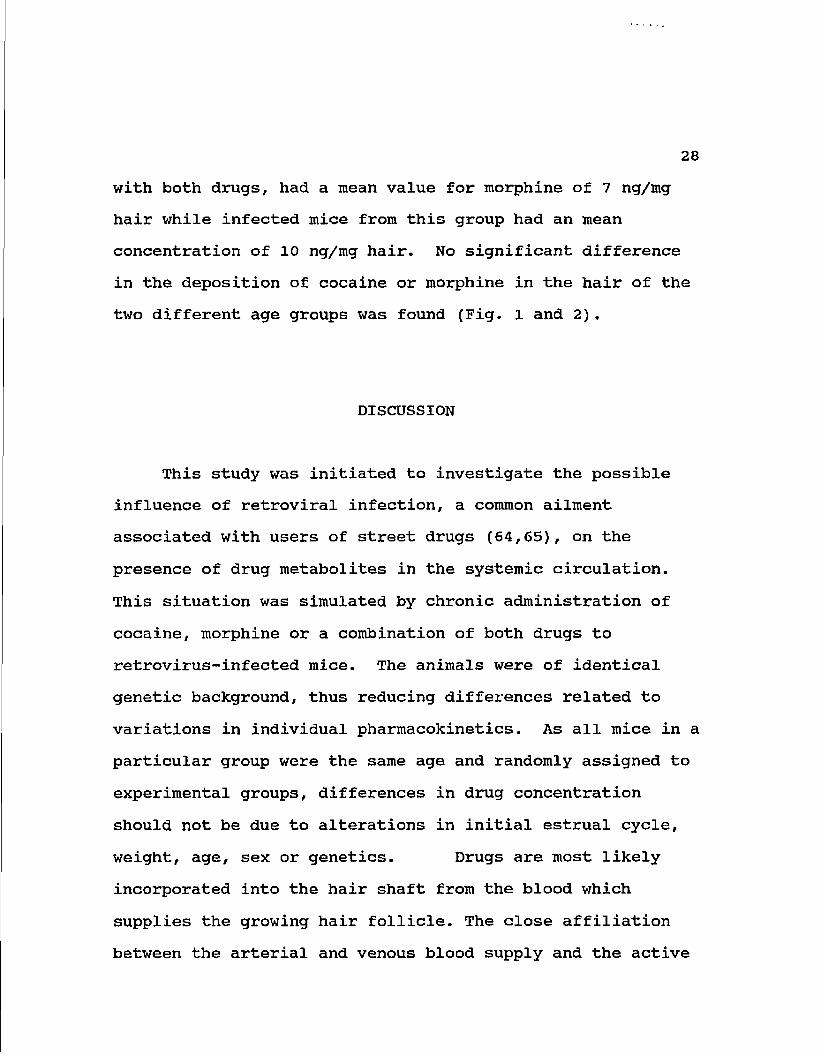
28
with both drugs, had a mean value for morphine of 7 ng/mg
hair while infected mice from this group had an mean
concentration of 10 ng/mg hair. No significant difference
in the deposition of cocaine or morphine in the hair of the
two different age groups was found (Fig. 1 and 2).
DISCUSSION
This study was initiated to investigate the possible
influence of retroviral infection, a common ailment
associated with users of street drugs (64,65), on the
presence of drug metabolites in the systemic circulation.
This situation was simulated by chronic administration of
cocaine, morphine or a combination of both drugs to
retrovirus-infected mice. The animals were of identical
genetic background, thus reducing differences related to
variations in individual pharmacokinetics. As all mice in a
particular group were the same age and randomly assigned to
experimental groups, differences in drug concentration
should not be due to alterations in initial estrual cycle,
weight, age, sex or genetics. Drugs are most likely
incorporated into the hair shaft from the blood which
supplies the growing hair follicle. The close affiliation
between the arterial and venous blood supply and the active
29
hair follicle presumably permits the transfer of drugs from
the circulation into the growing hair shaft (38). The shaft
consists of a matrix of tightly coiled proteins that may
bind and encase the drug molecules, permanently embedding
them in the growing hair fiber. These entrapped substances
cannot be washed out of hair by soap solutions, but can be
released by chemical treatment. After hair is washed to
remove external contamination, the released substances can
be analyzed with conventional RIA technology.
Cocaine or morphine was detected in the hair of all
treated mice. Neither drug was found in saline-treated
animals. There were no differences due to age in hair
concentration of either drug. In addition, a 50% reduction
in the amount of cocaine or morphine injected yielded a
similar reduction in hair levels. Thus there was no
apparent effect of having cocaine present simultaneously
with morphine on the level of either drug in hair.
There are conflicting reports as to the correlation
found between self-reported drug use and concentrations
subsequently found in samples of hair. Baumgartner et al.
(38) reported a trend towards a relationship between drug
levels in hair and self-reported intake for cocaine and
heroin. In an earlier report, however, Baumgartner et al.
(24) found significant differences between concentrations of
cocaine recovered from the hair of individuals reporting the
30
same level of use. Puschel also found no correlation
between concentration of opiates found in hair and self-
reported heroin use (73). Our data show significant
variation in the amount of drug incorporated into hair of
similarly treated, genetically identical animals. The
presence of drug could affect grooming, growth rate of hair,
and food consumption with weight loss or gain (20,74), all
of which could alter drug levels in hair. The animals
treated with cocaine lost 4.4% of their original weight,
whereas saline treated animals gained 6.2% of their original
weight (Chen et al., submitted for publication).
Retrovirally infected mice progressing to AIDS had more
than twice the amount of cocaine and almost twice the amount
of morphine in their hair than non-infected mice.
Retroviral infection also resulted in increased cocaine and
morphine levels in serum, although in both cases the
increase was less than two-fold. As determined by AUC, the
overall serum concentration of cocaine was 1.4 times higher
and that of morphine was 1.2 times higher in the
retrovirally infected animals.
Variations in drug concentration could be due to hair
growth rate, which varies from individual to individual and
over different areas of the body (20,33), or differences in
the pharmacokinetics of drug clearance. An individual that
clears the drug more quickly would have less available drug
31
in the blood to deposit in the hair. Thus, the increased
levels of both morphine and cocaine in the hair of
retrovirally infected mice may reflect altered elimination.
The higher drug levels in hair possibly suggest a longer
exposure of other tissues during retroviral infection to
injected cocaine and morphine. The higher, persistent level
of serum cocaine and morphine during retroviral infection
offers the opportunity for the same dose to produce greater
physiological effects, including immunomodulation (75,76)
which could be important in the progression of virally-
infected individuals to AIDS. In another study, natural
killer cell activity was shown to be increased
proportionally to the levels of cocaine recovered in the
hair of human subjects (Chapter 5). Other tissues also may
be damaged by persistent cocaine and morphine levels during
retroviral infection.
Serum was negative for cocaine 30 hr after the final
treatment, and only small amounts of morphine were detected.
As both drugs were found in the hair of all treated mice,
but in none of the untreated animals, hair analysis seems to
provide a better method of identification of previous drug
use than biological fluids such as serum. The fact that the
animals were treated daily over a long period of time means
that cyclic variations between individual mice are unlikely
to explain the variation in long term recovery in hair.
32
Our data support the use of hair testing to determine
the level of intake for cocaine and morphine as a
qualitative and semi-quantitative measure for these drugs in
drug-abusing groups, although the suitability of analysis
for these drugs in hair to quantitate individual past use
needs further development. Data obtained from human
subjects exhibit greater variability than that obtained from
the animal studies, perhaps reflecting a variety of factors
such as inaccurate recall, deliberate misrepresentation,
differences in mode of administration, variations in rates
of absorption or metabolism, and variable purity of drugs
obtained on the street (Chapter 4).
The feature that distinguishes the hair radioimmunoassay
from other tests to detect drugs of abuse is the unique
potential of hair to provide a chronological record of drug
use. Human hair grows at the rate of 1.2 + 0.18 cm/month
(Chapter 1), thus a history of drug exposure can be made by
analyzing various sections of hair that represent different
periods of growth. Such sectional analyses can be done
using less than 10 mg of hair. The retrospective capacity
of hair to record drug use has been replicated in several
other laboratories (1,29,77). This type of data is not
available from body fluid specimens typically used in drug
screening (2,23,29,62,63). Studies in a variety of settings
have shown that urinalysis tends to miss a rather large
number of drug users that are subsequently identified by
hair analysis, mainly as a result of the wide window of
detection available with the latter technique (38). The
unique capacity of hair analysis to uncover chronic drug
abuse patterns may make this technique an important adjunct
to medical diagnosis, rehabilitation evaluation, and other
applications where historical information is required.
ACKNOWLEDGEMENT
Supported by NIH grant DA04827. The capable technical
assistance of Bruce Smith and Guan-jie Chen in treating the
animals is appreciated.
34
3000
2000
*-*
flj X
UJ 1000
WZ\ Non-Infected
A Young
Coca no Cocoino +
Morphina
Retrovirus Infected
B Aged
Cocaine
Intraperitoneal Injection
Cocaioo +
Morphine
Figure 1. Cocaine concentrations in the hair of syngeneic C57/BL mice which were injected with 50 mg/kg cocaine or 25 mg/kg cocaine plus 25 mg/kg morphine.
35
•S 10
30 r
20
Non-Infected
Young
Mccphlrw I Mofphmo
•f Cocaino
• Rotrovlruo Infoctod
B Agod
Jj » I
Mcupldno
Intraperitoneal Injoctlon
_L
% if Mcxplirto
•4. Coc«lr»
Figure 2. Morphine concentrationQ in the hair of oyngonoio C57/BL mice infected with LP-BM5 or loft uninfoatod and injected with 55 mg/kg morphino or 25 mg/kg morphino pluo 25 mg/kg cocaine.
36
Serum Cocaine (/ig/ml)
Time Non-Infected Retrovirally Infected
20 min 229.04 ± 5.53 136.39 ± 5.95
40 min 40.16 ± 4.06 234.58 + 23.91
1 h 29.47 ± 5.50 47.72 + 17.29
1.5 h 7.95 ± 0.58 12.27 ± 2.28
2 h 4.92 ± 0.93 5.96 ± 1.88
5 h 1.95 ± 0 - 62 2.43 + 0.46
10 h 0.35 ± 0.039 0.44 ± 0.058
16 h 0.20 + 0.054 0.29 + 0.064
24 h 0.024 ± 0.016 0.064 + 0.036
30 h Not Detected Trace
Table I. Serum cocaine concentrations. Syngeneic C57/B1 mice were infected with LP-BM5 or left non-infected before i.p. administration of 50 mg/ml of cocaine hydrochloride for 6 weeks. Mice were sacrificed at the times indicated and serum cocaine levels determined by RIA. Values are expressed as means + S.D. for 5 mice per time point.
37
Serum Morphine (ng/ml)
Time Non-Infected Retrovirally Infected
20 min 3,738 ± 996 3,419 ± 888
40 min 2,453 ± 309 3,556 + 1,077
1 h 1,976 ± 217 2,264 ± 118
A
CM 682 ± 43 897 ± 135
5 h 285 ± 4.0 346 + 56
24 h 53 ± 19 69
o
+1
30 h 16 ± 14 25 ± 27
Table II. Serum morphine concentrtions. Syngeneic female C57/B1 mice were infected with LP-BM5 or non-infected before i.p. administration of 55 mg/kg of morphine sulfate. Mice were sacrificed at the times indicated and serum morphine levels determined by RIA. Values are expressed as means + S.D. for 5 mice per time point.
38
CHAPTER 3! ETHANOL INDUCED CHANGES IN SERUM
AND HAIR COCAINE CONCENTRATIONS
INTRODUCTION
A national survey on drug abuse showed the concurrent
use of cocaine and alcohol to be common (78). Cocaine use
has been shown to be associated with many toxicities,
including, liver injury, rhabdomyolysis, cerebrovascular
accidents, pulmonary edema, ischemia, and immune
abnormalities (75,79-81). Hepatotoxicity of cocaine in mice
has been shown to be strain and sex dependent (82-84), and
only two case reports of hepatotoxicity in man have been
reported (85,86), although liver dysfunction has been
reported in a cross-sections of cocaine using patients (79).
Ethanol has been shown to potentiate cocaine-induced liver
injury in mice (87,88). The hepatotoxicity of ethanol, on
the other hand, is well documented in humans and in animal
models (89,90).
Although cocaine is metabolized to several products,
only norcocaine seems to have biological activity (91). The
largest group of cocaine metabolites in man are the products
39
of hydrolysis, ecgonine, benzoylecgonine, and ecgonine
methylester. These comprise about 90% of the excreted
metabolites, with only about 5-10% being excreted as the
parent compound (92,93). N-hydroxynorcocaine and norcocaine
nitroxide are more minor metabolites which are produced by
N-demethylation, mainly in the liver, by the P-450 system
(92). N-hydroxynorcocaine appears to be responsible for the
toxicity seen in some cases through its oxidation to a
nitrosonium ion which can ultimately lead to lipid
peroxidation (94).
It is probable that the potentiation of cocaine
hepatotoxicity by ethanol is due to an interaction with the
P-450 system which may result in an increase in N-
hydroxynorcocaine produced. It has been shown that ethanol
is metabolized by the P-450 system as well as by
acetaldehyde dehydrogenase (95). Ethanol also induces some
P-450 isozymes, namely P-450IIE1 (89) . A general
proliferation of endoplasmic reticulum has been noted as
well (96).
A dose-response curve for the elevation of serum
glutamate-oxaloacetate transaminase in response to cocaine
has been demonstrated (94). Ethanol could change this dose-
response curve or alters systemic availability of cocaine.
Therefore, the effect of ethanol on cocaine concentrations
in hair and serum of male C57/B1 mice was investigated.
40
MATERIALS AND METHODS
Animals: Three-to-five week old male C57/BL6 mice (Charles
River Labs, Wilington, MA), weighing between 19-22g, were
randomly housed 5 to a cage in an approved animal care
facility with a 12 hr light cycle. Animals were assigned to
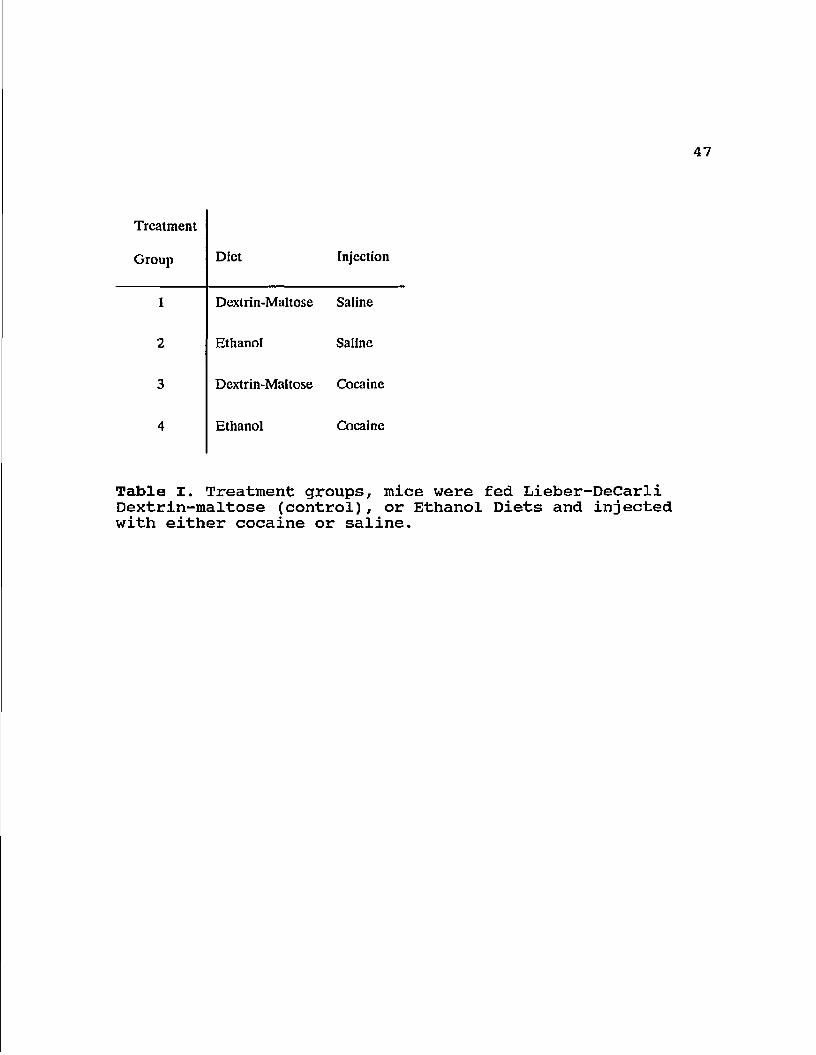
one of four treatment groups: group 1 (control), which was
fed a dextrin-maltose (isocalorically substituting for
ethanol) Lieber-Decarli diet (Dyets; Lieber/Decarli Formula?
Dyets, Inc. Bethlehem, PA) and injected with saline (0.1
ml); group 2, fed a Lieber-Decarli ethanol diet (5.05% v/v,
representing 27% of the total calories) and injected with
saline; group 3, fed the Lieber-Decarli control diet and
injected with cocaine (40mg/kg/day); and group 4, fed the
Lieber-Decarli ethanol diet and injected with cocaine
(40mg/kg/day) (Table I).
Ethanol was introduced into the diet for one week at
half the final concentration used in the experiment to allow
the mice to become accustomed to it. The diet was prepared
according to the manufacturer's recommended procedure
(Dyets, Inc., Bethlehem, PA). The animals were maintained
on this diet for either 5 or 9 weeks.
Cocaine hydrochloride was obtained from the National
Institute for Drug Abuse (Rockville, MD). Cocaine
41
administration was by i. p . injection. Prior to the first
week of treatment with the full concentration of alcohol the
mice injected with cocaine were given half the final
concentration (20 mg/kg) to reduce cocaine and ethanol
induced mortality. Following that week, mice were injected
with 40 mg/kg cocaine hydrochloride 7 days a week over the 5
or 9 week time periods. The animals were sacrificed under
ether at the end of either the fifth or ninth weeks.
Serum Samples: For the first four weeks of treatment, blood
was collected once a week from the retrosinus orbital of 4
mice per group 2 hr after cocaine injection. Blood was also
collected from the axillary vein at the time of termination
of the experiment, 24 hr after the final injection of
cocaine. Serum was obtained by centrifuging the blood at
1500 rpm after the blood was allowed to clot. Twenty-five
microliter serum samples were analyzed for cocaine
concentration using the radioimmunoassay (RIA) kit from
Diagnostic Products Corporation (Los Angeles, CA) according
to the manufacturer's recommended procedure.
Serum ethanol concentrations were determined by gas
chromatography. One microliter serum samples were injected
onto a glass wool plug on top of a Porpack Q Column (Alltech
Assoc., Deerfield, IL) maintained at 180°C (97). Peak area
for individual samples were compared to those obtained by
42
injection of standard solutions of known amounts of ethanol
onto the column.
Hair Samples: At the end of either the 5 or 9 week
treatment periods, an area just above the tail of each mouse
was shaved close to the skin using electric clippers
(OstarR) . The hair was stored at -20 °C in sealed plastic
bags for later analysis. The analysis of these hair samples
for cocaine was performed as in chapter l.
Statistics: All data were reported as mean ± standard
deviation (S.D.). Values were analyzed by one-way analysis
of variance to determine if there was a difference between
groups. A p value of less than 0.05 was considered
significantly different.
RESULTS
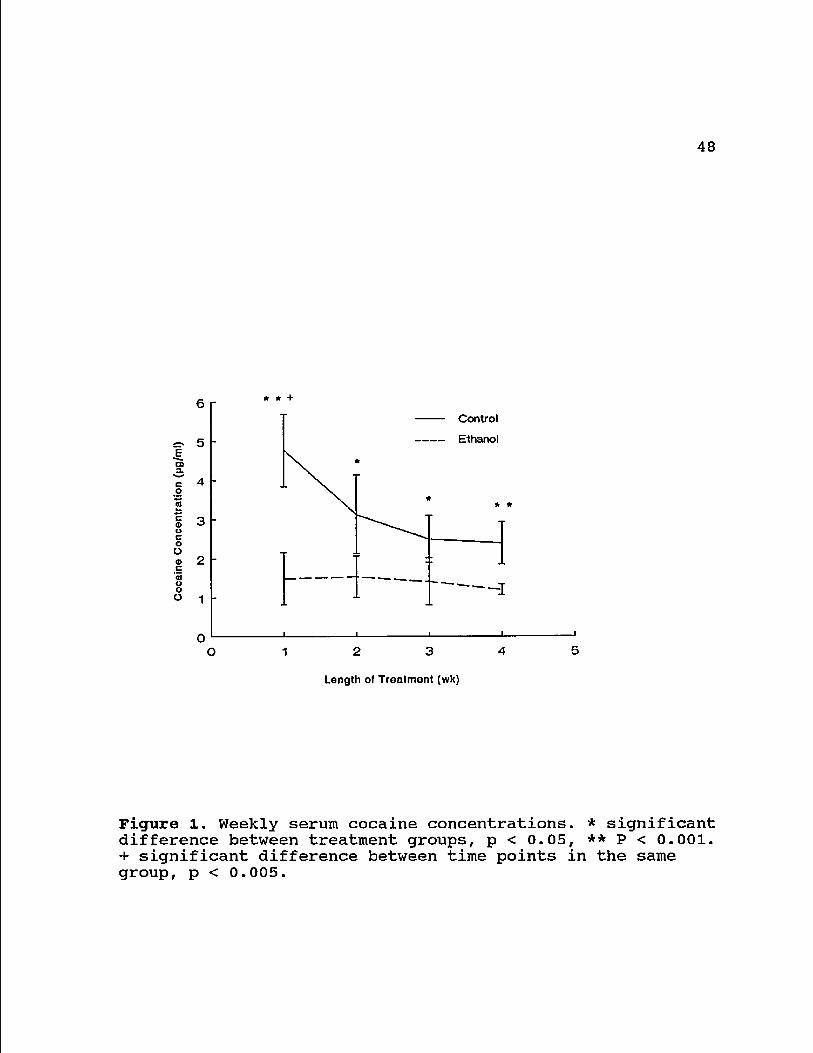
Serum Cocaine Concentrations: Two hours following injection
of cocaine (at approximately 11:00 am) the serum cocaine
concentrations were consistently higher in the mice fed the
control diet and injected with cocaine (group 3) over the
ethanol-fed, cocaine injected mice (group 4). In the first
week, the cocaine concentration in serum was highest overall
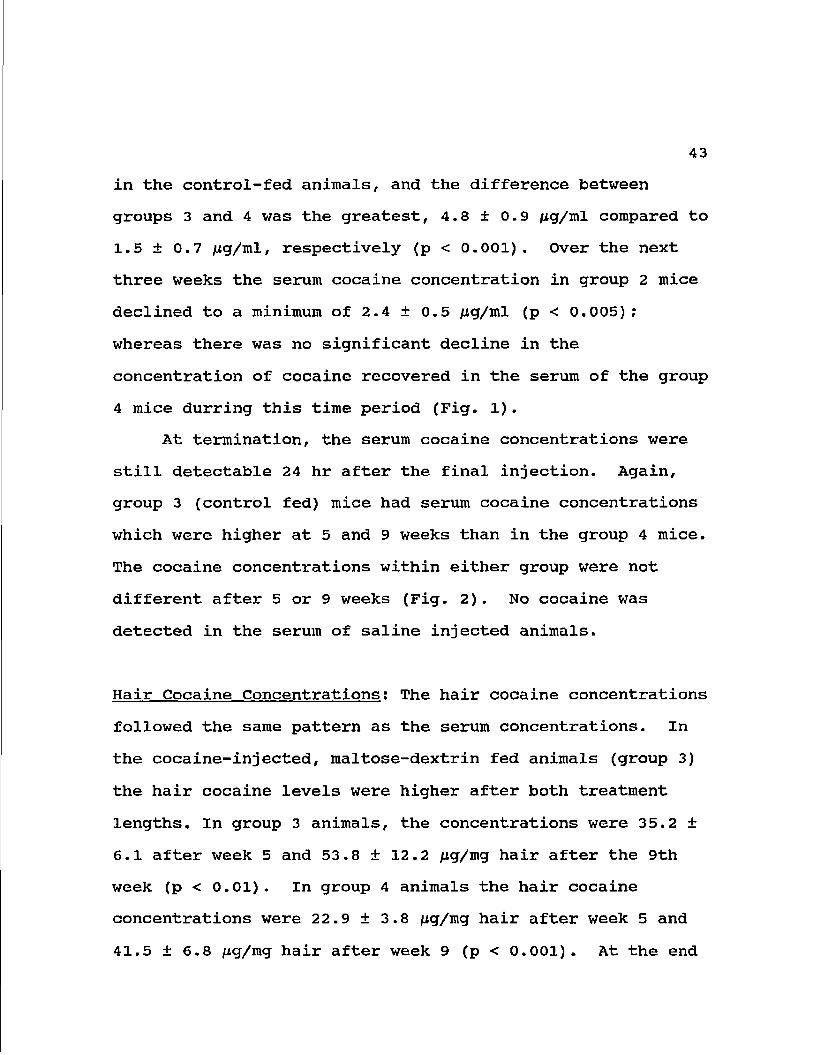
43
in the control-fed animals, and the difference between
groups 3 and 4 was the greatest, 4.8 ± 0.9 fig/ml compared to
1.5 ± 0.7 /ug/ml, respectively (p < 0.001) . Over the next
three weeks the serum cocaine concentration in group 2 mice
declined to a minimum of 2.4 ± 0.5 jug/ml (p < 0.005);
whereas there was no significant decline in the
concentration of cocaine recovered in the serum of the group
4 mice durring this time period (Fig. 1).
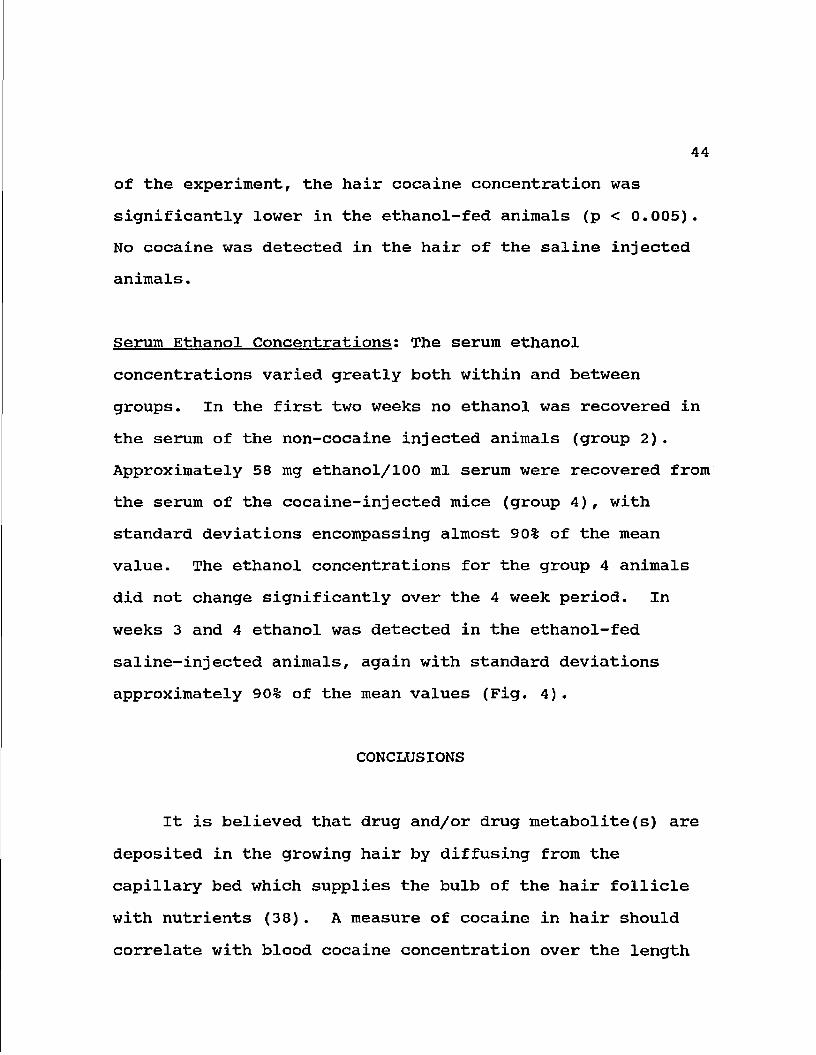
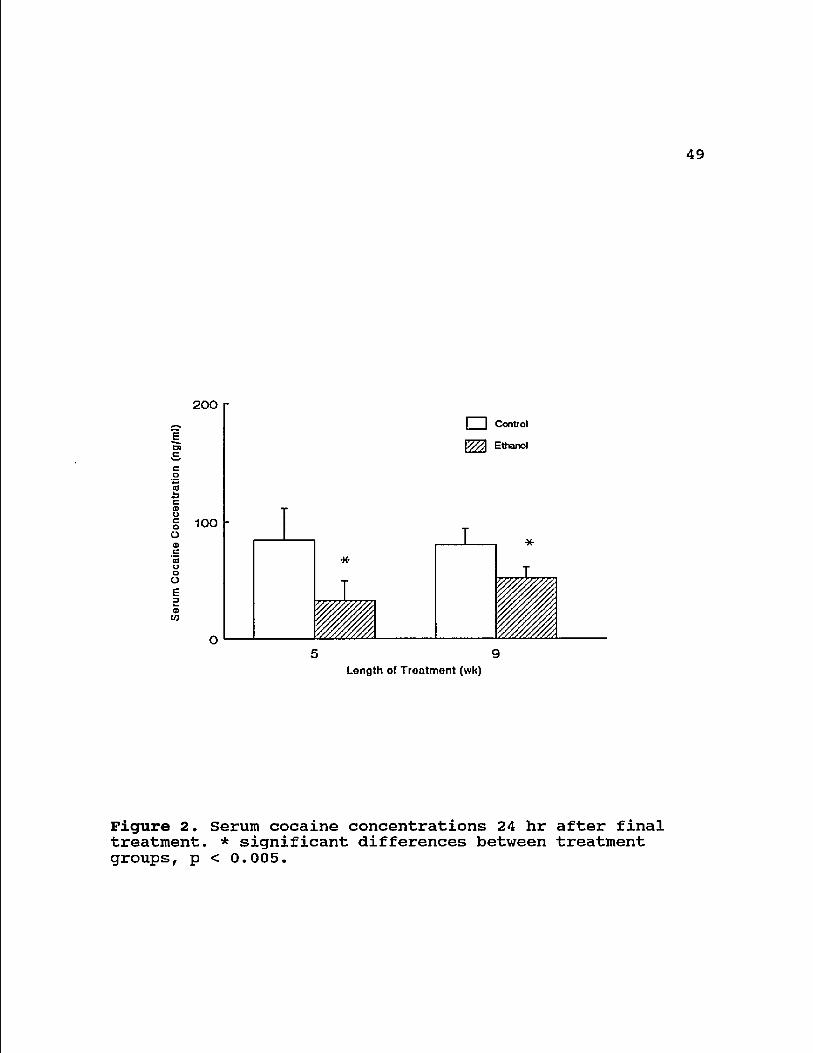
At termination, the serum cocaine concentrations were
still detectable 24 hr after the final injection. Again,
group 3 (control fed) mice had serum cocaine concentrations
which were higher at 5 and 9 weeks than in the group 4 mice.
The cocaine concentrations within either group were not
different after 5 or 9 weeks (Fig. 2). No cocaine was
detected in the serum of saline injected animals.
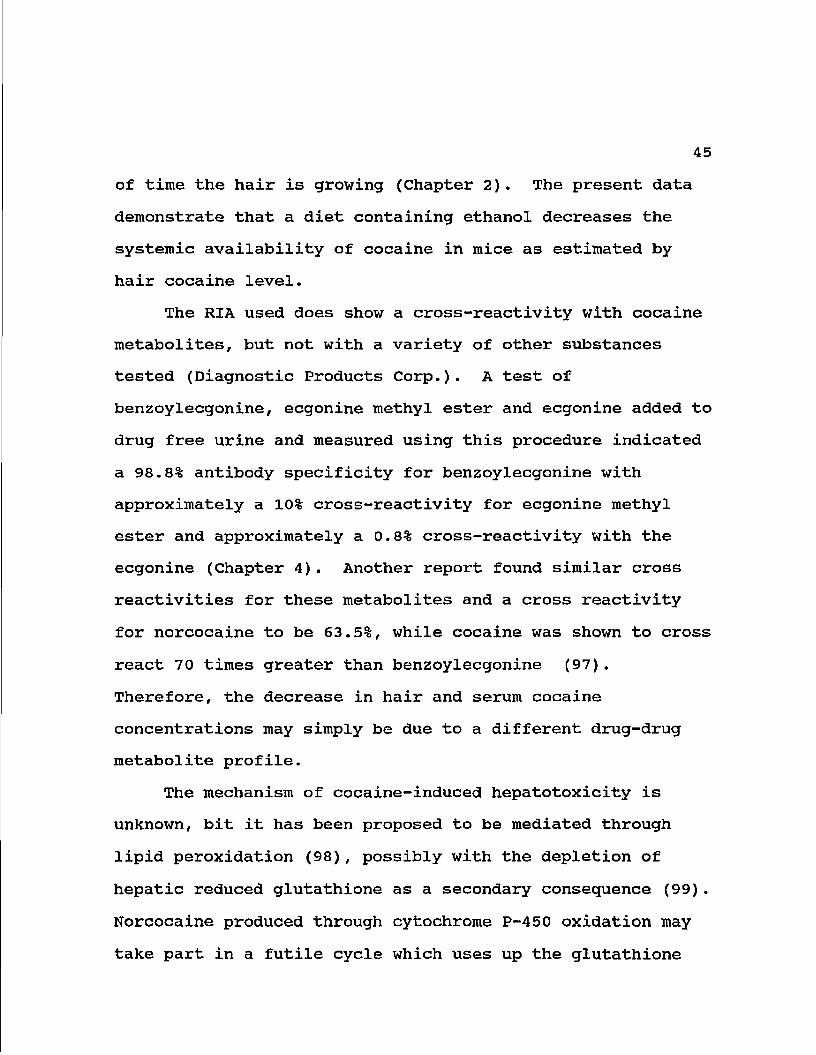
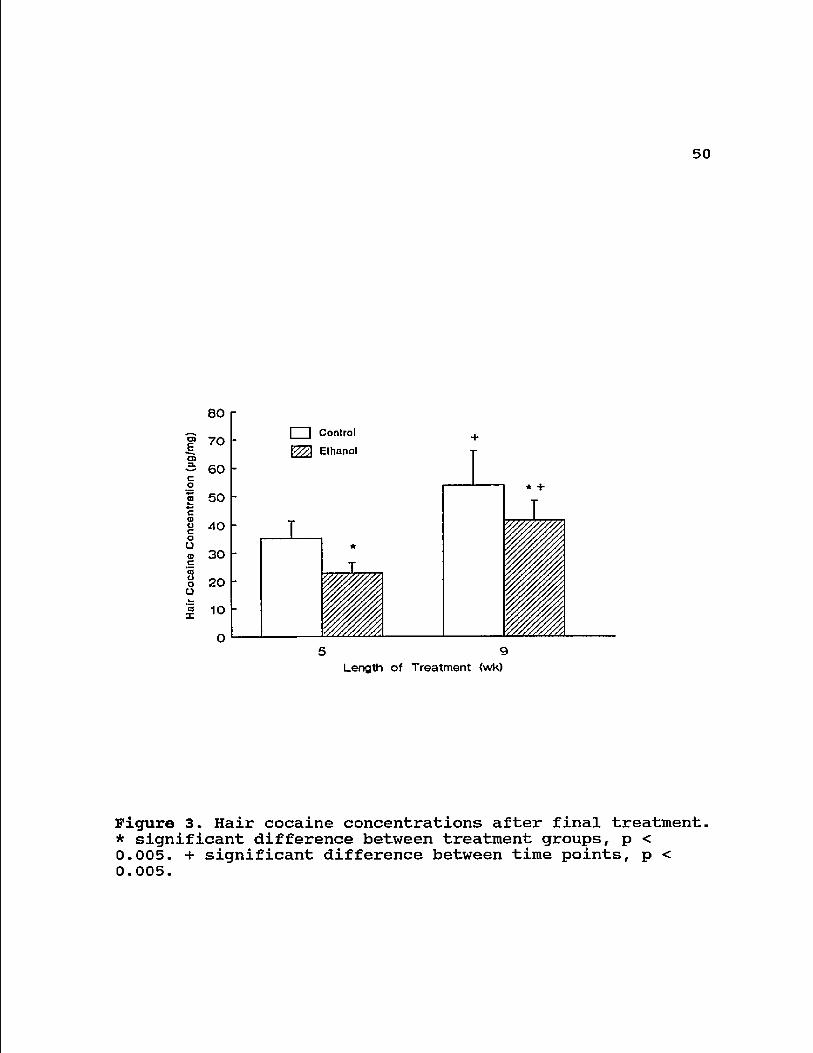
Hair Cocaine Concentrations; The hair cocaine concentrations
followed the same pattern as the serum concentrations. In
the cocaine-injected, maltose-dextrin fed animals (group 3)
the hair cocaine levels were higher after both treatment
lengths. In group 3 animals, the concentrations were 35.2 ±
6.1 after week 5 and 53.8 ± 12.2 jug/mg hair after the 9th
week (p < 0.01). In group 4 animals the hair cocaine
concentrations were 22.9 ± 3.8 Jig/mg hair after week 5 and
41.5 ± 6.8 fig/mg hair after week 9 (p < 0.001). At the end
44
of the experiment, the hair cocaine concentration was
significantly lower in the ethanol-fed animals (p < 0.005).
No cocaine was detected in the hair of the saline injected
animals.
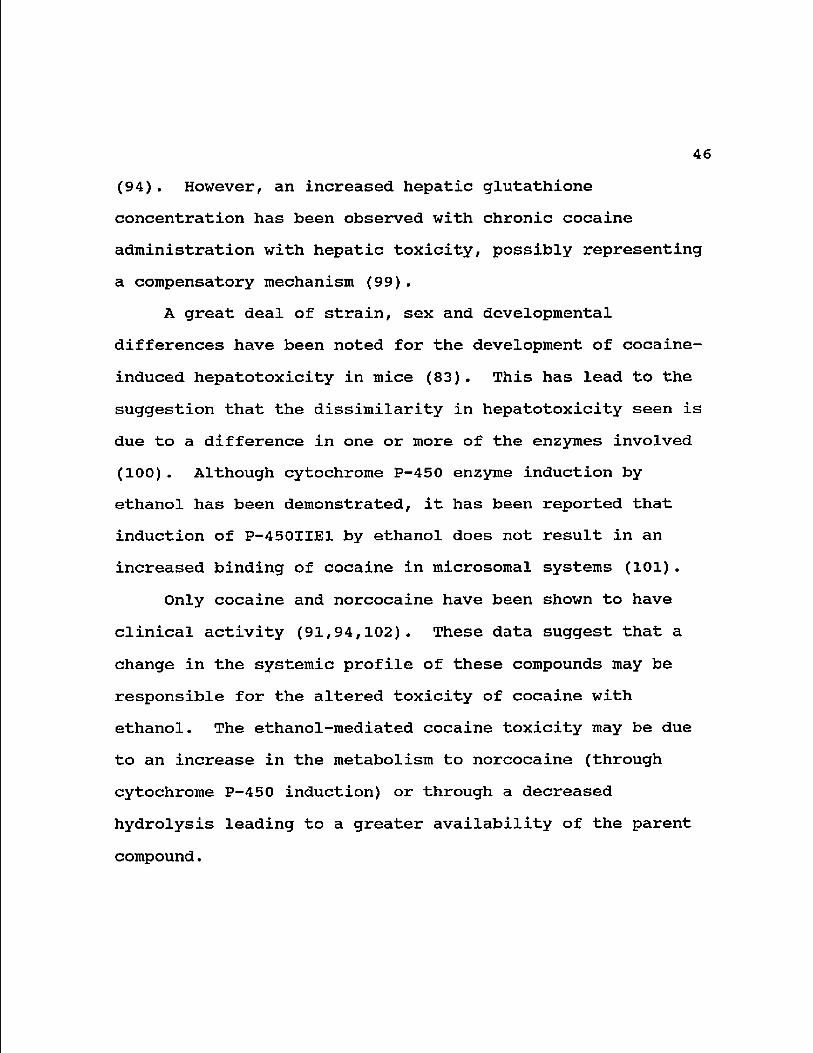
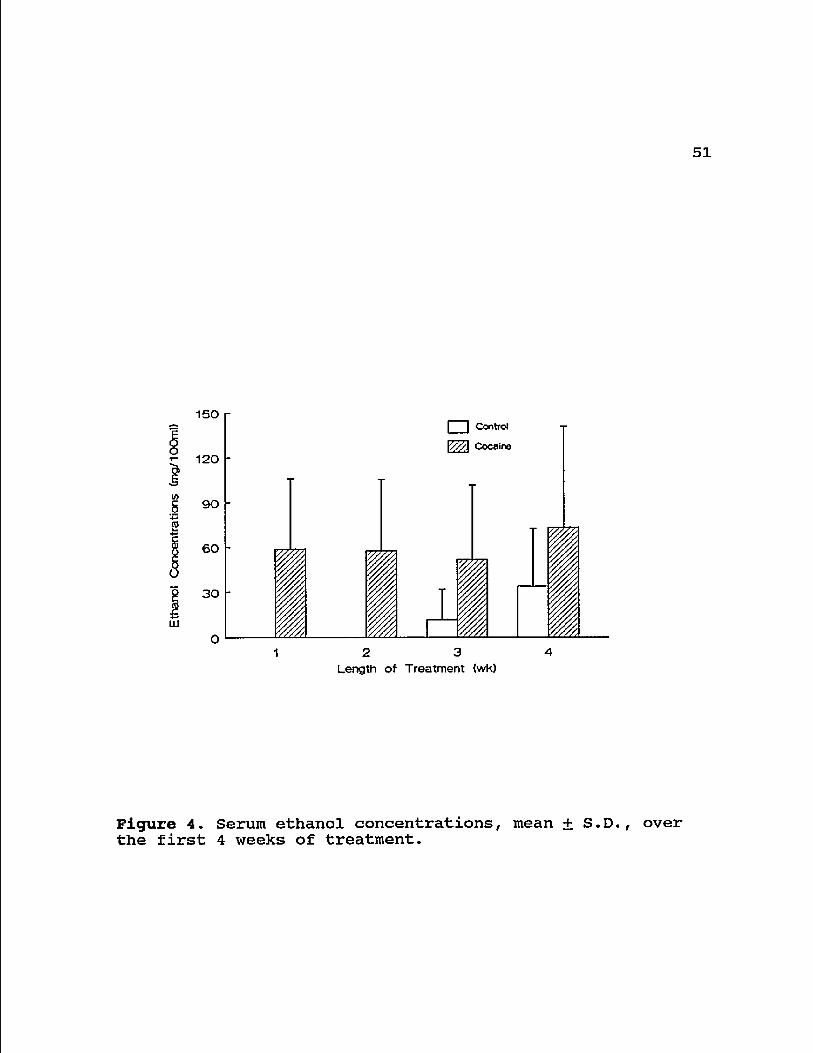
Serum Ethanol Concentrations; The serum ethanol
concentrations varied greatly both within and between
groups. In the first two weeks no ethanol was recovered in
the serum of the non-cocaine injected animals (group 2).
Approximately 58 mg ethanol/100 ml serum were recovered from
the serum of the cocaine-injected mice (group 4), with
standard deviations encompassing almost 90% of the mean
value. The ethanol concentrations for the group 4 animals
did not change significantly over the 4 week period. In
weeks 3 and 4 ethanol was detected in the ethanol-fed
saline-injected animals, again with standard deviations
approximately 90% of the mean values (Fig. 4).
CONCLUSIONS
It is believed that drug and/or drug metabolite(s) are
deposited in the growing hair by diffusing from the
capillary bed which supplies the bulb of the hair follicle
with nutrients (38). A measure of cocaine in hair should
correlate with blood cocaine concentration over the length
45
of time the hair is growing (Chapter 2). The present data
demonstrate that a diet containing ethanol decreases the
systemic availability of cocaine in mice as estimated by
hair cocaine level.
The RIA used does show a cross-reactivity with cocaine
metabolites, but not with a variety of other substances
tested (Diagnostic Products Corp.)* A test of
benzoylecgonine, ecgonine methyl ester and ecgonine added to
drug free urine and measured using this procedure indicated
a 98.8% antibody specificity for benzoylecgonine with
approximately a 10% cross-reactivity for ecgonine methyl
ester and approximately a 0.8% cross-reactivity with the
ecgonine (Chapter 4). Another report found similar cross
reactivities for these metabolites and a cross reactivity
for norcocaine to be 63.5%, while cocaine was shown to cross
react 70 times greater than benzoylecgonine (97).
Therefore, the decrease in hair and serum cocaine
concentrations may simply be due to a different drug-drug
metabolite profile.
The mechanism of cocaine-induced hepatotoxicity is
unknown, bit it has been proposed to be mediated through
lipid peroxidation (98), possibly with the depletion of
hepatic reduced glutathione as a secondary consequence (99).
Norcocaine produced through cytochrome P-450 oxidation may
take part in a futile cycle which uses up the glutathione
46
(94). However, an increased hepatic glutathione
concentration has been observed with chronic cocaine
administration with hepatic toxicity, possibly representing
a compensatory mechanism (99).
A great deal of strain, sex and developmental
differences have been noted for the development of cocaine-
induced hepatotoxicity in mice (83). This has lead to the
suggestion that the dissimilarity in hepatotoxicity seen is
due to a difference in one or more of the enzymes involved
(100). Although cytochrome P-450 enzyme induction by
ethanol has been demonstrated, it has been reported that
induction of P-450IIE1 by ethanol does not result in an
increased binding of cocaine in microsomal systems (101).
Only cocaine and norcocaine have been shown to have
clinical activity (91,94,102). These data suggest that a
change in the systemic profile of these compounds may be
responsible for the altered toxicity of cocaine with
ethanol. The ethanol-mediated cocaine toxicity may be due
to an increase in the metabolism to norcocaine (through
cytochrome P-450 induction) or through a decreased
hydrolysis leading to a greater availability of the parent
compound.
Treatment
Group Diet Injection
1 Dextrin-Maltose Saline
2 Ethanol Saline
3 Dextrin-Maltose Cocaine
4 Ethanol Cocaine
Table I. Treatment groups, mice were fed Lieber-DeCarli Dextrin-maltose (control), or Ethanol Diets and injected with either cocaine or saline.
48
6 r
=. 5
Q> 3. C o
c © u c o o <D c 03 o o o
Control
Ethanoi
—i
12 3 4
Length of Treatment (wk)
Figure 1. Weekly serum cocaine concentrations. * significant difference between treatment groups, p < 0.05, ** P < 0.001. + significant difference between time points in the same group, p < 0.005.
49
200
• Control
100
O 9 5
Length of Treatment (wk)
Figure 2. Serum cocaine concentrations 24 hr after final treatment. * significant differences between treatment groups, p < 0.005.
50
80 • Control
V//X Ethanol 70
60
50
40
30
20
10
o 9 5
Length of Treatment <wk)
Figure 3. Hair cocaine concentrations after final treatment. * significant difference between treatment groups, p < 0.005. + significant difference between time points, p < 0.005.
51
150
120
(0 g 90
s § 60
8 30
LLJ
I | Control Cocaino
2 3 Length of Treatment (wk)
Figure 4. Serum ethanol concentrations, mean + S.D., over the first 4 weeks of treatment.
52
CHAPTER 4: COCAINE METABOLITE IN
HAIR AND URINE OF DRUG USERS
INTRODUCTION
According to the 8th National Household Survey on Drug
Abuse (1985) the number of U.S. citizens who were current
users of marijuana, cocaine or heroin was estimated at 18
million, 6 million and 160,000 respectively (104). Drug
testing by urinalysis has long been the standard method by
which illegal drug use is identified since it provides a
rapid and inexpensive evaluation of an individual's drug
status. However, the technique is limited not only by the
relative ease with which samples may be adulterated or
exchanged but also by the short half-life of elimination of
some drug metabolites. For opiate and cocaine metabolites,
detection limits in urine are usually reached between 48 and
72 h following administration of the parent drug (60). These
restrictions have led to the development of techniques
designed to provide greater information on the pattern and
duration of drug abuse in habitual users.
While some quality control parameters remain to be
established (3,49), the method of hair analysis may prove
useful for clinical studies which require a comparison
53
between the amount of drug in biological samples, and the
effects of drugs of abuse on biological processes. We
considered it of interest, therefore, to determine the
correlation that might be established between two different
methods used to identify drug use, namely hair and urine
analysis. We report here that the status of a suspected
drug-using individual is not always adequately described by
self-report, and that hair analysis does appear to provide a
wider window of drug identification than the more commonly
used method of urinalysis.
METHODS
Subjects: Hair and urine samples, and verbal data were
collected from 47 men attending the Community Outreach
Program for AIDS in Southern Arizona (COPASA) in Nogales,
Arizona (age range 14-41 years, mean 25.9 years). The 47
subjects were recruited from this pool. The study was
approved by the Human Subjects Committee which also approved
advertisement for intravenous drug users and non-users.
COPASA clients are primarily individuals with a drug-using
life style. The overall incidence of HIV seropositivity in
800 subjects screened in the COPASA program has been found
to be less than 3% (Erickson & Estrada, unpublished data)
and none of the participants in our study reported either
54
infection with HIV or symptoms of AIDS. Interviewers were
told to take any male who volunteered and to inform subjects
that participation did not depend on drug-use history. All
subjects taking part in the study completed a detailed
questionnaire relating to past and present drug use.
Informed consent was obtained from all subjects, using forms
approved by the Human Subjects Committee of the University
of Arizona. A control group consisted of 10 male laboratory
personnel (age range 18-49, mean 33.5 years).
Extraction of Drugs from Hair: Scalp hair was cut close to
the skin at the back of the head of each individual, placed
into a zip-lock plastic bag and stored at -20°C. Scissors
were cleaned by swabbing with 75% ethanol on gauze after
each collection to prevent cross-contamination of hair
samples. Urine samples were obtained at the time of
participant presentation and frozen at -70°C until analysis.
Each hair sample was placed into a clean Buchner flask,
washed once with soap solution (Tincture Green Soap; 10% in
distilled water), rinsed four times with distilled water and
left to air-dry on absorbent paper. A portion of hair (100
mg) was taken from the proximal (cut) end of the original
sample and was approximately 3.5 cm in length, representing
the past 2-3 months of growth. To extract drug from hair,
each hair sample was incubated with hydrochloric acid (0.1
55
M, 1.0 ml) for 18 h at 37°C. The acid extracts were
neutralized with sodium hydroxide (1.0 M, 100 jul) and
phosphate-buffered saline (0.15 M, pH 7.4) was added to give
a final volume of 2.0 ml. Fifty microliters of each sample
was analyzed in duplicate by radioimmunoassay (RIA) on the
same day. The amount of drug per 2.0 ml of extract was
assumed to be equivalent to the amount per 100 mg of hair.
Radioimmunoassay: Prior to analysis, urine samples were
centrifuged (300 x g, 10 min) to sediment particulate
material. The pH at 25° C of each supernatant fraction was
found to be in the range 5.5-7.5 and was not adjusted.
Aliquots (50 /il) of hair extracts and urine samples were
analyzed for cocaine metabolite, benzoylecgonine (BE) (Coat-
a-Count, Diagnostic Products Corp., Los Angeles, CA)
(competitive binding ligand 125I~labelled BE) and urine
samples additionally assayed for cannabinoids (including A-
9-tetrahydrocannabinol, THC) by a double-antibody 125I solid
phase RIA (Coat-a-Count) according to the manufacturer's
recommended procedure. Briefly, 200 (jlI of 125I-labeled
metabolite is added to the sample, then 200 fil of the
metabolite anti-sera is added. After the samples are
incubated for 1 hr, 1.0 ml of precipitating solution (donkey
anti-sheep gamma globulin and polyethylene glycol) is added
and the samples are incubated for another 15 min. The
56
sample is then centrifuged at 3000xg for 15 min, the
supernatant decanted, and the pellet counted on a gamma
counter. The amount of radioactivity per sample was
determined using an LKB Automatic Gamma Counter interfaced
with an IBM microcomputer. Calibration curves were generated
using processed human urine standards for BE and
cannabinoids as supplied by the manufacturer. The line of
best fit between duplicate of 7 different concentrations
samples was generated by microcomputer and correlation
coefficients were consistently 0.997 or higher. Drug levels
in urine were expressed as nanograms of drug per milligram
creatinine (creatinine levels for all samples determined by
MedTox Laboratories., St. Paul, MN).
Adsorption of Drug to Drug-Free Hair: To determine whether
the manufacturer's standard curves for benzoylecgonine
(generated from urine-based calibrators) were applicable to
the measurement of these compounds in extracts of hair
samples, "test" standard curves were generated by overnight
incubation of washed, drug-free hair from the laboratory
controls with cocaine or BE hydrochloride (obtained from the
National Institute on Drug Abuse (NIDA), Rockville, MD) in a
methanol-chloroform (1:1) mixture. The solvent was removed
by nitrogen evaporation. Following acid hydrolysis and
neutralization, extracts were analyzed by RIA and the
57
standard curve generated compared with that obtained by
assay of the manufacturer's urine-based calibrators.
RESULTS
According to the manufacturer, the lower limits of
detection for BE and cannabinoids, the values approximately
2 standard deviations below the counts of maximum binding,
were 3 and 2 ng/ml, respectively. We established our own
cut-off levels by adding known amounts of drug to drug-free,
processed human urine (DPC) or (in the case of BE) to drug-
free normal hair and performing serial dilutions to give
final concentrations in the ng/ml range. Lines of best fit
were calculated using the SlideWrite Plus computer software
program (Sunnyvale, CA) and cut-off levels for positivity
taken at the point at which the standard curve lost
linearity. For THC we used a cannabinoids standard
previously quantified by gas chromatography/mass
spectrophotometry (GC/MS) (ConDoa, DPC). BE was used in the
form BE hydrochloride, dissolved initially in distilled
water and finally in drug-free processed human urine.
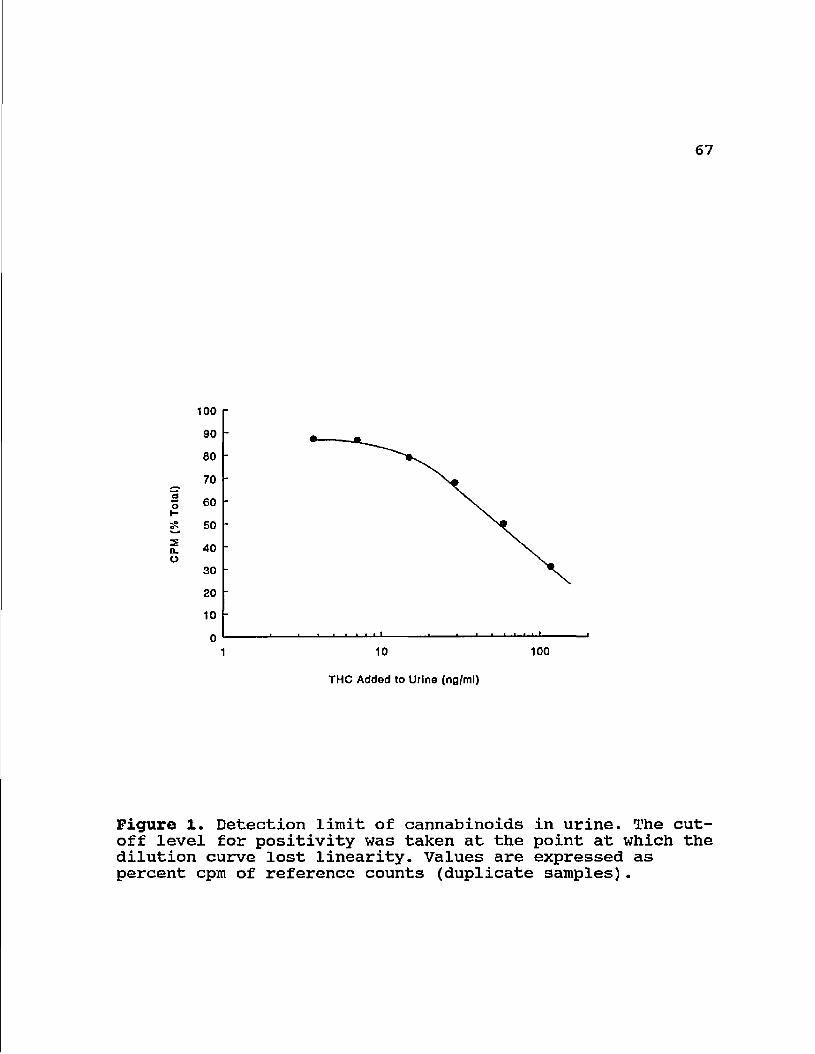
The standard curve derived in this manner for
cannabinoids in urine was linear to approximately 20 ng/ml
(Fig. 1). This value was twice as high as that obtained as
58
the mean + 2 S.D. of cpm values (9.3 ng/ml) of urine samples
from 10 laboratory controls presumed not to be using illegal
drugs, and thus was used to represent the cut-off level for
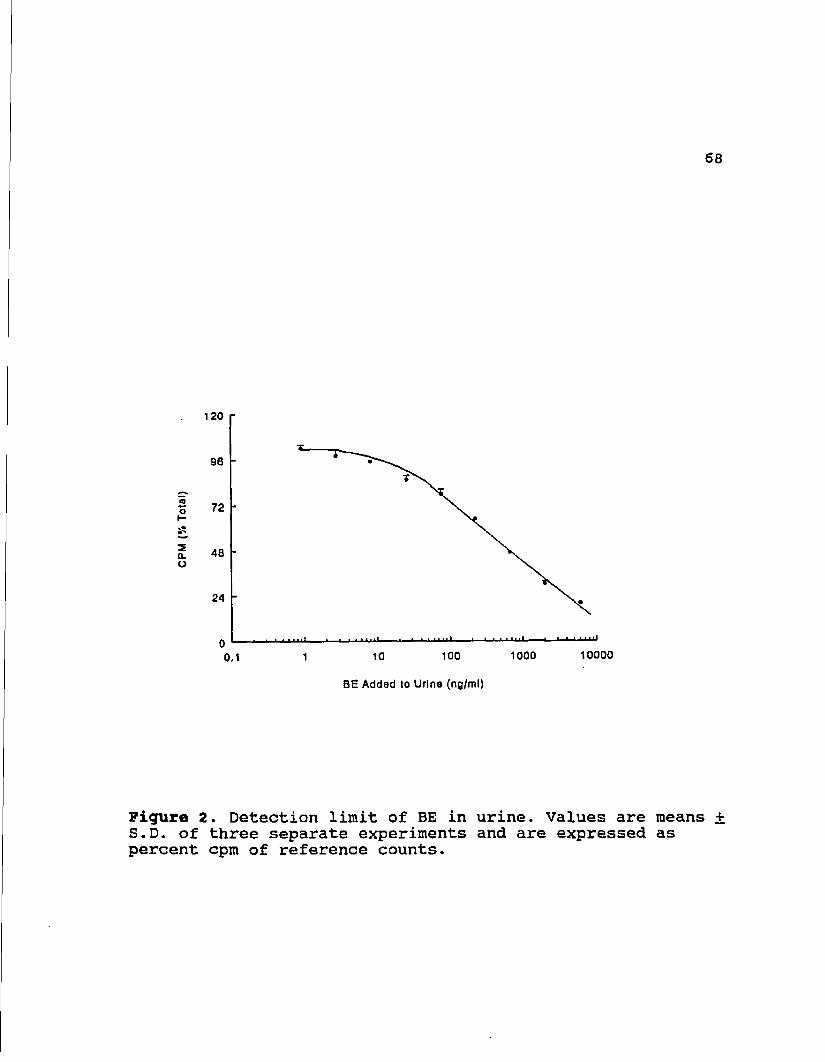
THC metabolite in urine. Similarly we obtained a standard
curve for BE which was linear to approximately 50 ng/ml BE
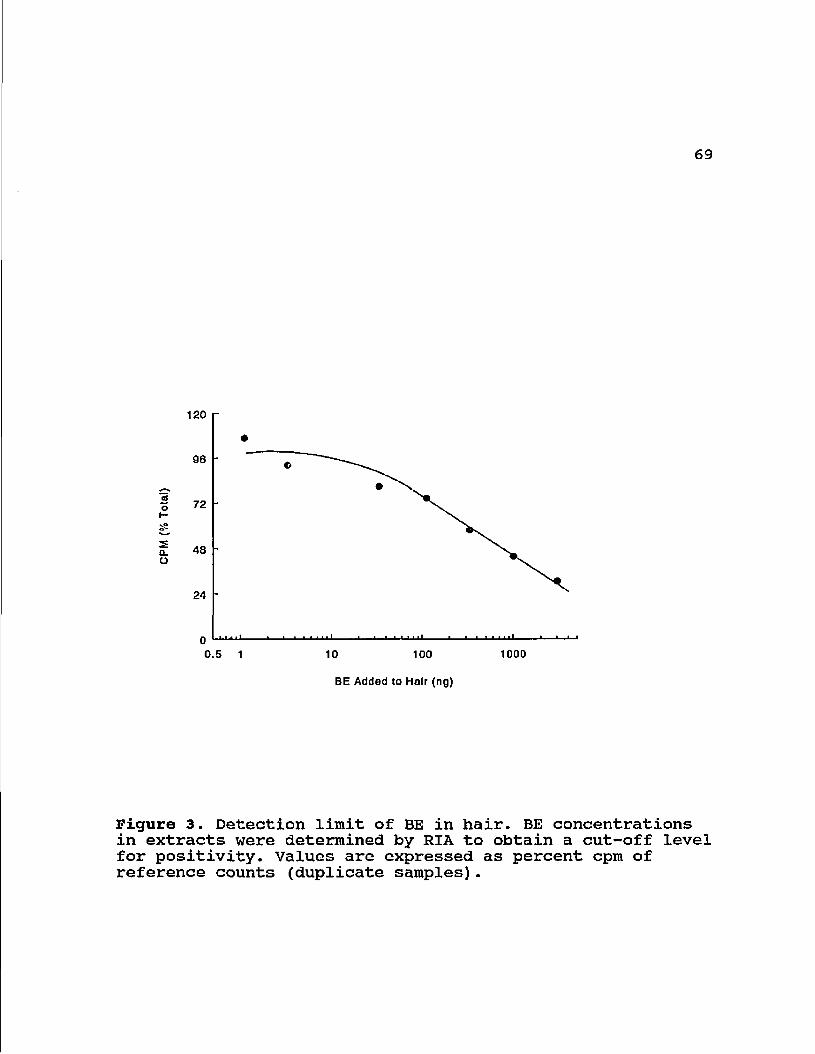
for BE in urine (Fig. 2) and to 60 ng BE added to hair (Fig.
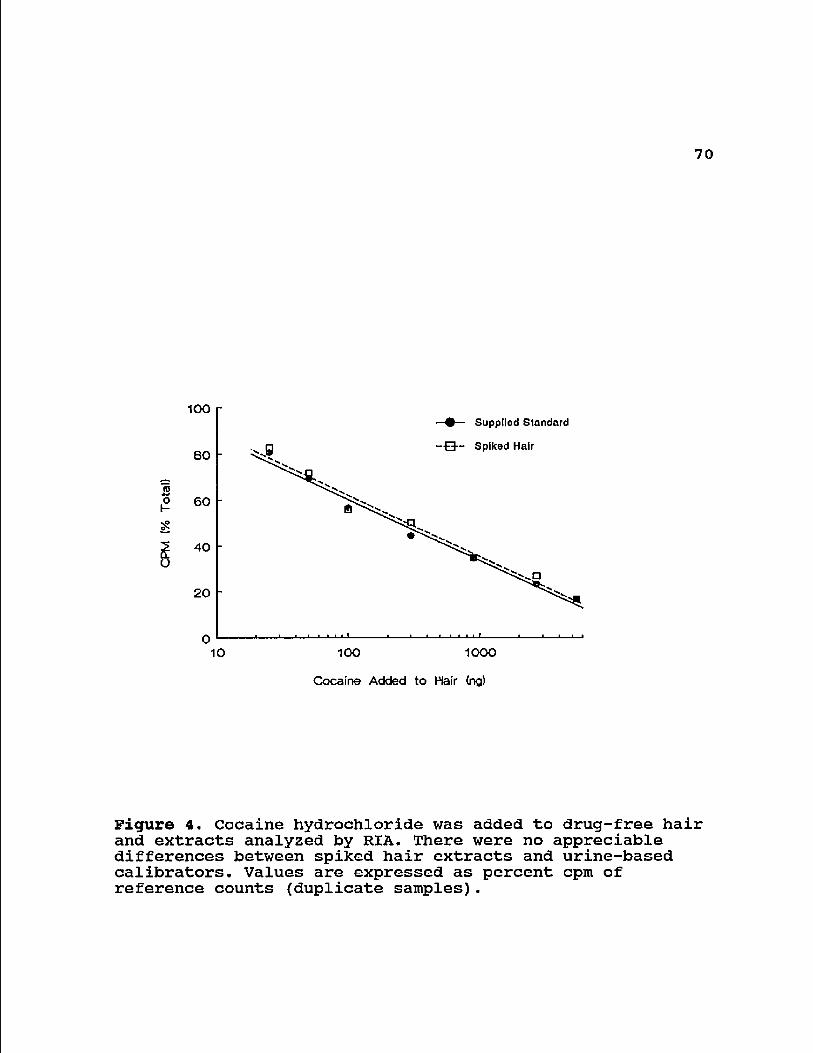
3). Although it is as yet impossible to obtain a "gold"
standard for drug in hair (i.e. a known quantity of drug
embedded in the hair matrix as opposed to surface adsorbed)
we showed that the standard curve of L-cocaine-spiked hair
samples (100 mg hair) deviated only slightly and not
significantly from that generated from the manufacturer's
calibrators and was linear to a concentration of added
cocaine of 25 ng (Fig. 4). The BE antibody used in this RIA
exhibits cross-reactivity of 104% with BE and 7259% with L-
cocaine (98), and based on this information and on the data
obtained from serial dilution procedures outlined above we
chose cut-off points for positivity of test urine samples of
50 ng/ml, and for hair samples of 25 ng/sample (100 mg
hair). Again, because the anti-BE antibody exhibits a high
degree of cross-reactivity with cocaine, results were
expressed as cocaine and BE combined (cocaine/BE), rather
than as BE alone.
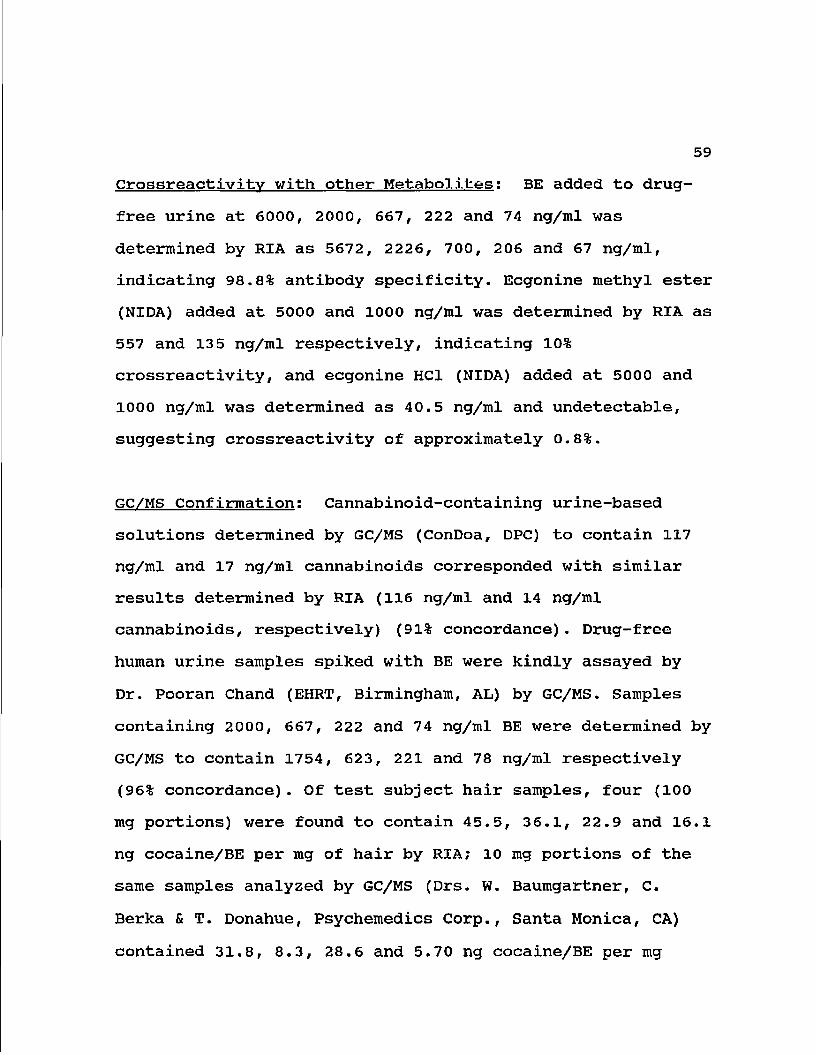
Crossreactivity with other Metabolites: BE added to drug-
free urine at 6000, 2000, 667, 222 and 74 ng/ml was
determined by RIA as 5672, 2226, 700, 206 and 67 ng/ml,
indicating 98.8% antibody specificity. Ecgonine methyl ester
(NIDA) added at 5000 and 1000 ng/ml was determined by RIA as
557 and 135 ng/ml respectively, indicating 10%
crossreactivity, and ecgonine HCl (NIDA) added at 5000 and
1000 ng/ml was determined as 40.5 ng/ml and undetectable,
suggesting crossreactivity of approximately 0.8%.
GC/MS Confirmation: Cannabinoid-containing urine-based
solutions determined by GC/MS (ConDoa, DPC) to contain 117
ng/ml and 17 ng/ml cannabinoids corresponded with similar
results determined by RIA (116 ng/ml and 14 ng/ml
cannabinoids, respectively) (91% concordance). Drug-free
human urine samples spiked with BE were kindly assayed by
Dr. Pooran Chand (EHRT, Birmingham, AL) by GC/MS. Samples
containing 2000, 667, 222 and 74 ng/ml BE were determined by
GC/MS to contain 1754, 623, 221 and 78 ng/ml respectively
(96% concordance). Of test subject hair samples, four (100
mg portions) were found to contain 45.5, 36.1, 22.9 and 16.1
ng cocaine/BE per mg of hair by RIA; 10 mg portions of the
same samples analyzed by GC/MS (Drs. W. Baumgartner, C.
Berka & T. Donahue, Psychemedics Corp., Santa Monica, CA)
contained 31.8, 8.3, 28.6 and 5.70 ng cocaine/BE per mg
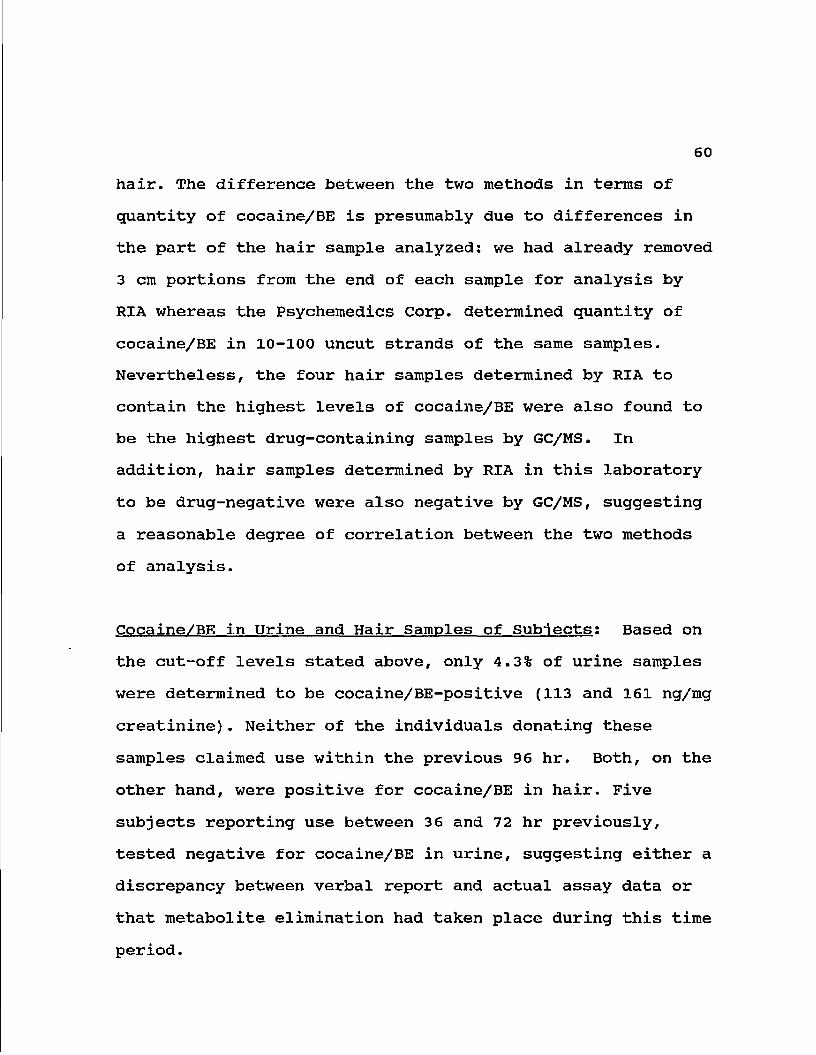
60
hair. The difference between the two methods in terms of
quantity of cocaine/BE is presumably due to differences in
the part of the hair sample analyzed: we had already removed
3 cm portions from the end of each sample for analysis by
RIA whereas the Psychemedics Corp. determined quantity of
cocaine/BE in 10-100 uncut strands of the same samples.
Nevertheless, the four hair samples determined by RIA to
contain the highest levels of cocaine/BE were also found to
be the highest drug-containing samples by GC/MS. In
addition, hair samples determined by RIA in this laboratory
to be drug-negative were also negative by GC/MS, suggesting
a reasonable degree of correlation between the two methods
of analysis.
Cocaine/BE in Urine and Hair Samples of Subjects: Based on
the cut-off levels stated above, only 4.3% of urine samples
were determined to be cocaine/BE-positive (113 and 161 ng/mg
creatinine). Neither of the individuals donating these
samples claimed use within the previous 96 hr. Both, on the
other hand, were positive for cocaine/BE in hair. Five
subjects reporting use between 3 6 and 72 hr previously,
tested negative for cocaine/BE in urine, suggesting either a
discrepancy between verbal report and actual assay data or
that metabolite elimination had taken place during this time
period.
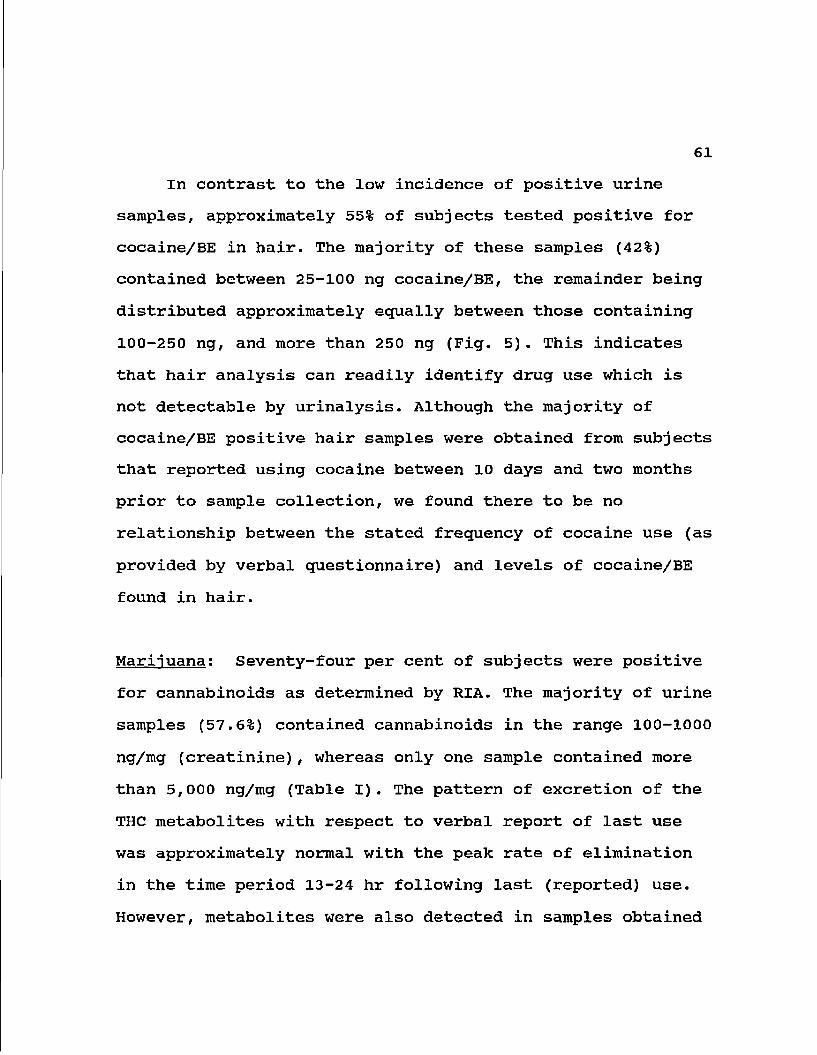
61
In contrast to the low incidence of positive urine
samples, approximately 55% of subjects tested positive for
cocaine/BE in hair. The majority of these samples (42%)
contained between 25-100 ng cocaine/BE, the remainder being
distributed approximately equally between those containing
100-250 ng, and more than 250 ng (Fig. 5). This indicates
that hair analysis can readily identify drug use which is
not detectable by urinalysis. Although the majority of
cocaine/BE positive hair samples were obtained from subjects
that reported using cocaine between 10 days and two months
prior to sample collection, we found there to be no
relationship between the stated frequency of cocaine use (as
provided by verbal questionnaire) and levels of cocaine/BE
found in hair.
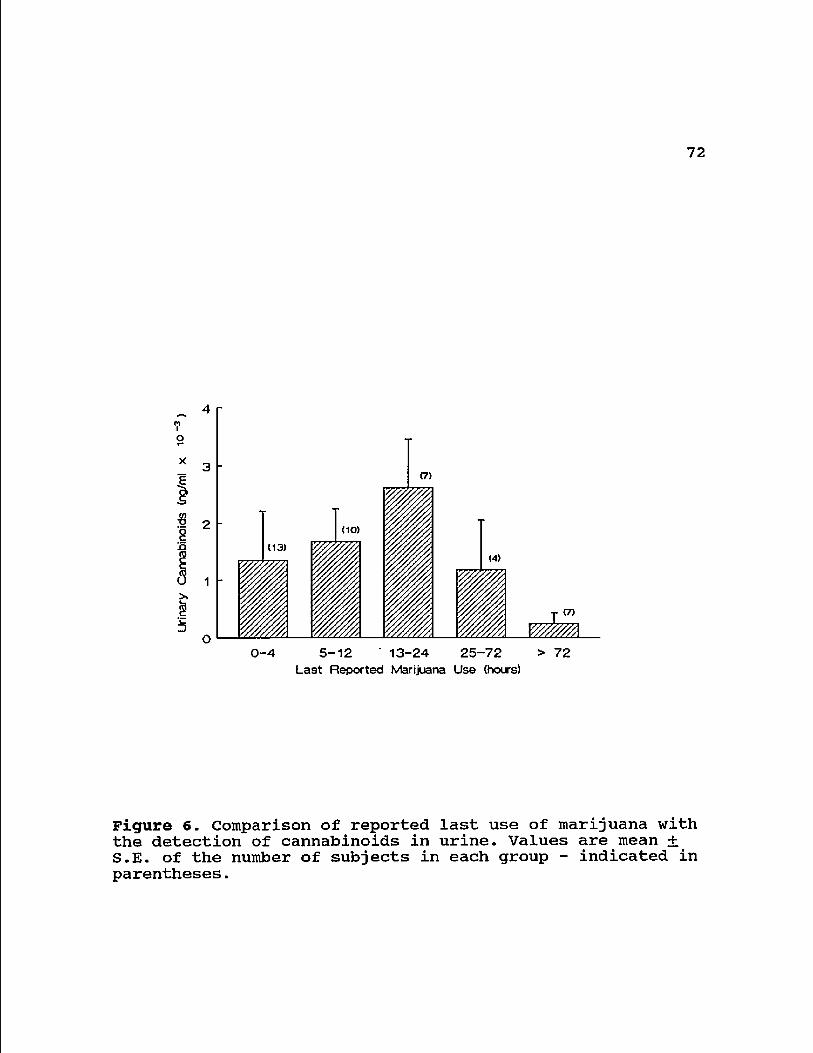
Marijuana: Seventy-four per cent of subjects were positive
for cannabinoids as determined by RIA. The majority of urine
samples (57.6%) contained cannabinoids in the range 100-1000
ng/mg (creatinine), whereas only one sample contained more
than 5,000 ng/mg (Table I). The pattern of excretion of the
THC metabolites with respect to verbal report of last use
was approximately normal with the peak rate of elimination
in the time period 13-24 hr following last (reported) use.
However, metabolites were also detected in samples obtained
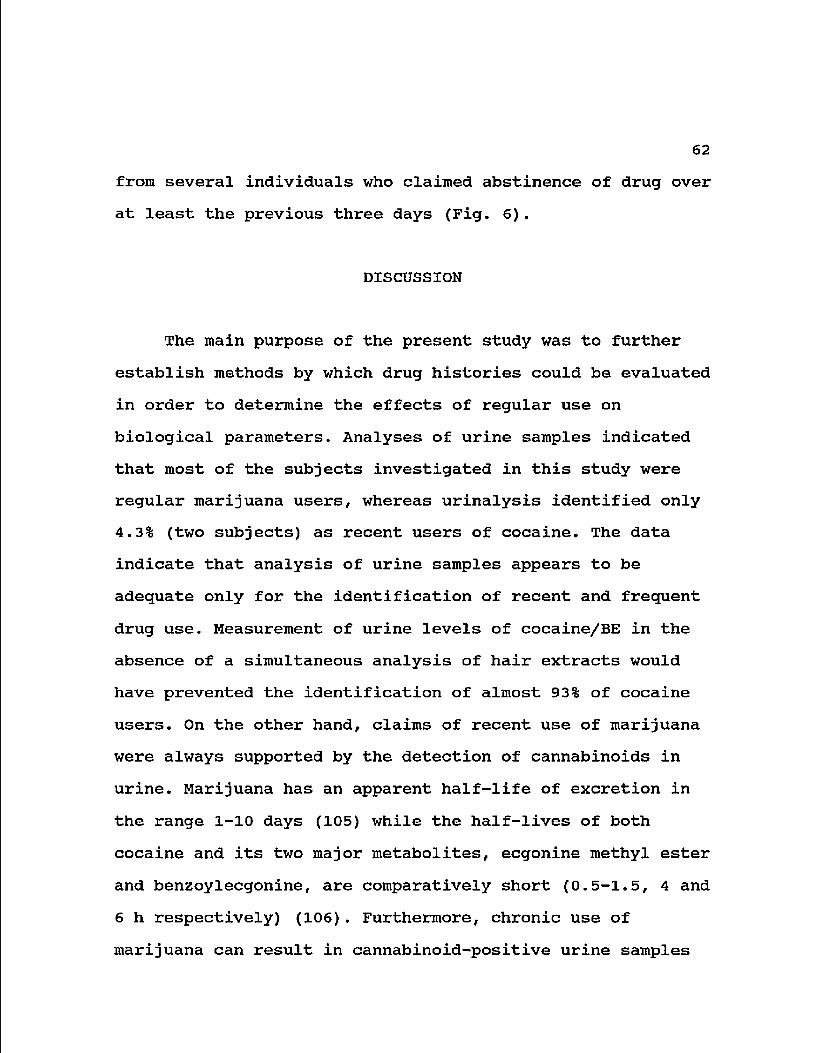
62
from several individuals who claimed abstinence of drug over
at least the previous three days (Fig. 6).
DISCUSSION
The main purpose of the present study was to further
establish methods by which drug histories could be evaluated
in order to determine the effects of regular use on
biological parameters. Analyses of urine samples indicated
that most of the subjects investigated in this study were
regular marijuana users, whereas urinalysis identified only
4.3% (two subjects) as recent users of cocaine. The data
indicate that analysis of urine samples appears to be
adequate only for the identification of recent and frequent
drug use. Measurement of urine levels of cocaine/BE in the
absence of a simultaneous analysis of hair extracts would
have prevented the identification of almost 93% of cocaine
users. On the other hand, claims of recent use of marijuana
were always supported by the detection of cannabinoids in
urine. Marijuana has an apparent half-life of excretion in
the range 1-10 days (105) while the half-lives of both
cocaine and its two major metabolites, ecgonine methyl ester
and benzoylecgonine, are comparatively short (0.5-1.5, 4 and
6 h respectively) (106). Furthermore, chronic use of
marijuana can result in cannabinoid-positive urine samples
63
up to 36 days after the last reported use (107) and
particularly heavy use may give positive results for more
than 60 days (108). In concordance with these reports we
found that intermediate and high concentrations of
cannabinoids were still detectable in several urine samples
from individuals claiming a 4-6 day abstinence from the
drug. Conversely, the detection time of BE in urine
following a single administration of cocaine is generally
less than 72 h (60,109) although it was shown recently that
BE may be excreted for as long as 120 h after cocaine use
(63). These findings were, however, attributed to chronic,
extremely heavy use of cocaine. Our subjects did not
(according to hair assay data) fit into this particular
category but appeared instead to be low-level, infrequent
users of cocaine. This postulate was confirmed by the
finding that the content of BE found in hair samples of
subjects was generally low (less than 250 ng).
Although little is known about drug uptake into hair,
the process may involve interaction of the metabolite with
cystine residues of the hair protein fiber network (3).
Incorporation into the hair matrix is thought to occur in
proportion to drug plasma concentration, which in turn
depends on the amount of drug administered and rates of
clearance. In the present study we observed several
instances in which admission of use of cocaine conflicted
64
with a cocaine/BE-negative hair sample, and vice versa.
Secondly, when in a subsequent study the levels of heroin
metabolite (morphine) in urine and hair were examined, the
number of samples actually testing positive (no urine
samples, two hair samples) bore little relationship to the
51% of subjects that claimed use. Our experiments with
genetically-identical mice injected with cocaine or morphine
have indicated that the amount of drug extracted from hair
is related to dose (Chapter 1). In these mice the co-
injection of cocaine and morphine did not affect the hair
levels of either BE or morphine, and there were no false
positive or false negative hair samples. Hence the
conflicting data obtained with human subjects regarding
frequency of self-reported use of drug and actual content of
metabolite detected in hair samples could be due to
differences in individual pharmacokinetics, poor recall or
ignorance of the purity of the drug administered (61). Our
results suggest the need to use analytical procedures to
support and show validity of data provided by verbal
reports, particularly if payment for participation is made.
The subjects in our study were Hispanic men rather than a
random sample of the drug-using population in the U.S., and
thus, the data (as with any small sample) are not
appropriate for extrapolation to that of other populations.
Nevertheless, the pattern of drug use observed with these
65
individuals appears similar to data obtained by survey
analysis, i.e., a high incidence of cocaine and marijuana
abuse, with a lower number of cases of heroin use. Our study
illustrates that surveys which depend only on verbal data
for evidence of drug use may suffer from a lack of recall or
veracity of reporting on the part of the subject. Thus it
is important to establish a reliable method whereby past and
present drug use may be properly evaluated. Hair analysis as
a method for evaluating the drug status of an individual has
several obvious advantages over urinalysis. First, long-term
drug use may be evaluated, depending on hair length; second,
samples are not easily adulterated and can be recollected
later if results are questioned; and last, the method of
collection does not cause embarrassment to the subject. On
the other hand, a recent dictum by the U.S. Food and Drug
Administration limits use of the technique in mass screening
procedures (e.g. pre-employment) on the basis that quality
control procedures have not yet been established (49).
Further, sample preparation can be more labor-intensive than
urinalysis, particularly if a large number of subjects is
involved. However, we believe that, for studies using small
numbers of subjects for measurement of biological changes,
hair analysis shows particular merit for confirmation of
drug use.
66
Acknowledgements
We express appreciation for the assistance of
interviewers Rigoberto Centeno, M.D. and Gloria Venezuela.
This study is supported by NIH grants AA08037 (minority
supplement), DA04827, and NIDA grant R 18 DA05748.
67
THC Added to Urine (ng/ml)
Figure 1. Detection limit of cannabinoids in urine. The cutoff level for positivity was taken at the point at which the dilution curve lost linearity. Values are expressed as percent cpm of reference counts (duplicate samples).
68
120
48
24
jJ x 1 0,1 1 10 100 1000 10000
BE Added to Urine (ng/ml)
Figure 2. Detection limit of BE in urine. Values are means + S.D. of three separate experiments and are expressed as percent cpm of reference counts.
69
BE Added to Hair (ng)
Figure 3. Detection limit of BE in hair. BE concentrations in extracts were determined by RIA to obtain a cut-off level for positivity. Values are expressed as percent cpm of reference counts (duplicate samples).
70
100
80
jO 60
>? cr*
O 40
20
-A— Supplied Standard
•E3— Spiked Hair
» » » * « • ! ' i . I *
10 100 1000
Cocaine Added to Hair (ng)
Figure 4. Cocaine hydrochloride was added to drug-free hair and extracts analyzed by RIA. There were no appreciable differences between spiked hair extracts and urine-based calibrators. Values are expressed as percent cpm of reference counts (duplicate samples).
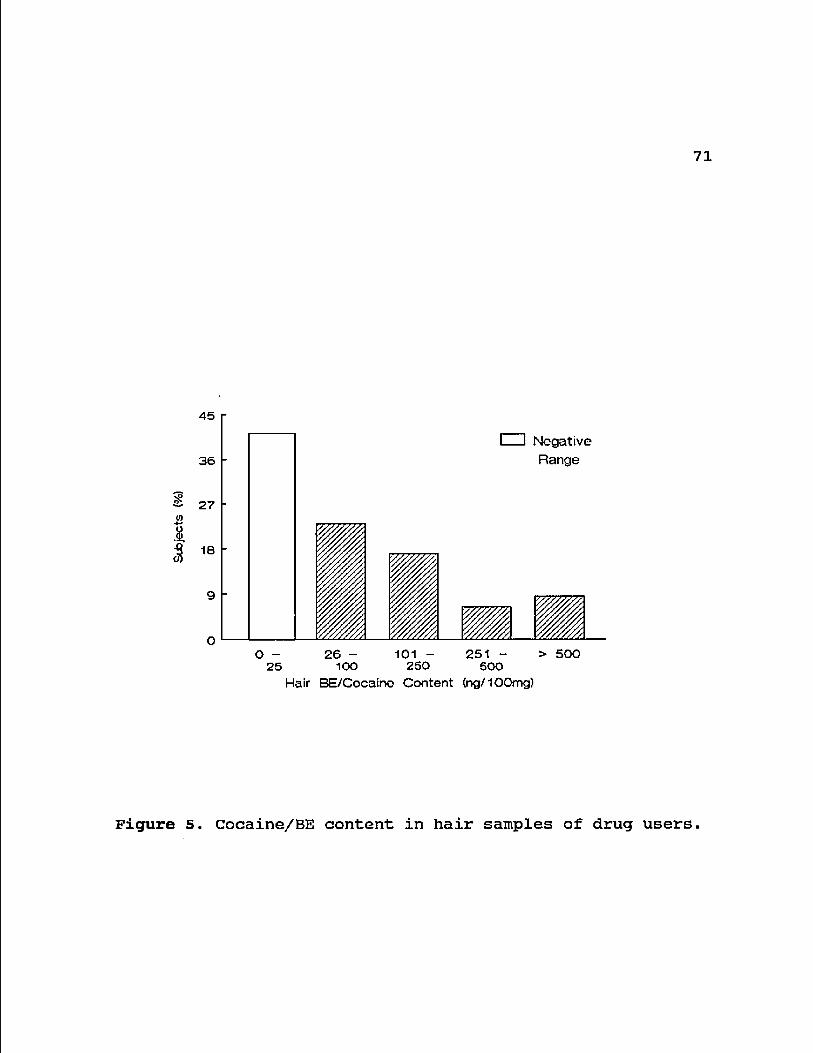
71
45
I I Negative
Range 36
27
18
9
O > 500 26 - 101 251 O
25 100 250 500 Hair BE/Cocaine Content (ng/100mg)
Figure 5. Cocaine/BE content in hair samples of drug users.
72
x
I
4 r
3 -
2 2 -
<3 >> 1 5
1 -
0-4 5-12 13-24 25-72 > 72 Last Reported Marijuana Use (hours)
Figure 6. Comparison of reported last use of marijuana with the detection of cannabinoids in urine. Values are mean ± S.E. of the number of subjects in each group - indicated in parentheses.
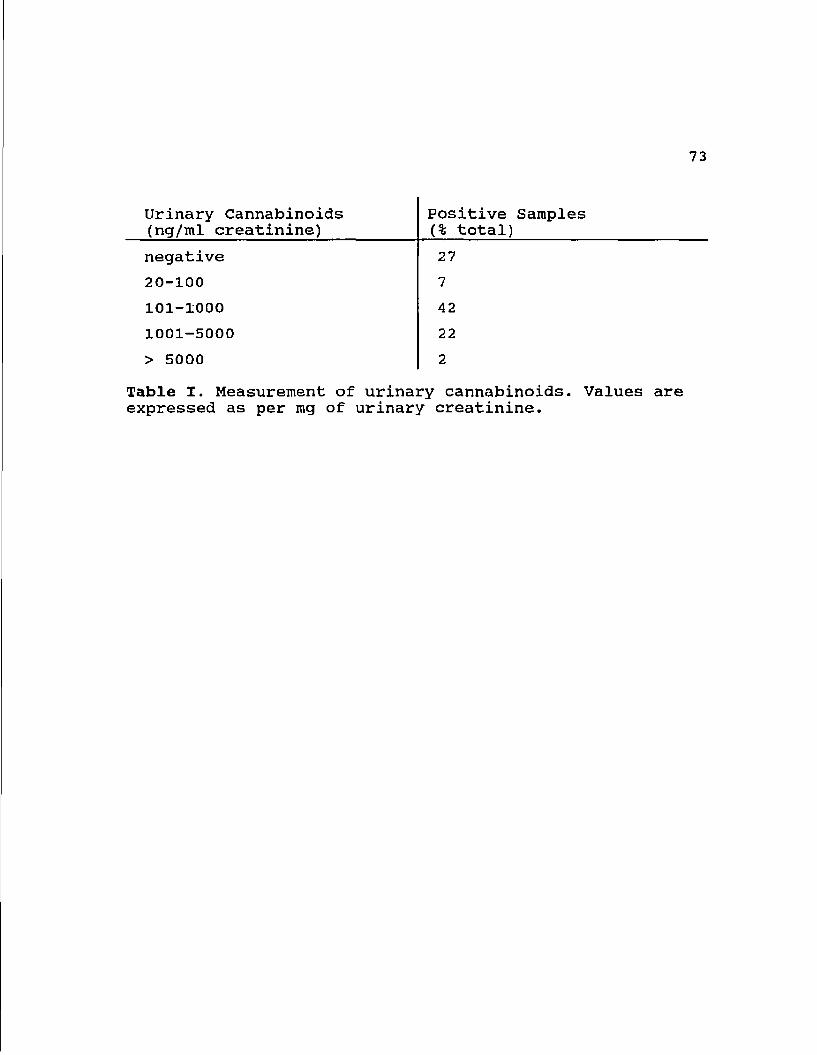
73
Urinary Cannabinoids (ng/ml creatinine)
Positive Samples (% total)
negative 27
20-100 7
101-1000 42
1001-5000 22
> 5000 2
Table I. Measurement of urinary cannabinoids. Values are expressed as per mg of urinary creatinine.
74
CHAPTER 5: COCAINE ASSOCIATED ABNORMALITIES IN
NATURAL KILLER CELL FUNGTION IN DRUG ABUSERS
INTRODUCTION
Cocaine (benzoylmethylecgonine) is an alkaloid obtained
from the leaves of Ervthroxvlon coca, a plant found
predominantly in Western South America. Considered the
"champagne of drugs", increasing use of cocaine as a
recreational drug in recent years has prompted questions
regarding the public health risks of abusing this drug and
reports document the toxic effects of cocaine (110,111).
Alterations of the immune system have been noted following
cocaine intake (75,112,113), although much remains to be
elucidated about the actual immunotoxicological mechanisms
involved. Cocaine has been poposed to be a co-factor in the
development of the Acquired Immunodeficiency Syndrome (AIDS)
(114) .
Natural Killer (NK) cells appear to play a role in a
variety of diseases. Compromised or absent NK cell activity
has been linked to development and progression of cancer as
well as chronic and acute viral infections including AIDS
(115-117). Studies also show that NK cells are involved in
75
multiple effector, regulatory and developmental activities
of the immune system (118-120).
The present study was undertaken as part of a detailed
investigation into the immunotoxicology of cocaine and other
drugs of abuse. Few reports are available regarding the
effects of cocaine on the immune system which may include
both suppressive and stimulatory actions (75) . An important
consideration in such studies involving drug addicts is an
accurate assessment of drug use. Most studies take into
account the history of drug use given by the subject.
However this can be misleading and inaccurate, varying with
the reasons or incentives facing the subject coming in for
the study. Having faced such inconsistencies, we screened
all our subjects for the presence of cocaine in urine and
hair. Analysis for cocaine in hair samples was done taking
into account its reliability (3) and the short duration of
time the drug and its metabolites remain in serum and urine.
On the other hand, it has been poposed that cocaine is
deposited at a consistent rate over time in hair and can be
used to correlate drug use with immunological functions
(38) .
76
MATERIALS AND METHODS
Drug Users: A non random sample of 47 Hispanic male drug
users were recruited in Nogales, Arizona. All subjects were
part of the National Institute of Drug Abuse (NIDA) funded
Community Outreach Project on AIDS in Southern Arizona
(COPASA). The details of the study were explained to all
subjects and informed consent was obtained as per the
regulations of the Human Subjects Committee of the
University of Arizona. Using a standardized questionnaire
administered by a trained bilingual interviewer, each
subject was asked his history of substance abuse including
cocaine, heroin, marijuana, alcohol and tobacco. Hair, urine
and blood samples were taken by trained personnel at the
time of the interview. None of the subjects reported
infection with Human Immunodeficiency Virus (HIV). The
overall incidence of seropositivity in the 800 subjects
screened in the COPASA program was less than 2% (Erickson &
Estrada, unpublished data).
Controls: A convenience sample of 15 disease-free healthy
males was recruited from laboratory and hospital personnel.
None of the controls had a history of substance abuse of any
77
kind, and this was confirmed by hair and urine analysis for
cocaine, morphine and marijuana.
Screening for cocaine use: To determine which of the
subjects actually used cocaine or other drugs over the
recent past, an analysis of urine and hair was done.
Extraction of the drug and its derivatives from hair was
done as described by Balabanova et al. (71) and modified by
us (Chapter 3), using an RIA kit (Diagnostic Products
Corporation, Los Angeles, CA). Urine samples were analyzed
for cocaine, morphine and for marijuana derivatives
(tetrahydrocannabinols).
Blood samples: Blood was collected by venipuncture into
Leucoprep tubes (Becton & Dickinson,Lincoln Park, NJ). These
sterile heparinized tubes, containing lymphocyte separation
medium, can directly be processed for mononuclear cell
separation, avoiding blood dilutions and keeping personnel
contact with blood to the minimum. The tubes were
centrifuged at 1500 g for 20 minutes. Mononuclear cells were
isolated, washed and depleted of adherent cells by plastic
adherence as described before (121).
Assay For NK Cell Activity; NK cell activity was measured
using the direct 51 Cr release assay with the erythroleukemia
78
cell line K562 as targets (122). Briefly, lymphocytes and
labelled target K562 cells were incubated together at
different effector:target concentrations (50:1, 25:1 and
12.5:1) in U bottom micotiter plates (Falcon, Becton &
Dickinson, NJ). After centrifugation at 40 g for 5 minutes
the plates were incubated at 37° C in a humidified
atmosphere of 5% carbon dioxide in air for 4 hours.
Following incubation the plates were centrifuged at 400 g
for 10 minutes and 100 fil of supernatant was removed from
each well and counted in a gamma counter. Total release of 51
Cr was determined in triplicate wells by lysis of labelled
K562 cells with 1% NP 40 solution. Spontaneous release was
determined by incubation of effector cells with media alone.
Percentage cytotoxicity was calculated by using the mean of
triplicate values as follows:
% Cytotoxicity = experimental release - spontaneous release x 100% total release — spontaneous release
Determination of Circulating NK Cells: The number of
circulating NK cells were determined by flow cytometry of
peripheral blood using the monoclonal antibody against the
CD 16 antigen found predominantly on NK cells (Leu 11c).
Data Analysis: Characteristics of the sample including
demographics and substance abuse patterns were analyzed
using descriptive statistics. Distribution of data for NK
cells, NK cell activity and drug levels were examined using
histograms and scatterplots.
Due to the non-normal distribution of drug and immune
parameters, comparisons among groups of subjects were made
using nonparametric techniques. Subjects were grouped by
level of cocaine measured in their hair. Groups were
compared using the Kruskal-Wallis 1-way ANOVA. When a
significant difference was demonstrated among the groups,
the Mann-Whitney U test examined differences between groups.
Bivariate relationships between cocaine levels in hair and
NK cell activity were estimated by Spearman rank order
correlation coefficients. Differences for all analyses were
considered statistically significant at p < 0.05.
RESULTS
Sample Characteristics: 47 Hispanic males participated in
the study. Average age of the sample was 25.9 years (S.D. =
6.3) with a range of 14-41 years. On a scale of non use to
heavy use of cocaine, the majority (n=27; 58%) reported
heavy current use; 11 reporting moderate use, 1 with
occasional use, 2 with infrequent use and 6 with non use.
Thirty six subjects said they used tobacco with the majority
80
(n= 23) smoking less than one pack a day. In addition, 38
subjects used alcohol, with 5 reporting daily use, 27 with
weekly use and 6 with monthly use. On a scale of 1 = poor to
4 = excellent, 26 reported fair health, 15 reported good
health and 2 reported poor health. None of the subjects
reported infection with HIV, hepatitis, gonorrhea or
syphilis. One user reported being diagnosed with
tuberculosis and two with genital herpes in the last month.
Controls included 15 males of mixed ethnicity with an age
range of 18-49 years in good health with no infections
(Table I).
Screening for Cocaine; The median cocaine level in the hair
of the 47 test subjects was 33.7 ng/100 mg hair (range: 1.4
to 4552.1 ng/100 mg hair). Four subjects tested positive for
cocaine in the urine. Two subjects tested mildly positive
for morphine in the hair and 38 of the 47 subjects tested
positive for marijuana derivatives in urine. To study the
relation between levels of cocaine in the hair and NK cell
activity, the sample of drug users were categorized into 3
groups. Group 1 had cocaine levels less than 18.7 ng/100 mg
hair and were classified as the low cocaine group (n =15).
Some of these individuals had hair cocaine levels which were
comparable to the hospital staff controls who were known to
be not using the drug. This could be due to a low frequency
81
of use or that insufficient time or insufficient amounts had
been taken for a detectable amount of cocaine metabolite to
be recovered in the hair. Two times the standard deviations
added to the mean value of the controls (18.7 ng/100 mg
hair) was used as a cut-off point. Group 2 had levels
greater than 18.7 ng/100 mg hair but less than 100 ng/ 100
mg hair were classified as the moderate cocaine group (n
=16)..Subjects with cocaine levels greater than 100 ng/100
mg hair were placed in the high cocaine group (n =16).
Circulating NK Cells Among Cocaine Users: The percent NK
cells ranged from 1-39% (median = 11%) for the low cocaine
group, 4-44% (median = 10%) for the moderate cocaine group,
and 5-40% (median = 14%) for the high cocaine group.
Absolute NK cell counts were in the range 90.2-1310.4
(median =327.6) for the low group, 25.7-1584.0 (median =
228.3) for the moderate group and 118.9-706.8 (median =
445.2) for the high group. No statistically significant
differences were evident between the three groups for
percent or number of NK cells. Differences among the three
cocaine groups and the controls for circulating NK cells
were not statistically significant using the Kruskal- Wallis
1 way ANOVA (Table II).
82
NK Cell Activity Among Drug Users : Comparison of NK cell
activities at the three Effector:Target (E:T) ratio levels
for the low, moderate and high cocaine groups were
performed. Results from all three ratios showed a consistent
pattern, and hence data for the 50:1 ratio is shown (Table
III). Significant differences were demonstrated among the
three groups of cocaine users (Kruskal-Wallis 1-way ANOVA).
Mann-Whitney U tests were used to determine which 2 groups
were different for each of the three cytotoxicity
parameters. There were significant differences between the
low and moderate, and between the low and high cocaine
groups. All significant differences revealed higher levels
of activity for moderate and high cocaine groups than for
the low cocaine group. No difference was demonstrated
between the moderate and high groups (Table II).
Scatterplots of ranked data for NK cell activity at all
three E:T ratios and cocaine levels in the hair demonstrated
significant positive relationships (Spearman's rho). At the
50:1 ratio, the rho was 0.54 (Figure 1). NK cell activity
was therefore seen to increase with higher levels of cocaine
in the 47 drug users. Differences among the three groups of
drug users and controls were statistically significant.
Mann-Whitney U tests were used to determine which of the
four groups were different (Table II). Controls were
compared with all cocaine groups and showed higher NK cell
83
activity than the low and moderate cocaine groups, but
showed no difference from the high cocaine group.
DISCUSSION
Concerns about immunotoxicological effects of drugs of
abuse are on the increase, particularly since the AIDS
epidemic. If drugs of abuse significantly compromise the
immune system, their use may well be a predisposing factor
in the development or enhancement of AIDS. All subjects
were selectively screened for cocaine abuse. They were
analyzed on the basis of differential levels of drug residue
in hair indicating extent of drug abuse in the recent past
(Chapter 4).
Findings in this study reveal aberrations in NK cell
activity in cocaine users, many of whom also used marijuana,
alcohol and tobacco. The various groups used similar amounts
of these substances (as confirmed by self admission and
verified by biochemical tests) but they were significantly
different in their use of cocaine. The interesting finding
of this study is the positive correlation seen between
levels of cocaine in the hair and NK cell function. The
observed changes in NK activity could not have been due to
changes in the counts of lymphoid cells with NK markers,
84
since no group showed any significant changes in the levels
of circulating NK cells. Thus it appears that the lifestyle
of the drug users lowered NK cell functions but not numbers
of NK cells. In addition, the use of larger amounts of
cocaine caused a relative rise in NK cell activity. This
finding might be interpreted in a different way. It is
possible that cocaine can be initially immunosuppressive,
explaining the low NK cell activity in subjects with low
concentrations of cocaine in their hair. On prolonged or
chronic use, the abuser becomes tolerant. This view is
supported by the fact that subjects with the highest levels
of cocaine in their hair and therefore the longest users,
had NK cell function values comparable to normal controls.
Associations between cocaine and NK cell activity have
been reported before. In a controlled study, known amounts
of either cocaine hydrochloride or benzoylecgonine
tetrahydrate (a major metabolite of cocaine) were
administered to eight subjects (4). An increase in NK cell
activity was demonstrated within 5 minutes following the
administration of the cocaine. No such increase was found
following the administration of benzoylecgonine. Also, there
was an increase in CD16 positive lymphocytes which are
believed to have NK activity. When added directly to
lymphocytes in vitro, cocaine had no influence on NK
activity (4).
85
In the present study, it is not probable that the
increased NK cell activity among the drug abusers with high
residues of cocaine in their hair was due to such a rapid
effect of cocaine. Almost none of our subjects had
detectable levels of cocaine metabolites in their urine
which indicates absence of use during the past day.
Therefore, the effects on NK cell function observed in this
study may not be an immediate or direct one.
Cocaine may increase NK cell function through a neuro
endocrine mediated process (75). In vivo, cocaine binds to
specific sites on brain membranes (123), resulting in
multiple neurochemical actions including altered metabolism
of neurotransmitters such as serotonin, dopamine,
acetylcholine and norepinephrine (124,125). Cocaine causes
inhibition of the reuptake of these neurotransmitters by
presynaptic nerve endings, causing a prolongation of their
actions. In addition, cocaine also stimulates the release of
beta endorphin (12 6). Beta endorphin and norepinephrine are
potent stimulants of NK cell activity (127-130). Whether
this increased activity is due to an increase in circulating
NK cells or due to an increased activation of existing cells
is not clear. We could not detect any increases in NK cell
numbers in the cocaine users based on surface phenotyping.
Another factor to be considered is the role of
nutrition. It is known that malnutrition can cause immune
86
derangement (131) and that drug users are usually found to
have nutritional deficiency (132). NK cells have been
recognized primarily for their cytotoxic reactivity against
malignant cells, microorganisms and viral infected cells.
However, it is now evident that these cells also have
powerful immunoregulatory roles in bone marrow cell
maturation and regulation of antibody production (117-120).
A recent study also demonstrated that NK cells could
directly suppress activation and proliferation of B
lymphocytes (133). The antibody producing mechanism is one
of the front line defense systems against pathogenic insult.
Any inhibition of this mechanism could have serious
repercussions for the host. In addition, NK cells also may
act as suppressor cells in some immune responses (115).
It therefore appears that the immunotoxicology of
cocaine in drug users, may involve complex metabolic
interactions. Moreover the stress resulting from
pathological, disruptive and nutritional consequences of
cocaine use may further contribute to the immunological
abnormalities. Since drug users are very high risk groups
for AIDS, it is possible that cocaine-induced defects in NK
cell function, whether suppressive or abnormally
stimulatory, can influence HIV infection (114). Our
preliminary studies on cocaine and NK cell function in
retrovirally infected mice seem to agree with this (5). A
comprehensive and multiparameter approach is therefore
required to elucidate this seemingly complex problem.
87
ACKNOWLEDGEMENTS
The authors are grateful to Rigoberto Centeno, MD, and
Gloria Venezuela for patient recruitment and interview,
Cathy Suriano for technical assistance and Mary Jane Hicks,
MD in doing flow cytometry. Supported in part by NIDA Grant
# R18 DA05748, NIH grant # DA 04827 and a minority
(Hispanic) post doctoral study {as part of the NIAAA funded
specialized Alcohol Research Center AA08037}.
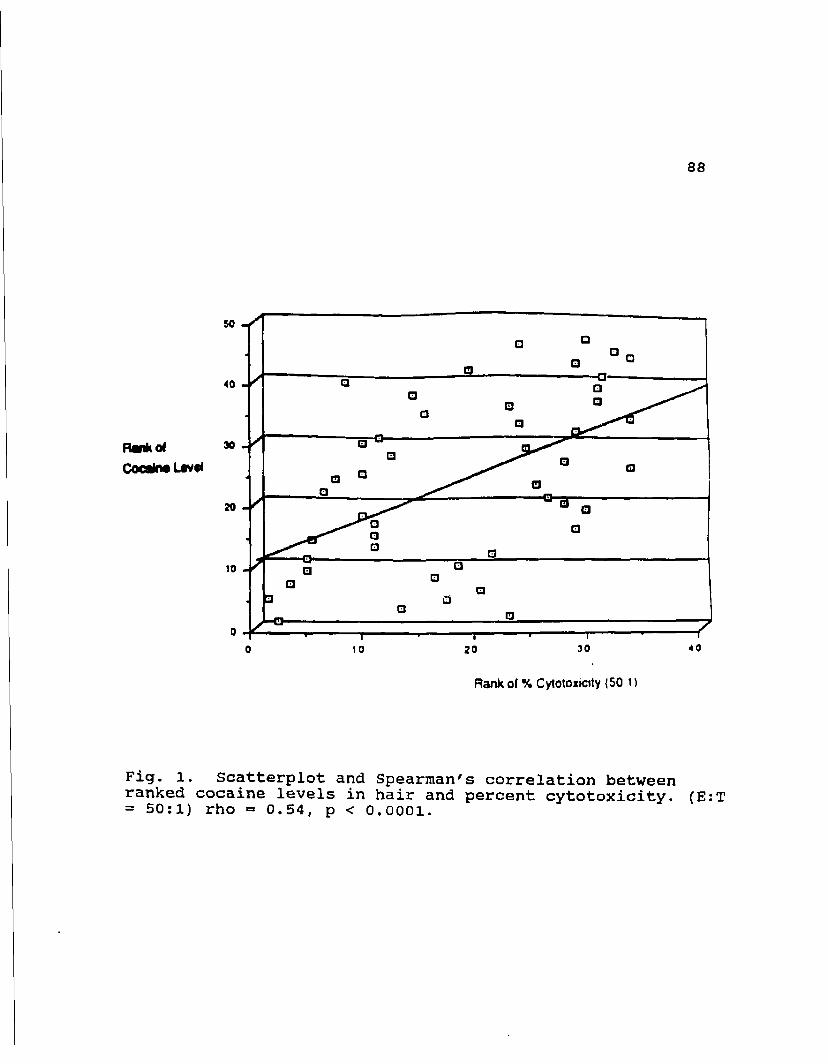
88
Rank of % Cytotoxioty {50 i t
Fig. l. Scatterplot and Spearman's correlation between ranked cocaine levels in hair and percent cytotoxicity. (E:T = 50:1) rho = 0.54, p < 0.0001.
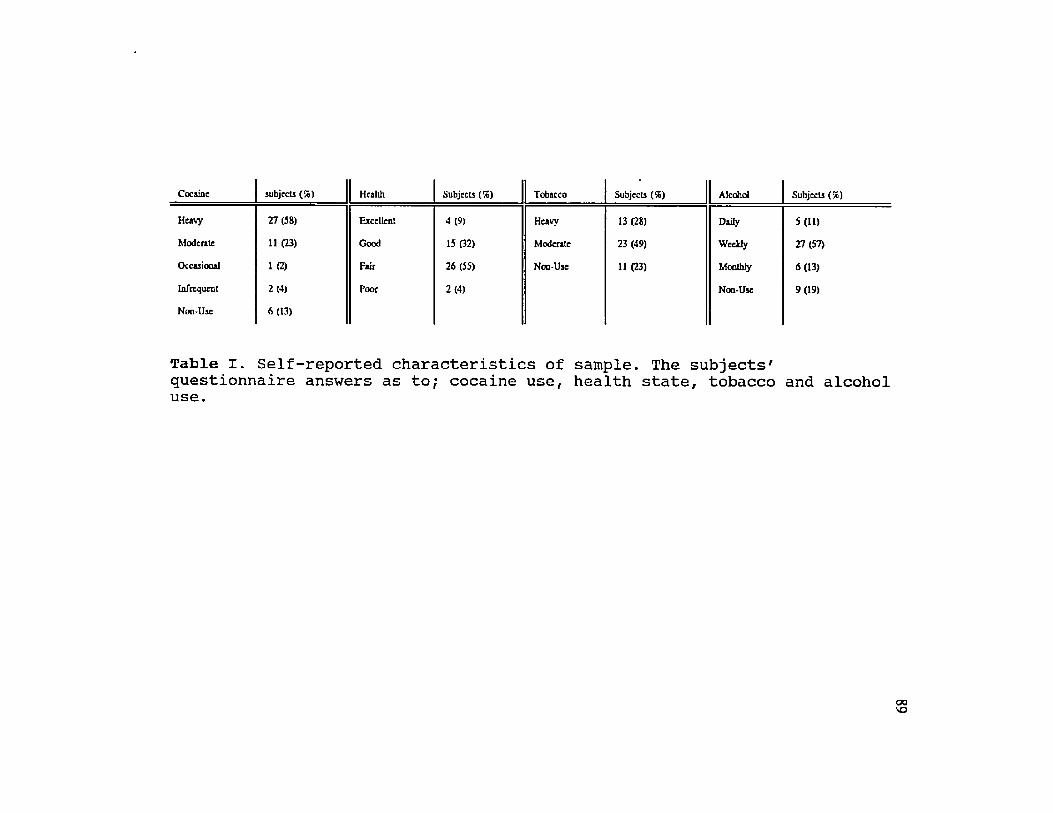
Cocaine subjects (%) Health Subjects (7c) Tobacco Subjects (56) Alcohol Subjects (%)
Heavy 27 (58) Excellent 4 (9) Heavy 13 (28) Daily 5(11)
Moderate 11 (23) Good 15 (32) Moderate 23 (49) Weekly 27(57)
Occasional 1 (2) Fair 26 (55) Non-Use 11 (23) Monthly 6(13)
Infrequent 2(4) Poor 2 (4) Non-Use 9(19)
Non-Use 6(13)
Table I. Self-reported characteristics of sample. The subjects' questionnaire answers as to; cocaine use, health state, tobacco and alcohol use.
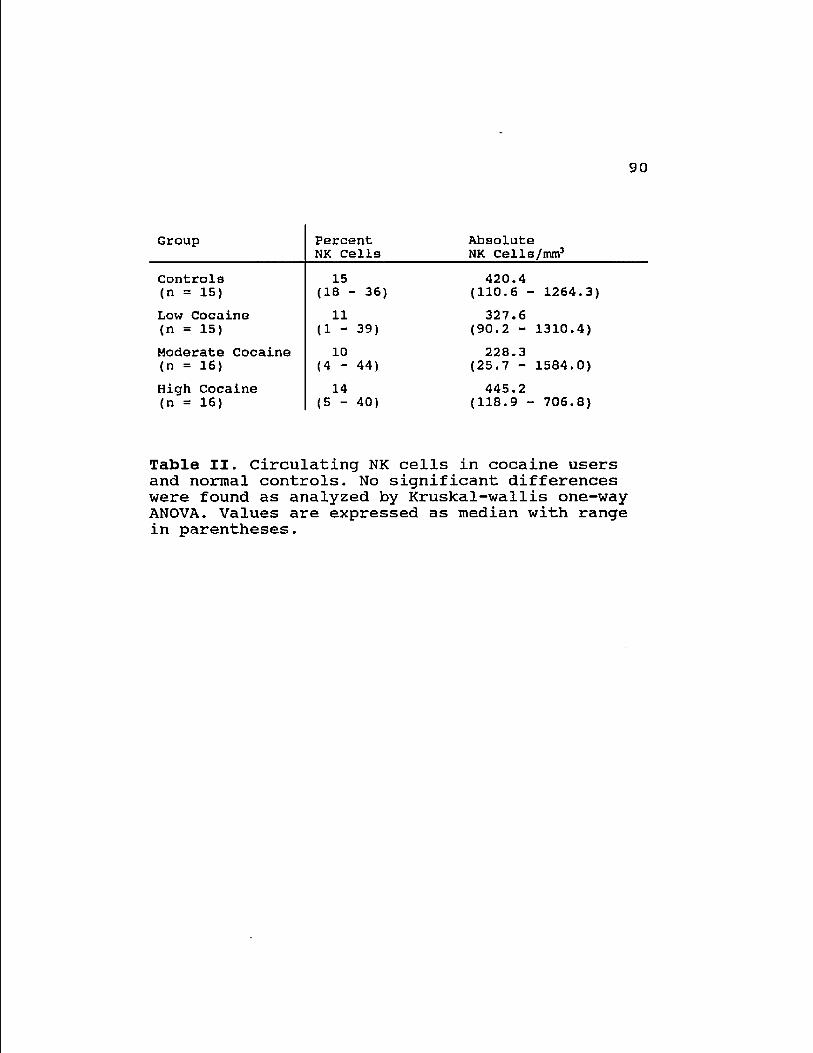
90
Group Percent Absolute Group NK Cells NK Cells/mm3
Controls 15 420.4 (n = 15) (18 - 36) (110.6 - 1264.3)
Low Cocaine 11 327.6 (n = 15) (1 - 39) (90.2 - 1310.4)
Moderate Cocaine 10 228.3 (n = 16) (4 - 44) (25.7 - 1584.0)
High Cocaine 14 445.2 (n = 16) (5 - 40) (118.9 - 706.8)
Table II. Circulating NK cells in cocaine users and normal controls. No significant differences were found as analyzed by Kruskal-wallis one-way ANOVA. Values are expressed as median with range in parentheses.
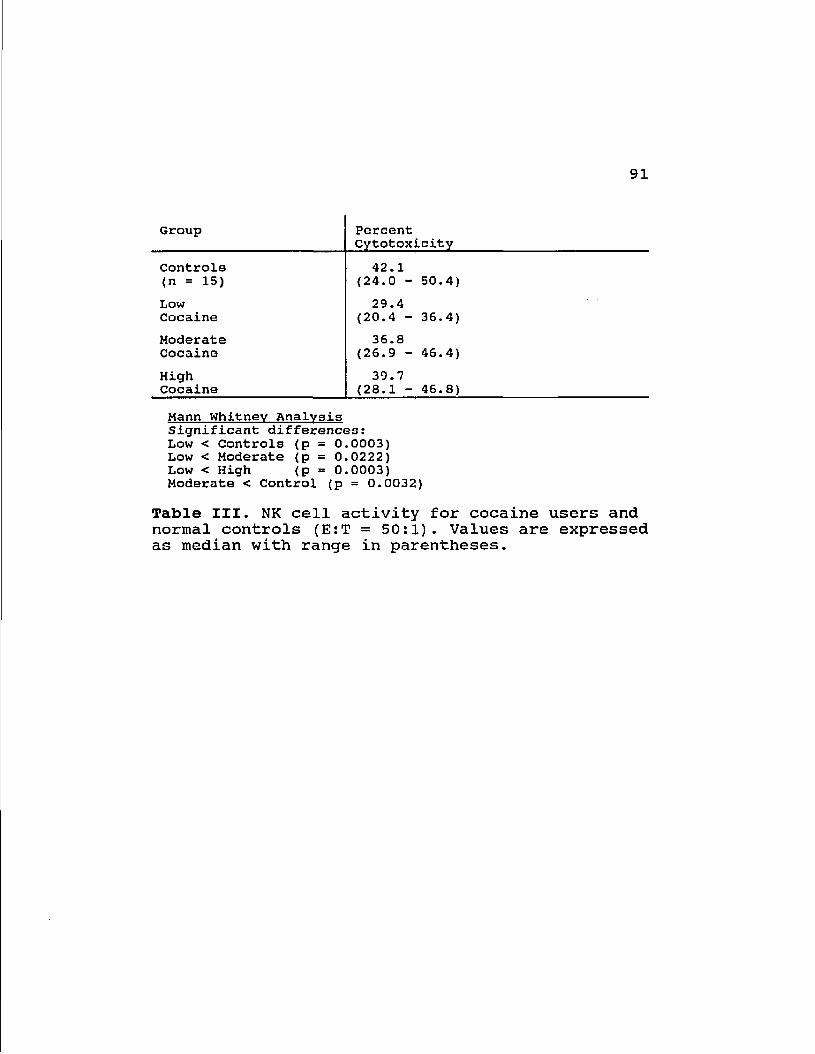
91
Group Percent Cytotoxicity
Controls 42.1 (n = 15) (24.0 - 50.4)
Low 29.4 Cocaine (20.4 - 36.4)
Moderate 36.8 Cocaine (26.9 - 46.4)
High 39.7 Cocaine (28.1 - 46.8)
Mann Whitney Analysis Significant differences: Low < Controls (p = 0.0003) Low < Moderate (p = 0.0222) Low < High (p = 0.0003) Moderate < Control (p = 0.0032)
Table III. NK cell activity for cocaine users and normal controls (E:T = 50:1). Values are expressed as median with range in parentheses.
92
CHAPTER 6: CONCLUDING DISCUSSION
The dramatic increase in cocaine use in the United
States over the last 10 years has prompted much interest
in its toxicity. There is no doubt that cocaine has a
variety of toxic effects in animals and in humans (80,81).
A dose-response relationship in humans has been difficult
to ascertain due to the problems involved in measuring the
extent of cocaine use (Chapter 4). We sought to establish
a method by which drug use might be accurately determined.
An animal model was used to develop a method to analyze
cocaine content in hair, and the procedure that was
developed to extract and measure cocaine from hair was
then applied to humans self-reporting drug use.
Few reports are available regarding the effect of
cocaine on the immune system or on the hepatotoxicity of
cocaine in humans. In humans it has been impossible to
confirm that any toxicity observed has not been due to
other factors associated with the lifestyle of the drug
user. In animals, these effects do not appear to be
mediated directly by cocaine, the immune changes observed
are possibly neuroendocrine-mediated and the
hepatotoxicity seen is most likely due to a metabolite of
cocaine (75,94). In either case, in vitro studies are
93
difficult to relate to in vivo situations. Also, the
animal models that have been used have shown a great deal
of variability in the effects of cocaine in different
strains and species (75,84). On the other hand, cocaine
has been listed as a Schedule II drug (i.e. high abuse
potential with limited medical application), and the only
accepted uses of cocaine are for topical administration
for mucous membrane anesthesia and vasoconstriction (81).
Studies on drug addicts have shown a variety of
toxicological effects (79,111), but it has not been
possible to define the cause of these effects (79,134).
Hair analysis may provide the information needed to
determine the level and quantity of drugs used (Chapter
1), and, thus, give a value by which correlations between
use and toxicity can by drawn.
The data given in these experiments do not, however,
validate the use of hair analysis to quantitate drug use.
The findings that retroviral infection and ethanol intake
both alter the recovery of cocaine in hair promote further
speculation as to the effects of the multiplicity of
variables found in the human population on drug recovery
from the hair of any one individual.
The fact that serum cocaine concentrations were also
altered by ethanol intake and by retroviral infection is
94
interesting, and lends credance to the results from the
hair analysis. This suggests that hair drug levels do
indeed represent exposure to that drug.
The question to be answered in the clinical situation
is the level of tissue exposure to cocaine. Hair may be a
very good way to assess that exposure. There are several
pathways for cocaine metabolism and the pattern by which
the bulk of the cocaine (parent compound) is transformed
may be influenced by strain and species variability which
could lead to the differences seen in cocaine toxicity
(92,133). In a comparison of cocaine metabolism in 2
human subjects it was found that the subject with the
higher serum cholinesterase activity showed less N-
demethylation activity (92). In this case hair cocaine
levels would presumably reflect systemic cocaine
concentrations rather than the amount of cocaine
administered, regardless of the route of metabolism.
In studies on human subjects the ranked level of
cocaine recovered from the hair of drug users correlated
with NK cell activity as well as with interleukin 2
receptor levels (Chen et al., submitted for publication),
but not with self-reported cocaine intake. The
differences to self-reported cocaine intake may be due to
many factors.
95
The use of hair analysis for drugs of abuse is not
currently allowed in criminal proceedings because
sufficient quality control and standardized procedures are
not available. The difference between the amount of
cocaine and morphine recovered in the hair of mice
retrovirally infected or fed ethanol and the amount
recovered in non-infected or sucrose-fed mice injected
with equivalent amounts of cocaine may indicate this
technique may be of limited use for the quantification of
cocaine or morphine used, but hair analysis may still be
valid in clinical applications.
96
REFERENCES:
1. Graham, K., Gideon, K., Klein, J., Schneiderman, J.f and Greenwald, M., Determination of Gestational Cocaine Exposure by Hair Analysis. JAMA, 1989, 262: 3328-3331.
2. Machalodimitrakis, M., Detection of Cocaine in Rats from Analysis of Hair. Med. Sci. Law, 1987, 27: 13-15.
3. Harkey, M.R., Henderson, G.L., Hair Analysis for Drugs of Abuse. In:Baselt, R.C., ed. Advances in Analytical Toxicology Vol. 2, Chicago: Year Book Medical Publishers, Inc., 1987, pp. 298-329.
4. Van Dyke, C. , Stesin, A., Jones, R., Chunthpri, A., Seamen, W., Cocaine Increases Natural Killer Cell Activity. J. Clin. Invest. 1986, 77:1387-1390.
5. Poet, T.S., Pillai, R., Woods, S., and Watson, R., Cocaine and Retroviral Infection Increase Natural Killer Cell Activity. Tox. Lett. In Press.
6. Flesch, P., in Physiology and Biochemistry of the Skin, S. Rothman, ed., University of Chicago Press, Chicago, 1954, pp. 601-661.
7. Airey, D., Total Mercury Concentration in Human Hair from 13 Countries in Relation to Fish Consumption and Location. Sci. Total Environ., 1983, 31:157-180.
8. Hansen, J.C., Wulf, H.C., Kromann, N., and Alboge, K., Human Exposure to Heavy Metals in East Greenland, I. Mercury. Sci. Total Environ., 1983, 26:233-243.
9. Kopito, L., Briley, A.M., and Shwachman, H., Chronic Plumbism in Children: Diagnosis by Hair Analysis. JAMA, 1969, 209: 243-248.
10. Berg, D., and Kollmer, W.E., in Trace Element Analytical Chemistry in Medicine and Biology Vol. 2, P. Bratter and P Schramel, eds., Walter de Gruyter and Co., Berlin, 1983. pp 571-583.
11. Scheiner, D.M., Katz, S.A. and Samitz, M.H., Nickel Levels in Hair and Nickel Ingestion in Guinea Pigs. Environ. Res., 1976, 12:355-357.
97
12. Valentine, J.L., Kang, H.K., and Spivey, G., Arsenic Levels in Human Blood, Urine, and Hair in Response to Exposure Via Drinking Water, Environ, Res., 1979, 20: 24-32.
13. Deeming, S.B., and Weber, C. W., Evaluation of Hair analysis for determination of Zinc Status Using Rats. Amer J. Clin. Nutr. 1977, 30:2047-2052.
14. Chittleborough, G. and Steel, B.J., Is Human Hair a Dosimeter for Endogenous Zinc and Other Trace Elements? Sci Total Environ., 1980, 15: 25-35.
15. McKenzie, J.M., Content of Zinc in Serum, urine Hair and Toenails of New Zealand Adults. Amer. J. Clin. Nutr., 1979, 32:, 570-579.
16. Machida, K., Matsubara, J., and Sugawara, K., Effect of Millimolar Level of Calcium Intake On Calcium, Phosphorus and Cadmium Content in Rats. Nutr. Rep. Internat., 1984, 29: 1145-1154.
17. Weigel, H.J., Jager, H.J., and Elmadfa, I., Cadmium Accumulation in Rat Organs After Extended Oral Administration with Low Concentrations of Cadmium Oxide. Arch. Environ. Contamin. Toxicol., 1984, 13: 279-287.
18. Vir, S.C., and Love, A.H.G., Zinc and Copper Nutriture of Females Taking Oral Contraceptive Agents. Amer. J. Clin. Nutr., 1981, 34: 1479-1483.
19. Gibson, R.S., The Interpretation of Human Hair Trace Element Concentrations. Sci. Total Environ. 1984, 39: 93-101.
20. Chatt, A., and Katz, S.A., Hair Analysis: Applications in the Biomedical and Environmental Sciences.VCH Publishers, Inc. New York, 1988.
21. Goldblum, R.W., Goldbaum, L.R., and Piper, W.N., Barbiturate Concentrations in the Skin and Hair of Guinea Pigs. J. Invest. Derm., 1954, 22: 121-128.
22. Harrison, W.H., Gray, R.M., and Solomon, L.M., Incorporation of 1-DOPA, 1-alpha-methyldopa and d,l-isoproterenol into Guinea Pig Hair. Acta Dermato-vener, 1974, 54:249-253.
23. Baumgartner, A.M., Jones, P.F., Baumgartner, W.A. et al. Radioimmunoassay of Hair for Determining Opiate-Abuse Histories. J. Nucl, Med. 1979,20: 748-752.
98
24. Baumgartner, W.A., Jones, P.F., Black, C.T. et al., Radioimmunoassay of Cocaine in Hair: Concise Communication. J. Nucl. Med., 1982, 23: 790-792.
25. Smith, R.P., Liu, R.H. Detection of Cocaine Metabolite in Perspiration Stain, Menstrual Blood Stain and Hair. J. For. Sci., 1980, 25: 79-87.
26. Heveran, JoE., Anthony, M., Ward, C. Determination of Phencyclidine by Radioimmunoassay. J. For. Sci., 1980, 25: 79-87.
27. Ishiyama, I., Nagai, T., and Toshida, S. Detection of Basic Drugs (Methamphetamine, Antidepressants, and Nicotine) From Human Hair. J. For. Sci. 1983, 28: 380-385.
28. Suzuki, 0., Hattori, H., Asano, M. Detection of Methamphetamine and Amphetamine in a Single Human Hair by Gas Chromatography/Chemical Ionization Mass Spectrometry. J. For. sci., 1984, 29: 611-617.
29. Uematsu, T., Sat, R., Suzuki, K., Yamaguchi, S., and Nakashima, M. , Human Scalp Hair as Evidence of Individual Dosage History of Haloperidol: Method and Retrospective study. Eur. J. Clin. Pharmacol. 1989, 37: 239-244.
30. Haley, N.J., and Hoffmann, D., Analysis for Nicotine and Cotinine in Hair to Determine Cigarette Smoker Status. Clin. Chem. 1985, 31: 1598-1600.
31. Balabanova, S., Arnold, P.J., Luckow, V., Brunner, H., and Wolf, H.U., Tetrahydrocannabinole im Haar von Haschischrauchern. Z. Rechtsmed. 1989, 102: 503-508.
32. Bogusz, M. , Anmerkungen zu: "Tetrahydrocannabinole im Haar von Haschischraucern" und zu der Antwort Dr. Balavanova auf die Bemerkungen Von H. Kaferstein and G Sticht. Z. Rechtsmed. 1990,
33. Goldsmith , L.W., ed. Biochemistry and Physiology of the Skin. NY. Oxford University Press, 1983.
34. Griffiths, W.A.D., and Reshad, H. Hair and Nail Growth: an Investigation of the Role of Left- and Right-Handedness. Clin. Exp. Dermatol. 1983, 8: 129-133.
35. Hopps, H.C., The Biologic Basis for Using Hair and Nail for Analysis of Trace Elements. Sci. Total Environ., 1977, 7: 71-89.
99
36. Baumgartner, W.A., and Hill, V.A. , Hair Analysis for Drugs of Abuse: Decontamination Issues. In: Proceeding of the 2nd International Congress of Therapeutic Drug Monitoring and Toxicology, Barcelona, Spain - In Press.
37. Fergusson, J.E., Hozbecher, J., and Ryan, D.E., The Sorption of Copper (II) , Manganese (II), Zinc (II) and Arsenic (III) Onto Human Hair. Sci. Total Environ., 1983, 26: 121-135.
38. Baumgartner, W.A., Hill, V.A., and Blahd, W.H., Hair Analysis for Drugs of Abuse. J. For. Sci., 1989, 34: 1433-1453.
39. Valente, D., Cassini, M., Pigliapochi, M., and Vansetti, G. Hair as a Sample in Assessing Morphine and Cocaine Addiction., Clin. Chem., 1981, 27: 1952-1953.
40. Offidani, C., Carnevale, A., and Chiarotti, M., Drugs in Hair: a New Extraction Procedure. For. Sci. Inter. 1989, 41: 35-39.
41. Hinners, T.A., Terill, W.J., Kent, J.L., and Colucci, A.V., Hair-Metal Binding. Environ. Health Prospec., 1974, 8: 191-199.
42. M'Baku, S.B., and Parr, R.M. Interlaboratory study of Trace and other Elements in the IAEA Powdered Human Hair reference Material, J. Redioanal. Chem. 1982, 69: 171-180.
43. Cranton, E.M., Bland, J.S., Chatt, A., Krakovitz, R., and Wright, J.V., J. Holist. Med., 1982, 4: 1-16.
44. Cone, E.J., Hair Testing for Drugs: Developments in an Infant Science. Employment Testing. 1989, 3: 439-446.
45. Fletcher, D.J., Hair Analysis Proven and Problematic Applications. Postgrad. Med. 1982, 72: 79-88.
46. Hambridge, K.M., Hair Analysis: Worthless for Vitamins, Limited for Minerals. Am. J. Clin. Nutr. 1982, 36: 943-949
47. Barrett, S., Commercial Hair Analysis: Science or Scam? JAMA. 1985, 1041-1045.
48. Baumgartner, W.A., Hair Analysis for Drugs of Abuse. Employment Testing. 1989, 3: 442-446.
49. Holden, C. Hairy Problems for New Drug-Testing Method. Science, 1990, 249: 1099-1100.
100
50. Federal Register June 1990, Vol 55.
51. Editorial. Pharmchem. News. 1990, Vol.18 No. 2.
52. Smith, H., Forshufvud, S., and Wassen, A., Distribution of arsenic in Napoleon's Hair. Nature, 1962, 194: 725-726.
53. Giovanoli-Jakubczak, T., and Berg, G,G., Measurement of Mercury in Human Hair. Arch. Environ. Health, 1974, 28: 139-144.
54. Chattopadhyay, A., Roberts, T.M., and Jervis, R.E., Scalp Hair as a Monitor of Community Exposure to Lead. Arch. Environ Health, 1977, 32:226-236.
55. Toribara, T,Y. and Jackson, D.A.,X-Ray Fluorescence Measurement of the Zinc Profile of a Single Human Hair. Clin. Chem. 1982, 28: 650-654.
56. Kopito, L. , Byers, R.K. and Shwachman, H., Lead In the Hair of Children with Chronic Lead Poisoning. New England J. Med., 1967, 276:949-953.
57. Hambidge, K.M., Franklin, M.L., and Jacobs, M.A., Changes in Hair Chromium Concentrations with Increasing distances From the Roots. Amer. J. Clin. Nutr., 1972, 25: 380-383.
58. Leslie, A.C.D., and Smith, H., Napoleon Bonaparte's Exposure to Arsenic During 1816. Arch. Toxicol., 1978, 41: 163-167.
59. Jekel, J.F., and Allen. Trends in Drug Abuse in the Mid-1980s. Yale J. Biol. Med., 1987, 60: 42-52.
60. Osterloh, J.D. and Becher, C.E., Chemical Dependency and Drug Testing in the Workplace. J. Med. 1990, 152: 506-513.
61. Martinez, F., Poet, T.S., and Watson, R.R., Hair Analysis. Science 1990, 250: 1070.
62. Van Dyke, C., Byck, R., Barash, P.G., and Jatlow, P., Urinary Excretion of Immunologically Reactive Metabolite(s) After Intranasal Administration of Cocaine, As Followed by Enzyme Immunoassay. Clin. Chem. 1977, 23: 241-244.
63. Burke, W.M., Ravi, N.V., Dhopesh, V., Vandegrift, B., and Maany, I., Prolonged Presence of Metabolite in Urine After Compulsive Cocaine Use. J. Clin. Psychiatry 1990, 51: 145-148.
101
64. Fuchs, D., Hausen, A., Reibnegger, G. , Schonitzer, D. , Unterweger, B., Blecha, H.G., Hengster, P., Rossler, H. , Schulz, T., Werner, E.R., Dietrich, M.P., Hinterhuber, H., Schauenstein, K., Traill, K., and Wachter, H., Immune Status of Drug Abusers. Cancer Det. Prev. Suppl., 1987, 1: 535-541.
65. Novick, D.M., Farci, P., Karayiannis, P., Gelb, A.M., Stenger, R.J., Kreek, M.J., and Thonmas, H.C., Hepatitis D Virus Antibody in HBsAg-Positive and HBsAg-Negative Substance Abusers with Chronic Liver Disease. J. Med. Virol. 1985, 15: 351-356.
66. Stryker, J., IV Drug Use and AIDS: Public Policy and Dirty Needles. J. Health. Policy Law., 1989, 14: 719-740.
67. Chattopadhyay, S.K., Makino, M., Hartley, J.W., and Morse, H.C., Pathogenesis of MAIDS, a Retrovirus-Induced Immunodeficiency Disease in Mice. In: Immune-Deficient Animals in Experimental Medicine, 6th Int. Workshop on Immune Deficient Animals, Beijing, 1988, pp.12-18.
68. Klinken, S.P., Frederickson, T.N., Hartley, J.W., Yetter, R.A., and Morse, H.C., Evolution of B cell Lineage Lymphomas in Mice with a Retrovirus-Induced Immunodeficiency Syndrom, MAIDS, J. Immunol. 1988, 140: 1123-1131.
69. Mosier, D.E., Animal Models for Retrovirus-Induced Immunodeficiency Disease. Immunol. Invest. 1986, 15: 233-261.
70. Watson, R.R., Prabhala, R.H., Darban, H.R., Yahya, M.D., and Smith, T.L., Changes of Lymphocyte Subsets and Macrophage Functions from High, Short-term Dietary Ethanol in C57/BL6 Mice. Life Sci. 1988 42: v-xi.
71. Balabanova, S., Brunner, H., and Nowak, R., Radioimmunological Determination of Cocaine in Human Hair. Z. Rechsmed 1987, 98: 229-234.
72. Gibaldi, M., and Levy, G., Pharmacokinetics in Clinical Practice, I. JAMA 1976, 235: 1864-1867.
73. Puschel, K., Thomasch, P., and Arnold, W., Opiate Levels in Hair. For. Sci. Inter. 1983, 21: 181-186.
74. Bozarth, M.A., and Wise, R.A., Toxicity Associated with Long-Term Intravenous Heroin and Cocaine Self-Administration in the Rat. JAMA 1985, 254: 81-83.
102
75. Watzl, B., and Watson, R.R., Immunomodulation by Cocaine-a Neuroendocrine Mediated Response. Life Sci. 1990, 46: 1319-1329.
76. Yahya, M.D., and Watson, R.R., Immunomodulation by Morphine and Marijuana. Life Sci. 1987, 41: 2503-2510.
77. Arnold, W., Radioimmunological Hair Analysis for Narcotics and Substitutes. J. Clin. Chem. Biochem. 1987, 25: 753-757.
78. Grant, B.F. and Harford, T.C. Concurrent and simultaneous use of alcohol with cocaine: results of national survey. Drug and Alcohol Dependence 1990, 25: 97-104.
79. Roth, D., Alarcon, F.J., Fernandez, J.A., Preston, R.A., and Bourgoignie, J.J. Acute rhabdomyolysis associated with cocaine intoxication. New Eng. J. Med. 1988, 319: 673-677.
80. Loper, K.A. Clinical Toxicology of Cocaine. Med. Tox. Adverse Drug Exposure 1989, 4: 174-185.
81. Ennenhorn, M.J., and Barceloux, D.G., In: Medical Toxicology: Diagnosis and Treatment of Human Poisonings. Elsevier Press, N.Y., 1988, pp. 644-661.
82. Kloss, M.W., Rosen, G.M., and Rauckman, E.J., Acute Cocaine-Induced Hepatotoxicity in DBA/2Ha Male Mice. Tox. Appl. Pharmacol. 1982, 65: 75-83.
83. Smolen, T.N. and Smolen, A. Developmental Expression of Cocaine Hepatotoxicity in the Mouse. Pharmac. Biochem. Behav. 1990, 36: 333-338.
84. Thompson, M.L., Shuster, L., and Casey, E. Sex and strain differences in response to cocaine. Biochem. Pharmacol. 1984, 33: 1299-1307.
85. Kanel, G.C., Cassidy, W., Shuster, L., and Reynolds, T.B. Cocaine-induced lever cell injury: comparison of morphological features in man and in experimental models. Hepatology 1989, 11: 646-651.
86. Perino, L.E., Warren, G.H., and Levine, J.S. Cocaine-induces hepatotoxicity in humans. Gastroenterology 1987, 93: 176-180.
87. Boyer, C.S. and Petersen, D.R. Potentiation of cocaine-mediated hepatotoxicity by acute and chronic ethanol. Alcoholism Clin. Exper. Res. 1990, 14: 28-31.
103
88. Smith, A.C., Freeman, R.W., and Harbison, R.D. Ethanol enhancement of cocaine-induced hepatotoxicity. Biochem. Pharmacol. 1981, 30: 453-458.
89. Lieber, C.S., Metabolic Effects of Ethanol and Its Interaction with Other Drugs, Hepatotoxic Agents, Vitamins, and Carcinogens: A 1988 Update. Seminars on Liver Disease 1988, 8:47-68.
90. Sherlock, S. Alcoholic Hepatitis. Alcohol and Alcoholism. 1990, 25: 189-196.
91. Hawks, R.L., Kopin, I.J., Colburn, R.W., and Thoa, N.B., Norcocaine: a Pharmacologically Active Metabolite of Cocaine Found in Bran. Life Sci. 1974, 15: 2189-2195.
92. Inaba, T., Stewart, D.J. and Kalow, W. Metabolism of cocaine in Man. Clin. Parmacol. Ther. 1978, 23: 547-552.
93. Kloss, M.W., Rosen, G.M., and Rauckman, E.J. Cocaine-mediated hepatotoxicity: a critical review. Biochem. Pharmacol. 1984, 33: 169-173.
94. Shuster, L., Garhart, C.A., Powers, J., Grunfeld, Y., and Kanel, G. Hepatotoxicity of cocaine In: Mechanisms of Cocaine Abuse and Toxicity, Clouet, D., Asghar, K., and Brown, R. eds. 1988, pp. 250-275. National Institute on Drug Abuse, rockville, MD.
95. Rubin, E. , and Lieber, C.S. Hepatic Microsomal enzymes in man and rat: induction and inhibition by ethanol. Science 1962, 162: 690-691.
96. Lieber C.S.Interaction of Ethanol with Drugs, Hepatotoxic Agents, Carcinogens and Vitamins. Alcohol and Alcoholism, 1990, 25: 157-176,
97. Taylor, G.G., Turrill, H.G., and Carter, G. Blood Alcohol Analysis: A Comparison of the Gas Chromatographic Assays with an Enzyme Assay. Pathology 1984, 16: 157-159.
98. Cone, E.J., and Mitchell, J., Validity Testing of Commercial Urine Cocaine Metabolite Assays: II. Sensitivity, Specificity, Accuracy, and Confirmation by Gas Chromatography/Mass Spectrometry, J. For. Sci. 1989, 34: 32-45.
104
99. Gottfried, M.R., Kloss, M.W., Graham, D., Rauckman, E.J., and Rosen, G.M., Ultrastructure of Experimental Cocaine Hepatotoxicity, Hepatology. 1986, 6: 299-304.
100. Wiener, H.L. and Reith, M.E.A., Differential Effects of Daily Administration of Cocaine on Hepatic and Cerebral Glutathione in Mice. Biochem. Pharmacol. 1990, 40: 1763-1768.
101. Leibman, D., Smolen, A., and Smolen, T.N., Strain, Sex and Developmental Profiles of Cocaine Metabolizing Enzymes in Mice, Pharmacol. Biochem. Behav., 37, 161-165.
102. Boelsterli, U.A., Goldlin, C and Bouis, P., Irreversible Binding of Cocaine to Hepatic Microsomes from Ethanol- or Phenobarbital-Induced Rats: Role of P-450IIE1. AASLD Abstracts of Papers, 12, 931.
103. Thompson, M.L., Shuster, L., and Shaw, K., Cocaine-Induced Hepatic Necrosis in Mice. Biochem. Pharmacol. 1979, 28: 2389-2395.
104. Voss, H.L. Patterns of Drug Use: Data From the 1985 National Household Survey. In: Gust, S.W., Walsh, J.M., eds. Drugs in the Workplace. NIDA Research Monogroaph Series, Vol 91. U.S. Dept. of Health and Human Survices, U.S. Government Printing Office, Wash. D.C. pp. 33-46.
105. Cridland, J.S., Rottanburg, D., and Robins, A.H. Apparent Half-Life of Excretion of Cannabinoids in Man. Human. Toxicol., 1983, 2: 641-644.
106. Jatlow, P.I. Drug Abuse Profile; Cocaine. Clin. Chem., 1987, 33: Suppl. 66B-71B.
107. Dackis, C.A., Pottash, A.L.C., Annitto, W. et al. Persistence of Urinary Marijuana Levels After Supervised Abstinence. Am. J., Psychiatry, 1982, 139: 1196-1198.
108. Ellis, G.M., Mann, M.A., Judson, B.A. et al. Excretion Patterns of Cannabinoid Metabolites After Last Use in a Group of Chronic Users. Clin. Pharmacol. Ther., 1985, 38: 572-578.
109. Cone, E.J., Menchen, S.L., Paul, B.D. Validity Testing of Commercial Urine Cocaine Metabolite Assays: I. Assay Detection Time, Individual Excretion Patterns, and Kinetics After Cocaine Administration to Humans. J. For. Sci., 1989, 34: 15-31.

105
110. Byck R. and Van Dyke, C. What Are the Effects of Cocaine in Man? In: Cocaine, 1977, NIDA Res. Monograph Series 13, 97-117.
111. Cregler, L.L., and Mark, H. , Medical Complications of Cocaine., N. Engl. J. Med. 1986, 315: 1495-1500.
112. Klein, T.W., Newton, C.A., Friedman, H. Suppression of Human and Mouse Lymphocyte Proliferation by Cocaine. Adv. Biochem. Psychopharmacol. 1988, 44: 139-143.
113. Watson, E.S., Murphy, J.C., Elsohly, H.M., Elsohly, M.A., and Turner, C.E., Effects of the Administration of coca Alkaloids on the Primary Immune Responses in Mice: Interaction with Delta 9 tetrahydrocannabinol and Ethanol. Toxicol. Appl. Pharmacol. 1983, 71: 1-13.
114. Pillai, R. and Watson, R.R., AIDS: Disease Progression and Immunomodulation by Drugs of Abuse and Alcohol. AIDS Med. Reports 1991, 4: 25-36.
115. Hebermann, R.B. and Ortaldo, J.R., Natural Killer Cells: Their Role in Defense Against Disease. Science. 1981, 214: 24-25.
116. Sirianni, M.C., Tagliaferri, F. and Aiuti, F., Pathogenesis of Natural Killer Cell Deficiency in AIDS. Immunol. Today 1990, 11: 81-82.
117. Trinchieri, G. Biology of Natural Killer Cells. Adv. Immunol. 1989, 47: 187-308.
118. Abruzzo, L.V., and Rowley, D.A., Homeostasis of the Antibody Response: Immunoregulation by NK Cells. Science, 1983, 222: 581-585.
119. Duwe, A.K., Sainghal, S.K., The Immunoregulatory Role of Bone Marrow. II. Characterization of a Suppressor Cell Inhibiting the In Vitro Antibody Response. Cell Immunol. 1985, 43: 372-381.
120. Hebermann, R.B. Immunoregulation by Natural Killer Cells. Mol. Immunol. 1981, 19: 1313-1321.
121. Pillai, R., Balaram, P., Abraham, T., Padmanabhan, T.K., and Nair, M.K., Natural Cytotoxicity and serum Blocking in Malignant Cervical Neoplasia. Am. J. Repro. Immunol. Microbiol. 1988, 16: 159-162.
106
122. Whiteside, T.L., Byrant, J., Day, R., Hebermann, R.B., Natural Killer Cytotoxicity in the Diagnosis of Immune Dysfunction: Criteria for a Reproducible Assay. J. Clin. Lab. Invest. 1990. 4: 102-114.
123. Reith, M.E.A., Sershen, A., and Lajtha, A. Saturable 3H Cocaine Binding in the Central Nervous System of Mouse. Life Sci. 1980, 27: 1055-1062.
124. Gold, M.S., Washton, A.M., and Dackis, C.A., Cocaine Abuse: Neurochemistry, Phenomenology and Treatment. Natl. Inst. Drug Abuse Research Monograph Series 61, 130-150.
125. Mendelson, J.H., Hello, N.K., Teoh, S.K., Ellingboe, J. and Cochin, J.A., cocaine Effects on Pulsatile Secretion of Anterior Pituitary, Gonadal and adrenal Hormones. J. Endocrinol. Metab. 1989, 69: 1256-1260.
126. Moldow, R.L., Fischmann, A.J., Cocaine Induced Secretion of ACTH, Beta Endorphin and Corticosterone. Peptides. 1987, 8: 819-822.
127. Froelich, C.J. and Backhurst, A.D., the Effect of Beta Endorphin on Natural and Antibody Dependent Cellular Cytotoxicity. Life Sci. 1984, 35: 261-265.
128. Kay, N., Allen, J., and Morley, J.E., Endorphins Stimulate Normal Blood Lymphocyte Natural Killer Cell Activity. Life Sci. 1984, 35: 53-59.
129. Kraus, L., Lock, S., Kutz, I., Edbril, S., Philips, K., Benson, H. Altered Natural Killer Cell Activity During Norepinephrine Infusion in Humans. Annu Meeting Am. Psychomatic. Soc., New York, 1983, 12: 6-9.
130. Levy, S.M., Fernstrom, J., Hebermann, R.B., Whiteside, T. M., and Lee, J., Persistently Low Natural Killer Cell Activity and Circulating Levels of Plasma Beta Endorphin: Risk Factors for Infectious Disease. Life Sci. 1991, 48: 107-116.
131. Watson, R.R. Modification of Humoral and Cellular Host Defense Systems By Malnutrition in Humans. Arizona Med. 1984, 41: 281-288.
132. Mohs, M., Watson, R.R., and Green, T. Nutritional Effects of Marijuana, Heroin, Cocaine and Nicotine. J. Am. Dietetic. Assoc. 1990, 90: 1261-1267.
107
133. Comities, T., Clofenet, G., Jourdan, M., Bataille, R., and Klein, B. Human Natural Killer Cells Suppress the Proliferation of B Cells. Immunol. Lett. 1990, 24: 57-62.
134. Connors, s., Rankin, D.R., Gandolfi, A.J., Krumdieck, C.L., Koep, L.J., and Brendel, K. Cocaine Hepatotoxicity in Cultured Liver Slices: a Species Comparison. Toxicology. 1990, 61: 171-183.