information asymmetry, liquidity, and stock...
TRANSCRIPT
Information Asymmetry, Liquidity, and Stock Returns
Sanders S. Chang and F. Albert Wang*
University of Dayton
September 13, 2017
Abstract
We develop a computationally straightforward and easily implemented proxy measure for the probability of informed trading that is consistent with salient features of information asymmetry. This measure, called PCM, remains significant after controlling for liquidity and trading effects in the bid-ask spread, suggesting that it is acting as a proxy for the adverse selection component of the spread. Further consistent with informed trading effects, it becomes elevated around earnings announcements and exhibits similar patterns to Kyle's lambda and price impact in time series. In asset-pricing tests, the effect of our informed-trading proxy on returns remains significantly positive in the face of other standard firm-stock characteristics, especially illiquidity. A long-short portfolio strategy based on PCM generates a Fama-French three-factor alpha of 8.4 percent per year. Overall, it appears that PCM strikes a balance between being very straightforward to implement, on the one hand, and still being able to function as an adequate proxy, on the other, with consistent evidence that it captures important features of informed trading and helps to explain the cross section of expected returns.
JEL Classification: G10, G14, G19 Keywords: Information asymmetry; Contrarian trading; Stock returns; Informed trading; Asset pricing; Market microstructure; PCM _____________________________________ *Corresponding author: University of Dayton, 300 College Park, Dayton, OH, 45469. Email: [email protected] (S.S. Chang); [email protected] (F.A. Wang). Tel: 937-229-3095. Fax: 937-229-2477. We thank Pete Kyle and seminar participants at the SEC and the University of Cincinnati for valuable discussions and comments. Jung-Yu Liu and Peixian Han provided excellent research assistance.
1
1. Introduction
The asset pricing literature focuses primarily on risk factors that affect an asset's returns in the
long run while abstracting from the trading mechanism of the market in which the asset is transacted. In
contrast, the market microstructure literature focuses on how the trading processes itself affects the
formation of transaction prices, while largely being silent on its asset pricing implications. Such a
dichotomy is convenient for analysis but leaves open an important question: to what extent do
microstructure features affect expected stock returns?
To be sure, there are at least two prominent hypotheses that have been put forward explaining the
linkage between market microstructure and stock returns. Amihud and Mendelson (1986) propose the
"liquidity" hypothesis that investors maximize expected returns net of transaction costs, and hence
liquidity, which embodies such costs, should be priced. They present supporting evidence by showing that
stock returns significantly increase in bid-ask spreads. In addition, Amihud (2002) constructs an
illiquidity measure and shows that stock returns significantly increase in this measure. Easley and O'Hara
(2004) propose the "information asymmetry" hypothesis that uninformed traders lose to informed traders
and hence require compensation to hold stocks with greater information asymmetry. As a result, such
information risk should be priced. Easley et al. (2002) develop the PIN measure of the probability of
informed trading as a proxy for information asymmetry and find that stock returns significantly increase
in PIN. It is worth noting that these two hypotheses are not competing, but are rather intimately related to
each other in the literature.
Recently, the information asymmetry hypothesis has come under serious re-examination. In a
well-known and widely cited study, Duarte and Young (2009) extend the structural model of Easley et al.
(1996) and decompose PIN into an information asymmetry component and an illiquidity component that
arises due to a symmetric order flow shock. They find that stock returns are significantly and positively
related to the illiquidity component in PIN, but not to its information asymmetry component. Moreover,
the effect of PIN disappears once illiquidity is included in asset pricing tests. As such, they conclude that
the PIN measure is priced, not because it captures informed trading per se, but because it serves as proxy
for the illiquidity effect that is unrelated to information. Similarly, using a sample of international stocks
across 47 countries, Lai et al. (2014) find that their PIN estimates are not priced in international markets.
Nevertheless, in spite of such findings, the question of whether and how information asymmetry
affects expected stock returns still seems to be an open one. Most importantly, while PIN has had limited
success in measuring informed trading, as Duarte and Young still, and very notably, remark (p. 136): "It
is possible...that private information could indeed be related to expected returns." The goal of this paper is
to address this question by developing and testing an alternative proxy for the probability of informed
trading.
2
It should be noted, however, that tests of the liquidity hypothesis are not without their own
complications either. Liquidity, like information asymmetry, is a slippery concept, mainly because it is
not observed directly. One, therefore, must rely on noisy proxies such as the bid-ask spread or the
Amihud (2002) illiquidity measure. If the noise in such measures were orthogonal to the signal, then we
would have a reliable proxy. However, market microstructure theory posits that information asymmetry
and liquidity are intimately related, making it difficult to disentangle these two signals from each other,
even though they arise from two distinct economic forces (Biais et al., 2005). On the one hand, when
information asymmetry increases, the adverse selection problem is heightened and this can lead to a fall
in liquidity. On the other hand, there are also liquidity concerns unrelated to information such as order-
handling costs, inventory-holding costs, or market power. In other words, one part of liquidity is
information driven, while the other part is unrelated to information.
However, and very importantly, there is now strong evidence that the effect of characteristic
illiquidity measures such as Amihud's have declined dramatically over the years, especially in the last
decade (Ben-Rephael et al., 2015). This is presumably due to the enhanced liquidity provided by
algorithmic, high-frequency traders, and suggests that concerns over the confounding effects of illiquidity
on information are largely mitigated in more recent data. In fact, we exploit this feature to show that our
alternative informed-trading proxy has significant explanatory power that is thus necessarily free of any
illiquidity effects.
In addition, extant measures of informed trading can oftentimes be quite difficult to compute. It
is well known, for example that PIN, being based on a highly structured Poisson arrival model, requires
the aggregation of large amounts of intraday or daily data into much longer (typically, quarterly) horizons
while also necessitating the use of numerical optimization procedures with unstable convergence
properties. Such drawbacks are especially inconvenient when dealing with very large transaction-level
trade and quote data. The loss of granularity and increased computational tax are weighty tradeoffs even
if a highly accurate informed-trading measure could be conceived. Given this apparent tradeoff, a more
useful approach for the purposes of applied work might be to construct a proxy that is easier to
implement, while being motivated by, and therefore still largely consistent with, the salient features of
informed trading. Of course, such would not necessarily be a perfectly accurate or pure measure of
informed trading, but would thus only serve as a proxy in the strict sense of the word.
In light of the discussion above, the aim of this paper is thus twofold: first, to develop a
computationally straightforward proxy for the probability of informed trading that is motivated by
relevant theories and, after establishing the plausibility of this information proxy, to employ it to test the
information asymmetry hypothesis. To achieve the first aim, we rely directly on the behavior of informed
traders. In particular, the literature suggests that informed traders are more likely to engage in contrarian
3
rather than herding trades (Campbell et al., 1993; Avramov et al., 2006; Back et al., 2016), and that they
tend to submit medium-size trades (Barclay and Warner, 1993; Chakravarty, 2001). We thereby develop
our measure for the probability of informed trading based on contrarian trades with medium size in two
steps. In the first step, as in Avramov et al. (2006), Chang et al. (2014), and Chang and Wang (2015), we
adopt the notion that buy (sell) trades made amid declining (rising) prices are contrarian in nature, while
buy (sell) trades initiated during rising (declining) prices suggest uninformed herding. In this spirit, we
define contrarian trades at the intraday, transaction-level frequency as buy trades in the presence of
negative unexpected returns and sell trades in the presence of positive unexpected returns. The daily
probability of contrarian trading (PC) is then calculated as the proportion of the number of contrarian
trades over the total number of trades during a day.
As noted above, such an approach to constructing an informed (contrarian) trading measure has
been employed in various previous settings. Avramov et al. (2006) show that, consistent with rational
expectation models, non-informational liquidity-driven (herding) trades increase volatility following stock
price declines, and informed (contrarian) trades reduce volatility following stock price increases. Chang
et al. (2014) extend the Avramov et al. approach to construct a dynamic intraday measure of the
probability of informed trading (DPIN) and find evidence consistent with Roll's (1988) conjecture that
firm-specific return variation (idiosyncratic volatility) can be explained by informed trading. Chang and
Wang (2015) find evidence that a contrarian based measure of informed trading appears to capture the
information-asymmetry component of the bid ask spread, versus the illiquidity component or other factors
due to volume or trading effects.
Two more recent papers also adopt the informed-contrarian approach and find supporting
evidence. Using a unique dataset where trader identity is observed, Weng et al. (2016) examine
international futures markets and find that the DPIN of Chang et al. of certain institutional investors that
are known to be more informed outperforms alternative PIN-based measures, specifically trade imbalance
(TIB) and volume-synchronous PIN (VPIN) (see below), and provides more stable effects in measuring
informed trading. Elaut et al. (2016) use DPIN as the informed trading measure to disentangle whether
intraday momentum in Russian FX markets is due to informed trading or liquidity provision. Notably,
with both papers examining high-frequency phenomena, they cite both the relative computational ease
and lack of frequency degradation of the informed-contrarian proxy in their choice of model, providing
further evidence that such a proxy captures salient features of informed trading.1
1 This PC measure also captures the salient features of information asymmetry recently modeled in Back et al. (2016), which is a hybrid of PIN and Kyle's (1985) model that allows for a probabilistic information event and an optimizing (possibly) informed trader. Their hybrid model implies that both price changes and order flows are needed to identify information asymmetry. Moreover, the optimizing informed trader in Back et al., as in Kyle's model, is by definition a contrarian trader who buys when liquidity traders sell (as the price gets driven below the informed trader's expected price based on his or her private information) and sells when liquidity traders buy (which pushes the price above the informed trader's expected price). In the same spirit, as a
4
Next, we further refine PC to obtain a finer measure of informed trading to account for the
concern that some contrarian trades included in PC may come from uninformed traders who by chance
happen to trade in a contrarian direction but who actually do not have private information. To do so, we
rely on trade size to further differentiate those contrarian trades that are more likely to be submitted by
informed traders from those by uninformed traders. The microstructure literature on stealth trading
suggests that large informed traders prefer to split orders and submit medium size trades to mitigate the
price impact of their trades (Barclay and Warner, 1993; Chakravarty, 2001). We thereby further condition
PC on medium-size trades, which we define as trades consisting of 1,000-9,999 shares, resulting in the
PCM measure.2
It is worth noting that PCM, as a relatively model-free measure, is fundamentally different from
the structural-model and statistical-based PIN of Easley et al. (1996, 2002). In essence, PCM is
conceived as the ex post probability of observing medium-sized contrarian trades over a specified period,
as such trades appear to conform closely to the characteristics of informed trading discussed in the
literature. Thus, a potential advantage of PCM is that since it is a standalone index based on the
proportion of certain types of trades occurring during a trading day, it can be computed directly from the
data at daily frequency without the need for aggregating data over longer horizons (i.e., "degradation to
lower frequencies", as in Elaut et al. (2016)) or estimation techniques that require numerical optimization,
which is an especially convenient feature when dealing with very large transaction-level databases of
trades and quotes. Furthermore, PCM is a general measure of informed trading that does not depend on a
specific group of market participants or a particular type of private information. That is, PCM may
capture informed trading from investors, asset managers, limit order traders, or even market makers with
superior information (e.g., Calcagno and Lovo, 2006) and may include private information about payoffs,
endowments, orders, or market participants (e.g., Vayanos, 1999). We calculate PCM at the daily
frequency from January 1993 to December 2012 for stocks traded on the NYSE and AMEX markets. To
be consistent with the asset pricing literature, we then derive a monthly PCM measure to be used for our
empirical analysis.
In order to first establish that PCM is possibly a reliable proxy for informed trading (before using
it in asset pricing tests of returns and the information asymmetry hypothesis), we subject it to a series of
tests consistent with the past literature. First, market microstructure theory posits that stock bid-ask
baseline for identifying information asymmetry, the PC proxy for the probability of contrarian trading by construction captures both notions of price changes and order flows. 2 While Chakravarty (2001) uses 500 shares as the lower bound for medium size, Kyle and Obizhaeva (2016) posit in their market microstructure invariance hypotheses that the average bet size of long-term traders, and hence trade size (all else equal), must grow with overall trading activity in the market, which of course has increased dramatically over recent years. Thus, in light of this dramatic growth, we thus raise the lower bound of medium-sized trades to 1,000 shares per trade to better capture this phenomenon.
5
spreads are influenced by adverse selection due to informed trading and by other factors unrelated to
information (Biais, et al., 2005). Thus, we gauge the effectiveness of PCM as a measure for informed
trading by examining whether it is positively related to the bid-ask spread after controlling for these other
factors. We find that the effect of PCM on spreads is significant and positive at the 1% level. In light of
the critique of Duarte and Young (2009), we include illiquidity, as well as firm size and other control
variables related to volume and trading factors (namely turnover, returns, and their variability) so that we
are able to more confidently attribute the marginal effect of PCM to the adverse selection component of
the bid-ask spread, rather than liquidity or other firm-specific or volume and trading factors unrelated to
information. In a similar vein, Chang and Wang (2015) also find that spreads are significantly and
positively related to their PC-based proxies after controlling for an array of firm, trading, and illiquidity
effects. Taken together, there is evidence that PCM is capturing the variation in the adverse selection
component of the bid-ask spread and thus might potentially serve as an effective proxy for informed
trading.
Second, there is also a large body of literature using earnings announcements as a proxy for
information events. Kim and Verrecchia (1994, 1997) posit that earnings announcements can stimulate
sophisticated traders to process public disclosure into private information, thus resulting in higher
information asymmetry around earnings announcements. In light of this, we study an event window
around earnings announcement days to examine whether PCM is able to register such information-rich
events. We find that PCM begins to rise slightly one day before the earnings announcement day, then
spikes dramatically upward on announcement days, and then declines sharply while remaining elevated
for roughly three days following an announcement before subsiding to normal levels. This pattern
suggests that PCM is able to detect the presence of informed trading. In fact, this pattern is very similar
to those in Back et al. (2015), who find the same behavior around earnings announcements for Kyle's
(1985) lambda (a measure of market or price impact that may also be influenced by informed trading). In
addition, since PCM is consistent in theory with the hybrid model of Back et al. (2016), one should expect
to observe similarities in the overall time-series patterns between it and both Kyle's lambda and price
impact (with the latter from Holden and Jacobsen (2014)). Indeed, PCM, Kyle's lambda, and price impact
are all rising over the 1990s, then dropping sharply following the turn of the century, with a brief upward
movement during the recent financial crisis of 2008, with the variability of these measures declining
through the period. The evidence from both the event-window analysis around earning announcements
and the overall time-series patterns provide further support that PCM may serve as a reliable proxy for
information asymmetry. In contrast, Back et al. (2015) find that PIN actually falls in a small window
around earnings-announcement days, contrary to what one would expect of a measure of informed
trading.
6
After establishing a tenable link between PCM and informed trading, we then turn our attention to
using the proxy to examine the relationship between informed trading and expected stock returns. First,
we sort stocks into monthly decile portfolios based on PCM and conduct a "10-1" long-short (self-funded)
portfolio strategy to evaluate excess returns and portfolio alpha. We find that the long-short portfolio
generates large excess returns and has a large positive and significant Fama-French three factor alpha of
0.702% (corresponding to an 8.4% abnormal return per year), which suggests that the effect of PCM on
stock returns is economically significant. We then compute the excess returns on 25 double-sorted
portfolios sorted monthly on PCM and illiquidity quintiles. Excess returns generally increase as we move
from low to high PCM portfolios within a given illiquidity category, thus suggesting that that PCM, and
the portion of informed trading that it is potentially proxying for, is orthogonal to illiquidity effects.
We then conduct more formal tests of the information asymmetry hypothesis by estimating a
series of monthly, firm-level Fama-MacBeth (1973) regressions of stock returns on PCM and other
standard variables in the literature that are known to also influence the cross-section of stock returns.
From these asset pricing tests, we find that PCM is positive and significant at the 1% level in explaining
the cross-section of stock returns after controlling for illiquidity and the three Fama-French firm
characteristics beta, size, and book-to market ratio, as well as PIN. We are able to overcome the critique
of Duarte and Young (2009) and show that PCM is robust even after controlling for other measures of
informed trading.
Recognizing recent technological innovations and regulatory changes that have affected the
trading process since the advent of decimalization in January 2001, we also conduct our analysis using
two subsamples to reflect periods prior to and after this important change, namely a subperiod from 1994-
2000, and from 2001-2011. We find that the effect of PCM as a proxy for information asymmetry actually
strengthens after the decimalization in 2001, suggesting that the recent technological innovations and
regulatory changes do not necessarily imply a diminishing information risk premium. In fact, our results
points to the opposite, i.e., that information risk appears to remain substantial and significant.
Finally, for robustness, we then examine alternative explanations to information asymmetry by
adding additional explanatory variables, including return standard deviation, turnover, coefficient of
variation of turnover, and momentum. The estimation results show that the coefficient on PCM remains
significant and positive after controlling for these additional variables. Taken together, our findings
indicate that informed trading, at least as proxied for by PCM, helps to explain the cross-section of stock
7
returns in a manner consistent with the information asymmetry hypothesis (Easley and O'Hara, 2004) that
information risk is priced and that informed trading is an important determinant of expected stock returns.
The paper proceeds as follows. Section 2 describes the data used in this study. Section 3 develops
the PCM proxy for the probability of informed trading. Section 4 evaluates the properties of PCM and
other variables of interest used in this study. Section 5 investigates and attempts to establish a link
between PCM and informed trading. Section 6 examines the relationship between informed trading, as
proxied for by PCM, and the cross-section of stock returns. Section 7 concludes.
2. Data
The intraday transaction data come from the Trades and Quotes (TAQ), database and information
on other share characteristics (e.g., share code, exchange code, shares outstanding, etc.) are from the
Center for Research in Security Prices (CRSP) database. The data span the period January 1993 to
December 2012. We include NYSE and AMEX-listed domestic issues, excluding foreign companies,
exchange traded funds, closed-end funds, and REITs (real estate investment trusts). Transactions
occurring outside the normal opening and closing times of the exchange are omitted, along with
transactions that have special conditions, corrections, or other indicators. To avoid complications
associated with thinly traded, illiquid stocks, only shares for which there are at least 250 trades per month
are included in the analysis.
As is standard in the empirical microstructure literature, we use the Lee and Ready (1991)
algorithm to match trades and quotes and to determine whether a particular trade is buyer- or seller-
initiated. For each firm in the sample, the total number of trades on a particular day is the sum of all buy
and sell trades (as well as unsigned trades) occurring on that day. As described further below, our proxies
for the probability of informed trading are then calculated using the number of certain types of buy and
sell trades in proportion to the total number of trades on a given day.
For the adverse selection and asset pricing tests, additional data on firm and stock characteristics
are required and obtained from the CRSP and COMPUSTAT databases. As is standard in the literature,
the analysis is conducted using monthly cross-sections, so we aggregate our daily measure of the
probability of informed trading to derive a monthly proxy, resulting in 244,900 firm-month observations
(2,783 firm observations) upon merging the datasets. Considering only the subset of NYSE- and AMEX-
listed firms for which all CRSP/COMPUSTAT data are available and our monthly proxies for the
probability informed trading are calculable from the TAQ database results in cross-sectional samples
ranging in size from 1,160 to 1,503 stocks across all months. This is comparable to Easley et al. (2002)
and Duarte and Young (2009). With a sample period from 1993-2012, there are 238 months with which to
conduct the analysis.
8
3. Constructing the PCM proxy for the probability of informed trading
To the extent that the identity of informed traders is not available to econometricians, we rely on
the literature on the behavior of informed traders to motivate the development of our proxies for the
probability of informed trading. In particular, we focus on two aspects of informed trading behavior to
distinguish it from uninformed trading: (1) contrarian versus herding trades and (2) trade size choice. The
literature suggests that informed traders are more likely to engage in contrarian trades than herding, and
they tend to submit medium-size trades. In what follows, we detail the process of the development of our
proxies for the probability of informed trading as guided by the relevant literature.
3.1. Information and trading behavior: Contrarian versus herding trades
Campbell et al. (1993) emphasize that changes in a stock's price are caused by information that
affects the valuation of the firm, or are due to the actions of liquidity or "non-informational" traders, who
desire to buy or sell stock for exogenous reasons. In the former case, prices reflect new information and
thus price reversals are less likely to be observed, if any. In the latter case, temporary demand and supply
pressures are expected to be short-lived, and thus price reversals are more likely to be observed.
Therefore, uninformed trading should be associated with negative serial correlation in individual stock
returns, while no such dependence should be associated with informed trading.
Based on this intuition, Avramov et al. (2006) devise an empirical framework to delineate
whether a particular trading day is dominated by broadly "contrarian" versus "herding" behavior on the
part of investors. In particular, they define daily sell orders in the face of unexpected positive returns as
contrarian trades, while sell orders in the face of unexpected negative returns are defined as herding
trades. Consistent with the model of Campbell et al. (1993), Avramov et al. show that unexpected returns
associated with herding trades exhibit significant negative serial correlation, while the autocorrelation for
contrarian trades is insignificant. Thus, it appears that contrarian (herding) trades are broadly akin to
informed (uninformed) trades. While Avramov et al. use these criteria of informed trading only for daily
sell orders to study its effect on volatility, Chang et al. (2014) apply this concept of contrarian trades
further to both buy and sell orders at 15-minute intervals throughout the trading day and thereby calculate
the probability of contrarian trades at each interval to construct a dynamic intraday probability of
informed trading (DPIN). They find that DPIN is useful in explaining the relationship between
idiosyncratic return variations and informed trading as conjectured by Roll (1988). Chang and Wang
(2015) adopt a similar concept to construct a proxy for informed trading at the daily frequency based on
the probability of contrarian trading and find evidence that this proxy appears to successfully capture the
adverse selection component of bid-ask spreads and illiquidity due to information asymmetry.
9
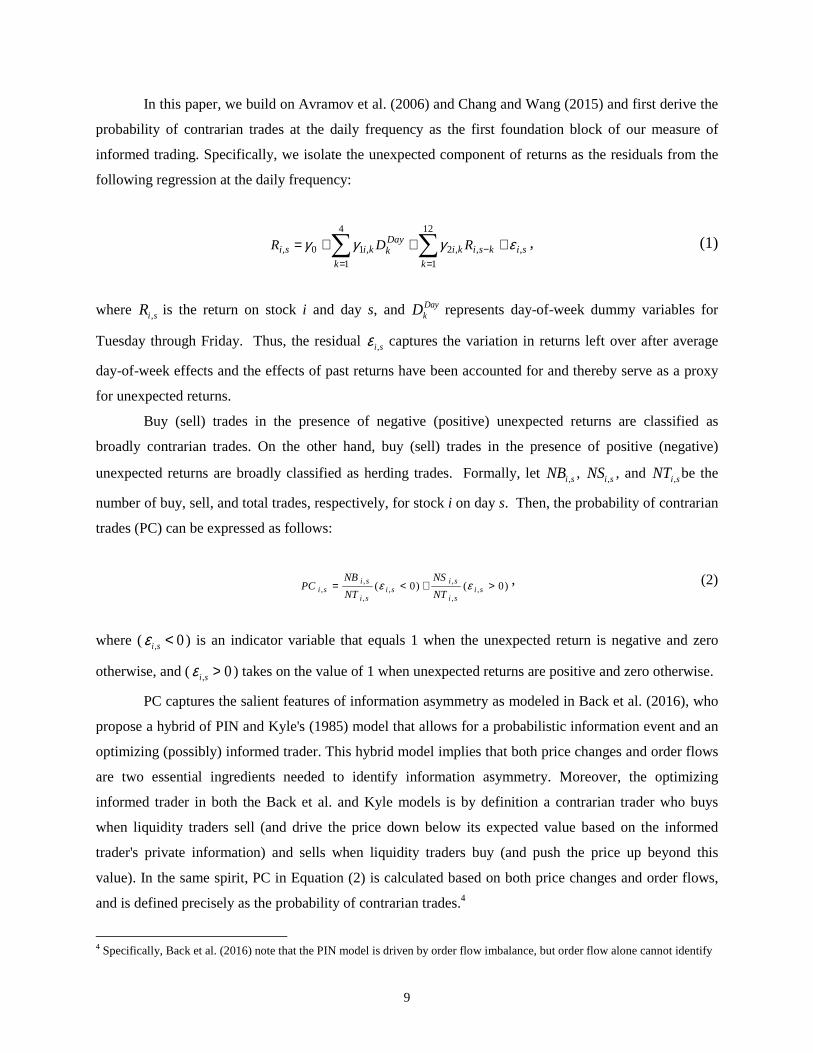
In this paper, we build on Avramov et al. (2006) and Chang and Wang (2015) and first derive the
probability of contrarian trades at the daily frequency as the first foundation block of our measure of
informed trading. Specifically, we isolate the unexpected component of returns as the residuals from the
following regression at the daily frequency:
si
k
ksiki
k
Daykkisi RDR ,
12
1
,,2
4
1
,10, εγγγ +++= ∑∑=
−=
, (1)
where Ri ,s is the return on stock i and day s, and DkDay represents day-of-week dummy variables for
Tuesday through Friday. Thus, the residual ε i ,s captures the variation in returns left over after average
day-of-week effects and the effects of past returns have been accounted for and thereby serve as a proxy
for unexpected returns.
Buy (sell) trades in the presence of negative (positive) unexpected returns are classified as
broadly contrarian trades. On the other hand, buy (sell) trades in the presence of positive (negative)
unexpected returns are broadly classified as herding trades. Formally, let NBi ,s, NSi ,s , and NTi ,sbe the
number of buy, sell, and total trades, respectively, for stock i on day s. Then, the probability of contrarian
trades (PC) can be expressed as follows:
)0()0( ,,
,,
,
,, >+<= si
si
sisi
si
sisi NT
NS
NT
NBPC εε , (2)
where (ε i ,s < 0) is an indicator variable that equals 1 when the unexpected return is negative and zero
otherwise, and (ε i ,s > 0) takes on the value of 1 when unexpected returns are positive and zero otherwise.
PC captures the salient features of information asymmetry as modeled in Back et al. (2016), who
propose a hybrid of PIN and Kyle's (1985) model that allows for a probabilistic information event and an
optimizing (possibly) informed trader. This hybrid model implies that both price changes and order flows
are two essential ingredients needed to identify information asymmetry. Moreover, the optimizing
informed trader in both the Back et al. and Kyle models is by definition a contrarian trader who buys
when liquidity traders sell (and drive the price down below its expected value based on the informed
trader's private information) and sells when liquidity traders buy (and push the price up beyond this
value). In the same spirit, PC in Equation (2) is calculated based on both price changes and order flows,
and is defined precisely as the probability of contrarian trades.4
4 Specifically, Back et al. (2016) note that the PIN model is driven by order flow imbalance, but order flow alone cannot identify

10
3.2. Information and trade size
Some contrarian trades defined in Equation (2) may come from uninformed traders who happen
to trade in a contrarian direction by chance but who actually do not have private information. To address
this issue, we use trade size characteristics to further differentiate those contrarian trades that are more
likely to be submitted by informed traders from those of uninformed traders. The relationship between
information and trade size choice has been extensively studied in the microstructure literature, suggesting
that large informed traders prefer to split orders and submit medium size trades to mitigate the price
impact of their trades. Thus, we apply trade size as a filter to further separate informed from uninformed
trades.
Specifically, Kyle (1985) shows that it is optimal for a large insider to strategically smooth out
his trading on private information. Admati and Pfleiderer (1988) show further that informed traders have
an incentive to disguise their trades by placing them among uninformed trades. Barclay and Warner
(1993) propose the stealth-trading hypothesis, arguing that informed traders disguise their trades by
submitting medium-sized trades, which are just small enough to camouflage their private information and
just large enough to avoid high transaction costs. Barclay and Warner, Hasbrouck (1995), Chakravarty
(2001), and Alexander and Peterson (2007) find evidence of stealth trading by institutional investors such
that their medium-sized trades tend to have large cumulative price impact.
In light of this discussion, we refine the baseline PC measure using a medium trade-size criterion
to create the finer PCM measure, which may serve as a closer proxy for informed trading than contrarian
trading alone:
)0()0( ,,
,,
,
,, >+<= si
si
MEDsi
sisi
MEDsi
si NT
NS
NT
NBPCM εε , (3)
where NBi ,sMED and NSi ,s
MED are the total number of medium sized buy and sell trades, respectively, in stock
i on day s, where an intraday trade is classified as medium sized if the number of shares traded is between
1,000 and 9,999 shares. We set our lower bound for the medium-size trade at 1,000 shares, which is
greater than the 500 shares used in the earlier stealth trading literature (Barclay and Warner, 1993;
Chakravarty, 2001). This adjustment is motivated by recent work by Kyle and Obizhaeva (2016), whose
market microstructure invariance hypothesis posits that the average bet size for informed traders, and by
information asymmetry if liquidity providers react to information asymmetry and informed traders react to liquidity. For example, an increase in information asymmetry can lead to a fall in liquidity, which in turn can lead to less informed trading and thereby may offset the increase in informed trading induced by higher information asymmetry in the first place. Therefore, the resulting order flow, which includes both informed trading and liquidity trading, need not reflect the change in information asymmetry.
11
implication trade size (all else equal), necessarily grows as overall trading activity in the market increases.
Given the unquestionable dramatic increase in market activity in recent years, especially after
decimalization in 2001, this is a salient issue.5 It is worth noting that PCM is a general measure of
informed trading that does not depend on a specific group of market participants or a particular type of
private information. That is, PCM may capture informed trading from investors, asset managers, limit
order traders, or even market makers with superior information (e.g., Calcagno and Lovo, 2006) and may
include private information about payoffs, endowments, orders, or market participants (e.g., Vayanos,
1999).
Clearly, PCM, as proxy for the probability of informed trading, is fundamentally different in
design from the PIN of Easley et al. (1996, 2002), which is based on a structural trading model that entails
well known difficulties for estimation (e.g., the necessity of aggregating data over long time horizons,
numerical optimization methods with unreliable convergence properties, etc.). In this regard, a possible
advantage of PCM is that it, in essence, is standalone index based on the proportion of certain types of
trades occurring during a trading day, and therefore can be computed directly from the data at daily
frequency without the need for aggregating data over longer horizons or estimation techniques that
require numerical optimization. As noted above, the loss of granularity and increased computational tax
are considerable tradeoffs even if a highly accurate informed-trading measure could be conceived. Given
this apparent tradeoff, a useful measure for the purposes of applied work might be a more easily
implemented proxy (in the strict sense of the word) that is motivated by, and therefore still largely
consistent with, the salient features of informed trading. This appears to be an especially convenient
feature when dealing with extremely large transaction-level databases such as TAQ.6
4. Properties of PCM and other variables of interest
4.1. Distribution of the PCM proxy for the probability of informed trading
We calculate PCM at the daily frequency from January 1993 to December 2012 for stocks traded
on the NYSE and AMEX markets. Because the adverse selection and asset pricing tests are conducted at
the (standard) monthly frequency, we average daily values to derive a corresponding monthly PCM, 5 For robustness, we also consider an alternative version of PCM using 500 shares as the lower bound and find that PCM using 1000 shares appears to be more consistent with features of informed trading. We discuss this further below. See Table 8. 6 In a dynamic sense, since it is constructed with intraday transaction data without the need for aggregation over long time horizons, PCM may also capture the short-lived, time-varying nature of private information and its relationship with adverse selection. This is explored further in Chang et al. (2014), Weng et al. (2016), and Elaut et al. (2016) (using DPIN). In this respect, PCM (and DPIN) employs the standard Lee and Ready (1991) algorithm to classify trades rather than the volume-based classification scheme of the VPIN measure of Easley et al. (2011, 2012), which may be the source of the mechanical link between VPIN and volume effects (and, in turn, returns), as noted in Andersen and Bondarenko (2014a,b).

12
which is what we will refer to below and use in our subsequent analyses. Table 1 reports empirical
properties of PCM. Panel (a) presents the distribution across firms and months and Panel (b) presents the
distribution across firms only. Both panels indicate substantial variation both across firms and across
firms and time, suggesting at first glance that firms indeed differ along dimensions related to PCM, and
thus, to the extent that it is a reliable proxy, possibly informed trading.
4.2. Correlations between PCM and firm characteristics
Table 2 reports the correlations between firm-level PCM and other relevant firm characteristics
with regard to adverse selection and asset pricing, namely firm size, trading volume, illiquidity, and the
bid-ask spread. Several observations are in order. First, PCM is significantly and positively correlated
with the bid-ask spread. Second, and more interestingly, PCM is not correlated with illiquidity (as
measured by Amihud (2002)). In concert, these two findings suggest, at least preliminarily, that PCM is
likely to capture a component of the bid-ask spread that, if too early to conclude is adverse selection, at
least appears unrelated to illiquidity. At this stage, this is a promising sign that PCM could potentially
disentangle the information asymmetry effect from the illiquidity effect, thus overcoming the Duarte and
Young (2009) critique.
In addition, PCM is significantly and negatively correlated with firm size. If informed trades tend
to concentrate more on small firms (which is a generally accepted view), then this finding suggests that
PCM might be successfully proxying for this effect. Specifically, to the extent that small firms are
subject to higher information asymmetry, it makes sense that informed traders have an incentive to split
orders and submit medium-size trades to mitigate price impact, consistent with the trade-size criterion
used to construct PCM. Lastly, both the bid-ask spread and illiquidity are significantly negatively
correlated with both firm size and trading volume, while spreads and illiquidity are both significantly
positively correlated with each other. These results are consistent with prior expectations.
4.3. Other variables used in adverse selection and asset pricing tests
For the purpose of identifying the effect of informed trading on the adverse-selection component
of the bid-ask spread and the cross-section of stock returns, which is the focus of the rest of the paper, it is
important to include an illiquidity measure in the asset pricing tests. As noted above, Duarte and Young
(2009) find that the effect of PIN of Easley et al. (1996, 2002) on stock returns disappears once
controlling for illiquidity. In light of this, we include in all of our adverse selection and asset pricing tests
the Amihud (2002) illiquidity measure, denoted ILLIQ, which for our purposes is calculated as the
average ratio of the absolute daily return to daily dollar volume over the previous month. This is to make
results comparable to PCM, which is also calculated by averaging daily values over a month.
13
Following Easley et al. (2002) and Duarte and Young (2009), the pre-ranking portfolio beta for
an individual stock in year t is estimated using data from at least two years to, when possible, five years
prior. Stock returns are regressed on the contemporaneous and lagged value-weighted CRSP
NYSE/AMEX index. The pre-ranking portfolio beta is then computed as the sum of the two coefficients.
Based on these estimated betas, stocks are sorted into 40 portfolios, and monthly portfolio returns are
calculated as equally-weighted returns of the stocks in each portfolio. For each of the 40 portfolios, the
post-ranking portfolio beta is estimated from the full sample period by regressing portfolio returns on
contemporaneous and lagged CRSP index returns. The corresponding portfolio beta, denoted BETA, is
then the sum of these two coefficients. Individual stock betas are then replaced by the portfolio beta of the
portfolio in which they belong. This sorting process is repeated at the beginning of every year, so that
portfolio betas change across years. In addition to BETA, the other two standard Fama-French (1992)
firm-characteristics are also included: SIZE denotes the logarithm of the year-end market value of equity,
and BM represents the logarithm of book equity divided by market value of equity at the end of the
previous year.
As further controls in the adverse selection and asset pricing test we add additional variables,
including bid-ask spreads, return variability, and share turnover, that may proxy for liquidity or volume
effects that may be correlated with PCM and also affect the adverse selection component or returns. The
bid-ask spread, SPREAD, is the average monthly bid-ask spread of a stock. The stock return variability,
STD, is the daily return standard deviation of a stock over the previous year. Stock turnover, TURN, and
the coefficient of variation of turnover, CVTURN, are employed to control for volume effects: the former
is the logarithm of the average monthly turnover divided by the number of shares outstanding over the
previous three years, while the latter is defined as the logarithm of the coefficient of variation of the
monthly turnover. Chordia et al. (2001) find that both turnover variables are negatively related to stock
returns.
Table 3 reports the summary statistics for all additional variables used in the adverse selection
and asset pricing tests across all stocks and months. There appears to be substantial and sufficient
variation in each variable across firms during the 1993-2012 sample period for reliable estimation.
5. The link between PCM and informed trading
5.1. Bid-ask spreads, adverse selection, and the PCM measure
Market microstructure theory posits that stock bid-ask spreads are influenced by adverse selection
due to informed trading, as well as other factors unrelated to information (Biais, et al., 2005). In light of
this, a first pass at gauging the effectiveness of PCM as a proxy for informed trading is to test whether it
is indeed positively related to spreads as predicted. Since spreads may also be influenced by factors

14
unrelated to information such as order-handing and inventory-control costs, we must use other variables
to control for such factors. Specifically, we conduct the following monthly Fama-MacBeth (1973)
regressions:
SPREADi ,t = α t + β1,tPCMi ,t−1 + β2,t ILLIQi ,t−1 + β3,tSIZEi ,t−1 + γ t 'Xi ,t−1 + ε i ,t , (4)
for stock i in month t, where the dependent variable SPREAD is the average bid-ask spread of a stock over
the current month, PCM is the informed trading proxy over the previous month; ILLIQ is the Amihud
(2002) illiquidity measure, which is calculated as the average ratio of the absolute daily return to daily
dollar volume in the previous month; SIZE in each month is taken to be the logarithm of market value of
equity at the end of the previous year. The vector of control variables X contains factors associated with
the bid-ask spread, namely TURN, which is the logarithm of the average monthly turnover divided by the
number of shares outstanding from over the previous three years, and CVTURN, the logarithm of the
coefficient of variation of turnover; RET, the percentage return in excess of the one-month T-bill rate in
the previous month; STD, the daily return standard deviation in the previous year; and a lag of SPREAD,
the average bid-ask spread in the previous month.
If the estimated β1 is positive after controlling for factors that influence spreads and may be
correlated with informed trading, notably size and illiquidity, but as well as other volume and trading
effects in the control vector X, then this would be consistent with the view that the marginal effect of
PCM is capturing, in part, an effect that is orthogonal to the illiquidity or volume-trading components of
the bid-ask spread, which are well controlled for by the other variables in Equation (4). Given that PCM
is constructed based on salient features of informed trading, these results suggest that PCM might be
serving as a proxy for the adverse selection component of the bid-ask spread. To the extent that market
makers take into account illiquidity conditions in the previous month, we would expect β2 to be positive.
To the extent that stocks of larger firms tend to have smaller spreads, we would expect β3 to be negative.
The results of the above regression are reported in Table 4. First, all coefficients are of the
predicted sign. Most importantly, the estimate of β1 on PCM is significant and positive at the 1% level.
This suggests that PCM is capturing some part of the variation in spreads that is orthogonal to the other
specified determinants. In other words, PCM does not appear to be confounded by factors such as
illiquidity and firm size. Given this result, along with how PCM is designed based on attributes of
informed trading from the previous literature as discussed above, it thus appears likely that PCM is acting
as a proxy, at least in part, for the adverse selection component. If so, at this early stage such results also

15
suggest that PCM may also overcome the Duarte and Young (2009) critique. As far as spreads are
concerned, the effect of PCM remains strong, even after controlling for illiquidity.
In addition, consistent with our expectations, the estimate of β2 is significantly positive and the
estimate of β3 is significantly negative, both at the 1% level. These results confirm that that market
makers do take into account illiquidity conditions in the previous month, ILLIQ₋₁, when setting their
current spreads and that firm size is negatively related to spread.
5.2. PCM around earnings announcements
There is a large body of literature using earnings announcements as a proxy for information
events. Kim and Verrecchia (1994, 1997), among others, posit that earnings announcements can stimulate
sophisticated traders to process public disclosures into private information, thus resulting in higher
information asymmetry around earnings announcements. Consistent with this prediction, Lee et al. (1993)
and Yohn (1998) find an increase in bid-ask spreads in the three days around earnings announcements.
Moreover, Krinsky and Lee (1996) find that only the adverse selection component of the spread increases
significantly around earnings announcements.
In light of this view of the literature that earnings announcements are information-asymmetry rich
events, for PCM to be a useful proxy for informed trading we should expect to detect an increase in this
measure around earnings announcements. We thus examine the behavior of PCM in an event window
around earnings announcement days. Earnings announcement dates are collected from COMPUSTAT for
all firms in the sample from 1993 to 2012. Denoting days in which a firm made an earnings
announcement as Day 0, we analyze the behavior of PCM in event time using a [-10, +10]-day window
around earnings announcements days. We first compute the average PCM value for each stock and then
calculate the ratio of each stock's PCM on event days to each stock's mean PCM. We then average these
ratios across all stocks on each event day.
Figure 1 shows the value of this average ratio in event time along with 95% confidence bands.
Most notably, there is a large and significant spike in PCM on earnings announcements days, increasing
by about 11% above normal on Day 0. Consistent with Kim and Verrecchia (1994, 1997), informed
trading begins rising prior to the announcement day, and then remains higher than normal but declining in
subsequent days. In our case, PCM begins rising the day before the announcement day, peaks on the day
of the announcement, and then subsequently declines sharply, remaining significantly above normal for
roughly three days following an announcement before subsiding to normal levels. This result suggests
that PCM behaves in a manner that is consistent with the expected pattern of informed trading during
earnings announcements. In contrast, Back et al. (2015) find that PIN (or more precisely, relative

16
absolute order imbalance (or trade imbalance, TIB) which is used as a proxy for (dynamic) PIN (Aktas,
2007)) actually falls around earnings announcements.
5.3. PCM, Kyle’s lambda, and price impact in time series
Kyle's (1985) lambda, a measure of market price impact (and thus closely related to illiquidity), is
also known to reflect, in part, information asymmetry. For example, Cong et al. (2010) and Back et al.
(2015) find that Kyle's lambda is higher around earnings announcements. Back et al. (2016) develop a
hybrid model of PIN and Kyle and develop a Kyle-style lambda as a measure of information asymmetry.
They find that their lambda and a price impact measure (an alternative measure of Kyle's lambda from
Holden and Jacobsen (2014)) both rise during the 1990s and then decline sharply following the turn of the
century, with a small upward movement during the recent financial crisis of 2008.
To the extent that Kyle's lambda and the price impact estimate reflect some degree of information
asymmetry, we should also expect to see similar patterns over time between PCM and both of these
measures. We construct a daily time series by calculating the average PCM across all stocks for each day
in the sample. Figure 2 shows the daily time series for this average (i.e., market) PCM over the 1993-
2012 period. There is a striking similarity in time-series patterns between PCM and both Kyle's lambda
and the price impact exhibited in Back et al. (2016) (see their Figures 3f and 5, respectively). Specifically,
as noted previously, all three series rise during the 1990s and then decline sharply following the year
2000, with a small and brief upward movement following the recent financial crisis in 2008. Moreover,
there is a relatively high degree of daily variability in the measure in the first half of the sample but then a
severe decline in variance after 2001. This pattern in variability closely mirrors the results in Back et al.,
who find the same pattern in the inter-quartile range of Kyle's lambda and price impact over the same
period. In addition, the evolution of the value of our PCM proxy over time also matches closely that of
the price impact estimate. Both time series start around 15% in 1993, rise to 20% around 2000, and
subsequently drop below 5% following 2007.
Such changes are consistent with the view that informed trading, in proportion to all trading
activity, has declined substantially in recent years due to the dramatic, exponential explosion of liquidity
provision by (non-information based) high-frequency trading. Such a large proportional decline in
informed trading would still be evident even if informed trading volume, in absolute terms, has been
growing at a reasonable pace. In any case, the close similarities in the time-series behavior between
PCM, Kyle's lambda, and price impact further suggest that PCM appears to be consistent with salient
features of informed trading.
6. PCM and the cross-section of stock returns
17
With evidence of a tenable link between PCM and informed trading, we next attempt to apply
PCM, as a possible proxy for informed trading, to explore a larger question in the asset pricing literature:
whether information risk is priced. The information asymmetry hypothesis predicts that expected stock
returns should be positively related to informed trading because uninformed traders lose to informed
traders and hence require compensation to hold stocks with greater information asymmetry (Easley and
O'Hara, 2004).
6.1. PCM, illiquidity, firm size, and portfolio excess returns
6.1.1. Excess returns and three-factor alphas of portfolios sorted on PCM
As a first pass towards understanding the relationship between informed trading and returns, we
examine the behavior of portfolios sorted on PCM. Specifically, we sort stocks into 10 decile portfolios
each month with the "1 (Low)" portfolio containing the 10% of stocks with the lowest PCM and the "10
(High)" portfolio containing the 10% of stocks with the highest PCM. We also form the "10-1" portfolio,
which represents the long-short (self-funded, zero-investment) portfolio, with returns calculated by
subtracting portfolio 1 returns from portfolio 10 returns. For each portfolio, we examine portfolio excess
returns and evaluate the Fama-French three-factor (FF3) alpha to determine whether information risk (as
proxied for by PCM) contributes to returns in excess to the standard market risk (MKT), size (SMB), and
growth (HML) factors.
Table 5 presents the sorting results. The mean (excess) return for each portfolio is reported in the
first column, while the second column reports the FF3-factor alpha. Notably, the "10-1" long-short
portfolio generates a large and statistically significant mean return of 1.155% per month, and has a large
and statistically significant alpha of .702% (corresponding to an 8.4% abnormal return per year). The
results from these one-dimensional sorts suggest, at the very least, that PCM can be used to construct
portfolios with abnormal risk-adjusted returns. Perhaps more generally, and to the extent that PCM
serves as a proxy for informed trading, they also suggest that stock returns do vary along dimensions
related to information asymmetry.
6.1.2. Excess returns and firm size from two-dimensional sorts on PCM and illiquidity
Given the Duarte and Young (2009) critique, a next step to further investigate the relationship
between informed trading and returns must take into account the possible confounding effects of
illiquidity. We thus follow the methodology in Fama and French (1992) and perform monthly, two-
dimensional, sequential sorting of stocks into portfolios and calculate and compare their monthly excess
returns. Specifically, for each month, stocks are sorted into five illiquidity groups from Low to High
based on their Amihud (2002) illiquidity measure (ILLIQ) from the previous month, and then stocks in
18
each of these ILLIQ groups are further sorted into five PCM groups from Low to High based on their
average PCM in the previous month, resulting in 25 ILLIQ-PCM portfolios. For each portfolio, average
monthly excess return and firm size are calculated and these numbers are then averaged across the entire
sample period.
The double-sorting results are reported in Table 6. Panel (a) shows that within each ILLIQ group,
portfolio excess returns generally increase across the five Low to High PCM categories. However, for
some of these groups, the increase is non-monotonic. Panel (b), which shows average firm size across
portfolios, helps to explain why. For the lowest ILLIQ group, for which illiquidity is of the least concern
(and firm size is the largest), high PCM is associated with larger firm size, which in turn is associated
with lower returns. On the other hand, for the highest ILLIQ group, for which illiquidity is of the greatest
concern (and firm size is the smallest), high PCM is associated with smaller firm size, which in turn is
associated with higher returns. For the three middle ILLIQ groups, we see that firm size fluctuates to a
certain degree as we move across PCM categories.
Thus, although a positive relationship between informed trading, as measured by PCM, and
returns is still observed after "controlling" for illiquidity in these two-dimensional sorts, we now see that
firm size is also an important factor (as we should expect, of course). Further regression analysis is thus
warranted and necessary in order to control for possible confounding effects due to illiquidity, as well as
firm size and other variables, when identifying the asset pricing implication of informed trading.
6.2. Asset pricing tests
6.2.1. Regression analysis methodology
We now test the information asymmetry hypothesis formally by conducting a series of monthly,
firm-level Fama-MacBeth (1973) regressions to account for other variables that also influence stock
returns. Our first baseline specification employs the three Fama-French (1992) firm characteristics -- beta,
firm size, and the book-to-market ratio -- along with an illiquidity measure, as follows:
RETi ,t = α t + γ 1,tPCMi ,t−1 + γ 2,t ILLIQi ,t−1 + γ 3,t BETAi ,t + γ 4,tSIZEi ,t−1 + γ 5,t BMi ,t−1 + ε i ,t , (5)
for stock i in month t, where the dependent variable RET is the monthly percentage return of stock i in
excess of the one-month T-bill rate; PCM is the measure of information asymmetry in the previous
month; and ILLIQ is the monthly Amihud (2002) illiquidity measure, which is calculated as the average
ratio of the absolute daily return to daily dollar volume over the previous month. BETA is the portfolio
beta in the current year estimated from the full period using 40 post-ranking portfolios. For each month,
19
SIZE is the logarithm of market value of equity at the end of the previous year, and BM is the logarithm of
book equity divided by market value of equity at the end of the previous year.
Under the information asymmetry hypothesis, the coefficient of interest is the estimate of the
parameter γ 1 in Equation (5). We should observe a positive and statistically significant coefficient if
information asymmetry, as measured by PCM, indeed has a marginal effect on stock returns.
6.2.2. Estimation results
The estimation results in Table 7 confirm our preliminary findings from the portfolio sorts in
Tables 5 and 6. That is, PCM is large and positive and highly significant in explaining the cross-section of
stock returns after controlling for ILLIQ and the three Fama-French firm characteristics, BETA, SIZE, and
BM. In addition, ILLIQ is positive and significant at the 1% level, consistent with the strong effect of
illiquidity on stock returns found in Duarte and Young (2009).7 Also consistent with the previous
literature, stock returns are significantly negatively related to SIZE and positively related to BM, while
BETA is no different from zero, as in Fama and French (1992) and Easley et al. (2002). Most importantly,
from Table 7 it is evident that after controlling for ILLIQ and other important factors such as SIZE, PCM
survives the Duarte and Young critique and other possible confounding effects implied in Table 6. The
marginal effect of PCM on returns thus appears orthogonal to liquidity concerns unrelated to information.
Coupled with the fact that PCM is designed to reflect salient characteristics of informed trading activity
from the literature, this finding further supports that PCM may be a reliable proxy for informed trading
and provides evidence that information risk, at least as measured by PCM, appears to be priced in a
manner consistent with the information-asymmetry hypothesis.
As a robustness check, we include PIN in the regression. This allows us to assess the marginal
explanatory power of each measure in explaining the cross section of returns, and whether there is any
overlap in their information content (in the econometric sense). Adding PIN to Equation (5) yields:
RETi ,t = α t + γ 1,tPCMi ,t−1 + γ 2,tPINi ,t−1 + γ 3,t ILLIQi ,t−1 +γ 4,t BETAi ,t + γ 5,tSIZEi ,t−1 + γ 6,t BM i ,t−1 + ε i ,t , (6)
for stock i and month t.8 The estimation results for various specifications based on the above regression
are reported in Table 8. First, PIN is insignificant in our sample for Models (1) and (2) excluding PCM,
with or without controlling for illiquidity. When PCM and PIN are included together in the regression in
7 However, Ben-Rephael et al. (2015) show that the effect of characteristic liquidity measures such as Amihud illiquidity have declined dramatically in the last decade. We explore the implications of this finding in split-sample analyses below. 8 The PIN data are from Brown and Hillegeist (2007), available for the period of 1993 to 2010 and downloaded from http://scholar.rhsmith.umd.edu/sbrown/pin-data?destination=node/998.
20
Models (3) and (4), the coefficient on PCM is positive and significant at the 1% level irrespective of the
illiquidity control, but PIN is again invariably insignificant. The magnitude of the estimates and t-
statistics on PIN become drastically reduced in the presence of PCM when comparing across models.
Thus, it appears that the information content in PCM is largely orthogonal to PIN.
6.3. Sub-sample analysis: before and decimalization
So far, we have conducted our empirical analysis on the full sample of data from January 1993 to
December 2012. However, this time period encompasses tremendous technological innovation and
regulatory changes in stock markets and trading processes. Chief among these, arguably, is the
decimalization of stock prices that occurred in January 2001. Since then, new trading technologies and
venues have advanced rapidly and trading activity has increased dramatically as a result. Some
researchers argue that such technological innovation and regulatory changes may lead to better liquidity
in the market (see, e.g., Angel et al., 2010; O'Hara, 2014). Indeed, Ben-Rephael et al. (2015) show that
the effect of characteristic liquidity measures such as Amihud illiquidity have declined dramatically over
the years, and especially in the last decade. In light of these developments, we conduct a sub-sample
analysis to examine whether and how the effect of information asymmetry, at least as proxied for by
PCM, on stock returns may have been affected as a result.
Related to decimalization, the average trade size has also declined dramatically in recent years,
with many traders splitting their orders into a series of smaller sized trades. O'Hara (2014) reports that the
average trade size of U.S. equity markets is now just over 200 shares. On the one hand, this might suggest
that the effect of PCM, which uses a lower bound of 1,000 shares, may diminish or even disappear after
decimalization. On the other hand, one may reasonably argue that much of the smaller sized trades are not
motivated by information but rather by liquidity, such as those from high frequency trading (HFT).
Moreover, Kyle and Obizhaeva (2016) posit that under market microstructure invariance, the bet size of
long-term traders must increase as trading activity accelerates. To the extent such long-term traders are
motivated by information, then all else equal the average informed trade size may plausibly grow with bet
size for a similar order splitting strategy (e.g., splitting a bet into 10 trades on average for each bet).
It is in the spirit of the latter consideration (i.e., increasing informed trade size) that we use 1000
shares as the lower bound for the medium-size of trades in our PCM measure, instead of the 500 share
cutoff used in the earlier stealth trading literature (Barclay and Warner, 1993; Chakravarty, 2001).
However, given the above discussion on changes in trading processes and technology, it becomes
necessary and interesting to compare results between subperiods before and after decimalization, and also
to compare PCM as currently defined to an alternative version of PCM defined using 500 shares as the
lower bound for medium sized trades, which we denote by PCM500.
21
We therefore re-perform the regression in Equation (6) using two subsamples to reflect the two
periods prior to and after decimalization, namely a subperiod from 1994-2000, and from 2001-2011. In
each subperiod, we run the regression using PCM and PCM500 separately as alternative proxies for
information asymmetry. We also include PIN in the subsample analysis to see whether its effect on
returns may be time dependent (since we did not detect significance in the full sample) and to control for
possible effects arising from PIN within and across subperiods.
The results are reported in Table 9, with Panel (a) corresponding to the 1994-2000 subperiod, and
Panel (b) the 2001-2011 subperiod. Several observations are in order. First, and most importantly, the
effect of information asymmetry, as measured by PCM, actually strengthens after the decimalization in
2001. This is evident from the size and significance of the coefficient estimates on both PCM and
PCM500, which increase dramatically in the later subperiod. Namely, the coefficient on PCM increases
from 5.03 (p-value = .09) to 13.23 (p-value = .01). Notably, this result is in stark contrast to the
diminishing liquidity premium documented in Ben-Rephael et al. (2015). While recent technological
innovation (especially HFT) and regulatory changes may have lead to a diminishing liquidity premium,
there does not appear to be a corresponding diminishing information risk premium. In fact, these
subsample results seem to point in the opposite direction that information risk appears to remain
substantial and significant. However, consistent with the diminishing illiquidity effect, we find that the
coefficient on ILLIQ is highly significant at the 1% level in the earlier subperiod, but becomes
insignificant in the later subperiod. This strongly suggests that PCM has significant explanatory power
that is thus necessarily free of any illiquidity effects, as illiquidity effects have largely disappeared.
Second, the size of the coefficient of PCM is more than two times that of PCM500 in each sub-
period. For example, in the later sub-period, the coefficient on PCM is 13.23 whereas the coefficient on
PCM500 is 6.43. Furthermore, only PCM is statistically significant in both subperiods, whereas PCM500
is only significant in the later subperiod. These results validate our use of 1000 shares, instead of 500, as
the lower bound to define medium-sized trades in constructing PCM. In other words, as average bet size
has declined over time due to the preponderance of small trades sizes (due to uninformed HFT), in order
to better detect informed trades we must increase the trade-size threshold to more clearly separate
informed from uninformed trades. However, as discussed above, increasing this threshold is consistent
with the increasing bet size on the part of informed traders that necessarily follows from an increase in
overall trading activity, as put forth in the market microstructure invariance hypotheses of Kyle and
Obizhaeva (2016).
Third, the effect of PIN is significant at the 10% level in the first subperiod, and only in the
presence of PCM500 rather than PCM. This result is generally consistent with those in Duarte and Young
(2009) in that the effect of PIN appears marginally significant in earlier years but seems to have
22
weakened in more recent data. Overall, the above subsample analysis with alternative definitions of PCM
indicates that our main findings from the full sample are robust in the face of the important recent
technological innovations and regulatory changes ushered in since the decimalization of stock prices in
2001.
6.5. Alternative explanations
Following Easley et al. (2002) we conduct a final robustness check of the effect of informed
trading, as measured by PCM, on returns by considering alternative variables that are known to be
positively associated with returns and may have confounding effects on informed trading. Specifically,
we expand the regression in Equation (5) to include the following variables: return variability, share
turnover, which may proxy for liquidity or volume effects, and momentum. However, unlike Easley et al.,
we do not include the bid-ask spread in any of the regressions at this stage. As discussed above, market
microstructure theory suggests that the spread consists of two main parts: one part is related to
information asymmetry while the other is related to liquidity concerns unrelated to information (Biais, et
al., 2005). Reflecting these two parts, in Section 5 we find that the spread is positively related to PCM,
while others, e.g., Amihud and Mendelson (1986), find a positive relation between the spread and stock
returns as evidence to support their liquidity hypothesis. Thus, with the PCM and ILLIQ proxies in place
for their respective components of the bid-ask spread, further adding spreads themselves into the
regression again would introduce a severe multicollinearity problem. Here, our approach is similar to that
in Duarte and Young (2009), who also do not include the spread when testing PIN in the presence of an
illiquidity factor.
Specifically, stock return variability, STD, is the daily return standard deviation of stock i over the
previous year. Stock turnover, TURN, and the coefficient of variation of turnover, CVTURN, are
employed to control for volume effects. The former is calculated as the logarithm of the average monthly
turnover divided by the number of shares outstanding over the previous three years, while the latter is the
logarithm of the former's coefficient of variation. Chordia et al. (2001) find that both turnover variables
are negatively related to stock returns. Finally, while we have not explored possible linkages between
informed trading and momentum effects, given that such effects are commonly used in the literature we
include an additional variable to control for momentum, RET27, which is the cumulative return of stock i
over the previous five months.
Table 10 presents the results from incorporating these additional variables in our asset pricing
tests. Notably, regardless of which of these additional variables is included, and whether in succession or
all together at once, the coefficient on PCM in every specification remains significant and positive at
either the 1% or 5% level. All of the results corroborate the main findings above.
23
7. Conclusion
The relationship between stock returns and information is a central issue in both the asset pricing
and market microstructure literature. The information asymmetry hypothesis posits that information risk
should be priced because uninformed traders lose to informed traders and hence require compensation to
hold stocks with greater information asymmetry (Easley and O'Hara, 2004). The aim of this paper is
twofold: (1) develop a computationally straightforward and easily implemented proxy for the probability of
informed trading that is motivated by relevant theories and trading characteristics and (2), employ the
proxy to test the information asymmetry hypothesis.
Our proxy for informed trading, called PCM, is based on the concept of contrarian trades
(Campbell et al., 1993; Avramov et al., 2006; Back et al., 2016) and trade size choice, which is motivated
by the stealth trading literature (Barclay and Warner, 1993; Chakravarty, 2001), along with the market
microstructure invariance hypotheses (Kyle and Obizhaeva, 2016). PCM, then, in essence is conceived as
the ex post probability of observing medium-sized contrarian trades over a specified period, as such trades
appear to conform most closely to the characteristics of informed trading discussed in the literature.
We attempt to establish a link between PCM and informed trading in several ways. First, we
examine whether PCM is positively related to the bid-ask spread, which is known to have an adverse
selection component and an illiquidity component. We find that PCM is significant and positive in
explaining spreads even after controlling for Amihud (2002) illiquidity and firm size, as well as other
variables of interest related to volume and trading characteristics, including turnover and returns, as well
as their variability, that may also be related to illiquidity and informed trading. Thus, we might plausibly
attribute the marginal effect of PCM on the bid-ask spread to informed trading (the adverse selection
component), rather than illiquidity or other volume-trading factors unrelated to information (the illiquidity
component).
To further investigate the link between PCM and information, we analyze the behavior of PCM in
an event window surrounding earnings announcements, which are known to be information rich events.
Consistent with Kim and Verrecchia (1994, 1997), PCM begins rising the day before the earnings
announcement day, peaks on the announcement day, and declines sharply but remains significantly above
normal for roughly three days following an announcement, before subsiding back to normal levels. This
suggests that PCM may be successfully detecting informed trading during these periods. There is also a
striking similarity in time-series patterns between PCM and both the Kyle's lambda and the price impact
estimated in Back et al. (2016). All three time series rise over 1990s and drop sharply following the turn
of the century, with a brief upward movement during the recent financial crisis. The collective evidence
from the cross-sectional regression analysis of bid-ask spreads, the analysis of an event window around
24
earnings announcements, and the time-series comparison with Kyle's lambda and price impact suggest a
plausible link between PCM and information asymmetry.
After performing a sequence of preliminary tests on the positive relationship between PCM and
returns, we then formally test the information asymmetry hypothesis by conducting a series of Fama-
MacBeth (1973) regressions of stock returns on PCM and other variables that may also influence stock
returns. We find that PCM is positive and significant in explaining stock returns after controlling for
Amihud illiquidity and the three Fama-French firm characteristics, beta, firm size, and the book-to-market
ratio. Since the effect of PCM on returns is obtained after controlling for illiquidity, we are able to
overcome the critique of Duarte and Young (2009). Namely, information asymmetry, as proxied for by
PCM, does appear to have a marginal effect on returns that is orthogonal to illiquidity and other factors
not directly related to information. Testing robustness, we examine alternative explanations to
information asymmetry by adding additional explanatory variables used in the literature related to volume
and trading factors such as turnover, returns, and their variability, as well as momentum. The estimation
results show that the coefficient on PCM remains significant and positive after controlling for these
additional variables. The information content (in the econometric sense) of PCM is also found to be
orthogonal to PIN.
To account for the potential effect of decimalization in 2001, we split the sample into pre- and
post-2001 subperiods. The effect of PCM actually strengthens after the post-decimalization subperiod.
This suggests that while recent technological innovations (especially HFT) and regulatory changes may
have lead to a diminishing liquidity premiums (as documented in Ben-Rephael et al. (2015)), they have
not necessarily lead to a diminishing information risk premium. In fact, we find that information risk, as
measured by PCM, remains substantial and significant after decimalization. Moreover, since illiquidity
has virtually no effect in the post-2001subperiod, this finding that PCM is even more economically and
statistically significant during this time where illiquidity effects are negligible provides further evidence
that it is not confounded by illiquidity and that, to the contrary, it must therefore be capturing a
component in returns that is almost wholly unrelated to illiquidity.
The collective evidence in this paper suggests therefore that PCM appears to be a potentially
reliable and useful proxy for informed trading and adverse selection. There also appears to be evidence
that informed trading, as measured by PCM, provides incremental information in explaining the cross-
section of returns, thus lending support to the information asymmetry hypothesis (Easley and O'Hara,
2004) that information risk is priced and informed trading is an important determinant of expected stock
returns.
As noted above, extant measures of informed trading can oftentimes be quite difficult to compute,
requiring the aggregation of large amounts of intraday or daily data into much longer horizons (frequency

25
degradation) while also necessitating the use of numerical optimization procedures with unstable
convergence properties. Such drawbacks are especially inconvenient when dealing with very large
transaction-level trade and quote data, as is typical now. The loss of granularity and increased
computational tax are considerable tradeoffs, even if a highly accurate informed-trading measure could be
conceived. Given this apparent tradeoff in applied work, our approach here is to attempt to construct a
proxy that is easier to implement, while being motivated by, and therefore still largely consistent with, the
salient features of informed trading, realizing that it would not necessarily be a perfectly accurate or pure
measure of informed trading, but would at least serve as a reliable proxy, in the strict sense of the word.
As such, with a more easily implemented informed trading measure, possible future research
using this measure can continue apace. Recently, for example, using a unique dataset where trader
identity is observed, Weng et al. (2016) examine international futures markets and find that the PC-based
proxy (i.e., DPIN) of certain institutional investors that are known to be more informed outperforms
alternative PIN-based measures, specifically trade imbalance (TIB) and volume-synchronous PIN (VPIN)
(see below), and provides more stable effects in measuring informed trading. Elaut et al. (2016) use this
proxy for informed trading to disentangle whether intraday momentum in Russian FX markets is due to
informed trading or liquidity provision. Notably, both papers cite both the relative computational ease
and lack of frequency degradation of the informed-contrarian proxy in their choice of model, providing
further evidence that such a proxy captures salient features of informed trading.

26
References Admati, A., Pfleiderer, P., 1988. A theory of intraday patterns: volume and price volatility. Review of Financial Studies 1, 3-40. Alexander, G.J., Peterson, M.A., 2007. An analysis of trade-size clustering and its relation to stealth trading. Journal of Financial Economics 84, 435-471. Amihud, Y., 2002. Illiquidity and stock returns: cross-section and time-series effects. Journal of Financial Markets 5, 31-56. Amihud, Y., Mendelson, H., 1986. Asset pricing and the bid-ask spread. Journal of Financial Economics 17, 223-249. Andersen, T.G., Bondarenko, O., 2014a. VPIN and the flash crash. Journal of Financial Markets 17, 1-45. Andersen, T.G., Bondarenko, O., 2014b. Reflecting on the VPIN dispute. Journal of Financial Markets 17, 53- 64. Angel, J. Harris, L., Spatt, C., 2010. Equity trading in the 21st century. Working Paper, Carnegie Mellon University. Avramov, D., Chordia, T., Goyal, A., 2006. The impact of trades on daily volatility. Review of Financial Studies 19, 1241-1277. Back, K., Crotty, K., Li, T., 2015. Can information asymmetry be identified from order flows alone? Working Paper, Rice University. Back, K., Crotty, K., Li, T., 2016. Estimating information asymmetry in securities markets. Working Paper, Rice University. Barclay, M., Warner, J., 1993. Stealth trading and volatility: which trades move prices. Journal of Financial Economics 34, 281-305. Ben-Rephael, A., Kadan, O., Wohl, A., 2015. The diminishing liquidity premium. Journal of Financial and Quantitative Analysis 50, 197-229. Biais, B., Glosten, L., Spatt, C., 2005. Market microstructure: A survey of microfoundations, empirical results, and policy implications. Journal of Financial Market 8, 217-264. Brown, S., Hillegeist, S.A., 2007. How disclosure quality affects the level of information asymmetry. Review of Accounting Studies 12, 443-477. Calcagno, R., Lovo, S., 2006. Bid-ask price competition with asymmetric information between market makers. Review of Economic Studies 73, 329-355. Campbell, J., Grossman, S., Wang J., 1993. Trading volume and serial correlation in stock returns. Quarterly Journal of Economics 31, 281-318. Chakravarty, S., 2001. Stealth trading: which traders’ trades move stock prices? Journal of Financial Economics 61, 289-307.
27
Chang, S.S, Chang, L.V., Wang, F.A., 2014. A dynamic intraday measure of the probability of informed trading and firm-specific return variation. Journal of Empirical Finance 29, 80-94. Chang, S.S, Wang, F.A., 2015. Adverse selection and the presence of informed trading. Journal of Empirical Finance 33, 19-33. Chordia, T., Subrahmanyam, A., and Anshuman, V.R., 2001, Trading activity and expected stock returns, Journal of Financial Economics 59, 3-32. Duarte, J., Young, L., 2009. Why is PIN priced? Journal of Financial Economics 91, 119-138. Cong, Y., Hoitash, R., Krishnan, M., 2010. Event study with imperfect competition and private information: earnings announcements revisited. Review of Quantitative Finance and Accounting, 34, 383-411. Easley, D., Kiefer, N., O’Hara, M., Paperman, J., 1996. Liquidity, information and infrequently traded stocks. Journal of Finance 51, 1405–1436. Easley, D., Hvidkjaer, S., O'Hara, M., 2002. Is information risk a determinant of asset returns? Journal of Finance 57, 2185-2221. Easley, D., O'Hara, M., 2004. Information and cost of capital. Journal of Finance 59, 1553-1583. Easley, D., Lopez de Prado, M.M., O'Hara, M., 2011. The microstructure of the “flash crash”: flow toxicity, liquidity crashes, and the probability of informed trading. Journal of Portfolio Management 201, 118-128. Easley, D., Lopez de Prado, M.M., O'Hara, M., 2012. Flow toxicity and liquidity in a high-frequency world, Review of Financial Studies 25, 1458-1493. Elaut, G., Frömmel, M., Lampaert, K., 2016. Intraday momentum in FX markets: Disentangling informed trading from liquidity provision, Journal of Financial Markets, forthcoming. Fama, E., French, K., 1992. The cross-section of expected stock returns. Journal of Finance 47, 427-465. Fama, E., MacBeth, J., 1973. Risk, return, and equilibrium: empirical tests. Journal of Political Economy 81, 607-636. Hasbrouck, J., 1995. One security, many markets: determining the contributions to price discovery. Journal of Finance 50, 1175-1199. Holden C.W., Jacobsen, S., 2014. Liquidity measurement problems in fast, competitive markets: Expensive and cheap solutions. Journal of Finance 69, 1747-1785. Kim, O., Verrecchia, R.E., 1994. Market liquidity and volume around earnings announcements. Journal of Accounting and Economics 17, 41-67. Kim, O., Verrecchia, R.E., 1997. Pre-announcement and even-period private information. Journal of Accounting and Economics 24, 395-419. Krinsky, I., Lee, J., 1996. Earnings announcements and the components of the bid-ask spread. Journal of Finance 51, 1523-1535. Kyle, A.S., 1985. Continuous auctions and insider trading. Econometrica 53, 1315-1335.

28
Kyle A.S., Obizhaeva, A.A., 2016. Market microstructure invariance: empirical hypotheses. Econometrica, (forthcoming). Lai, S., Ng, L., Zhang, B., 2014. Does PIN affect equity prices around the world. Journal of Financial Economics 114, 178-195. Lee, C.M.C., Ready, M.J., 1991. Inferring trade direction from intraday data. Journal of Finance 46, 733-746. Lee, C.M.C., Mucklow, B., Ready, M.J., 1993. Spreads, depths and the impact of earnings information: An intraday analysis. Review of Financial Studies 6, 345-374. O’Hara, M., 2014. High frequency market microstructure. Working Paper, Cornell University. Vayanos, D., 1999. Strategic trading and welfare in a dynamic market. Review of Economic Studies 66, 219-254. Weng, P.S., Wu, M.H., Chen, M.L., Tsai, W.C., 2016. An empirical analysis of the dynamic probability of informed institutional trading: evidence form the Taiwan Futures Exchange. Journal of Futures Markets (forthcoming). Yohn, T.L., 1998. Information asymmetry around earnings announcements. Review of Quantitative Finance and Accounting, 11, 165-182.
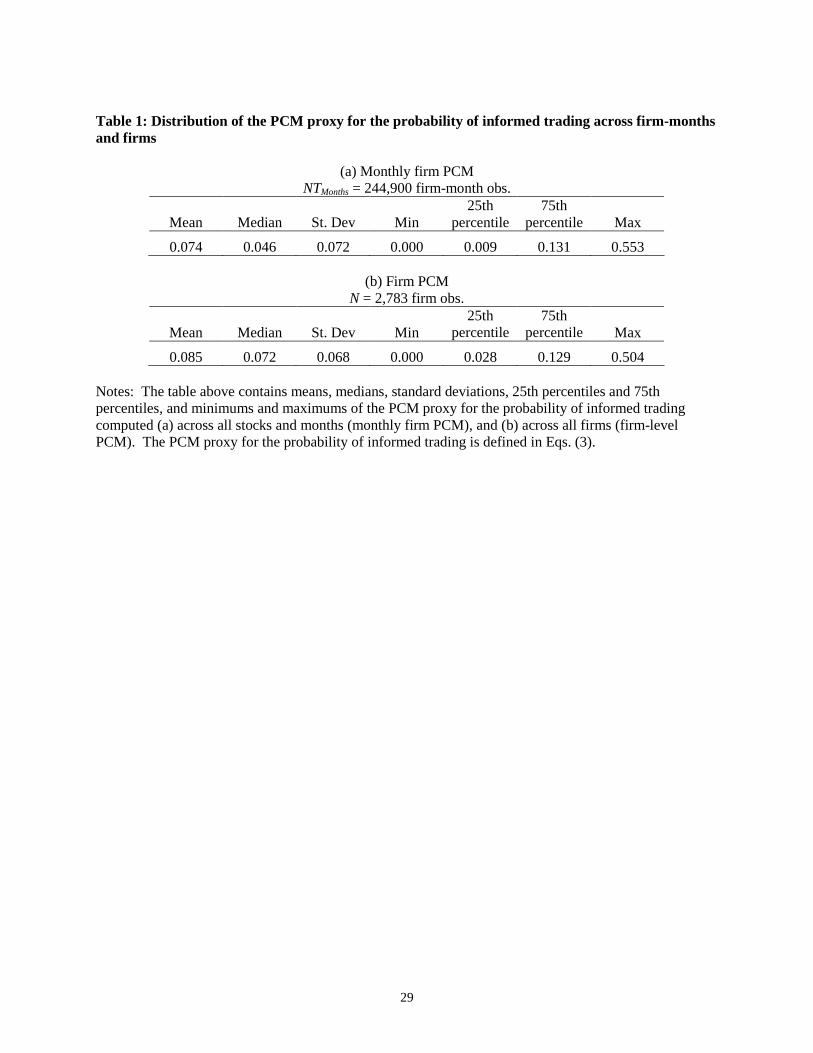
29
Table 1: Distribution of the PCM proxy for the probability of informed trading across firm-months and firms
(a) Monthly firm PCM NTMonths = 244,900 firm-month obs.
Mean Median St. Dev Min 25th
percentile 75th
percentile Max
0.074 0.046 0.072 0.000 0.009 0.131 0.553
(b) Firm PCM N = 2,783 firm obs.
Mean Median St. Dev Min 25th
percentile 75th
percentile Max
0.085 0.072 0.068 0.000 0.028 0.129 0.504 Notes: The table above contains means, medians, standard deviations, 25th percentiles and 75th percentiles, and minimums and maximums of the PCM proxy for the probability of informed trading computed (a) across all stocks and months (monthly firm PCM), and (b) across all firms (firm-level PCM). The PCM proxy for the probability of informed trading is defined in Eqs. (3).
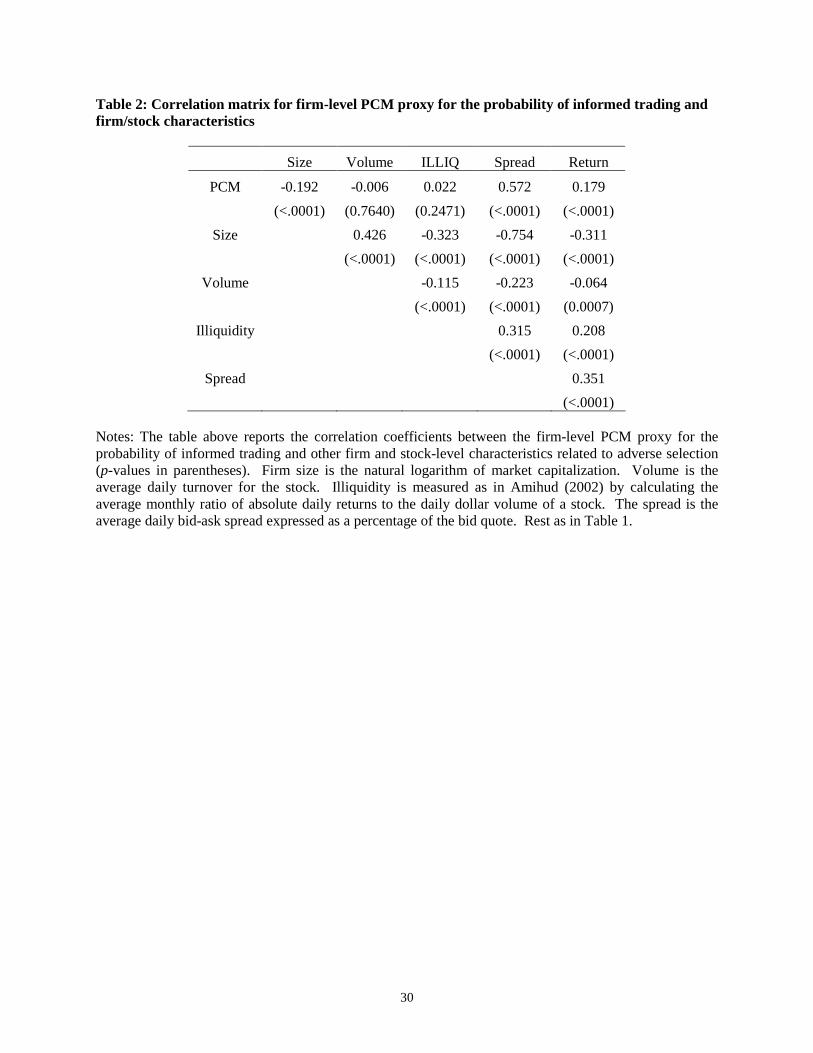
30
Table 2: Correlation matrix for firm-level PCM proxy for the probability of informed trading and firm/stock characteristics
Size Volume ILLIQ Spread Return
PCM -0.192 -0.006 0.022 0.572 0.179
(<.0001) (0.7640) (0.2471) (<.0001) (<.0001)
Size 0.426 -0.323 -0.754 -0.311
(<.0001) (<.0001) (<.0001) (<.0001)
Volume -0.115 -0.223 -0.064
(<.0001) (<.0001) (0.0007)
Illiquidity 0.315 0.208
(<.0001) (<.0001)
Spread 0.351
(<.0001) Notes: The table above reports the correlation coefficients between the firm-level PCM proxy for the probability of informed trading and other firm and stock-level characteristics related to adverse selection (p-values in parentheses). Firm size is the natural logarithm of market capitalization. Volume is the average daily turnover for the stock. Illiquidity is measured as in Amihud (2002) by calculating the average monthly ratio of absolute daily returns to the daily dollar volume of a stock. The spread is the average daily bid-ask spread expressed as a percentage of the bid quote. Rest as in Table 1.
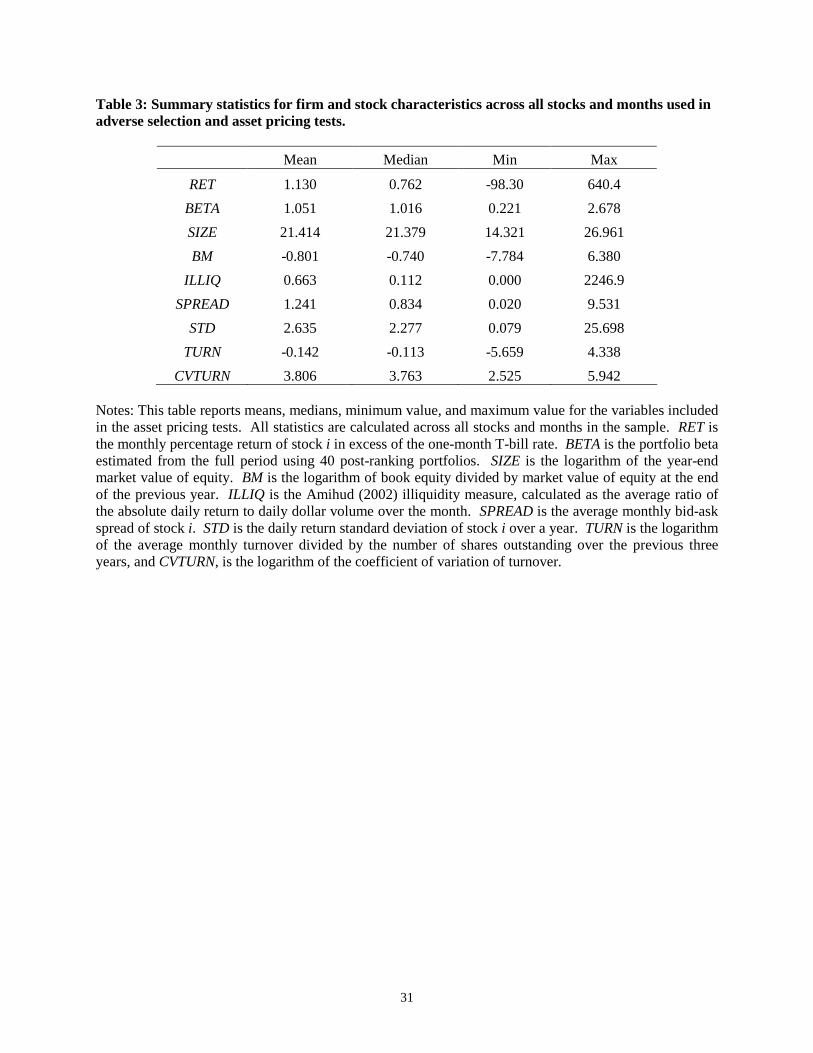
31
Table 3: Summary statistics for firm and stock characteristics across all stocks and months used in adverse selection and asset pricing tests.
Mean Median Min Max
RET 1.130 0.762 -98.30 640.4
BETA 1.051 1.016 0.221 2.678
SIZE 21.414 21.379 14.321 26.961
BM -0.801 -0.740 -7.784 6.380
ILLIQ 0.663 0.112 0.000 2246.9
SPREAD 1.241 0.834 0.020 9.531
STD 2.635 2.277 0.079 25.698
TURN -0.142 -0.113 -5.659 4.338
CVTURN 3.806 3.763 2.525 5.942 Notes: This table reports means, medians, minimum value, and maximum value for the variables included in the asset pricing tests. All statistics are calculated across all stocks and months in the sample. RET is the monthly percentage return of stock i in excess of the one-month T-bill rate. BETA is the portfolio beta estimated from the full period using 40 post-ranking portfolios. SIZE is the logarithm of the year-end market value of equity. BM is the logarithm of book equity divided by market value of equity at the end of the previous year. ILLIQ is the Amihud (2002) illiquidity measure, calculated as the average ratio of the absolute daily return to daily dollar volume over the month. SPREAD is the average monthly bid-ask spread of stock i. STD is the daily return standard deviation of stock i over a year. TURN is the logarithm of the average monthly turnover divided by the number of shares outstanding over the previous three years, and CVTURN, is the logarithm of the coefficient of variation of turnover.
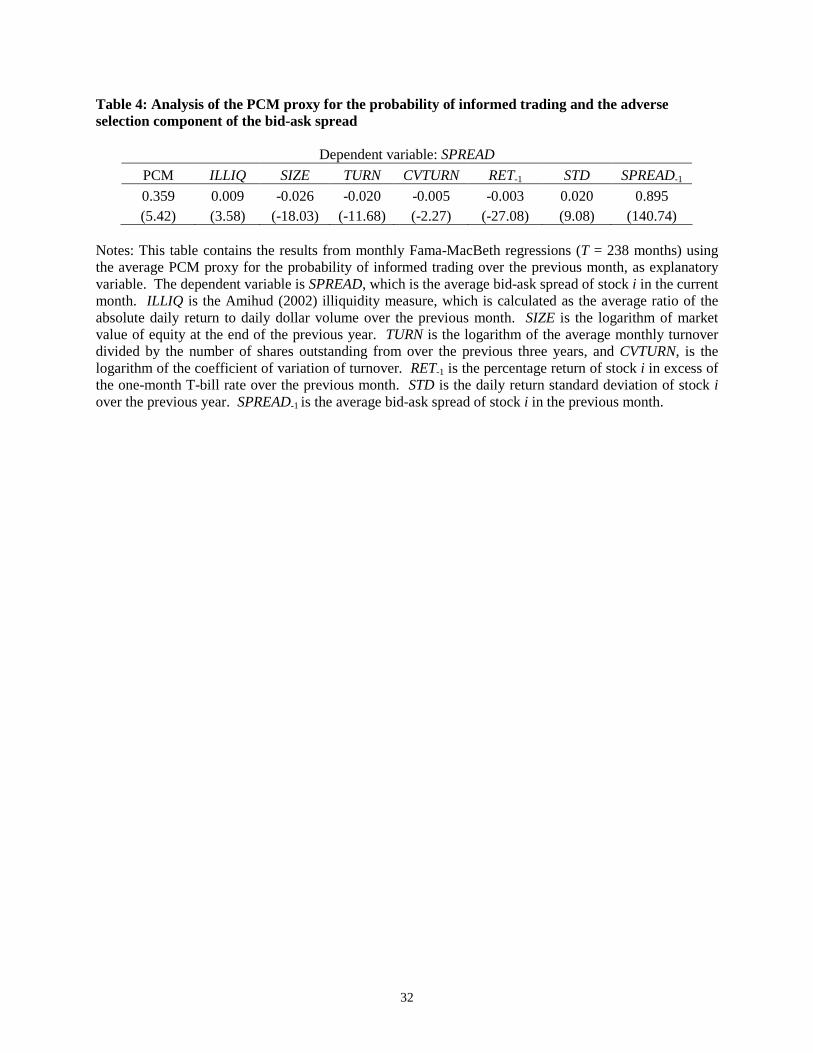
32
Table 4: Analysis of the PCM proxy for the probability of informed trading and the adverse selection component of the bid-ask spread
Dependent variable: SPREAD
PCM ILLIQ SIZE TURN CVTURN RET-1 STD SPREAD-1 0.359 0.009 -0.026 -0.020 -0.005 -0.003 0.020 0.895 (5.42) (3.58) (-18.03) (-11.68) (-2.27) (-27.08) (9.08) (140.74)
Notes: This table contains the results from monthly Fama-MacBeth regressions (T = 238 months) using the average PCM proxy for the probability of informed trading over the previous month, as explanatory variable. The dependent variable is SPREAD, which is the average bid-ask spread of stock i in the current month. ILLIQ is the Amihud (2002) illiquidity measure, which is calculated as the average ratio of the absolute daily return to daily dollar volume over the previous month. SIZE is the logarithm of market value of equity at the end of the previous year. TURN is the logarithm of the average monthly turnover divided by the number of shares outstanding from over the previous three years, and CVTURN, is the logarithm of the coefficient of variation of turnover. RET-1 is the percentage return of stock i in excess of the one-month T-bill rate over the previous month. STD is the daily return standard deviation of stock i over the previous year. SPREAD-1 is the average bid-ask spread of stock i in the previous month.
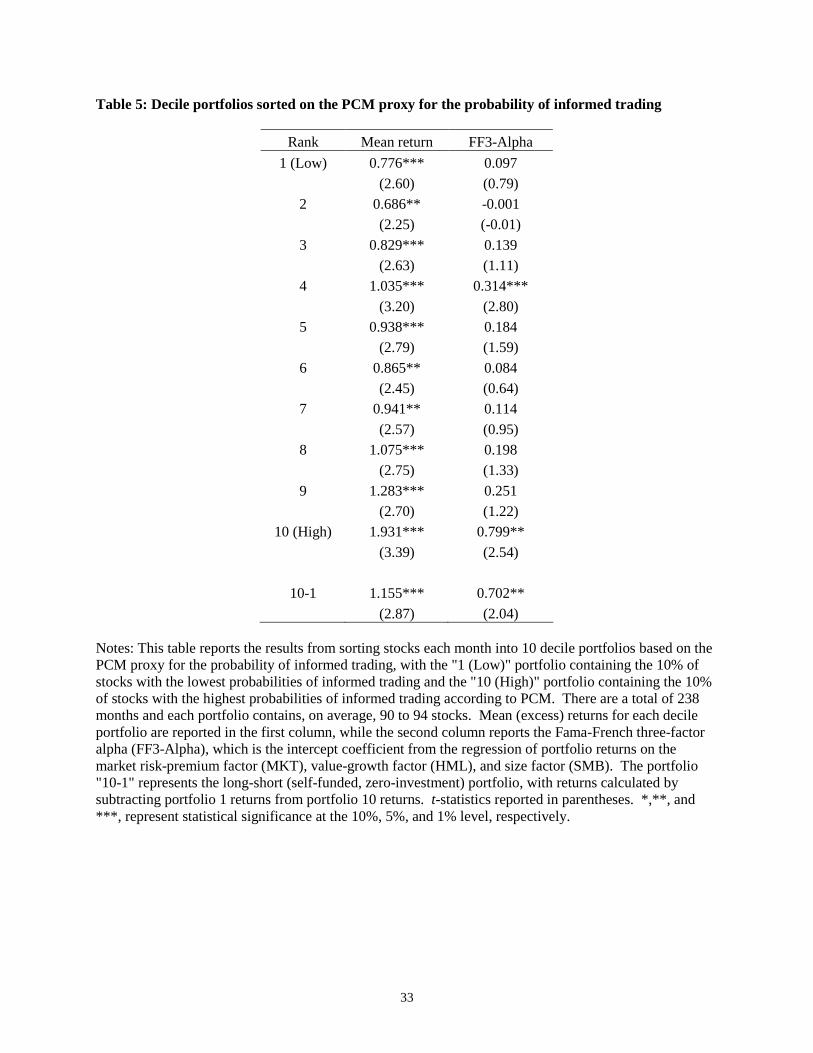
33
Table 5: Decile portfolios sorted on the PCM proxy for the probability of informed trading
Rank Mean return FF3-Alpha 1 (Low) 0.776*** 0.097
(2.60) (0.79) 2 0.686** -0.001 (2.25) (-0.01) 3 0.829*** 0.139 (2.63) (1.11) 4 1.035*** 0.314*** (3.20) (2.80) 5 0.938*** 0.184 (2.79) (1.59) 6 0.865** 0.084 (2.45) (0.64) 7 0.941** 0.114 (2.57) (0.95) 8 1.075*** 0.198 (2.75) (1.33) 9 1.283*** 0.251 (2.70) (1.22)
10 (High) 1.931*** 0.799** (3.39) (2.54)
10-1 1.155*** 0.702** (2.87) (2.04)
Notes: This table reports the results from sorting stocks each month into 10 decile portfolios based on the PCM proxy for the probability of informed trading, with the "1 (Low)" portfolio containing the 10% of stocks with the lowest probabilities of informed trading and the "10 (High)" portfolio containing the 10% of stocks with the highest probabilities of informed trading according to PCM. There are a total of 238 months and each portfolio contains, on average, 90 to 94 stocks. Mean (excess) returns for each decile portfolio are reported in the first column, while the second column reports the Fama-French three-factor alpha (FF3-Alpha), which is the intercept coefficient from the regression of portfolio returns on the market risk-premium factor (MKT), value-growth factor (HML), and size factor (SMB). The portfolio "10-1" represents the long-short (self-funded, zero-investment) portfolio, with returns calculated by subtracting portfolio 1 returns from portfolio 10 returns. t-statistics reported in parentheses. *,**, and ***, represent statistical significance at the 10%, 5%, and 1% level, respectively.
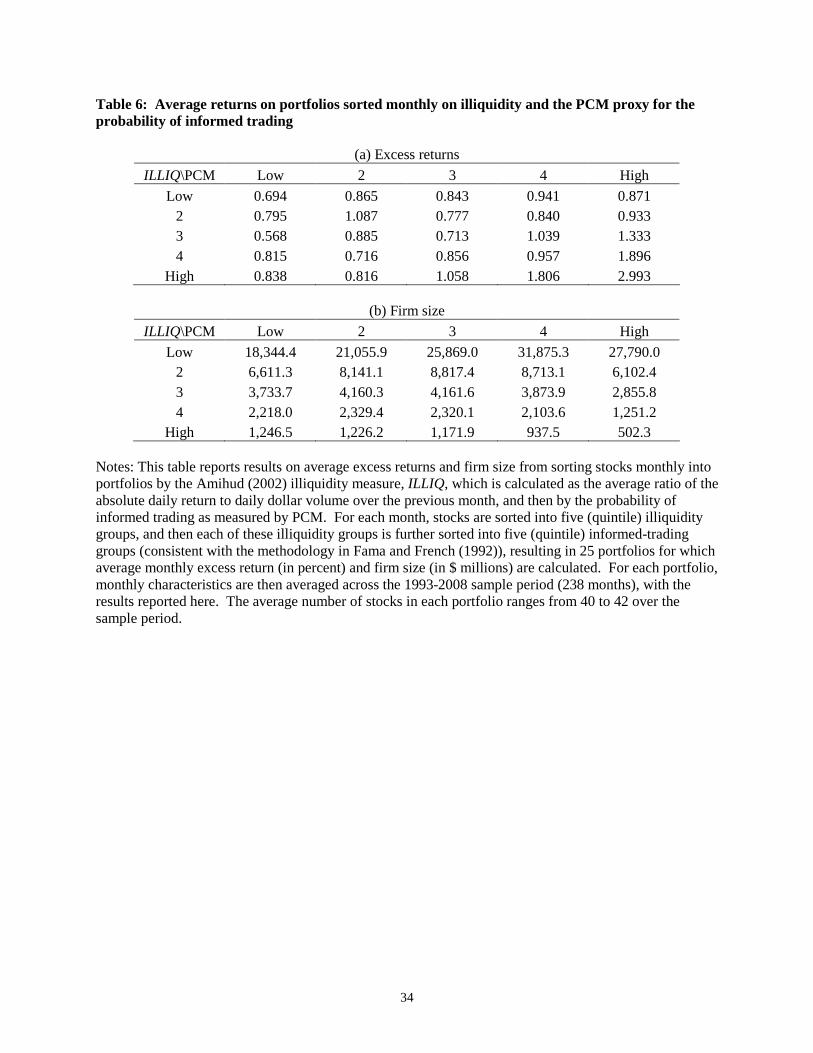
34
Table 6: Average returns on portfolios sorted monthly on illiquidity and the PCM proxy for the probability of informed trading
(a) Excess returns
ILLIQ\PCM Low 2 3 4 High Low 0.694 0.865 0.843 0.941 0.871
2 0.795 1.087 0.777 0.840 0.933 3 0.568 0.885 0.713 1.039 1.333 4 0.815 0.716 0.856 0.957 1.896
High 0.838 0.816 1.058 1.806 2.993
(b) Firm size
ILLIQ\PCM Low 2 3 4 High Low 18,344.4 21,055.9 25,869.0 31,875.3 27,790.0
2 6,611.3 8,141.1 8,817.4 8,713.1 6,102.4 3 3,733.7 4,160.3 4,161.6 3,873.9 2,855.8 4 2,218.0 2,329.4 2,320.1 2,103.6 1,251.2
High 1,246.5 1,226.2 1,171.9 937.5 502.3 Notes: This table reports results on average excess returns and firm size from sorting stocks monthly into portfolios by the Amihud (2002) illiquidity measure, ILLIQ, which is calculated as the average ratio of the absolute daily return to daily dollar volume over the previous month, and then by the probability of informed trading as measured by PCM. For each month, stocks are sorted into five (quintile) illiquidity groups, and then each of these illiquidity groups is further sorted into five (quintile) informed-trading groups (consistent with the methodology in Fama and French (1992)), resulting in 25 portfolios for which average monthly excess return (in percent) and firm size (in $ millions) are calculated. For each portfolio, monthly characteristics are then averaged across the 1993-2008 sample period (238 months), with the results reported here. The average number of stocks in each portfolio ranges from 40 to 42 over the sample period.
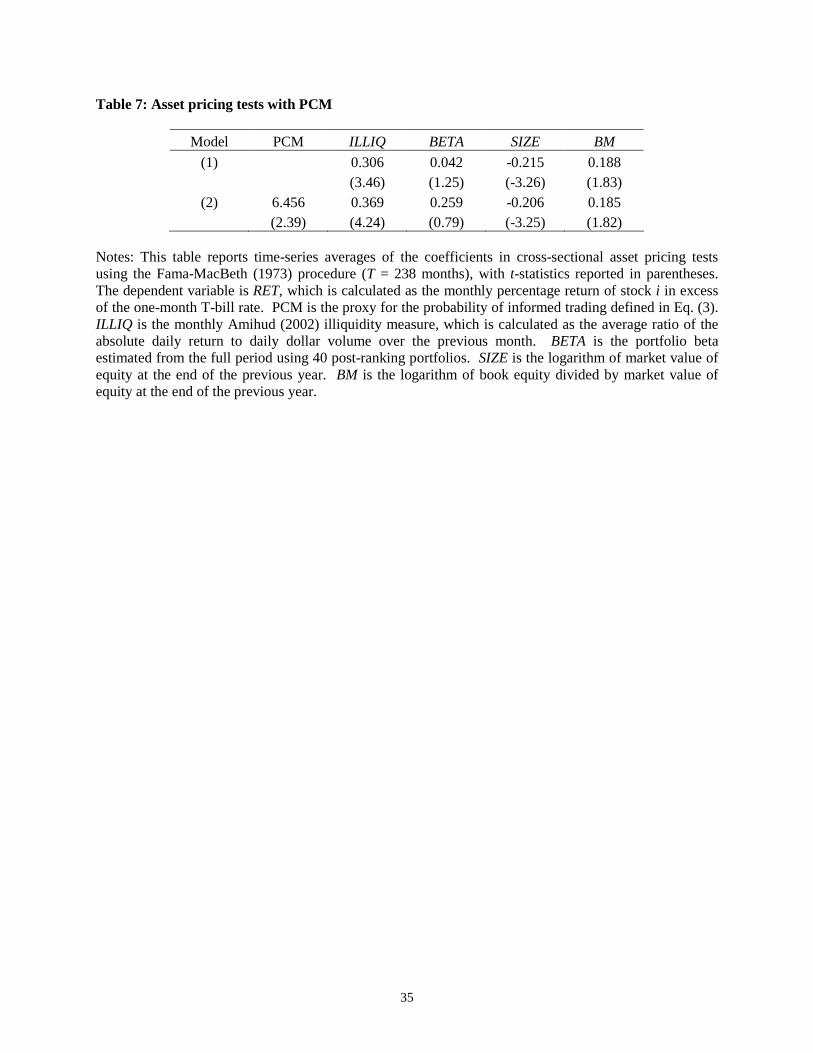
35
Table 7: Asset pricing tests with PCM
Model PCM ILLIQ BETA SIZE BM (1) 0.306 0.042 -0.215 0.188 (3.46) (1.25) (-3.26) (1.83)
(2) 6.456 0.369 0.259 -0.206 0.185 (2.39) (4.24) (0.79) (-3.25) (1.82)
Notes: This table reports time-series averages of the coefficients in cross-sectional asset pricing tests using the Fama-MacBeth (1973) procedure (T = 238 months), with t-statistics reported in parentheses. The dependent variable is RET, which is calculated as the monthly percentage return of stock i in excess of the one-month T-bill rate. PCM is the proxy for the probability of informed trading defined in Eq. (3). ILLIQ is the monthly Amihud (2002) illiquidity measure, which is calculated as the average ratio of the absolute daily return to daily dollar volume over the previous month. BETA is the portfolio beta estimated from the full period using 40 post-ranking portfolios. SIZE is the logarithm of market value of equity at the end of the previous year. BM is the logarithm of book equity divided by market value of equity at the end of the previous year.
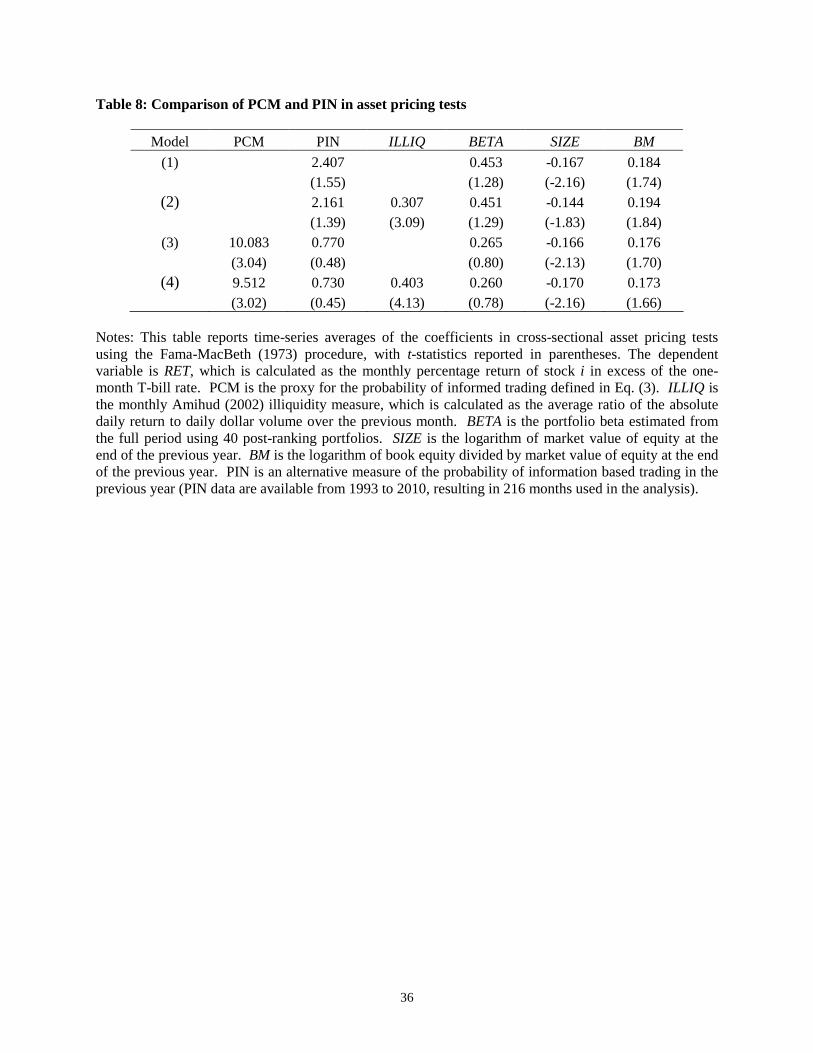
36
Table 8: Comparison of PCM and PIN in asset pricing tests
Model PCM PIN ILLIQ BETA SIZE BM (1) 2.407 0.453 -0.167 0.184 (1.55) (1.28) (-2.16) (1.74)
(2) 2.161 0.307 0.451 -0.144 0.194 (1.39) (3.09) (1.29) (-1.83) (1.84)
(3) 10.083 0.770 0.265 -0.166 0.176 (3.04) (0.48) (0.80) (-2.13) (1.70)
(4) 9.512 0.730 0.403 0.260 -0.170 0.173 (3.02) (0.45) (4.13) (0.78) (-2.16) (1.66)
Notes: This table reports time-series averages of the coefficients in cross-sectional asset pricing tests using the Fama-MacBeth (1973) procedure, with t-statistics reported in parentheses. The dependent variable is RET, which is calculated as the monthly percentage return of stock i in excess of the one-month T-bill rate. PCM is the proxy for the probability of informed trading defined in Eq. (3). ILLIQ is the monthly Amihud (2002) illiquidity measure, which is calculated as the average ratio of the absolute daily return to daily dollar volume over the previous month. BETA is the portfolio beta estimated from the full period using 40 post-ranking portfolios. SIZE is the logarithm of market value of equity at the end of the previous year. BM is the logarithm of book equity divided by market value of equity at the end of the previous year. PIN is an alternative measure of the probability of information based trading in the previous year (PIN data are available from 1993 to 2010, resulting in 216 months used in the analysis).
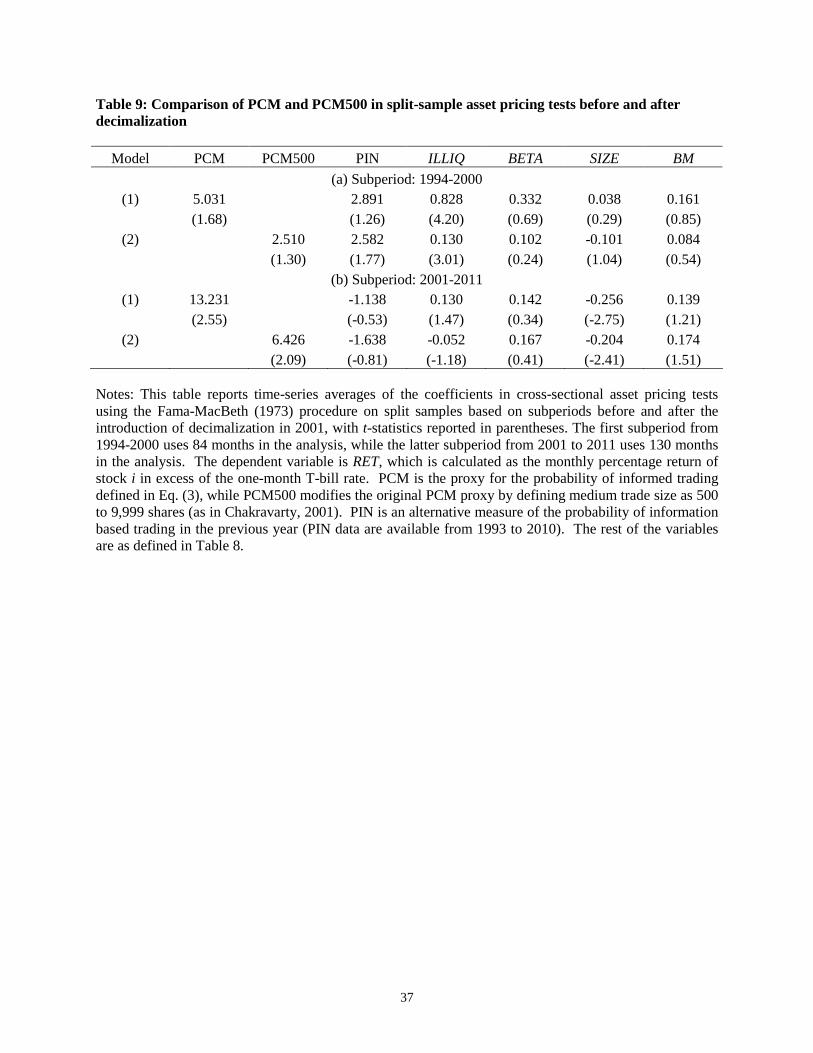
37
Table 9: Comparison of PCM and PCM500 in split-sample asset pricing tests before and after decimalization
Model PCM PCM500 PIN ILLIQ BETA SIZE BM (a) Subperiod: 1994-2000
(1) 5.031 2.891 0.828 0.332 0.038 0.161 (1.68) (1.26) (4.20) (0.69) (0.29) (0.85)
(2) 2.510 2.582 0.130 0.102 -0.101 0.084 (1.30) (1.77) (3.01) (0.24) (1.04) (0.54)
(b) Subperiod: 2001-2011 (1) 13.231 -1.138 0.130 0.142 -0.256 0.139 (2.55) (-0.53) (1.47) (0.34) (-2.75) (1.21)
(2) 6.426 -1.638 -0.052 0.167 -0.204 0.174 (2.09) (-0.81) (-1.18) (0.41) (-2.41) (1.51)
Notes: This table reports time-series averages of the coefficients in cross-sectional asset pricing tests using the Fama-MacBeth (1973) procedure on split samples based on subperiods before and after the introduction of decimalization in 2001, with t-statistics reported in parentheses. The first subperiod from 1994-2000 uses 84 months in the analysis, while the latter subperiod from 2001 to 2011 uses 130 months in the analysis. The dependent variable is RET, which is calculated as the monthly percentage return of stock i in excess of the one-month T-bill rate. PCM is the proxy for the probability of informed trading defined in Eq. (3), while PCM500 modifies the original PCM proxy by defining medium trade size as 500 to 9,999 shares (as in Chakravarty, 2001). PIN is an alternative measure of the probability of information based trading in the previous year (PIN data are available from 1993 to 2010). The rest of the variables are as defined in Table 8.
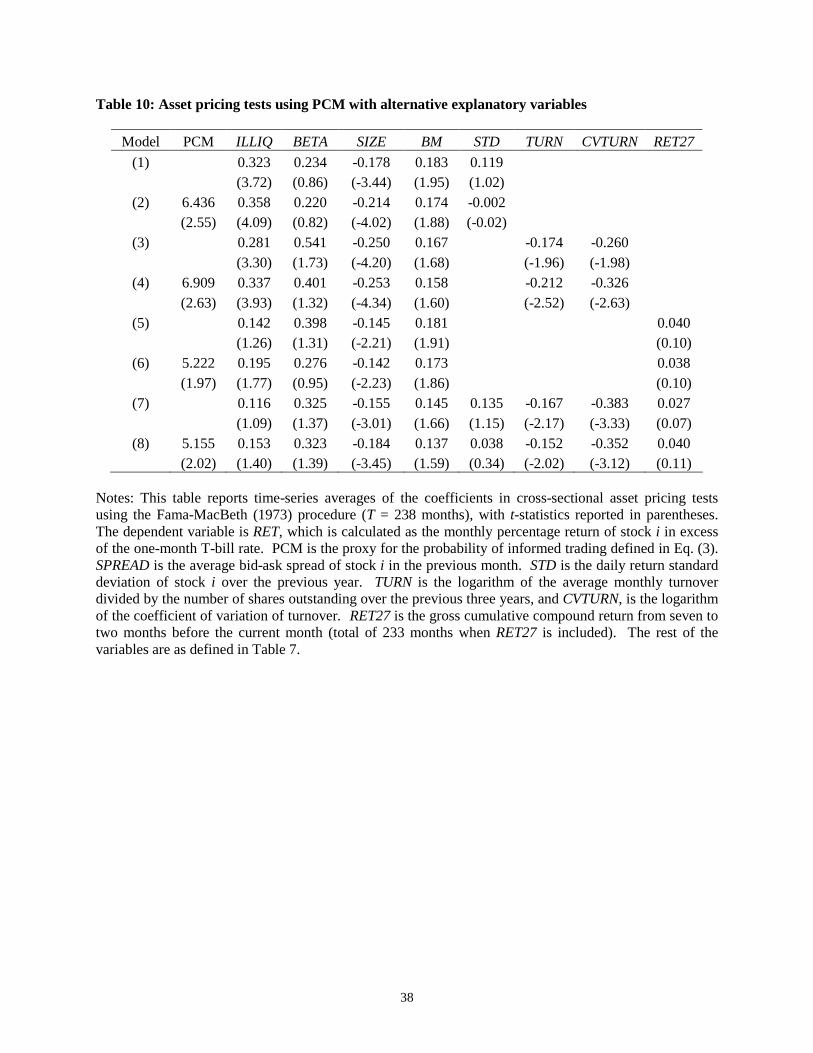
38
Table 10: Asset pricing tests using PCM with alternative explanatory variables
Model PCM ILLIQ BETA SIZE BM STD TURN CVTURN RET27 (1) 0.323 0.234 -0.178 0.183 0.119 (3.72) (0.86) (-3.44) (1.95) (1.02)
(2) 6.436 0.358 0.220 -0.214 0.174 -0.002 (2.55) (4.09) (0.82) (-4.02) (1.88) (-0.02)
(3) 0.281 0.541 -0.250 0.167 -0.174 -0.260 (3.30) (1.73) (-4.20) (1.68) (-1.96) (-1.98)
(4) 6.909 0.337 0.401 -0.253 0.158 -0.212 -0.326 (2.63) (3.93) (1.32) (-4.34) (1.60) (-2.52) (-2.63)
(5) 0.142 0.398 -0.145 0.181 0.040 (1.26) (1.31) (-2.21) (1.91) (0.10)
(6) 5.222 0.195 0.276 -0.142 0.173 0.038 (1.97) (1.77) (0.95) (-2.23) (1.86) (0.10)
(7) 0.116 0.325 -0.155 0.145 0.135 -0.167 -0.383 0.027 (1.09) (1.37) (-3.01) (1.66) (1.15) (-2.17) (-3.33) (0.07)
(8) 5.155 0.153 0.323 -0.184 0.137 0.038 -0.152 -0.352 0.040 (2.02) (1.40) (1.39) (-3.45) (1.59) (0.34) (-2.02) (-3.12) (0.11)
Notes: This table reports time-series averages of the coefficients in cross-sectional asset pricing tests using the Fama-MacBeth (1973) procedure (T = 238 months), with t-statistics reported in parentheses. The dependent variable is RET, which is calculated as the monthly percentage return of stock i in excess of the one-month T-bill rate. PCM is the proxy for the probability of informed trading defined in Eq. (3). SPREAD is the average bid-ask spread of stock i in the previous month. STD is the daily return standard deviation of stock i over the previous year. TURN is the logarithm of the average monthly turnover divided by the number of shares outstanding over the previous three years, and CVTURN, is the logarithm of the coefficient of variation of turnover. RET27 is the gross cumulative compound return from seven to two months before the current month (total of 233 months when RET27 is included). The rest of the variables are as defined in Table 7.
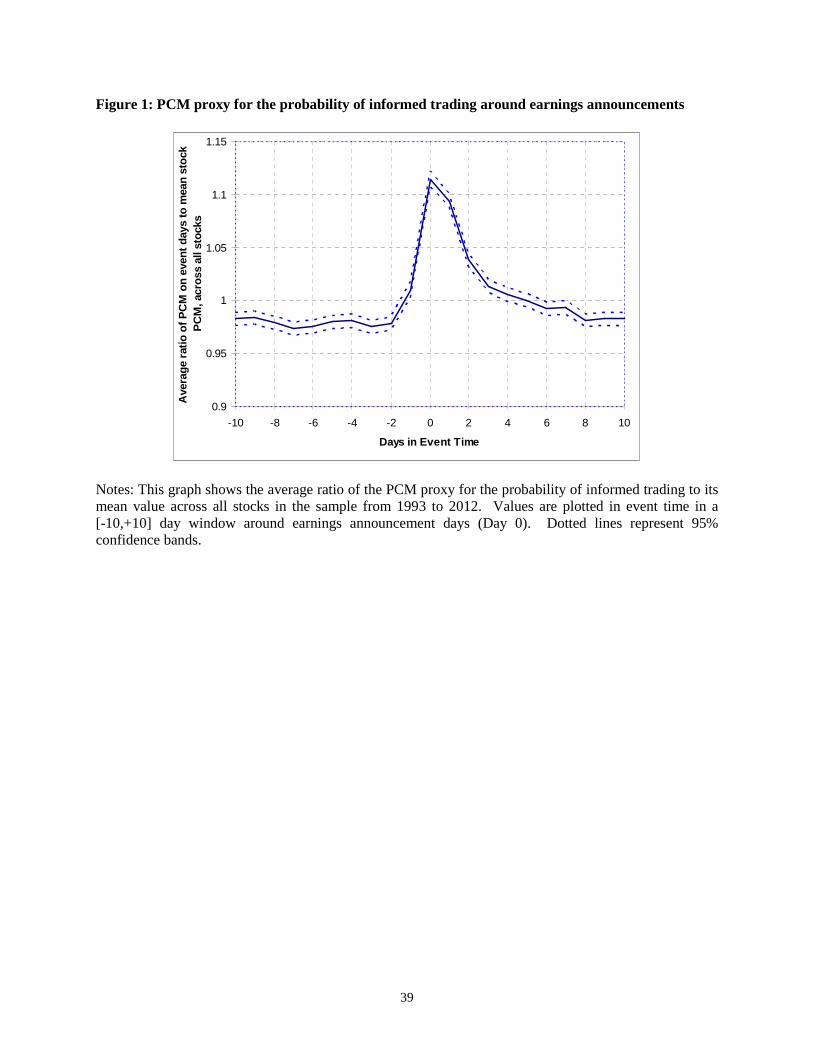
39
Figure 1: PCM proxy for the probability of informed trading around earnings announcements
0.9
0.95
1
1.05
1.1
1.15
-10 -8 -6 -4 -2 0 2 4 6 8 10
Days in Event Time
Ave
rag
e ra
tio
of
PC
M o
n e
ven
t d
ays
to m
ean
sto
ck
PC
M, a
cro
ss a
ll st
ock
s
Notes: This graph shows the average ratio of the PCM proxy for the probability of informed trading to its mean value across all stocks in the sample from 1993 to 2012. Values are plotted in event time in a [-10,+10] day window around earnings announcement days (Day 0). Dotted lines represent 95% confidence bands.
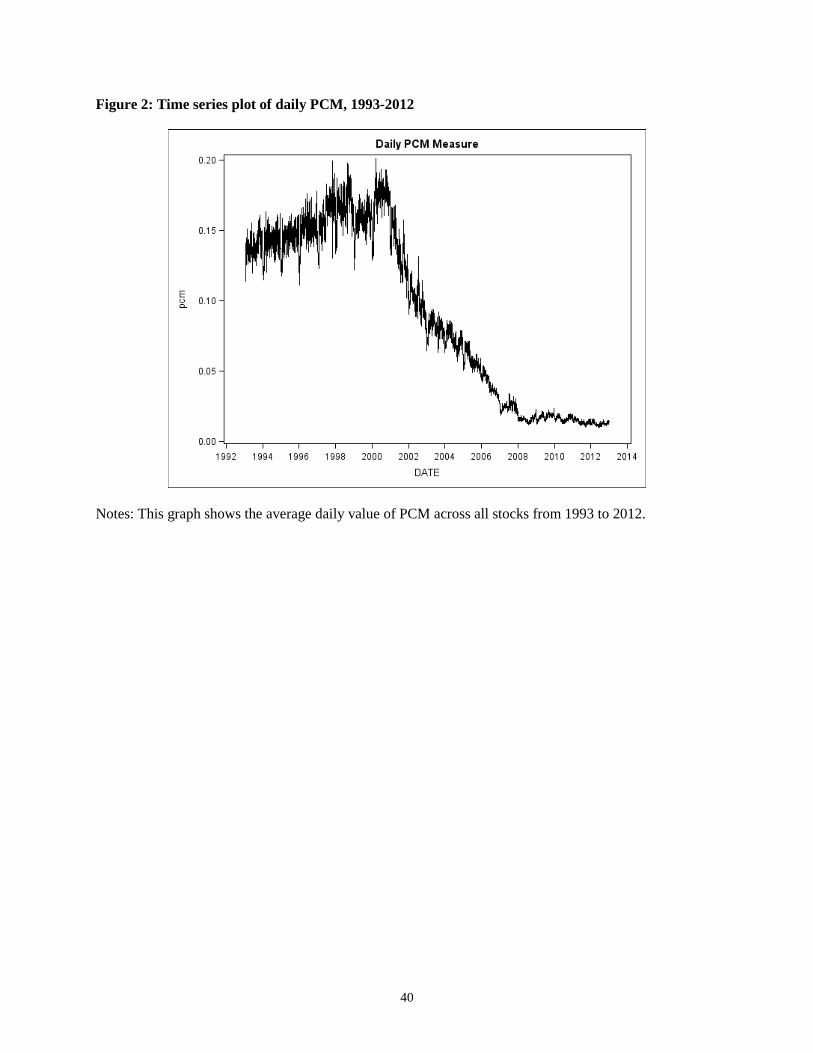
40
Figure 2: Time series plot of daily PCM, 1993-2012
Notes: This graph shows the average daily value of PCM across all stocks from 1993 to 2012.