influence of storage temperature on microbial spoilage characteristics of haddock fillets...
TRANSCRIPT
biology 111 (2006) 112–125www.elsevier.com/locate/ijfoodmicro
International Journal of Food Micro
Influence of storage temperature on microbial spoilage characteristicsof haddock fillets (Melanogrammus aeglefinus) evaluated
by multivariate quality prediction
G. Olafsdottir a,⁎, H.L. Lauzon a, E. Martinsdottir a, K. Kristbergsson b
a Icelandic Fisheries Laboratories, Skulagata 4, 101 Reykjavík, Icelandb University of Iceland, Department of Food Science, Hjardarhagi 6-7, 107 Reykjavík, Iceland
Received 13 July 2005; received in revised form 23 March 2006; accepted 25 April 2006
Abstract
The proliferation of specific spoilage organisms (SSO) and quality changes were evaluated in haddock fillets stored in styrofoam boxes at 0, 7and 15 °C and under temperature fluctuations. A rapid electronic nose technique was used to monitor different classes of compounds, representingmicrobial metabolites that were characteristic for the onset of spoilage odors. Photobacterium phosphoreum predominated among the spoilagebacteria and high levels of TVB-N were observed at sensory rejection. Pseudomonas spp. appeared to be responsible for the development ofsweet, fruity spoilage odors in haddock fillets coinciding with increasing response of the electronic nose CO sensor. H2S-producing bacteria, mostlikely Shewanella putrefaciens, were associated with the H2S sensor's response at abusive temperature conditions. Partial Least SquaresRegression (PLSR) was used as an explorative tool to provide a better understanding of the spoilage potential of SSOs, by evaluating modelsbased on electronic nose responses and counts of specific spoilage organisms to predict sensory quality (Torry scores). The best prediction of thesensory quality was obtained by PLSR models based on five variables: the electronic nose sensors (CO, NH3 and H2S), pseudomonads counts anda time–temperature variable. Good agreement between the predicted and experimental data indicates that these variables characterize the sensoryquality of haddock fillets stored under different temperatures.© 2006 Elsevier B.V. All rights reserved.
Keywords: Specific spoilage organisms; Electronic nose; Fish quality; Sensory analysis; TVB-N; PLSR; DMFit; SSSP
1. Introduction
Export of fresh fish as fillets from Iceland to the markets inEurope and in the USA has become increasingly important inrecent years, while the export of whole fish in ice has declined. Itis well documented that packed fillets spoil more rapidly andhave different spoilage pattern than whole fish (Lindsay et al.,1986; Jørgensen et al., 1988; Huss, 1995; Lauzon et al., 2002).Consequently, the vested interest of the industry partners is tomaintain the freshness of the fish fillets, by optimal handling andtransport conditions to ensure the high quality of the products onthe market. Temperature control during all stages of theproduction and in the distribution chain is emphasized in guide-
⁎ Corresponding author. Tel.: +354 5308600; fax: +354 5308601.E-mail address: [email protected] (G. Olafsdottir).
0168-1605/$ - see front matter © 2006 Elsevier B.V. All rights reserved.doi:10.1016/j.ijfoodmicro.2006.04.045
lines on good manufacturing practices. However, temperaturefluctuations can occur in the production or in the distributionchain because of unforeseeable events such as improper icing ofthe raw material or delays in transport. In this case the rate of thedeteriorative changes occurring in fish caused by microbialgrowth and oxidative changes will be influenced and therefore,the information on storage days or days from catch will not bereliable to determine the actual quality (Botta et al., 1987; Huss,1995).
Recent developments in sensor technologies and dataanalysis procedures have stimulated interests to develop rapidtechniques to detect postmortem quality changes in muscle food(Olafsdottir et al., 1997a, 2004; Ellis and Goodacre, 2001). Foraccurate evaluation of quality no single index can encompassall the complex changes occurring during spoilage of fish(Martin et al., 1978) and therefore a multisensor concept has

113G. Olafsdottir et al. / International Journal of Food Microbiology 111 (2006) 112–125
been introduced based on simultaneous instrumental analysis ofvarious sensory related attributes (Olafsdottir et al., 2004).
The detection of specific spoilage organisms (SSO) like She-wanella putrefaciens, Pseudomonas ssp. and Photobacteriumphosphoreum is considered more reliable than total viable counts(TVC) to accurately evaluate the freshness or spoilage level of fishproducts (Dalgaard, 2000; Gram et al., 2002). The potential of H2S-producing organisms, like S. putrefaciens, to develop sulfurcompounds contributing to off-flavor described as onion, cabbageand putrid spoilage odors at advanced stages of storage in fish iswell known (Miller et al., 1973a; Herbert et al., 1975). S.putrefaciens has been identified as the main SSO in whole cod(Herbert and Shewan, 1976; Jørgensen et al., 1988) as well as inaerobically stored haddock fillets (Levin, 1968; Chai et al., 1971).Development of ammonia-like and ‘fishy’ off-flavors has beenrelated to fish spoilage bacteria like S. putrefaciens and P.phosphoreum that can reduce TMAO to TMA (Jørgensen andHuss, 1989; Dalgaard, 1995). P. phosphoreumwas identified as animportant TMA producer in iced cod and in cod fillets (VanSpreekens, 1974; Van Spreekens and Toepoel, 1981) and has beensuggested as the main spoilage organism in packed cod fillets,although this bacterium does not produce intensive off odors(Dalgaard et al., 1993; Dalgaard, 1995). Other well known spoilagebacteria likePseudomonas spp. do not produce TMA from TMAO(Castell et al., 1959). Earlier studies on the formation of odorousdegradation compounds in fish (cod, haddock and rockfish) fromthe North Atlantic area showed that pseudomonads, in particular P.fragi, were responsible for quality changes and development ofsweet, fruity off odors in chilled fish (Castell andGreenough, 1957;Castell et al., 1959; Miller et al., 1973b). More recently theimportance of pseudomonads in spoilage in fish species from theMediterranean Sea (Koutsoumanis and Nychas, 1999) andAmerican plaice (Lauzon, 2000) has been reported. Growth ofpseudomonads species was modeled as a function of storage timeand correlated well with organoleptical shelf-life in Mediterraneanspecies (Koutsoumanis and Nychas, 2000).
Predictive microbiology as a tool to study the microbialecology in food has gained considerable interest (Ross and Mc-Meekin, 1994). Kinetic models based on the Arrhenius equationhave been developed to describe the relationship between tem-perature and relative spoilage rate for muscle foods. Recentlymodels based on enumeration of specific spoilage organisms(SSO) to determine the remaining shelf-life of fish products havebeen developed (Dalgaard et al., 1997a; Koutsoumanis andNychas, 2000; Koutsoumanis, 2001; Dalgaard, 2002). Com-parison of the chemical profiles of spoiled seafoods and of themetabolites produced by potential spoilage organisms has onlybeen used to a limited extent for characterization of SSOs (Gramand Dalgaard, 2002). More knowledge on the chemical charac-terization of spoilage processes of muscle food and their corre-lations with sensory and microbiological changes is needed(Dainty, 1996). Multi-compound indices based on gas chroma-tography analysis of the main compounds produced by bacteriaduring spoilage have been suggested to evaluate the complexchanges occurring in fish products stored under different con-ditions (Lindsay et al., 1986; Olafsdottir and Fleurence, 1998;Jørgensen et al., 2000, 2001; Olafsdottir et al., 2005).
Detection of microbial metabolites would be useful as analternative or supporting information to microbial enumerationto use in models for a more rapid evaluation of the quality andshelf-life of fish products. Electronic noses based on selectivedetection of the main classes of volatile compounds producedcontributing to the spoilage odor, like amines, sulfur com-pounds, alcohols, aldehydes and esters, can be used to measurequality changes in fish in a rapid way (Olafsdottir et al., 1997b,2000, 2002, 2003; Di Natale et al., 2001).
The data presented herein is from two storage experiments ofhaddock fillets performed in the years 2001 and 2003. The differenttemperature conditions during storage were selected to study theinfluence of abusive conditions on the proliferation of the micro-flora. The objective was to characterize spoilage in haddock filletsand determine the spoilage domain of the specific spoilage bacteriaby studying their growth and production of spoilage metabolitesunder a range of temperature conditions. The maximum potentialgrowth rate of the SSOs was evaluated by using the curve fittingmodel DMFit (Baranyi and Roberts, 1994). Partial least squaresregression (PLSR) models were used to explore the spoilagepotential of the microflora by studying the correlation of SSOs,volatile compounds measured by an electronic nose, TVB-N andsensory analysis. Determination of the end of shelf-life based onsensory analysis was compared to the estimation of shelf-life basedon the currently available SSSP model.
2. Materials and methods
2.1. Storage experiments of haddock fillets at constantenvironmental temperatures — 2001
The fish was caught by longline in November 2001 in fishinggrounds Southwest of Iceland. The average seawater tempera-ture was around 8 °C. The fish was iced and stored ungutted onboard and received at the processing factory within 12 h fromcatch. After gutting, filleting and skinning, the fillets werepackaged in styrofoam (EPS, expanded polystyrene) boxes linedwith a plastic bag and an adsorbing pad at the bottom. Each box(110×400×263 mm) contained 11 fillets and a cooling mat wasplaced on top. The boxes were transported to the laboratory andstored at different temperatures (0, 7 and 15 °C) until sensoryrejection. Analyses of duplicate samples were performed ondays 1, 3, 5, 7, 10 and 14 after catch for samples stored at 0 °C.Because ofmore rapid spoilage at higher temperatures additionalsamples were taken on day 2 for groups stored at 7 and 15 °C andthe last sampling days were on days 7 and 4, respectively.
2.2. Storage experiments of haddock fillets at fluctuatingenvironmental temperatures — 2003
Additional storage experiments were conducted in November2003 on haddock fillets obtained from the same factory as in 2001to collect further data to study the influence of fluctuatingtemperatures during storage. The fish was caught by longlineclose to Sandgerði, Southwest of Iceland. The average seawa-ter temperature was around 8 °C in November. The fish wastransported the same day to the factorywhere it was stored ungutted
114 G. Olafsdottir et al. / International Journal of Food Microbiology 111 (2006) 112–125
in ice slurry overnight and processed traditionally at the factory thefollowing day. The fish was then hand filleted and cooled in ice-water before being skinned in a machine and packed in plastic bagsin the styrofoam boxes as before and transported to the laboratorythe same day. Two groups of samples were prepared (“0 °C a” and“0 °C + abuse”). Both sample groups were initially stored at 0 to1 °C, but on the fourth day post-catch, group “0 °C + abuse” wastransferred from the cooler and stored overnight (16 h) at roomtemperature (RT) and then moved back to the cooler. The firstsamples were taken on the day following processing (2 day post-catch). Samples were analyzed regularly until sensory rejection:group “0 °C a” on days 2, 4, 7, 9 and 11 post-catch; group “0 °C +abuse” on days 2, 4, 5, 7 and 9 post-catch.
At each day of sampling duplicate analyses were done usingone box containing 11 fillets for the various analyses. Four filletswere used for sensory analysis. Another four fillets were pooledinto 2 samples and used for microbial analysis (TVC and SSOcounts), chemical analysis of total volatile bases (TVB-N) andpH. Three fillets were then used for the analysis of volatilecompounds with an electronic nose with electrochemical sensors.
2.3. Temperature recording
Temperature data loggers were used in the experiments(Stow Away®, Onset Computer Corporation, Bourne, Mass.,USA) to monitor the temperature of the fillets and the ambientstorage environment. The loggers were located underneath andabove the fillets inside the styrofoam boxes, i.e. one box foreach temperature treatment, and on top of the box to follow theenvironmental variations of each storage condition. Tempera-ture recordings were at 5 min intervals. Data is only shown fromloggers located underneath the fillets.
2.4. Sensory analysis
Sensory analysis to evaluate the freshness of the fillets wasperformed by 8–12 previously trained panelists from the IFLsensory panel (age range 25 to 65 years), both female and male.They were all trained according to international standards (ISO,1993) for evaluation of different seafood, including detectionand recognition of tastes and odors by use of scales anddescriptors. The Torry scheme (Shewan et al., 1953) was used toassess the freshness (odor and flavor) of cooked fish. Thescheme ranges from 10 = very fresh to 3 = very spoiled, with arejection level at 5.5. Fish from each sampling group wasportioned into an aluminium box and cooked in a steam oven(98 to 100 °C for 5 min). Samples were anonymously coded andassessed in duplicate. A computerized system (FIZZ, Version2.0, 1994–2000, Biosystèmes, Couternon, France) was used fordata recording and for further data processing. Average scoresof the judges were calculated for each sample assessed and thereported value was the average of the duplicate samples.
2.5. Microbiological evaluation
Fillets were aseptically minced, pooling 2 fillets for eachsample. Twenty-five grams of minced flesh were mixed with
225 mL of cooledMaximum Recovery Diluent (MRD, Oxoid) ina stomacher for 1 min. Successive 10-fold dilutions were made asrequired. Total viable psychrotrophic counts (TVC, 15 °C) wereevaluated by spread-plating aliquots onto modified Long andHammer's medium; while counts of H2S-producing bacteria andpresumptive pseudomonadswere evaluated on spread-plated IronAgar (15 °C) and modified CFC medium (22 °C), respectively(Lauzon et al., 2002). Counts of P. phosphoreum were estimatedby using the PPDM-Malthus conductance method (Dalgaardet al., 1996), as described by Lauzon (2003).
2.6. TVB-N and pH measurements
Total volatile basic nitrogen content (TVB-N) was measuredby a steam distillation method described by Malle and Pou-meyrol (1989), using the rest of the flesh mince prepared formicrobiological analysis within 30 min of preparation.
The pHwasmeasured in 5 g of mincemoistened with 5mL ofdeionised water. The pH meter was calibrated using the buffersolutions of pH 7.00±0.01 and 4.01±0.01 (25 °C) (RadiometerAnalytical A/S, Bagsvaerd, Denmark).
2.7. Electronic nose measurements
Electronic nose measurements were performed using a gassensor instrument called “FreshSense”, developed by theIcelandic Fisheries Laboratories and Maritech (Iceland). Theinstrument is based on electrochemical gas sensors (CO, H2S, andSO2: Dräger, Lübeck, Germany; NH3: City Technology, Ports-mouth, United Kingdom). The measurement technique and theaccuracy of the measurements were described earlier byOlafsdottir et al. (1998, 2002). The instrument consisted of a2.3 L closed glass sampling container and a dynamic samplingsystem. Duplicate samples of approximately 500 g of fish filletswere analyzed. The samplesweremaintained at room temperaturebefore the measurements started, for about 15 to 30 min or untilthey reached 8 to 12 °C. Measurements were taken every 10 s for5 min. The reported value (current) is the average of the last threemeasurements of the 5 min measurement cycle minus the averageof three values before the measurement starts.
2.8. Data analysis
Microsoft Excel 97 was used for data processing, to calculatemeans and standard deviations for all multiple measurementsand to generate graphs.
Analysis of variance (ANOVA) was applied to the sensory,chemical and electronic nose data using the Number CruncherStatistical Software (NCSS 2000, NCSS, Kaysville, Utah, USA).Significant differences were determined by One way ANOVAand Duncan's Multiple-Comparison Test was used to determinethe statistical difference between samples. An effect wasconsidered significant at the 5% level (p<0.05).
Multivariate analysis was performed by the Unscrambler(version 9.1.2, CAMO A/S, Trondheim, Norway). The relation-ships between sensory, microbial, chemical and electronic nosemeasurements were explored by Partial Least Squares Regression

Fig. 1. Temperature profiles of haddock fillets stored in styrofoam boxes at15 °C, 7 °C, 0 °C and 0 °C + temperature abused on day 4 for 16 h. Temperatureloggers located underneath the fillets at the bottom of the boxes.
Fig. 2. Assessment of shelf-life by sensory analysis (Torry) of haddock filletsstored at 0 °C (-▪-), 7 °C (-♦-) and 15 °C (-x-) from the experiment in 2001, andat 0 °C a (-▴-) (traditional process) and 0 °C + abuse (-Δ-) (traditional processand temperature abuse) in 2003.
115G. Olafsdottir et al. / International Journal of Food Microbiology 111 (2006) 112–125
(PLSR). The effect of temperature of fillets and time was alsoincluded as an independent variable by calculating, for allsamples at each sampling day, the accumulative influence oftemperature (T) and time (t): Taccumulative=∑(T−Tmin)×dt; Tmin
was defined as the minimum temperature of fillets in storage.PLSR was performed on the data using average values of
replicates standardized to equal variance (weighting with 1/standard deviation). PLSR models were calculated with micro-bial, chemical and electronic nose variables as X predictors andsensory data as Y response factors (Martens and Martens, 2001).The Jack-knife method (Martens andMartens, 1999) was used todetermine significant variables in X with a significance level of5% ( p<0.05). Outlier detection is built into the Unscramblersoftware and detects samples that are badly described by themodels. All models were calculated with full-leave one-out crossvalidation.
The bacterial growth data collected were fitted to determinemaximum specific growth rates (h−1) by using DMFit (http://www.ifr.ac.uk/safety/DMFit/), an in-house program of IFR (UK)which is based on a reparameterized version of the model ofBaranyi and Roberts (1994). DMFit is an Excel add-in program tofit curves where a linear phase is preceded and followed by astationary phase.
The Seafood Spoilage and Safety Predictor (SSSP v. 2.0)software (http://www.dfu.min.dk/micro/sssp) was used to pre-dict the effect of storage temperature on shelf-life of haddockusing the recorded temperature profiles. The SSSP is based onkinetic models for growth of specific spoilage organisms andempirical relative rates of spoilage secondary models (Dalgaardet al., 2002). The S. putrefaciens-like H2S-producing bacteriamodel for aerobically stored fresh fish was used to predict theshelf-life of haddock fillets.
3. Results
Temperature of the fillets was monitored during storage underthe different environmental conditions (Fig. 1). The rapid increase
in temperature at the higher temperature storage is obvious andfillets had reached 14 °C after 1.5 days of storage at 15.1±1.1 °C.The temperature of the fillets stored at 7.2±0.2 °C had increasedto 7 °C within 3 days, while the fillets stored at 0.9±0.3 °C hadcooled down in one day (day 2 from catch). The initial tempe-rature of the fillets was higher in 2001 (∼4 °C) because no coolingof the fillets was employed after filleting and deskinning, whilethe initial temperature of the fillets in 2003 was lower (0.9 to2.3 °C) when the fillets were cooled during processing (Table 2).The temperature of the fillets of sample group “0 °C + abuse”increased gradually to 10 °C in 16 h when stored at room tempe-rature.When the boxeswere transferred back to chilled conditionsit took almost three days to cool the fillets to 0 °C. The thermalinsulating properties of the styrofoam boxes that are commonlyused for export of fillets are obviously important when tempe-rature fluctuates, influencing both the warming and cooling timeof the fish.
3.1. Sensory analysis and shelf-life determination of haddockfillets
The end of shelf-life based on Torry sensory score of 5.5 wasestimated after 13.5 days from catch for samples stored at 0 °C;after 6.5 days when stored at 7 °C and after approximately 4.5 to5 days when stored at 15 °C (Fig. 2). The temperature abusedfillets from the experiments in 2003 had a shorter shelf-life thanthe fillets stored at 0 °C (9 days and 11.5 days, respectively). Thedifferent shelf-life of the fillets stored at 0 °C in the experimentsin 2001 and 2003 (13.5 and 11.5 days, respectively) may becaused by the difference in the initial handling and/or biologicalvariation of the raw material resulting in higher initial bacterialcounts in 2003 (Table 2) and slower bacterial growth in 2001(Fig. 3). Although the seawater temperature was around 8 °C forboth the years 2001 and 2003 in November, it is of interestthat the average seawater temperature in Icelandic waters wasgenerally higher in 2003 than in the year 2001 (http://www.
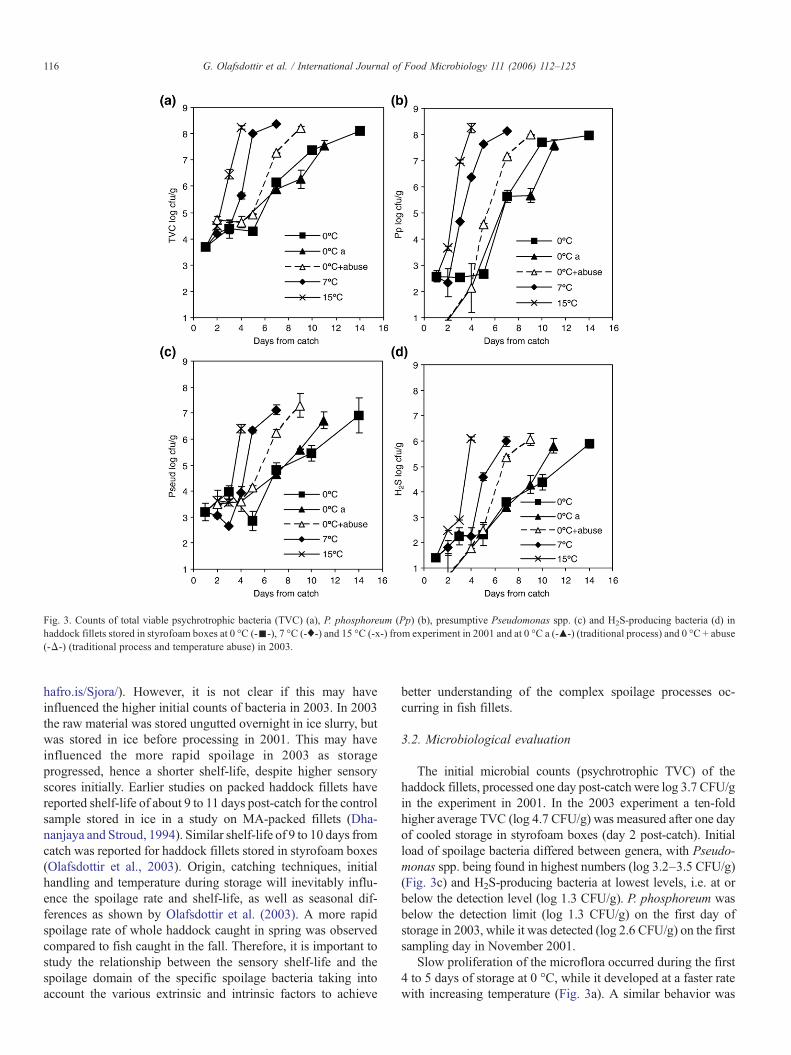
Fig. 3. Counts of total viable psychrotrophic bacteria (TVC) (a), P. phosphoreum (Pp) (b), presumptive Pseudomonas spp. (c) and H2S-producing bacteria (d) inhaddock fillets stored in styrofoam boxes at 0 °C (-▪-), 7 °C (-♦-) and 15 °C (-x-) from experiment in 2001 and at 0 °C a (-▴-) (traditional process) and 0 °C + abuse(-Δ-) (traditional process and temperature abuse) in 2003.
116 G. Olafsdottir et al. / International Journal of Food Microbiology 111 (2006) 112–125
hafro.is/Sjora/). However, it is not clear if this may haveinfluenced the higher initial counts of bacteria in 2003. In 2003the raw material was stored ungutted overnight in ice slurry, butwas stored in ice before processing in 2001. This may haveinfluenced the more rapid spoilage in 2003 as storageprogressed, hence a shorter shelf-life, despite higher sensoryscores initially. Earlier studies on packed haddock fillets havereported shelf-life of about 9 to 11 days post-catch for the controlsample stored in ice in a study on MA-packed fillets (Dha-nanjaya and Stroud, 1994). Similar shelf-life of 9 to 10 days fromcatch was reported for haddock fillets stored in styrofoam boxes(Olafsdottir et al., 2003). Origin, catching techniques, initialhandling and temperature during storage will inevitably influ-ence the spoilage rate and shelf-life, as well as seasonal dif-ferences as shown by Olafsdottir et al. (2003). A more rapidspoilage rate of whole haddock caught in spring was observedcompared to fish caught in the fall. Therefore, it is important tostudy the relationship between the sensory shelf-life and thespoilage domain of the specific spoilage bacteria taking intoaccount the various extrinsic and intrinsic factors to achieve
better understanding of the complex spoilage processes oc-curring in fish fillets.
3.2. Microbiological evaluation
The initial microbial counts (psychrotrophic TVC) of thehaddock fillets, processed one day post-catch were log 3.7 CFU/gin the experiment in 2001. In the 2003 experiment a ten-foldhigher average TVC (log 4.7 CFU/g) was measured after one dayof cooled storage in styrofoam boxes (day 2 post-catch). Initialload of spoilage bacteria differed between genera, with Pseudo-monas spp. being found in highest numbers (log 3.2–3.5 CFU/g)(Fig. 3c) and H2S-producing bacteria at lowest levels, i.e. at orbelow the detection level (log 1.3 CFU/g). P. phosphoreum wasbelow the detection limit (log 1.3 CFU/g) on the first day ofstorage in 2003, while it was detected (log 2.6 CFU/g) on the firstsampling day in November 2001.
Slow proliferation of the microflora occurred during the first4 to 5 days of storage at 0 °C, while it developed at a faster ratewith increasing temperature (Fig. 3a). A similar behavior was

Table 1Maximum specific growth rate (h−1) of different bacterial groups (Pseudomonas spp., P. phosphoreum, S. putrefaciens-like H2S producing bacteria) assessed inhaddock fillets stored in styrofoam boxes under different temperature conditions from experiments in 2001 and 2003 as estimated by DMFit and compared to SSSPvalues for growth rate estimations of S. putrefaciens at constant temperature based on average temperature of fillets
Temperaturea TVC Pseudomonas spp. P. phosphoreum S. putrefaciens
°C DMFit DMFit DMFit DMFit SSSP
2001 — 0 °C NA 0.016 0.012 0.191b 0.033 0.0452003 — 0 °C a 0.2±0.2 0.013 0.022c 0.079 0.053 0.0472003 — 0 °C + abuse 1.7±2.5 0.024 0.047d 0.116 0.081 0.0692001 — 7 °C 6.9±0.8 0.037 0.033 0.105 0.078 0.1752001 — 15 °C 12.0±3.7 0.068 0.048 0.203 0.145 0.325e
aAverage temperature of fillets during storage (temperature recording for 2001 0 °C was not available and a value of 0°C was estimated) initial delay of 105.6 hb,69.6 hc, 60.5 hd, followed by rapid growth.eOut of range of the model (>10 °C).
117G. Olafsdottir et al. / International Journal of Food Microbiology 111 (2006) 112–125
observed for P. phosphoreum (Pp) (Fig. 3b) reaching TVC levelsand dominating the spoilage microflora on day 7 at 0 °C and ondays 3 at 7 and 15 °C. Growth of Pseudomonas spp. (Fig. 3c)and H2S-producing bacteria (Fig. 3d) was slow but steadythroughout the storage period at lower temperature, but theirgrowth accelerated with increasing temperature as expected.Similar maximum specific growth rate was observed for Pseu-domonas spp. and H2S-producing bacteria in the temperaturerange of 0 to 7 °C, as evaluated by DMFit (Table 1). However,because of the higher initial Pseudomonas counts (about 100fold), this bacterial group had reached higher levels at sensoryrejection, ranking it in second place of importance among theSSOs evaluated (Table 2). At 15 °C, larger difference inmaximum specific growth rate was observed among thesegenera, the fastest rate observed for P. phosphoreum (0.203),
Table 2Overview of measured initial values for the microbial, TVB-N, pH, electronic noserejection based on Torry score=5.5, including estimation of shelf-life by TVB-N (35styrofoam boxes from storage experiments in 2001 and 2003 at different temperatur
Initial values Est
2001 2003 200
0 °
Estimated shelf-life:Sensory analysis (Torry score=5.5) a 13.TVB-N (35 mg N/100 g) a 12–Sensory analysis (Torry score=5.5) b 12.SSSP model: H2S-producer counts
b 10Microbial counts:
TVC (log10 CFU/g) 3.7±0.3 4.7±0.0 8.1H2S-producer counts 1.4±0.1 1.3±0.9 5.9% H2S-producers/TVC 0.6
Pseudomonas counts 3.2±0.3 3.5±0.5 6.9% Pseudomonas spp./TVC 6.3
P. phosphoreum counts 2.6±0.2 1.3±0.0 8.0% Pp/TVC 79.
Sensory: Torry score 8.7±0.3 9.0±0.1 5.5TVB-N (mg N/100 g) 14.0±0.1 11.8±0.4 45pH 6.55±0.01 6.68±0.05 6.7Electronic nose: CO sensor 64±19 31±5 280Electronic nose: NH3 sensor <10 <10 <1Electronic nose: H2S sensor 38±6 31±27 52
a Estimated total shelf-life from catch (including time delay between catch and prb Estimated shelf-life after processing.
second for H2S-producing bacteria (0.145) and slowest forPseudomonas spp. (0.048). Temperature abuse of raw materialand processed fillets clearly triggered the development of P.phosphoreum, as well as the other bacterial groups assessed butto a lesser extent (Table 1).
The fact thatP. phosphoreum rapidly reached TVC levels in allsamples and dominated the spoilage microflora suggests that thisbacterium may contribute considerably to the overall spoilage ofaerobically stored haddock fillets. Other workers have reportedthe presence of this bacterium in aerobically spoiled fish (VanSpreekens, 1974; Dalgaard et al., 1997b; Esaiassen et al., 2004).This bacterium has already been reported as the main spoilageorganism in fish packed under modified atmosphere (Dalgaard,1995; Dalgaard et al., 1997b; Emborg et al., 2002). The maxi-mum specific growth rate of pseudomonads and H2S-producing
and sensory data and the estimated values for the experimental data at sensorymg N/100 g) and the SSSP S. putrefaciens model for haddock fillets stored ines and temperature fluctuations
imated values at sensory rejection
1 2003
C 7 °C 15 °C 0 °C a 0 °C + abuse
5 days 6.5 days 4.5 days 11.5 days 9 days13 days 4.5 days 3 days 12–13 days 8 days5 days 5.5 days 3.5 days 10 days 8 daysdays 3.5 days 2 days 10–10.5 days 7 days
8.4 8.2 7.5 8.26 6.1 5.8 6.1
% 0.4% 0.8% 2.4% 0.8%7.1 6.4 6.7 7.3
% 5.0% 1.6% 15.1% 15.2%8.1 8.2 7.5 8.0
4% 50.2% 100% 100% 61.2%5.5 5.5 5.5 5.577 60 27 456.7 6.8 6.7 6.9470 510 730 570
0 40 30 10 28130 92 20 50
ocessing).

118 G. Olafsdottir et al. / International Journal of Food Microbiology 111 (2006) 112–125
bacteria was higher in 2003 than in 2001. Based on their ability toproduce off odors as reported earlier (Castell et al., 1959; Levin,1968; Chai et al., 1971; Miller et al., 1973a,b; Jørgensen et al.,1988), it is suggested that these bacteria, especiallyPseudomonasspp., may have contributed to the characteristic spoilage odors offillets and shorter shelf-life in 2003.
3.3. TVB-N and pH measurements
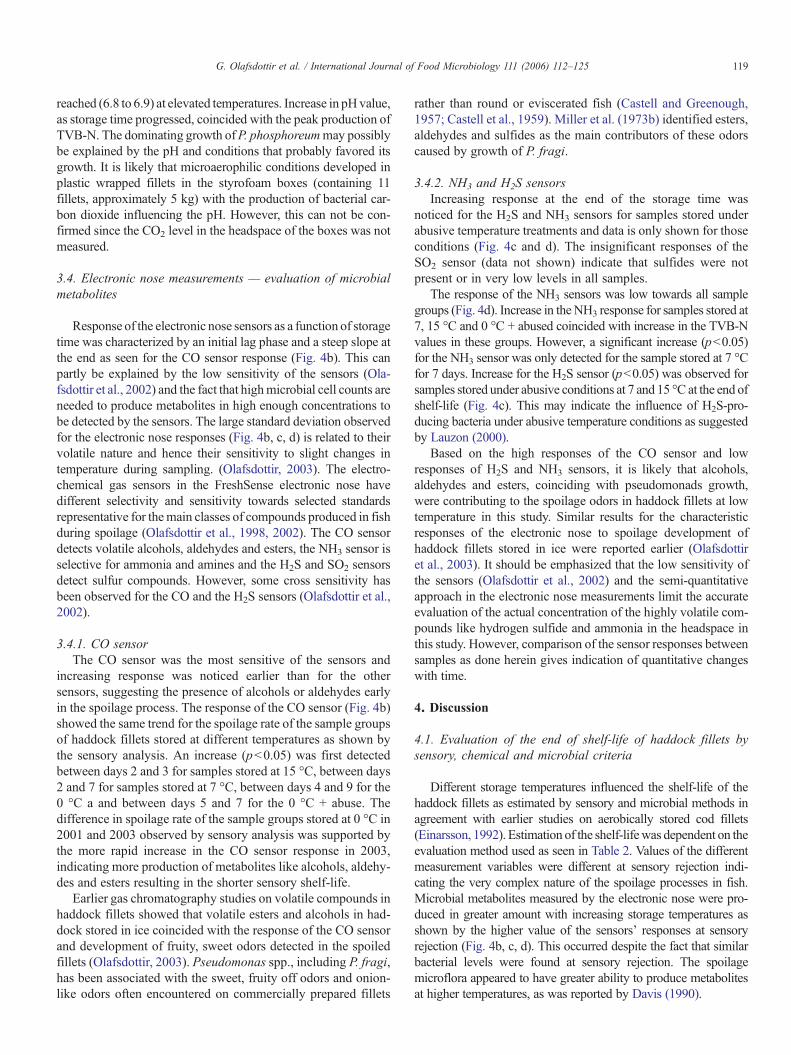
The formation of volatile bases (TVB-N) in the haddock filletsincreased at the end of storage in all sample groups (Fig. 4a).Although large standard deviations for TVB-N were noticed forthe last days of storage, especially for the groups stored at elevatedtemperatures (0 °C + abuse, 7 °C and 15 °C), the increase wassignificant (p<0.05). The influence of the abusive temperaturetreatment on the sample group from 2003 (0 °C + abuse) wasevidenced by a more rapid TVB-N production compared to thesample group stored continuously at 0 °C. Comparison of the
Fig. 4. TVB-N values (a) and electronic nose responses measured by CO sensor (b), H0 °C (-▪-), 7 °C (-♦-) and 15 °C (-x-) from storage experiment in 2001 and at 0 °temperature abuse) in 2003. Only the temperature abused samples are shown for the
TVB-N values obtained for groups stored at 0 °C showed that alower level (p<0.05) was reached in 2003 (27 mg N/100 g) thanin 2001 (45mgN/100 g) at sensory rejection, on days 11 and 13.5,respectively (Table 2). The lower TVB-N value observed in 2003concurred with the lower P. phosphoreum counts reached atsensory rejection (log 7.5 CFU/g) than in 2001 (log 8 CFU/g)(Fig. 3b). Based on the finding of Dalgaard (1995) that P.phosphoreum was a 30 times more active TMA producer than S.putrefaciens it is likely that P. phosphoreum was mainly res-ponsible for the high TVB-N content.
Slight changes were observed in pH of samples during storage(Table 2). The range of pH values measured in the samples was6.5 to 6.9. Lower initial pH values were measured in fillets from2001 (6.5 to 6.6)whichwasmaintained duringmost of the storageperiod, reaching 6.73 on the last sampling day (0 °C). The lowerpH value of the fillets in 2001 may have influenced the extendedshelf-life. An initial pH value of 6.68 was observed in 2003reaching 6.71 at the end of chilled storage. Higher pH values were
2S sensor (c) and NH3 sensor (d) in haddock fillets stored in styrofoam boxes atC a (-▴-) (traditional process) and 0 °C + abuse (-Δ-) (traditional process andH2S and NH3 sensors.
119G. Olafsdottir et al. / International Journal of Food Microbiology 111 (2006) 112–125
reached (6.8 to 6.9) at elevated temperatures. Increase in pHvalue,as storage time progressed, coincided with the peak production ofTVB-N. The dominating growth ofP. phosphoreummay possiblybe explained by the pH and conditions that probably favored itsgrowth. It is likely that microaerophilic conditions developed inplastic wrapped fillets in the styrofoam boxes (containing 11fillets, approximately 5 kg) with the production of bacterial car-bon dioxide influencing the pH. However, this can not be con-firmed since the CO2 level in the headspace of the boxes was notmeasured.
3.4. Electronic nose measurements — evaluation of microbialmetabolites
Response of the electronic nose sensors as a function of storagetime was characterized by an initial lag phase and a steep slope atthe end as seen for the CO sensor response (Fig. 4b). This canpartly be explained by the low sensitivity of the sensors (Ola-fsdottir et al., 2002) and the fact that highmicrobial cell counts areneeded to produce metabolites in high enough concentrations tobe detected by the sensors. The large standard deviation observedfor the electronic nose responses (Fig. 4b, c, d) is related to theirvolatile nature and hence their sensitivity to slight changes intemperature during sampling. (Olafsdottir, 2003). The electro-chemical gas sensors in the FreshSense electronic nose havedifferent selectivity and sensitivity towards selected standardsrepresentative for themain classes of compounds produced in fishduring spoilage (Olafsdottir et al., 1998, 2002). The CO sensordetects volatile alcohols, aldehydes and esters, the NH3 sensor isselective for ammonia and amines and the H2S and SO2 sensorsdetect sulfur compounds. However, some cross sensitivity hasbeen observed for the CO and the H2S sensors (Olafsdottir et al.,2002).
3.4.1. CO sensorThe CO sensor was the most sensitive of the sensors and
increasing response was noticed earlier than for the othersensors, suggesting the presence of alcohols or aldehydes earlyin the spoilage process. The response of the CO sensor (Fig. 4b)showed the same trend for the spoilage rate of the sample groupsof haddock fillets stored at different temperatures as shown bythe sensory analysis. An increase (p<0.05) was first detectedbetween days 2 and 3 for samples stored at 15 °C, between days2 and 7 for samples stored at 7 °C, between days 4 and 9 for the0 °C a and between days 5 and 7 for the 0 °C + abuse. Thedifference in spoilage rate of the sample groups stored at 0 °C in2001 and 2003 observed by sensory analysis was supported bythe more rapid increase in the CO sensor response in 2003,indicating more production of metabolites like alcohols, aldehy-des and esters resulting in the shorter sensory shelf-life.
Earlier gas chromatography studies on volatile compounds inhaddock fillets showed that volatile esters and alcohols in had-dock stored in ice coincided with the response of the CO sensorand development of fruity, sweet odors detected in the spoiledfillets (Olafsdottir, 2003). Pseudomonas spp., including P. fragi,has been associated with the sweet, fruity off odors and onion-like odors often encountered on commercially prepared fillets
rather than round or eviscerated fish (Castell and Greenough,1957; Castell et al., 1959). Miller et al. (1973b) identified esters,aldehydes and sulfides as the main contributors of these odorscaused by growth of P. fragi.
3.4.2. NH3 and H2S sensorsIncreasing response at the end of the storage time was
noticed for the H2S and NH3 sensors for samples stored underabusive temperature treatments and data is only shown for thoseconditions (Fig. 4c and d). The insignificant responses of theSO2 sensor (data not shown) indicate that sulfides were notpresent or in very low levels in all samples.
The response of the NH3 sensors was low towards all samplegroups (Fig. 4d). Increase in theNH3 response for samples stored at7, 15 °C and 0 °C + abused coincided with increase in the TVB-Nvalues in these groups. However, a significant increase (p<0.05)for the NH3 sensor was only detected for the sample stored at 7 °Cfor 7 days. Increase for the H2S sensor (p<0.05) was observed forsamples stored under abusive conditions at 7 and 15 °C at the end ofshelf-life (Fig. 4c). This may indicate the influence of H2S-pro-ducing bacteria under abusive temperature conditions as suggestedby Lauzon (2000).
Based on the high responses of the CO sensor and lowresponses of H2S and NH3 sensors, it is likely that alcohols,aldehydes and esters, coinciding with pseudomonads growth,were contributing to the spoilage odors in haddock fillets at lowtemperature in this study. Similar results for the characteristicresponses of the electronic nose to spoilage development ofhaddock fillets stored in ice were reported earlier (Olafsdottiret al., 2003). It should be emphasized that the low sensitivity ofthe sensors (Olafsdottir et al., 2002) and the semi-quantitativeapproach in the electronic nose measurements limit the accurateevaluation of the actual concentration of the highly volatile com-pounds like hydrogen sulfide and ammonia in the headspace inthis study. However, comparison of the sensor responses betweensamples as done herein gives indication of quantitative changeswith time.
4. Discussion
4.1. Evaluation of the end of shelf-life of haddock fillets bysensory, chemical and microbial criteria
Different storage temperatures influenced the shelf-life of thehaddock fillets as estimated by sensory and microbial methods inagreement with earlier studies on aerobically stored cod fillets(Einarsson, 1992). Estimation of the shelf-lifewas dependent on theevaluation method used as seen in Table 2. Values of the differentmeasurement variables were different at sensory rejection indi-cating the very complex nature of the spoilage processes in fish.Microbial metabolites measured by the electronic nose were pro-duced in greater amount with increasing storage temperatures asshown by the higher value of the sensors' responses at sensoryrejection (Fig. 4b, c, d). This occurred despite the fact that similarbacterial levels were found at sensory rejection. The spoilagemicroflora appeared to have greater ability to produce metabolitesat higher temperatures, as was reported by Davis (1990).

Fig. 5. PLSR correlation loadings based on all the measured variables: microbial(TVC, pseudomonads, H2S counts), Photobacterium phosphoreum (PP),chemical (TVB-N, pH) and electronic nose (CO, NH3, SO2 and H2S sensors)and Tacc as predictors for the Torry scores as a response variable for the haddocksamples stored at different temperatures. The outer and the inner ellipses indicate100% and 50% explained variance, respectively. Significant variables aresymbolized with small circles.
120 G. Olafsdottir et al. / International Journal of Food Microbiology 111 (2006) 112–125
4.1.1. TVB-NBased on the fixed TVB-N limit (35 mg N/100 g) as quoted in
the EU regulations for gadoids (European Union, 1995) a slightlyshorter shelf-lifewas estimated for all sample groups (see Fig. 4a),than when using the sensory Torry score criteria of 5.5 (Table 2).TVB-N is only useful to detect advanced spoilage because valuesonly begin to increase at later stages of storage (Oehlenschläger,1998; Baixas-Nogueras et al., 2003). It has been pointed out thatTVB-N and TMA often give ambiguous information about thequality of the products as their levels are influenced by the storagemethod like in modified atmosphere packaging (Davis, 1990;Dalgaard et al., 1993; Debevere and Boskou, 1996; Lauzon et al.,2002) and in pre-frozen chilled fillets (Magnússon and Martins-dóttir, 1995; Guldager et al., 1998).
4.1.2. TVC and SSOTotal viable psychrotrophic counts (TVC) can give contro-
versial estimation of the end of shelf-life and different limitshave been set based on product types. Einarsson (1992) reportedthat shelf-life of cod fillets estimated by microbial growth was ingeneral shorter than when evaluated by sensory analysis. In thisstudy, the spoilage bacteria became dominated by P. phosphor-eum (50 to 100%) at all storage temperatures tested reachinglevels of log 7.5 to 8.2/g at sensory rejection (Table 2). Pseu-domonas spp. represented about 5 to 15% of the spoilagebacteria reaching loads of log 7.3/g under abused conditions,while H2S-producing bacteria were found in minority (0.4 to2.4%) reaching levels of about log 6/g. At 15 °C Pseudomonasspp. and H2S-producing bacteria were found at very low levels,1.6 and 0.8%, respectively.
Contradictory to previous findings on the role of S. putre-faciens in TMA production and spoilage of fresh fish/fillets (Jør-gensen and Huss, 1989), their low levels (about log 6/g) observedat sensory rejection did not support the high TVB-N levelsmeasured. High TVB-N levels at sensory rejection were sug-gested to be related to high P. phosphoreum counts that reachedTVC levels (>log 8/g) for most sample groups. Interestingly,lower TVB-N levelswere found in samples from2003whenTVCand Pp counts were <log 8/g. In that event, pseudomonads deve-lopment may have promoted the production of other metabolitesaffecting sensory characteristics and shorter shelf-life of theproduct. The contribution of pseudomonads to the TVB-N pro-duction based on cell counts is not likely since pseudomonads donot produce TMAand their counts at sensory rejectionwere lowerthan the P. phosphoreum counts (Table 2). In a study on Medi-terranean species where pseudomonads were predominating, thepseudomonads level of 107 CFU/gwas determined as the limit forthe end of shelf-life coinciding with a TVB-N level of about26 mg N/100g (Koutsoumanis and Nychas, 2000).
Based on the relatively low counts of the H2S-producingbacteria, they do not appear to be important in the development ofspoilage odors in haddock fillets at low temperature. However,under abusive temperature conditions the influence of H2S-producing bacteria may be related to the increase for the H2Ssensor observed for samples stored under abusive conditions at 7and 15 °C at the end of shelf-life (Table 2). Lauzon (2000) de-monstrated that S. putrefaciens became active when co-cultured
with Pseudomonas spp. at high temperature (10–15 °C) in a fishmodel system. In a model system with single bacterial cultures,detection of metabolites coincides with high counts, however,evidence suggests that in co-culture systems the metabolite pro-duction may be high even though the counts of the individualbacteria are lower (Lauzon, unpublished data).
The interaction of the spoilage microflora has been studied bymany researchers to understand better the spoilage developmentin fish (Gram et al., 2002). Pseudomonas spp. have been sug-gested to inhibit the growth of S. putrefaciens (Gram and Mel-chiorsen, 1996; Lauzon, 2000). Interestingly, the H2S sensorresponse appeared to decline in the group 0 °C a, at the end ofstorage, at the same time as a rapid increase was observed in theCO response suggesting active production of metabolites bypseudomonads. This may indicate the ability of Pseudomonasspp. to delay the growth of S. putrefaciens, and as a result limitsthe production of the H2S metabolite, but further studies areneeded to verify this.
4.1.3. Seafood Spoilage and Safety Predictor (SSSP)The estimated shelf-life (SL) obtained by the S. putrefaciens-
like H2S-producing bacteria (Sp) model of the SSSP under-estimated the observed SL after processing for the abusive tem-perature conditions (Table 2). The estimated growth rates of Sp atdifferent temperatures, on which the models are based, werehigher than those estimated by DMFit for the products tested in2001 (Table 1) and therefore the predicted SL was shorter thanobserved (Table 2). However, the shelf-life predicted by the SSSPmodel for the 0 °C sample in 2003 corresponded to the observedvalue of about 10 days (Table 2) and similar growth rates wereestimated by DMFit and SSSP (Table 1). The Sp-model is basedon the growth of S. putrefaciens in a liquid model system, but ithas been validated in some fish species, haddock among others,and should only be used within a temperature range of 0–10 °C.More rapid growth rates of SSO in such model systems can beexpected (Koutsoumanis, 2001; Dalgaard et al., 2002), asexperimental conditions may not resemble the product targeted

Table 3PLSR model to predict Torry sensory scores (Y) based on different combination of the measured variables (X): TVB-N, pH, microbial counts (TVC, Pseud, Pp, H2Scounts), electronic nose sensors (CO, NH3, H2S, SO2) and temperature treatment (Tacc) for haddock fillets (N=21)
X No. ofvariables
Expl X Expl Y Correlationr2
RMSEP
PC1 PC2 PC1 PC2
All measured 11 62 15 86 7 0.94 0.44All significant 7 79 10 92 1 0.95 0.40
Microbial counts SSO TVC, Pseud, Pp, H2S counts, Tacc 5 80 15 89 3 0.92 0.50Pseud, Pp, H2S counts, Tacc 4 76 19 89 3 0.92 0.50Pseud, Pp, Tacc 3 71 23 86 5 0.92 0.51Pseud, H2S counts, Tacc 3 74 25 89 3 0.92 0.51Pp, H2S counts, Tacc 3 76 21 82 7 0.89 0.59
Electronic nose CO, NH3, H2S, Tacc 4 70 18 54 17 0.77 0.89CO, NH3, Tacc 3 74 19 59 13 0.77 0.89CO, H2S, Tacc 3 68 24 54 14 0.78 0.85CO, Tacc 2 73 27 60 7 0.70 0.93
Combination e-nose+SSO+temp CO, NH3, H2S+H2S counts+Tacc 5 67 20 74 16 0.92 0.51CO, NH3, H2S+Pseud+Tacc 5 64 22 75 14 0.93 0.49CO, NH3, H2S+Pp+Tacc 5 66 19 69 15 0.87 0.64CO, NH3, H2S+TVC+Tacc 5 67 19 71 16 0.89 0.60
Classical TVB-N, TVC, Tacc 3 75 18 74 15 0.91 0.54
All models calculated using 2 principal components and full cross validation.
121G. Olafsdottir et al. / International Journal of Food Microbiology 111 (2006) 112–125
because of differences in growth substrates, structure and micro-bial diversity, hence resulting in shorter estimated SL. SSSP mo-dels have been found to predict SL of naturally contaminatedseafood with an accuracy of 25% (Dalgaard et al., 2002), but ahigher prediction error (0 to 46%)was found in our case. Thismaybe explained by the fact that S. putrefaciens was not the domi-nating SSO in the haddock fillets. The SSSPmodel is based on theinitial concentration of the SSO in the product and as clearlyexplained by Dalgaard (2002) several assumptions are maderegarding the growth of the SSO. For example it is assumed thatother bacteria present in the microflora will not influence thegrowth of the SSO and that the SSOwill growwithout a lag phaseand produce metabolites responsible for spoilage. The lattercriterion was fulfilled since no apparent lag phase was observedfor Sp in the haddock fillets (Table 1). Moreover, the response ofthe H2S electronic nose sensor correlated best with the H2Scounts, suggesting the production of metabolites, but the assump-tion that the SSO has to reach a minimal spoilage level (107 CFU/g) when the product is rejected by sensory analysis was notjustified. In the haddock fillets the counts of H2S-producingbacteria were much lower (about log 6 CFU/g). For S. putre-faciens, cell counts of about 107 CFU/g were needed to achievedetectable TMA production in inoculated fish juice and 108 CFU/g for off odor detection (Jørgensen and Huss, 1989). Highercounts (108 CFU/g) were observed when TMA was detected inpacked cod (Dalgaard, 1995) and when TVB-N levels reached26mgN/100 g in sterile fish block inoculatedwith S. putrefaciens(Koutsoumanis and Nychas, 2000). The SSSP model alsoassumes that micro-organisms other than the SSO should be ofno importance for spoilage, but herein the predominance of the P.phosphoreum was evident and the pseudomonads appeared tohave spoilage potential as well. Therefore, this emphasizes theimportance of identifying the SSOs and their spoilage domain inthe respective products before applying a model based on onlyone SSO for shelf-life prediction.
4.2. Evaluation of multi-indicator criteria for the quality ofhaddock fillets — PLSR correlation and prediction modeling
Evaluation of the spoilage characteristics of haddock by PLSRwas done to determine which variables best described the qualitydegradation of haddock fillets stored at different temperatures byevaluating their correlations and potential to predict sensory quality.
4.2.1. PLSR — correlation of variablesThe correlation of the variables was explored by PLSR mo-
deling using average values of all the samples (N=22) fromdifferent storage conditions. The correlation loading plot (Fig. 5)shows that all the microbial methods are highly correlated alongthe first principal component (PC1) explaining 62% of thevariation in the data set and describing the spoilage level of thesamples. The negative correlation coefficients for the microbialvariables and the Torry sensory score based on their actualvalues were high (r=−0.92; −0.96; −0.93 and −0.88 for TVC,H2S-, Pseud- and Pp-counts, respectively). The responses of theCO sensor correlated better with the sensory score (r=−0.82)than the NH3 sensor (r=−0.63). The NH3 sensor responses onthe other hand had higher correlation to TVB-N (r=0.80) thanthe CO sensor (r=0.64) as can be expected because of itssensitivity to amines.
The variables TVB-N, NH3, pH, H2S and Tacc (Tmin=−0.1) onthe upper half of the plot (Fig. 5) describe the variation in the dataexplained by the second principal component (PC2). Theirloadings were characteristic for the spoiled samples that wereinfluenced by high temperatures (7 and 15 °C). The variables H2Sand NH3 were not significant according to the Jack-knife methodto predict the Torry score. However, it is worthwhile to considertheir contribution, since the PC2 is explaining 15% of thevariation in the data. The H2S and NH3 sensors were bestcorrelated to the Tacc variable (r=0.74 and 0.75, respectively) anddescribing samples that were influenced by high temperature.
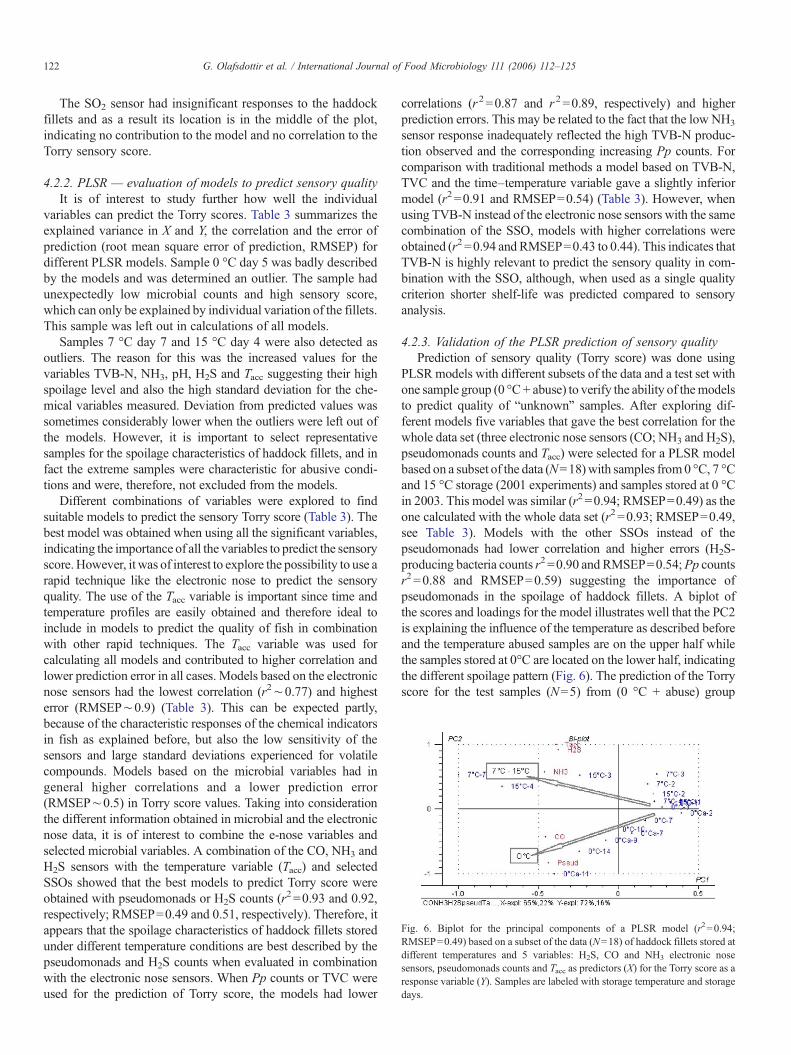
Fig. 6. Biplot for the principal components of a PLSR model (r2=0.94;RMSEP=0.49) based on a subset of the data (N=18) of haddock fillets stored atdifferent temperatures and 5 variables: H2S, CO and NH3 electronic nosesensors, pseudomonads counts and Tacc as predictors (X) for the Torry score as aresponse variable (Y). Samples are labeled with storage temperature and storagedays.
122 G. Olafsdottir et al. / International Journal of Food Microbiology 111 (2006) 112–125
The SO2 sensor had insignificant responses to the haddockfillets and as a result its location is in the middle of the plot,indicating no contribution to the model and no correlation to theTorry sensory score.
4.2.2. PLSR — evaluation of models to predict sensory qualityIt is of interest to study further how well the individual
variables can predict the Torry scores. Table 3 summarizes theexplained variance in X and Y, the correlation and the error ofprediction (root mean square error of prediction, RMSEP) fordifferent PLSR models. Sample 0 °C day 5 was badly describedby the models and was determined an outlier. The sample hadunexpectedly low microbial counts and high sensory score,which can only be explained by individual variation of the fillets.This sample was left out in calculations of all models.
Samples 7 °C day 7 and 15 °C day 4 were also detected asoutliers. The reason for this was the increased values for thevariables TVB-N, NH3, pH, H2S and Tacc suggesting their highspoilage level and also the high standard deviation for the che-mical variables measured. Deviation from predicted values wassometimes considerably lower when the outliers were left out ofthe models. However, it is important to select representativesamples for the spoilage characteristics of haddock fillets, and infact the extreme samples were characteristic for abusive condi-tions and were, therefore, not excluded from the models.
Different combinations of variables were explored to findsuitable models to predict the sensory Torry score (Table 3). Thebest model was obtained when using all the significant variables,indicating the importance of all the variables to predict the sensoryscore. However, it was of interest to explore the possibility to use arapid technique like the electronic nose to predict the sensoryquality. The use of the Tacc variable is important since time andtemperature profiles are easily obtained and therefore ideal toinclude in models to predict the quality of fish in combinationwith other rapid techniques. The Tacc variable was used forcalculating all models and contributed to higher correlation andlower prediction error in all cases. Models based on the electronicnose sensors had the lowest correlation (r2∼0.77) and highesterror (RMSEP∼0.9) (Table 3). This can be expected partly,because of the characteristic responses of the chemical indicatorsin fish as explained before, but also the low sensitivity of thesensors and large standard deviations experienced for volatilecompounds. Models based on the microbial variables had ingeneral higher correlations and a lower prediction error(RMSEP∼0.5) in Torry score values. Taking into considerationthe different information obtained in microbial and the electronicnose data, it is of interest to combine the e-nose variables andselected microbial variables. A combination of the CO, NH3 andH2S sensors with the temperature variable (Tacc) and selectedSSOs showed that the best models to predict Torry score wereobtained with pseudomonads or H2S counts (r2=0.93 and 0.92,respectively; RMSEP=0.49 and 0.51, respectively). Therefore, itappears that the spoilage characteristics of haddock fillets storedunder different temperature conditions are best described by thepseudomonads and H2S counts when evaluated in combinationwith the electronic nose sensors. When Pp counts or TVC wereused for the prediction of Torry score, the models had lower
correlations (r2=0.87 and r2=0.89, respectively) and higherprediction errors. This may be related to the fact that the low NH3
sensor response inadequately reflected the high TVB-N produc-tion observed and the corresponding increasing Pp counts. Forcomparison with traditional methods a model based on TVB-N,TVC and the time–temperature variable gave a slightly inferiormodel (r2=0.91 and RMSEP=0.54) (Table 3). However, whenusing TVB-N instead of the electronic nose sensors with the samecombination of the SSO, models with higher correlations wereobtained (r2=0.94 and RMSEP=0.43 to 0.44). This indicates thatTVB-N is highly relevant to predict the sensory quality in com-bination with the SSO, although, when used as a single qualitycriterion shorter shelf-life was predicted compared to sensoryanalysis.
4.2.3. Validation of the PLSR prediction of sensory qualityPrediction of sensory quality (Torry score) was done using
PLSR models with different subsets of the data and a test set withone sample group (0 °C+ abuse) to verify the ability of themodelsto predict quality of “unknown” samples. After exploring dif-ferent models five variables that gave the best correlation for thewhole data set (three electronic nose sensors (CO; NH3 and H2S),pseudomonads counts and Tacc) were selected for a PLSR modelbased on a subset of the data (N=18)with samples from0 °C, 7 °Cand 15 °C storage (2001 experiments) and samples stored at 0 °Cin 2003. This model was similar (r2=0.94; RMSEP=0.49) as theone calculated with the whole data set (r2=0.93; RMSEP=0.49,see Table 3). Models with the other SSOs instead of thepseudomonads had lower correlation and higher errors (H2S-producing bacteria counts r2=0.90 and RMSEP=0.54;Pp countsr2 =0.88 and RMSEP=0.59) suggesting the importance ofpseudomonads in the spoilage of haddock fillets. A biplot ofthe scores and loadings for the model illustrates well that the PC2is explaining the influence of the temperature as described beforeand the temperature abused samples are on the upper half whilethe samples stored at 0°C are located on the lower half, indicatingthe different spoilage pattern (Fig. 6). The prediction of the Torryscore for the test samples (N=5) from (0 °C + abuse) group
123G. Olafsdottir et al. / International Journal of Food Microbiology 111 (2006) 112–125
showed a good agreement between the predicted and experimen-tal data with a minimum deviation of 0.28 in Torry score units anda maximum deviation of 0.63. The average percent differencebetween predicted and experimental data was 4.8%.
5. Conclusions
The results showed that P. phosphoreum appeared to be veryimportant based on their counts and growth rate in the spoilage offresh haddock fillets packed in bulk (approximately 5 kg) underaerobic conditions in styrofoam boxes. High counts of P. phos-phoreum coincided with high TVB-N values. P. phosphoreumand Pseudomonas spp. were dominating under temperatureabusive conditions. Similar counts were observed for each bac-terial group at sensory rejection in samples stored at 0 °C, 7 °C and15 °C. However, microbial metabolites were produced in higherlevels with increasing storage temperature as shown by theincreasing responses of the electronic nose sensors and increasedTVB-N values at sensory rejection. Pseudomonas spp. weresuggested to contribute to the characteristic sweet, fruity spoilageodors of haddock fillets associated with high responses of the COsensor. The spoilage characteristics of haddock fillets evaluated asTorry sensory scores were best described by pseudomonadscounts in combination with the electronic nose responses whenevaluated by PLSR models. The CO sensor was useful to detectincipient spoilage and characteristic spoilage of fillets stored atlow temperatures while the H2S and NH3 sensors detectedadvanced spoilage and the influence of temperature abuse.Further development of the electronic nose instrument including asampling system with temperature control and more sensitivesensors could improve its performance to detect the differentchemical spoilage indicators. This would permit the inclusion ofreliable data on microbial metabolites into shelf-life models forfish fillets alongwith data on different SSOs and time temperaturehistory of the products. For accurate prediction of sensory qualityand shelf-life of fish fillets combined criteria of the SSOs and theirmetabolites are needed.
Acknowledgements
The authors thank The Icelandic Centre for Research for partlyfinancing the project, the staff at IFL for their valued contributionin chemical, microbial and sensory analyses of samples as well asthe staff at Tros, Sandgerði, for their participation in the project.
References
Baranyi, J., Roberts, T.A., 1994. A dynamic approach to predicting bacterialgrowth in food. International Journal of Food Microbiology 23, 277–294.
Baixas-Nogueras, S., Bover-Cid, S., Veciana-Nogues, M.T., Vidal-Carou, M.C.,2003. Suitability of volatile amines as freshness indexes for iced Mediter-ranean Hake. Journal of Food Science 68, 1607–1610.
Botta, J.R., Bonnell, G., Squires, B.E., 1987. Effect of method of catching andtime of season on sensory quality of fresh raw Atlantic cod (Gadus morhua).Journal of Food Science 52 (4), 928–931.
Castell, C.H., Greenough, M.F., 1957. The action of Pseudomonas on fishmuscle: 1. Organisms responsible for odour produced during incipientspoilage of chilled fish muscle. Journal of the Fisheries Research Board ofCanada 12 (4), 617–625.
Castell, C.H., Greenough, M.F., Dale, J., 1959. The action of Pseudomonas onfish muscle: 3. Identification of organisms producing fruity and onionyodours. Journal of the Fisheries Research Board of Canada 16 (1), 13–19.
Chai, T., Chien, C., Rosen, A., Levin, R.E., 1971. Detection and incidence ofspecific species of spoilage bacteria on fish. Applied Microbiology 16 (11),1738–1741.
Dainty, R.H., 1996. Chemical/biochemical detection of spoilage. InternationalJournal of Food Microbiology 33 (1), 19–33.
Dalgaard, P., 1995. Qualitative and quantitative characterization of spoilagebacteria from packed fish. International Journal of Food Microbiology 26,319–333.
Dalgaard, P., 2000. Fresh and lightly preserved seafood, In: Man, C.M.D., Jones,A.A. (Eds.), Shelf Life Evaluation of Foods, 2nd edition. Aspen PublishingInc., Maryland, USA, pp. 110–139.
Dalgaard, P., 2002. Modelling and predicting the shelf-life of seafood. Chapter12. In: Bremner, H.A. (Ed.), Safety and Quality Issues in Fish Processing.Woodhead Publishing Ltd., Cambridge, England, pp. 191–219.
Dalgaard, P., Gram, L., Huss, H.H., 1993. Spoilage and shelflife of cod filletspacked in vacuum or modified atmospheres. International Journal of FoodMicrobiology 19, 283–294.
Dalgaard, P., Mejlholm, O., Huss, H.H., 1996. Conductance method forquantitative determination of Photobacterium phosphoreum in fishproducts. Journal of Applied Bacteriology 81, 57–64.
Dalgaard, P., Mejlholm, O., Huss, H.H., 1997a. Application of an iterativeapproach for development of a microbial model predicting the shelf-life ofpacked fish. International Journal of Food Microbiology 38, 169–179.
Dalgaard, P., Mejlholm, O., Christiansen, T.J., Huss, H.H., 1997b. Importance ofPhotobacterium phosphoreum in relation to spoilage of modified atmo-sphere-packed fish products. Letters in Applied Microbiology 24, 373–378.
Dalgaard, P., Buch, P., Silberg, S., 2002. Seafood spoilage predictor—development and distribution of a product specific application software.International Journal of Food Microbiology 73, 343–349.
Davis, H.K., 1990. Some effects of modified atmosphere packaging gases onfish and chemical tests for spoilage. Chilling and Freezing of New FishProducts, International Institute of Refrigeration, Commission C2, Aberdeen1990-3, pp. 201–207.
Debevere, J., Boskou, G., 1996. Effect of modified atmosphere packaging on theTVB/TMA-producing microflora of cod fillets. International Journal ofFood Microbiology 31, 221–229.
Dhananjaya, S., Stroud, G.D., 1994. Chemical and sensory changes in haddockand herring stored under modified atmosphere. International Journal of FoodScience and Technology 29, 575–583.
Di Natale, C., Olafsdottir, G., Einarsson, S., Mantini, A., Martinelli, E.,Paolesse, R., Falconi, C., D'Amico, A., 2001. Comparison and integration ofdifferent electronic noses for the evaluation of freshness of cod fish fillets.Sensors and Actuators B 77, 572–578.
Einarsson, H., 1992. Predicting the shelf life of cod (Gadus morhua) filletsstored in air and modified temperatures between −4 °C and +16 °C. In:Huss, H.H., Jacobsen, M., Liston, J. (Eds.), Quality Assurance in the FishIndustry. Elsevier Science Publishers B.V., Amsterdam, The Netherlands,pp. 479–488.
Ellis, D.I., Goodacre, R., 2001. Rapid and quantitative detection of the microbialspoilage of muscle foods: current status and future trends. Trends in FoodScience and Technology 12, 414–424.
Emborg, J., Laursen, B.G., Rathjen, T., Dalgaard, P., 2002. Microbial spoilageand formation of biogenic amines in fresh and thawed modified atmospherepacked salmon (Salmo salar) at 2 °C. Journal of Applied Microbiology 92,790–799.
Esaiassen, M., Nilsen, H., Joensen, S., Skjerdal, T., Carlehog, M., Eilertsen, G.,Gundersen, B., Elvevoll, E., 2004. Effects of catching methods on qualitychanges during storage of cod (Gadus morhua). Lebensmittel-Wissenschaftund Technologie 37, 643–648.
European Union, 1995. 95/149/EC: commission decision of 08 March 1995fixing the total volatile basic nitrogen (TVB-N) limit values for certaincategories of fishery products and specifying the analysis method to be used.Official Journal L 097, 0084–0087, 29/04/1995.
Gram, L., Dalgaard, P., 2002. Fish spoilage bacteria— problems and solutions.Current Opinion in Biotechnology 13, 262–266.

124 G. Olafsdottir et al. / International Journal of Food Microbiology 111 (2006) 112–125
Gram, L., Melchiorsen, J., 1996. Interaction between fish spoilage bacteriaPseudomonas sp. and S. putrefaciens in fish extracts and on fish tissue.Journal of Applied Bacteriology 80, 589–595.
Gram, L., Ravn, L., Rasch, M., Bruhn, J.B., Christensen, A.B., Givskov, M.,2002. Food spoilage — interactions between food spoilage bacteria.International Journal of Food Microbiology 78, 79–97.
Guldager, H.S., Bøknæs, N., Østerberg, C., Nielsen, J., Dalgaard, P., 1998.Thawed cod fillets spoil less rapidly than unfrozen fillets when stored undermodified atmosphere at 2 °C. Journal of Food Protection 61, 1129–1136.
Herbert, R.A., Shewan, J.M., 1976. Roles played by bacterial and autolyticenzymes in the production of volatile sulphides in spoiling North Sea cod(Gadus morhua). Journal of the Science of Food and Agriculture 27, 89–94.
Herbert, R.A., Ellis, J.R., Shewan, J.M., 1975. Isolation and identification of thevolatile sulphides produced during chill-storage of North Sea cod (Gadusmorhua). Journal of the Science of Food and Agriculture 26, 1195–1202.
Huss, H.H., 1995. Quality and quality changes in fresh fish. FAO FisheriesTechnical Paper, vol. 348. Food and Agriculture Organization of the UnitedNations, Roma, pp. 31–50.
ISO, 1993. Sensory Analysis—General Guidance for the Selection, Training andMonitoring of Assessors. Part 1: Selected Assessors, 8586-1. The InternationalOrganization for Standardization, Geneva, Switzerland, pp. 1–10.
Jørgensen, B.R., Huss, H.H., 1989. Growth and activity of Shewanellaputrefaciens isolated from spoiling fish. International Journal of FoodMicrobiology 9, 51–62.
Jørgensen, B.R., Gibson, D.M., Huss, H.H., 1988. Microbiological quality andshelf life prediction of chilled fish. International Journal of FoodMicrobiology 6, 295–307.
Jørgensen, L.V., Dalgaard, P., Huss, H.H., 2000. Multiple compound qualityindex for cold-smoked salmon (Salmo salar) developed by multivariateregression of biogenic amines and pH. Journal of Agricultural and FoodChemistry 48, 2448–2453.
Jørgensen, L.V., Huss, H.H., Dalgaard, P., 2001. Significance of volatilecompounds produced by spoilage bacteria in vacuum-packed cold-smokedsalmon (Salmo salar) analyzed by GC–MS and multivariate regression.Journal of Agricultural and Food Chemistry 49, 2376–2781.
Koutsoumanis, K., 2001. Predictive modeling of the shelf life of fish undernonisothermal conditions. Applied and Environmental Microbiology 67 (4),1821–1829.
Koutsoumanis, K., Nychas, G.J.E., 1999. Chemical and sensory changes asso-ciated with microbial flora of Mediterranean Boque (Boops boops) storedaerobically at 0, 3, 7, and 10 °C. Applied and Environmental Microbiology65 (2), 698–706.
Koutsoumanis, K., Nychas, G.J.E., 2000. Application of a systematicexperimental procedure to develop a microbial model for rapid fish shelflife predictions. International Journal of Food Microbiology 60, 171–184.
Lauzon, H.L., 2003. Notkun Malthus leiðnitækni til hraðvirkra örverumælinga.IFL Project Report, vol. 30-03. 30 pp. (in Icelandic).
Lauzon, H.L., 2000. Shelf-life and bacteriological spoilage of American plaice(Hippoglossoides platessoides). In: Shahidi, F. (Ed.), Seafood in Health andNutrition, Transformation in Fisheries and Aquaculture: Global Perspec-tives, a Science Tech. Book. St. John's, NF, Canada, pp. 327–354.
Lauzon, H.L., Stefánsson, G., Jónsson, G.P., Sveinsdóttir, K., 2002. Sensoryquality and shelf life of MAP redfish (Sebastes marinus) fillets as affected byprevious bulk storage of whole fish. Journal of Aquatic Food ProductTechnology 11 (3/4), 251–273.
Levin, R.E., 1968. Detection and incidence of specific species of spoilagebacteria on fish. Applied Microbiology 16 (11), 1734–1737.
Lindsay, R.C., Josephson, D.B., Olafsdóttir, G., 1986. Chemical andbiochemical indices for assessing the quality of fish packaged in controlledatmospheres. In: Kramer, D.E., Liston, J. (Eds.), Proceedings of anInternational Symposium, University of Alaska Sea Grant Program,Anchorage, Alaska. Elsevier Science Publishers B.V., Amsterdam, TheNetherlands, pp. 221–234.
Magnússon, H., Martinsdóttir, E., 1995. Storage quality of fresh and frozen–thawed fish in ice. Journal of Food Science 60, 273–278.
Malle, P., Poumeyrol, M., 1989. A new chemical criterion for the quality controlof fish: trimethylamine/total volatile basic nitrogen (%). Journal of FoodProtection 52 (6), 419–423.
Martens, H., Martens, M., 1999. Modified Jack-knife estimation of parameteruncertainty in bilinear modelling by partial least squares regression (PLSR).Food Quality and Preference 11, 5–16.
Martens, M., Martens, H., 2001. Multivariate Analysis of Quality. AnIntroduction. John Wiley and Sons, England. 445 pp.
Martin, R.E., Gray, R.J.H., Pierson, M.D., 1978. Quality assessment of fresh fishand the role of the naturally occurring microflora. Food Technology 5,188–192.
Miller III, A., Scanlan, R.A., Lee, J.S., Libbey, L.M., 1973a. Volatilecompounds produced in sterile fish muscle (Sebastes melanops) by Pseu-domonas putrifaciens, Pseudomonas fluorescens, and an Achromobacterspecies. Applied Microbiology 26 (1), 18–21.
Miller III, A., Scanlan, R.A., Lee, J.S., Libbey, L.M., 1973b. Identification of thevolatile compounds produced in sterile fish muscle (Sebastes melanops) byPseudomonas fragi. Applied Microbiology 25 (6), 952–955.
Oehlenschläger, J., 1998. Suitability of ammonia-N, dimethylamine-N,trimethylamine-N, trimethylamine oxide-N and total volatile basic nitrogenas freshness indicators in seafoods. In: Olafsdottir, G., Luten, J., Dalgaard,P., Careche, M., Verrez-Bagnis, V., Martinsdottir, E., Heia, K. (Eds.),Methods to Determine the Freshness of Fish in Research and Industry.International Institute of Refrigeration, Paris, pp. 92–99.
Olafsdottir, G., 2003. Developing rapid olfaction arrays for determining fishquality. In: Tothill, I.E. (Ed.), Rapid and On-Line Instrumentation for FoodQuality Assurance. Woodhead Publishing Ltd, Cambridge, England,pp. 339–360.
Olafsdottir, G., Jonsdottir, R., Lauzon, H.L., Luten, J., Kristbergsson, K., 2005.Characterization of volatile compounds in chilled cod (Gadus morhua)fillets by gas chromatography and detection of quality indicators by anelectronic nose. Journal of Agricultural and Food Chemistry 53 (26),10140–10147.
Olafsdottir, G., Fleurence, J., 1998. Evaluation of fish freshness using volatilecompounds—classification of volatile compounds in fish. In: Olafsdottir,G., Luten, J., Dalgaard, P., Careche, M., Verrez-Bagnis, V., Martinsdottir, E.,Heia, K. (Eds.), Methods to Determine the Freshness of Fish in Research andIndustry. International Institute of Refrigeration, Paris, pp. 55–69.
Olafsdottir, G., Martinsdóttir, E., Oehlenschläger, J., Dalgaard, P., Jensen, B.,Undeland, I., Mackie, I.M., Henehan, G., Nielsen, J., Nilsen, H., 1997a.Methods to evaluate fish freshness in research and industry. Trends in FoodScience and Technology 8, 258–265.
Olafsdottir, G., Martinsdóttir, E., Jónsson, E.H., 1997b. Rapid gas sensormeasurements to predict the freshness of capelin (Mallotus villosus). Journalof Agricultural and Food Chemistry 45 (7), 2654–2659.
Olafsdottir, G., Högnadóttir, Á., Martinsdóttir, E., 1998. Application of gassensors to evaluate freshness and spoilage of various seafoods. In:Olafsdottir, G., Luten, J., Dalgaard, P., Careche, M., Verrez-Bagnis, V.,Martinsdottir, E., Heia, K. (Eds.), Methods to Determine the Freshness ofFish in Research and Industry. International Institute of Refrigeration, Paris,pp. 100–109.
Olafsdottir, G., Högnadóttir, Á., Martinsdóttir, E., Jónsdóttir, H., 2000.Application of an electronic nose to predict total volatile bases in capelin(Mallotus villosus) for fishmeal production. Journal of Agricultural andFood Chemistry 48 (6), 2353–2359.
Olafsdottir, G., Li, X., Lauzon, H.L., Jonsdottir, R., 2002. Precision andapplication of electronic nose measurements for freshness monitoring ofredfish (Sebastes marinus) stored in ice and modified atmosphere bulkstorage. Journal of Aquatic Food Product Technology 11 (3/4), 229–249.
Olafsdottir, G., Jonsdottir, R., Tryggvadóttir, S.V., Einarsson, S., Lauzon, H.L.,2003. Prediction of freshness quality of haddock fillets using electronicnose, texture and TVB-N measurements. First Joint Trans-Atlantic FisheriesTechnology Conference (TAFT) 33rd WEFTA Meeting and 48th AtlanticFisheries Technology Conference, 11–14 June 2003, Reykjavik–Iceland,pp. 148–150. http://vefur.rf.is/TAFT2003.
Olafsdottir, G., Nesvadba, P., Di Natale, C., Careche, M., Oehlenschläger, J.,Tryggvadóttir, S.V., Schubring, R., Kroeger, M., Heia, K., Esaiassen, M.,Macagnano, A., Jørgensen, B.M., 2004. Multisensor for fish qualitydetermination. Trends in Food Science and Technology 15, 86–93.
Ross, T., McMeekin, T.A., 1994. Predictive microbiology. International Journalof Food Microbiology 23, 241–264.

125G. Olafsdottir et al. / International Journal of Food Microbiology 111 (2006) 112–125
Shewan, J.M., Macintosh, R.G., Tucker, C.G., Ehrenberg, A.S.C., 1953. Thedevelopment of a numeric scoring system for the sensory assessment of thespoilage of wet white fish stored in ice. Journal of the Science of Food andAgriculture 4, 283–298.
Van Spreekens, K.J.A., 1974. The suitability of Long and Hammer's medium forthe enumeration of more fastidious bacteria from fresh fishery products.Archiv fur Lebensmittelshygiene 25 (10), 213–219.
Van Spreekens, K.J.A., Toepoel, L., 1981. Quality of fishery products inconnection with the psychrophilic and psychrotrophic bacterial flora. In:Roberts, T.A., Hobbs, G., Christian, J.H.B., Skovgaard, N. (Eds.),Psychrotrophic Microorganisms in Spoilage and Pathogenicity. AcademicPress, London, UK, pp. 283–294.