influence of parameters of the glow discharge …lenr-canr.org/acrobat/savvatimovinfluenceo.pdf ·...
TRANSCRIPT

INFLUENCE OF PARAMETERS OF THE GLOW DISCHARGE ONCHANGE OF STRUCTURE AND THE ISOTOPE COMPOSITION
OF THE CATHODE MATERIALS
I.B. SAVVATIMOVA AND D.V. GAVRITENKOV
FSUE, “RI SIA Luch”, Moscow, Russia
Results of examinations of changes in structure, element, and isotope compositionof cathodes after the glow discharge exposure in hydrogen, deuterium, argon, andxenon are submitted. The voltage of the discharge was less than 1000 V and thecurrent was 5–150 mA. Samples before and after ions bombardment in the glowdischarge were explored by the methods of mass spectrometry: the secondary ions(SIMS), the secondary ions with additional ionization of neutral sprayed particles(SNMS), spark (SMS), and thermo-ionization (TIMS), and also methods of energydispersion X-ray spectral analysis (EDX). The alpha-, beta-, gamma- emission,and gamma- spectrometry for radioactive uranium specimens were also carriedout before and after experiments in the glow discharge. Changes in structure, iso-tope, and element composition of the cathode samples depend on current density,integrated ions flow (fluence of ions), kind of irradiating ions and other experimen-tal conditions. Attempts are made to estimate qualitatively and quantitativelythe role of each of the parameters on intensity of the observed changes in cathodecomposition. It is shown that the maximum changes in structure, chemical andisotope composition of the cathode material occur in “hot points,” such as cratersfrom microexplosions, phase segregations, blisters and other new formations. Var-ious methods of the analysis revealed that the basic elements Mg, O, Si, Al, andCa with quantities up to per cents and more were prevailing in these zones andnot found out before experiment. The greatest changes of the isotope relationswere observed for iron, calcium, silicon, chromium after experiments with pulsingcurrent. EDX method finds out the elements missing in the samples before ex-periment such as cadmium, strontium, tin. The isotopes with mass number 59(Co 100%), 55 (Mn 100%), 45 (Sc 100%) are also not found in initial samples andbackground measurement by TIMS method. Results of changes in the elementand isotope composition, which are found by various methods of the analysis, arecompared with possible reactions of fusion-fission. It is noted that under differentexperimental conditions on various cathode materials similar groups of prevailingelements are find by various methods of the analysis.
1. Introduction
As is known, the ionic processing of materials results in changing surface properties.It has been shown earlier that physical–mechanical properties, element, and isotopecompositions in plasma of a glow discharge change.1−9
The majority of the “additional” elements found after ion irradiation and notfound before irradiation is distributed at the boundaries of grains1 and in lo-cal spots.3,4,9 They make up from the 10th fractions of a percent up to several
1

2
percents. Thus in initial samples the content of separate impurity elements didnot exceed 10−3–10−4 at.% and EDX analysis could not reveal it. Groups of suchelements as Sc, Ti, V, Ag, Cd, In, P, Cl, Br, Ge, As, Kr, Sr, Y, Ru, and Xe havebeen found in Pd after irradiation by ions of all the types (D, H, Ar, and Ar+Xe),but in various quantities.2 Elements with atom numbers Z = 26–31 (Fe, Cu, Zn,and Ga) were observed by the method of energy-dispersion X-ray spectral analysis(EDX) preferentially after irradiation by deuterium ions.
As a result of EDX and radiography, it was supposed that nuclear transmu-tations occur more intensively on local sites.1−4 Distinctions in the characteristicspectrums corresponding to various combinations confirmed the nuclear processesin local zones.3,9 Considerable changes of the isotope relations were observed for10B/11B, 12C/13C, 60Ni/61Ni/62, 40Ca/44Ca, and 90Zr/91Zr.3 Change of the iso-tope relation in 109/107Ag from 3/1 up to 9/1 was observed in different series ofexperiments.3,9
In this paper, the changes of structure, element, and isotope composition of pal-ladium for various parameters of the discharge are compared. The role of the currentsort in transmutation intensity is shown. The possible types of nuclear reactionsfor pairs of the elements observed in the cathodes after experiments are shown.
2. Methods of the Analysis and Parameters of Glow Discharge
The installation had a vacuum discharge chamber with a cathode and an anode.The chamber was evacuated up to 10−2 Torr, and then it was filled by working gasup to 3–10 Torr. Deuterium, hydrogen, argon, and xenon were used as workinggases. Samples were irradiated by currents with density of ∼10–50 mA/cm2 andat discharge voltage of 50–1200 V. The discharge burning exposure was 1–40 h,diameter of samples ∼20 mm, thickness ∼100 µm, the irradiated area - about 1 cm2.Multilayer cathodes consisting of several foils approximately 100 µm thick each foracquisition of data on change of the element and isotope composition on depth wereused. The examinations procedure in detail is described in Refs. 3 and 9. Themeasurement system allowed recording current, discharge voltage, gas pressure,sample temperature, temperature of the inlet, output of the cooling water in thecathode, anode, and cooling jacket.
Changes in the element and isotope composition were analyzed by EDX meth-ods and mass spectrometry. The element composition of the cathode materials wasstudied on scanning electronic microscope Hitachi S-840 with Link Analytical LS - 5for a spectral analysis, later the structure of the surface and the sample compositionwere studied by electronic microscope JEOL JSM 6460-LV using INCA for X-rayspectral analysis. The content of elements was estimated using programs INCA(Version 4.02). Time of the spectra recording is 2 min. The accelerating voltageof 10 kV for the analysis of lighter elements and 30 kV for heavier elements wereused. The analyzed zone size was about 1 µk2 for the probe analysis in point, andwhen scanning on the area it was up to ∼250 × 200 µk2. Sensitivity of the methodwas ∼10−2 atom.%. Depth of an analyzed layer made up about 1mk. Elements

3
O, F, S, Na, Mg, Al, Ti, Cr, and Fe are analyzed on Kα, Mo and Br - on Lα,W - on Mα of characteristic spectrums lines. Concentration of forming (“addi-tional”) impurity elements was determined given of the majority of lines of seriesin characteristic spectrum.
Initial samples and samples after experiments in deuterium glow discharge areanalyzed. Places with structural defects and new formations such as swellings (blis-ters), craters, areas of micromeltings, needle structures, and sites of surface withoutspecial changes after irradiation in glow discharge plasma were explored.
The isotope composition of the samples at high temperature was determinedby the method of the thermo-ionization mass spectrometry on mass spectrometer“Finnigan”-262. The sample temperature in this analysis usually exceeded 1800◦C.The majority of complex compounds should break up (dissociate) at such a tem-perature while the secondary ionic mass spectrometry can give many compositecomplexes.
3. Changes in Structure of Surface, Element, and IsotopeComposition
It is shown that changes of structure, element, and isotope composition depend onthe following:
(a) Doses of irradiating ions (Tables 1–3).1
(b) Density of ions current (Tables 4 and 5).3,4
(c) Irradiating ions kind (Tables 4 and 5).3−5
(d) Current sorts: direct or pulsing (Tables 6, 12, and 13).(e) Places of “hot points” analysis and new formation (Tables 8–12).
Each of the above process parameters (a–d) influenced on the process intensityand its reproducibility. The role of “hot points” in the change of structure, chemical,and isotope composition3−5 and the groups of the elements dominating in these“active sites” are analyzed by various methods.1,2,5 In this paper special attention ispaid to structural change in new formations (in zones of craters, growth formations,and blisters) and to the effect of current (direct and pulsing).
3.1. Dependence of “Additional” Elements Quantity on Dose
Changes of the isotope and element composition of the samples irradiated by deu-terium ions after different exposure time (dose) were analyzed by several methods.Table 1 comprised the data received by method of secondary ionic mass spectrom-etry after 30 min bombarding of palladium by deuterium. Table 2 includes theresults of EDX data, and Table 3 has the same samples data obtained by methodof spark mass spectrometry.
The increase in the content of Li by a factor of 50–450 (rows 1 and 2), 11B by afactor of 70 (row 4) can be a result of nuclear process under conditions of low-energyactions in glow discharge plasma with the participation, for example, of hydrogen

4
or deuterium, or processes of heavier elements fission. The increase in the contentof Zr by a factor of ∼340 (rows 15 and 16), V by a factor of 100 (row 5), Cr by afactor of 160 (row 6), Fe by a factor of 2 (rows 9), and Ni - 5–30 (rows 10 and 11)can also be a result of nuclear transmutations. The experimental time of this serieswas ∼30 min. The increase of the impurity elements at the backside was observedonly for Li. “Dot” aggregations of Zn, Co, Br, and Mg located preferentially onboundaries of subgrains, with a density of ∼(1–10)×106 cm−2 (for Zn the densityof such places made up ∼(1–2)×106 cm−2, for Br∼(2–4)×106 cm−2)1 are foundduring scanning the surface of a sample.
Table 1. Changes of isotope and element composition of impurity atoms on surface of palladiumafter bombarding by deuterium ions (SIMS).3
No. Mass number Element Content (arb.un.)
Beforeexperiment
After experiment
Irradiated side Back side
1 6 Li* 0.02 1.00 0.152 7 Li* 0.02 9.00 0.283 10 B* 0.01 0.01 0.014 11 B* 0.10 7.00 0.015 51 V* 0.30 30.00 0.206 53 Cr 0.60 96.00 1.007 54 Fe, Cr 2.20 15.00 2.008 56 Fe 22.20 55.00 20.009 57 Fe 11.00 45.00 12.0010 60 Ni 0.10 3.00 0.2011 61 Ni 0.20 10.00 0.2012 63 Cu 1.40 60.00 1.0013 87 Sr* 0.10 1.00 0.1014 88 Sr* 0.50 0.10 0.2015 90 Zr* 0.00 57.00 0.0016 91 Zr* 0.10 34.00 0.10
Thickness of the samples ∼ 100 µm. Depth of analyzed layer was ∼ 100 A.Method of the analysis secondary ionic mass spectrometry.Li, B, V, Sr, and Zr were not present at the discharge chamber earlier.The source of possible impurity is absent.
The comparison of the new elements quantity shows that an increase in experi-mental time (fluence) by a factor of 10 times (data EDX) leads only to an increasein Mo which is an element of construction (the a pressure holder of the sample,screening a part of surface during sample irradiation). Therefore, it is not surpris-ing that irradiation time increase leads to Mo quantity increase. The quantity ofother “additional” elements (Br, Sr, and Te which are absent in the sample beforeexperiment) does not change largely with an increase of experimental time (a doseof irradiation) by a factor of 10.
The reason for such an effect can be both preferred formation of these elements inthe sample at the initial stage of the discharge burning, having significant quantity of

5
different defects on its surface and possible preferable sputtering of lighter elementsat the following experimental stage. Another reason for the absence of growth of the“additional” elements quantity with an increase in discharge burning time can beparticipation of the forming elements in the secondary reactions. It is impossible toexclude the contribution of irradiated surface screening by sputtered. However, theanalysis of the same samples by spark mass spectrometry method does not confirmthe explanation of the results obtained by the surface screening by molybdenumprecipitation because an increase of other elements such as 7Li, 11B, K, Rb, In, andNb in a longer experiment was observed both on irradiated and on the backside ofthe same sample.
Table 2. Additional atoms on palladium surface after glow discharge in deuterium (EDX).1
No. The additionalatoms
The nuclearnumber
Dependence of quantity of impuritieson duration of experiment(×10−2 at. %)
4 h 40 h
1 Na 11 7.0 ± 0.3 3.0 ± 0.32 Mg 12 1.0 ± 0.3 2.0 ± 0.33 Al 13 4.0 ± 0.3 2.0 ± 0.34 Si** 14 1.5 ± 0.3 < 0.35 Ca 20 4.0 ± 0.3 3.0 ± 0.36 Ti* 22 1.0 ± 0.3 1.5 ± 0.37 Br* 35 3.0 ± 0.6 2.0 ± 0.68 Sr* 38 7.0 ± 0.6 6.0 ± 0.69 Y* 39 40.0 ± 1.0 20.0 ± 1.010 Mo** 42 15.0 ± 1.0 40.0 ± 1.011 Tc* 43 20.0 ± 1.0 10.0 ± 1.0
*Source of possible pollution is absent.**Source of possible pollution is the parts of the construction.Sonde diameter was 1 µm.EDX method used SEM “HITACHI-800” with “Link Analytical” device.All the peaks corresponding to Ti, Br, Sr, Y, and Tc on X-ray spectrums were observed afterexperiments.Ti, Br, Sr, Y, and Tc were never present in the discharge chamber before experiment. Ti, Br, Sr,Y, Tc, Zn, and Co are absent before experiments in spectrums of this Pd.
A 500–3000-fold increase in Zr content (rows 20 and 21) can be a result ofpossible nuclear processes under low-energy actions in glow discharge plasma. Onecan assume that a 10–20-fold increase in Indium content (series 28) can also be aneffect of stimulated nuclear processes with the participation of palladium and, forexample, hydrogen, deuterium, or boron (mass numbers 10, 11). The assumptionof preferred sputtering of light elements forming during experiment can confirm thedata of Table 3 obtained by SMS method. One can see an increase in 10B contentby a factor of 2 on the sample backside with 4-hour irradiation and an increase in11B by a factor of 10 on the sample backside after 40-h experiment, and only bya factor of ∼3 on the irradiated side of samples (40 h). Increasing Al, 115In, and

6
93Nb correlate with an increase of the discharge time both on the irradiated and onbackside of the sample. Similar changes are also observed for 90Zr isotope on thesurface irradiated by palladium ions where the increase is ∼500 times after 4-hourdischarges and 1200 times for 40 h. On the backside, the quantity of 90Zr increasesby a factor of ∼4.4. The quantity of 91Zr isotope increases ∼1000 and ∼1200 timeswith a 10-fold increase in discharge time. The 80Se increasing was ∼100 times on
Table 3. Quantity of the impurity atoms on palladium surface after deuterium ions irradiationat glow discharge (SMS).1
No. Massnumber
Element Content before(×10−4 at. %)(× 100 ppm)
Additional element content in Pd for differentexperiment duration (× 10−4at. %)
4 h 40 h
Upper Lower Upper Lower
1 6 Li 0.06 0.152 7 Li 0.06 0.33 0.40 0.90 0.503 10 B 0.07 0.154 11 B 0.07 0.30 0.20 0.20 0.705 23 Na 0.44 4.40 1.00 2.00 6.006 27 Al 6.00 96.00 10.00 300.00 25.007 28 Si** 9.00 18.00 9.00 3.008 29 Si** 7.00 21.00 11.00 10.009 30 Si** 6.00 18.00 4.50 15.00 66.0010 32 S 7.00 14.00 2.00 3.50 2.0011 39 K 3.00 9.00 12.00 4.5012 41 K 3.00 12.00 1.00 18.00 9.0013 47 Ti* 1.20 1.80 60.0014 48 Ti* 1.40 580.00 2.50 3.5015 49 Ti* 1.30 680.00 3.25 130.00 2.6016 50 Ti* 1.70 3.40 130.0017 78 Se* 0.23 0.23 0.20 0.20 4.0018 80 Se* 0.30 0.20 0.20 0.20 33.0019 85 Rb* < 0.03 0.01 0.05 90.00 51.0020 90 Zr* < 0.05 25.00 0.05 60.00 0.2221 91 Zr* < 0.05 50.00 0.05 61.0022 93 Nb* < 2.00 40.00 2.00 7200.00 4.0023 98 Mo** 0.40 3.0024 100 Mo** 1.80 4500.00 1.80 2880.0025 103 Rh* 7.00 21.00 21.00 25.00 7.0026 107 Ag* 1.00 63.00 3.00 1.00 3.2027 109 Ag* 1.00 50.00 1.50 2.5028 115 In* < 0.04 0.48 0.04 0.80 0.16
*Possible source of impurity is absent.**Possible source of Mo and Si impurities are construction parts.Depth of analyzed layer ∼ 10 µm.Sensitivity of the method 10−6at. %.The quantity of each isotope is brought to 100 %. Ti, Se, and Ru, In were not present beforedischarge experiments.The sample irradiated by ions and contacting“Lower” sample was not irradiated by deuterium ions and did not contact deuterium plasma.

7
backside for 40-hour experiment. Authors could not explain a significant increasein 11B, 115In, 93Nb, 80Se I-I 91Zr on the backside of the sample by other non-nuclearprocesses.
3.2. Dependence of Quantity of “Additional” Elements on CurrentDensity and Ions Kind
Current density (ions flow) and ions type are also important parameters the quan-tity of the impurity elements in the cathode material after discharge experimentsdepends on them. The data of other series experiments for quantities of Ag in Pd atvarious density of ions flow with different ion content are shown in Tables 4 and 6.
Table 4. Change of quantity of Ag in Pd glow-discharge cathode (SMS)4.
Samplenumber
Current(mA)
Ionstype
Analyzeplace*
Ag+2 (ppm) Increasing(times)
Isotope mass
107 109
Initial 0 1 1.7 × 101 2.2 × 101
1666 35 D2
1 5.0 × 10³ 5.2 × 10³ ∼2.5 × 10²
2 2.1 × 10³ 2.2 × 10³ ∼1.0 × 10²
3 <1.5×101 < 5 –
1667** 35 H2
1 1.1 × 10² 7.7 × 101 ∼4.02 <2.0×101 <2.0 × 101 –3 <2.0×101 <2.0 × 101 –
1668 25 H2D2
1 5.7 × 10² 5.6 × 10² ∼2.5 × 101
2 6.9 × 10² 7.4 × 10² ∼ 3.5 × 101
3 1.2 × 10² 1.3 × 10² ∼ 5.0
1670 25 H21 9.7 × 10² 1.0 × 10³ ∼ 5.0 × 101
2 4.5 × 10² 4.5 × 10² ∼2.0 × 101
1671 25 D21 2.6 × 10³ 2.7 × 10³ ∼1.2 × 10²
2 1.8 × 10² 1.9 × 10² ∼ 9.0
∗1, 2, 3 depth of analyzed layer is 10 µm: (1, 2) the upper irradiated sample; (3) unirradiated lowersample.** 1668 - discharge in hydrogen, and then in deuterium.ppm: impurities particles per million.
One can see that the maximal Ag increase after deuterium discharge at greaterdensity of current (35 MA) in the near-surface layer of 10µm was 250 times (from20 ppm in an initial state up to 5000 ppm after irradiation by deuterium). Thefollowing layer ∼10 µm thick only showed ∼a 100-fold Ag increase. A lower increase(∼120 times) of Ag content was observed at smaller current density (25 MA). Aless increase was observed in hydrogen at greater current density.
It can be explained by easier output of hydrogen implanted into palladium latticeat a higher temperature of the sample (and accordingly by a smaller hydrogen con-tent in palladium lattice), i.e. by closely related velocities of hydrogen implantation
8
and hydrogen desorption under these conditions. An essential increase of Ag con-tent in the lower sample (∼4 times) was observed only for the sample preliminarilyirradiated by hydrogen and then by deuterium. This might be a result of simul-taneous running of both non-nuclear (sputtering, diffusion separation) and nuclearprocesses (fusion and fission, secondary interaction of nuclear reactions products).
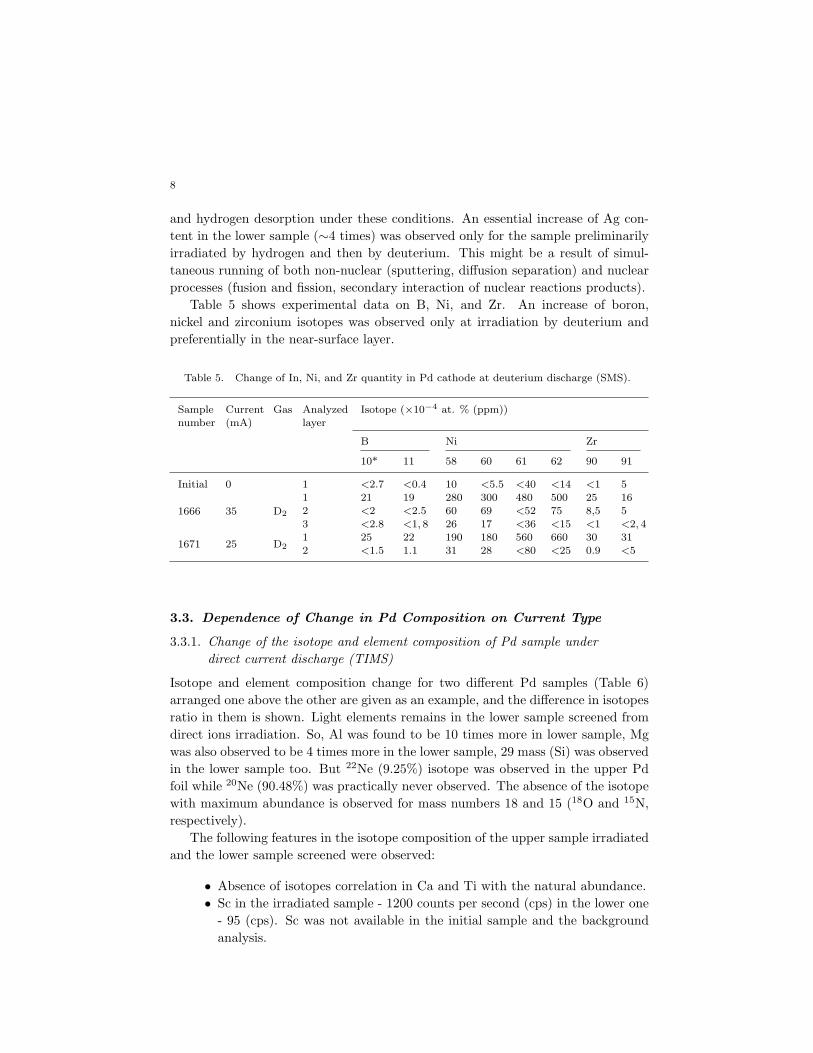
Table 5 shows experimental data on B, Ni, and Zr. An increase of boron,nickel and zirconium isotopes was observed only at irradiation by deuterium andpreferentially in the near-surface layer.
Table 5. Change of In, Ni, and Zr quantity in Pd cathode at deuterium discharge (SMS).
Samplenumber
Current(mA)
Gas Analyzedlayer
Isotope (×10−4 at. % (ppm))
B Ni Zr
10* 11 58 60 61 62 90 91
Initial 0 1 <2.7 <0.4 10 <5.5 <40 <14 <1 5
1666 35 D2
1 21 19 280 300 480 500 25 162 <2 <2.5 60 69 <52 75 8,5 53 <2.8 <1, 8 26 17 <36 <15 <1 <2, 4
1671 25 D21 25 22 190 180 560 660 30 312 <1.5 1.1 31 28 <80 <25 0.9 <5
3.3. Dependence of Change in Pd Composition on Current Type
3.3.1. Change of the isotope and element composition of Pd sample underdirect current discharge (TIMS)
Isotope and element composition change for two different Pd samples (Table 6)arranged one above the other are given as an example, and the difference in isotopesratio in them is shown. Light elements remains in the lower sample screened fromdirect ions irradiation. So, Al was found to be 10 times more in lower sample, Mgwas also observed to be 4 times more in the lower sample, 29 mass (Si) was observedin the lower sample too. But 22Ne (9.25%) isotope was observed in the upper Pdfoil while 20Ne (90.48%) was practically never observed. The absence of the isotopewith maximum abundance is observed for mass numbers 18 and 15 (18O and 15N,respectively).
The following features in the isotope composition of the upper sample irradiatedand the lower sample screened were observed:
• Absence of isotopes correlation in Ca and Ti with the natural abundance.• Sc in the irradiated sample - 1200 counts per second (cps) in the lower one
- 95 (cps). Sc was not available in the initial sample and the backgroundanalysis.

9
Cr and Fe were not available in the discharge chamber parts (water-cooled stainlesssteel holder was placed under eight Pd foils 100µm thick each and one molybdenumfoil 0.1 mm thick). Cobalt and manganese have not also been found in initial Pdand in background measurement. Cr, Fe, Co, and Mn were observed in the secondsample in smaller quantities. Therefore, Mn intensity in the upper sample was 4000cps and only ∼30 cps in the lower Pd sample. Cobalt quantity was found to be∼380 cps in the upper sample and 20 cps in the lower sample, 52Cr was ∼10 000and ∼3400 cps, respectively. Only 44Ca, 24Mg, and Al were found to be in biggerquantities in lower Pd sample as compared with the upper sample.
Table 6. Isotope and element composition of Pd samples irradiated by deuterium ions underdirect current discharge (TIMS).
Mass Element Natural abundance (%) N1CPS, 1610(1)
N2CPS,1610(2)
∆(N2-N1)
14 N 90.6 – –15 0.37 2.0 × 101 – −2.0 × 101
16 O 99.8 – –18 0.20 1.0 × 101 –22 Ne 9.32 6.0 × 101 1.0 × 101 −1.0 × 101
24 Mg 78.99 1.0 × 101 3.8 × 101 +2.8 × 101
25 10 – 1.0 × 101 +1.0 × 101
26 11 – –27 Al 100 1.0 × 10³ 1.0 × 10⁴ +9.0 × 10³
28 Si 92.23 2.5 × 10² 1.0 × 10² −2.4 × 10²
29 4.68 – 1, 5 × 10² +1.5 × 10²
30 3.09 – 3.0 × 101 +3.0 × 101
42 Ca 0.65 1.8 × 10³ 1.5 × 10² −1.65 × 10³
43 0.14 4.3 × 10³ 1, 5 × 10² −4.15 × 10³
44 2.09 1.0 × 101 6 × 10² +5.9 × 10²
45 Sc 100 1.2 × 10³ 9.5 × 101 −1.1 × 10³
46 Ti 8.0 5.0 × 101 6.5 × 101 +1.5 × 101
47 7.3 3.0 × 101 5.5 × 101 +2.5 × 101
48 73.8 1.2 × 10² 4.0 × 10² +2.8 × 10²
49 5.5 1.0 × 101 4.5 × 101 +3.5 × 101
50 Ti, Cr 5.4; 4.3 4.6 × 10² 2.0 × 10² −2.6 × 10²
51 V 99.8 4.6 × 10² 5.0 × 10² +4.0 × 10²
52 Cr 83.8 1.0 × 10⁴ 3.4 × 10³ −6.6 × 10³
53 Cr 9.5 7.0 × 10² 3.0 × 10² −4.0 × 10²
54 Fe,Cr 5.8; 2.37 2.0 × 10³ 2, 6 × 10² −1.7 × 10³
55 Mn 100 4.0 × 10³ 3.0 × 101 −3.0 × 10³
56 Fe 91.7 1.5 × 10⁴ 2.5 × 10³ −1.2 × 10⁴
57 Fe 2.2 1.5 × 10³ 5.5 × 101 −1.4 × 10³
58 Fe 0.28 3.8 × 10² 3.0 × 101 −3.5 × 10²
59 Co 100 3.8 × 10² 2.0 × 101 −3.6 × 10²
1610(1)—irradiated sample (N1); 1610 (2)—screened sample located under irradiated sample (N2).

10
A change of the isotope ratio in samples after carrying out deuterium bom-bardment was observed from several percent up to hundreds.1,2 The quantities of“additional” elements were from 0.1 at.% up to ∼ 5 at.%. The most considerabledifference in the isotope ratio was observed for Mg, Si, K, S, Ca, and Fe isotopesafter deuterium discharge.
A comparison of the chemical composition and isotope ratio on palladium sam-ples after experiments in deuterium discharge with direct current and pulsing cur-rent by thermo-ionization mass spectrometry is shown in Tables 7–10.
One can see from Table 8 that the quantity of Mg (24–26) and Si (28–30) isotopesin the lower layers of the sample are higher; therefore it is impossible to explain thisfact by “impurity” from the surface.
Table 7. Change of Fe, Cr, and Ti isotope ratio with direct current by TIMS (No. 1610).
Samplenumber*
Element Isotopes Natural abundance(Nn)
Ratio after experiment(Nexp)
K**
1 Fe 56/57 91.72/2.2 = 41.7 1.5 × 10⁴/1.5 × 103 = 10 4.17
2 2.5×10³/5.5×101 = 46.4 0.901 Cr 52/53 83.8/9.25 = 8.8 1.0×10⁴/7.0×102 = 14.3 0.622 3400/3.0 × 102 = 11.3 0.7812
Ti 48/47 73.8/7.3 = 10.12 1.2 × 10²/3.0 × 101 = 44.0×10²/5.5×101 = 7.3
2.501.40
12
Ti 48/46 73.8/8 = 9.82 1.2×10²/5.0×101 = 2.44.0×102/6.5×101 = 6.15
3.801.50
12
Ti 48/49 73.8/13.42 = 13.42 1.2 × 10²/101 = 124.0×10²/4.5×101 = 8.9
1.101.50
*(1) An irradiated sample, (2) the sample located under irradiated one.** K = Nn/N exp: natural ratio/ratio after experiments.
3.3.2. Change of isotope and element composition in palladium at deuteriumdischarge under pulsing current
These results (Tables 9 and 10) apply to the experiments with pulsing currentfrequency of ∼ 1.35 × 10³ Hz, pulse length duration of 70µs and a weak magnetic(magnetic field was ∼ 4 T). Average current is ∼ 10–15 mA, current in an impulse is∼ 100–150 mA. A very essential increase (1000 times) of the isotopes ratio in pulsingcurrent experiments essentially for isotopes of iron takes place. The contributionof heavy isotopes for such elements as Ni (∼ 11–16 times) and Cr (∼ 8 times) alsodecreases. For Ti and Ba the contribution of a heavier isotope increases 2–3 times.It is important to note that changes in ratios of lead (1 ± 0.1) and gallium (1.5 ±0.1) isotopes after the experiments are not practically observed.
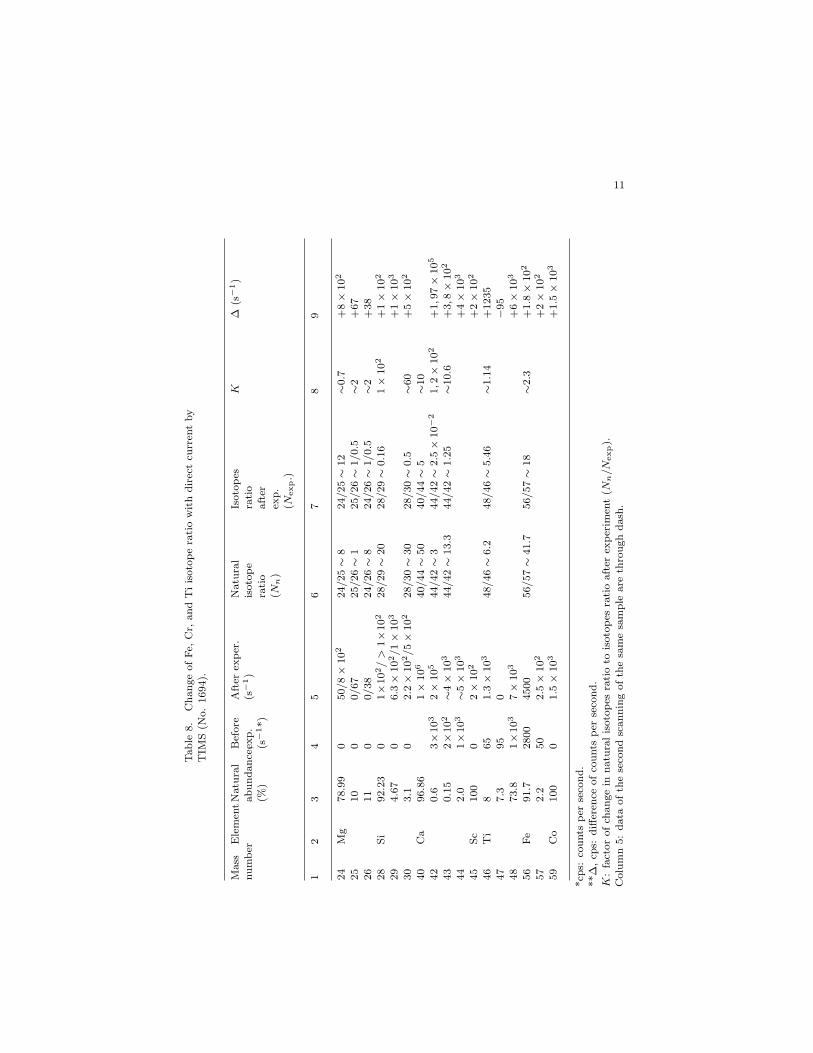
11Tab
le8.
Cha
nge
ofFe
,C
r,an
dT
iis
otop
era
tio
wit
hdi
rect
curr
ent
byT
IMS
(No.
1694
).
Mas
snu
mber
Ele
men
tNat
ural
abun
danc
e,(%
)
Bef
ore
exp.
(s−
1*)
Aft
erex
per
.(s
−1)
Nat
ural
isot
ope
rati
o(N
n)
Isot
opes
rati
oaf
ter
exp.
(Nex
p.)
K∆
(s−
1)
12
34
56
78
9
24M
g78
.99
050
/8
×10
224
/25
∼8
24/25
∼12
∼0.7
+8
×10
2
2510
00/
6725
/26
∼1
25/26
∼1/
0.5
∼2+
6726
110
0/38
24/26
∼8
24/26
∼1/
0.5
∼2+
3828
Si92
.23
01×
102/
>1×
102
28/29
∼20
28/29
∼0.
161
×10
2+
1×
102
294.
670
6.3
×10
2/1
×10
3+
1×
103
303.
10
2.2
×10
2/5
×10
228
/30
∼30
28/30
∼0.
5∼6
0+
5×
102
40C
a96
.86
1×
106
40/44
∼50
40/44
∼5
∼10
420.
63×
103
2×
105
44/42
∼3
44/42
∼2.
5×
10−
21,
2×
102
+1,
97×
105
430.
152×
102
∼4×
103
44/42
∼13
.344
/42
∼1.
25∼1
0.6
+3,
8×
102
442.
01×
103
∼5×
103
+4
×10
3
45Sc
100
02
×10
2+
2×
102
46T
i8
651.
3×
103
48/46
∼6.
248
/46
∼5.
46∼1
.14
+12
3547
7.3
950
−95
4873
.81×
103
7×
103
+6
×10
3
56Fe
91.7
2800
4500
56/57
∼41
.756
/57
∼18
∼2.3
+1.
8×
102
572.
250
2.5
×10
2+
2×
102
59C
o10
00
1.5
×10
3+
1.5
×10
3
*cps
:co
unts
per
seco
nd.
**∆
,cp
s:di
ffer
ence
ofco
unts
per
seco
nd.
K:
fact
orof
chan
gein
natu
ralis
otop
esra
tio
tois
otop
esra
tio
afte
rex
per
imen
t(N
n/N
exp).
Col
umn
5:da
taof
the
seco
ndsc
anni
ngof
the
sam
esa
mpl
ear
eth
roug
hda
sh.

12
Table 9. Change of isotope and element composition in pal-ladium at deuterium discharge under pulsing current (TIMS,# 1799).
Element Mass number Naturalabundance(%)
Afterexperiment(cps)
Ne 20 90,5 2.0 × 101
21 0,27 3.0 × 101
22 9,32 5.0 × 101
Ni 58 68.1 1.5 × 10²
60 26.2 6.5 × 10²
Ni 61 1.25 3.0 × 101
62 3.6 1.3 × 10²
Fe 56 91.7 1.6 × 10²
57 2.2 4.0 × 10³
Cr 52 83.8 4.8 × 10²
53 9.5 4.5 × 10²
Ti 48 73.8 2.0 × 10²
47 8 1.0 × 101
Ga 69 60 3.0 × 10²
71 40 1.8 × 10²
Ba 138 71.7 3.0 × 10³
137 11.3 1.9 × 10²
136 7.85 1.2 × 10²
135 6.6 2.2 × 10²
134 2.4 2.5 × 10²
Pb 206 23.6 4.0 × 101
207 22.6 4.8 × 101
208 52.3 1.0 × 10²
3.4. “Additional” Elements Quantity on Different Methods ofAnalysis
One can see that most essential changes of the element composition in rather consid-erable areas of surfaces and in the local microzones characterized by some differentstructural changes (Table 11 with EDX data and Figs. 1–4) were observed. TIMSmethod can show very thin changes in the surface layers, but these measurementswill concern all areas of the analysis.
If we carried out spark mass spectrometry analyses, we found considerablysmaller quantities, about 10−4 nuclear percent. However, the analyzed layer depthwas ∼10 µm. Therefore, the depth of X-ray spectral analysis is ∼10 times less, andthe depth of TIMS analysis is ∼100 times less than for SMS. Taking into accountthe analysis depth of spark mass spectrometry and correlate it with TIMS data and(or) EDX method, it is possible to assume that TIMS data in the thin surface layerwas also ∼ 0.1–0.6%. Thus, each method of the surface analysis is important andshould be taken into account. Therefore, the analysis of the samples before andafter experiments was carried out, at least, by two different methods (e.g., EDXand TIMS).

13
Table 10. Isotope ratio change in “additional” elements of Pd sample after pulsing current ex-periment.
Element Isotopes Natural isotopes ratio (Nn) Ratio after experiment (Nexp) K**
Si 28/29 93.2/4.7 = 22.6 10/75 = 0.13 1.7 × 10²
28/30 93.2/3.1 = 29.8 10/20 = 0.5 6.0 × 10²
Ne 20/21 90.5/0.27 = 33.5 20/30 = 0.67 5.0 × 10²
20/22 90.5/9.329.7 20/50 = 0.4 2.4 × 10²
Ni 58/60 68.1/26.2 = 2.6 1.5 × 10²/6.5 × 102 = 0.23 1.1 × 101
58/61 68.1/1.25 = 55 1.5 × 10²/3 × 101 = 5 1.1 × 101
58/62 68.1/3.6 = 19 1.5 × 10²/1.3 × 102 = 1.15 1.6 × 101
Fe 56/57 91.2/2.2 = 41.45 1.6 × 10 × /4 × 103 = 0.04 1.0 × 10³
Cr 52/53 83.8/9.5 = 8.82 4.8 × 10²/4.5 × 102 = 1.066 8.0 × 101
Ti 48/47 73.8/8 =∼ 9 2 × 10²/10 = 20 5.0 × 10⁻¹
Ba 138/137 71.7/11.3 = 6.35 3 × 10³/1.9 × 102 = 15.8 4.0 × 10⁻¹
138/136 71.7/7.85 = 9.13 3 × 10³/120 = 25 3.6 × 10⁻¹
138/135 71.7/6.6 = 10.8 3 × 10³/2.2 × 102 = 13.63 8.0 × 10⁻¹
138/134 71.7/2.4 = 29.8 3 × 10³/2.5 × 102 = 12 2.5 × 101
Pb 208/207 52.3/22.6=2.31 1 × 10²/48 = 2.0 1.1 × 101
208/206 52.3/23.6 = 2.22 1 × 10²/40 = 2.5 9.0 × 10⁻¹
K**: A factor of change in natural isotopes ratio to isotopes ratio after experiment (Nn/Nexp).
The “geometric” factor shows the influence of boundary conditions (Fig. 3a andb). The maximal surface change was observed at the interfaces between radiatedand unirradiated (screened) areas. The screened areas had the insignificant changein topological structure and chemical structure.
Table 11. Dependence main elements on palladium sur-face for various methods of analysis of the same sample.
Element Atomic % (EDX)* TIMS (cps)∗∗
Mg 3.1 ± 0.2 –Fe 6 ± 0.2 ∼ 5.0×10³±2.5×10²
Al 3.7 ± 0.2 ∼ 9.0×10⁵±2.5×10³
Ga 2.4 ± 0.4 ∼ 7.0×10³±2.5×10²
O 50 ± 1.5 –Ca 2.7 ± 0.3 ∼ 2.2 × 10³ ± 1 × 10²
(42, 43, 44 isotopes)Ti 4.3 ± 0.3 –
* The volume of analysis by X-ray spectral method (EDX)on electronic microscope JEOL JSM ∼ I µm3.** TIMS: thermo-ionization method; cps: impulses (ions)per second in the sample after experiment minus the ac-count in the initial sample. Using TIMS method, analyzeda Pd strip 1–2 mm thick and 20 mm in length, includ-ing a zone under the screen. The field volatilizes tens ofangstrom unit from the sample surface during the analysis.

14
Fig. 1. Blisters on Pd surface after 22-hour deuterium discharge exposure. (a) Needle formations onthe boundary of radiated and unirradiated areas. (b) Broken cocoon. (c) Microexplosion “crater”.
a. Needle formations on the boundary b. Broken cocoon. c. Micro explosion "crater"
Fig. 2. New formations on Pd surface after deuterium bombardment.
As can be seen in Table 13, the composition (in quantity and element content) ofeach element in the 1 µm-diameter point do not coincide (do not equal) with allanalyzed Fig. 4a area 250 × 200 µm2. The sample (1610/2) is one upper in eightfoils-multilayer sample in this experiment. Upper sample was partly melted duringexperiment. However, heat balance was not estimated in this experiment.
The separate elements content, analyzed of 1610/2 area ∼ 300 × 220 µm2, withelements content on the 1 µm diameter area were compared. Data of Table 13
showed same difference in additional elements content and close values for mainelements for homogeneous place of the surface.
a. radiated and unirradiated areas b. radiated area on the left
Fig. 3. New formations on the boundary (a) of radiated and unirradiated areas (b) radiated area onthe left Fig. 4c. The screened area from glow discharge radiation.

15
Table 12. Chemical composition change in new formations areas (Fig. 2c).
Atomic percentsElement
Point 1 Point 2 Point 3 Point 4 Point 5 Point 6
O 60.1 ± 1.2 21.5 ± 1.2 52.3 ± 1.5Al 2.1 ± 0.9 0.5 ± 0.3 0.8 ± 0.2Mg 1.5±0.5Si 1.4±0.5Ti 4.3 ± 0.3Ga 0.5 ± 0.4 1.7 ± 0.6 1.6±0.9 1.5 ± 0.6Mo 1.6 ± 0.2 3.4 ± 0.6 4.2±0.8 2.6 ± 0.5 1.1 ± 0.3Pd 97.9 ± 0.3 33.1 ± 0.7 93.5 ± 0.9 94.2±0.9 74.4 ± 1.1 40.7 ± 1.0
3.5. Conformity Between Changes in Element Composition ofPalladium and Structural Changes (Method EDX)
The most essential changes of structure are observed with an increasing in dischargetime. For example, numerous swellings - blisters (Fig. 1) and various growth
a. b. c.
Fig. 4. (a) Pd surface after deuterium irradiation by dose ∼ 8 × 10²¹ sm−2. (b) Screening zones
(Pd # 1610, 30 mA, 400±20 V, P ∼ 5Torr, 4 h in H→D. Set included eight foils. Three Pd foilwere partially melted). Crater on the end of crack on back sample.
Table 13. Additional elements in Pd after deuterium bombardment (EDX,atomic percent).
At. % , Fig. 4a (1610/1) At. % , (1610/2)Element
Point 1 (1 µm) All areas Point1 (1µm) All areas
O 13.3 ± 0.2 55.9 ± 1.2Na 1.2 ±0 .2Mg 1.4 ± 0.3 0.7 ± 0.1 1.25 ± 0.3 0.95 ± 0.3Al 1.3 ± 0.2 0.9 ± 0.1 0.27 ± 0.3 0.53 ± 0.17Si 0.4 ± 0.1 0.49 ± 0.2 0.25 ± 0.1Ga 2.0 ± 0.2 0.8 ± 0.1 2.32 ± 0.25 2.32 ± 0.2Mo 1.2 ± 0.1 0.82 ± 0.1 0.53 ± 0.16 0.47 ± 0.16Pd 80.4 ± 0.4 39.13± 0.2 95.0 ± 0.3 95.36 ± 0.25W 0.3± 0.05 0.12 ± 0.1 0.12 ± 0.08

16
formations are observed: needle-shaped growth and formations similar to cocoons(Figs. 2 and 3). Especially considerable changes of structure were observed onboundaries of the irradiated and unirradiated areas (Fig. 3). Examples of thestructures forming after irradiation by low-energy ions and the element compositionin these areas are explored in details (Figs. 3 and 4 and Tables 12 and 14).
4. Discussion. Transmutation Effect
Earlier it was shown that the irradiation by ions with energy <1 keV at glowdischarge causes complexes of defects (dislocations and their aggregations, pores)depending on type of bombarding ions, temperature of irradiation and fluence ofions. The ions implantation with such energies can occur to depths of no more thanseveral atomic layers. However, the radiation type defects under conditions of stressconcentration gradient were formed.14 In this case, the gas atoms are implanted todepths up to several millimeters. In addition, voids in volume of cathode materialirradiated with low-energy ions are formed.13 Earlier Matveenko (IAE “KurchatovCenter”) showed (applied to the first wall of a thermonuclear reactor) that pressurein the pores under hydrogen ions energy of <1 keV could reach some hundreds ofatmospheres.
The appearance of new elements absent in the sample and constructive parts ofthe apparatus before was found in the samples irradiated on glow-discharge cathode.An increase in the quantity of the impurity elements hundreds and thousands oftimes was revealed. Besides a change in the isotope ratio of elements from tensof percent up to hundreds of times3 was observed. The analysis of the samplesirradiated in glow discharge for more reliable results was carried out by severalmethods: a mass spectrometry and X-ray microanalysis in several Institutes of thecountry (including GIRedMet, IPhChAS, Tomsk Polytechnic Institute, “Lutch”).The greatest changes of the isotope and element composition were observed in “hotpoints”: places of microexplosions, craters of plasma microdischarges.9
It is difficult to say what process is primary-microexplosions, microdischargeson structural inhomogeneities, growth formations, and phase inserts; or formationof new elements and phase segregations in places of microexplosions is the result ofelements transmutations in the micromelting zones. New elements formation as theresult of DD-reactions at the cracks edges with oxide films, so-called acceleratingeffect, is possible too. It might be the consequence of “overvoltages” incipient on“spikes” formations (cone-shaped or needle-shaped) and resulting in instantaneousmicromeltings or microexplosions. In these cases, processes similar to the processesin constructional materials of the nuclear reactors with the formation of micromelt-ings zones (“thermal” peaks) are possible, too. It is difficult to estimate the priorityof these processes. Every possible, the ions concentration gradient and tempera-ture gradient can contribute to the change of cathode structure. Ivanov11 showedthat a formation of pulsing microplasma discharges (unipolar arcs) on structuralirregularities (heterogeneities), impurities segregation and oxide films in the surfacematerial layer was possible.

17
Examination of the radioactivity change, the isotope and element compositionof the uranium samples (uranium component decrease and thorium component in-crease by gamma-spectrometry, mass spectrometry and EDX) in glow dischargeshowed the opportunity of stimulation of nuclear transmutations processes underlow-energy actions.7,8 It is impossible to explain the increase of integrated αt, βt, γturanium emission and the change of ratio of uranium energy peaks and its daugh-ter elements (231,234Th and 234U) after experiments in glow discharge by pollution(impurity) from medium (environment) or by some other effects.
The maximum quantity of additional elements at glow discharge experimentsshould be observed under equivalent conditions for heavier ions (e.g., an argon) if“additional” elements appearance is a result of cathode sputtering or redistribu-tions of these elements in volume of the ion irradiated material. These quantitiesshould grow according to masses and ionic radiuses of bombarding ions in the follow-ing sequence: a minimum quantity for the hydrogen irradiated samples, a greaterquantity—for deuterium irradiated samples, and a maximum quantity for heavy-ions irradiated samples (argon and xenon), respectively. We observed a maximumquantity of additional elements and their maximum variety at deuterium discharges.Smaller quantities of these elements and a smaller variety of them were observedat hydrogen discharges and minimum of variety for argon and xenon.2 One cansee that the peak effect on characteristic spectrums was for experiments in deu-terium. Dependence of additional elements quantity on ions current density andon temperature of process is very significant and ambiguous. In this case, it isdifficult to take into account the action of plurality of simultaneously proceedingprocesses. Probably, both new additional elements formation and preferable sput-tering of lighter elements simultaneously occur under low-energy ions irradiation.The accelerated (speeded) surface diffusion, the impurity components segregationsnear dislocations and other defects are also take place. A series of experiments4
showed a dependence of the element composition change on current density andworking gas composition (medium) (Tables 6 and 7). So, a maximal increase of Agquantity was observed for the greatest current density of 35 mA/sm2 (250 times orfrom 20 up to 5000 ppm). A comparison of the discharge in hydrogen, deuteriumand the discharge with preliminary irradiation in hydrogen and then in deuteriumshowed, that additional quantity of Ag appearance was minimal (up to 200 ppm).The isotope and element composition changes essentially depend on such parameterof process as current sort. The isotope changes obtained by TIMS method for ex-periments with direct current are given in Tables 7 and 8 and with pulsing current inTables 9 and 10. A significant change was observed for 56/57Fe (∼1000) in puls-ing current experiment, this change being significant not only on value of ratio,but also on absolute value. So, for a sample after experiment with pulsing currentN(N57Fe–N56Fe) = 3840 cps, and the natural iron 56/57 isotopes ratio is about40, 56/57 isotope ratio after experiment is ∼0.04. The 56/57 isotopes ratio forSample 1610 at direct current was ∼10. It means that the ratio decreases 4 timesdue to an increase of the contribution of 57Fe (a heavier isotope). Thus, a change in

18
the 56/57Fe isotope ratio by a factor of more than 100 for experiment with pulsingcurrent was observed.
For the same Sample 1610 the isotope ratio of 48/47Ti increases ∼2.5 times and48/46Ti increases almost ∼3.8 times due to a decrease of contribution of a heavierisotope (the most spread 48Ti isotope). The 52/53Cr isotope ratio also decreasesdue to a decrease of contribution of heavier isotope 53. Thus, it is impossible toexplain this effect by sputtering of a lighter isotope or by isotopes separation. Alsoit is impossible to explain it by diffusion coefficient.
The 56/57Fe isotope ratio in 1694 as compared with natural ratio of isotopesis ∼2.3 (Table 1). The 48/46Ti isotope ratio comparison is about ∼5.46. SamplesNo. 1610 and No. 1694 had different experimental conditions. So No. 1610 was amultilayered compound and after experiment some melting areas and even crackswere found on it and No. 1694 was single-layered and its surface after experimentwas more homogeneous.
We would like to pay special attention to detection of isotopes with mass number59 (Co), cps of which was ∼103 cps, for 55 (Mn) ∼103 cps, for 45 (Sc) ∼ 102 cps.They were found in a plenty in the samples after experiment but they were foundin initial samples.
The comparison of the quantity of the elements analyzed by method SMS withpossible reactions of fusion-fission of nucleus is given in Table 15 in view of con-formity of their masses, their spin and parity. The opportunity of simultaneousappearance of particular isotopes groups in samples is supposed, i.e. formationof such elements as Mg and Br (1); Mg and As (2); Si and As (3) in the samelow-energy process in glow discharge.
The variants of the reactions given in the table are possible from the results ofthe analysis. It is possible to see the presence of isotopes with mass numbers 26and 80 as results of reactions (1–4), 19 and 88 - reaction (5), 50 and 56 - reaction(6) in one analyzed sample.
It could be possible to explain the appearance of chemical elements in the sam-ples irradiated by ions in glow discharge by such reactions, but the high Coulombbarrier makes the probability of such processes insignificant. Rodionov12 paid at-tention to the fact that the Coulomb barrier is a classical concept and the repre-sentation of it at nuclear distances does not work. It means that the concept of theCoulomb barrier is not meaningful in quantum ensembles for low energies of inter-acting particles. It makes possible multinuclear reactions in low-energy processes.
Therefore, it is supposed that Fe, Ni, and Ti can appear in the following reac-tions:
α + 10246 Pd → 46
22Ti + 6026Fe∗ + 20.1 MeV, (7)
or → 4822Ti + 58
26Fe + 25.1 MeV, (8)
or → 5022Ti + 56
26Fe + 26.5 MeV. (9)

19
Tab
le14
.A
ddit
iona
lel
emen
tsin
stru
ctur
efo
rmat
ions
afte
rde
u-te
rium
exper
imen
ts(a
tom
ic%
,E
DX
)*
Ele
men
tB
ound
ary
12
3“F
low
er”
Fig
.4a
Scre
ened
zone
Poi
nt1
Poi
nt2
Poi
nt3
All
zone
sPoi
nt4
Poi
nt5
Poi
nt6
12
34
56
78
910
1112
1314
O73
.3±0
.769
.3±0
.743
.4±1
.216
.4±1
.54.
3±1.
326
.4±0
.222
.4±2
.138
.3±1
.366
.2±0
.7N
a0.
13±0
.05
0.13
±0.1
01.
7±0.
43.
1±0.
30.
63±0
.25
Mg
0.12
±0.0
40.
2±0.
11.
0±0.
21.
2±0.
31.
1±0.
20.
9±0.
31.
6±0.
30.
8±0.
21.
6±0.
10.
96±0
.20.
75±0
.19
0.30
±0.0
61.
54±0
.3
Al
2.05
±0.0
41.
8±0.
13.
4±0.
22.
2±0.
10.
5±0.
133.
8±0.
110
.8±0
.1Si
0.3±
0.1
0.3±
0.1
1.0±
0.1
0.4±
0.1
0.6±
0.1
0.5±
0.1
0.3±
0.15
0.27
±0.1
K0.
8±0.
1S
4.1±
0.2
Fe0.
06±0
.03
0.2 ±
0.1
0.20
±0.0
70.
12±0
.06
Ni
0.2±
0.1
Ga
0.22
±0.0
50.
4±0.
10.
8±0.
22.
2±0.
21.
6±
0.1
1.6±
0.2
2.3±
0.2
1.1±
0.2
2.0±
0.2
1.5±
0.2
1.35
±0.1
30.
37±0
.05
2.1±
0.2
Sr0.
06±0
.03
0.2±
0.1
Mo
9.4±
0.1
8.0±
0.1
0.6±
0.1
0.4±
0.1
0.16
±0.0
80.
10±0
.04
Pd
13.6
±0.1
19.2
±0.1
44.5
±0.3
92.6
±0.7
74.1
±1.1
92.3
±0.4
95.0
±0.3
66.3
±0.3
95.0
±0.3
70.8
±0.3
54.5
±0.3
22.1
±0.1
95.9
±0.3
Cd
0.17
±0.5
0.14
±0.0
50.
2±0.
10.
4±0.
1A
c0.
35±0
.05
0.5±
0.06
1.2±
0.1
2.8±
0.3
2.9 ±
0.25
Pb
0.14
±0.0
40.
2±0.
050.
2±0.
060.
2±0.
10.
17±0
.08
0.16
±0.0
80.
04±0
.02
Sn0.
54±0
.10.
15±0
.1W
0.6±
0.1
0.6±
0.1
0.21
±0.0
70.
16±0
.06
0.08
±0.0
40.
07±0
.02
*Vol
tage
25kV
,#
1694
.

20
However, for reactions (7–9) with the participation of α-particles, first the fol-lowing possible reactions are to proceed:
d + 10446 Pd → 22
10Ne + 8035Br∗ + α + 5.21 MeV, (10)
d + 10546 Pd → 23
10Ne∗ + 8035Br∗ + α + 3.3 MeV, (11)
d + 10846 Pd → 4
8Be∗ + 9841Nb∗ + α + 2.75 MeV, (12)
9841Nb∗ → 51M:β−2.3, 1.9 : γ787.3, 722.7 → 98
42Mo,
Table 15. Isotopes ratio in possible nuclear reactions in Sample No. 1734 (SMS).
Mass cps Possible reactions
26 40 d + 10446 Pd → 1226Mg + 80
35Br∗ + 15.8;8035Br∗ → 17.66M:β−2.00 : γ616.6 →80
36 Kr;or 80
35Br∗ → 17.66MeV : β+.85 : ×γ616.6 → 8034Se
1
80 60000d + 108
46 Pd → 2612Mg + 80
33As∗ + α + 12.2;8033As∗ → 16S:β−5.4, 4.7 : γ665.9 → 80
34Se2
d + 10446 Pd → 26
14Si∗ + 8033As∗ + 2.63 MeV 3
α + 10246 Pd → 26
12Mg + 8036Kr + 8.60 MeV
2614Si∗ → 2.235S:β+3.83 : γ829 → 26
13Al∗ → 6.345S:β+3.21 → 2612Mg
2613Al∗ → 7.3E5 A:β + 1.17 : γ1808.6 → 26
12Mg
4
19 80 p + 10646 Pd → 19
9 F + 8838Sr + 4.42 MeV
588 50
50 30 α + 10246 Pd → 50
22Ti + 5626Fe + 26.5 MeV
656 18
d + 10446 Pd → 30
15P∗ + 72
30Zn∗ + α + 9.64 MeV,
α + 10246 Pd → 22
10Ne + 8438Sr + 3.16 MeV,
α + 10246 Pd → 18
10Ne∗ + 8838Sr + 2.92 MeV,
α + 10446 Pd →22
10 Ne + 8638Sr + 5.55 MeV,
α + 10646 Pd → 24
10Ne∗ + 8638Sr + 2.98 MeV,
α + 10846 Pd → 22
10Ne + 9038Sr + 6.85 MeV
It is necessary to note that TIMS in analyzed samples revealed masses of iso-topes 18 and 22 to a small extent many times. Isotopes of molybdenum were alwayspresent significantly. As it was noticed earlier, molybdenum could also be a conse-quence of its over-sputtering from the surface of the sample holder. Mass of isotope

21
22 in a quantity of 60 cps and mass 80 in a quantity of 95 cps were also observedin this spectrum.
d + 10246 Pd → 22
10Ne + 8237Rb + 5.90 MeV.
Masses 22 and 82 were also present in TIMS spectrums of this sample in quan-tities of 60 and 540 count per second (cps). It is necessary to note that the instablefinding of Ag by method EDX6 could be a result of formation
10847 Ag∗
,10647 Ag∗
,10847 Ag∗
,11047 Ag∗
in the following reactions with the further transmutation of these isotopes intostable.
d + 10446 Pd → 106
47 Ag∗ + 10.7 MeV,
10647 Ag∗ → 24.0M : β−1.96 :γ511.9 → 106
48 Cd,
d + 10646 Pd → 108
47 Ag∗ + 10.8 MeV,
10847 Ag∗ → 2.39M : ε : β−1.65 :γ633.0 → 108
48 Cd
d + 10846 Pd → 110
47 Ag∗ + 11.1 MeV,
11047 Ag∗ → 24.6S : β−2.981 :γ657.8 → 110
48 Cd.
The opportunity of going above described reactions with the formation of argen-tums isotopes in an excited state and their subsequent transition into stable statecan help to understand that the results of finding many elements change with achange in the interval of the samples analysis time after the experiment termina-tion. This fact is undoubtedly important, and it is necessary to take into accountwhen isotopes quantity and their composition are to be correctly estimated, as theperformance of the analysis at the time planned after the experiment terminationis not always feasible.
5. Conclusion
1. The complex of examinations showed that changes of structure and elementcomposition in the samples irradiated by glow discharge ions depended on:(a) density of ions flow, (b) dose of irradiating ions, (c) kind of irradiatingions, and (d) sort of current and other parameters of process.
2. Dependence on parameters is ambiguous as some factors simultaneouslyaffect the change of composition.
3. More homogeneous structure and more homogeneous change of compositionare observed for long experiments.

22
4. Maximum changes of element composition are observed in “ hot (active)points ” - micro craters, areas of micromelting and others new structuralformations.
5. Various methods of low-energy action on different materials give a formationof plurality of basic elements (Si, Al, Mg, and Ca) found by various methodsof the analysis of these materials. Such more rare elements as Mn, Sc, Co,Sr, Ne, and Ba were found in a smaller extent.
6. The peak changes of the 56/57 iron isotope composition (1000 times) wereobserved for pulsed current.
7. A comparison of elements and isotopes found by various analysis methodswith possible types of fusion-fission reactions is carried out.
Acknowledgements.
Authors express the gratitude to corresponding member of the Academy of SciencesI.I. Fedik (“Lutch”) and Professor, Dr. B.U. Rodionov (MEPhI) for valuable notesby preparation of this article.
References
1. I. Savvatimova, Ya. Kucherov, and A. Karabut, Transaction of Fusion Technology 26,4T, 389 (1994).
2. I. Savvatimova, A. Senchukov, and I. Chernov , ICCF6, Progress in new hydrogenenergy. Japan (1996), p. 575.
3. I. Savvatimova, A. Karabut, Nuclear Reaction Products Registration. Surface,Moscow: RAN (1996), Vol. 1, p. 63.
4. I. Savvatimova B, Karabut A.B., Radioactivity of the Pd cathode after GD. Surface,Moscow: RAN (1996), Vol. 1, p. 76.
5. I. Savvatimova, Transmutation in cathode materials at GD. ICCF-7, Canada (1998),p. 342.
6. I. Savvatimova, Reproducibility of experiments in GD, ICCF8, Italian Phys. Society,Italy (2000), p. 277.
7. J. Dash, I. Savvatimova and H. Kozima, Effects of GD on Radioactivity Proc. ICENES2002 (2002), p. 122
8. J. Dash, and I. Savvatimova, Effects of glow discharge with hydrogen isotope plasmason radioactivity of uranium, Proc. ICCF10, Bejing, China, 2002.
9. I. Savvatimova and D. Gavritenkov, Results of Ti analysis after GD. Proc. ICCF11(2004).
10. A. Karabut, Ya. Kucherov, and I. Savvatimova, Possible nuclear reactions mechanismsat glow discharge in dseuterium. Proc. ICCF3, Japan (1992), p. 165
11. V. Ivanov, Excitation and effect of microplasma discharges on metals and alloys in amicrowave plasma torch, Applied Physics B2, 5(2001).
12. Rodionov, Proc. 12 Rus. CF Conf. 2004, Moscow (2005), p. 110.13. Ya. Kucherov, A. Karabut, and I. Savvatimova, Phys. Let. A170, 265 (1992).14. G. Vorontzova, and I. Savvatimova, Atomic Energy 69(5), 297 (1990).