inflation report february 2008. money and asset prices
DESCRIPTION
Chart 1.1 Bank Rate and market interest rate expectations (a) Sources: Bank of England and Bloomberg. (a) The February 2008 and November 2007 curves are based on fifteen working day averages to 6 February and 7 November respectively. These curves are estimated based on a combination of general collateral gilt repo rates at short maturities and instruments that settle on Libor at longer horizons (see box on page 12 of the November 2007 Report). The August 2007 curve is based on the average of one-day forward rates in the five working days to 1 August; those rates were derived from instruments that settle on Libor, adjusted for credit risk.TRANSCRIPT
Inflation Report Inflation Report February 2008February 2008

Money and asset pricesMoney and asset prices
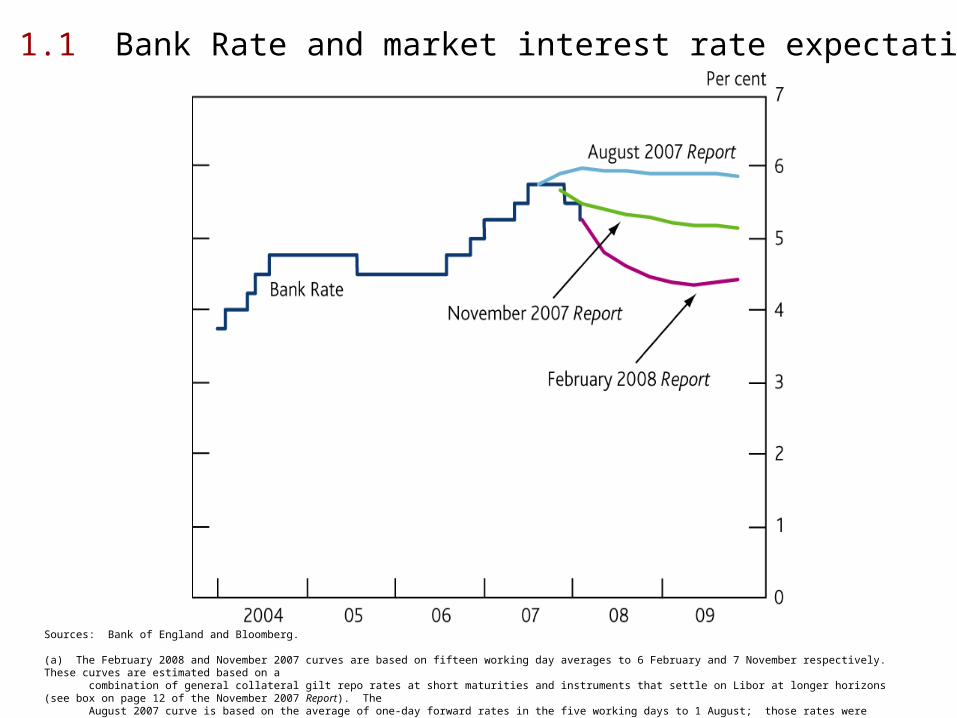
Chart 1.1 Bank Rate and market interest rate expectations(a)
Sources: Bank of England and Bloomberg.
(a) The February 2008 and November 2007 curves are based on fifteen working day averages to 6 February and 7 November respectively. These curves are estimated based on a combination of general collateral gilt repo rates at short maturities and instruments that settle on Libor at longer horizons (see box on page 12 of the November 2007 Report). The August 2007 curve is based on the average of one-day forward rates in the five working days to 1 August; those rates were derived from instruments that settle on Libor, adjusted for credit risk.
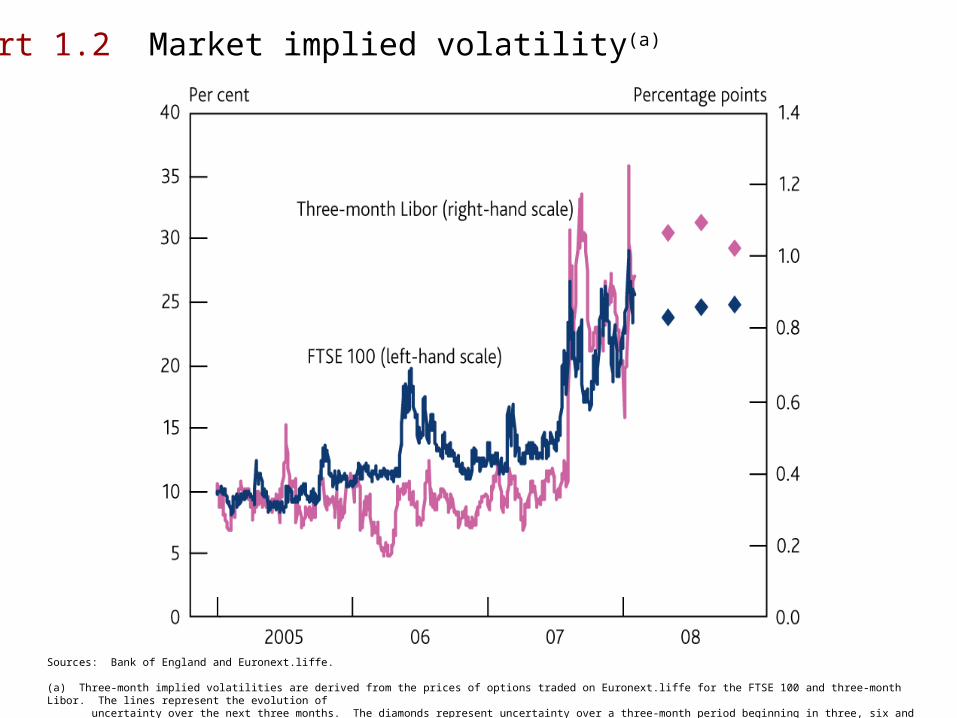
Chart 1.2 Market implied volatility(a)
Sources: Bank of England and Euronext.liffe.
(a) Three-month implied volatilities are derived from the prices of options traded on Euronext.liffe for the FTSE 100 and three-month Libor. The lines represent the evolution of uncertainty over the next three months. The diamonds represent uncertainty over a three-month period beginning in three, six and nine months’ time respectively.
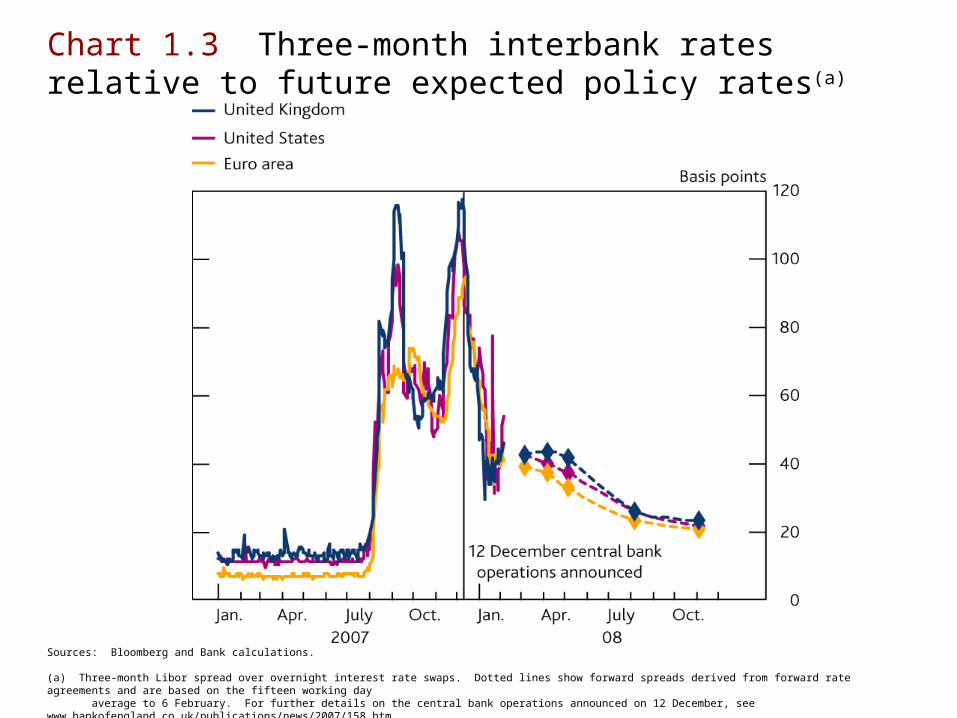
Chart 1.3 Three-month interbank rates relative to future expected policy rates(a)
Sources: Bloomberg and Bank calculations.
(a) Three-month Libor spread over overnight interest rate swaps. Dotted lines show forward spreads derived from forward rate agreements and are based on the fifteen working day average to 6 February. For further details on the central bank operations announced on 12 December, see www.bankofengland.co.uk/publications/news/2007/158.htm.
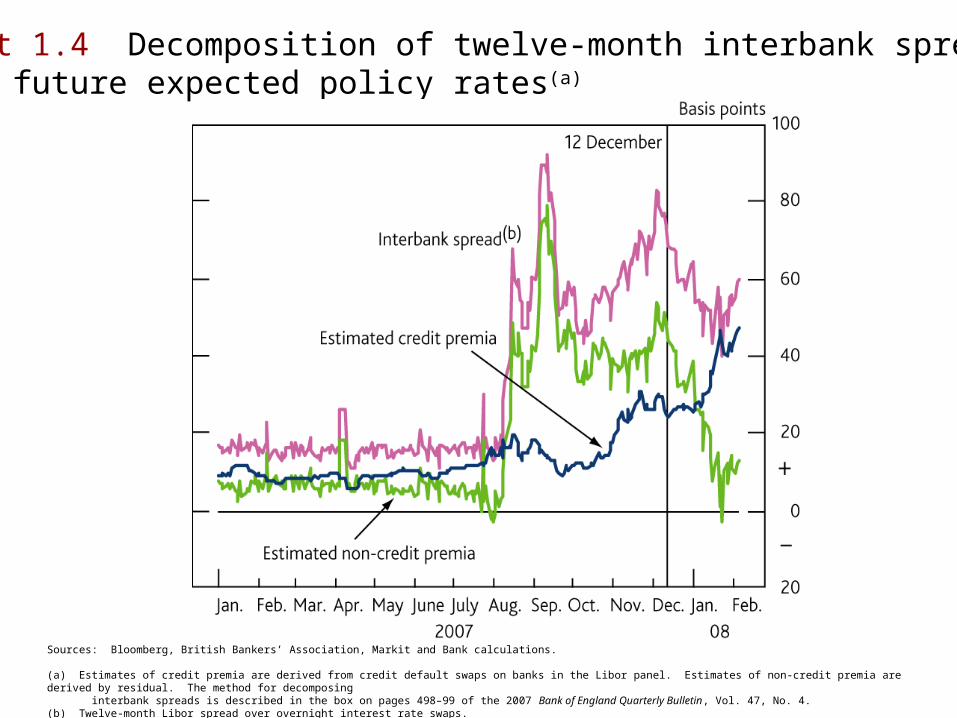
Chart 1.4 Decomposition of twelve-month interbank spread over future expected policy rates(a)
Sources: Bloomberg, British Bankers’ Association, Markit and Bank calculations.
(a) Estimates of credit premia are derived from credit default swaps on banks in the Libor panel. Estimates of non-credit premia are derived by residual. The method for decomposing interbank spreads is described in the box on pages 498–99 of the 2007 Bank of England Quarterly Bulletin, Vol. 47, No. 4.(b) Twelve-month Libor spread over overnight interest rate swaps.
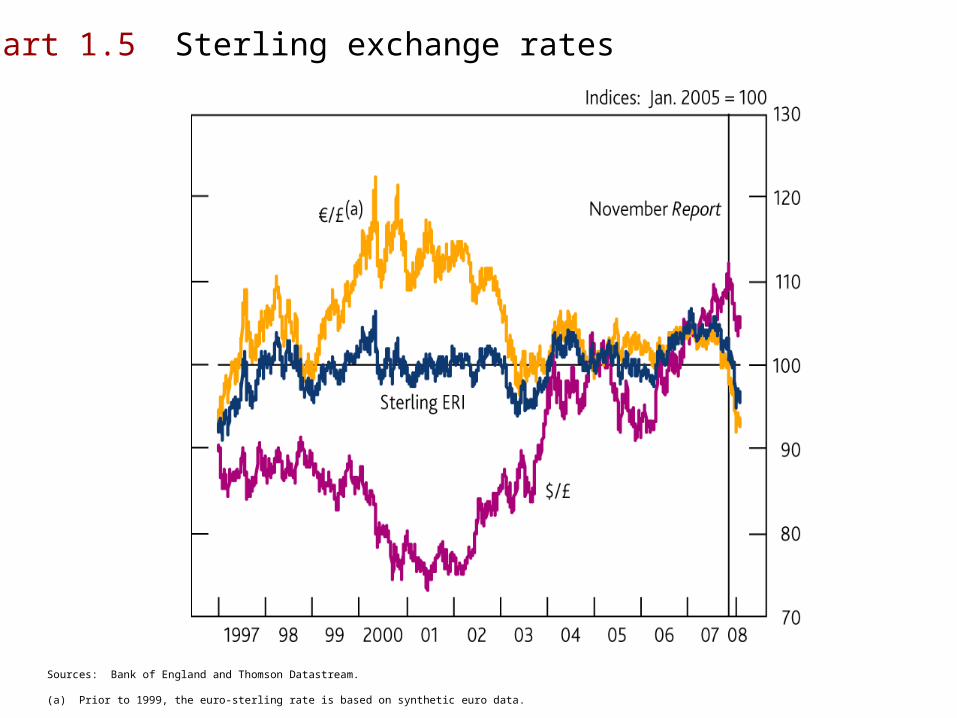
Chart 1.5 Sterling exchange rates
Sources: Bank of England and Thomson Datastream.
(a) Prior to 1999, the euro-sterling rate is based on synthetic euro data.
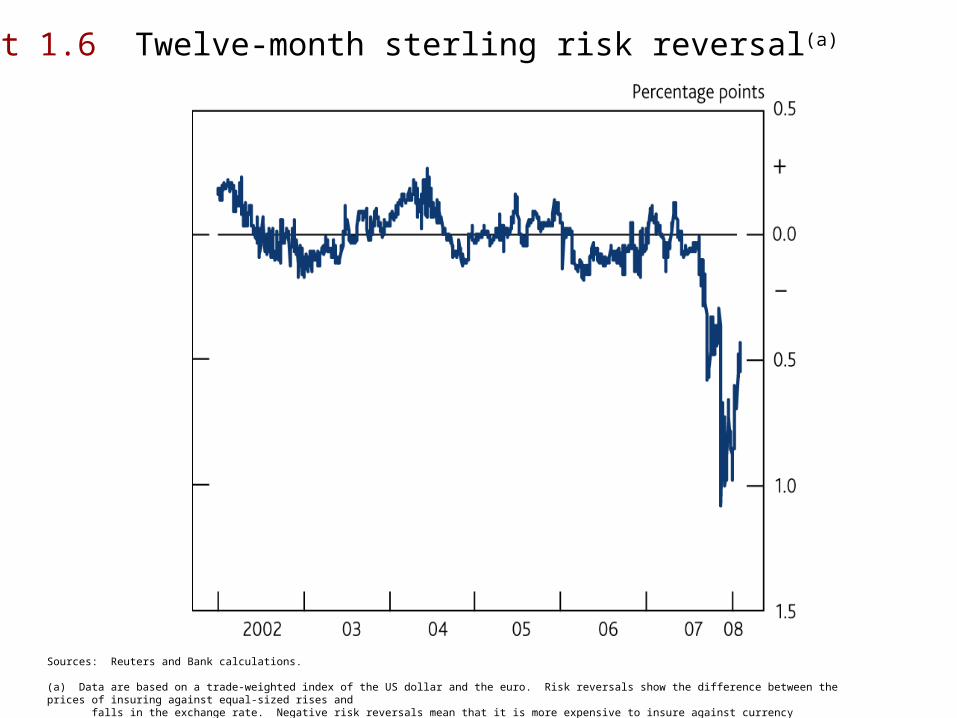
Chart 1.6 Twelve-month sterling risk reversal(a)
Sources: Reuters and Bank calculations.
(a) Data are based on a trade-weighted index of the US dollar and the euro. Risk reversals show the difference between the prices of insuring against equal-sized rises and falls in the exchange rate. Negative risk reversals mean that it is more expensive to insure against currency depreciations than appreciations.
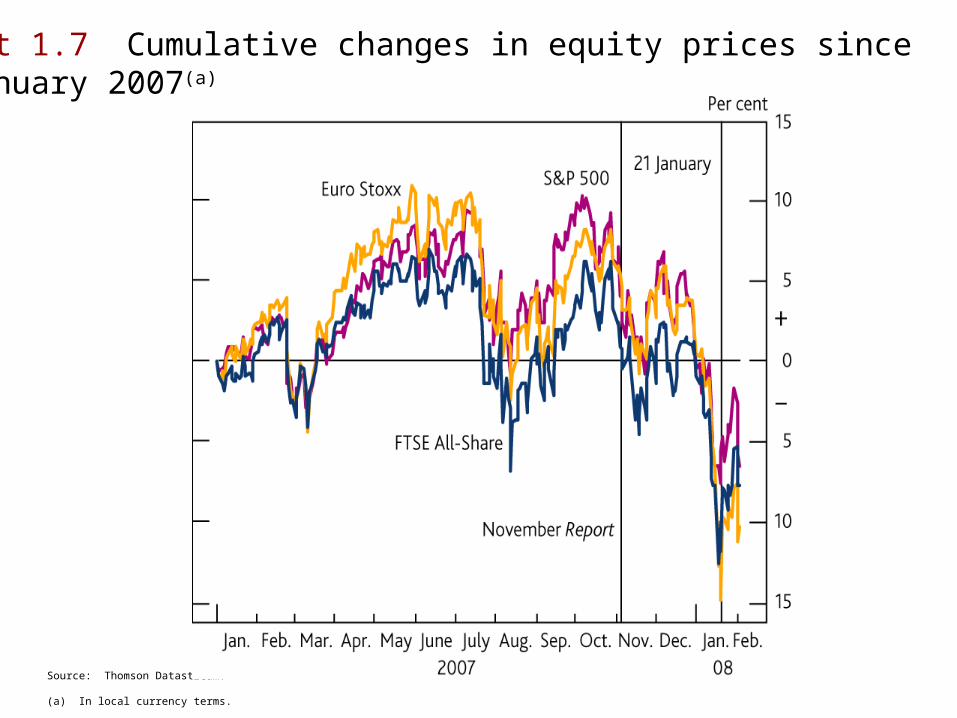
Chart 1.7 Cumulative changes in equity prices since 4 January 2007(a)
Source: Thomson Datastream.
(a) In local currency terms.
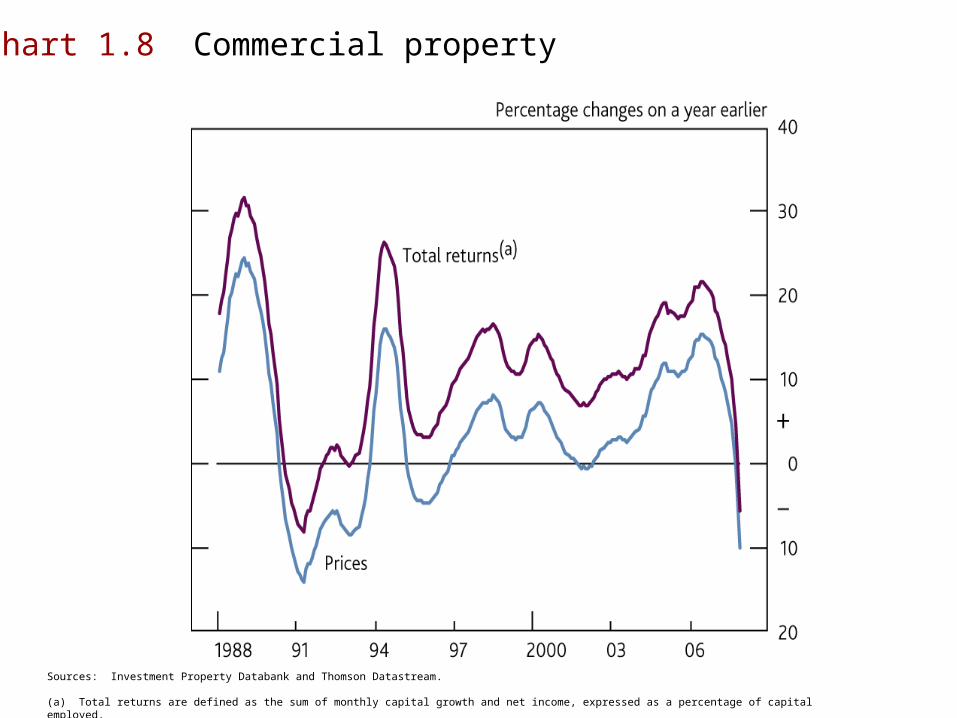
Chart 1.8 Commercial property
Sources: Investment Property Databank and Thomson Datastream.
(a) Total returns are defined as the sum of monthly capital growth and net income, expressed as a percentage of capital employed.
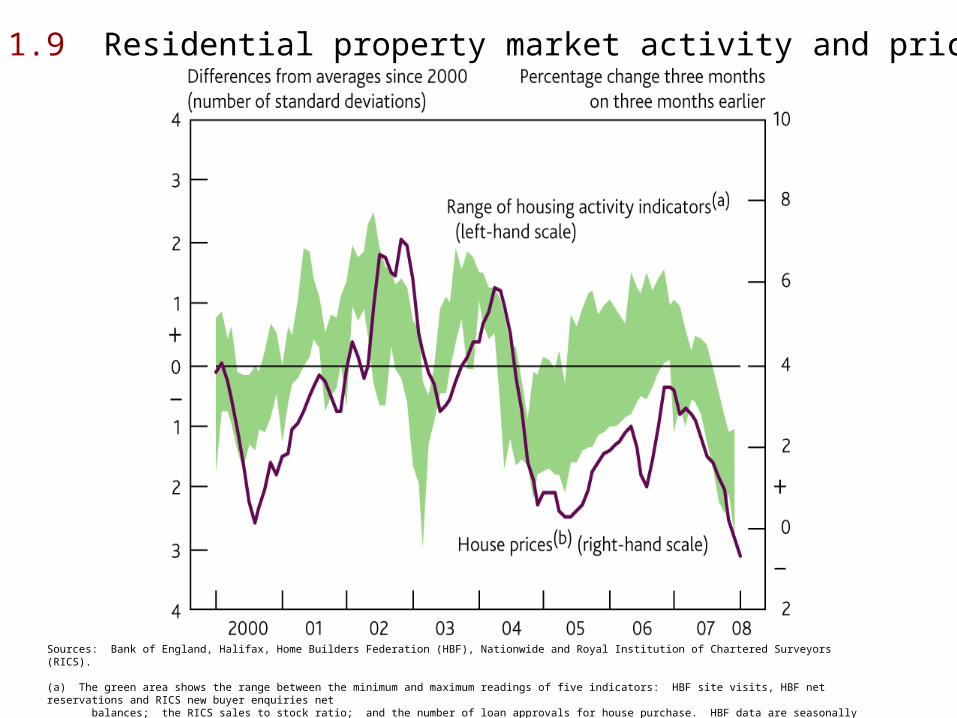
Chart 1.9 Residential property market activity and prices
Sources: Bank of England, Halifax, Home Builders Federation (HBF), Nationwide and Royal Institution of Chartered Surveyors (RICS).
(a) The green area shows the range between the minimum and maximum readings of five indicators: HBF site visits, HBF net reservations and RICS new buyer enquiries net balances; the RICS sales to stock ratio; and the number of loan approvals for house purchase. HBF data are seasonally adjusted by Bank staff.(b) Average of Halifax and Nationwide. The published Halifax index has been adjusted in 2002 by the Bank of England to account for a change in the method of calculation.
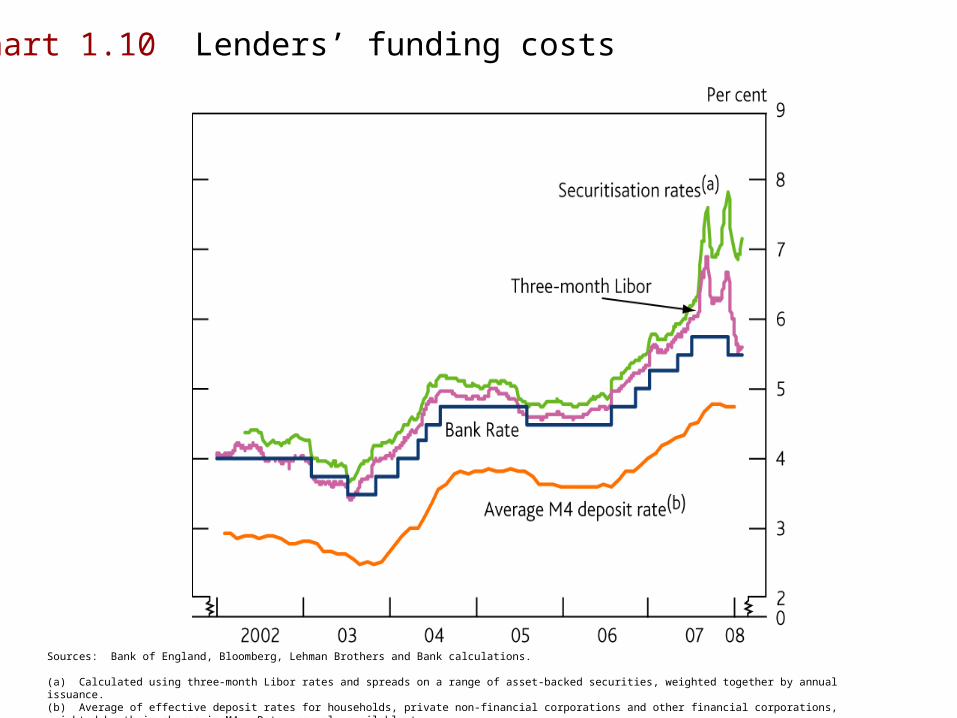
Chart 1.10 Lenders’ funding costs
Sources: Bank of England, Bloomberg, Lehman Brothers and Bank calculations.
(a) Calculated using three-month Libor rates and spreads on a range of asset-backed securities, weighted together by annual issuance.(b) Average of effective deposit rates for households, private non-financial corporations and other financial corporations, weighted by their shares in M4. Data are only available to December.
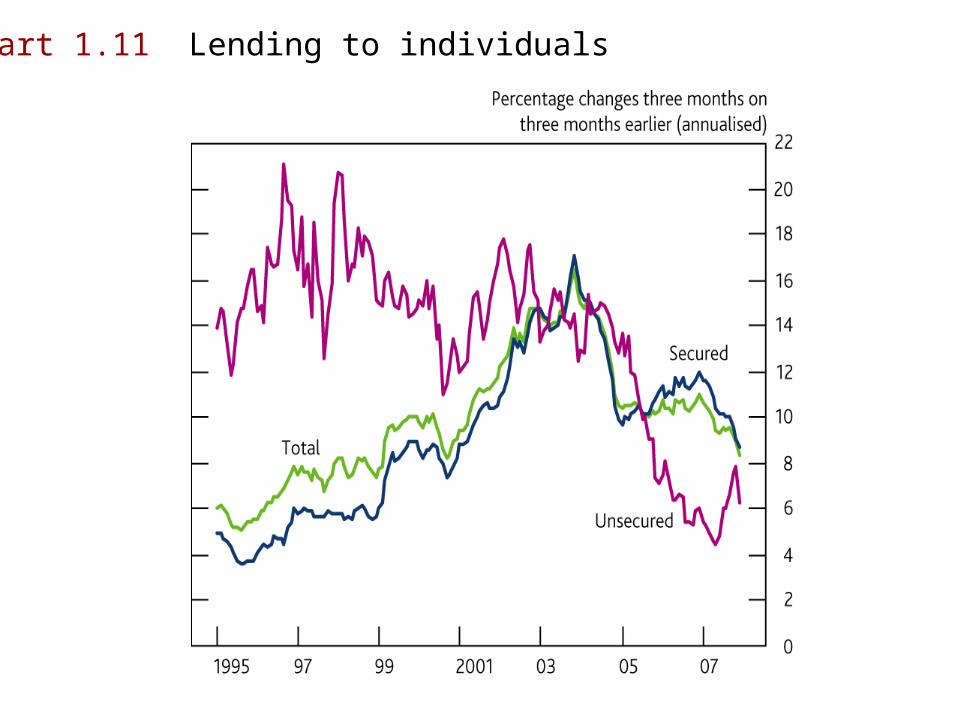
Chart 1.11 Lending to individuals
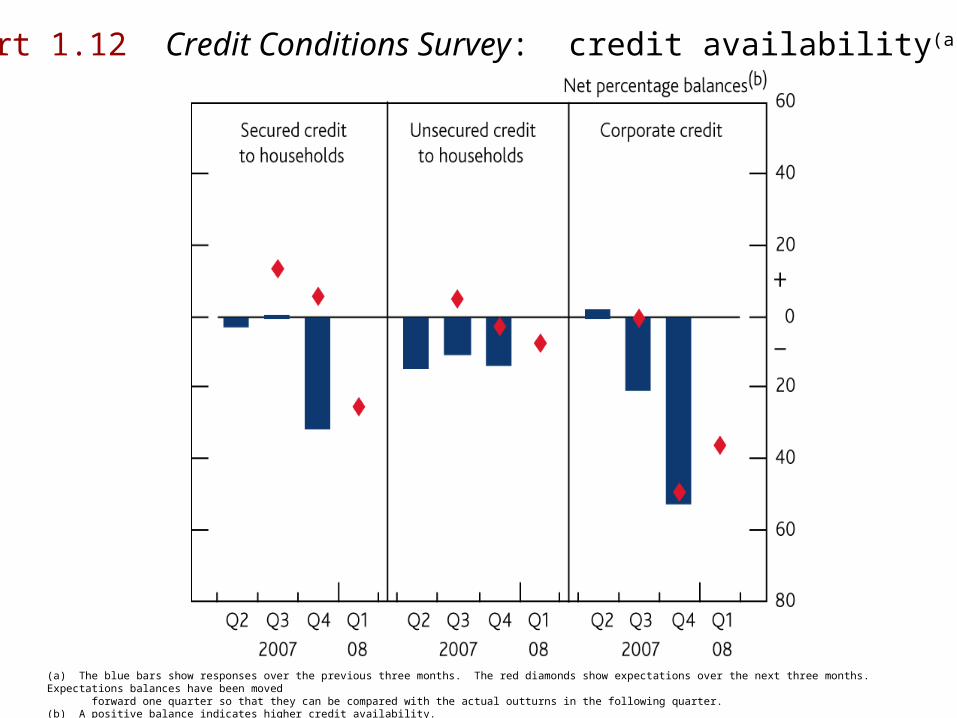
Chart 1.12 Credit Conditions Survey: credit availability(a)
(a) The blue bars show responses over the previous three months. The red diamonds show expectations over the next three months. Expectations balances have been moved forward one quarter so that they can be compared with the actual outturns in the following quarter.(b) A positive balance indicates higher credit availability.
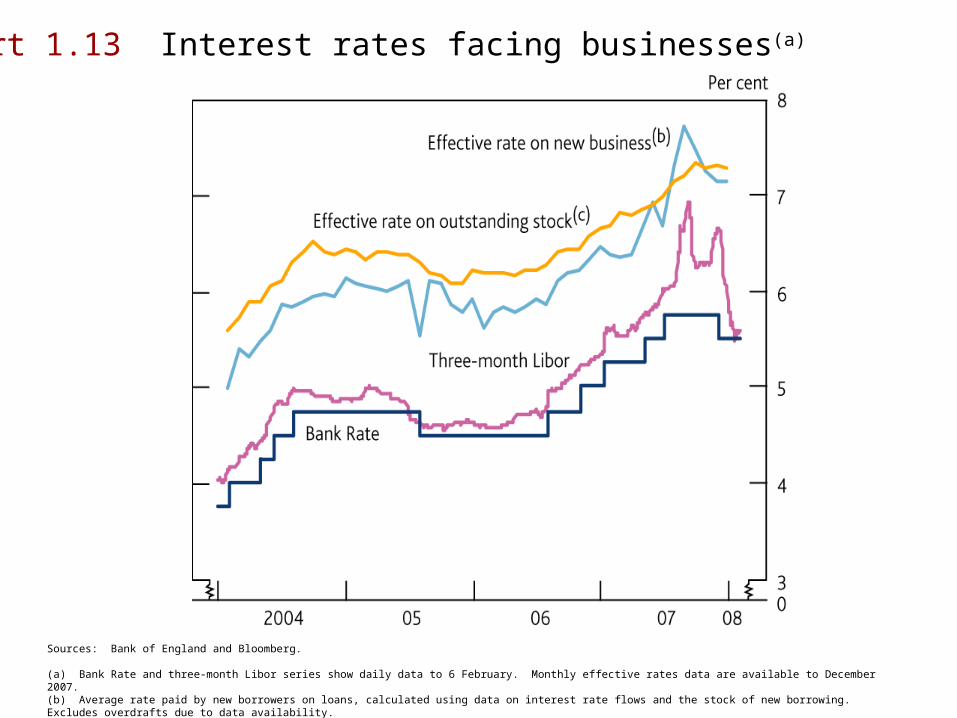
Chart 1.13 Interest rates facing businesses(a)
Sources: Bank of England and Bloomberg.
(a) Bank Rate and three-month Libor series show daily data to 6 February. Monthly effective rates data are available to December 2007.(b) Average rate paid by new borrowers on loans, calculated using data on interest rate flows and the stock of new borrowing. Excludes overdrafts due to data availability.(c) Average rate paid by existing borrowers on overdrafts and other loans, calculated using data on interest rate flows and the outstanding stock of borrowing.
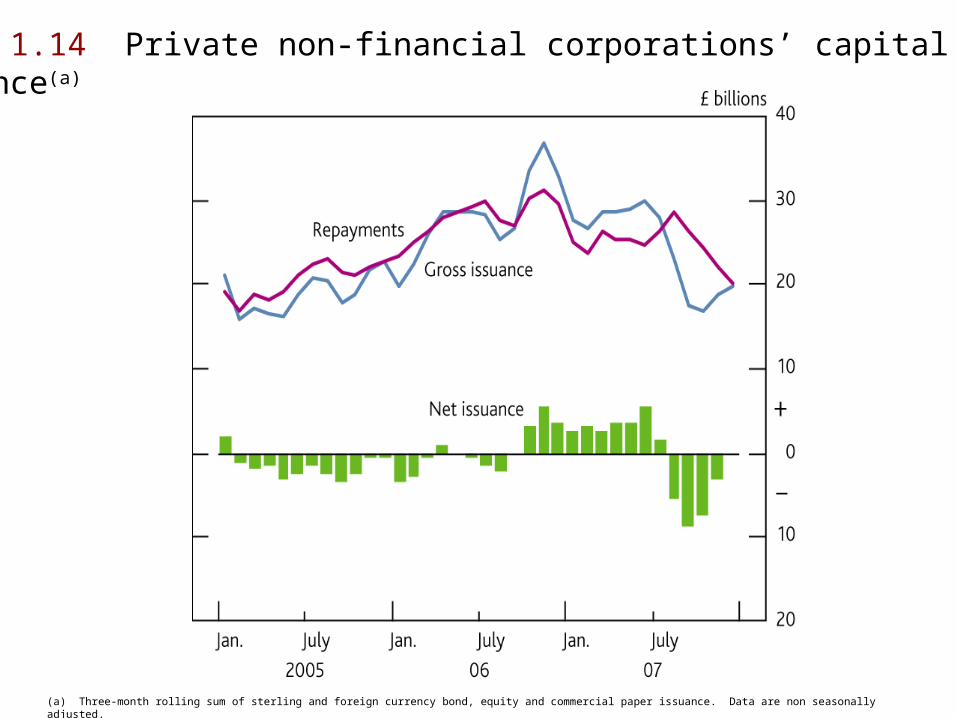
Chart 1.14 Private non-financial corporations’ capitalissuance(a)
(a) Three-month rolling sum of sterling and foreign currency bond, equity and commercial paper issuance. Data are non seasonally adjusted.
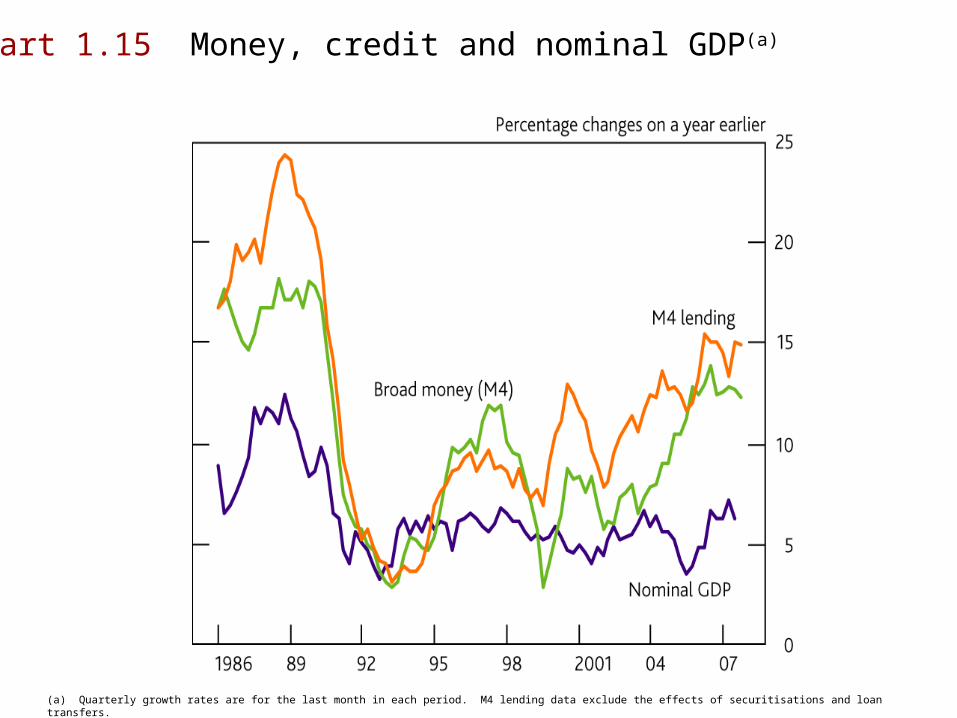
Chart 1.15 Money, credit and nominal GDP(a)
(a) Quarterly growth rates are for the last month in each period. M4 lending data exclude the effects of securitisations and loan transfers.

TablesTables
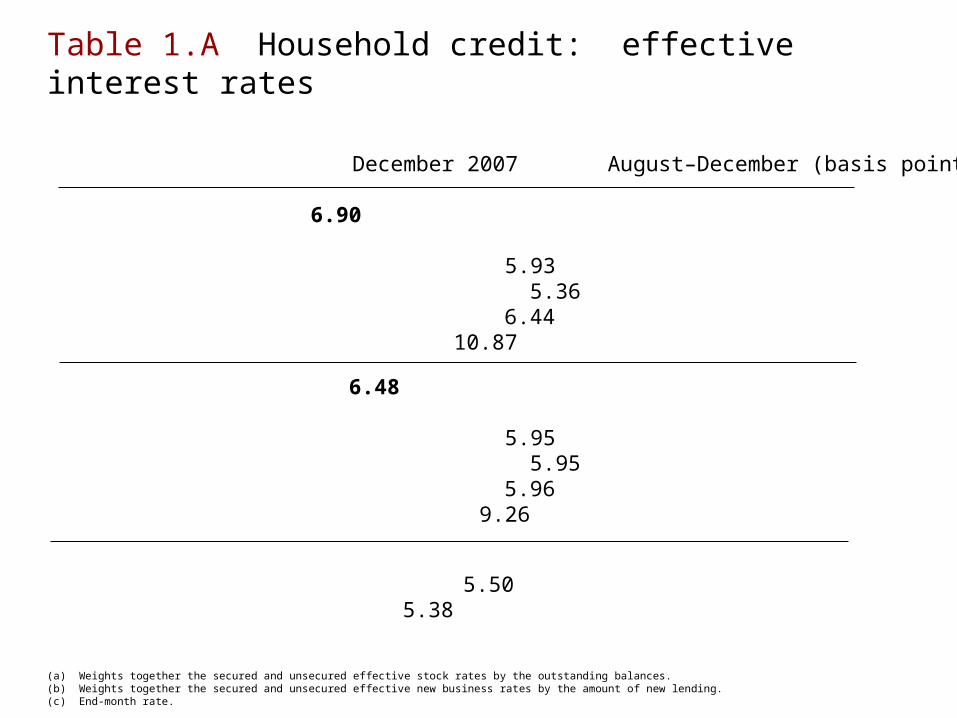
Table 1.A Household credit: effective interest rates
(a) Weights together the secured and unsecured effective stock rates by the outstanding balances.(b) Weights together the secured and unsecured effective new business rates by the amount of new lending.(c) End-month rate.
Per cent Change between December 2007 August–December (basis points)
Rate on outstanding stock(a) 6.90 4 of which: Secured 5.93 2 – fixed 5.36 11 – variable 6.44 -15 Unsecured 10.87 -3
Rate on new business(b) 6.48 14 of which: Secured 5.95 7 – fixed 5.95 21 – variable 5.96 -14 Unsecured 9.26 15
Memo: Bank Rate(c) 5.50 -25 Two-year swap rate 5.38 -77
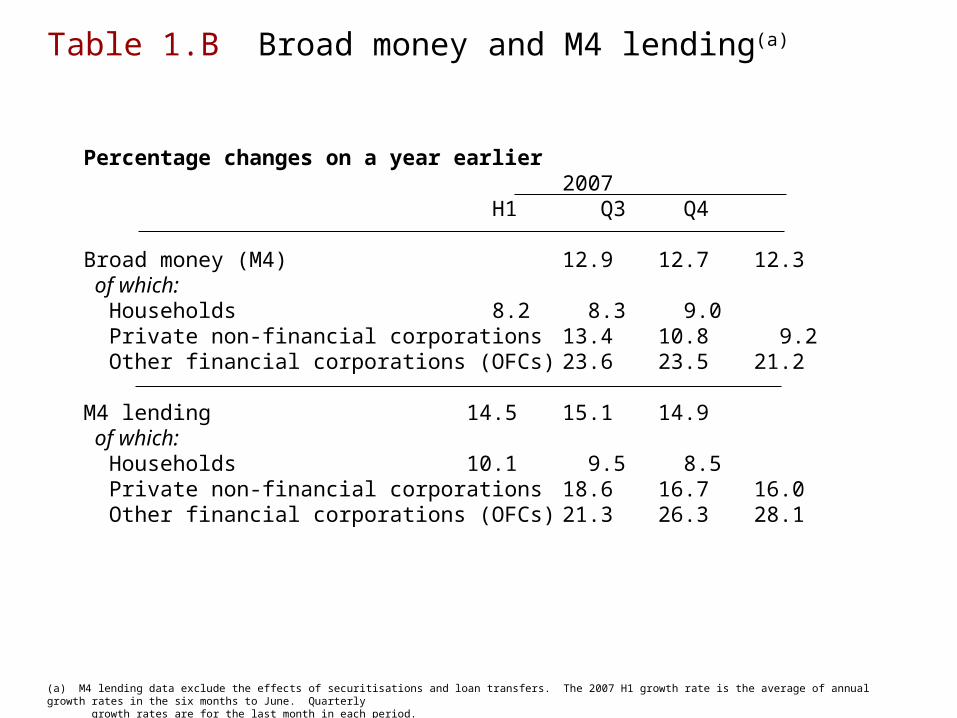
Table 1.B Broad money and M4 lending(a)
(a) M4 lending data exclude the effects of securitisations and loan transfers. The 2007 H1 growth rate is the average of annual growth rates in the six months to June. Quarterly growth rates are for the last month in each period.
Percentage changes on a year earlier2007
H1 Q3 Q4
Broad money (M4) 12.9 12.7 12.3 of which: Households 8.2 8.3 9.0 Private non-financial corporations 13.4 10.8 9.2 Other financial corporations (OFCs) 23.6 23.5 21.2
M4 lending 14.5 15.1 14.9 of which: Households 10.1 9.5 8.5 Private non-financial corporations 18.6 16.7 16.0 Other financial corporations (OFCs) 21.3 26.3 28.1

Terms and conditionsTerms and conditionson bank lendingon bank lending
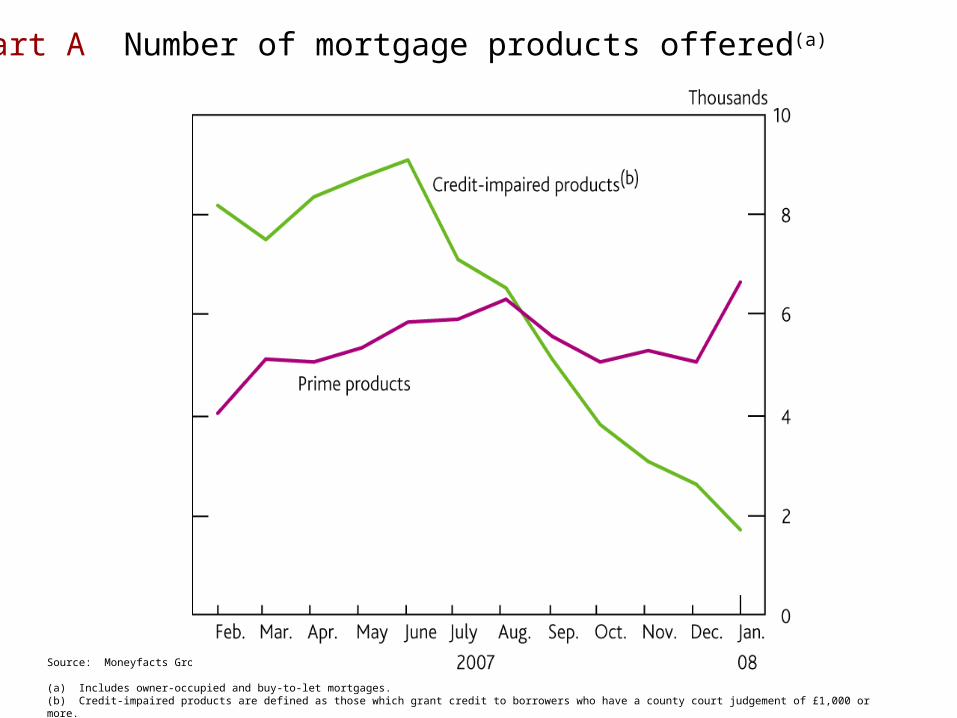
Chart A Number of mortgage products offered(a)
Source: Moneyfacts Group.
(a) Includes owner-occupied and buy-to-let mortgages.(b) Credit-impaired products are defined as those which grant credit to borrowers who have a county court judgement of £1,000 or more.
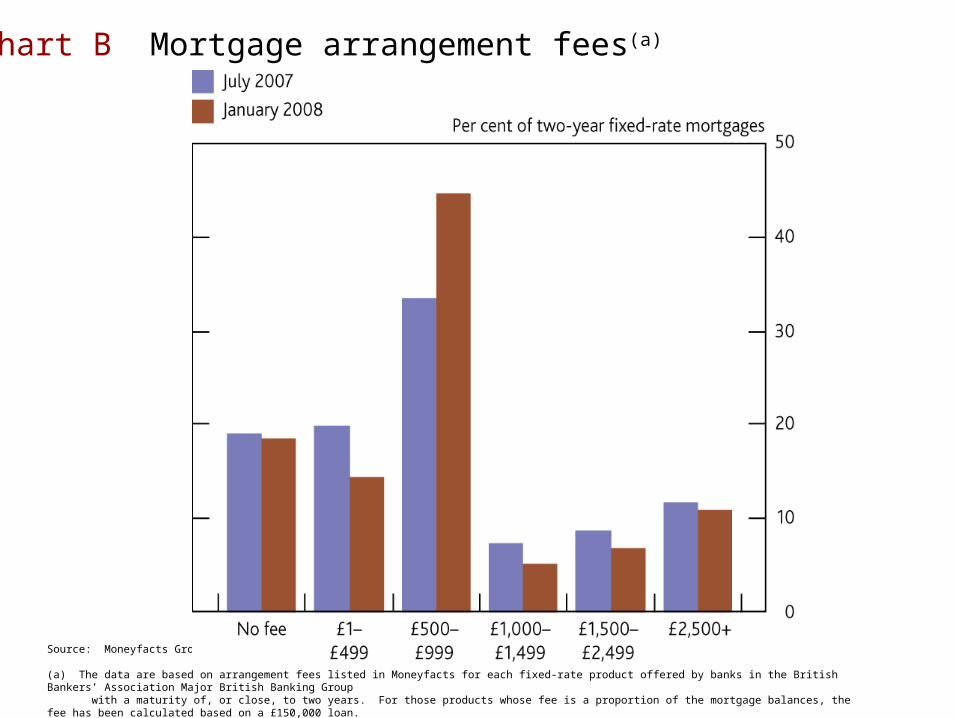
Chart B Mortgage arrangement fees(a)
Source: Moneyfacts Group.
(a) The data are based on arrangement fees listed in Moneyfacts for each fixed-rate product offered by banks in the British Bankers’ Association Major British Banking Group with a maturity of, or close, to two years. For those products whose fee is a proportion of the mortgage balances, the fee has been calculated based on a £150,000 loan. No adjustment has been made for other fees and promotions.
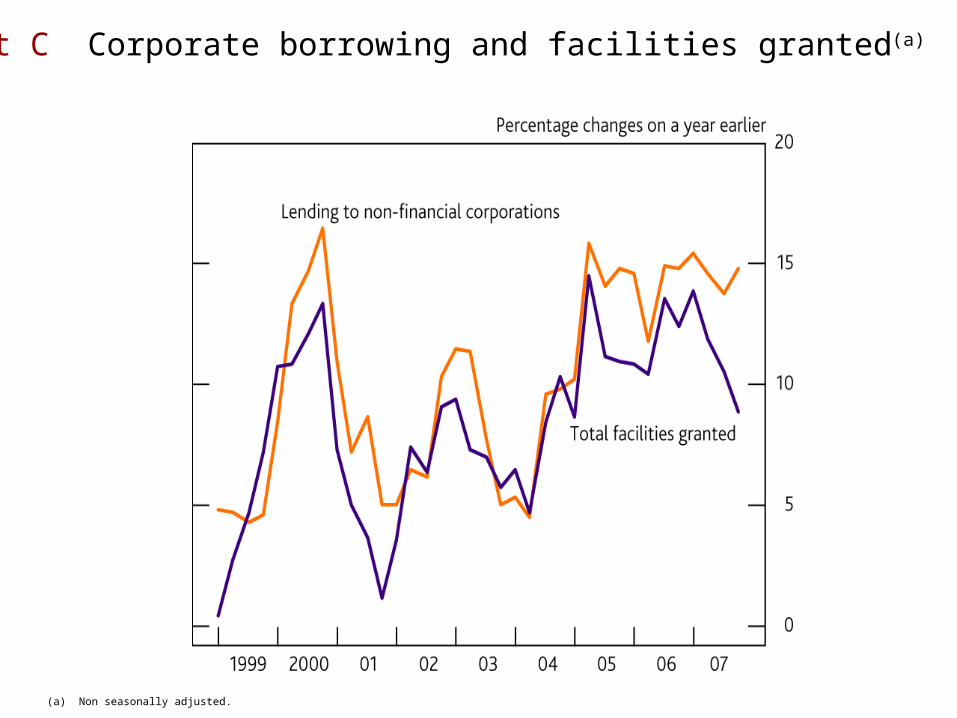
Chart C Corporate borrowing and facilities granted(a)
(a) Non seasonally adjusted.