inferring strange behavior from connectivity pattern...
TRANSCRIPT
Inferring Strange Behavior from ConnectivityPattern in Social Networks
Meng Jiang1, Peng Cui1, Alex Beutel2,Christos Faloutsos2, and Shiqiang Yang1
1 Department of Computer Science and Technology, Tsinghua [email protected],{cuip,yangshq}@tsinghua.edu.cn
2 Computer Science Department, Carnegie Mellon University{abeutel,christos}@cs.cmu.edu
Abstract. Given a multimillion-node social network, how can we sum-marize connectivity pattern from the data, and how can we find unex-pected user behavior? In this paper we study a complete graph from alarge who-follows-whom network and spot lockstep behavior that largegroups of followers connect to the same groups of followees. Our firstcontribution is that we study strange patterns on the adjacency matrixand in the spectral subspaces with respect to several flavors of lockstep.We discover that (a) the lockstep behavior on the graph shapes dense“block” in its adjacency matrix and creates “ray” in spectral subspaces,and (b) partially overlapping of the behavior shapes “staircase” in thematrix and creates “pearl” in the subspaces. The second contribution isthat we provide a fast algorithm, using the discovery as a guide for practi-tioners, to detect users who offer the lockstep behavior. We demonstratethat our approach is effective on both synthetic and real data.
Keywords: lockstep behavior, connectivity pattern, eigenspace, socialnetworks
1 Introduction
Given a large social network, how can we catch strange user behaviors, and howcan we find intriguing and unexpected connectivity patterns? While the strangebehaviors have been documented across services ranging from telecommunicationfraud [1] to deceptive Ebay’s reviews [2] to ill-gotten Facebook’s page-likes [3],we study here a complete graph of more than 117 million users and 3.33 billionedges in a popular microblogging service Tencent Weibo (Jan. 2011). Severalrecent studies have used social graph data to characterize connectivity patterns,with a focus on understanding the community structure [4–6] and the clusterproperty [7, 8]. However, no analysis was presented to demonstrate what strangeconnectivity pattern we can infer strange behavior from and how.
In this paper, we investigate lockstep behavior pattern on Weibo’s “who-follows-whom” graph, that is, groups of followers acting together, consistentlyfollowing the same group of followees, often with little other activity. Therefore,though the followees are not popular, they could have a large number of followers.
2 Meng Jiang, Peng Cui, Alex Beutel, Christos Faloutsos, and Shiqiang Yang
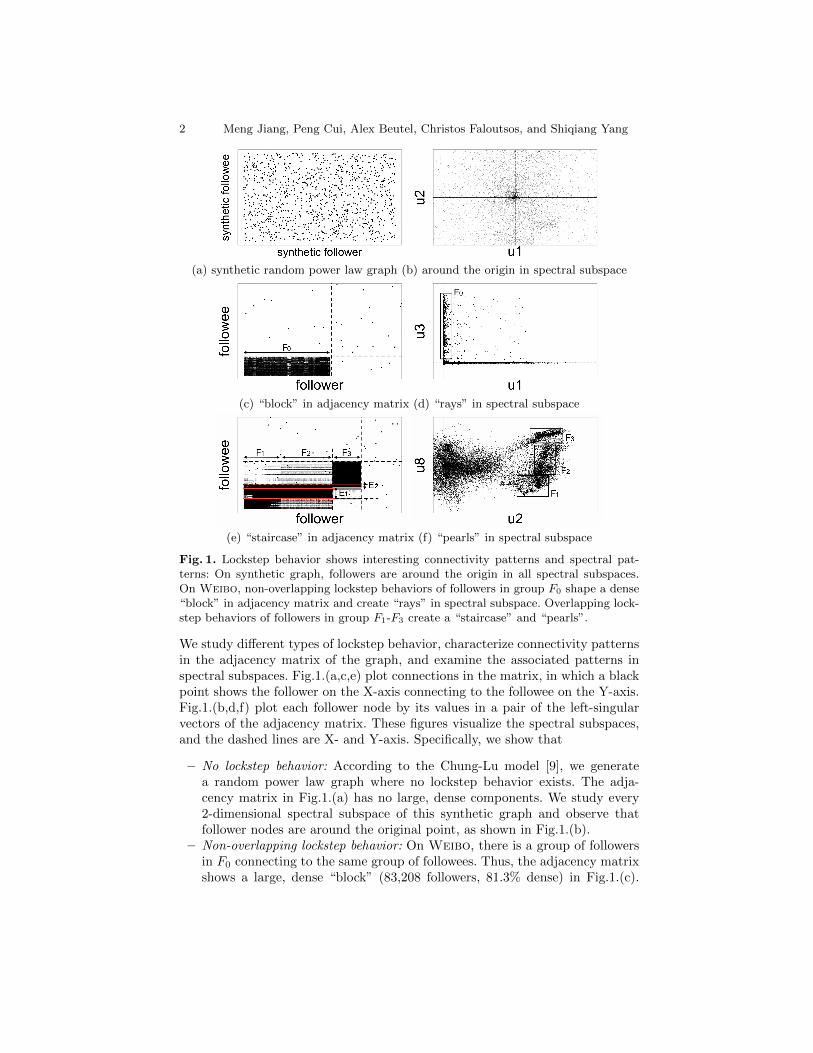
(a) synthetic random power law graph (b) around the origin in spectral subspace
(c) “block” in adjacency matrix (d) “rays” in spectral subspace
(e) “staircase” in adjacency matrix (f) “pearls” in spectral subspace
Fig. 1. Lockstep behavior shows interesting connectivity patterns and spectral pat-terns: On synthetic graph, followers are around the origin in all spectral subspaces.On Weibo, non-overlapping lockstep behaviors of followers in group F0 shape a dense“block” in adjacency matrix and create “rays” in spectral subspace. Overlapping lock-step behaviors of followers in group F1-F3 create a “staircase” and “pearls”.
We study different types of lockstep behavior, characterize connectivity patternsin the adjacency matrix of the graph, and examine the associated patterns inspectral subspaces. Fig.1.(a,c,e) plot connections in the matrix, in which a blackpoint shows the follower on the X-axis connecting to the followee on the Y-axis.Fig.1.(b,d,f) plot each follower node by its values in a pair of the left-singularvectors of the adjacency matrix. These figures visualize the spectral subspaces,and the dashed lines are X- and Y-axis. Specifically, we show that
– No lockstep behavior: According to the Chung-Lu model [9], we generatea random power law graph where no lockstep behavior exists. The adja-cency matrix in Fig.1.(a) has no large, dense components. We study every2-dimensional spectral subspace of this synthetic graph and observe thatfollower nodes are around the original point, as shown in Fig.1.(b).
– Non-overlapping lockstep behavior: On Weibo, there is a group of followersin F0 connecting to the same group of followees. Thus, the adjacency matrixshows a large, dense “block” (83,208 followers, 81.3% dense) in Fig.1.(c).
Inferring Strange Behavior from Connectivity Pattern in Social Networks 3
Fig.1.(d) plots the spectral subspace formed by the 1st and 3rd left-singularvectors. The followers in group F0 neatly align the Y-axis. We name thispattern “ray” according to the shape of the points.
– Partially overlapping lockstep behavior: A more surprising connectivity pat-tern we discover in the adjacency matrix is a “staircase” (10,052 followers,43.1% dense), as shown in Fig.1.(e). Groups of followers in F1-F3 behave inlockstep, forming three more than 89% dense blocks. However, different fromthe non-overlapping case, F1-F2 have the same large group of followees E1,and F1-F3 share a small group E2. The overlapping lockstep behaviors of thefollowers create multiple micro-clusters of points that deviate from the originand lines in the 2nd and 8th left-singular vector subspace. Fig.1.(f) shows thespherical micro-clusters, roughly on a circle, so called “pearls” pattern.
Motivated by this investigation, we further propose a novel approach, whichinclude effective and efficient techniques that can learn the connectivity patternsand infer following behaviors in lockstep. The contributions are as follows:
– Insights: We offer new insights into the fingerprints on the singular vectorsleft by different types of synthetic lockstep behaviors. This gives us a setof rules that data scientists and practitioners can use to discover strangeconnectivity patterns and strange user behaviors.
– Algorithm: We propose an efficient algorithm that exploits the insights above,and automatically find the followers that behave in lockstep. We demonstratethe effectiveness on both synthetic data and a real social graph.
The rest of the paper is organized as follows: Section 2 discusses relatedwork. Section 3 provides insights from strange connectivity patterns and Section4 introduces our algorithm inferring lockstep behaviors. We give experimentalresults in Section 5 and conclude in Section 6.
2 Related work
A great deal of work has been devoted to mining connectivity patterns. Forfinding social communities, Leskovec et al. [4] capture the intuition of a cluster asset of users with better internal connectivity than external connectivity. Clausetet al. [10] and Wakita et al. [11] infer community structure from network topologyby optimizing the modularity. It is desirable that user of a community havea dense internal links and small number of links connected to users of othercommunities. For graph clustering and partitioning, Ng et al. [12] present aspectral clustering algorithm using eigenvectors of matrices derived from thedata. Huang et al. [13] devise a spectral bi-partitioning algorithm using thesecond eigenvector of the normalized Laplacian matrix.
The properties of spectral subspaces have recently received much attention.Prakash et al. [14] show that the singular vectors of mobile call graphs, whenplotted against each other, have separate lines along specific axes, which is asso-ciated with the presence of tightly-knit communities. The authors propose Spo-kEn to chip the communities embeded in the graphs. Ying et al. [15] suggest
4 Meng Jiang, Peng Cui, Alex Beutel, Christos Faloutsos, and Shiqiang Yang
that the lines formed by nodes in well-structured communities are not necessar-ily axes aligned. Wu et al. [16] give theoretical studies to explain the existenceof orthogonal lines in the spectral subspaces.
However, none of the above approaches provided a guide for practitionersto understand real settings, namely, non-overlapping and partially overlappinglockstep behaviors, with an explanation for the strange spectral patterns weobserve (“staircase” and “pearl”), and strange connectivity patterns.
3 Guide for lockstep behavior inference
In this section, we first introduce how to plot spectral subspaces. We then studydifferent types of lockstep behavior, show the connectivity patterns. and give alist of rules on which type of behavior the spectral patterns represent.
3.1 Spectral-subspace plotThe concept of “spectral-subspace plot” is fundamental. The intuition behindit is that it is a visualization tool to help us see strange patterns. Let A be theN ×N adjacency matrix of our social graph. Each user can be envisioned as anN -dimensional point; a spectral-subspace plot is a projection of those points inN dimensions, into a suitable 2-dimensional subspace. Specifically, the subspaceis spanned by two singular vectors.
More formally, the k-truncated singular value decomposition (SVD) is a fac-torization of the form A = UΣV T , where Σ is a k × k diagonal matrix withthe first k singular values, and U and V are orthonormal matrices of dimensionsN×k. U and V contain as their columns the left- and right- singular vectors, re-spectively. Let un,i be the (n,i) entry of matrix U , and similarly, vn,i is the entryof matrix V . The score un,i is the coordinate of n-th follower on the i-th left-singular vector. Thus, we define (i,j)-left-spectral-subspace plot as the scatterplot of the points (un,i, un,j), for n = 1, . . . , N . This plot is exactly the projec-tion of all N followers on the i-th and j-th left-singular vectors. We have thesymmetric definition for the N users as followees: (i,j)-right-spectral-subspaceplot is the scatter plot of the points (vn,i, vn,j), for n = 1, . . . , N . Clearly, it iseasy to visualize such 2-dimensional plots; if used carefully, the plots can reveala lot of information about the adjacency matrix, as we will show shortly.
As we had shown in Fig.1.(a-b), normally, given a random power law graph,we would expect to find a cloud of points around the origin in all the spectralsubspaces. However, we find strange shapes (“ray” and “pearl”) in some left-spectral-subspace plots of Weibo data. The question we want to answer here is:What kind of user behavior could cause “rays” and “pearls” in spectral subspaces?
The short answer is different types of lockstep behavior. We explain belowin more detail what type of lockstep behavior generates such the odd patterns.
3.2 “Ray” for non-overlapping lockstep behaviorIn order to enumerate all the types of lockstep behavior, we introduce conceptsof “camouflage” and “fame”. If a group of followers F had monetary incentivesto follow the same group of followees E in lockstep, they could follow additionalfollowees who are not in E, which is called “camouflage” that helps look normal.
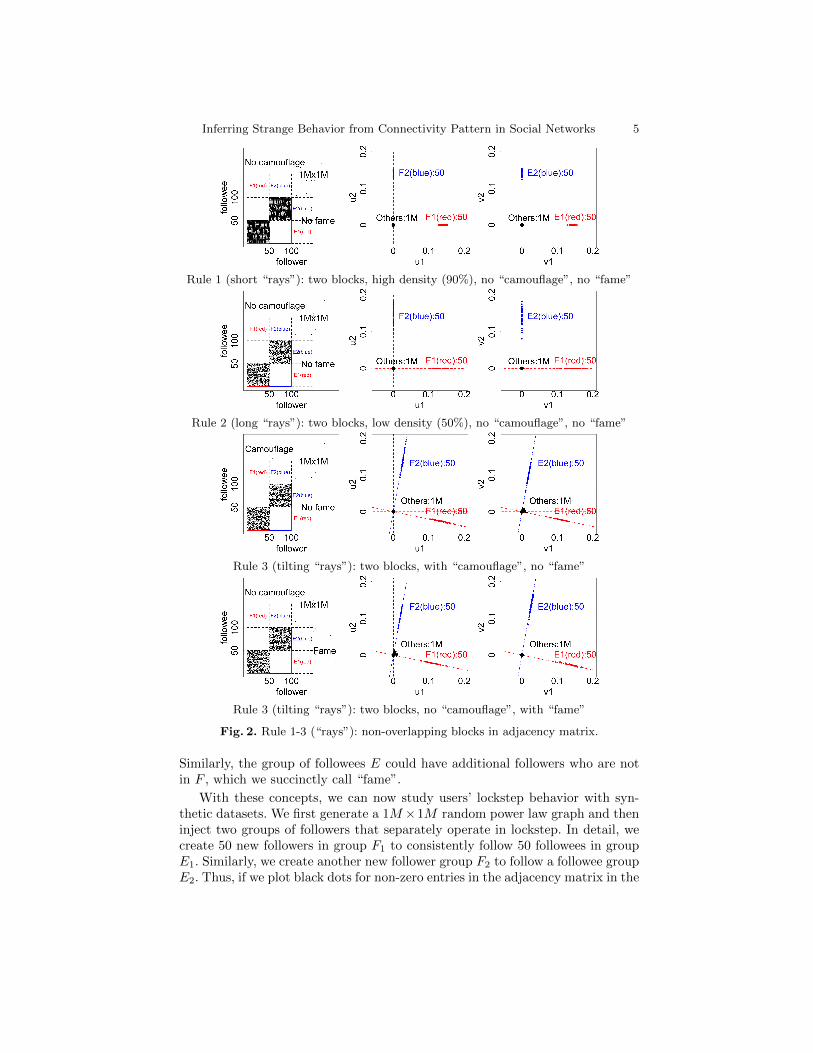
Inferring Strange Behavior from Connectivity Pattern in Social Networks 5
Rule 1 (short “rays”): two blocks, high density (90%), no “camouflage”, no “fame”
Rule 2 (long “rays”): two blocks, low density (50%), no “camouflage”, no “fame”
Rule 3 (tilting “rays”): two blocks, with “camouflage”, no “fame”
Rule 3 (tilting “rays”): two blocks, no “camouflage”, with “fame”
Fig. 2. Rule 1-3 (“rays”): non-overlapping blocks in adjacency matrix.
Similarly, the group of followees E could have additional followers who are notin F , which we succinctly call “fame”.
With these concepts, we can now study users’ lockstep behavior with syn-thetic datasets. We first generate a 1M ×1M random power law graph and theninject two groups of followers that separately operate in lockstep. In detail, wecreate 50 new followers in group F1 to consistently follow 50 followees in groupE1. Similarly, we create another new follower group F2 to follow a followee groupE2. Thus, if we plot black dots for non-zero entries in the adjacency matrix in the
6 Meng Jiang, Peng Cui, Alex Beutel, Christos Faloutsos, and Shiqiang Yang
left side of Fig.2, we spot two 50× 50 non-overlapping, dense blocks. Propertiesof the non-overlapping lockstep behavior are discussed as follows:
– Density: High, if a new follower connects to 90% of the related followeegroup; low, if the ratio is as small as 50%.
– Camouflage: With camouflage, if the follower connects to 0.1% of other fol-lowees; no camouflage, if he follows only the new followees and no one else.
– Fame: With fame, if a new followee is also followed by 0.1% of other followers;no fame, if the followee is followed by no one else.
The spectral subspaces formed by left- and right-singular vectors are plottedin the middle and right of Fig.2, respectively. We spot footprints left in theseplots by the different types of non-overlapping lockstep behavior and summarizethe following rules:
– Rule 1 (short “rays”): If the lockstep behavior of followers is compact on thegraph, the adjacency matrix contains one or more non-overlapping blocks ofhigh density like 90%. The spectral-subspace plots show short rays: a set ofpoints that densely fall along a line that goes through the origin.
– Rule 2 (long “rays”): If a group of followers and a group of followees areconsistently but loosely connected, the adjacency matrix contains blocks oflow density like 50%. The plots show long rays: the rays stretch into linesaligned with the axes and elongate towards the origin.
– Rule 3 (tilting “rays”): If the follower group has “camouflage” or the followeegroup has “fame”, the adjacency matrix shows sparse external connectionsoutside the blocks. Different from Rule 1-2, a more messy set of rays comeout of the origin at different angles, called tilting rays.
In summary, we find that non-overlapping lockstep behavior creates rays onthe spectral-subspace plots: as the density decreases, the rays elongate; as thefollowers add camouflage or the followees add fame, the rays tilt.
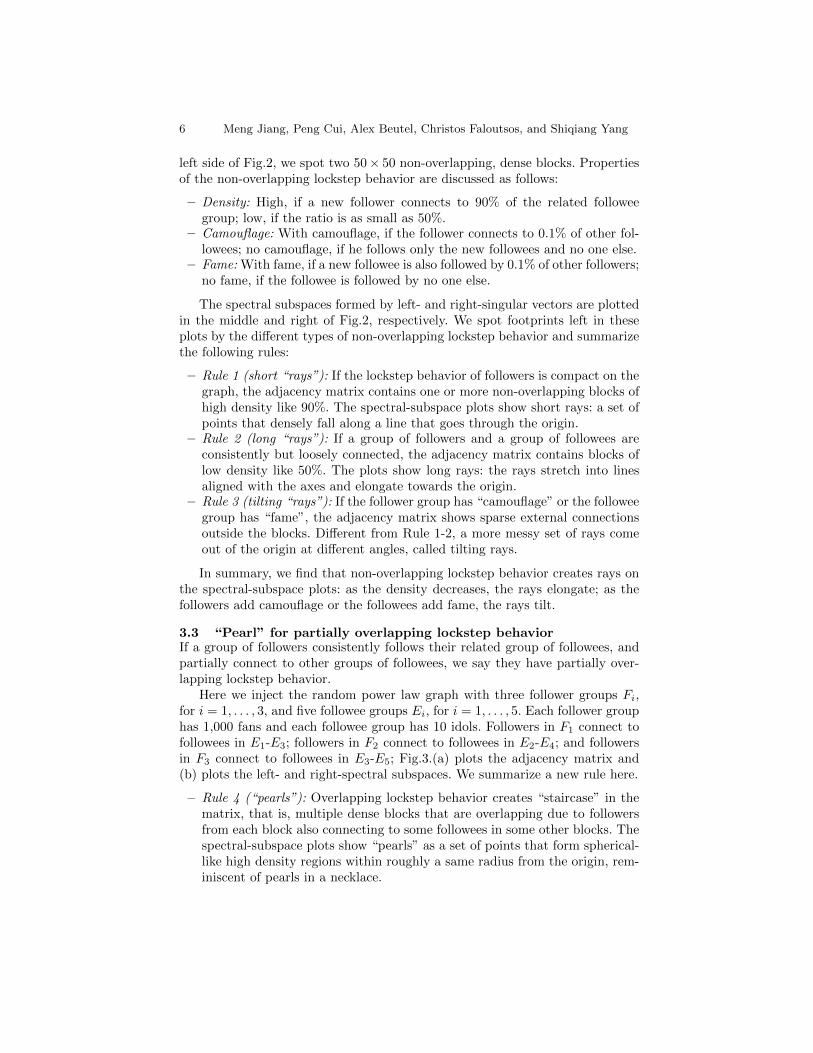
3.3 “Pearl” for partially overlapping lockstep behaviorIf a group of followers consistently follows their related group of followees, andpartially connect to other groups of followees, we say they have partially over-lapping lockstep behavior.
Here we inject the random power law graph with three follower groups Fi,for i = 1, . . . , 3, and five followee groups Ei, for i = 1, . . . , 5. Each follower grouphas 1,000 fans and each followee group has 10 idols. Followers in F1 connect tofollowees in E1-E3; followers in F2 connect to followees in E2-E4; and followersin F3 connect to followees in E3-E5; Fig.3.(a) plots the adjacency matrix and(b) plots the left- and right-spectral subspaces. We summarize a new rule here.
– Rule 4 (“pearls”): Overlapping lockstep behavior creates “staircase” in thematrix, that is, multiple dense blocks that are overlapping due to followersfrom each block also connecting to some followees in some other blocks. Thespectral-subspace plots show “pearls” as a set of points that form spherical-like high density regions within roughly a same radius from the origin, rem-iniscent of pearls in a necklace.
Inferring Strange Behavior from Connectivity Pattern in Social Networks 7
(a) adjacency matrix (b) left-spectral subspace plot (c) right-spectral subspace plot
Fig. 3. Rule 4 (“pearls”): a “staircase” of three partially overlapping blocks.
In our case, Fig.3.(b) shows “pearls” of three clusters, each having 1,000followers in groups from F1 to F3. Fig.3.(c) shows five clusters, each having 10followees in E1 to E5. If the follower groups share some followees, or followeegroups have the same followers, their clusters are close on these plots.
With the insights into patterns on spectral-subspace plots (Rule 1-4), it isnow easy for a practitioner to predict connectivity patterns in the adjacencymatrix and infer different types of lockstep behavior.
4 Lockstep behavior inference algorithm
Our lockstep behavior inference algorithm has two steps:
– Seed selection: Following Rule 1-4 in Sect.3, select nodes as seeds of followersthat behave in lockstep, simiply called “lockstep” followers.
– “Lockstep” propagation: Propagate “lockstep” score between followers andfollowees, and thus catch the lockstep behaviors.
4.1 Seed selection
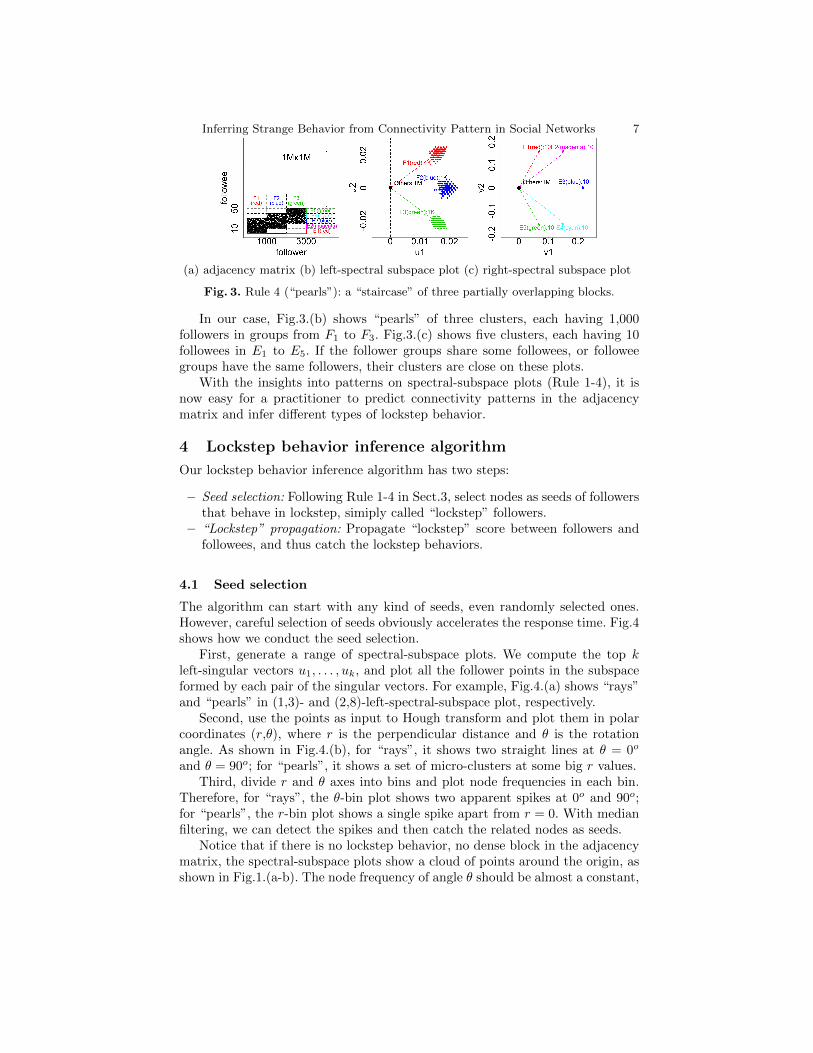
The algorithm can start with any kind of seeds, even randomly selected ones.However, careful selection of seeds obviously accelerates the response time. Fig.4shows how we conduct the seed selection.
First, generate a range of spectral-subspace plots. We compute the top kleft-singular vectors u1, . . . , uk, and plot all the follower points in the subspaceformed by each pair of the singular vectors. For example, Fig.4.(a) shows “rays”and “pearls” in (1,3)- and (2,8)-left-spectral-subspace plot, respectively.
Second, use the points as input to Hough transform and plot them in polarcoordinates (r,θ), where r is the perpendicular distance and θ is the rotationangle. As shown in Fig.4.(b), for “rays”, it shows two straight lines at θ = 0o
and θ = 90o; for “pearls”, it shows a set of micro-clusters at some big r values.Third, divide r and θ axes into bins and plot node frequencies in each bin.
Therefore, for “rays”, the θ-bin plot shows two apparent spikes at 0o and 90o;for “pearls”, the r-bin plot shows a single spike apart from r = 0. With medianfiltering, we can detect the spikes and then catch the related nodes as seeds.
Notice that if there is no lockstep behavior, no dense block in the adjacencymatrix, the spectral-subspace plots show a cloud of points around the origin, asshown in Fig.1.(a-b). The node frequency of angle θ should be almost a constant,
8 Meng Jiang, Peng Cui, Alex Beutel, Christos Faloutsos, and Shiqiang Yang(a) (b) (c) (d)
“rays” show two apparent spikes on θ frequency at 0o and 90o
“pearls” show a spike on r frequency at a much-greater-than-zero value
Fig. 4. Find “rays” and “pearls”: (a) spectral-subspace plot (b) hough transform (c)bin plot of perpendicular distance r frequency (d) bin plot of rotation angle θ frequency.
and the node frequency of distance r should decrease smoothly with the valueincreasing. The r- and θ-bin plots are omitted for saving space.
4.2 “Lockstep” propagation
We now interpret how we start with the seeds and refine a group of followers andfollowees with lockstep behavior. The “lockstep” value of a followee is defined asthe percentage of the seeds or “lockstep” followers who are its followers. Similarly,the “lockstep” value of a follower is defined as the percentage of the “lockstep”followees who are its followees. We need a threshold to decide which users arenew “lockstep” followers/followees and here we use 0.8 as default.
The algorithm recursively propagates this value from followers to followees,and vice versa, like what Belief Propagation method does. In more detail, weexplain the steps as follows.
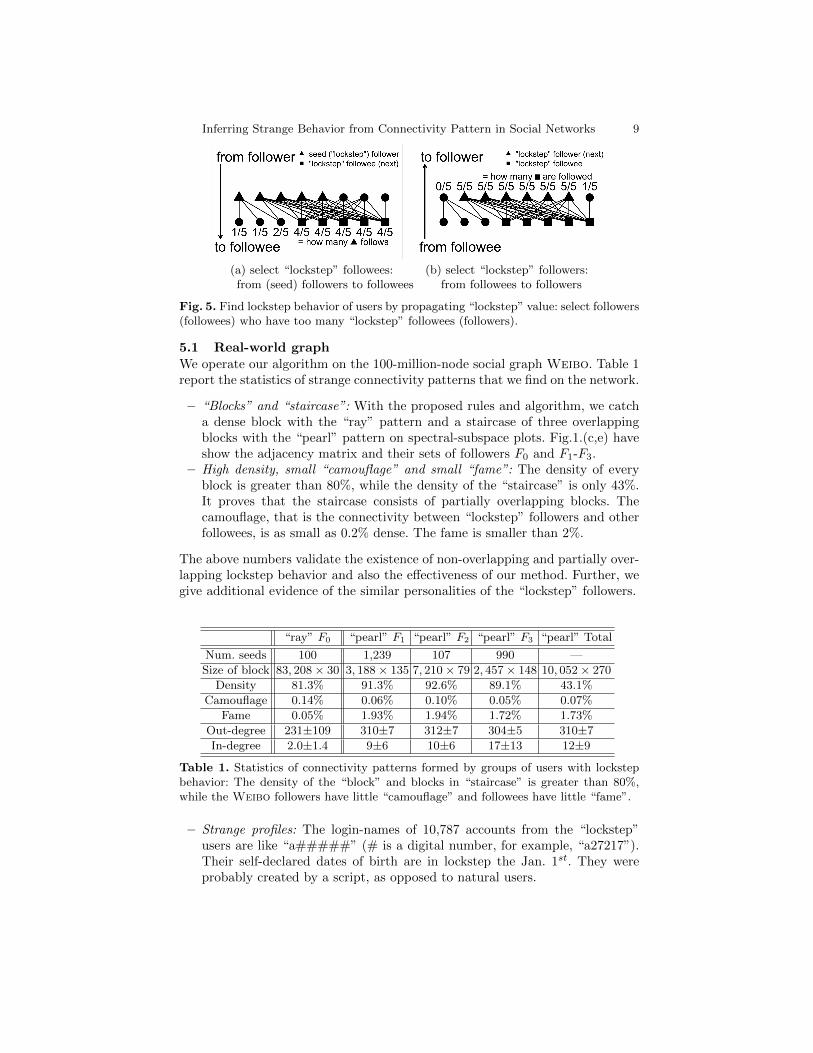
– From follower to followee: Fig.5.(a) shows an example of a directed graphwith followers at the top and followees at the bottom. We start with 5 “lock-step” followers as seeds for propagation. For each followee, we count howmany its followers are in the seed set. We select the group of “lockstep”followees who have too many “lockstep” followers.
– From followee to follower: Next for each follower, we count how many its fol-lowees are “lockstep”. Fig.5.(b) shows how we select new “lockstep” followersand exonerate those innocent with zero or one “lockstep” followee.
– Repeat until convergence: Report the groups of “lockstep” followers and fol-lowees if they are not empty.
Note that our algorithm is linear to the scale of the social graph and thus scalableto be applied in real applications.
5 Experimental resultsIn this section we present our empirical evaluation, first on a large, real-worldgraph, and then on synthetic graphs where the ground truth is known.
Inferring Strange Behavior from Connectivity Pattern in Social Networks 9
(a) select “lockstep” followees: (b) select “lockstep” followers:from (seed) followers to followees from followees to followers
Fig. 5. Find lockstep behavior of users by propagating “lockstep” value: select followers(followees) who have too many “lockstep” followees (followers).
5.1 Real-world graphWe operate our algorithm on the 100-million-node social graph Weibo. Table 1report the statistics of strange connectivity patterns that we find on the network.
– “Blocks” and “staircase”: With the proposed rules and algorithm, we catcha dense block with the “ray” pattern and a staircase of three overlappingblocks with the “pearl” pattern on spectral-subspace plots. Fig.1.(c,e) haveshow the adjacency matrix and their sets of followers F0 and F1-F3.
– High density, small “camouflage” and small “fame”: The density of everyblock is greater than 80%, while the density of the “staircase” is only 43%.It proves that the staircase consists of partially overlapping blocks. Thecamouflage, that is the connectivity between “lockstep” followers and otherfollowees, is as small as 0.2% dense. The fame is smaller than 2%.
The above numbers validate the existence of non-overlapping and partially over-lapping lockstep behavior and also the effectiveness of our method. Further, wegive additional evidence of the similar personalities of the “lockstep” followers.
“ray” F0 “pearl” F1 “pearl” F2 “pearl” F3 “pearl” Total
Num. seeds 100 1,239 107 990 —
Size of block 83, 208× 30 3, 188× 135 7, 210× 79 2, 457× 148 10, 052× 270
Density 81.3% 91.3% 92.6% 89.1% 43.1%
Camouflage 0.14% 0.06% 0.10% 0.05% 0.07%
Fame 0.05% 1.93% 1.94% 1.72% 1.73%
Out-degree 231±109 310±7 312±7 304±5 310±7
In-degree 2.0±1.4 9±6 10±6 17±13 12±9
Table 1. Statistics of connectivity patterns formed by groups of users with lockstepbehavior: The density of the “block” and blocks in “staircase” is greater than 80%,while the Weibo followers have little “camouflage” and followees have little “fame”.
– Strange profiles: The login-names of 10,787 accounts from the “lockstep”users are like “a#####” (# is a digital number, for example, “a27217”).Their self-declared dates of birth are in lockstep the Jan. 1st. They wereprobably created by a script, as opposed to natural users.
10 Meng Jiang, Peng Cui, Alex Beutel, Christos Faloutsos, and Shiqiang Yang
– Small in-degree values of followers: The average in-degree value of followersin the single “block” is as small as 2.0, while that of followers in the “stair-case” is smaller than 20. The “lockstep” followers actively connect to theirfollowees but they have little reputation themselves.
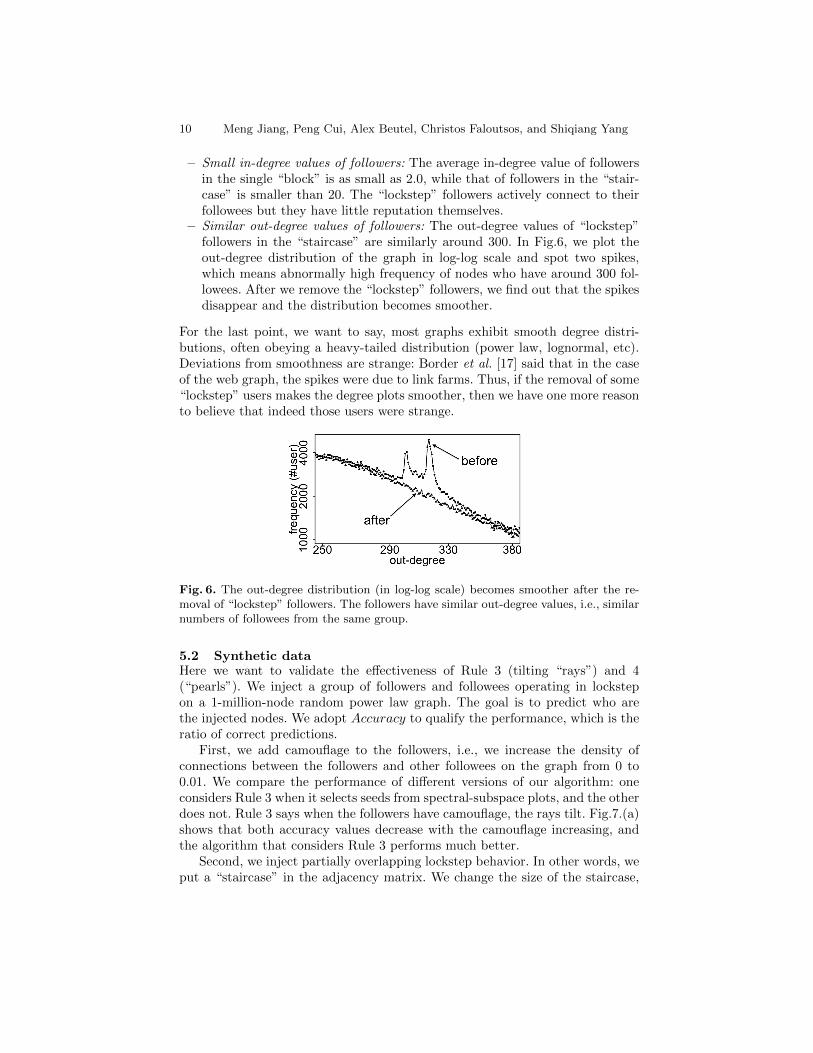
– Similar out-degree values of followers: The out-degree values of “lockstep”followers in the “staircase” are similarly around 300. In Fig.6, we plot theout-degree distribution of the graph in log-log scale and spot two spikes,which means abnormally high frequency of nodes who have around 300 fol-lowees. After we remove the “lockstep” followers, we find out that the spikesdisappear and the distribution becomes smoother.
For the last point, we want to say, most graphs exhibit smooth degree distri-butions, often obeying a heavy-tailed distribution (power law, lognormal, etc).Deviations from smoothness are strange: Border et al. [17] said that in the caseof the web graph, the spikes were due to link farms. Thus, if the removal of some“lockstep” users makes the degree plots smoother, then we have one more reasonto believe that indeed those users were strange.
Fig. 6. The out-degree distribution (in log-log scale) becomes smoother after the re-moval of “lockstep” followers. The followers have similar out-degree values, i.e., similarnumbers of followees from the same group.
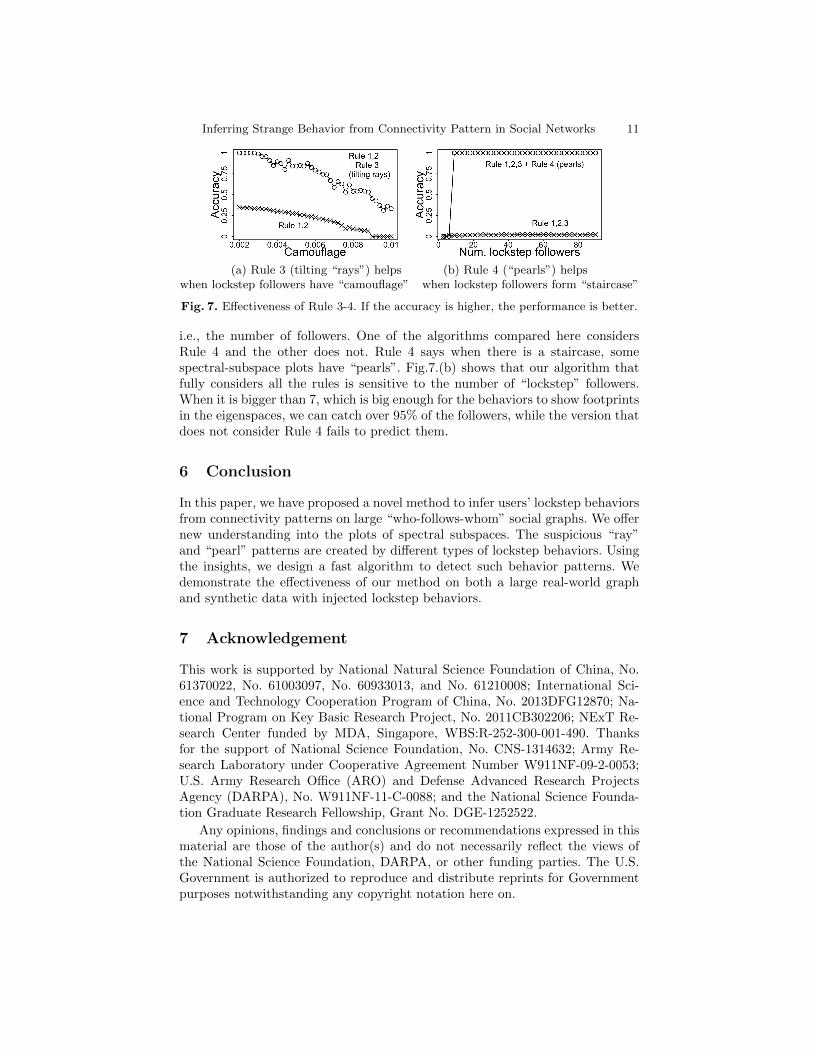
5.2 Synthetic dataHere we want to validate the effectiveness of Rule 3 (tilting “rays”) and 4(“pearls”). We inject a group of followers and followees operating in lockstepon a 1-million-node random power law graph. The goal is to predict who arethe injected nodes. We adopt Accuracy to qualify the performance, which is theratio of correct predictions.
First, we add camouflage to the followers, i.e., we increase the density ofconnections between the followers and other followees on the graph from 0 to0.01. We compare the performance of different versions of our algorithm: oneconsiders Rule 3 when it selects seeds from spectral-subspace plots, and the otherdoes not. Rule 3 says when the followers have camouflage, the rays tilt. Fig.7.(a)shows that both accuracy values decrease with the camouflage increasing, andthe algorithm that considers Rule 3 performs much better.
Second, we inject partially overlapping lockstep behavior. In other words, weput a “staircase” in the adjacency matrix. We change the size of the staircase,
Inferring Strange Behavior from Connectivity Pattern in Social Networks 11
(a) Rule 3 (tilting “rays”) helps (b) Rule 4 (“pearls”) helpswhen lockstep followers have “camouflage” when lockstep followers form “staircase”
Fig. 7. Effectiveness of Rule 3-4. If the accuracy is higher, the performance is better.
i.e., the number of followers. One of the algorithms compared here considersRule 4 and the other does not. Rule 4 says when there is a staircase, somespectral-subspace plots have “pearls”. Fig.7.(b) shows that our algorithm thatfully considers all the rules is sensitive to the number of “lockstep” followers.When it is bigger than 7, which is big enough for the behaviors to show footprintsin the eigenspaces, we can catch over 95% of the followers, while the version thatdoes not consider Rule 4 fails to predict them.
6 Conclusion
In this paper, we have proposed a novel method to infer users’ lockstep behaviorsfrom connectivity patterns on large “who-follows-whom” social graphs. We offernew understanding into the plots of spectral subspaces. The suspicious “ray”and “pearl” patterns are created by different types of lockstep behaviors. Usingthe insights, we design a fast algorithm to detect such behavior patterns. Wedemonstrate the effectiveness of our method on both a large real-world graphand synthetic data with injected lockstep behaviors.
7 Acknowledgement
This work is supported by National Natural Science Foundation of China, No.61370022, No. 61003097, No. 60933013, and No. 61210008; International Sci-ence and Technology Cooperation Program of China, No. 2013DFG12870; Na-tional Program on Key Basic Research Project, No. 2011CB302206; NExT Re-search Center funded by MDA, Singapore, WBS:R-252-300-001-490. Thanksfor the support of National Science Foundation, No. CNS-1314632; Army Re-search Laboratory under Cooperative Agreement Number W911NF-09-2-0053;U.S. Army Research Office (ARO) and Defense Advanced Research ProjectsAgency (DARPA), No. W911NF-11-C-0088; and the National Science Founda-tion Graduate Research Fellowship, Grant No. DGE-1252522.
Any opinions, findings and conclusions or recommendations expressed in thismaterial are those of the author(s) and do not necessarily reflect the views ofthe National Science Foundation, DARPA, or other funding parties. The U.S.Government is authorized to reproduce and distribute reprints for Governmentpurposes notwithstanding any copyright notation here on.
12 Meng Jiang, Peng Cui, Alex Beutel, Christos Faloutsos, and Shiqiang Yang
References
1. Becker, R.A., Volinsky, C., Wilks, A.R.: Fraud detection in telecommunications:History and lessons learned. Technometrics 52, no. 1, 2010.
2. Chau, D.H., Pandit, S., Faloutsos, C.: Detecting fraudulent personalities in net-works of online auctioneers. In Knowledge Discovery in Databases PKDD, pp.103–114, 2006.
3. Beutel, A., Xu, W., Guruswami, V., Palow, C., Faloutsos, C.: CopyCatch: stoppinggroup attacks by spotting lockstep behavior in social networks. In Proceedings ofthe 22nd international conference on World Wide Web, pp. 119–130, 2013.
4. Leskovec, J., Kevin, J.L., Dasgupta, A., Mahoney, M.W.: Statistical properties ofcommunity structure in large social and information networks. In Proceedings ofthe 17th international conference on World Wide Web, pp. 695–704, 2008.
5. Fortunato, S.: Community detection in graphs. Physics Reports, 486(3), pp. 75–174, 2010.
6. Chen, J., Saad, Y.: Dense subgraph extraction with application to community de-tection. IEEE Transactions on Knowledge and Data Engineering, 24(7), pp. 1216–1230, 2012.
7. Zha, H., He, X., Ding, C., Simon, H., Gu, M.: Bipartite graph partitioning and dataclustering. In Proceedings of the tenth international conference on Information andknowledge management, pp. 25–32, 2001.
8. Gunnemann, S., Boden, B., Farber, I., Seidl, T.: Efficient Mining of CombinedSubspace and Subgraph Clusters in Graphs with Feature Vectors. In Advances inKnowledge Discovery and Data Mining, pp. 261–275, 2013.
9. Chung, F., Lu, L.: The average distances in random graphs with given expecteddegrees. Proceedings of the National Academy of Sciences, 99(25), pp. 15879–15882, 2002.
10. Clauset, A., Newman, M. E., Moore, C.: Finding community structure in very largenetworks. Physical review E, 70(6), 066111, 2004.
11. Wakita, K., Tsurumi, T.: Finding community structure in mega-scale social net-works. In Proceedings of the 16th international conference on World Wide Web,pp. 1275–1276, 2007.
12. Ng, A. Y., Jordan, M. I., Weiss, Y.: On spectral clustering: Analysis and an algo-rithm. Advances in neural information processing systems, 2, 849–856, 2002.
13. Huang, L., Yan, D., Taft, N., Jordan, M. I.: Spectral clustering with perturbeddata. In Advances in Neural Information Processing Systems, pp. 705–712, 2008.
14. Prakash, B.A., Sridharan, A., Seshadri, M., Machiraju, S., Faloutsos, C.: Eigen-spokes: Surprising patterns and scalable community chipping in large graphs. InAdvances in Knowledge Discovery and Data Mining, pp. 435–448, 2010.
15. Ying, X.,Wu, X.: On Randomness Measures for Social Networks. In SIAM Inter-national Conference on Data Mining, vol. 9, pp. 709-720, 2009.
16. Wu, L., Ying, X., Wu, X., Zhou, Z.: Line orthogonality in adjacency eigenspacewith application to community partition. In Proceedings of the 22nd internationaljoint conference on Artificial Intelligence, pp. 2349–2354, 2011.
17. Broder, A., Kumar, R., Maghoul, F., Raghavan, P., Rajagopalan, S., Stata, R.,Tomkins, A., Wiener, J.: Graph structure in the web. Computer networks, 33(1),pp. 309–320, 2000.