inferior vena cava echocardiography
TRANSCRIPT
J Clin Ultrasound 104’7-51, February 1982
Inferior Vena Cava Echocardiography
Richard S. Meltzer, MD, Jackie McGhie, BS, and Jos Roelandt, MD
Abstract: The inferior vena cava can be imaged during echocardiography from the subcostal transducer position as an echo-free space at a depth ranging from 6 to 15 cm from the abdominal wall. The normal inferior vena cava M-mode echocardiogram has an “a” and “v” pulsation pattern similar to that seen in the jugular venous tracing and exhibits prominent cyclic respiratory changes. Since right atrial activity can be seen as a pulsation on the M-mode inferior vena cava tracing, specific patterns can be observed during cardiac arrhythmias. In right heart failure the inferior vena cava is usually distended, with diminished respiratory collapse. In tricuspid regurgitation, contrast injected into an arm appears in the inferior vena cava during the “v” wave. “A-wave synchronous” inferior vena cava contrast or a contrast appearance unrelated to the cardiac cycle, frequently with deep inspiration, does not suggest tricuspid re- gurgitation. Indexing Words: Echocardiography * Inferior vena cava * Ultrasonic contrast . Tricuspid regurgitation
The echocardiographic appearance of the inferior vena cava receives little or no description in most standard texts of echocardiography. However, studies of the inferior vena cava employing in- travenous contrast have recently been described as being both sensitive and specific for diagnosing tricuspid regurgitation. A group of cardiologists recently included this article among the 100 most important current articles in cardiology.2 Thus in- ferior vena cava echocardiography will probably be performed more frequently in the near future. The purpose of this article is to review the exam- ination technique and the normal inferior vena cava echocardiographic patterns. Specific applica- tions for inferior vena cava echocardiography are also discussed.
This report is based on the authors’ experience with inferior vena cava echocardiography in over 100 subject^.^
METHODS
The inferior vena cava is imaged from the subcos- tal transducer position with the patient in the supine position. Studies are facilitated by flexing
From the Department of Clinical Echocardiography, Thorax- center, Erasmus University and University Hospital, Rotter- dam, the Netherlands. Manuscript received April 3, 1981; re- vised manuscript accepted July 30,1981. For reprints contact Richard S. Meltzer, MD, Thoraxcenter, Erasmus University, PO Box 1738, Rotterdam, the Netherlands.
@ 1982 by John Wiley &Sons, Inc. 0091-27511821020047-05 $01 .OO
the knees and hips to allow abdominal muscular relaxation and by recording during deep inspira- tion. With either M-mode or two-dimensional echocardiography, the inferior vena cava can be recognized in a normal adult as an echo-free space at a depth ranging from 6 to 15 cm from the ab- dominal wall, Its depth is mainly dependent on hepatic and abdominal wall thickness. It is lo- cated slightly to the right of the midline. Its char- acteristic pulsations and inspiratory collapse help in its identification during M-mode studies (Fig 1). On two-dimensional echocardiography, the in- ferior vena cava is seen in the sagittal plane as a tubular structure entering the right atrium above the diaphragm. Hepatic veins are also frequently imaged (Fig 2). These hepatic veins often cause an extra echo-free space anterior to the inferior vena cava (Fig 3) and converge superiorly toward the inferior vena cava. Their walls are usually not as well delineated as those of the inferior vena cava (Fig 2).
If the ultrasound beam is directed too far cephalad during M-mode echocardiographic studies (direction 3 in Fig 3), it will intersect the right atrium rather than the inferior vena cava. Since the inferior vena cava enters the posterior part of the right atrium, the echocardiographer can recognize the right atrium-inferior vena cava junction on an M-mode scan by the echo-free space which enlarges rapidly, mainly in a direc- tion toward the transducer as the right atrium is
47
48 RICHARD S. MELTZER ET AL
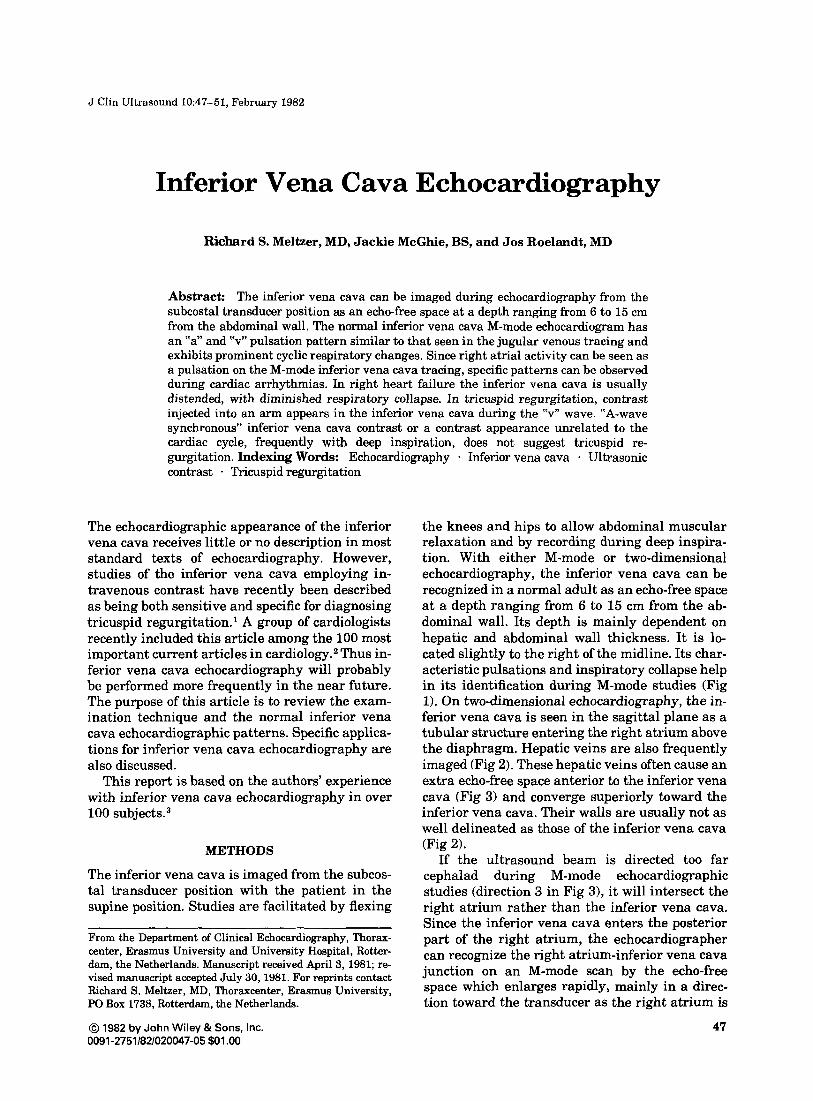
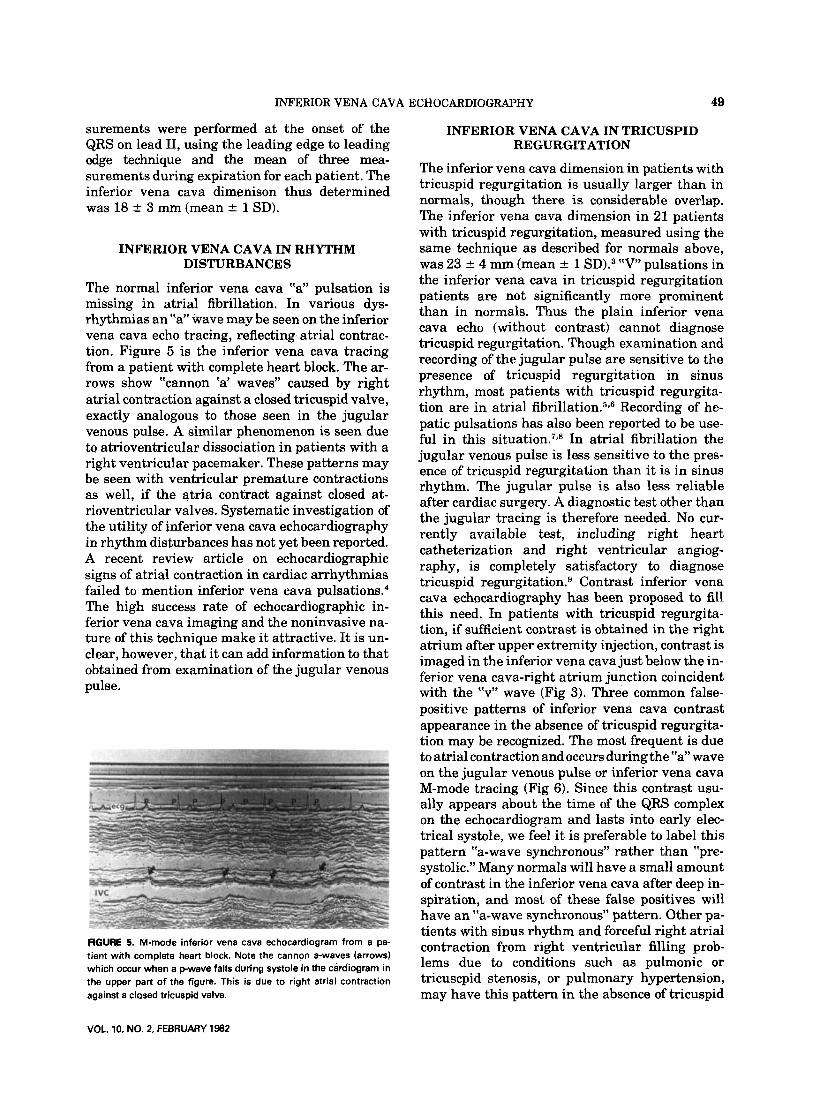
FIGURE 1. Normal inferior vena cava M-mode echocardiogram. Note that the a pulsation (a) is slightly more prominent than the v pulsation (v). Characteristic inspiratory collapse is seen in the inferior FIGURE 3. M-mode inferior vena cava echocardiogram after upper
vena cava at the left and right of this tracing. The inferior vena cava pulsations may be transmitted to the overlying hepatic tissue; their
extremity injection Of 5 CC 5% dextrose SOlUtiOn in a patient with tricuspid regurgitation. LP: liver pulse. HV: hepatic vein. Note the ap-
timing excludes transmitted aortic pulsations. pearance of contrast in both the inferior vena cava and the hepatic vein coincident with the v pulsation, indicating retrograde flow due to tricuspid regurgitation.
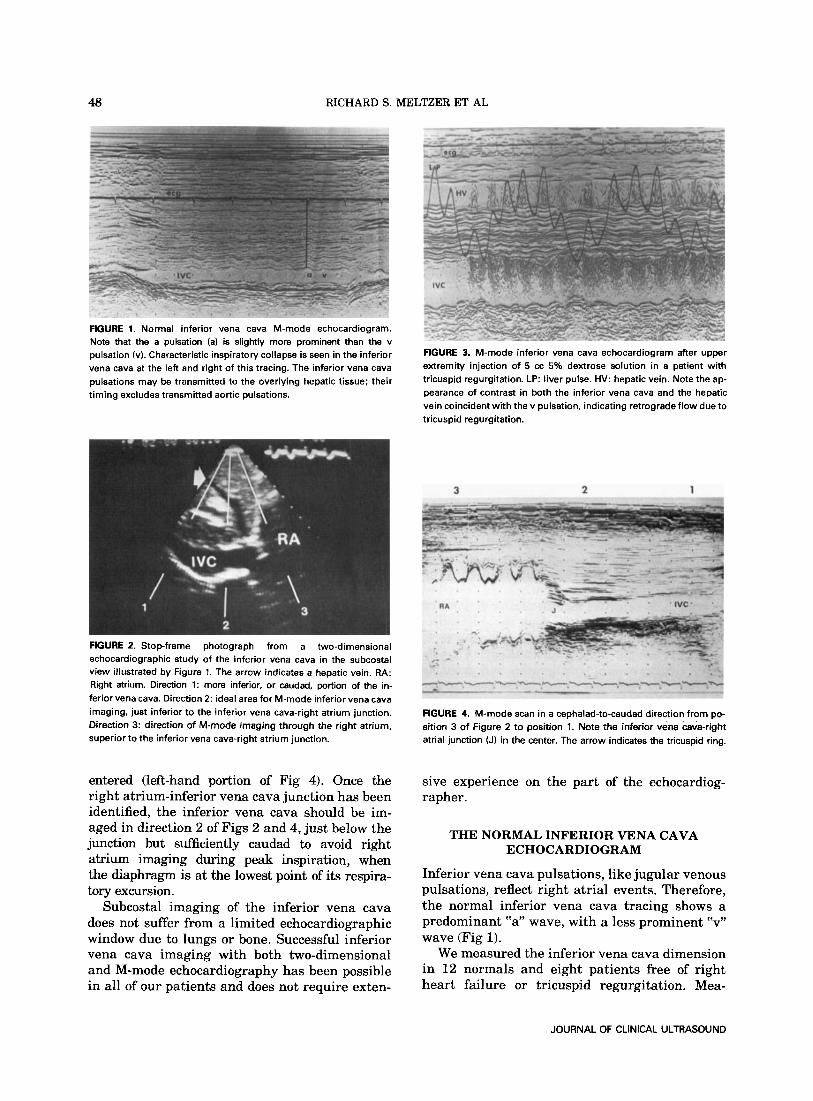
FIGURE 2. Stop-frame photograph from a two-dimensional echocardiographic study of the inferior vena cava in the subcostal view illustrated by Figure 1. The arrow indicates a hepatic vein. RA: Right atrium. Direction 1: more inferior, or caudad, portion of the in- ferior vena cava. Direction 2: ideal area for M-mode inferior vena cava imaging, just inferior to the inferior vena cava-right atrium junction. Direction 3: direction of M-mode imaging through the right atrium, superior to the inferior vena cava-right atrium junction.
entered (left-hand portion of Fig 4). Once the right atrium-inferior vena cava junction has been identified, the inferior vena cava should be im- aged in direction 2 of Figs 2 and 4, just below the junction but sufficiently caudad to avoid right atrium imaging during peak inspiration, when the diaphragm is at the lowest point of its respira- tory excursion.
Subcostal imaging of the inferior vena cava does not suffer from a limited echocardiographic window due to lungs or bone. Successful inferior vena cava imaging with both two-dimensional and M-mode echocardiography has been possible in all of our patients and does not require exten-
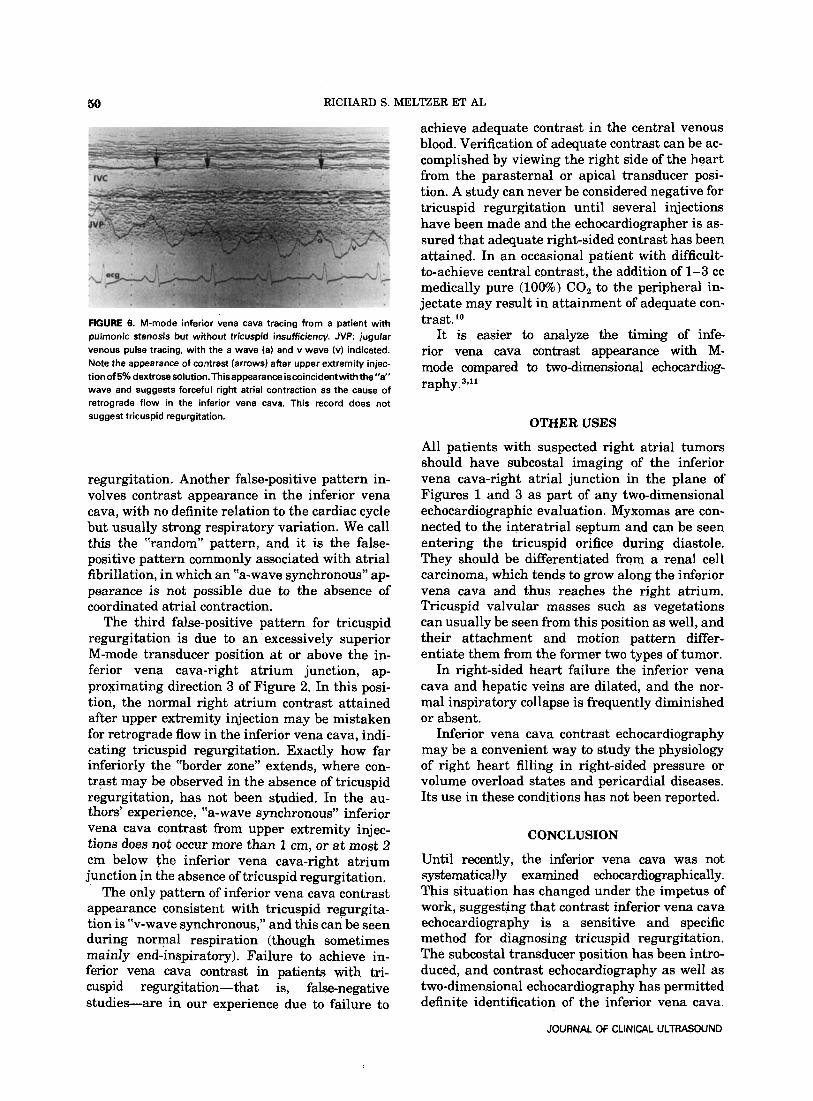
FIGURE 4. M-mode scan in a cephalad-to-caudad direction from po- sition 3 of Figure 2 to position l. Note the inferior vena cava-right atrial junction (J) in the center. The arrow indicates the tricuspid ring.
sive experience on the part of the echocardiog- rapher.
THE NORMAL INFERIOR VENA CAVA ECHOCARDIOGRAM
Inferior vena cava pulsations, like jugular venous pulsations, reflect right atrial events. Therefore, the normal inferior vena cava tracing shows a predominant “a” wave, with a less prominent “v” wave (Fig 1).
We measured the inferior vena cava dimension in 12 normals and eight patients free of right heart failure or tricuspid regurgitation. Mea-
JOURNAL OF CLINICAL ULTRASOUND
INFERIOR VENA CAVA ECHOCARDIOGRAPHY 49
surements were performed at the onset of the QRS on lead 11, using the leading edge to leading edge technique and the mean of three mea- surements during expiration for each patient. The inferior vena cava dimenison thus determined was 18 & 3 mm (mean & 1 SD).
INFERIOR VENA CAVA IN RHYTHM DISTURBANCES
The normal inferior vena cava “a” pulsation is missing in atrial fibrillation. In various dys- rhythmias an “a” wave may be seen on the inferior vena cava echo tracing, reflecting atrial contrac- tion. Figure 5 is the inferior vena cava tracing from a patient with complete heart block. The ar- rows show “cannon ‘a’ waves” caused by right atrial contraction against a closed tricuspid valve, exactly analogous to those seen in the jugular venous pulse. A similar phenomenon is seen due to atrioventricular dissociation in patients with a right ventricular pacemaker. These patterns may be seen with ventricular premature contractions as well, if the atria contract against closed at- rioventricular valves. Systematic investigation of the utility of inferior vena cava echocardiography in rhythm disturbances has not yet been reported. A recent review article on echocardiographic signs of atrial contraction in cardiac arrhythmias failed to mention inferior vena cava pulsation^.^ The high success rate of echocardiographic in- ferior vena cava imaging and the noninvasive na- ture of this technique make it attractive. It is un- clear, however, that it can add information to that obtained from examination of the jugular venous pulse.
FWjURE 5. M-mode inferior vena cava echocardiogram from a pa- tient with complete heart block. Note the cannon a-waves (arrows) which occur when a p-wave falls during systole in the cardiogram in the upper part of the figure. This is due to right atrial contraction against a closed tricuspid valve.
INFERIOR VENA CAVA IN TRICUSPID REGURGITATION
The inferior vena cava dimension in patients with tricuspid regurgitation is usually larger than in normals, though there is considerable overlap. The inferior vena cava dimension in 21 patients with tricuspid regurgitation, measured using the same technique as described for normals above, was 23 ? 4 mrn (mean rt 1 SD).3 “V” pulsations in the inferior vena cava in tricuspid regurgitation patients are not significantly more prominent than in normals. Thus the plain inferior vena cava echo (without contrast) cannot diagnose tricuspid regurgitation. Though examination and recording of the jugular pulse are sensitive to the presence of tricuspid regurgitation in sinus rhythm, most patients with tricuspid regurgita- tion are in atrial fibril la ti or^.^,^ Recording of he- patic pulsations has also been reported to be use- ful in this s i t ~ a t i o n . ~ , ~ In atrial fibrillation the jugular venous pulse is less sensitive to the pres- ence of tricuspid regurgitation than it is in sinus rhythm. The jugular pulse is also less reliable after cardiac surgery. A diagnostic test other than the jugular tracing is therefore needed. No cur- rently available test, including right heart catheterization and right ventricular angiog- raphy, is completely satisfactory to diagnose tricuspid regurgitati~n.~ Contrast inferior vena cava echocardiography has been proposed to fill this need. In patients with tricuspid regurgita- tion, if sufficient contrast is obtained in the right atrium after upper extremity injection, contrast is imaged in the inferior vena cava just below the in- ferior vena cava-right atrium junction coincident with the “v” wave (Fig 3). Three common false- positive patterns of inferior vena cava contrast appearance in the absence of tricuspid regurgita- tion may be recognized. The most frequent is due to atrial contraction and occurs during the “a” wave on the jugular venous pulse or inferior vena cava M-mode tracing (Fig 6) . Since this contrast usu- ally appears about the time of the QRS complex on the echocardiogram and lasts into early elec- trical systole, we feel it is preferable to label this pattern “a-wave synchronous” rather than “pre- systolic.’’ Many normals will have a small amount of contrast in the inferior vena cava after deep in- spiration, and most of these false positives will have an “a-wave synchronous” pattern. Other pa- tients with sinus rhythm and forceful right atrial contraction from right ventricular filling prob- lems due to conditions such as pulmonic or tricuscpid stenosis, or pulmonary hypertension, may have this pattern in the absence of tricuspid
VOL. 10, NO. 2, FEBRUARY 1982
50 RICHARD S. MELTZER ET AL
FIGURE 6. M-mode inferior vena cava tracing from a patient with pulrnonic stenosis but without tricuspid insufficiency. JVP: jugular venous pulse tracing, with the a wave (a) and v wave (v) indicated. Note the appearance of contrast (arrows) after upper extremity injec- tion of 5% dextrose solution.Thisappearance iscoincidentwith the”a“ wave and suggests forceful right atrial contraction as the cause of retrograde flow in the inferior vena cava. This record does not suggest tricuspid regurgitation.
regurgitation. Another false-positive pattern in- volves contrast appearance in the ipferior vena cava, with no definite relation to the cardiac cycle but usually strong respiratory variation. We call this the “random” pattern, and it is the false- positive pattern commonly associated with atrial fibrillation, in which an “a-wave synchronous” ap- pearance is not possible due to the absence of coordinated atrial contraction.
The third false-positive pattern for tricuspid regurgitation is due to an excessively superior M-mode transducer position at or above the in- ferior vena cava-right atrium junction, ap- proximating direction 3 of Figure 2. In this posi- tion, the normal right atrium contrast attained after upper extremity injection may be mistaken for retrograde flow in the inferior vena cava, indi- cating tricuspid regurgitation. Exactly how far inferiorly the “border zone” extends, where con- trast may be observed in the absence of tricuspid regurgitation, has not been studied. In the au- thors’ experience, “a-wave synchronous” inferior vena cava contrast from upper extremity injec- tions does not occur more than 1 em, or at most 2 cm below the inferior vena cava-right atrium junction in the absence of tricuspid regurgitation.
The only pattern of inferior vena cava contrast appearance consistent with tricuspid regurgita- tion is “v-wave synchronous,” and this can be seen during normal respiration (though sometimes mainly end-inspiratory). Failure to achieve in- ferior vena cava contrast in patients with tri- cuspid regurgitation-that is, false-negative studies-are in our experience due to failure to
achieve adequate contrast in the central venous blood. Verification of adequate contrast can be ac- complished by viewing the right side of the heart from the parasternal or apical transducer posi- tion. A study can never be considered negative for tricuspid regurgitation until several injections have been made and the echocardiographer is as- sured that adequate right-sided contrast has been attained. In an occasional patient with difficult- to-achieve central contrast, the addition of 1-3 cc medically pure (10W0) CO, to the peripheral in- jectate may result in attainment of adequate con- trast. lo
It is easier to analyze the timing of infe rior vena cava contrast appearance with M- mode compared to two-dimensional echocardiog- r a ~ h y . ~ , ”
OTHER USES
All patients with suspected right atrial tumors should have subcostal imaging of the inferior vena cava-right atrial junction in the plane of Figures 1 and 3 as part of any two-dimensional echocardiographic evaluation. Myxomas are con- nected to the interatrial septum and can be seen entering the tricuspid orifice during diastole. They should be differentiated from a renal cell carcinoma, which tends to grow along the inferior vena cava and thus reaches the right atrium. Tricuspid valvular masses such as vegetations can usually be seen from this position as well, and their attachment and motion pattern differ- entiate them from the former two types of tumor.
In right-sided heart failure the inferior vena cava and hepatic veins are dilated, and the nor- mal inspiratory collapse is frequently diminished or absent.
Inferior vena cava contrast echocardiography may be a convenient way to study the physiology of right heart filling in right-sided pressure or volume overload states and pericardial diseases. Its use in these conditions has not been reported.
CONCLUSION
Until recently, the inferior vena cava was not systematically examined echocardiographically. This situation has changed under the impetus of work, suggesting that contrast inferior vena cava echocardiography is a sensitive and specific method for diagnosing tricuspid regurgitation. The subcostal transducer position has been intro- duced, and contrast echocardiography as well as two-dimensional echocardiography has permitted definite identification of the inferior vena cava.
JOURNAL OF CLINICAL ULTRASOUND
INFERIOR VENA CAVA ECHOCARDIOGRAPHY 51
As further experience is obtained, we will see whether inferior vena cava echocardiography will be useful in situations other than suspected tricuspid regurgitation.
ACKNOWLEDGMENT
The authors wish to thank Wim Vletter and Wil- lem Gorissen for technical assistance and Dineke de Bruyn for aid in manuscript preparation.
REFERENCES
Lieppe W, Behar VS, Scallion R, et al: Detection of tricuspid regurgitation with two-dimensional echocardiography and peripheral vein injections. Circulation 57:128, 1978. Cohen LS and the Cardiovascular Disease Com- mittee, Medical Knowledge Self-Assessment Pro- gram V, American College of Physicians: Car- diovascular diseases-an annotated bibliography of recent literature. Ann Int Med 91:137, 1979. Meltzer RS, Van Hoogenhuyzen DCA, Serruys PW, et al: The diagnosis of tricuspid regurgitation by
contrast echocardiography. Circulation 63: 1093, 1981.
4. Prabhu R, DCruz I, Cohen HC, et al: Echocardio- graphic correlates of atrial contraction in normal and abnormal atrial rhythm. Prog Cardiovasc Dis 20:463,1978.
5. Sepulveda G, Lukas DS: The diagnosis of tricuspid insufficiency: Clinical features in 60 cases with as- sociated mitral valve disease. Circulation 11:552, 1955.
6. kliiller 0, Shillingford J Tricuspid incompetence. Br Heart J 16:195, 1954.
7.
8.
9.
10.
11.
Terry RB: Coupled hepatic pulsations in tricuspid incompetence (A new physical sign). Am Heart J 57:158, 1959. Calleja HB, Rosenow OF, Clark TE: Pulsations of the liver in heart disease. Am J Med 30:202, 1961. Pepine CJ, Nichols WW, Selby JH: Diagnostic tests for tricuspid insufficiency: How good? Cathet Car- diovasc Diagn 51, 1979. Meltzer RS, Serruys PW, Hugenholtz PG, et al: In- travenous carbon dioxide as an echocardiographic contrast agent. J Clin Ultrasound 9:127, 1981. Wise NK, Myers S, Fraker TD, et al: Contrast M-mode ultrasonography of the inferior vena cava. Circulation 63:1100, 1981.
VOL. 10, NO. 2, FEBRUARY 1982