infant feeding survey 2010 - uk data service · 1. introduction the infant feeding survey (ifs) ......
TRANSCRIPT
Copyright © 2012, Health and Social Care Information Centre. All Rights Reserved.
Infant Feeding Survey 2010
Authors: Fiona McAndrew, Jane Thompson, Lydia Fellows, Alice Large, Mark Speed and Mary J. Renfrew
A survey carried out on behalf of Health and Social Care Information Centre by IFF Research in partnership with Professor Mary Renfrew, Professor of Mother and Infant Health, College of Medicine, Dentistry and Nursing, University of Dundee
UK Data Archive Study Number 7281 - Infant Feeding Survey, 2010
Copyright © 2011, The Health and Social Care Information Centre. All Rights Reserved. 1
Health and Social Care Information Centre is England‟s central, authoritative source of health and social care information.
www.ic.nhs.uk
Author: Health and Social Care Information Centre, IFF Research
Responsible Statistician: Paul Eastwood, Lifestyle Statistics Section Head
Version: 1
Date of Publication: 20 November 2012
Copyright © 2011, The Health and Social Care Information Centre. All Rights Reserved. 2
Health and Social Care Information Centre would like to thank the following organisations for contributing to this publication:
Copyright © 2011, The Health and Social Care Information Centre. All Rights Reserved. 3
Contents
1. Introduction
1.1 Background to infant feeding policy
1.2 Smoking and drinking in pregnancy
1.3 Aims of the survey
1.4 Survey methodology
1.5 Definitions and terminology used in the survey
1.6 Standard analysis variables
1.7 Weighted bases
1.8 Making comparisons with results from previous surveys
1.9 Contextual information
2. Incidence, prevalence and duration of breastfeeding
Key Findings
2.1 Incidence of breastfeeding
2.2 Standardisation of breastfeeding rates
2.3 Prevalence of breastfeeding
2.4 Duration of breastfeeding
2.5 Exclusive breastfeeding
3. Choice of feeding methods
Key findings
3.1 Planned method of feeding
3.2 Reason for choice of feeding method
3.3 Awareness of the health outcomes related to infant feeding
3.4 Sources of information on the health outcomes related to infant feeding
3.5 Factors associated with planned feeding method
3.6 Antenatal care and feeding information received during pregnancy
4. Birth, post-natal care and the early weeks
Key findings
4.1 Breastfeeding and factors associated with the birth
4.2 Experiences in the hospital, birth centre or unit and breastfeeding in the early weeks
4.3 Problems feeding the baby and help or support given
4.4 The influence of own feeding experiences and friends and relatives
Copyright © 2011, The Health and Social Care Information Centre. All Rights Reserved. 4
5. The use of milk other than breastmilk
Key findings
5.1 Types of milk other than breastmilk given to babies
5.2 The use of different types of milk
5.3 Age at which milk other than breastmilk was first introduced
5.4 Different types of milk other than breastmilk given to infants
5.5 Use of follow-on formula
5.6 Liquid cow‟s milk
5.7 How mothers make up formula feeds
5.8 Methods used to sterilise bottles
6. Feeding and health after the early weeks
Key findings
6.1 Problems experienced with feeding in later months
6.2 Help and information with feeding problems
6.3 Reasons for stopping breastfeeding after the early weeks
6.4 Dummy usage
6.5 Health problems with the baby
6.6 Routine contact with a health professional
7. Healthy Start
Key findings
7.1 Background information
7.2 Eligibility for the Healthy Start scheme
7.3 Registration and awareness of the Healthy Start scheme
7.4 Sources of awareness of the Healthy Start scheme
7.5 Usage of Healthy Start vouchers
7.6 Reasons for not using Healthy Start vouchers
7.7 Incidence of breastfeeding by Healthy Start status
7.8 Prevalence of breastfeeding by Healthy Start status
8. Introduction of solid foods
Key findings
8.1 Age of introduction of solid food
8.2 Types of solid food given at Stage 2 and 3
8.3 Foods avoided and family history of allergy
8.4 Information about giving solid foods
8.5 Difficulties with introducing solid food
Copyright © 2011, The Health and Social Care Information Centre. All Rights Reserved. 5
9. Additional drinks and supplementary vitamins
Key findings
9.1 Additional drinks
9.2 Age of introduction of additional drinks
9.3 Reasons for giving additional drinks
9.4 Use of cup or beaker
9.5 Vitamin and iron supplements
10. Feeding outside the home
Key findings
10.1 Feeding the baby after returning to work
10.2 Feeding in public places
10.3 How mothers prefer to breastfeed in public
10.4 Barriers to breastfeeding in public
10.5 Mothers‟ feelings about feeding in front of other people
10.6 Where should facilities be available for breast and bottle-feeding mothers
11. Dietary supplements, smoking and drinking during pregnancy
Key findings
11.1 Taking of dietary supplements during pregnancy
11.2 Smoking
11.3 Drinking during pregnancy
Appendix A. Survey Methodology
Appendix B. Sampling errors
Appendix C. Logistic regression analysis
Appendix D. Multiple births
Appendix E. Survey documents
Copyright © 2011, The Health and Social Care Information Centre. All Rights Reserved. 6
1. Introduction
The Infant Feeding Survey (IFS) has been carried out every five years since 1975 and the 2010 survey was the eighth time the survey has been conducted. The survey was carried out by IFF Research, in partnership with Professor Mary Renfrew of the University of Dundee, on behalf of the Health and Social Care Information Centre.
1.1 Background to infant feeding policy
The way in which babies are fed has important consequences for the short, medium and long-term health of babies and their mothers. Good quality studies from developed country settings relevant to the UK and including some randomised controlled trials have shown that babies who are not breastfed are more likely to develop a range of diseases and conditions. These include lower respiratory tract infection, gastrointestinal infection, and otitis media (e.g. Howie et al, 19901, Wilson et al, 19982, Ip et al, 20073, Horta et al, 20074, Quigley et al, 20075, Kramer et al 20016). Preterm babies who are not breastfed or who do not receive breastmilk are more likely to develop necrotising entercolitis (e.g. Henderson et al 20097). Mothers who do not breastfeed are more likely to develop breast cancer (e.g. Collaborative Group on Hormonal Factors in Breast Cancer et al, 2002)8.
It is methodologically challenging to study health outcomes related to infant feeding as studies are mainly descriptive, and it is important to control for confounding factors such as socio-economic and ethnic background. In recent years the quality of the evidence base has improved. Other diseases and conditions that have been shown to have an association with not being breastfed, but where confounding factors are more problematic, include Sudden Infant Death Syndrome (SIDS) (e.g. Hauck et al 2011)9, worse cognitive and behavioural outcomes (e.g. Heikkilä et al, 201110, Quigley et al, 201211, Kramer et al, 200812), and childhood obesity (e.g. Horta et al 20074). A range of other diseases are associated with not being breastfed (e.g. Ip et al 20073, Horta et al 20074), and further research is needed to clarify the level of association.
For the past 50 years or more, breastfeeding rates in the UK have been among the lowest in the world13. The decline in breastfeeding rates in the first half of the 20th century across many developed countries resulted from a combination of factors that included the widespread availability of breastmilk substitutes, bottles and teats, the medicalisation of childbirth and nutrition, and the increased employment of women outside the home (Lawrence and Lawrence, 2010)14. In the 1960s and 70s, international concern grew about the implications of this new feeding pattern for population health. When the first Infant Feeding Survey (IFS) was conducted in 1975, only in England and Wales, it found that 51% of women started to breastfeed15. Since then, initiation rates have risen, with the most consistent increases being seen since the 1990 survey when the UK initiation rate was 62%16. Increases have mostly been seen across all four countries in the UK, but each country started from a different baseline, with the rates in Northern Ireland being lowest of all (36% in 1990).
There are a range of reported reasons why for many women in the UK, breastfeeding represents a challenging choice. These include the inadequate training of health service staff in the support of breastfeeding women (Renfrew et al, 2006; Dykes, 2006) and media portrayal of infant feeding showing formula feeding as normative and breastfeeding as problematic and contentious (Henderson et al, 2000). Consequently, many women are constrained in their choice of infant feeding method: some choose not to start, and those who do start often have to revert to formula feeding. The situation in 2010 in terms of duration of breastfeeding, problems with breastfeeding, access to
Copyright © 2012, Health and Social Care Information Centre. All Rights Reserved. 7
support and information, mothers‟ feelings about feeding in public and the impact of returning to work is discussed in later chapters.
Government policy in the UK has consistently supported breastfeeding as the best way of ensuring a healthy start for infants and of promoting women‟s health. In 1974 a Committee on Medical Aspects of Food and Nutrition Policy (COMA) Working Party was set up to review infant feeding practices in the UK. The recommendations of this Working Party were that all mothers should be encouraged to breastfeed and that mothers should be discouraged from introducing solid foods before their baby is four months old17. Subsequent reports throughout the 1980s and 1990s continued to endorse these broad recommendations18.
During this time, the infant feeding recommendations in the UK were broadly in line with the guidance from the World Health Organisation (WHO), which in the 1990 Innocenti Declaration recommended that all infants should be fed exclusively on breastmilk from birth up to four to six months of age19. Early in 2000, the WHO commissioned a systematic review of the published scientific literature on the optimal duration of exclusive breastfeeding20 (updated 2009). As a result of this review, the WHO revised its guidance to recommend exclusive breastfeeding for the first six months of an infant‟s life21, which was reinforced in their 2003 Global Strategy (WHO 2003)22. On the advice of the Scientific Advisory Committee on Nutrition, this revised guidance was adopted by the UK health departments from 2003 onwards.
That guidance remains current, and is as follows23:
Breastmilk is the best form of nutrition for infants
Exclusive breastfeeding is recommended for around the first six months (26 weeks) of an infant‟s life
Infant formula is the only recommended alternative to breastfeeding for babies who are under 12 months old
Around six months is the recommended age for the introduction of solid foods for infants, whether breastfed or fed on breastmilk substitutes
Breastfeeding (and/or breastmilk substitutes) should continue beyond the first six months, along with appropriate types and amounts of solid foods
Mothers who are unable to, or choose not to, follow these recommendations should be supported to optimise their infants‟ nutrition.
It should be noted that these are public health recommendations. All infants should be managed individually so that insufficient growth or other adverse outcomes are not ignored and appropriate interventions are provided.
Following the introduction of solids at around six months, NICE recommends that breastfeeding continues for as long as the mother and baby wish24. More specifically, the WHO recommends continued breastfeeding along with appropriate complementary foods up to two years of age or beyond.
In order to support and promote these and previous recommendations, a range of policy and practice developments have been introduced across the UK over the past few decades. Some of the policies and promotional activities which have been put in place, such as National Breastfeeding Awareness Week (established in 1993, central funding support discontinued in England in 2011), have been UK-wide; others have been developed differently by each of the four countries.
As a result of increasing evidence on the population health implications of not breastfeeding, and of the WHO Global Strategy (2003) and the revised UK recommendations in 2003, the pace and breadth of coordinated, evidence-based policy developments increased over the past decade. These
Copyright © 2012, Health and Social Care Information Centre. All Rights Reserved. 8
developments collectively have influenced service provision for childbearing women, staff education and training, the Healthy Start scheme (described later), and the protection of women who breastfeed in public places. Although some of these developments have been discontinued, others remain in place and others are being introduced, and UK-wide policy continues to promote breastfeeding.
Some examples of policy developments are:
The UNICEF UK Baby Friendly Initiative (BFI) was launched in 1994. Its principles were extended to cover the work of community health-care services in 1998, in the Seven Point Plan for Sustaining Breastfeeding in the Community (revised and updated in 2008). In 2008 the National Institute for Health and Clinical Excellence (NICE) first made the recommendation that NHS Trusts should implement a structured, multifaceted programme to encourage breastfeeding, using the UNICEF UK BFI programme as the minimum standard (NICE 2008, updated 2011) The Baby Friendly Initiative works with the health care system to ensure a high standard of care for pregnant women and breastfeeding mothers and babies. Support is provided for health-care facilities that are seeking to implement best practice and an assessment and accreditation process recognises those that have achieved the required standard.
In 2006, the UK-wide Welfare Food Scheme (WFS) which provided formula, cow‟s milk and vitamins to low-income pregnant women and children was re-launched as Healthy Start. Food vouchers for fresh fruit and vegetables (and from 2012, plain, frozen fruit and vegetables), cow‟s milk and formula are now given to eligible women and children. Healthy Start has addressed the previous inequity between breastfeeding and formula feeding women in the WFS, in which women who formula fed received a higher monetary value (i.e. formula for their babies) then those who breastfed (who received only cow‟s milk for themselves). The monetary value of Healthy Start vouchers is the same for all women regardless of feeding method. Similarly, vouchers for vitamin tablets and drops are provided for all women and children on the Healthy Start scheme.
In England, the Infant Feeding Initiative was launched in 1999, as part of the government‟s commitment to improving health inequalities. Between 1999 and 2002 nearly £3m was spent on funding 79 different projects. The focus of all these projects was the development of innovative practices that aimed to increase the incidence and duration of breastfeeding, especially amongst those groups who were least likely to breastfeed. An evaluation of these initiatives was published in 2003, which provides a synthesis of the key challenges and findings from these projects and makes recommendations on how best to support mothers who start to breastfeed.25
Increasing breastfeeding rates by two percentage points per year with a focus on mothers from disadvantaged groups was a specific target in the Department of Health‟s Priorities and Planning Framework for England 2003-2006. Improved local data collection has resulted from the requirement for Primary Care Trusts (PCTs) to monitor rates of initiation and partial and exclusive breastfeeding at 6-8 weeks (see ChiMat Data Atlas26).
Evidence-based guidance on commissioning local breastfeeding support services in England
was published in 2009 (DH 2009).27
Breastfeeding has been included in the Public Health Outcomes Framework for England (Department of Health, 2012).28
In Wales a strategy for promoting breastfeeding was published in 2001. A National Breastfeeding Co-ordinator was appointed in 2003. The National Breastfeeding Programme
Copyright © 2012, Health and Social Care Information Centre. All Rights Reserved. 9
delivers a programme of activities that incorporate work within the NHS, communities, schools and the voluntary sector. It aims to address the unequal rates of breastfeeding and promotes breastfeeding across the population, including to young mothers and school leavers. It also provides local coordination of Support Groups, Peer Supporter training and the Breastfeeding Welcome Scheme. In addition to all maternity units, all community health services are now fully participating in the UNICEF UK Baby Friendly Initiative programme.
In Scotland, the Scottish Breastfeeding Group (SBG) was set up in 1995 as a multi-disciplinary group to help contribute to policy development and to act as a conduit for the dissemination of good practice and information on breastfeeding. A National Breastfeeding Adviser was in post from 1995 to 2005 and informed and influenced policy development, contributed to the development of resources, supported and monitored NHS Board activities, and encouraged best practice. Stemming from the work of the SBG a dedicated website (Breastfeeding in Scotland) was set up in 1999 to provide information on breastfeeding for a wide range of audiences including clinicians, mothers, and researchers.
In 2008 The Scottish Government‟s Chief Executive‟s Letter (CEL) 36 set out a strategy, accompanied by significant investment, to improve the nutrition of all women of childbearing age, pregnant women, and children under five with a specific focus on health inequalities, encouraging breastfeeding, and increasing the uptake of Healthy Start. This policy direction has been further confirmed by the launch of „Improving Maternal and Infant Nutrition: A Framework for Action‟ in 2011.29
The first regional breastfeeding strategy for Northern Ireland, published in 1999, aimed to promote and support breastfeeding. A Regional Breastfeeding Co-ordinator was appointed in 2002 to provide advice and support in implementing the strategy. Over the past ten years, a number of initiatives have been taken forward led by the Breastfeeding Strategy Implementation Group and the Health Promotion Agency for NI, including the development of resources for both parents and health professionals; introduction of peer support in the community; introduction of the Breastfeeding Welcome Here Scheme; and participation in UNICEF BFI programme by maternity facilities and also by Trust community facilities. A new 10-year Breastfeeding Strategy for Northern Ireland has been developed and has recently undergone a public consultation (which closed on 28 September 2012).
Developments have not been restricted to the health service. In 2005, the Breastfeeding etc. (Scotland) Act was enacted, which made it an offence to prevent or stop a person from breastfeeding a child under the age of two years in any public place. In Northern Ireland, since April 2008, the Sex Discrimination (Northern Ireland) Order 1976, as amended, has banned discrimination against women on the grounds that they have recently (i.e. within the last 26 weeks) given birth. The Equality Act (2010) has subsequently brought in protection for women breastfeeding in public across Great Britain. From April 2007, statutory maternity entitlements for women in the UK increased to nine months‟ paid leave together with a further three months‟ unpaid leave for those wishing to take it. These policy developments are discussed in more detail in Chapter 10.
The contribution that breastfeeding makes to child health and wellbeing has been recognised in cross-government policy on early years (Field 2010)30, tackling inequalities (Marmot 2010)31, reducing infant mortality (DH 2007)32, and obesity (DH 2008)33. Growth charts have been revised to reflect the normal growth patterns of breastfed children in good health; these are applicable to all children regardless of feeding method (SACN/RCPCH Expert Group on Growth Standards, 2007)34. The increasing recognition of the part that socio-economic disadvantage plays in infant feeding, with women from lower socio-economic groups having higher rates of infant formula feeding, contributing substantially, along with the higher use of inappropriate drinks and solid foods, to nutritional inequalities (Nelson 2000)35, has been recognised and built into policy decisions, such as the provision of additional funds to support UNICEF UK BFI accreditation in low income areas in England.
Copyright © 2012, Health and Social Care Information Centre. All Rights Reserved. 10
More generally, a key development since 2005 has been the introduction of SureStart Children‟s Centres in England, which bring together different support agencies to offer a range of services for parents and children under five years old. Child and family health services which may be provided at Children‟s Centres include antenatal services, Children‟s Health Clinics, where parents can have their baby weighed and see a health visitor, breastfeeding support groups and weaning sessions, where parents can get information on introducing their baby to solids. Sure Start was originally announced in 1998, with Sure Start Local Programmes (SSLPs) being set up in areas of deprivation. From 2005 to 2006, fundamental changes were made in SSLPs, as they came under the control of Local Authorities and were operated as Children‟s Centres (CCs). This modified the service-delivery process in that the guidelines for CCs were more specific about the services to be offered.
Flying Start is the Welsh Government‟s early years programme, which provides a path for improving the life chances of children in some of the most disadvantaged communities. At the heart of the programme is an intensive Health Visiting service. The Welsh Government also supports Integrated Children‟s Centres (ICC) which are based on the concept that providing integrated education, care, family support and health services is an important factor in securing good outcomes for children and their parents. Introduced in 2003 to 2004, there is at least one ICC in each local authority area in Wales. Each of these centres must provide early years education, open access play, high quality childcare and community training as well as other vital family support services.
Sure Start was introduced in Northern Ireland in 2000 and was initially led by the Department of Health, Social Services and Public Safety. In November 2006 policy responsibility for Sure Start transferred to the Department of Education (DE). There are currently 35 Sure Start Partnerships in Northern Ireland which offer services to approximately 34,000 children, under the age of 4 and their families living in areas which are in at least the top 20% disadvantaged wards. There is an intention to extend Sure Start provision on a gradual basis over time, and as budgets allow, to the top 25% most disadvantaged wards. All children (from birth until age 4), and their families within the catchment area of each Sure Start can access services, as provision is universal within the targeted areas. The DE works closely with the Health & Social Care Board and Trusts and the Childcare Partnerships in the delivery of Sure Start services through a holistic and integrated approach, bringing health, education and parenting support services together in a co-ordinated way.
At the time of the 2010 survey, Sure Start Scotland was in operation, delivering family support services via existing community organisations. There is currently no nationwide programme for family support in Scotland and the Scottish Government is now focusing on the Early Years Framework, underpinned by the Getting it Right for Every Child (GIRFEC) principles, rather than the Sure Start Scotland programme. Family Support is provided, at a local level, through a variety of means using both Local Authority and Third Sector-run programmes and facilities. Different local authorities utilise different family support models, and it is the responsibility of each local authority to manage their own budget and to allocate their financial resources on the basis of local needs and priorities.
The Early Years Framework is intended to shift the focus of service planning, design and delivery away from crisis management towards prevention, early identification and early intervention by agencies who work together around the needs of the individual child and family. There is a focus too on supporting parents to improve their skills and capacity to improve outcomes for their children. The aims of the Framework, therefore, reflect many of those for Sure Start Scotland.36
Copyright © 2012, Health and Social Care Information Centre. All Rights Reserved. 11
1.2 Smoking and drinking in pregnancy
Although its primary purpose has always been to monitor infant feeding practices, the survey has also been used to measure the proportion of mothers who smoke and drink during pregnancy and to look at how mothers‟ smoking and drinking behaviour changes as a result of their pregnancy.
The 1998 Tobacco White Paper Smoking Kills outlined the government‟s anti-smoking strategy and highlighted smoking among pregnant women as a key area. A specific target was adopted for England to reduce the percentage of women who smoke during pregnancy from 23% (in 1995) to 15% by the year 2010; with a fall to 18% by the year 2005. The Infant Feeding Survey was chosen as the vehicle for measuring progress towards this target.
There was a further national target in Scotland to reduce smoking during pregnancy, which sought a reduction in the proportion of women who smoke during pregnancy from 29% to 23% between 1995 and 2005 and to 20% by 2010. The proportion of women in Scotland smoking during pregnancy in 2009/10 was 18.8%.37
Government policies relating to smoking during pregnancy in England include Every Child Matters (HM Government, 2004), Maternity Matters: choice, access and continuity of care in a safe service (DH, 2007), the Cancer Reform Strategy (DH, 2007), Health Inequalities: progress and next steps (DH 2008), and the Implementation Plan for reducing health inequalities in infant mortality: a good practice guide (DH, 2007). In June 2010, NICE issued guidance on how to stop smoking during pregnancy and following childbirth.38
Most recently, the Department of Health's (DH) Tobacco Control Plan for England39, published in March 2011, outlined the action that the Government will take nationally until 2015 to continue to drive down the prevalence of smoking and to support comprehensive tobacco control in local areas. It includes a national target to reduce smoking during pregnancy to 11% or less by the end of 2015 (baseline measure of 14.1% in 2009/10). This target is to be specifically measured by the smoking status at time of delivery statistical collection (SSATOD40, recorded at the time of giving birth) published by the Health and Social Care Information Centre (previously DH).
A Tobacco Control Action Plan for Wales has been published recently, which includes smoking in pregnancy, using this survey as an indicator.41
A new ten-year strategy for the future of tobacco control in Northern Ireland was published in February 2012.42 While the strategy is aimed at the entire population, it identifies pregnant women, and their partners who smoke as a key priority group requiring more focused action. An aspirational target has been included in the strategy to reduce the proportion of pregnant women who smoke to 9% by 2020.
More generally, a key policy development since the 2005 Infant Feeding Survey has been the introduction of smoke free legislation across the UK. Legislation came into force in Wales in April 2007 and England in July 2007, making it against the law to smoke in virtually all 'enclosed' and 'substantially enclosed' public places and workplaces.43 Similar legislation was also introduced in Scotland in March 200644 and in Northern Ireland in April 2007.45
Copyright © 2012, Health and Social Care Information Centre. All Rights Reserved. 12
1.3 Aims of the survey
The first COMA Working Party set up in the 1970s recommended that a national survey be carried out to establish basic information about infant feeding practices in England and Wales. The first survey took place in 1975 and surveys have been conducted every five years since then. From 1980 the survey covered Scotland, while from 1990 Northern Ireland was also included. The 2005 survey was the first time that England and Wales had been sampled separately, providing separate estimates for all four countries in the UK.
Since IFS began in 1975, the content of the survey has evolved to reflect the prevailing policy agenda, while recognising the importance of maintaining consistency over time to allow comparison and trend analysis.
The main aims of the 2010 survey were broadly similar to previous Infant Feeding Surveys, and were as follows:
To establish how infants born in 2010 were being fed and to provide national figures on the incidence, prevalence and duration of breastfeeding and exclusive breastfeeding. These estimates are to be provided separately for England, Wales, Scotland and Northern Ireland, as well as for the UK as a whole;
To examine trends in infant feeding practices over recent years, in particular to compare changes between 2005 and 2010;
To investigate variations in feeding practices among different socio-demographic groups and the factors associated with mothers‟ feeding intentions and with the feeding practices adopted in the early weeks;
To establish the age at which solid foods are introduced and to examine practices associated with introducing solid foods up to 9 months; To measure the proportion of mothers who smoke and drink during pregnancy, and to look at the patterns of smoking and drinking behaviour before, during and after the birth; and
To measure levels of awareness of and registration on the Healthy Start scheme and understand how Healthy Start vouchers are being used.
1.4 Survey methodology
The sample design and fieldwork procedures were broadly similar to those used in the 2005 survey. However, for the first time in 2010, mothers were offered the option to complete the survey online. This was entirely voluntary and all mothers were sent the paper questionnaire at Stage 1 as well.
A completely unclustered sample of 30,760 births was selected from all births registered in the period August to October 2010. The aim of the sampling process was to achieve a sufficiently robust sample size in each country to produce separate estimates for England, Wales, Scotland and Northern Ireland. For this reason the sampling fraction and the precise length of the sampling period varied from country to country. In both Wales and Northern Ireland all births in the specified period were selected. Births were drawn at random from all those registered in England and Scotland during the defined sampling period.
As response was predicted to be lower amongst mothers from lower socio-economic groups and younger mothers, in England and Scotland, mothers from the most deprived quintile of each country‟s Index of Multiple Deprivation (IMD) were over-sampled. In 2005, births where no partner
Copyright © 2012, Health and Social Care Information Centre. All Rights Reserved. 13
details were recorded at registration had been over-sampled, but it was decided in 2010 to use the Index of Multiple Deprivation instead, as it was felt that the lowest IMD quintile would have a stronger correlation with low socio-economic group than not having registered a partner. This approach also helped to ensure sufficient younger mothers were included, as they were more likely to be from lower socio-economic groups. Prior to 2005, mothers from lower Social Class groups had been over sampled, but this was discontinued in 2005, because the Social Class system used on previous surveys had been replaced by the National Statistics Socio-Economic Classification (NS-SEC) and it was felt that the association between infant feeding practices and NS-SEC was not as well understood as the association between infant feeding practices and Social Class.
At Stage 1 of the survey, postal questionnaires were despatched to mothers during September – December 2010, with the despatch of the initial questionnaire being staggered on a weekly basis to ensure it reached the mother when the baby was approximately six weeks old. Up to three reminders were sent to mothers who had not returned a questionnaire. A total of 15,724 mothers returned the Stage 1 questionnaire, representing a response rate of 51%.
At Stage 2 of the survey, postal questionnaires were despatched to mothers during January to April 2011, when their babies were around four to six months old. Those who had participated in the Stage 1 online survey and who had provided their email address were invited by email to take part in the Stage 2 survey. They also received a letter, despatched at the same time as the initial postal questionnaires, telling them that the online survey was ready to complete.
Up to three reminders were sent to mothers who had not returned a questionnaire. Mothers who did not respond to the postal or online survey were subsequently followed up by either by telephone (where a telephone number had been provided at Stage 1) or face-to-face. A total of 12,565 mothers completed the Stage 2 questionnaire, representing a response rate of 80%.
At Stage 3 of the survey, postal questionnaires were despatched to mothers during May to August 2011, when their babies were around eight to ten months old. The fieldwork procedures were exactly the same as for Stage 2, with the exception of a slight modification to the procedures for the online survey. At the end of the Stage 2 questionnaire, respondents were asked to provide their email address, as well as their telephone number. All respondents who responded to the survey online at Stage 2 and any who responded postally but provided their email address were sent an email inviting them to take part in the Stage 3 survey, with a link to the online survey. As at Stage 2, they also received a letter, despatched at the same time as the initial postal questionnaires, telling them that the online survey was ready to complete.
The follow-up procedures for mothers who did not return the questionnaire were exactly the same as for Stage 2. A total of 10,768 mothers returned the Stage 3 questionnaire, representing a response rate of 86%.
Since mothers were only contacted in later stages of the survey if they had responded to the previous one, the effect of non-response at each stage is cumulative. Thus, the response rate at Stage 3 of the survey based on the initial sample of mothers was 35%.
All the data were then weighted to correct both for differential sampling and for differential response rates among different groups. Further weights were applied to the Stage 2 and Stage 3 data to correct for further non-response bias introduced through attrition over the course of the survey.
Copyright © 2012, Health and Social Care Information Centre. All Rights Reserved. 14
Further details about the survey methodology, including details for each individual country, are contained in Appendix A.
1.5 Definitions and terminology used in the survey
The definitions of some key terms used throughout the report are given below. In 2010, a clarification that breastfeeding included giving babies expressed breastmilk was included, but otherwise those marked with a (†) have been used consistently since 1975. Exclusive breastfeeding was first measured in 2005 and has been defined in the same way in 2010.
Breastfed initially† refers to all babies whose mothers put them to the breast, even if this was on one occasion only. It includes giving babies expressed breastmilk.
Incidence of breastfeeding† refers to the percentage of babies who were breastfed initially. This definition includes all babies who were put to the breast at all, even if it was only once. It includes giving babies expressed breastmilk.
Prevalence of breastfeeding† refers to the percentage of all babies who are being breastfed (including being given expressed breastmilk) at specific ages, even if they are also receiving infant formula, solid food or other liquids.
Duration of breastfeeding† refers to the length of time that mothers who breastfed initially continued to breastfeed for (including giving expressed breastmilk), even if they were also giving their baby other milk and solid foods.
Prevalence of exclusive breastfeeding refers to the proportion of all babies who have only ever been given breastmilk up to specific ages and who have never been fed formula, solid foods, or any other liquids.
Duration of exclusive breastfeeding refers to the length of time that mothers who initially gave breastmilk exclusively continued to feed exclusively, that is not giving formula, solid foods, or any other liquids.
Smoking during pregnancy: Three categories of smoking behaviour are used in the report as follows:
Smoking before or during pregnancy is the percentage of women who smoked at all in the two years before they completed Stage 1 of the survey. This roughly covers the period of their pregnancy plus the year before conception.
Smoking throughout pregnancy is the percentage of women who smoked in the two years before they completed Stage 1 of the survey, and who were smoking at the time of their baby‟s birth. It included women who may have given up smoking before or during their pregnancy, but who had restarted before the birth.
Gave up smoking before or during pregnancy is the percentage of women who smoked in the two years before they completed Stage 1 of the survey and who gave up during this period and had not restarted before the birth of the baby.
Copyright © 2012, Health and Social Care Information Centre. All Rights Reserved. 15
Drinking during pregnancy: Three categories of drinking behaviour are used in the report as follows:
Drinking before or during pregnancy is the proportion of mothers who drank alcohol at all in the two years before they completed Stage 1 of the survey. This roughly covers the period of their pregnancy plus the year before conception.
Drinking during pregnancy is the proportion of all mothers who drank alcohol in the two years before they completed Stage 1 of the survey, and who drank during pregnancy.
Gave up drinking before pregnancy is the proportion of mothers who drank alcohol in the two years before they completed Stage 1 of the survey but who did not drink during pregnancy.
1.6 Standard analysis variables
Throughout the report a number of key analysis variables are used. These are defined below:
Birth order: All mothers were asked whether this was their first child and, if not, how many children they had. Many results are analysed by birth order, with comparisons being made between first-time mothers and mothers of second or later babies.
Mother’s age: All mothers were asked their current age at Stage 1 of the survey and the results are banded into five bands: Under 20 years of age, 20-24, 25-29, 30-34, 35 or over.
National Statistics socio-economic classification (NS-SEC): From 2001 the National Statistics socio-economic classification (NS-SEC) was introduced for all official surveys and statistics. It replaced Social Class based on occupation and socio-economic group (SEG). This classification aims to differentiate occupations in terms of their employment relations, rather than skill level and so the distinction between manual and non-manual is no longer used. NS-SEC consists of eight, five and three class versions, and the version used here is the three class version. This consists of three groups as follows:
Managerial and professional occupations
Intermediate occupations
Routine and manual occupations
Additionally, there are two residual categories consisting of those who have never worked and those where NS-SEC could not be classified because of insufficient information.
As had been the case in 2005, the 2010 survey collected occupational information needed to code NS-SEC for mothers only. Prior to 2005, occupational information for partners had been collected. This means that all analysis by socio-economic classification is based on the mother, and not on her partner.
Details of how NS-SEC is derived and the different analysis categories can be found on the National Statistics website46.
Copyright © 2012, Health and Social Care Information Centre. All Rights Reserved. 16
Education level: All mothers were asked at what age they left full-time education. Throughout the report this is used as a proxy for education level, with mothers who left full-time education at 16 or under being categorised as having the lowest education level and mothers who left full-time education at over 18 being categorised as having the highest education level.
Index of Multiple Deprivation (IMD)
Indices of deprivation identify areas of multiple deprivation at the small area level. Separate indices have been constructed for England, Wales, Scotland and Northern Ireland. Although not directly comparable, each index measures deprivation in its broadest sense by assessing indicators relating to income, employment, health and education, among others. These dimensions are then aggregated to provide an overall measure of multiple deprivation and each area is given a deprivation rank and score. 47
For the purposes of this report, the Index in each country has been divided into five quintiles, such that a mother living in the most deprived quintile is in an area in the 20% of the index with the highest deprivation in her country. Conversely a mother in the least deprived quintile is in an area in the 20% of the index with the lowest deprivation in her country.
It should be noted that for analysis by IMD at UK level, the corresponding quintiles in each country have been combined. This means that mothers in the most deprived quintile are in the most deprived quintile in their country: this does not necessarily reflect comparative levels of deprivation between each of the countries in the UK.
Ethnic group: The 2010 survey asked mothers in England, Wales and Scotland for their ethnic group. The question used was the National Statistics ethnic group question first introduced in 2001. It consists of the following categories:
White – British, Irish, Any Other White background
Mixed – White and Black Caribbean, White and Black African, White and Asian, Any Other Mixed background
Asian or Asian British – Indian, Pakistani, Bangladeshi, Any Other Asian background
Black or Black British – Caribbean, African, Any Other Black Background
Chinese or Other Ethnic Group – Chinese, Any Other Ethnic background
In Northern Ireland, religious denomination was asked instead of ethnicity, although no results are presented by religion.
Stages of the survey: The approximate ages of babies at the different stages of the survey were as follows:
Stage 1: babies aged four to ten weeks
Stage 2: babies aged four to six months
Stage 3: babies aged eight to ten months
Copyright © 2012, Health and Social Care Information Centre. All Rights Reserved. 17
1.7 Weighted bases
When results for each country are shown separately, they are weighted only to compensate for differential non-response and the over-sampling of mothers from the most deprived IMD quintile (England and Scotland only). Separate weights were created for England only, Wales only, as well as England and Wales combined. Where results are based on the UK as a whole, an additional weight is applied to compensate for the over-sampling in Scotland, Northern Ireland and Wales.
All weights have been scaled to the unweighted sample sizes for each country and for the UK as a whole, a practice similar to that adopted on the 2005 survey. Further information about weighting is provided in Appendix A.
1.8 Making comparisons with results from previous surveys
One of the main aims of the 2010 survey is to provide trend data in infant feeding practices, especially highlighting changes since the last survey in 2005. Although many of the key questions and definitions have been kept consistent across all surveys, there are a number of other factors that need to be considered when looking at comparisons over time.
1.8.1 Sampling error
All surveys are subject to sampling error due to the chance variations between a particular sample and the whole population from which it has been drawn. When comparing results from two separate samples, each will be subject to sampling error meaning that any observed changes over time may actually be attributable to sampling variation, rather than being real. Sampling errors are influenced by the size of the sample on which estimates are being based, the variability of the particular measure within the sample, and the complexity of the sample design. Further details about sampling errors and examples of standard errors for some of the key survey estimates can be found in Appendix B.
As a general rule only differences that are statistically significant at the 95% confidence level are commented on in the text.
1.8.2 Non response
Most surveys are subject to possible bias due to non-response. Analysis of the 2010 survey showed a lower response rate among younger mothers and areas of higher deprivation. The achieved samples at each stage of the survey were weighted by age and IMD quintiles (within each country) to correct for this differential non-response, using registration data from all births within the sampling period. Further weights were applied to the Stage 2 and Stage 3 data to correct for further non-response bias introduced through attrition over the course of the survey. Further information on weighting is provided in Appendix A.
Copyright © 2012, Health and Social Care Information Centre. All Rights Reserved. 18
1.8.3 Comparison of survey universes
Between 1980 and 1990 the Infant Feeding Survey was only conducted in England and Wales, and Scotland. This means that historically data on the total sample have been presented for Great Britain. In the 2000 survey it was decided to reflect the fact that the survey had also been conducted in Northern Ireland since 1990, and present the total sample results at UK level. This has been repeated for the 2010 survey, except for any analysis by ethnicity. The ethnicity question was not asked in Northern Ireland (the 2001 Census showed that 99% of the population in Northern Ireland are White48), and therefore total sample estimates by ethnicity are presented for Great Britain.
The 2005 survey was the first survey designed to present separate estimates for Wales. Prior to this the sample in England and Wales had been drawn as a single sample, with the Welsh part of the sample being too small to present separate results.
1.8.4 Changes in the socio-demographic characteristics of mothers
Any significant changes in the characteristics of the universe of mothers in different years will affect the interpretation of trend data, and this will be particularly important if these characteristics are themselves associated with key survey estimates, such as the incidence of breastfeeding. Analysis of previous surveys has shown a significant change in the characteristics of mothers over the longer-term, with the sample universe becoming older, staying in education for longer, and having higher socio-economic characteristics over time. These changes have reflected changes in the population.
Tables 1.1-1.4 show the profile of the 2005 and 2010 surveys by several key socio-demographic measures to examine whether these longer term trends have continued in the last five years.
Across the UK as a whole the proportion of mothers having a first baby in 2010 remained consistent with that reported in 2005 at 51%. The only exception to this was in Northern Ireland, where the proportion dropped from 49% in 2005 to 45% in 2010. This decline comes after a noticeable increase in the proportion of mothers having a first-time baby in Northern Ireland in the five years leading up to 2005 (up from 41% in 2000).
Table 1.1
There has been a slight shift since 2005 in the age of mothers. Although the proportion of mothers aged 30 or over in the UK remained consistent in this time (47% in 2005 and 48% in 2010), women aged under 25 in 2010 were less likely to be mothers than their counterparts in 2005 (23% in 2010 compared with 27% on 2005). This may be related to that fact that a higher proportion of women remained in education for longer in 2010 compared to 2005.
It should be noted that, as in 2005, the data were weighted by age, to correct for differential non-response by age of mother, so the age profile of mothers in the survey matches that of registration data from all births in the sampling period of the survey.
Table 1.2
Copyright © 2012, Health and Social Care Information Centre. All Rights Reserved. 19
Mothers in the 2010 survey had remained in education for a longer period than mothers in 2005. The proportion of mothers in the UK leaving education aged over 18 increased from 38% in 2005 to 51% in 2010. This change was most marked in Scotland where in 2005 38% of mothers left education aged over 18 compared to 54% in 2010. This overall finding may in part reflect an increase in the number of students taking up places on undergraduate courses in the UK, especially among those aged 25 and over, in the ten years leading up to 2010 as reported by the University and College Admissions Service (UCAS)49.
Table 1.3
The proportion of mothers working in managerial and professional occupations and intermediate occupations remained relatively consistent across the two surveys (36% in managerial and professional occupations in 2005 and 35% in 2010; 21% in intermediate occupations in 2005 and 20% in 2010). However, the proportion of mothers working in routine and manual occupations declined over the same period (down from 33% in 2005 to 27% in 2010). There were corresponding increases in the proportion of mothers who had never worked (from 7% in 2005 to 10% in 2010) and in those whose occupation could not be classified (from 3% to 9% respectively).
Table 1.4
1.8.5 Age of babies at each stage of the survey
At each stage of the survey babies will be a range of ages at the point the mother completes the questionnaire. Although the design and implementation of the sampling and fieldwork procedures are intended to try and make this age range as narrow as possible it is difficult to completely control this since it depends upon how quickly the mother completed the survey when they received it, and whether they responded to the first, second, third reminder, or had to be followed-up by an interviewer.
Some of the key variables are not affected by this age range because they are based on the specific age of the baby. For example, incidence and duration of breastfeeding, and age at which solids were first introduced are both based on the actual age of the baby. However, other measures relate to what the mother was doing at the time they completed the questionnaire. For example, whether mothers were giving their baby vitamins or whether they were breastfeeding in public or not relate to what mothers were doing at the time of the survey. This means that if the average age of the babies is different from survey to survey it may affect comparisons of any questions which are based on the mother‟s behaviour or attitude at the time she completed the questionnaire.
Table 1.5 shows that the average age of babies across the UK at Stage 1 of the 2010 survey was 53 days; this is consistent with the age of babies at Stage 1 of the 2005 survey (54 days). Difference in age between the two surveys was most marked in Scotland where at Stage 1 of the 2010 survey babies were on average 5 days older than those at Stage 1 of the 2005 survey (47 days in 2005 and 52 days in 2010), but there was still less than a week‟s difference.
At Stage 1, 68% of babies were in the age range six to ten weeks, while 89% were in the age range four to ten weeks. Because of this, the age of babies at Stage 1 is referred to as “four to ten weeks” when used in the rest of the report, the same time period used for the 2005 survey.
The average age of babies at Stage 2 of the survey was 22 weeks. This was generally consistent across all countries and similar to the average age in the 2005 survey (21 weeks). A smaller proportion of babies in 2010 fell into the four to five month age band than was the case in 2005 (48%
Copyright © 2012, Health and Social Care Information Centre. All Rights Reserved. 20
compared with 67% in 2005), but this meant there was a more even spread across the four to six month age band. At this stage, 86% were in the age range four to six months (up from 82% in 2005). The age of babies at Stage 2 is referred to as “four to six months” when used in the rest of the report.
The average age of babies at Stage 3 of the survey was 38 weeks. Again this was relatively consistent across countries but indicates that on average babies at Stage 3 in 2010 were three weeks younger than those at Stage 3 in the 2005 survey (41 weeks). The proportion of babies that fell into the age range of eight to nine months was double that of the 2005 survey (52% in 2010 compared with 26% in 2005) and the proportion of babies in 2010 falling into the eight to ten months age band was lower than in 2010 (74% in 2010 compared with 80% in 2005). This is due primarily to mothers responding to the survey before their baby had reached eight months. The younger age profile of babies in 2010 reflects the fact that mothers were quicker to respond to the survey at Stage 3 than had been expected based on earlier stages of the survey. This may be due to the fact that a greater proportion of the sample took part in the survey online at Stage 3, which may have encouraged a faster response. Further details on the methodology are provided in the Appendices.
Overall, the figures suggest that for Stages 1 and 2 of the 2010 survey the age profile of babies was broadly similar to the profile of the 2005 survey, but on average babies at Stage 3 were three weeks younger in 2010 than 2005. This should be borne in mind when comparing the Stage 3 findings between 2005 and 2010.
Table 1.5
1.9 Contextual information
This final section provides further context to assist in interpreting the findings discussed in the remainder of the report in terms of:
Providing a description of key demographic variables not already discussed (ethnicity and the Index of Multiple Deprivation);
Explaining how some of the key demographic variables are inter-related;
Giving background information about the birth and significant factors relating to the baby.
1.9.1 Ethnicity by country and region
Mothers in Great Britain were asked for their ethnic group. This was not asked in Northern Ireland, but it can be assumed that the majority of the sample in Northern Ireland was White, based on the 2001 Census, which showed that 99% of the population in Northern Ireland were from a White background.
Just over four in five mothers in Great Britain were from a White background (82%). Mothers from a non-White background were most likely to be from an Asian ethnic background, accounting for seven per cent of the survey population. Four per cent of mothers were from a Black ethnic background, two per cent were from a Mixed ethnic background and one per cent were from a Chinese or other ethnic background.
Although White mothers were in the majority in all countries, this was more likely to be the case in Wales and Scotland (92% and 91% respectively) than in England (80%). There was also considerable variation by region within England. Mothers were more likely to be from a White background in the South West (91%) and the North East (90%), while mothers were less likely to be from a White background in London (58%), reflecting greater ethnic diversity in the capital.
Copyright © 2012, Health and Social Care Information Centre. All Rights Reserved. 21
Table 1.6
1.9.2 Index of Multiple Deprivation (IMD) by country and ethnicity and region
As mentioned earlier in this chapter, each country has its own Index of Multiple Deprivation but these have been divided into quintiles in each country and combined at this level. It should be borne in mind that each mother has been placed in a quintile on the index for her country, but this does not necessarily reflect comparative levels of deprivation across countries.
Overall, mothers were more likely to live in more deprived areas in their country. Twenty-eight per cent of mothers lived in the most deprived quintile in their country, while only 15% of mothers lived in the least deprived quintile in their country. The skew towards more deprived areas was least apparent in Northern Ireland, where there was a more even spread across the different quintiles (22% lived in the most deprived quintile, compared with 28% of all mothers).
Although it is not possible to compare deprivation levels between countries, it is helpful to consider relative deprivation levels across Government Office Regions in England. There was considerable disparity by region in England. Overall, nearly one in three mothers in England (28%) lived in the most deprived quintile, but it was higher in the North East (52%), Yorkshire and the Humber (45%), the West Midlands (40%), the North West (39%) and London (34%). Mothers in the South East (32%) and the East of England (25%) were more likely to live in the least deprived quintile (compared with 15% of all English mothers).
Mothers in Great Britain from a Black (59%), Asian (43%) and Mixed ethnic background (37%) were more likely to live in the most deprived quintile than White mothers and those from a Chinese or other ethnic background (24% for both). Due to low base sizes for minority ethnic groups in Scotland and Wales, it is not possible to break this down by country.
Table 1.7
1.9.3 Inter-relationship between NS-SEC and age of mother, educational level, IMD, ethnicity and country
As mentioned at section 1.5.3, 35% of mothers came from managerial and professional occupations, 20% came from intermediate occupations, 27% had routine and manual occupations and 10% had never worked. As socio-economic group is often a key discriminator, it is helpful to consider how it inter-relates with other demographic characteristics.
Older mothers and those who had left full-time education when they were aged over 18 were more likely to be in managerial and professional occupations (49% of mothers aged 30-34, 53% of mothers aged 35 or over and 51% of those who left education when they were aged over 18). This is likely to reflect a wider trend in society for more educated, professional women to delay having children until their career is established.
The youngest mothers (those aged under 20) were four times more likely than average never to have worked (41% compared with 10% overall). Mothers aged under 20 (39%) and aged 20-24 (46%) were also more likely than average to be in routine and manual occupations. Leaving education at
Copyright © 2012, Health and Social Care Information Centre. All Rights Reserved. 22
the age of 16 or younger was also associated with being in routine and manual occupations (40% compared with 27% overall) or never having worked (18% compared with 10% overall).
Unsurprisingly, there was a relationship between socio-economic group and the level of deprivation of the area in which mothers lived (defined by quintile of the Index of Multiple Deprivation). Mothers in managerial and professional occupations were more likely to be living in the most affluent areas (54% in the least deprived quintile compared with 19% in the most deprived quintile). Conversely, those who had never worked were more likely to be living in the most deprived quintile (21%) and less likely to be living in the least deprived quintile (2%). A similar pattern was evident for mothers in routine and manual occupations (35% in the most deprived quintile; 15% in the least deprived quintile).
There were also distinctions by ethnicity in terms of mothers‟ socio-economic group. White mothers were more likely to be in managerial and professional occupations (37%) and Asian and Black mothers were less likely (26% and 23% respectively). Mothers from minority ethnic groups were more likely never to have worked than White mothers. This was particularly the case for Asian mothers (36%), compared with six per cent of White mothers.
It is also worth noting that there was little variation by country in terms of socio-economic group. Mothers in Scotland were a little more likely to be from managerial and professional occupations (37% compared with 35% overall). Mothers who had never worked were a little more likely to live in England (11% compared with 7% in Scotland and Northern Ireland), which may reflect the greater proportion of mothers from minority ethnic groups living in England.
Table 1.8
1.9.4 Where the mother gave birth
For the first time in the Infant Feeding Survey, mothers in 2010 were asked in more detail about where they gave birth, rather than just hospital or home. Most mothers reported that they gave birth in hospital, either in a midwife-led unit (64%) (where care is entirely delivered by midwives and mothers are encouraged to give birth with as little medical intervention as possible) or a consultant-led unit (the traditional „Labour Ward‟) (29%). A further 2% reported that they gave birth in a midwife-led unit or birth centre separate from hospital and 3% reported they gave birth at home. Since this survey was conducted, the Birthplace in England study has been published (Rowe 2011), and the two categories described here probably map onto their definitions of „alongside‟ midwifery-led units and „freestanding‟ midwifery-led units.50
The proportion of mothers indicating they gave birth in a midwife-led unit is unexpectedly high, given that not all hospitals have such units. It could be assumed that mothers interpreted this as receiving midwife-led care, since mothers giving birth in a „consultant-led unit‟ would not need to be seen by the consultant, unless there were complications during the labour or birth. Hence we have interpreted it as an indicator of whether the mother had a high risk pregnancy or experienced complications during the birth or not; for example, mothers reporting that they gave birth in a consultant-led unit were more likely to give birth by caesarean section (52%) and less likely to have a normal birth (19%). They were also more likely to be older (40% aged 35 or over) and therefore more at risk of complications during the birth. They were also more likely to work in managerial or professional occupations (40%), which may be linked to age in this case.
Table 1.9
Copyright © 2012, Health and Social Care Information Centre. All Rights Reserved. 23
1.9.5 BFI accreditation by country, English region and IMD
As mentioned earlier in this chapter, an important policy development to encourage mothers to breastfeed was the establishment of the UNICEF UK Baby Friendly Initiative, which was launched in the UK in 1994. The Baby Friendly Initiative works with the health-care system (NHS Trusts (or equivalent in the devolved nations), other health-care facilities and higher education institutions) to ensure a high standard of care for pregnant women and breastfeeding mothers and babies. Support is provided for health-care facilities that are seeking to implement best practice, with the aim of ensuring that all parents make informed decisions about feeding their babies and are supported in their chosen feeding method. Best practice for maternity units is represented by the Ten Steps to Successful Breastfeeding. An assessment and accreditation process recognises those that have achieved the required standard. Assessment for Baby Friendly accreditation takes place in several
stages, until full accreditation is achieved.51
In 2010, mothers were asked to record the name of the hospital and the town where they gave birth. This made it possible to identify whether the mother gave birth in a hospital, birth centre or unit with full BFI accreditation or not. Hospitals which had achieved full accreditation by July 2010 were identified i.e. just before the „IFS babies‟ were born.
Fifteen per cent of mothers who gave birth in a hospital, birth centre or unit did so in one with full BFI accreditation (71% did not and a further 15% were unclassified as mothers did not provide enough detail about the hospital where they gave birth). However, there was considerable disparity by country. Full BFI accreditation was highest in Scotland and Northern Ireland (52% in each) and lowest in England (9%). Wales fell in the middle at 34%.
Table 1.10
Across all countries mothers in the most deprived areas were more likely to give birth in a BFI accredited hospital. In England, funding to work towards BFI accreditation was targeted at the most deprived areas, often in areas where breastfeeding initiation rates were lowest, but this pattern was also evident in the devolved nations even though specific funding had not been directed in this way52. In England, 13% of mothers who gave birth in a hospital, birth centre or unit and who lived in the most deprived areas gave birth in a hospital with full BFI accreditation (compared with 9% on average for England). The figures for mothers living in the most deprived areas for the devolved nations were 42% for Wales, 60% for Scotland and 65% for Northern Ireland (compared with 34% for all mothers giving birth in a hospital, birth centre or unit in Wales and 52% for these mothers in Scotland and Northern Ireland).
Table 1.11
In England, linked to the targeting of funding for BFI, there was considerable variation by region (see Table 1.10). Thus, mothers in the North East of England who gave birth in a hospital, birth centre or unit were more than three times more likely than the average for England to have given birth in a hospital with BFI accreditation (28% compared with 9% on average). Mothers in the West Midlands (19%), South West (18%) and Yorkshire and the Humber (17%) were also more likely to have given birth in a hospital with full BFI accreditation. Conversely, no mothers in London and few in the East of England (less than 0.5%) or the South East (4%) had given birth in a hospital with full BFI accreditation. As mentioned earlier, mothers in the North East, Yorkshire and the Humber, the West Midlands and London were more likely to live in the most deprived quintile. The incidence of breastfeeding by IMD and region is discussed in Chapter 2.
Copyright © 2012, Health and Social Care Information Centre. All Rights Reserved. 24
1.9.6 Type of delivery
Nearly two-thirds of babies were born by normal birth (63%)53, while nearly a quarter (24%) were born by caesarean section. Vacuum extraction (ventouse) and forceps were each used in seven per cent of births.
Babies were most likely to be born by normal birth in England (64%) and least likely in Northern Ireland (57%), with Wales and Scotland both falling in between (60%). There was a corresponding difference in the rate of births by caesarean section in each country, with 29% of mothers in Northern Ireland giving birth in this way, compared with 26% in both Wales and Scotland and 24% in England. There was little variation by country in the proportion of births involving forceps or vacuum extraction, except in Scotland, where forceps were four times more likely to be used than vacuum extraction (12% and 3% respectively).
Babies born to younger mothers were more likely to be born by normal birth (74% of mothers aged under 20) and those born to older mothers were more likely to be born by caesarean section (33% of mothers aged over 35). Findings by socio-economic group are likely to be linked to age. Mothers who had never worked were more likely to have a normal birth (73%), while mothers in managerial and professional occupations were more likely to give birth by caesarean section (27%).
Table 1.12
1.9.7 Analgesia
For the first time in 2010, mothers were asked about non-pharmacological methods of pain relief used in labour, such as using a Transcutaneous Electrical Nerve Stimulator (TENS) machine or birth pool, as well as pharmacological methods such as gas and air.
The most commonly used pharmacological analgesic during labour was gas and air, used by 70% of mothers. Epidurals were used by a third of mothers (33%) while pethidine or similar injections were used in a slightly lower proportion of births (28%). Only 10% of mothers did not receive any pharmacological analgesic during labour (although they may have used non-pharmacological methods).
In terms of non-pharmacological methods of pain relief, nearly two in five (38%) mothers reported that they used natural methods of pain relief, such as breathing or massage, 15% used a TENS machine and 11% used water or a birthing pool.
Mothers who used non-pharmacological methods such as natural methods (breathing and massage), a TENS machine or a birthing pool during the birth tended to have a managerial or professional occupation and be older. Forty-five per cent of managerial and professional women used natural methods, 24% used a TENS machine and 14% used a birthing pool compared with 38%, 15% and 11% of all mothers respectively). Mothers aged 30-34 were more likely than other mothers to use natural methods (40%), a TENS machine (20%)54 and a birthing pool (13%). Conversely, mothers receiving pethidine were more likely to be younger (44% of mothers aged under 20 compared with 28% of all mothers) and to be in routine or manual occupations (32%). Younger mothers were also more likely to use gas and air (79% of mothers aged under 20 compared with 70% of all mothers).
Table 1.13
Copyright © 2012, Health and Social Care Information Centre. All Rights Reserved. 25
1.9.8 Prematurity and special care
Also for the first time in this longitudinal survey, mothers were asked how many weeks into their pregnancy they gave birth. The majority of babies were full term (born at 37 weeks or more) at birth (93%), 4% were born at 35-36 weeks gestation and 3% at 34 weeks or less. Those more likely to give birth to a premature baby were mothers aged under 20 (9% gave birth to a premature baby compared with 6% on average), those who had never worked (9%) or Asian mothers (8%).
Table 1.14
Mothers were asked if their baby had been given phototherapy for jaundice or had been admitted to special care. Only 7% were admitted to special care and 5% were put under a lamp; just over one in ten were affected by either (11%). As would be expected, premature babies were much more likely to receive these types of care. A third (34%) of premature babies received phototherapy for jaundice compared with only 3% of full term babies. The proportion increased with the prematurity of the baby (28% of those born at 35-36 weeks compared with 50% of those born at less than 32 weeks).
Over half of premature babies were admitted to special care (53% vs. 5% of full term babies) and the proportion increased with the prematurity of the baby (37% of those born at 35-36 weeks were noted by respondents to have been admitted to special care compared with 83% for those less than 32 weeks). It should be noted that all babies born at less than 32 weeks would have needed some form of additional care and the proportion of those born at 35-36 weeks who were admitted to special care also seems low. Some premature babies may have needed to go into intensive care or a high dependency unit – while some mothers may have recorded this under „special care‟, this may not always have been the case.
Table 1.15
Full term babies tended to have shorter stays in special care than premature babies (35% one day or less compared with 7% for premature babies); nearly two-thirds of premature babies were in special care for more than a week (64% compared with only 13% of full term babies).
Table 1.16
1.9.9 Birth weight
Most babies weighed 3 kilograms or more (78%), while 5% of babies were of low birthweight (defined as less than 2.5 kilograms).
As might be expected, premature babies were much more likely to be of low birthweight than full term babies (50% compared with 3% respectively). Babies admitted to special care were also more likely than those who were not to be of low birthweight (34% compared with 3%). There were also variations according to socio-demographic characteristics. Low birthweight babies were more likely to be born to the youngest mothers (9% of mothers aged under 20); there was little variation between the other age groups. They were also more likely to be born to mothers who had never worked (9%) and to Asian mothers (9%); again there was little variation for the other socio-economic groups and ethnic groups.
Although there was no variation by country in the proportion of mothers giving birth to low birthweight babies, the largest babies (those weighing 3.5 kilograms or more) were more likely to be born to mothers in Northern Ireland and Scotland (51% and 48% respectively, compared with 43% of all mothers). White mothers were also more likely to give birth to the largest babies (45%), while
Copyright © 2012, Health and Social Care Information Centre. All Rights Reserved. 26
mothers from Asian and Chinese or other ethnic backgrounds were less likely to (27% and 28% respectively).
Table 1.17
1.9.10 Skin-to-skin contact
Skin-to-skin contact soon after birth is known to help mothers to establish a first successful breastfeed. The majority of mothers (81%) had skin-to-skin contact with their baby within an hour of the birth, rising to 88% within 24 hours. This was a significant increase since 2005 (when it was 72% within an hour; 81% within 24 hours). Nearly four in five mothers said they had skin-to-skin contact for as long as they wanted (79%) in 2010.
Mothers of full term babies were more likely to have skin-to-skin contact with their babies within 24 hours than mothers of premature babies (90% compared with 59%). When babies were admitted to special care, mothers were less likely to have skin-to-skin contact (56% compared with 91% of those not admitted to special care).
Mothers who had had a caesarean section were also less likely to have skin-to-skin contact within 24 hours (78% compared with 92% for normal deliveries).
Table 1.18
Copyright © 2012, Health and Social Care Information Centre. All Rights Reserved. 27
Notes and references
1
Howie, P W, Forsyth, J S, Ogston, S A, Clark, A & C du V Florey, 1990. Protective effect of breast feeding against infection. BMJ, 300, 11-16. 2 Wilson, A C, Forsyth, J S, Greene, S A, Irvine, L, Hau, C & Howie, P W, 1998. Relation of infant diet to childhood health:
seven year follow up of cohort of children in Dundee infant feeding study. BMJ, 316, 21-25. 3 Ip, S, Chung, M, Raman, G, Chew, P, Magula, N, DeVine, D, Kalinos, T & Lau, J 2007. Breastfeeding and maternal and
infant health outcomes in developed countries. Evidence Report/Technology Assessment No. 153. AHRQ Publication No. 07-E007. . Rockville, MD: Agency for Healthcare Research and Quality. 4 Horta, B L, Bahl, R, Martines, J C & Victora, C G, 2007. Evidence on the long-term effects of breastfeeding. Geneva:
World Health Organization. 5
Quigley, M A, Kelly, Y J & Sacker, A, 2007. Breastfeeding and hospitalization for diarrheal and respiratory infection in the UK Millennium Cohort Study. Pediatrics, 119, e837-842. 6 Kramer MS, Chalmers B, Hodnett ED, Sevkovskaya Z, Dzikovich I, Shapiro S, Collet JP, Vanilovich I, Mezen I, Ducruet T,
Shishko G, Zubovich V, Mknuik D, Gluchanina E, Dombrovskiy V, Ustinovitch A, Kot T, Bogdanovich N, Ovchinikova L, Helsing E; PROBIT Study Group (Promotion of Breastfeeding Intervention Trial). Promotion of Breastfeeding Intervention Trial (PROBIT): a randomized trial in the Republic of Belarus. JAMA. 2001 Jan 24-31;285(4):413-20. 7 Henderson, G, Craig, S, Brocklehurst, P & McGuire, W, 2009. Enteral feeding regimens and necrotising enterocolitis in
preterm infants: a multicentre case-control study. Arch Dis Child Fetal Neonatal Ed, 94., F120-3. 8 Collaborative Group on Hormonal Factors in Breast Cancer , Möller, T, Olsson, H & Ranstam, J, 2002. Breast cancer and
breast feeding: collaborative reanalysis of individual data from 47 epidemiological studies in 30 countries, including 50,302 women with breast cancer and 96,973 without the disease. Lancet, 360, 187-195. 9 Hauck, F R, Thompson, J M D, Tanabe, K O, Moon, R Y & Vennemann, M M, 2011. Breastfeeding and reduced risk of
sudden infant death syndrome: a meta-analysis. Pediatrics, http://www.pediatrics.org/cgi/doi/10.1542/peds.2010-3000 doi:10.1542/peds.2010-3000 Accepted for publication Mar 14, 2011. 10
Heikkilä, K, Sacker, A, Kelly, Y, Renfrew, M J & Quigley, M A, 2011. Breastfeeding and child behaviour in the Millennium Cohort Study. Arch Dis Child, 96, 635. 11
Quigley, M A, Hockley, C, Carson, C, Kelly, Y, Renfrew, M J & Sacker, A, 2012. Breastfeeding is Associated with Improved Child Cognitive Development: A Population-Based Cohort Study. The Journal of Pediatrics, 160, 25-32. 12
Kramer, M S, Aboud, F, Mironova, E, Vanilovich, I, Platt, R W, Matush, L, Igumnov, S, Fombonne, E, Bogdanovich, N & Ducruet, T, 2008. Breastfeeding and child cognitive development: New evidence from a large randomized trial. Arch Gen Psychiatr, 65, 578. 13
WHO Global Databank: http://www.who.int/nutrition/databases/infantfeeding/en/index.html 14
Lawrence RA and Lawrence RM 2010. Breastfeeding: a guide for the medical profession. 7th Edition. Elsevier. 15
Martin J. Infant feeding 1975: attitudes and practice in England and Wales. London: HMSO, 1978. 16
White A, Freeth S and O’Brien M. 1992 Infant Feeding 1990. HMSO, London 17
Department of Health and Social Security (1974) Present day practice in infant feeding. Report on health and Social Subjects 9. (London: HMSO) 18
Updated reports on current infant feeding guidance were produced by COMA in 1980, 1988, and 1994. 19
World Health Organisation (1990) Declaration on the protection, promotion and support of breastfeeding made at the
WHO/UNICEF meeting on Breastfeeding in the 1990s: A Global Initiative. 20
Kramer S and Kakuma R (2002) The optimal duration of exclusive feeding: A systematic review (Cochrane Library) 21
World Health Organisation (2001) The optimal duration of exclusive breastfeeding: report on an expert consultation (Geneva: WHO) 22
World Health Organisation 2003. Global Strategy for Infant and Young Child Feeding. Geneva: World Health Organisation. 23
Department of Health (2003) Infant feeding recommendation (London: DH). Also see http://www.healthpromotionagency.org.uk/work/breastfeeding/pdfs/infant%20feeding%20guidelines%20cmocno.pdf 24
See NICE public health guidance 11 http://guidance.nice.org.uk/PH11 25
Dykes F (2003) Infant Feeding Initiative: a report evaluating the Breastfeeding Practice Projects 1999-2002 (London: Department of Health) 26
http://atlas.chimat.org.uk/IAS/dataviews/breastfeedingprofile 27
Department of Health 2009. Commissioning local breastfeeding support services London: DH http://www.dh.gov.uk/prod_consum_dh/groups/dh_digitalassets/documents/digitalasset/dh_106497.pdf. 28
Department of Health 2012. Improving outcomes and supporting transparency: Part 1: A public health outcomes framework for England, 2013-2016. DH http://www.dh.gov.uk/prod_consum_dh/groups/dh_digitalassets/@dh/@en/documents/digitalasset/dh_132559.pdf. 29
Scottish Government (2011) Improving maternal and infant nutrition; a framework for action. The Scottish Government, Edinburgh.
Copyright © 2012, Health and Social Care Information Centre. All Rights Reserved. 28
30
Field, F 2010. The foundation years: preventing poor children becoming poor adults: the report of the Independent Review of Poverty and LIfe Chances. In: GOVERNMENT, H. (ed.). London: Cabinet Office. 31
Marmot, M 2010. The Marmot Review http://www.instituteofhealthequity.org/Content/FileManager/pdf/fairsocietyhealthylives.pdf 32
Department of Health 2007. Review of the Health Inequalities Infant Mortality PSA Target. London. 33
Department of Health 2008. Healthy Weight, Healthy Lives: a cross governmental strategy for England. London: HM Government http://webarchive.nationalarchives.gov.uk/20100407220245/http://www.dh.gov.uk/en/Publicationsandstatistics/Publications/PublicationsPolicyAndGuidance/DH_082378. 34
SACN/RCPCH Expert Group on Growth Standards 2007. Application of WHO Growth Standards in the UK. London: TSO http://www.sacn.gov.uk/pdfs/sacn.rcpch_who_growth_standards_report_final.pdf. 35
Nelson, M, 2000. Childhood nutrition and poverty. P Nutr Soc, 59, 307-315. 36
For further information on Scottish Government policies and services around parenting and family support see http://www.scotland.gov.uk/Topics/People/Young-People/Early-Years-and-Family/Families 37 See the Smoking at Booking table on the Births in Scottish Hospitals publication at: http://www.isdscotland.org/Health-Topics/Maternity-and-Births/Publications/2011-08-30/mat_bb_table8.xls 38
http://www.nice.org.uk/nicemedia/live/13023/49345/49345.pdf 39
http://www.dh.gov.uk/en/Publicationsandstatistics/Publications/PublicationsPolicyAndGuidance/DH_124917 40 For further information on SSATOD, please see: http://www.ic.nhs.uk/pubs/wsstd1213q1
41 http://wales.gov.uk/topics/health/improvement/index/tobaccoplan/?lang=en
42 http://www.dhsspsni.gov.uk/tobacco_strategy_-_final.pdf
43 http://www.legislation.gov.uk/ukpga/2006/28/contents
44 http://www.legislation.gov.uk//asp/2005/13
45 http://www.dhsspsni.gov.uk/index/phealth/php/health_promotion/smoking_ni_order_2006.htm
46 http://www.ons.gov.uk/ons/search/index.html?newquery=ns+sec
47 For further information on the Indices of Multiple Deprivation across the UK see the Office for National Statistics
website: http://www.neighbourhood.statistics.gov.uk/dissemination/Info.do;jessionid=6v3KP9yD0hkvPvCHvRfXCdmbtBh1KJXHyr7z4pcB9zP60thzFKQd!1949496690!1342009987425?m=0&s=1342009987425&enc=1&page=analysisandguidance/analysisarticles/indices-of-deprivation.htm&nsjs=true&nsck=true&nssvg=false&nswid=1280
48 http://www.nisra.gov.uk/Census/2001%20Census%20Results/Key%20Statistics/KeyStatisticstoOutputAreaLevel.html
49 http://www.ucas.ac.uk/about_us/media_enquiries/media_releases/2010/210110
50 Rowe R. Birthplace terms and definitions: consensus process. Birthplace in England research programme. Final report
part 2: NIHR Service Delivery and Organisation programme; 2011. 51
For further information on UNICEF‟s Baby Friendly Initiative, see www.unicef.org.uk/BabyFriendly/ 52
In Scotland and Wales, funding to work towards BFI accreditation was universally available across all areas. While arrangements for working towards BFI are different in Northern Ireland, as in Scotland and Wales there has been no targeting of efforts towards more deprived areas. 53
This is described in the questionnaire as „normal (vaginal) birth‟. 54
Mothers aged 35 or more were also more likely than average to use a TENS machine (18%).
Copyright © 2012, Health and Social Care Information Centre. All Rights Reserved. 1
2. Incidence, prevalence and duration of breastfeeding
Key Findings
Mothers in the UK are breastfeeding their babies for longer with one in three mothers still breastfeeding at six months in 2010 compared with one in four mothers in 2005. However, the proportion of mothers following current UK government guidelines on exclusive breastfeeding remained unchanged between 2005 and 2010 – with only one in every hundred breastfeeding exclusively for the first six months of their baby’s life.
The initial breastfeeding rate increased from 76% in 2005 to 81% in 2010. This includes all babies who were put to the breast at all, even if this was on one occasion only, and also includes giving expressed breastmilk. Initial breastfeeding rates in 2010 were 83% in England, 74% in Scotland, 71% in Wales, and 64% in Northern Ireland. The incidence of breastfeeding increased between 2005 and 2010 in England, Scotland and Wales (from 78%, 70% and 67% respectively) but there was no statistically significant increase in Northern Ireland.
In terms of longer term trends, initiation rates have risen in the UK since 1990, when the UK series began. The UK initiation rate was 62% in 1990 and increases have been seen across all countries in the UK since then. Each country started from a different baseline, with the rates in Northern Ireland being lowest of all (36% in 1990).
The highest incidences of breastfeeding were found among mothers aged 30 or over (87%), those from minority ethnic groups (97% for Chinese or other ethnic group, 96% for Black and 95% for Asian ethnic group), those who left education aged over 18 (91%), those in managerial and professional occupations (90%) and those living in the least deprived areas (89%).
Whilst mothers of first babies were more likely to start breastfeeding than mothers of second or later babies (84% compared with 78%), mothers who had previously breastfed a baby for at least six weeks were more likely to start breastfeeding their latest baby than those who had breastfed a previous child for less than six weeks or not at all (97% compared with 79% and 35%). These variations were evident in all countries and were consistent with the patterns found in previous surveys.
Across the UK, the prevalence of breastfeeding fell from 81% at birth to 69% at one week, and to 55% at six weeks. At six months, just over a third of mothers (34%) were still breastfeeding.
Mothers continued to breastfeed for longer in 2010 than was the case in 2005. The gap in breastfeeding levels at birth between 2005 and 2010 was five percentage points (76% in 2005 compared with 81% in 2010) and by six months the gap became nine percentage points (25% in 2005 compared to 34% in 2010). This suggests that policy developments to improve support and information provided to mothers to encourage them to continue breastfeeding may have had an impact.
Increases in the prevalence of breastfeeding were observed in England (from 26% when the baby was aged six months in 2005 to 36% in 2010) and Scotland (from 24% to 32% at six months respectively) and to a lesser extent in Wales (18% to 23% at six months respectively) whilst there was no significant difference in Northern Ireland (14% to 16% at six months respectively).
In terms of longer term trends, while breastfeeding initiation has been steadily increasing over time, the prevalence of breastfeeding at later ages did not increase between 1995 and 2000. Improvements in the prevalence of breastfeeding at later ages have however been seen from 2005 onwards. At six weeks, the respective prevalence levels were 42% in 1995 and 2000, 48% in 2005 and 55% in 2010, while at six months they were 21% in 1995 and 2000, 25% in 2005 and 34% in 2010.
Copyright © 2012, Health and Social Care Information Centre. All Rights Reserved. 2
Prevalence of breastfeeding at all ages of baby up to nine months was highest among certain demographic groups. For example, when babies were aged six months, this was highest for mothers from managerial and professional occupations (44%), those who left education aged over 18 (46%), those aged 30 or over (45%), those living in the least deprived areas (40%) and those from minority ethnic groups (66% for Chinese or other ethnic group, 61% for Black and 49% for both Asian and Mixed ethnic groups).
Most mothers who had breastfed their previous child for six weeks or longer were also likely to feed their current baby for six weeks or more. Thus, at six weeks 82% of mothers who breastfed initially and who breastfed their previous child for six weeks or longer were still breastfeeding, while over half (55%) of these mothers were still breastfeeding at six months.
Across the UK, 69% of mothers were exclusively breastfeeding at birth in 2010. At one week, less than half of all mothers (46%) were exclusively breastfeeding, while this had fallen to around a quarter (23%) by six weeks. By six months, levels of exclusive breastfeeding had decreased to one per cent, indicating that very few mothers were following the UK health departments’ recommendation that babies should be exclusively breastfed until around the age of six months.
Prevalence of exclusive breastfeeding was higher in England and Scotland and lower in Northern Ireland and Wales. For example at six weeks, it was 24% and 22% in England and Scotland respectively, compared to 17% in Wales and 13% in Northern Ireland.
There has been an increase in the prevalence of exclusive breastfeeding at birth (from 65% in 2005 to 69% in 2010), but there has been little change thereafter up until six weeks. However, the fall-out in later months was lower in 2010 than 2005, for example, at three months, 17% of mothers were still breastfeeding exclusively (up from 13% in 2005) and at four months, 12% were still breastfeeding exclusively (up from 7% in 2005).
Among mothers who breastfed exclusively at birth, 62% lost their exclusive breastfeeding status by the introduction of formula (or other milk), while a further seven per cent lost it by introducing both formula and other liquids at around the same age. One in ten mothers (10%) lost their exclusive feeding status by first giving their baby some other liquid, while the same proportion (10%) lost exclusivity through the introduction of solids.
Mothers who lost their exclusive breastfeeding status due to solids breastfed exclusively for much longer than mothers who first introduced formula (for example, among those who breastfed exclusively at birth, 79% of those who first introduced solids and one per cent of those who first introduced formula were still breastfeeding exclusively at four months).
Copyright © 2012, Health and Social Care Information Centre. All Rights Reserved. 3
This chapter presents the key statistics about initiation of breastfeeding, the proportion of babies who received any breastmilk at specific ages up to nine months, and the length of time mothers continued to breastfeed. The survey also measured levels of exclusive breastfeeding at specific ages up to six months. For all these key measures comparisons are made with previous surveys where possible and variations by different demographic subgroups are explored. The feeding practices of twins and triplets are discussed in Appendix D.
Breastfeeding initiation and prevalence is also considered later in the report. Chapter 4 discusses how the gestational age of the baby at birth and events during and immediately after the birth may affect feeding, and more specifically breastfeeding, in the first few weeks. The findings of logistic regression to understand the impact of various demographic characteristics and other factors on breastfeeding initiation and prevalence at two and six weeks (based on full term babies) can be found in Appendix C.
2.1 Incidence of breastfeeding
Incidence of breastfeeding is defined as the proportion of babies who were breastfed initially. This includes all babies who were put to the breast at all, even if this was on one occasion only. It also includes giving expressed breastmilk to the baby.
2.1.1 Trends in incidence of breastfeeding
The initial breastfeeding rate increased from 76% in 2005 to 81% in 2010 in the UK.
Incidence of breastfeeding by country follows the same pattern as in 2005, with initial breastfeeding rates highest in England (83%).
Incidence of breastfeeding has continued to increase across Great Britain. Breastfeeding rates rose from 78% to 83% between 2005 and 2010 in England, from 67% to 71% in Wales and from 70% to 74% in Scotland. In Northern Ireland, the rate changed from 63% to 64%, which was not a large enough increase to be statistically significant at a 5% significance level.
In terms of longer term trends, initiation rates have risen in the UK since 1990, when the UK series began. The UK initiation rate was 62% in 1990 and increases have been seen across all countries in the UK since then. Each country started from a different baseline, with the rates in Northern Ireland being lowest of all (36% in 1990).
Table 2.1 and Figure 2.1
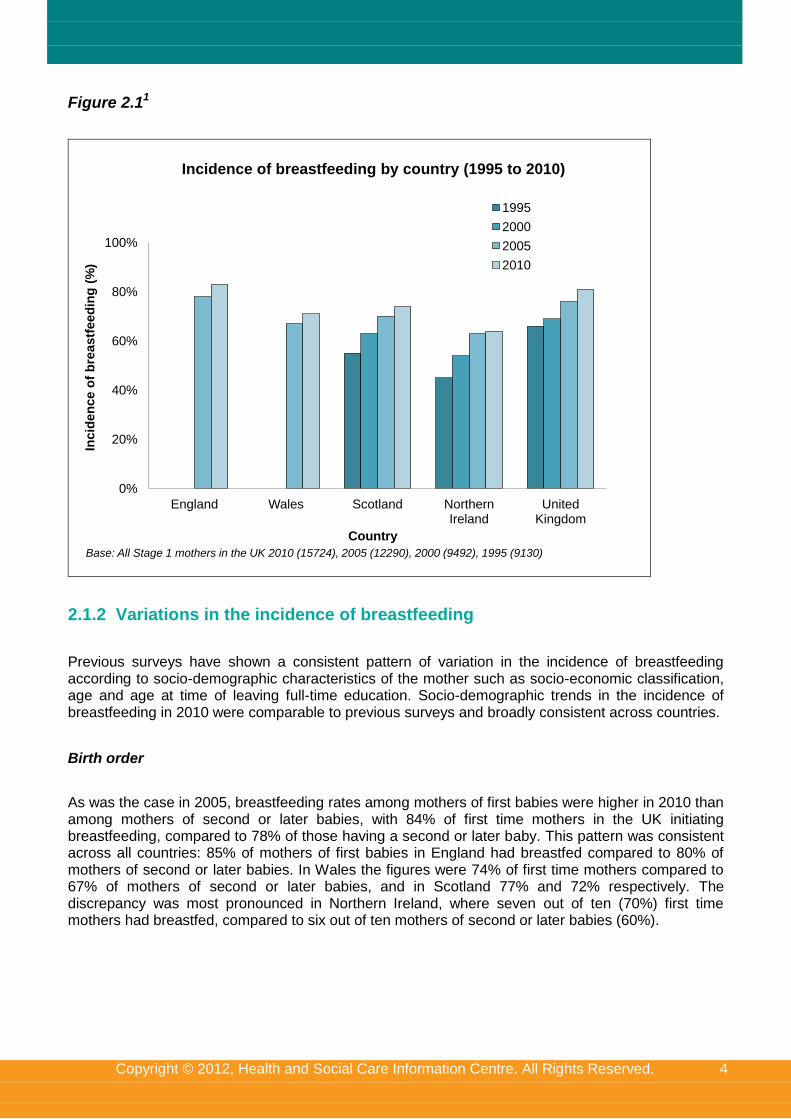
Copyright © 2012, Health and Social Care Information Centre. All Rights Reserved. 4
Figure 2.11
0%
20%
40%
60%
80%
100%
England Wales Scotland Northern Ireland
United Kingdom
Incid
en
ce o
f b
reastf
eed
ing
(%
)
Country
1995
2000
2005
2010
Base: All Stage 1 mothers in the UK 2010 (15724), 2005 (12290), 2000 (9492), 1995 (9130)
Incidence of breastfeeding by country (1995 to 2010)
2.1.2 Variations in the incidence of breastfeeding
Previous surveys have shown a consistent pattern of variation in the incidence of breastfeeding according to socio-demographic characteristics of the mother such as socio-economic classification, age and age at time of leaving full-time education. Socio-demographic trends in the incidence of breastfeeding in 2010 were comparable to previous surveys and broadly consistent across countries.
Birth order
As was the case in 2005, breastfeeding rates among mothers of first babies were higher in 2010 than among mothers of second or later babies, with 84% of first time mothers in the UK initiating breastfeeding, compared to 78% of those having a second or later baby. This pattern was consistent across all countries: 85% of mothers of first babies in England had breastfed compared to 80% of mothers of second or later babies. In Wales the figures were 74% of first time mothers compared to 67% of mothers of second or later babies, and in Scotland 77% and 72% respectively. The discrepancy was most pronounced in Northern Ireland, where seven out of ten (70%) first time mothers had breastfed, compared to six out of ten mothers of second or later babies (60%).
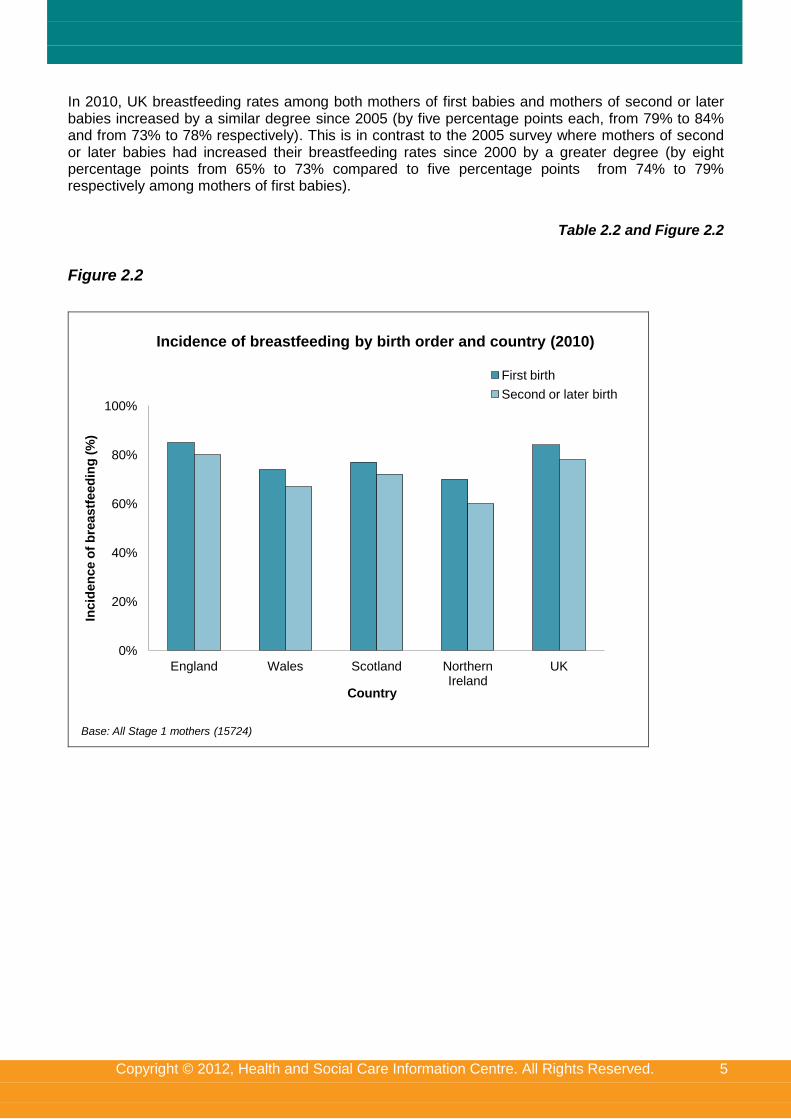
Copyright © 2012, Health and Social Care Information Centre. All Rights Reserved. 5
In 2010, UK breastfeeding rates among both mothers of first babies and mothers of second or later babies increased by a similar degree since 2005 (by five percentage points each, from 79% to 84% and from 73% to 78% respectively). This is in contrast to the 2005 survey where mothers of second or later babies had increased their breastfeeding rates since 2000 by a greater degree (by eight percentage points from 65% to 73% compared to five percentage points from 74% to 79% respectively among mothers of first babies).
Table 2.2 and Figure 2.2
Figure 2.2
0%
20%
40%
60%
80%
100%
England Wales Scotland Northern Ireland
UK
Incid
en
ce o
f b
reastf
eed
ing
(%
)
Country
First birth
Second or later birth
Base: All Stage 1 mothers (15724)
Incidence of breastfeeding by birth order and country (2010)
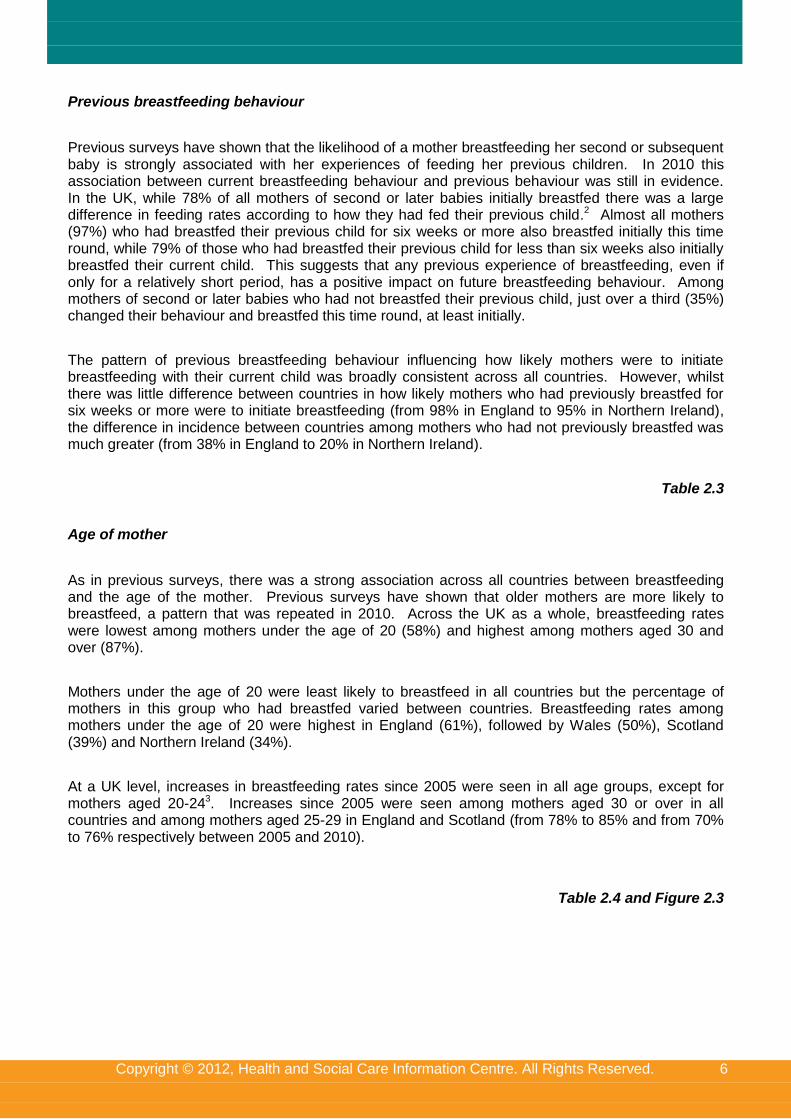
Copyright © 2012, Health and Social Care Information Centre. All Rights Reserved. 6
Previous breastfeeding behaviour
Previous surveys have shown that the likelihood of a mother breastfeeding her second or subsequent baby is strongly associated with her experiences of feeding her previous children. In 2010 this association between current breastfeeding behaviour and previous behaviour was still in evidence. In the UK, while 78% of all mothers of second or later babies initially breastfed there was a large difference in feeding rates according to how they had fed their previous child.2 Almost all mothers (97%) who had breastfed their previous child for six weeks or more also breastfed initially this time round, while 79% of those who had breastfed their previous child for less than six weeks also initially breastfed their current child. This suggests that any previous experience of breastfeeding, even if only for a relatively short period, has a positive impact on future breastfeeding behaviour. Among mothers of second or later babies who had not breastfed their previous child, just over a third (35%) changed their behaviour and breastfed this time round, at least initially.
The pattern of previous breastfeeding behaviour influencing how likely mothers were to initiate breastfeeding with their current child was broadly consistent across all countries. However, whilst there was little difference between countries in how likely mothers who had previously breastfed for six weeks or more were to initiate breastfeeding (from 98% in England to 95% in Northern Ireland), the difference in incidence between countries among mothers who had not previously breastfed was much greater (from 38% in England to 20% in Northern Ireland).
Table 2.3
Age of mother
As in previous surveys, there was a strong association across all countries between breastfeeding and the age of the mother. Previous surveys have shown that older mothers are more likely to breastfeed, a pattern that was repeated in 2010. Across the UK as a whole, breastfeeding rates were lowest among mothers under the age of 20 (58%) and highest among mothers aged 30 and over (87%).
Mothers under the age of 20 were least likely to breastfeed in all countries but the percentage of mothers in this group who had breastfed varied between countries. Breastfeeding rates among mothers under the age of 20 were highest in England (61%), followed by Wales (50%), Scotland (39%) and Northern Ireland (34%).
At a UK level, increases in breastfeeding rates since 2005 were seen in all age groups, except for mothers aged 20-243. Increases since 2005 were seen among mothers aged 30 or over in all countries and among mothers aged 25-29 in England and Scotland (from 78% to 85% and from 70% to 76% respectively between 2005 and 2010).
Table 2.4 and Figure 2.3
Copyright © 2012, Health and Social Care Information Centre. All Rights Reserved. 7
Figure 2.3
0%
20%
40%
60%
80%
100%
England Wales Scotland Northern Ireland
UK
Inc
ide
nc
e o
f b
rea
stf
eed
ing
(%
)
Country
Under 20
20 - 24
25 - 29
30 or over
Base: All Stage 1 mothers (15724)
Incidence of breastfeeding by mother’s age and country (2010)
Ethnicity of mother
Information on ethnicity was collected in England, Wales and Scotland, but was not asked in Northern Ireland4. As in 2005, mothers from all minority ethnic groups were more likely to breastfeed compared with White mothers. Thus more than nine in ten mothers who classified themselves as Asian (95%), Black (96%), or Chinese or other ethnic origin (97%) initially breastfed compared with just under nine in ten (89%) mothers of mixed race and around four in five White mothers (79%). The increase in the incidence of breastfeeding since 2005 has come primarily from White mothers (74% to 79%): the increases in the Mixed and Chinese or other ethnic groups were not statistically significant. In any case, initiation rates in non-White communities were already at a high level.
Table 2.5
Socio-economic classification (NS-SEC) of mother
Mothers were classified into socio-economic groups based on either their current or previous job. As with previous surveys, there was a clear association between breastfeeding and socio-economic status. Further details of the NS-SEC classification can be found in section 1.6 and section 1.9.3 of Chapter 1.
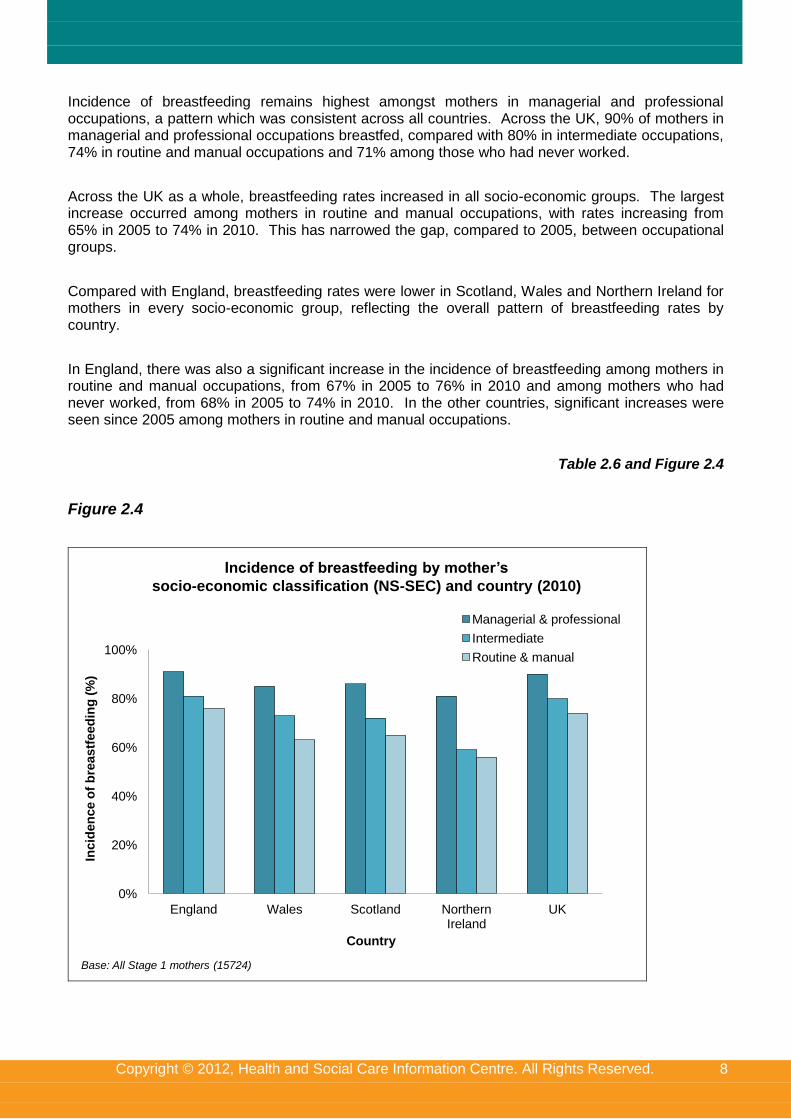
Copyright © 2012, Health and Social Care Information Centre. All Rights Reserved. 8
Incidence of breastfeeding remains highest amongst mothers in managerial and professional occupations, a pattern which was consistent across all countries. Across the UK, 90% of mothers in managerial and professional occupations breastfed, compared with 80% in intermediate occupations, 74% in routine and manual occupations and 71% among those who had never worked.
Across the UK as a whole, breastfeeding rates increased in all socio-economic groups. The largest increase occurred among mothers in routine and manual occupations, with rates increasing from 65% in 2005 to 74% in 2010. This has narrowed the gap, compared to 2005, between occupational groups.
Compared with England, breastfeeding rates were lower in Scotland, Wales and Northern Ireland for mothers in every socio-economic group, reflecting the overall pattern of breastfeeding rates by country.
In England, there was also a significant increase in the incidence of breastfeeding among mothers in routine and manual occupations, from 67% in 2005 to 76% in 2010 and among mothers who had never worked, from 68% in 2005 to 74% in 2010. In the other countries, significant increases were seen since 2005 among mothers in routine and manual occupations.
Table 2.6 and Figure 2.4
Figure 2.4
0%
20%
40%
60%
80%
100%
England Wales Scotland Northern Ireland
UK
Incid
en
ce o
f b
reastf
eed
ing
(%
)
Country
Managerial & professional
Intermediate
Routine & manual
Base: All Stage 1 mothers (15724)
Incidence of breastfeeding by mother’s
socio-economic classification (NS-SEC) and country (2010)
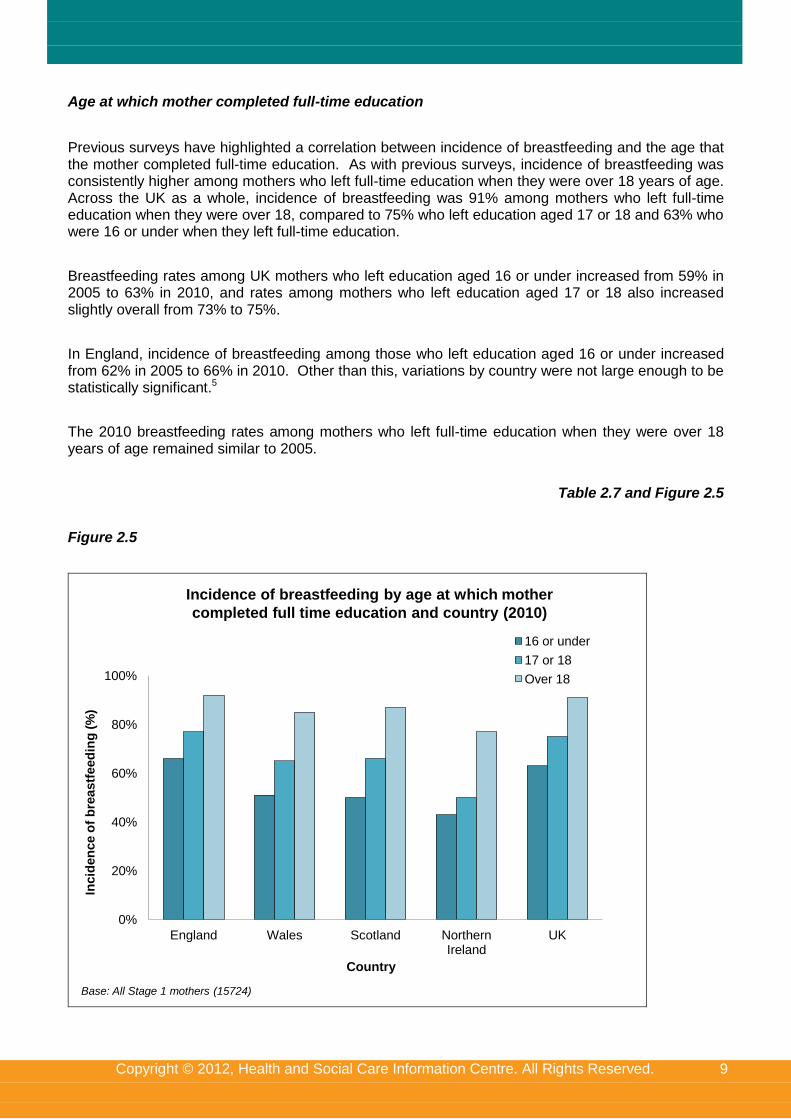
Copyright © 2012, Health and Social Care Information Centre. All Rights Reserved. 9
Age at which mother completed full-time education
Previous surveys have highlighted a correlation between incidence of breastfeeding and the age that the mother completed full-time education. As with previous surveys, incidence of breastfeeding was consistently higher among mothers who left full-time education when they were over 18 years of age. Across the UK as a whole, incidence of breastfeeding was 91% among mothers who left full-time education when they were over 18, compared to 75% who left education aged 17 or 18 and 63% who were 16 or under when they left full-time education.
Breastfeeding rates among UK mothers who left education aged 16 or under increased from 59% in 2005 to 63% in 2010, and rates among mothers who left education aged 17 or 18 also increased slightly overall from 73% to 75%.
In England, incidence of breastfeeding among those who left education aged 16 or under increased from 62% in 2005 to 66% in 2010. Other than this, variations by country were not large enough to be statistically significant.5
The 2010 breastfeeding rates among mothers who left full-time education when they were over 18 years of age remained similar to 2005.
Table 2.7 and Figure 2.5
Figure 2.5
0%
20%
40%
60%
80%
100%
England Wales Scotland Northern Ireland
UK
Incid
en
ce o
f b
reastf
eed
ing
(%
)
Country
16 or under
17 or 18
Over 18
Base: All Stage 1 mothers (15724)
Incidence of breastfeeding by age at which mother
completed full time education and country (2010)
Copyright © 2012, Health and Social Care Information Centre. All Rights Reserved. 10
Deprivation
Although, as discussed in Chapter 1, the level of deprivation is linked with socio-economic group (for example, mothers from managerial and professional occupations are more likely to live in more affluent areas), it is also useful to consider initiation rates by level of deprivation in the area in which mothers live. The incidence of breastfeeding decreased as deprivation levels increased, so that fewer than three-quarters (73%) of mothers in the most deprived quintile initiated breastfeeding compared with almost nine in ten (89%) of the least deprived mothers.
The effect of deprivation on incidence of breastfeeding can be seen across all countries, although the difference between mothers living in the most and least deprived areas is smallest in England, where 76% of the mothers living in the most deprived areas initiated breastfeeding compared with 89% in the least deprived areas – a difference of 13 percentage points. Elsewhere in the UK, the differences between mothers living in the most and least deprived areas were between 25 and 30 percentage points: in Wales 60% of the most deprived mothers initiated breastfeeding compared with 85% of the least deprived, whilst in Scotland these figures were 60% and 88% respectively, and in Northern Ireland 49% and 79% respectively. This could be explained by the ethnic profile of each country. As discussed in Chapter 1, mothers from minority ethnic backgrounds are more likely to live in England than the devolved nations and only a very small minority live in Northern Ireland. Black and Asian mothers are more likely to live in the most deprived areas than other ethnic groups. As mothers from ethnic minorities were more likely to initiate breastfeeding, this may be why there was less of a gap in initiation rates between the most and least deprived areas in England, where the non-White population is greater.
Table 2.8
Region
Regional analysis is presented by Government Office Region rather than Strategic Health Authority as in 2005.6 In England, breastfeeding rates were lower than the 83% average in the North East (65%), the North West (76%), Yorkshire and the Humber (77%) and the West Midlands (78%) regions. Breastfeeding rates were in line with average for England in the East of England (85%), the South West (85%) and East Midlands (83%) and were higher than average in London (94%) and the South East (86%). This is likely to reflect the socio-economic and/or ethnic profile of different regions across England (and also applies to the devolved nations). For example, regions with a higher level of deprivation and a higher proportion of White mothers such as in the North East of England had lower initiation rates. In London where initiation rates were highest, there are more mothers from minority ethnic backgrounds who are more likely to breastfeed. The socio-economic and ethnic profile of mothers in different English regions and the devolved nations is discussed in more detail in Chapter 1.
Table 2.9
Copyright © 2012, Health and Social Care Information Centre. All Rights Reserved. 11
2.2 Standardisation of breastfeeding rates
To assess whether increases in the incidence of breastfeeding are solely due to changes in the demographic composition of the sample over time (e.g. mothers are now generally older and more educated, and older and more educated mothers are more likely to breastfeed) a statistical technique known as standardisation can be used.
Previous Infant Feeding Surveys have shown increasing percentages of mothers aged 30 or over and mothers who have continued in full-time education beyond the age of 18. Standardisation to the age of mother and what age the mother left full-time education in 1985 (or 1990 for Northern Ireland) allows us to see whether there is an element of ‘real’ change in the incidence of breastfeeding, which cannot be attributed to changes in the sample.
Table 2.10 shows the standardised incidence of breastfeeding by country. It is only possible to show this for England and Wales combined as standalone data for Wales does not exist before 2005.
Between 2005 and 2010, the survey estimates showed that incidence of breastfeeding had increased in England and Wales combined and in Scotland, but had not increased significantly in Northern Ireland. The standardised rates show the same pattern for all countries, suggesting that increases in England and Wales as well as in Scotland7 are ‘real’ changes over time rather than changes largely attributable to changes in the sample composition by age and length of time in education.
Table 2.10
2.3 Prevalence of breastfeeding
Prevalence of breastfeeding is defined as the proportion of all babies who are being breastfed at specific ages, even if they are also receiving infant formula or solid food.
2.3.1 Trends in prevalence by country
As already seen in Table 2.1, across all countries initial breastfeeding rates were higher in 2010 compared with previous surveys. However, although more than four-fifths (81%) of mothers started breastfeeding at birth, there was a noticeable fall-out during the early weeks. Thus, across the UK the prevalence of breastfeeding fell from 81% at birth to 69% at one week, and to 55% at six weeks. At six months, over a third of mothers (34%) were still breastfeeding.
The level of fall-out by six weeks was lower in Scotland and England than in the other countries (there was a decrease of 24 percentage points to 50% in Scotland and 26 percentage points to 57% in England compared with 31 percentage point decreases in Wales and Northern Ireland). A similar pattern was evident at six months for Scotland only: there had been a decrease of 42 percentage points in Scotland, compared with decreases of 47 percentage points in England and 48 percentage points in Wales and Northern Ireland. Thus, while initiation rates were nine percentage points lower in Scotland than England (where the rates were the highest), by six months, the gap had narrowed (prevalence in England was 36% compared with 32% in Scotland).
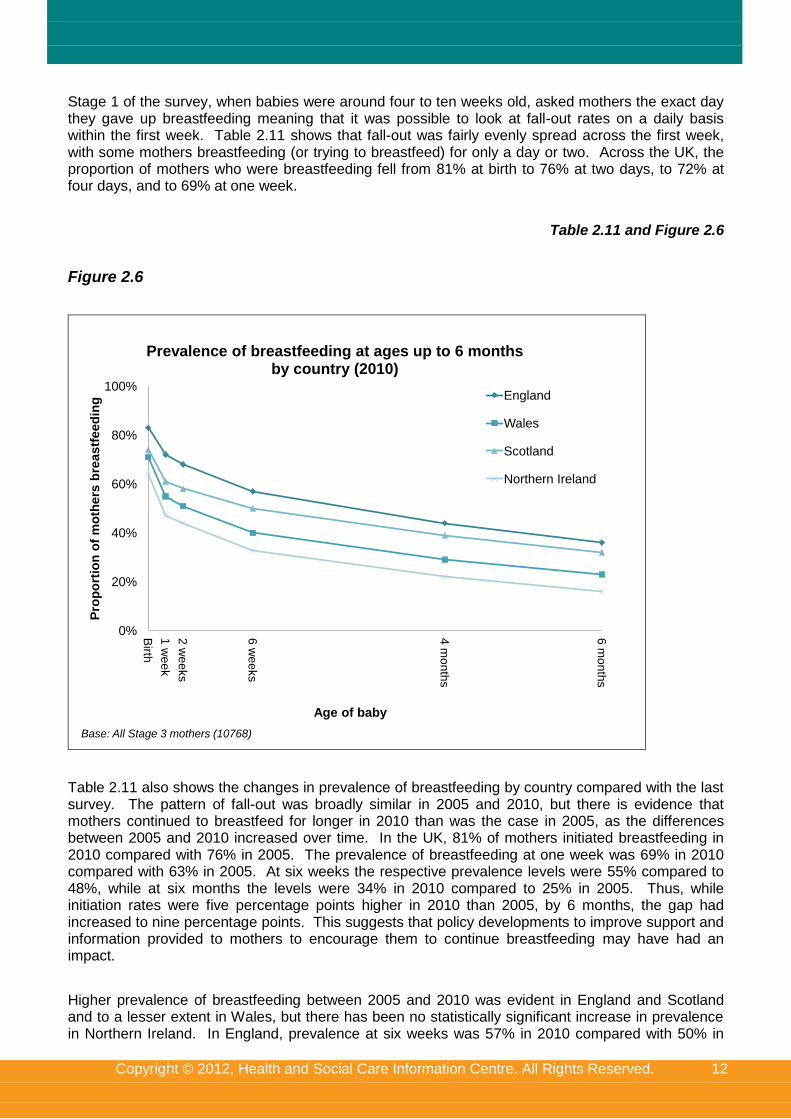
Copyright © 2012, Health and Social Care Information Centre. All Rights Reserved. 12
Stage 1 of the survey, when babies were around four to ten weeks old, asked mothers the exact day they gave up breastfeeding meaning that it was possible to look at fall-out rates on a daily basis within the first week. Table 2.11 shows that fall-out was fairly evenly spread across the first week, with some mothers breastfeeding (or trying to breastfeed) for only a day or two. Across the UK, the proportion of mothers who were breastfeeding fell from 81% at birth to 76% at two days, to 72% at four days, and to 69% at one week.
Table 2.11 and Figure 2.6
Figure 2.6
0%
20%
40%
60%
80%
100%
Birth
1 w
ee
k
2 w
ee
ks
6 w
ee
ks
4 m
on
ths
6 m
on
ths
Pro
po
rtio
n o
f m
oth
ers
bre
as
tfe
ed
ing
Age of baby
Prevalence of breastfeeding at ages up to 6 months by country (2010)
England
Wales
Scotland
Northern Ireland
Base: All Stage 3 mothers (10768)
Table 2.11 also shows the changes in prevalence of breastfeeding by country compared with the last survey. The pattern of fall-out was broadly similar in 2005 and 2010, but there is evidence that mothers continued to breastfeed for longer in 2010 than was the case in 2005, as the differences between 2005 and 2010 increased over time. In the UK, 81% of mothers initiated breastfeeding in 2010 compared with 76% in 2005. The prevalence of breastfeeding at one week was 69% in 2010 compared with 63% in 2005. At six weeks the respective prevalence levels were 55% compared to 48%, while at six months the levels were 34% in 2010 compared to 25% in 2005. Thus, while initiation rates were five percentage points higher in 2010 than 2005, by 6 months, the gap had increased to nine percentage points. This suggests that policy developments to improve support and information provided to mothers to encourage them to continue breastfeeding may have had an impact.
Higher prevalence of breastfeeding between 2005 and 2010 was evident in England and Scotland and to a lesser extent in Wales, but there has been no statistically significant increase in prevalence in Northern Ireland. In England, prevalence at six weeks was 57% in 2010 compared with 50% in
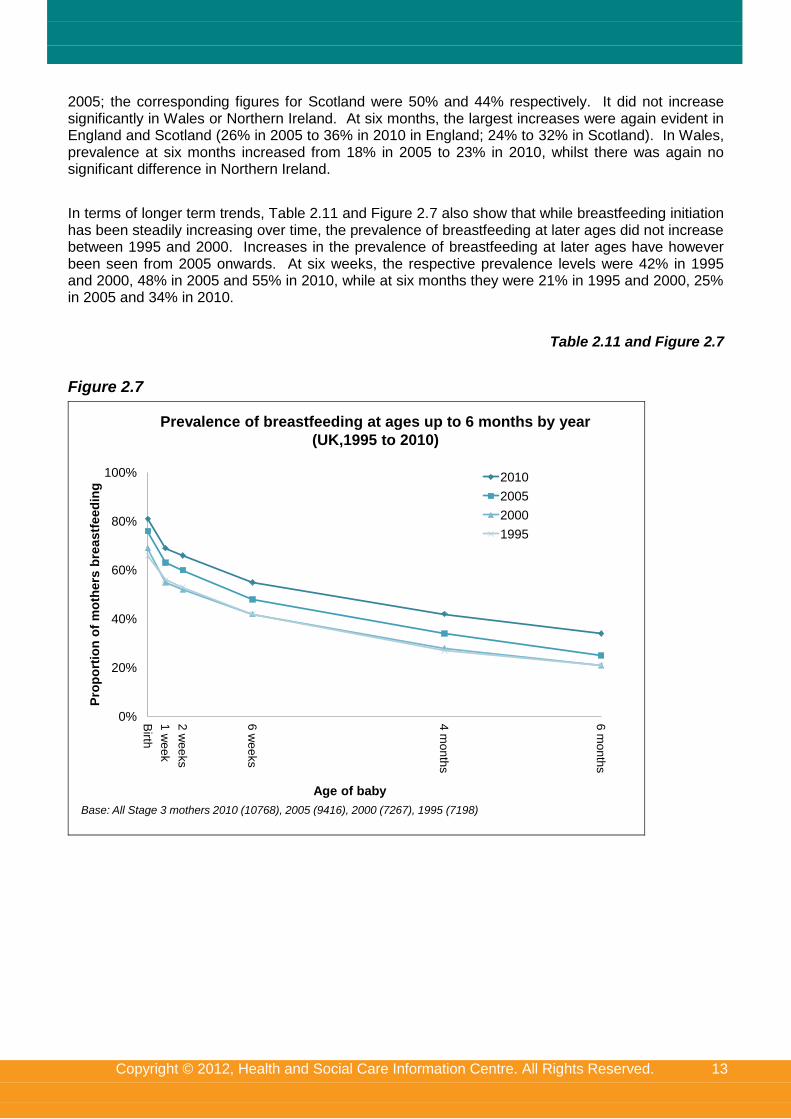
Copyright © 2012, Health and Social Care Information Centre. All Rights Reserved. 13
2005; the corresponding figures for Scotland were 50% and 44% respectively. It did not increase significantly in Wales or Northern Ireland. At six months, the largest increases were again evident in England and Scotland (26% in 2005 to 36% in 2010 in England; 24% to 32% in Scotland). In Wales, prevalence at six months increased from 18% in 2005 to 23% in 2010, whilst there was again no significant difference in Northern Ireland.
In terms of longer term trends, Table 2.11 and Figure 2.7 also show that while breastfeeding initiation has been steadily increasing over time, the prevalence of breastfeeding at later ages did not increase between 1995 and 2000. Increases in the prevalence of breastfeeding at later ages have however been seen from 2005 onwards. At six weeks, the respective prevalence levels were 42% in 1995 and 2000, 48% in 2005 and 55% in 2010, while at six months they were 21% in 1995 and 2000, 25% in 2005 and 34% in 2010.
Table 2.11 and Figure 2.7
Figure 2.7
0%
20%
40%
60%
80%
100%
Birth
1 w
ee
k
2 w
ee
ks
6 w
ee
ks
4 m
on
ths
6 m
on
ths
Pro
po
rtio
n o
f m
oth
ers
bre
astf
eed
ing
Age of baby
2010
2005
2000
1995
Base: All Stage 3 mothers 2010 (10768), 2005 (9416), 2000 (7267), 1995 (7198)
Prevalence of breastfeeding at ages up to 6 months by year
(UK,1995 to 2010)
Copyright © 2012, Health and Social Care Information Centre. All Rights Reserved. 14
2.3.2 Variations in the prevalence of breastfeeding
Birth order
As already seen in section 2.1.2, first-time mothers were more likely to initiate breastfeeding at birth. However, Table 2.12 shows that first-time mothers had a higher fall-out rate compared with mothers of second or later babies (from birth to six weeks the fall-out rate was 29 percentage points for first-time mothers and 23 percentage points for mothers of second or later babies). This meant that there was no difference in the prevalence of breastfeeding by birth order from six weeks onwards (when prevalence was 55% for both first-time mothers and mothers of second or later babies). In 2005 and earlier surveys, prevalence was higher among second-time mothers from four months onwards, so this suggests that while the fall-out rate was still higher for first-time mothers in 2010, it was not as marked as was the case previously. This may be as a result of improved information and support for first-time mothers, to manage their expectations of what breastfeeding will be like and enable them to resolve any problems they may experience when establishing breastfeeding.
Table 2.12
Age of mother
Table 2.12 shows breastfeeding prevalence by the age of the mother. This shows that not only were initial breastfeeding rates lower among younger mothers but also that the fall-out rate was higher among this group. At six months, mothers aged 35 or over were more than four times as likely to be breastfeeding compared with mothers aged under 20 (45% and 11% respectively).
Of particular note was the fall-out rate among mothers under 25. While over half (56%) of mothers aged under 20 and over two-thirds (68%) of mothers aged 20-24 breastfed or tried to breastfeed initially, this had fallen to 42% and 52% by one week.
Table 2.12
Socio-economic classification (NS-SEC) of mother
Table 2.12 shows that the differences in the levels of breastfeeding seen at birth between mothers from different socio-economic groups continued through until nine months, with mothers from managerial and professional occupations having higher rates of breastfeeding at all ages compared with mothers from intermediate occupations, who in turn had higher rates compared with mothers from routine and manual occupations. For example, prevalence of breastfeeding at six weeks was 70% among mothers from managerial and professional occupations compared with 52% among mothers from intermediate occupations and 42% among mothers from routine and manual occupations. Mothers who had never worked had similar levels of breastfeeding to mothers from routine and manual occupations (45% and 42% respectively, which is not a statistically significant difference).
Table 2.12
Copyright © 2012, Health and Social Care Information Centre. All Rights Reserved. 15
Age at which mother completed full-time education
Table 2.12 shows that the different rates of breastfeeding seen at birth by the length of time the mother was in education continued at all ages of the baby. Mothers who had left full time education at the age of 16 or younger were more likely to stop breastfeeding within the first two weeks than mothers who had left full time education when they were over 18 years of age (44% of mothers who left education at 16 or younger were still breastfeeding at two weeks, compared with 79% of mothers who left education when they were over 18 years of age). The pattern of higher fall-out among those who had left education at a younger age continued at later ages of the baby as well. Thus, at six weeks, mothers who left full-time education at over the age of 18 were nearly twice as likely to be breastfeeding compared with mothers who left aged 16 or under (70% and 32% respectively). At six months, they were more than 2.5 times as likely to be breastfeeding (46% and 17% respectively).
Table 2.12
Deprivation
Level of deprivation continued to be related to prevalence of breastfeeding at all ages of the baby, although the disparity between the most and least deprived areas was more marked up to six weeks, reflecting higher fall-out rates in more deprived areas when babies were younger; thereafter the gap narrowed. For example, at two weeks, 56% of mothers in the most deprived areas were breastfeeding, compared with 75% of mothers in the least deprived areas. However, by six months, 31% of mothers in the most deprived areas were still breastfeeding, compared with 40% of mothers in the least deprived areas. This may be due to the higher proportion of mothers from minority ethnic backgrounds living in the most deprived areas, particularly in England, who tended to breastfeed for longer (see also the earlier analysis of breastfeeding initiation by deprivation and ethnicity in section 2.1.2 as well as the analysis of prevalence by ethnicity in the next section).
Table 2.12
Ethnicity of mother
Mothers from Asian, Black and Chinese or other ethnic groups were the most likely to breastfeed initially, while White mothers were the least likely (mothers of Mixed ethnic origin fell in between the two). This difference was maintained through until later ages, although to a lesser extent among Asian mothers: At six months, 66% of mothers of Chinese or other ethnic origin and 61% of Black mothers were still breastfeeding. Prevalence at six months among Asian mothers was the same as for mothers of Mixed ethnic origin (49%), but all these groups had higher prevalence than White mothers (32%).
Particularly noticeable was the high level of breastfeeding among Black and Chinese or other mothers and the relatively low fall-out rate. While 95% of Black mothers breastfed initially, this had fallen to 85% at six weeks, and to 73% at four months. For mothers of Chinese or other ethnic origin, the figures were 96%, 82% and 76% respectively.
Table 2.13
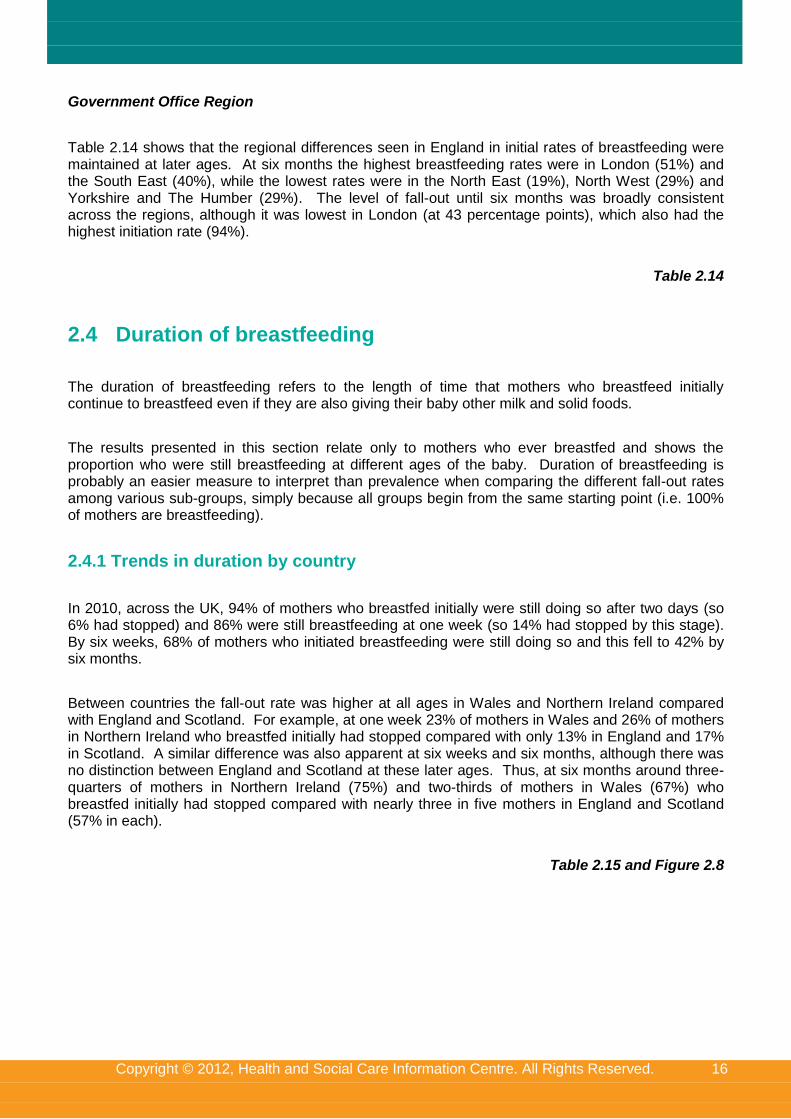
Copyright © 2012, Health and Social Care Information Centre. All Rights Reserved. 16
Government Office Region
Table 2.14 shows that the regional differences seen in England in initial rates of breastfeeding were maintained at later ages. At six months the highest breastfeeding rates were in London (51%) and the South East (40%), while the lowest rates were in the North East (19%), North West (29%) and Yorkshire and The Humber (29%). The level of fall-out until six months was broadly consistent across the regions, although it was lowest in London (at 43 percentage points), which also had the highest initiation rate (94%).
Table 2.14
2.4 Duration of breastfeeding
The duration of breastfeeding refers to the length of time that mothers who breastfeed initially continue to breastfeed even if they are also giving their baby other milk and solid foods.
The results presented in this section relate only to mothers who ever breastfed and shows the proportion who were still breastfeeding at different ages of the baby. Duration of breastfeeding is probably an easier measure to interpret than prevalence when comparing the different fall-out rates among various sub-groups, simply because all groups begin from the same starting point (i.e. 100% of mothers are breastfeeding).
2.4.1 Trends in duration by country
In 2010, across the UK, 94% of mothers who breastfed initially were still doing so after two days (so 6% had stopped) and 86% were still breastfeeding at one week (so 14% had stopped by this stage). By six weeks, 68% of mothers who initiated breastfeeding were still doing so and this fell to 42% by six months.
Between countries the fall-out rate was higher at all ages in Wales and Northern Ireland compared with England and Scotland. For example, at one week 23% of mothers in Wales and 26% of mothers in Northern Ireland who breastfed initially had stopped compared with only 13% in England and 17% in Scotland. A similar difference was also apparent at six weeks and six months, although there was no distinction between England and Scotland at these later ages. Thus, at six months around three-quarters of mothers in Northern Ireland (75%) and two-thirds of mothers in Wales (67%) who breastfed initially had stopped compared with nearly three in five mothers in England and Scotland (57% in each).
Table 2.15 and Figure 2.8
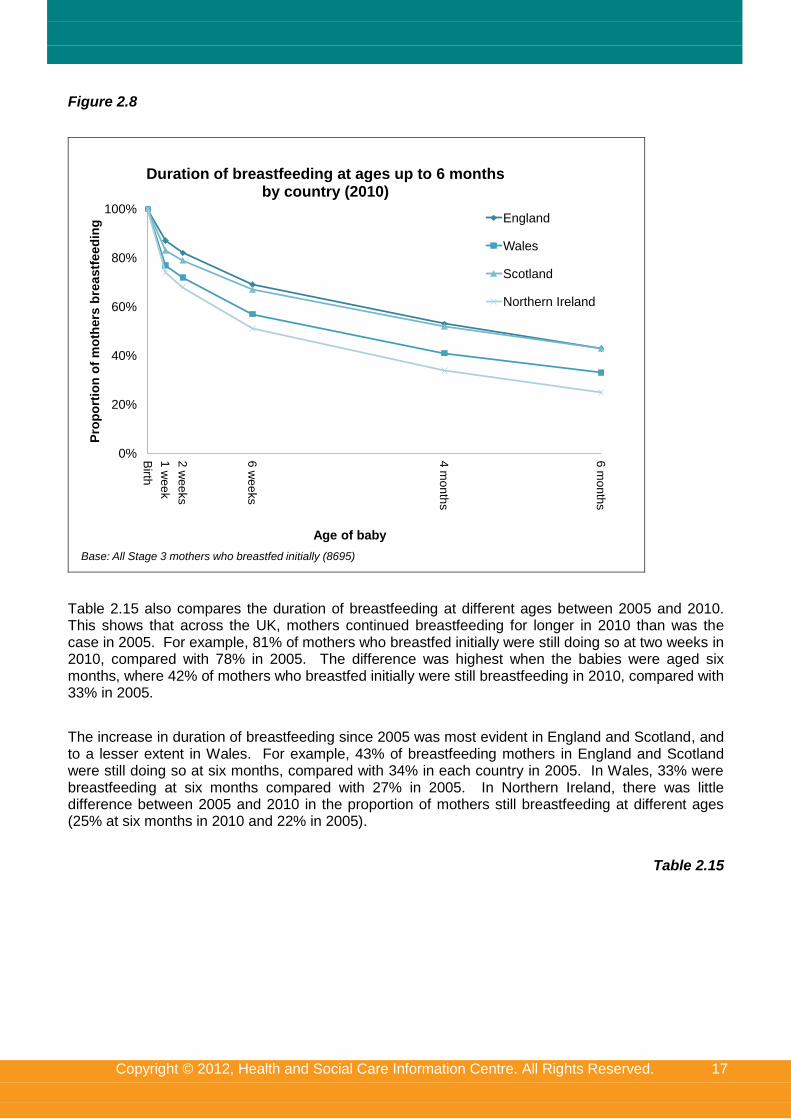
Copyright © 2012, Health and Social Care Information Centre. All Rights Reserved. 17
Figure 2.8
0%
20%
40%
60%
80%
100%
Birth
1 w
ee
k
2 w
ee
ks
6 w
ee
ks
4 m
on
ths
6 m
on
ths
Pro
po
rtio
n o
f m
oth
ers
bre
astf
eed
ing
Age of baby
Duration of breastfeeding at ages up to 6 months by country (2010)
England
Wales
Scotland
Northern Ireland
Base: All Stage 3 mothers who breastfed initially (8695)
Table 2.15 also compares the duration of breastfeeding at different ages between 2005 and 2010. This shows that across the UK, mothers continued breastfeeding for longer in 2010 than was the case in 2005. For example, 81% of mothers who breastfed initially were still doing so at two weeks in 2010, compared with 78% in 2005. The difference was highest when the babies were aged six months, where 42% of mothers who breastfed initially were still breastfeeding in 2010, compared with 33% in 2005.
The increase in duration of breastfeeding since 2005 was most evident in England and Scotland, and to a lesser extent in Wales. For example, 43% of breastfeeding mothers in England and Scotland were still doing so at six months, compared with 34% in each country in 2005. In Wales, 33% were breastfeeding at six months compared with 27% in 2005. In Northern Ireland, there was little difference between 2005 and 2010 in the proportion of mothers still breastfeeding at different ages (25% at six months in 2010 and 22% in 2005).
Table 2.15
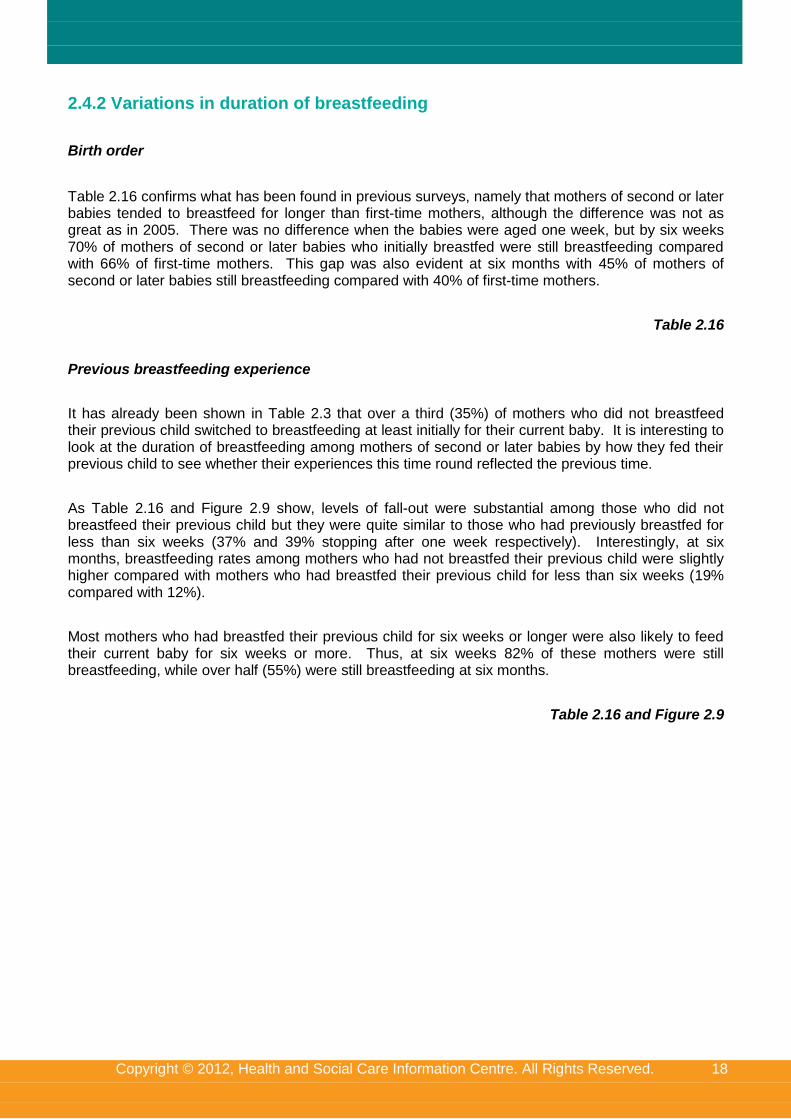
Copyright © 2012, Health and Social Care Information Centre. All Rights Reserved. 18
2.4.2 Variations in duration of breastfeeding
Birth order
Table 2.16 confirms what has been found in previous surveys, namely that mothers of second or later babies tended to breastfeed for longer than first-time mothers, although the difference was not as great as in 2005. There was no difference when the babies were aged one week, but by six weeks 70% of mothers of second or later babies who initially breastfed were still breastfeeding compared with 66% of first-time mothers. This gap was also evident at six months with 45% of mothers of second or later babies still breastfeeding compared with 40% of first-time mothers.
Table 2.16
Previous breastfeeding experience
It has already been shown in Table 2.3 that over a third (35%) of mothers who did not breastfeed their previous child switched to breastfeeding at least initially for their current baby. It is interesting to look at the duration of breastfeeding among mothers of second or later babies by how they fed their previous child to see whether their experiences this time round reflected the previous time.
As Table 2.16 and Figure 2.9 show, levels of fall-out were substantial among those who did not breastfeed their previous child but they were quite similar to those who had previously breastfed for less than six weeks (37% and 39% stopping after one week respectively). Interestingly, at six months, breastfeeding rates among mothers who had not breastfed their previous child were slightly higher compared with mothers who had breastfed their previous child for less than six weeks (19% compared with 12%).
Most mothers who had breastfed their previous child for six weeks or longer were also likely to feed their current baby for six weeks or more. Thus, at six weeks 82% of these mothers were still breastfeeding, while over half (55%) were still breastfeeding at six months.
Table 2.16 and Figure 2.9
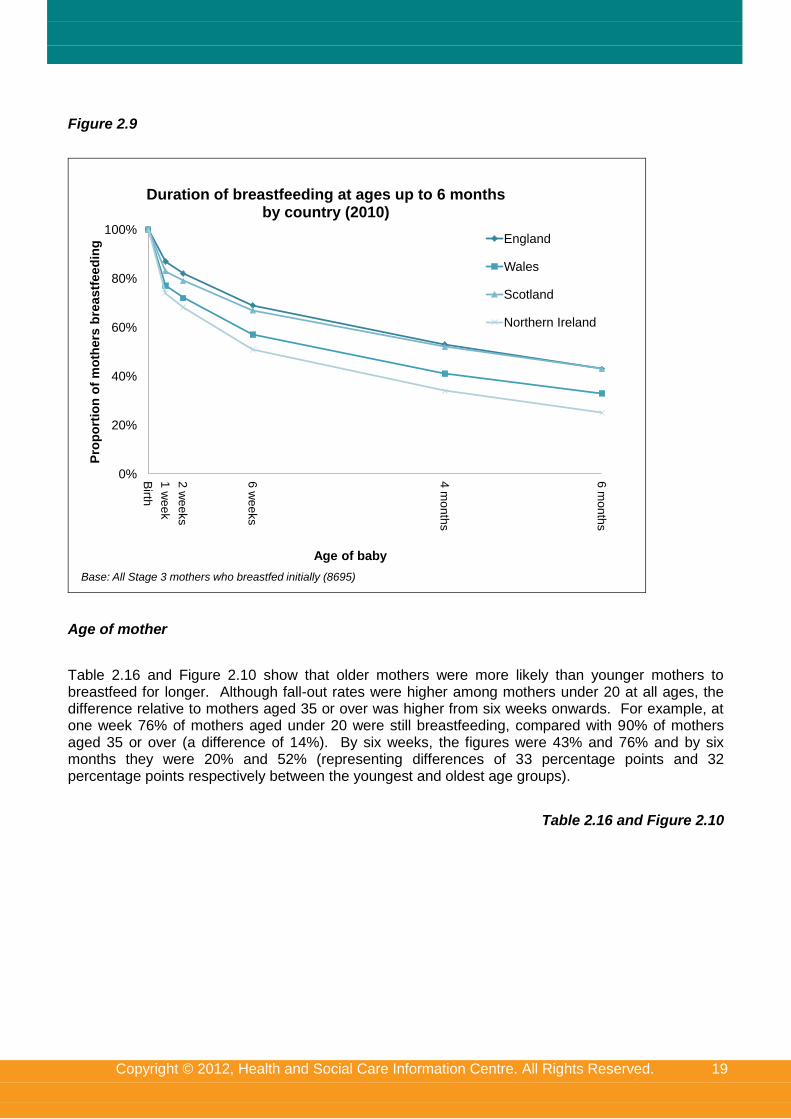
Copyright © 2012, Health and Social Care Information Centre. All Rights Reserved. 19
Figure 2.9
0%
20%
40%
60%
80%
100%
Birth
1 w
ee
k
2 w
ee
ks
6 w
ee
ks
4 m
on
ths
6 m
on
ths
Pro
po
rtio
n o
f m
oth
ers
bre
astf
eed
ing
Age of baby
Duration of breastfeeding at ages up to 6 months by country (2010)
England
Wales
Scotland
Northern Ireland
Base: All Stage 3 mothers who breastfed initially (8695)
Age of mother
Table 2.16 and Figure 2.10 show that older mothers were more likely than younger mothers to breastfeed for longer. Although fall-out rates were higher among mothers under 20 at all ages, the difference relative to mothers aged 35 or over was higher from six weeks onwards. For example, at one week 76% of mothers aged under 20 were still breastfeeding, compared with 90% of mothers aged 35 or over (a difference of 14%). By six weeks, the figures were 43% and 76% and by six months they were 20% and 52% (representing differences of 33 percentage points and 32 percentage points respectively between the youngest and oldest age groups).
Table 2.16 and Figure 2.10
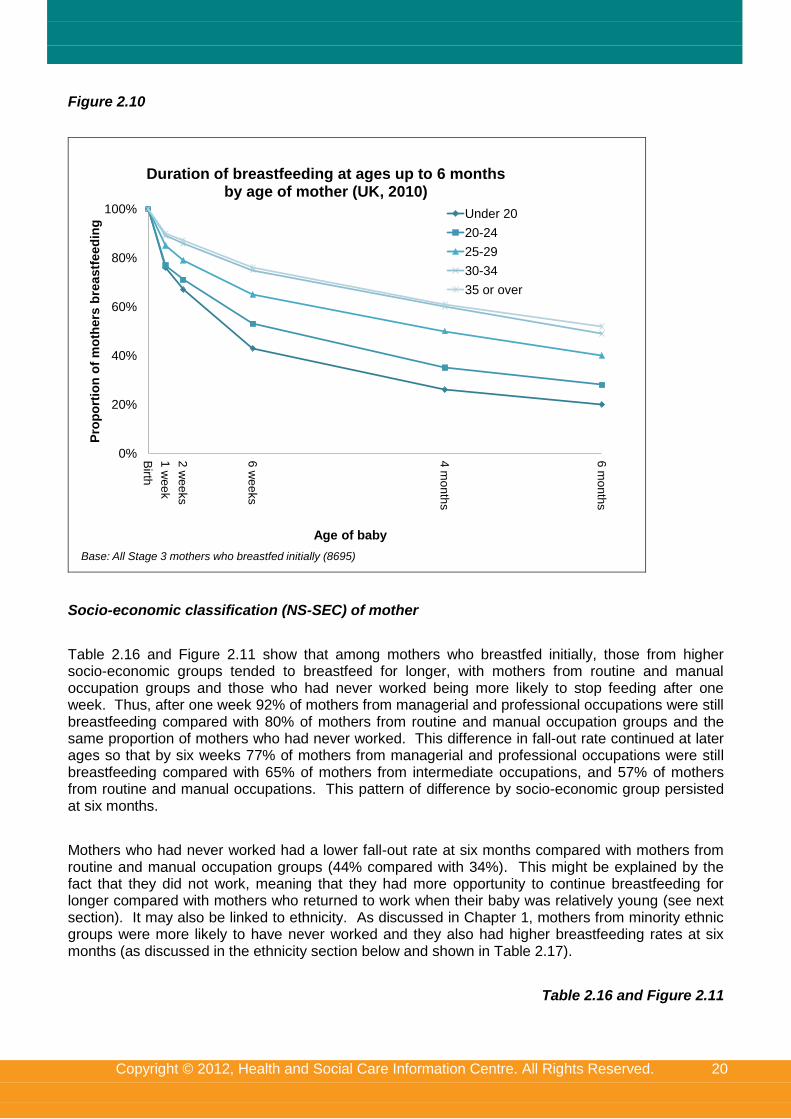
Copyright © 2012, Health and Social Care Information Centre. All Rights Reserved. 20
Figure 2.10
0%
20%
40%
60%
80%
100%
Birth
1 w
ee
k
2 w
ee
ks
6 w
ee
ks
4 m
on
ths
6 m
on
ths
Pro
po
rtio
n o
f m
oth
ers
bre
astf
eed
ing
Age of baby
Duration of breastfeeding at ages up to 6 months by age of mother (UK, 2010)
Under 20
20-24
25-29
30-34
35 or over
Base: All Stage 3 mothers who breastfed initially (8695)
Socio-economic classification (NS-SEC) of mother
Table 2.16 and Figure 2.11 show that among mothers who breastfed initially, those from higher socio-economic groups tended to breastfeed for longer, with mothers from routine and manual occupation groups and those who had never worked being more likely to stop feeding after one week. Thus, after one week 92% of mothers from managerial and professional occupations were still breastfeeding compared with 80% of mothers from routine and manual occupation groups and the same proportion of mothers who had never worked. This difference in fall-out rate continued at later ages so that by six weeks 77% of mothers from managerial and professional occupations were still breastfeeding compared with 65% of mothers from intermediate occupations, and 57% of mothers from routine and manual occupations. This pattern of difference by socio-economic group persisted at six months.
Mothers who had never worked had a lower fall-out rate at six months compared with mothers from routine and manual occupation groups (44% compared with 34%). This might be explained by the fact that they did not work, meaning that they had more opportunity to continue breastfeeding for longer compared with mothers who returned to work when their baby was relatively young (see next section). It may also be linked to ethnicity. As discussed in Chapter 1, mothers from minority ethnic groups were more likely to have never worked and they also had higher breastfeeding rates at six months (as discussed in the ethnicity section below and shown in Table 2.17).
Table 2.16 and Figure 2.11
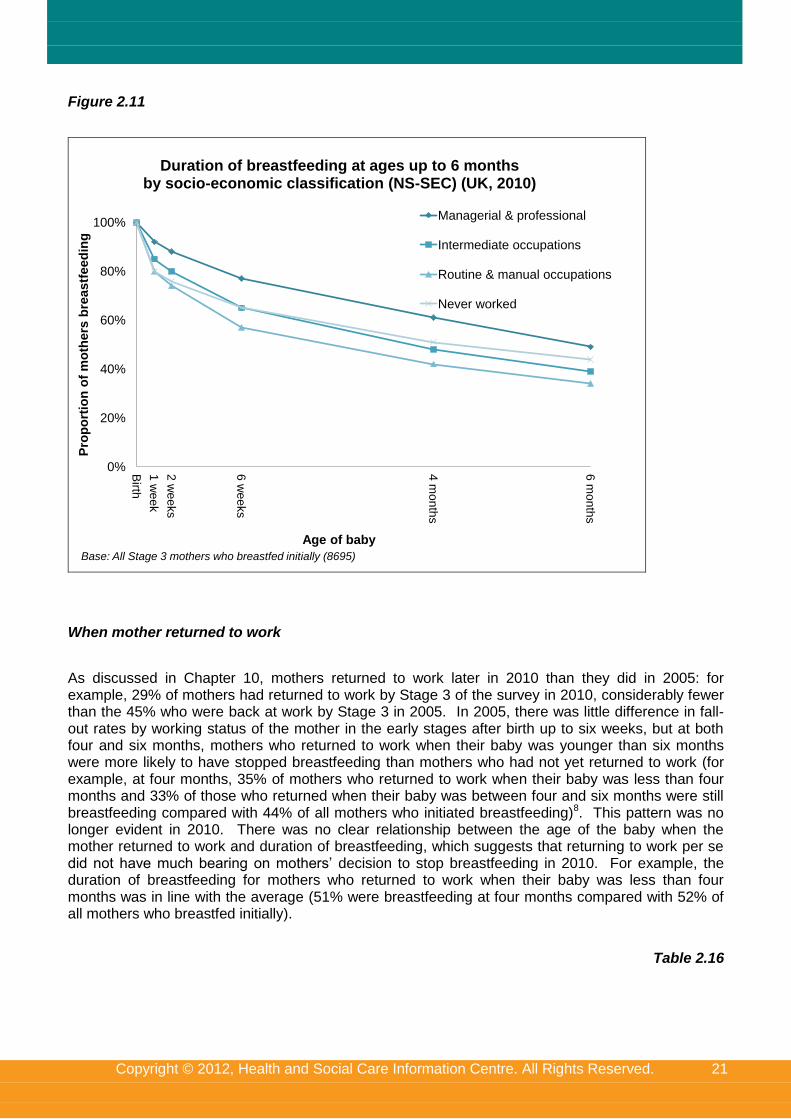
Copyright © 2012, Health and Social Care Information Centre. All Rights Reserved. 21
Figure 2.11
0%
20%
40%
60%
80%
100%
Birth
1 w
ee
k
2 w
ee
ks
6 w
ee
ks
4 m
on
ths
6 m
on
ths
Pro
po
rtio
n o
f m
oth
ers
bre
astf
eed
ing
Age of baby
Duration of breastfeeding at ages up to 6 months by socio-economic classification (NS-SEC) (UK, 2010)
Managerial & professional
Intermediate occupations
Routine & manual occupations
Never worked
Base: All Stage 3 mothers who breastfed initially (8695)
When mother returned to work
As discussed in Chapter 10, mothers returned to work later in 2010 than they did in 2005: for example, 29% of mothers had returned to work by Stage 3 of the survey in 2010, considerably fewer than the 45% who were back at work by Stage 3 in 2005. In 2005, there was little difference in fall-out rates by working status of the mother in the early stages after birth up to six weeks, but at both four and six months, mothers who returned to work when their baby was younger than six months were more likely to have stopped breastfeeding than mothers who had not yet returned to work (for example, at four months, 35% of mothers who returned to work when their baby was less than four months and 33% of those who returned when their baby was between four and six months were still breastfeeding compared with 44% of all mothers who initiated breastfeeding)8. This pattern was no longer evident in 2010. There was no clear relationship between the age of the baby when the mother returned to work and duration of breastfeeding, which suggests that returning to work per se did not have much bearing on mothers’ decision to stop breastfeeding in 2010. For example, the duration of breastfeeding for mothers who returned to work when their baby was less than four months was in line with the average (51% were breastfeeding at four months compared with 52% of all mothers who breastfed initially).
Table 2.16
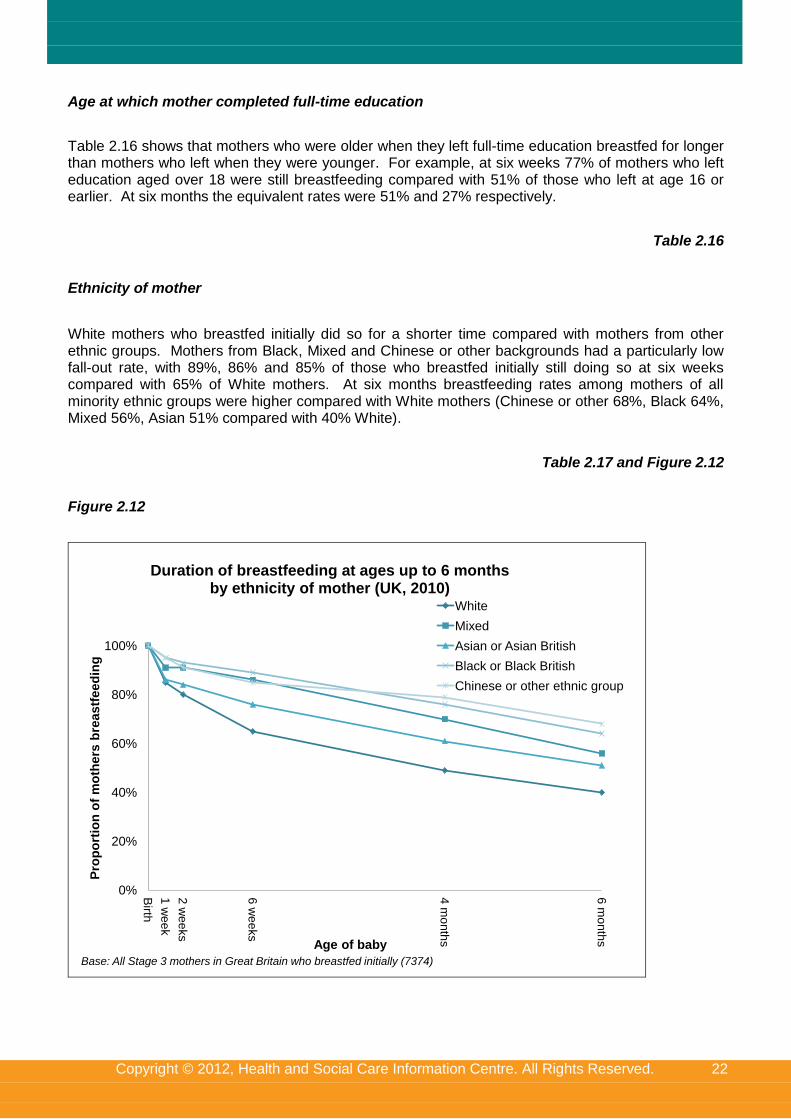
Copyright © 2012, Health and Social Care Information Centre. All Rights Reserved. 22
Age at which mother completed full-time education
Table 2.16 shows that mothers who were older when they left full-time education breastfed for longer than mothers who left when they were younger. For example, at six weeks 77% of mothers who left education aged over 18 were still breastfeeding compared with 51% of those who left at age 16 or earlier. At six months the equivalent rates were 51% and 27% respectively.
Table 2.16
Ethnicity of mother
White mothers who breastfed initially did so for a shorter time compared with mothers from other ethnic groups. Mothers from Black, Mixed and Chinese or other backgrounds had a particularly low fall-out rate, with 89%, 86% and 85% of those who breastfed initially still doing so at six weeks compared with 65% of White mothers. At six months breastfeeding rates among mothers of all minority ethnic groups were higher compared with White mothers (Chinese or other 68%, Black 64%, Mixed 56%, Asian 51% compared with 40% White).
Table 2.17 and Figure 2.12
Figure 2.12
0%
20%
40%
60%
80%
100%B
irth
1 w
ee
k
2 w
ee
ks
6 w
ee
ks
4 m
on
ths
6 m
on
ths
Pro
po
rtio
n o
f m
oth
ers
bre
astf
eed
ing
Age of baby
Duration of breastfeeding at ages up to 6 months by ethnicity of mother (UK, 2010)
White
Mixed
Asian or Asian British
Black or Black British
Chinese or other ethnic group
Base: All Stage 3 mothers in Great Britain who breastfed initially (7374)
Copyright © 2012, Health and Social Care Information Centre. All Rights Reserved. 23
Region
Table 2.18 shows that duration of breastfeeding among mothers who breastfed initially varied by region in England, with mothers in the south feeding for longer than mothers in the north. For example, at six months 29% of mothers in the North East and 37% in Yorkshire and Humberside were still breastfeeding compared with 54% of mothers in London and 46% in the South East. The proportion of mothers still breastfeeding at six months in the other regions were similar, ranging from 39% in the North West to 43% in the East of England.
Table 2.18
2.5 Exclusive breastfeeding
The definition of exclusive breastfeeding adopted by the World Health Organisation in 1991 is that an infant receives only breastmilk, and no other liquids or solids, with the exception of medicine, vitamins, or mineral supplements.
In 2000, the World Health Organisation commissioned a systematic review of the published scientific literature on the optimal duration of exclusive breastfeeding (updated 2009). As a result of this, the WHO recommended exclusive breastfeeding for the first six months. On the advice of the Scientific Advisory Committee on Nutrition, this revised guidance was adopted by the UK health departments from 2003 onwards.
The 2005 Infant Feeding Survey was the first time that an attempt was made to measure the proportion of all babies and infants who are exclusively breastfed at specific ages and the duration of exclusive feeding. Thus, for the first time, it is possible to compare prevalence and duration of exclusive breastfeeding against this benchmark.
2.5.1 Defining and measuring exclusive breastfeeding
In considering how to define and measure exclusive breastfeeding it is important to distinguish between two concepts. The first concept, and the one that is more commonly measured, is the proportion of babies or infants who are currently being exclusively breastfed. This is usually measured by asking mothers what they have fed their babies over a specific period, such as the last 24 or 48 hours. The strength of this measure is that it is unlikely to be affected by significant recall error since the period being asked about is both easily defined and in the recent past. However, the weakness of the measure is that it represents only a ‘snapshot’ and so is not a good measure of irregular feeding patterns. Thus, infants who are given formula, other liquids, or solids, on an irregular basis, would be categorised as ‘exclusive’ if they had not received them in the 24 or 48 hours before the survey.
The second way of thinking about exclusivity is to measure the proportion of babies or infants who have been exclusively breastfed since birth. This measure is better at capturing irregular feeding patterns since it seeks to measure babies and infants who have only ever been given breastmilk since birth. With this measure exclusive feeding status is ‘lost’ the first time that formula, other liquids, or solids are given to a baby. The weakness of this measure, however, is that in the absence of continuous monitoring, it relies upon mothers being able to accurately recall when they first introduced formula, other liquids, and solids. Because of this a degree of recall error is likely to be incorporated into the measure.
Copyright © 2012, Health and Social Care Information Centre. All Rights Reserved. 24
The aim of the 2010 Infant Feeding Survey was to try and measure the proportion of infants at different ages who had been exclusively breastfed since birth.
The way in which the definition of exclusive breastfeeding used in this report was measured is outlined below:
At each stage of the survey mothers were asked whether they had ever given their babies formula, other liquids, or solids since birth. If the mother said that they had given any of these they were then asked at what age they had first introduced each one;
At each stage of the survey the way in which the age data was collected was tailored to what was considered to be the most realistic way of collecting the data given the likely recall period. Thus, at Stage 1, mothers were asked when they had first introduced formula or other liquids in terms of days or weeks; at Stage 2, when their babies were around four to six months old, they were asked about it in terms of weeks; and at Stage 3, when their babies were around eight to ten months old, they were asked about it in terms of months. While it was accepted that asking respondents to provide information to the nearest week or the nearest month created a degree of imprecision in the data collected, it was felt that this had to be balanced against the ability of mothers to accurately recall these events;
Using this information three intermediate measures were then derived for each mother using a common timescale:
o Age at which formula (or other milk) was first introduced;
o Age at which any other liquids were first introduced; and
o Age at which solids were first introduced
Finally, a composite measure of exclusivity was derived by using the three intermediate measures to determine at what age exclusivity was lost by the introduction of formula, or other liquids, or solids. In deriving this measure careful attention was given to how the ‘boundary points’ were defined. For example, if a mother reported that they first introduced formula at six weeks, should they be counted as being exclusive or not exclusive at six weeks? It was decided that in such a situation the baby would be counted as being exclusively breastfed up to six weeks, but not at the six week point itself. This same principle was applied for all different ages.
It should be noted that in this chapter, formula, solids and other liquids are discussed only in relation to measuring exclusive breastfeeding. Specific information about formula, solids, and other liquids is contained in the rest of the report (Chapters 5, 8 and 9).
2.5.2 Trends in prevalence of exclusive breastfeeding by country
Prevalence of exclusive breastfeeding is defined as the proportion of all babies who are being exclusively breastfed at specific ages, meaning that they have only ever been given breastmilk up to that specific age.
Table 2.19 shows the proportion of all mothers who were exclusively breastfeeding at different ages up to six months in each country. Mothers who introduced something other than breastmilk on day 1 were defined as not feeding exclusively at birth.
Copyright © 2012, Health and Social Care Information Centre. All Rights Reserved. 25
Across the UK, 69% of mothers were exclusively breastfeeding at birth in 2010. At one week less than half of all mothers (46%) were exclusively breastfeeding, while this had fallen to around a quarter (23%) by six weeks. By six months levels of exclusive breastfeeding had decreased to one per cent.
There has been an increase in the prevalence of exclusive breastfeeding at birth (from 65% in 2005 to 69% in 2010), but there has been little change thereafter up until six weeks. However, the fall-out in later months was lower in 2010 than 2005, for example, at three months, 17% of mothers were still breastfeeding exclusively (up from 13% in 2005) and at four months, 12% were still breastfeeding exclusively (up from 7% in 2005).
The prevalence of exclusive breastfeeding at birth was 71% in England, 63% in Scotland, 57% in Wales and 52% in Northern Ireland, reflecting the incidence of breastfeeding in each country. However, while the pattern of fall-out was broadly similar across all countries, the gap between England and Scotland narrowed over time, so that by six weeks the prevalence of exclusive breastfeeding in Scotland was on a par with England (22% and 24% respectively), while it was 17%
in Wales and 13% in Northern Ireland. By six months rates were negligible in all countries.
There were distinctions by country in terms of changes since 2005. The increase in exclusive breastfeeding at birth was evident in England only (66% to 71%). However, increases in exclusive breastfeeding prevalence were apparent between two and four months in England, Scotland and Wales and were most noticeable at three and four months, in line with the national picture. In Northern Ireland, there was no change in the prevalence of exclusive breastfeeding.
Table 2.19 and Figures 2.13 and 2.14
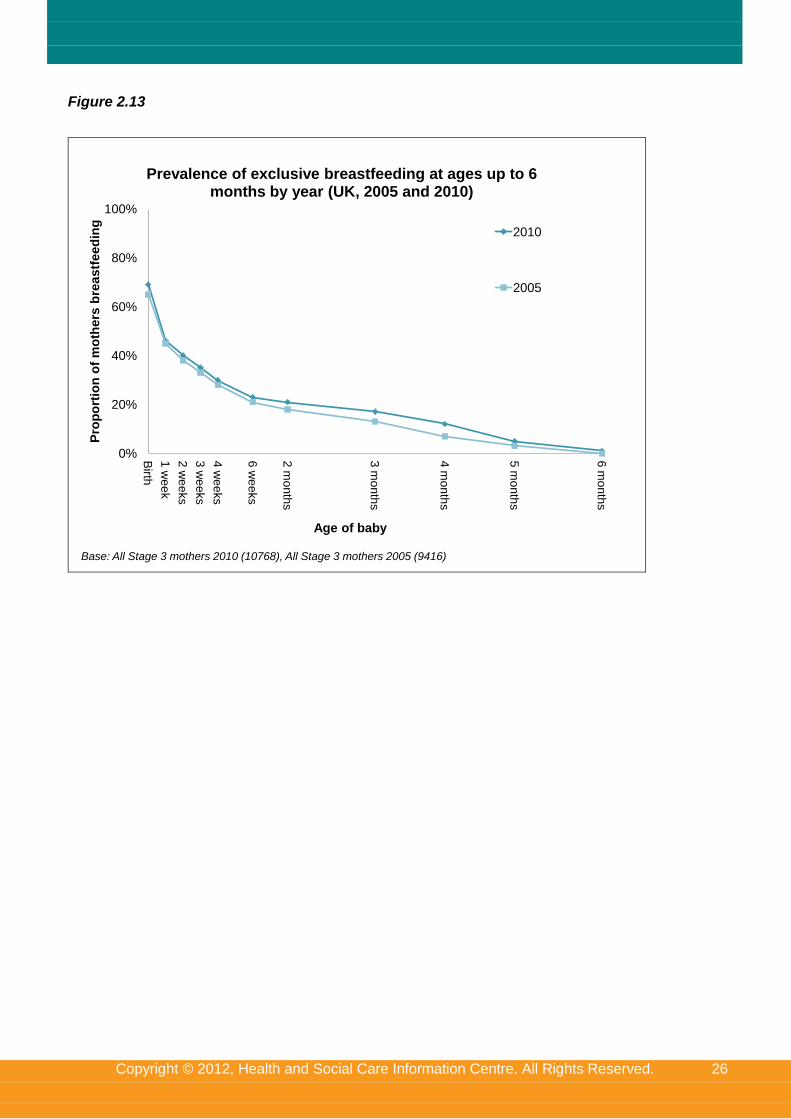
Copyright © 2012, Health and Social Care Information Centre. All Rights Reserved. 26
Figure 2.13
0%
20%
40%
60%
80%
100%
Birth
1 w
ee
k
2 w
ee
ks
3 w
ee
ks
4 w
ee
ks
6 w
ee
ks
2 m
on
ths
3 m
on
ths
4 m
on
ths
5 m
on
ths
6 m
on
ths
Pro
po
rtio
n o
f m
oth
ers
bre
astf
eed
ing
Age of baby
Prevalence of exclusive breastfeeding at ages up to 6 months by year (UK, 2005 and 2010)
2010
2005
Base: All Stage 3 mothers 2010 (10768), All Stage 3 mothers 2005 (9416)
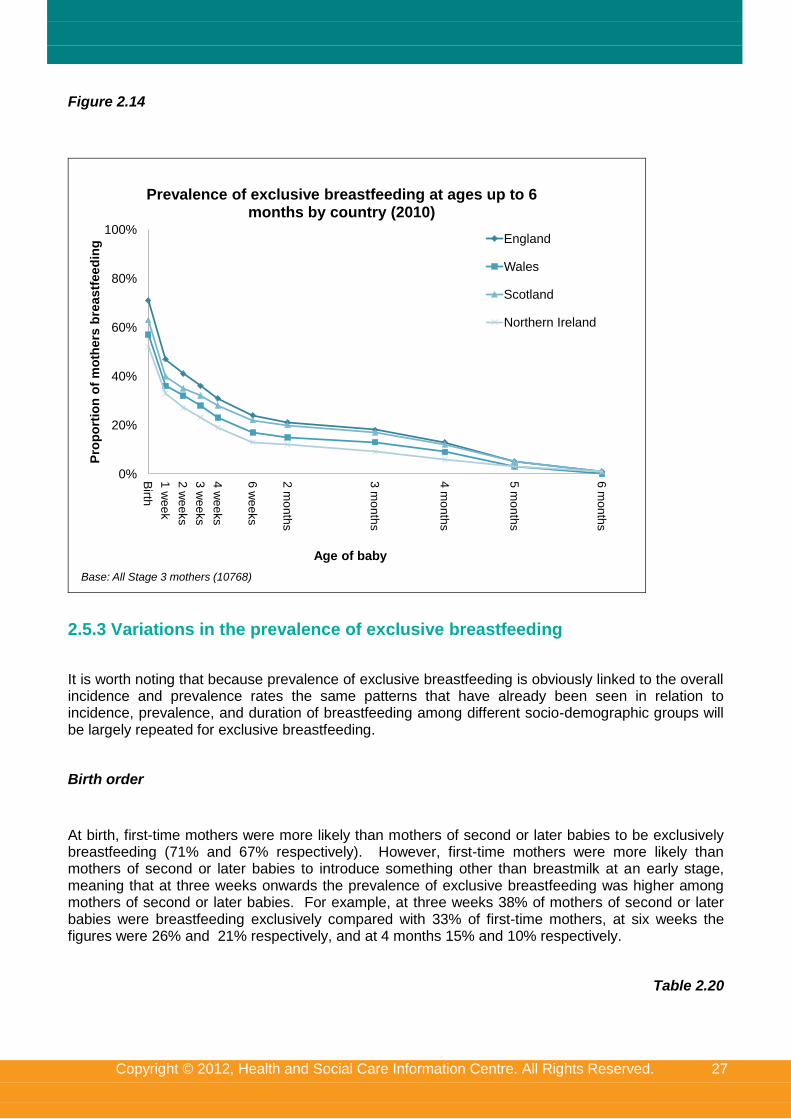
Copyright © 2012, Health and Social Care Information Centre. All Rights Reserved. 27
Figure 2.14
0%
20%
40%
60%
80%
100%
Birth
1 w
ee
k
2 w
ee
ks
3 w
ee
ks
4 w
ee
ks
6 w
ee
ks
2 m
on
ths
3 m
on
ths
4 m
on
ths
5 m
on
ths
6 m
on
ths
Pro
po
rtio
n o
f m
oth
ers
bre
astf
eed
ing
Age of baby
Prevalence of exclusive breastfeeding at ages up to 6 months by country (2010)
England
Wales
Scotland
Northern Ireland
Base: All Stage 3 mothers (10768)
2.5.3 Variations in the prevalence of exclusive breastfeeding
It is worth noting that because prevalence of exclusive breastfeeding is obviously linked to the overall incidence and prevalence rates the same patterns that have already been seen in relation to incidence, prevalence, and duration of breastfeeding among different socio-demographic groups will be largely repeated for exclusive breastfeeding.
Birth order
At birth, first-time mothers were more likely than mothers of second or later babies to be exclusively breastfeeding (71% and 67% respectively). However, first-time mothers were more likely than mothers of second or later babies to introduce something other than breastmilk at an early stage, meaning that at three weeks onwards the prevalence of exclusive breastfeeding was higher among mothers of second or later babies. For example, at three weeks 38% of mothers of second or later babies were breastfeeding exclusively compared with 33% of first-time mothers, at six weeks the figures were 26% and 21% respectively, and at 4 months 15% and 10% respectively.
Table 2.20
Copyright © 2012, Health and Social Care Information Centre. All Rights Reserved. 28
Age of mother
Older mothers were more likely than younger mothers to be breastfeeding exclusively at birth. Around three-quarters of mothers aged 35 or over (76%) and aged 30-34 (75%) were feeding exclusively at birth compared with just over half (55%) of mothers aged 20-24 and under half (46%) of mothers aged under 20. Differences in rates of exclusivity by the mother’s age were still evident at later ages of the baby but the gap narrowed over time, with 30% of mothers aged 35 or over and 12% of mothers aged under 20 breastfeeding exclusively at 6 weeks and 16% of mothers aged 35 or over and five per cent of mothers aged under 20 and aged 20-24 breastfeeding exclusively at 4 months.
Table 2.20
Socio-economic classification (NS-SEC) of mother
As with levels of overall prevalence, mothers from managerial and professional occupation groups were the most likely to be breastfeeding exclusively at birth (79%), while mothers from routine and manual occupation groups (61%) and mothers who had never worked (53%) were the least likely.
Again, these differences in levels of exclusive breastfeeding among different social groups were maintained at later ages of the baby. At four months, mothers from managerial and professional groups were over twice as likely to be breastfeeding exclusively (18%) than both mothers from routine and manual occupations (7%) and those who had never worked (8%). However, by six months the prevalence of exclusive breastfeeding was one per cent among mothers from all social groups.
Table 2.20
Deprivation
Mothers living in the most deprived areas were least likely to breastfeed exclusively at birth (60%), while mothers living in the least deprived areas were most likely to do so (77%). The gap between the mothers in the most and least deprived areas declined over time however. For example, at four weeks, 23% of mothers in the most deprived areas were breastfeeding exclusively, compared with 37% of mothers in the most affluent areas. However, by four months, 10% of mothers in the most deprived areas were breastfeeding exclusively, compared with 16% of mothers in the least deprived areas.
Table 2.20
Ethnicity of mother
As shown in Table 2.21 levels of exclusive breastfeeding at birth were higher among mothers of all minority ethnic groups compared with White mothers: for example, 68% of White mothers breastfed exclusively at birth compared with 78% of Black mothers and 75% of Asian mothers. However, at one week, levels of exclusive feeding were fairly similar with 46% of White mothers feeding exclusively compared with 48% of Asian and 49% of Black and Chinese or other ethnic groups.
Copyright © 2012, Health and Social Care Information Centre. All Rights Reserved. 29
Levels of exclusivity were highest among mothers of Mixed ethnic origin at one to four weeks, although they were similar for other ethnic groups, but thereafter there was no distinction by ethnicity.
It is interesting to note that while prevalence levels of breastfeeding generally were higher for Asian, Black and Chinese or other communities, this was not the case for exclusive prevalence after one week.
Table 2.21
Region
In England, levels of exclusivity by region broadly reflected the differences already seen in overall prevalence levels. The lowest levels of exclusive prevalence at birth were in the North East (54%) and the North West (63%) and the highest levels were in London (79%) followed by the South East (74%) and the South West, East Midlands and East of England (all at 73%). This same regional trend was evident throughout the six month period when prevalence was measured, although the gap between the highest and lowest narrowed considerably over time. For example, at four months, 15% of mothers in London and the South East who exclusively breastfed at birth were still doing so, compared with eight per cent in the North East.
Table 2.22
2.5.4 Duration of exclusive breastfeeding by country
Duration of exclusive breastfeeding refers to the length of time that mothers who breastfeed exclusively at birth continue to feed their baby only breastmilk.
Table 2.23 shows that in 2010 across the UK there was a sharp fall-out in exclusivity in the early weeks among mothers who were exclusively breastfeeding at birth. Thus, at one week 66% of mothers who fed exclusively at birth were still doing so, while by six weeks this had fallen to 34% of mothers who had fed exclusively at birth. At four months, 18% of mothers who were feeding exclusively at birth had still only ever given their baby breastmilk, but this had fallen to one per cent at six months.
Compared with 2005, the fall-out in the first week was more pronounced in 2010 (66% at one week in 2010 were still exclusively breastfeeding compared with 69% in 2005), but thereafter the duration of exclusive breastfeeding up to six weeks was similar to 2005. At later ages of the baby, exclusive breastfeeding was higher in 2010 than in 2005. This was particularly the case at three and four months (21% in 2005 were still breastfeeding at three months compared with 25% in 2010; at four months there was an even greater increase from 12% in 2005 to 18% in 2010).
The fall-out in exclusive feeding was broadly similar across all countries, although it occurred at a faster rate in Wales and Northern Ireland compared with Scotland and England. For example, 45% of mothers in Scotland and 44% of mothers in England who were breastfeeding exclusively at birth were still doing so at four weeks compared with 41% of mothers in Wales and 35% in Northern Ireland. This difference was still evident, although to a lesser extent, at four months with 19% of mothers in Scotland and 18% of mothers in England still feeding exclusively compared with 15% per cent in Wales and 12% in Northern Ireland.
Copyright © 2012, Health and Social Care Information Centre. All Rights Reserved. 30
The same pattern of duration figures being higher in England and Scotland than in Wales and Northern Ireland was also evident in 2005, though as with the overall duration of exclusive breastfeeding, the fall-out rate in each of the countries was more pronounced in 2005 than in 2010. While there was little change in the duration of exclusive breastfeeding between 2005 and 2010 in each country for the earlier time points, increases were evident later on, although when this started varied by country. The greatest increase since 2005 in the duration of exclusive breastfeeding occurred in Scotland and WaIes; there were significant increases from four weeks in Scotland and Wales. The increase was most pronounced at three and four months, for example, in Wales 15% of mothers who exclusively breastfed at birth were still doing so at four months, up from seven per cent in 2005; in Scotland 19% were doing so in 2010, up from 10% in 2005. In England, duration of exclusive breastfeeding had also increased at three and four months (25% at three months, up from 21% in 2005 and 18% at four months, up from 12% in 2005) and in Northern Ireland, this was the case at four months (12%, up from eight per cent in 2005).
Table 2.23
2.5.5 Variation in the duration of exclusive breastfeeding
Detailed analysis by subgroup is not repeated for subgroups where the findings have been discussed in the section on prevalence of exclusive breastfeeding as the patterns observed are broadly the same.
Birth order
Table 2.24 shows that among mothers who breastfed exclusively at birth the fall-out rate was higher among first-time mothers compared with mothers of second or later babies. At one week 36% of first-time mothers who were feeding exclusively at birth were no longer doing so compared with 30% of second-time or later mothers. This difference was evident at both six weeks with 38% of second-time mothers still feeding exclusively compared with 30% of first-time mothers and also at four months (22% and 14% respectively).
Table 2.24
Previous feeding experience
Although no information on exclusive breastfeeding of previous children was available it is interesting to look at the duration of exclusive breastfeeding by how mothers of second or later babies fed their previous child. Table 2.24 shows that mothers who breastfed their previous child for six weeks or more (not necessarily exclusively) breastfed exclusively for longer this time round compared with both mothers who had fed their previous child for less than six weeks and mothers who had not breastfed their previous child at all. Mothers who had not breastfed their previous child continued to breastfeed their baby exclusively for longer than those who had only breastfed for a short period previously, although from two months on there was no significant difference between the two groups.
At one week, 79% of mothers who had breastfed their previous child for six weeks or more were still exclusively feeding their current baby at one week compared with 52% of mothers who had not breastfed their previous child and 38% of those who had breastfed their previous child for less than six weeks.
Copyright © 2012, Health and Social Care Information Centre. All Rights Reserved. 31
At six weeks nearly half (45%) of all mothers who had breastfed their previous child for six weeks or more were still feeding exclusively compared with 20% of mothers who did not breastfeed their previous child and 12% of mothers who breastfed their previous child for less than six weeks.
Table 2.24
2.5.6 How exclusive breastfeeding status was lost
To try to better understand the nature of exclusive breastfeeding, it is interesting to look at how mothers who breastfed exclusively at birth lost their exclusive status. Exclusivity is considered to be lost the first time that formula or other milk, solids, or any other liquid is given to a baby. From the data it was possible to work out for each mother who breastfed exclusively at birth exactly what, apart from breastmilk, they first gave their baby. Some mothers may have given their baby both formula and liquid, for example, or some other combination around the same time. Since much of the data was collected in banded periods (e.g. weeks) it was not always possible to know which component was actually introduced first.
All mothers who were feeding exclusively at birth were divided into five categories;
Exclusive feeding status lost by the introduction of formula (or other milk);
Exclusive feeding status lost by the introduction of any other liquids, such as water or juice;
Exclusive feeding status lost by the introduction of formula and other liquids at around the
same time;
Exclusive feeding status lost by the introduction of solids; and
Exclusive feeding status lost by the introduction of solids and something else (formula and/ or
other liquids) at around the same time
Table 2.25 and Figure 2.15 show that just over three in five mothers (62%) who breastfed exclusively at birth lost their exclusive feeding status by giving their baby formula, while a further seven per cent lost it by introducing both formula and other liquids at around the same age. One in ten mothers (10%) lost their exclusive feeding status by first giving their baby some other liquid such as water or juice, while the same proportion (10%) lost their exclusive status by giving their baby solids. A further nine per cent did so by introducing both solids and either formula or some other liquid at around the same time. These findings are very similar to the 2005 survey results.
Table 2.25 and Figure 2.15
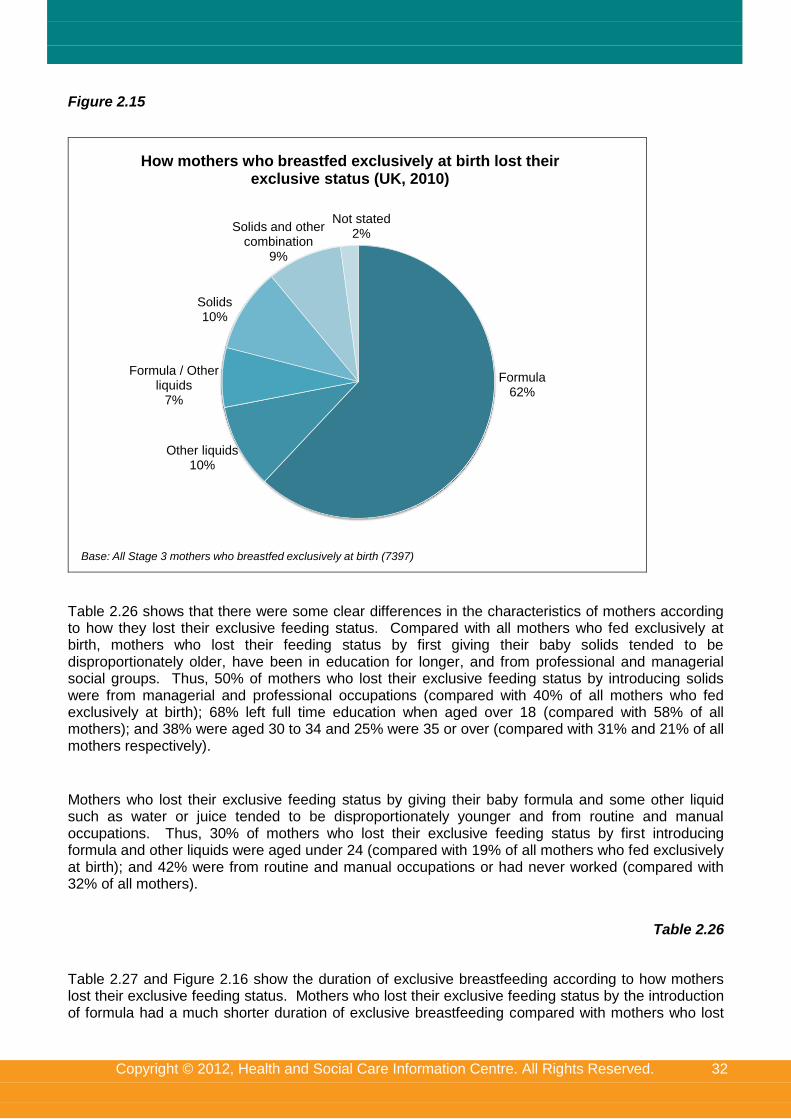
Copyright © 2012, Health and Social Care Information Centre. All Rights Reserved. 32
Figure 2.15
Formula62%
Other liquids10%
Formula / Other liquids
7%
Solids10%
Solids and other combination
9%
Not stated2%
How mothers who breastfed exclusively at birth lost their exclusive status (UK, 2010)
Base: All Stage 3 mothers who breastfed exclusively at birth (7397)
Table 2.26 shows that there were some clear differences in the characteristics of mothers according to how they lost their exclusive feeding status. Compared with all mothers who fed exclusively at birth, mothers who lost their feeding status by first giving their baby solids tended to be disproportionately older, have been in education for longer, and from professional and managerial social groups. Thus, 50% of mothers who lost their exclusive feeding status by introducing solids were from managerial and professional occupations (compared with 40% of all mothers who fed exclusively at birth); 68% left full time education when aged over 18 (compared with 58% of all mothers); and 38% were aged 30 to 34 and 25% were 35 or over (compared with 31% and 21% of all mothers respectively).
Mothers who lost their exclusive feeding status by giving their baby formula and some other liquid such as water or juice tended to be disproportionately younger and from routine and manual occupations. Thus, 30% of mothers who lost their exclusive feeding status by first introducing formula and other liquids were aged under 24 (compared with 19% of all mothers who fed exclusively at birth); and 42% were from routine and manual occupations or had never worked (compared with 32% of all mothers).
Table 2.26
Table 2.27 and Figure 2.16 show the duration of exclusive breastfeeding according to how mothers lost their exclusive feeding status. Mothers who lost their exclusive feeding status by the introduction of formula had a much shorter duration of exclusive breastfeeding compared with mothers who lost
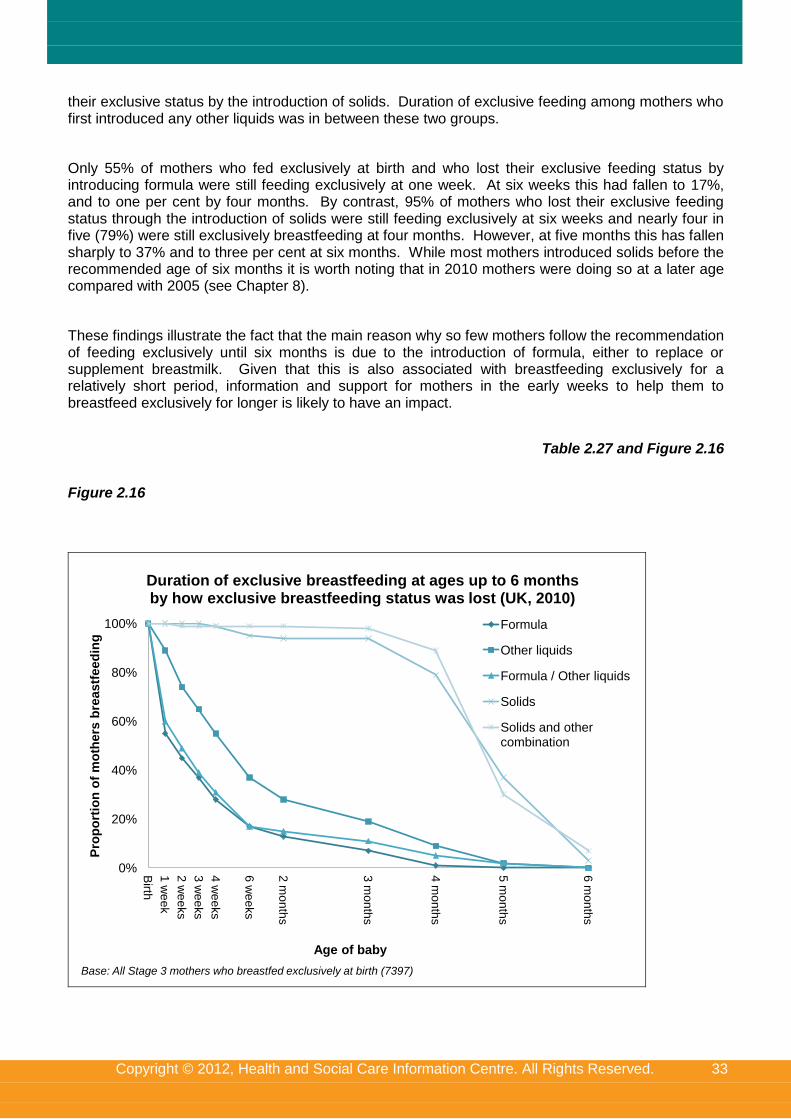
Copyright © 2012, Health and Social Care Information Centre. All Rights Reserved. 33
their exclusive status by the introduction of solids. Duration of exclusive feeding among mothers who first introduced any other liquids was in between these two groups.
Only 55% of mothers who fed exclusively at birth and who lost their exclusive feeding status by introducing formula were still feeding exclusively at one week. At six weeks this had fallen to 17%, and to one per cent by four months. By contrast, 95% of mothers who lost their exclusive feeding status through the introduction of solids were still feeding exclusively at six weeks and nearly four in five (79%) were still exclusively breastfeeding at four months. However, at five months this has fallen sharply to 37% and to three per cent at six months. While most mothers introduced solids before the recommended age of six months it is worth noting that in 2010 mothers were doing so at a later age compared with 2005 (see Chapter 8).
These findings illustrate the fact that the main reason why so few mothers follow the recommendation of feeding exclusively until six months is due to the introduction of formula, either to replace or supplement breastmilk. Given that this is also associated with breastfeeding exclusively for a relatively short period, information and support for mothers in the early weeks to help them to breastfeed exclusively for longer is likely to have an impact.
Table 2.27 and Figure 2.16
Figure 2.16
0%
20%
40%
60%
80%
100%
Birth
1 w
ee
k
2 w
ee
ks
3 w
ee
ks
4 w
ee
ks
6 w
ee
ks
2 m
on
ths
3 m
on
ths
4 m
on
ths
5 m
on
ths
6 m
on
ths
Pro
po
rtio
n o
f m
oth
ers
bre
astf
eed
ing
Age of baby
Duration of exclusive breastfeeding at ages up to 6 months by how exclusive breastfeeding status was lost (UK, 2010)
Formula
Other liquids
Formula / Other liquids
Solids
Solids and other combination
Base: All Stage 3 mothers who breastfed exclusively at birth (7397)
Copyright © 2012, Health and Social Care Information Centre. All Rights Reserved. 34
Notes and references
1 England and Wales were reported together prior to 2005.
2 Mothers who had more than two children were classified according to how they had fed their last child.
3 In the 2010 IFS Early Results report, published in June 2011, it was reported that incidence of breastfeeding increased
since 2005 in all age groups, but the difference for mothers in the 20-24 age group was not significant. The report can be found at: www.ic.nhs.uk/pubs/infantfeeding10 4 As discussed in Chapter 1, it can be assumed that the majority of the sample in Northern Ireland was White, based on the
2001 Census which showed that 99% of the population in Northern Ireland were from a White background. 5 In the 2010 IFS Early Results report (see link above at endnote 3), published in June 2011, it was reported that incidence
of breastfeeding among mothers in this group increased in all countries, however these differences were not statistically significant in Wales, Scotland and Northern Ireland. 6 From 1
st July 2006, the ten SHAs were the same as Government Office regions (GORs), other than that the South East
England GOR was split into two: South Central and South East coast. As the abolition of SHAs was anticipated at the time of the 2010 IFS (as well as because the organisation of SHAs had changed between the 2005 IFS and 2010), regional analysis is presented by GOR. 7 In the 2010 IFS Early Results report, (link above at endnote 3) a rounding error meant that the standardised figure for
Scotland (60%) was reported incorrectly in the text and table so it appeared (wrongly) that the increase in incidence in Scotland was largely due to changes in sample composition. 8 See Infant Feeding Survey 2005 report at http://www.ic.nhs.uk/pubs/ifs2005, Table 2.21
Copyright © 2012, Health and Social Care Information Centre. All Rights Reserved. 1
3. Choice of feeding methods
Key findings
When asked to think back to before they had their baby, three-quarters of mothers (75%) said they intended to breastfeed their baby in some way, an increase from seven in ten (70%) in 2005.
Mothers of second or later babies who had breastfed their previous child for six weeks or more (94%), mothers who said most of their friends only breastfed (92%) and mothers who were only breastfed themselves as infants (89%) were the most likely to intend to breastfeed (either exclusively or with formula).
Almost all mothers who intended to breastfeed actually did so, at least initially: 98% of those intending to breastfeed only and 95% of those intending to give breastmilk and formula.
Most mothers who planned to formula feed only actually did so (82%), however, nearly one in five (18%) breastfed initially. This is an increase on 2005, where about one in ten (11%) mothers who planned only to formula feed actually breastfed their baby.
Mothers who intended to breastfeed only did so for longer compared with mothers who intended to mix breast and formula feeding and those who had only intended to formula feed. For example, when babies were six months old, 50% of mothers who intended to breastfeed only were still doing so compared with 23% of mothers who intended to use mixed feeding.
Over four in five mothers said they were aware of the health benefits of breastfeeding (83%) and three-quarters (75%) were able to name a benefit spontaneously. Mothers from managerial and professional occupations (89%) and mothers aged 35 or over (84%) were most likely to be able to name a benefit.
About four in five mothers recalled receiving information during their pregnancy about the health benefits of breastfeeding (82%), with midwives being the most common source of such information (83% of those who recalled receiving information). Mothers who recalled receiving information were more likely than mothers who had not to intend to breastfeed (77% compared with 66%) and were more likely to actually initiate breastfeeding (83% compared with 73% of those who did not recall receiving information).
Nearly all mothers had attended antenatal check-ups (96%), while about two in five (38%) had attended antenatal classes. First-time mothers (64%) and mothers from managerial and professional occupations (50%) were the most likely to attend antenatal classes.
About three-quarters (76%) of all mothers had discussed feeding at their antenatal check-ups, while just less than three in ten of all mothers had discussed feeding at antenatal classes (28%).
Two in five mothers (41%) were taught how to position their baby for breastfeeding and how to attach their baby to the breast during their pregnancy.
Copyright © 2012, Health and Social Care Information Centre. All Rights Reserved. 2
This chapter explores how mothers intended to feed their baby prior to the birth. It looks at the reasons behind their feeding choice and the possible social factors that may have influenced it. It also examines the influence that health professionals and others may have had on mothers’ choice of feeding method, through information received at antenatal check-ups and classes.
3.1 Planned method of feeding
At Stage 1 of the survey, when babies were around four to ten weeks old, all mothers were asked if they had planned before the birth how they were going to feed their baby. The majority of mothers said that they had made plans, with over nine in ten (92%) across the UK being able to state their planned feeding method. Overall, three-quarters of mothers (75%) said that they planned to breastfeed in some way, an increase from seven in ten (70%) in 2005. Around three in five (61%) mothers intended only to breastfeed and a further 14% intended to breastfed and formula feed. One in twelve (8%) had not decided on their method of feeding before the birth.
Mothers in England were the most likely to plan to breastfeed (76%), and mothers in Northern Ireland were the least likely (58%). Conversely, mothers in Northern Ireland were the most likely to plan to formula feed only (31%), and mothers in England were the least likely to do so (16%).
Table 3.1
Table 3.2 shows that first time mothers were a little more likely to intend to breastfeed (76%) compared with mothers of second or later babies (73%). This pattern was more pronounced when looking at those who intended only to breastfeed with two-thirds (66%) of first time mothers stating this was their intention compared with just over half (55%) of mothers of second or later babies. First time mothers were also more likely than mothers of second or later babies to say they had not made up their mind before the birth how they were going to feed their baby (10% and 5% respectively).
Given the association between mothers’ experiences of feeding a previous baby and how they fed their current baby, it is not surprising to see that there was also a strong association between the mother’s previous feeding experience and her intended feeding behaviour this time around. Almost all mothers of second or later babies (94%) who had breastfed their previous child for six weeks or more said they had intended to breastfeed this time round, with most saying they planned to breastfeed only (73%). Two-thirds (67%) of mothers of second or later babies who had breastfed their previous child for less than six weeks said they had also intended to breastfeed this time round, although 23% said they intended to use infant formula only. Mothers who did not breastfeed their previous child at all were least likely to have intended to breastfeed this time round: 29% of these mothers intended to breastfeed compared with 62% who intended to use infant formula only. It is interesting to note that a higher proportion of mothers switched from previous exclusive formula use to intending to breastfeed (29%) than the proportion of mothers who breastfed previously for more than six weeks intending to use formula only this time round (3%).
Table 3.2
The vast majority of mothers who said they had decided before the birth how they planned to feed their baby carried out their stated intentions, at least in terms of what they did initially. However, while this association might be expected it must also be treated with caution. The fact that mothers were asked retrospectively about their feeding intentions may mean that they could have forgotten or rationalised their intentions, in the light of their actual experience.
Copyright © 2012, Health and Social Care Information Centre. All Rights Reserved. 3
Mothers who intended to breastfeed were more likely to have carried out their intentions than mothers who intended only to use formula. Nearly all (98%) mothers who intended only to breastfeed initiated breastfeeding and, of mothers who planned to give breastmilk and formula, 95% breastfed initially. Most mothers who planned only to formula feed did actually do so (82%), however, nearly one in five (18%) breastfed initially. Where mothers had not decided how to feed their baby before the birth, their actual feeding behaviour was split, with 64% breastfeeding initially and 36% using only infant formula.
While the actual feeding behaviour of mothers who intended only to breastfeed or to give breastmilk and formula has remained unchanged since 2005, breastfeeding initiation rates have increased among mothers who intended only to formula feed or had not decided how to feed their baby before the birth. The proportion of mothers initiating breastfeeding who had planned only to formula feed increased from 11% in 2005 to 18% in 2010, while for mothers who had not decided how to feed their baby before the birth, it increased from 57% in 2005 to 64% in 2010. This may be linked to the increase in the proportion of mothers having skin-to-skin contact with their baby within an hour of the birth, which may make mothers more likely to try breastfeeding (see Chapter 1).
Table 3.3
While the association between stated intentions and actual feeding behaviour was strong, it is also useful to examine whether feeding intentions were related to the duration of breastfeeding and exclusive breastfeeding among mothers who initiated breastfeeding.
Table 3.4 shows that mothers who said they intended to breastfeed only did so for longer compared with mothers who said they intended to adopt a mixed feeding approach (giving breastmilk and formula). Thus, at one week 90% of mothers who intended to breastfeed only were still doing so compared with 81% of mothers who intended to use a mixed feeding approach. This difference continued through until nine months. For example, at six months 50% of mothers who intended to breastfeed only were still doing so compared with 23% of mothers who intended to use mixed feeding.
Mothers who said they had not intended to breastfeed but who did so initially, breastfed for the shortest time. Thus, of these mothers under half (44%) were still breastfeeding at one week, and this had fallen to six per cent at six months.
Table 3.4
Table 3.5 shows a similar pattern when looking at the duration of exclusive breastfeeding. Mothers who had intended only to breastfeed were likely to feed exclusively for longer than mothers who intended to use mixed feeding. Thus, 71% of mothers who had intended to breastfeed only and who fed exclusively at birth were still exclusively breastfeeding at one week compared with 53% of mothers who had intended to use mixed feeding. At six weeks the proportions of mothers who were still exclusively breastfeeding were 40% and 11% respectively.
Mothers who intended to use infant formula only but who actually breastfed exclusively at birth tended not to feed exclusively for long. Thus, at one week only 37% of these mothers were still feeding exclusively and this had dropped to seven per cent at six weeks.
Table 3.5
Copyright © 2012, Health and Social Care Information Centre. All Rights Reserved. 4
3.2 Reason for choice of feeding method
At Stage 1, all mothers who said they knew before the birth how they were going to feed their baby were asked why they had planned to feed their baby in this way. Answers were collected in open format and later coded into categories. More than one reason could be provided.
Table 3.6 shows that by far the most common reason behind the intention to breastfeed only was an understanding that this was best for the baby’s health. This reason was given by 83% of all mothers who planned only to breastfeed, with first-time mothers being more likely than mothers of second or later babies to cite this as a reason (88% and 76% respectively). Other common reasons given for planning to breastfeed included convenience (22%), because of the health benefits for the mother (17%), because of the closer bond it helped to create between mother and baby (16%) and because it was cheaper than using infant formula (15%). Just over quarter of mothers of second or later babies stated convenience as a reason (26%), compared with 19% of first-time mothers.
Mothers of second or later babies who had breastfed previous children tended to give fuller responses than those who had not breastfed and were more likely to mention a number of reasons for planning to breastfeed. The difference was most marked for convenience, with mothers who had experienced breastfeeding a previous child being much more likely to mention this than those who had not (28% compared with 8%). Older mothers were also more likely to mention convenience than younger mothers (28% of those aged 35 or over compared with 13% of mothers aged 20-24 and under 20). These two findings may be linked, as older mothers are more likely to have had previous children.
Table 3.6
Table 3.7 shows that the most common reasons given by mothers who planned before the birth to use infant formula only were that they did not like the idea of breastfeeding (20%), convenience or due to their lifestyle (19%) and because other people could feed the baby (17%).
Previous feeding behaviour was a common reason cited by mothers of second or later babies who intended to use formula only this time round. Over a third (35%) said this was how they had fed their previous children, while 18% said they had tried breastfeeding in the past and had not liked it or were put off by the experience of others.
The youngest mothers (those aged under 20) were more likely to say they did not like the idea of breastfeeding (31%) and that they would be embarrassed to breastfeed (20%), which may reflect the fact that young mothers may feel more self-conscious about breastfeeding. These concerns were also more likely to be expressed by first-time mothers (30% and 16% respectively). First time mothers were also more likely to plan to use infant formula only because other people could feed the baby (21%).
Table 3.7
Copyright © 2012, Health and Social Care Information Centre. All Rights Reserved. 5
3.3 Awareness of the health outcomes related to infant feeding
A range of health outcomes are associated with how infants are fed. In order to match the language in which these are normally discussed with mothers, respondents were asked whether they were aware of the health benefits of breastfeeding.
As seen in the previous section, a key reason mothers stated for wanting to breastfeed was the health benefits associated with doing so. At Stage 1 of the survey all mothers, irrespective of their feeding intentions were asked whether they were aware of the health benefits of breastfeeding and if so, what the benefits were for the baby and for the mother as a result of doing so.
Overall, 83% of mothers across the UK said that they were aware of the health benefits of breastfeeding; three-quarters (75%) were able to name at least one of these specific benefits spontaneously in 2010. The proportion aware of the health benefits was very similar to 2005 (84% in 2005), although the proportion able to name a benefit was higher in 2005 (80%).
Mothers in Scotland were most likely to be aware of the health benefits of breastfeeding (86% compared with 83% overall), and able to name a benefit (79% compared with 75% overall). This fits in with a finding reported later in the chapter that mothers in Scotland were the most likely to recall receiving information about the health benefits of breastfeeding, although the fact that a similarly high proportion recalled receiving information in Northern Ireland did not also translate into greater awareness (83% aware of health benefits and 72% aware and able to name a health benefit in Northern Ireland). The proportion of mothers aware of health benefits and able to name a health benefit also dropped in Northern Ireland, relative to 2005 (88% and 83% in 2005), although it remained broadly consistent in the other UK nations.
Table 3.8
Socio-demographic characteristics also had an effect on awareness of the health benefits of breastfeeding. Mothers in managerial or professional occupations had the highest levels of knowledge (89% aware and able to name a benefit), while those who had never worked had the lowest levels (44% aware and able to name a benefit).
In addition, older mothers were more likely than younger ones to be aware of the health benefits and be able to spontaneously give a health benefit of breastfeeding. For example, over four in five (84%) mothers aged 35 or over were aware and able to name a health benefit, compared to three in five mothers under 20 years of age (60%).
In terms of ethnicity, White mothers were more likely to say that they were aware of the health benefits of breastfeeding than any other group. Seventy-eight per cent of White mothers were able to name a heath benefit of breastfeeding, compared with 64% of mothers from Chinese or other ethnic minority groups, 63% of Black mothers and 59% of Asian mothers. Mothers from a mixed race background were in line with the average.
Mothers who said they had intended only to breastfeed were more likely to be aware of the health benefits of breastfeeding (82% aware and able to name a benefit) than those who said they were planning to use infant formula only (56% aware and able to name a benefit). This pattern continued through to actual feeding behaviour where four in five (80%) of those who breastfed initially were aware and able to name a benefit compared with over half (55%) of those who never breastfed.
Copyright © 2012, Health and Social Care Information Centre. All Rights Reserved. 6
There was no difference in the level of awareness of the health benefits of breastfeeding between first-time and second-time mothers. However, among mothers of second or later babies, those who had breastfed their previous child were more likely to be aware of the health benefits of breastfeeding, compared with those who had not. For example, 84% of mothers who had breastfed their previous child for 6 weeks or more were able to name a benefit, compared with 56% of those who had not breastfed their previous child.
Table 3.9
When mothers who said they were aware of the health benefits of breastfeeding were asked to specify what they thought the health benefits were, the most commonly mentioned health benefit for the baby was that breastfeeding helps to build the baby’s immunity resulting from antibodies passed on from the mother. This was mentioned by over two-thirds (69%) of mothers who were aware of the health benefits (and were able to name at least one). Other health benefits frequently cited by mothers who were aware of the health benefits were that:
breastfeeding reduces the likelihood of asthma, eczema and other allergies (25%)
breastmilk is more nutritious and has more vitamins than infant formula (24%)
the baby has less colic or wind and fewer stomach and digestive problems (13%)
it helps to reduce the chance of childhood obesity (12%)
The most commonly cited health benefit of breastfeeding for the mother was that it helps the uterus contract after the birth and/or helps the mother lose weight (mentioned by 67% of mothers who knew about the health benefits of breastfeeding). In addition, reducing the risk of cancer was also cited as a health benefit of breastfeeding to the mother with 38% citing that it reduces the risk of breast or ovarian cancer and a further 22% saying that it reduces the risk of cancer generally.
Additionally, one in five (20%) mothers mentioned the role of helping the bonding process with the baby as a health benefit for both the mother and the baby.
Regarding health benefits for the baby, there were some variations by country in terms of the health benefits of breastfeeding mentioned, which may reflect the different sources of information provided to mothers in each of the UK nations. Mothers in Scotland (33%) and Northern Ireland (30%) were more likely than mothers in England (25%) and Wales (22%) to mention the role of breastfeeding in protecting against allergies such as asthma and eczema. Conversely, mothers in Scotland were least likely to state that breastmilk is more nutritious / has more vitamins (16% compared to 24% overall) and mothers in Northern Ireland were least likely to mention that it helps develop the immune system (64% compared to 69% overall).
In terms of health benefits for the mother, mothers in Scotland and Northern Ireland were more likely to mention the reduced risk of cancer (32% and 27% respectively, compared to 21% in England and 22% in Wales) and osteoporosis (14% and 12% respectively compared with eight per cent in England and nine per cent in Wales). Conversely, mothers in Scotland were least likely to mention that breastfeeding helped the uterus to contract and helped the mother lose weight (54% compared with 67% overall). Regarding health benefits for the mother and baby, mothers in Scotland were also least likely to mention that breastfeeding helps bonding with the baby (15% compared with 20% overall).
Table 3.10
Copyright © 2012, Health and Social Care Information Centre. All Rights Reserved. 7
3.4 Sources of information on the health outcomes related to infant feeding
At Stage 1 all mothers were asked if they had received any information during their pregnancy about the health outcomes related to infant feeding (again, to match the language in which these are normally discussed with mothers, the term ‘health benefits of breastfeeding’ was used). Just over four in five mothers (82%) across the UK recalled receiving information about the health benefits of breastfeeding, although this was higher in Scotland (88%) and Northern Ireland (87%) than in Wales (82%) or England (81%).
As might be expected, first-time mothers were more likely to recall being given information about the health benefits of breastfeeding (87% compared with 77% of mothers of second or later babies). However, as discussed in section 3.3, mothers of second or later babies were just as likely to be aware of the health benefits of breastfeeding as first-time mothers, as they are likely to have received information about this in an earlier pregnancy.
The patterns by age, occupational group and ethnicity discussed in section 3.3 were reflected in the proportions recalling receiving information about the health benefits of breastfeeding, however they were much less marked. This indicates that not recalling receiving information accounts to some extent for lack of awareness and knowledge of the health benefits of breastfeeding, but other factors are also involved. For example, over four in five (85%) of those in managerial and professional occupations recalled receiving this information, compared with 71% of those who had never worked. Mothers aged under 20 (73%), Chinese (74%) and Asian (77%) mothers were less likely than average (82%) to recall receiving this information.
Table 3.11
Table 3.12 shows that mothers who recalled receiving information on the benefits of breastfeeding during pregnancy were more likely to say that they were aware of the health benefits of breastfeeding (87%), compared to mothers who did not recall receiving any information (64%). Mothers who recalled receiving information were also more likely to be able to name a health benefit spontaneously, with 79% being able to do so, compared with 57% of mothers who did not recall receiving information.
Information provided during pregnancy also appears to be related to feeding intentions and behaviour. Mothers who recalled receiving information on the health benefits of breastfeeding were more likely to have planned to breastfeed (77%) than those who did not recall receiving information (66%). They were also more likely to have actually breastfed initially compared with those who did not recall receiving information (83% and 73% respectively).
Table 3.12
Mothers had recalled receiving information from a variety of sources. Midwives were the most common source of information (83%), although this was lower in England (82%) than the other UK nations (90% for Scotland and Northern Ireland, 88% for Wales). Other common sources of information about the health benefits of breastfeeding included books, leaflets and magazines (38%), health visitors (18%) and the internet (13%).
Table 3.13
Copyright © 2012, Health and Social Care Information Centre. All Rights Reserved. 8
3.5 Factors associated with planned feeding method
As discussed earlier, there is a very strong association between stated feeding intentions before the birth and actual feeding behaviour, meaning that the relationship seen in Chapter 2 between feeding behaviour and socio-demographic characteristics is expected to be repeated for feeding intentions in this chapter, with older mothers, those from managerial and professional occupations, and those who left education later being the most likely to say they had intended to breastfeed.
However, there are also other social and cultural factors that may be important in influencing a woman’s choice of feeding. This section looks at the relationship between planned feeding method and how the mother herself was fed and the influence of her peers. In examining the association between a woman’s feeding intentions and those of her peers, it should be borne in mind that the socio-demographics of any peers are likely to be the same as the woman herself in terms of socio-economic group, age and so on.
Table 3.14 shows that of mothers who were breastfed only as babies, 89% were planning to breastfeed themselves (either exclusively or with formula), compared with 60% of mothers who were formula fed only as babies (and 68% of mothers who did not know how they were fed). Likewise, mothers who were formula fed only as babies were more likely to say that they were planning to use infant formula only (30%) compared with mothers who were only breastfed as babies (6%). Nevertheless, the fact that 60% of mothers that were only fed with infant formula as a baby intended to breastfeed themselves (either exclusively or with formula), demonstrates that while how mothers themselves were fed as babies is an important factor, this is not an essential pre-requisite for breastfeeding.
Mothers were also asked if they had known other mothers with young babies before they had their baby, and if so, how these mothers had fed their babies. Nearly nine in ten (88%) mothers across the UK had known other mothers with young babies before they had their baby. Of these, virtually all mothers (98%) knew the feeding method that was used by the other mothers. (Data not shown).
Table 3.14 also shows that nine in ten mothers (92%) who said most of their friends had only breastfed their babies also intended to breastfeed their own baby (either exclusively or with formula). For mothers where most of their peers had only formula fed, the intention to breastfeed dropped again to three in five (60%). However, as with how the mother was fed herself, peer influence was not the only influencing factor, as the majority of these mothers still intended to breastfeed.
Among women who said that they had not known other mothers, and therefore might be expected not to have been influenced by their peers, three-quarters (75%) planned to breastfeed, which was in line with the overall proportion (75%).
Table 3.14
Copyright © 2012, Health and Social Care Information Centre. All Rights Reserved. 9
3.6 Antenatal care and feeding information received during pregnancy
At Stage 1 of the survey all mothers were asked about the antenatal care they received. Mothers who had attended antenatal check-ups or classes were also asked whether feeding had been discussed with them. This section looks initially at the antenatal care received by mothers and goes on to examine the information on feeding they received at check-ups and classes during their pregnancy.
3.6.1 Antenatal care received
Almost all mothers across the UK (96%) had attended antenatal check-ups during their pregnancy and this was broadly consistent across countries. Nearly two in five (38%) attended antenatal classes during their pregnancy. Mothers in Scotland were the most likely to have done so (44%), whilst mothers in Wales were the least likely (31%).
Whether or not the mother was a first time mother had no relationship with whether antenatal check-ups were attended, but this did have an effect on whether antenatal classes were attended. Nearly two-thirds (64%) of first time mothers attended these classes whereas around one in ten (11%) mothers of second or later babies did so. Many of the mothers of second or later babies may have attended classes during their first pregnancy and not felt the need to attend them again.
In addition, attendance of antenatal classes was strongly associated with the socio-economic characteristics of the mother, with attendance at antenatal check-ups being influenced to a lesser extent. Half (50%) of mothers in managerial and professional occupations attended antenatal classes, compared with nearly three in ten (29%) mothers in routine and manual occupations and 17% of those who had never worked. Mothers who had never worked were also less likely to attend antenatal check-ups (88%).
Both attendance at antenatal check-ups and antenatal classes were influenced by the mother’s ethnicity. White mothers were the most likely to attend check-ups (97%) and classes (40%), whilst Asian mothers were the least likely to attend either (89% and 25% respectively). This maybe inter-related with findings for occupational group, for example, Asian mothers were the most likely to have never worked (see Chapter 1 for further discussion on this).
Table 3.15
The most common location stated for antenatal classes was in a hospital, birth centre or midwifery led unit, which was mentioned by half of mothers who attended an antenatal class across the UK (51%). This was followed by a quarter (25%) of mothers who stated attending antenatal classes in a Children’s Centre and nearly a fifth (19%) who stated attending at a clinic, doctor’s surgery or health centre.
There were variations in locations for antenatal classes by country, reflecting how these classes are delivered across the four UK nations. For example, mothers in Northern Ireland and Wales were more likely to attend classes in a hospital, birth centre or midwifery led unit (76% and 75% respectively), mothers in Scotland were more likely to attend classes at a clinic or doctor’s surgery (41%) and mothers in England were more likely to attend classes at a Children’s Centre (29%).
Copyright © 2012, Health and Social Care Information Centre. All Rights Reserved. 10
Additionally, attendance at classes delivered by a voluntary or charitable organisation was more common in England (17%).
Table 3.16
3.6.2 Information on feeding received during antenatal care
Mothers were asked whether feeding was discussed at any antenatal check-ups or classes they attended during this pregnancy. All mothers were also asked if they had been taught positioning and attachment during this pregnancy. Table 3.17 shows that across the UK, 84% of mothers said that feeding had been discussed at an antenatal check-up or class or that they had been taught positioning and attachment. Just over three-quarters of mothers (76%) had discussed feeding at an antenatal check up, while 28% of mothers discussed feeding in an antenatal class. (The teaching of positioning and attachment is discussed later in this section).
Overall, mothers in Scotland and Northern Ireland were more likely (84% and 85% respectively) to discuss feeding at check-ups than mothers in England and Wales (75% and 78% respectively). Scottish mothers were the most likely to have attended classes where feeding was discussed (33%) and Welsh mothers were the least likely to have done so (22%). First time mothers were more likely than mothers of second or later babies to discuss feeding at antenatal check-ups or classes (88% and 80% respectively). This was primarily due to the large difference in attendance of classes including talks or discussions about feeding babies, where nearly half (48%) of first time mothers discussed feeding, compared with six per cent of mothers of second or later babies. Again, this reflects their relative propensity to attend these classes. The proportion of first time and second or later mothers discussing feeding at antenatal check-ups was much more in line with each other (77% and 75% respectively).
Mothers in managerial and professional occupations were also more likely to attend an antenatal class where feeding was discussed (39%) compared with those who had never worked (10%).
Table 3.17 also shows that those intending to formula feed were more likely to discuss feeding at an antenatal check-up than those intending to breastfeed (81% and 75% respectively), although there was no variation in attendance of antenatal check-ups by feeding intention (see Table 3.15). It may be that those intending to formula feed had a more extended discussion about feeding at the check-up, where the health professional sought to understand why they wanted to do this and gave them information about why they may want to consider breastfeeding. Mothers may have been more likely to recall it for this reason. Conversely, those intending to breastfeed were more likely to attend antenatal classes, including those where feeding was discussed (43% and 32%) than those who intended to formula feed only (18% and 10% respectively) – see Table 3.15 as well as Table 3.17. Although this may suggest that attendance at antenatal classes has a positive impact on mothers’ likelihood to intend to breastfeed, it should also be borne in mind that the demographic profile of those attending antenatal classes and those intending to breastfeed and actually initiating breastfeeding are similar. In particular, mothers in managerial and professional occupations were more likely to attend antenatal classes, intend to breastfeed and carry out these intentions (see Chapter 2 for information on the demographic profile of those who initiate breastfeeding).
Two in five mothers (41%) across the UK were taught how to position their baby for breastfeeding and how to attach their baby to the breast during pregnancy. Mothers were more likely to be taught this in England and Scotland (42% and 41% respectively) than in Wales or Northern Ireland (36% and 35% respectively). In a similar pattern to the discussion of feeding at classes, a higher proportion of first time mothers were taught positioning of the baby and how to attach to the breast (58%) compared with mothers of second or later babies (24%).
Copyright © 2012, Health and Social Care Information Centre. All Rights Reserved. 11
Those who were taught positioning and attachment were also more likely to intend to breastfeed than formula feed (48% compared with 16%). However, it is hard to say whether this influenced their intention to breastfeed, or whether they attended a session on this because a prior intention to breastfeed meant that it seemed relevant to them.
Table 3.17
Copyright © 2012, Health and Social Care Information Centre. All Rights Reserved. 1
4. Birth, post-natal care and the early weeks
Key findings
Skin-to-skin contact soon after birth is known to help mothers to establish a first successful breastfeed. The majority of mothers (81%) had skin-to-skin contact with their baby within an hour of the birth, rising to 88% within 24 hours. This was a significant increase since 2005 (when it was 72% within an hour and 81% within 24 hours). Breastfeeding initiation was indeed much higher for babies exposed to skin-to-skin contact (84% for those babies within an hour of contact and those who had contact between one and twelve hours, compared with 61% with no such contact).
Mothers of the most premature babies (born when mothers were less than 32 weeks pregnant) were more likely to initiate breastfeeding (92%), although there was no difference in breastfeeding initiation between full term and all babies born prematurely.
Babies starting life in special care were more likely to be given breastmilk initially (85%). Babies spending long periods of time in special care after the birth were more likely than average to be breastfed at one and two weeks (for example, 78% of those spending two to three days and 77% of those spending four or more days were being breastfed at one week, compared with 70% of all mothers).
There was a relationship between how mothers were fed themselves as infants and how their peers fed their babies with how long mothers breastfed their own children. Breastfeeding mothers who were themselves entirely formula fed were more likely to stop breastfeeding in the first two weeks (27%) than mothers who were only breastfed themselves (9%). For breastfeeding mothers where most of their friends only formula fed their babies, these mothers were more likely to stop breastfeeding within two weeks (26%) than mothers where most of their friends breastfed only (6%).
Just over three in ten breastfed babies had received additional feeds in the form of formula, water or glucose while in hospital (31%). This practice was particularly associated with those starting life in special care (73%), prematurity (67%) and receiving phototherapy for jaundice (63%). In about 14% of cases, additional feeds had been given on advice and in 10% of cases, it was because the mother wanted to. The remaining 7% said that neither of these applied.
Provision of formula or additional drinks was associated with an increased likelihood of stopping breastfeeding in the early weeks, particularly for those who wanted to do so, as opposed to doing so on advice. By the end of the first week, 42% of those who wanted to give additional feeds and 21% of those advised to do so had stopped breastfeeding, compared with 10% of mothers who exclusively breastfed in hospital.
Nearly three-quarters of mothers who breastfed initially put their baby to the breast within the first hour (74%).
Most babies born in a hospital, birth centre or unit who were breastfed initially stayed with their mother at all times (89%). This is an increase since 2005 (84%).
Nearly seven in ten mothers breastfeeding in the hospital, birth centre or unit (69%) had been shown how to put their baby to the breast in the first few days (84% of first-time mothers and 50% of mothers of second or later babies).
Just under half of mothers breastfeeding in the hospital, birth centre or unit (48%) were informed about how to recognise that their baby was getting enough milk and nearly two in five (37%) felt they were confident enough to recognise whether or not their baby was getting enough milk.
Around three in ten mothers had experienced some kind of feeding problem either in the hospital, birth centre or unit (29%) or in the early weeks after leaving (30%). The highest levels of problems were experienced by mothers who used a combination of breastmilk and formula (52% in hospital, 42% after leaving).
Copyright © 2012, Health and Social Care Information Centre. All Rights Reserved. 2
Over four in five breastfeeding mothers who experienced problems were offered help or support (84% in the hospital, birth centre or unit, 82% after leaving). Those who did not receive help or support for these problems were more likely to have stopped breastfeeding within the first two weeks than those who did receive such help or support (27% compared with 15% after leaving the hospital, birth centre or unit).
Nearly seven in ten mothers (69%) had been given the contact details of a voluntary organisation or community group which helps new mothers with infant feeding.
Nearly two-thirds of mothers (64%) were aware of the National Breastfeeding Helpline, with four per cent saying they had used it in the UK.
Copyright © 2012, Health and Social Care Information Centre. All Rights Reserved. 3
This chapter examines factors related to the birth and to care provided to mothers in the hospital, birth centre or unit. There is a particular focus on how the gestational age of the baby at birth and events during and immediately after the birth may affect feeding, and more specifically breastfeeding, in the first few weeks. This chapter also covers problems with breastfeeding in the hospital, birth centre or unit and the initial weeks, reasons for stopping and what could have helped mothers continue breastfeeding for longer. The possible influence of relatives and friends on mothers’ feeding practices is also considered.
4.1 Breastfeeding and factors associated with the birth
Chapter 3 noted that the majority of mothers who said that they had planned to breastfeed followed through with their intentions. However, it is useful to examine the variance in prevalence of breastfeeding in the first two weeks by factors related to the labour and delivery and whether the mother gave birth in a hospital with full accreditation from the Baby Friendly Initiative, enabling any potential influences on breastfeeding initiation to be detected.
The findings of logistic regression on understanding the impact of these factors as well as of various demographic characteristics on breastfeeding initiation and prevalence at two and six weeks (based on full term babies) can be found in Appendix C.
Contextual information such as type of delivery, where the mother gave birth, analgesia given during labour, the gestational age of the baby at birth and whether the baby was admitted to special care are discussed in Chapter 1.
4.1.1 Type of delivery
Nearly two-thirds of babies were born by normal birth (63%), while nearly a quarter (24%) were born by caesarean section. Vacuum extraction (ventouse) and forceps were each used in seven per cent of births (see Chapter 1). Although the likelihood to breastfeed initially and to breastfeed at one and two weeks did not vary much by method of birth, those who had had a vacuum extraction were more likely to breastfeed at each of these stages. For example, 84% of mothers who had undergone this procedure began breastfeeding initially, compared with 81% overall. In addition, at one and two weeks mothers who had a vacuum extraction were still more likely to breastfeed with 74% and 72% doing so for the respective stages, compared with 70% and 67% overall. There is no obvious reason for this and it may be a finding which is not replicated.
Table 4.1
4.1.2 Where the mother gave birth
For the first time in the Infant Feeding Survey, mothers in 2010 were asked in more detail about where they gave birth, rather than just hospital or home. Most mothers reported that they gave birth in hospital, either in a midwife-led unit (64%) (where care is entirely delivered by midwives and mothers are encouraged to give birth with as little medical intervention as possible) or a consultant-led unit (the traditional ‘Labour Ward’) (29%). A further 2% reported that they gave birth in a midwife-led unit or birth centre separate from hospital and 3% reported they gave birth at home. See Chapter 1 for further discussion on these findings.
Copyright © 2012, Health and Social Care Information Centre. All Rights Reserved. 4
Breastfeeding initiation was highest among the small proportion who gave birth at home (88%) and among those who reported that they gave birth in a consultant-led unit (85%), compared with 81% overall. Mothers giving birth at home may receive more consistent support to establish breastfeeding and they may not have to deal with the range of different staff and practices that occur in hospital; they may also be more predisposed to breastfeed for lifestyle reasons and due to their socio-economic characteristics. There are likely to be a number of factors influencing the higher proportion of mothers initiating breastfeeding who reported that they gave birth in consultant-led units. As discussed in Chapter 1, mothers reporting that they gave birth in a consultant-led unit were more likely to give birth by caesarean section and less likely to have a normal birth. After having a complicated birth, mothers may receive more support, particularly if the baby has to go into special care. The higher breastfeeding initiation rate may also relate to socio-demographics; older mothers and those from managerial and professional occupations were more likely to report that they gave birth in a consultant-led unit and these groups were also more likely to breastfeed.
Those who had home births also had the highest breastfeeding rates in the early weeks following the birth, where at one week 82% of those who had a home birth were breastfeeding, compared with 70% overall. Furthermore, the proportion of mothers who had home births and were still breastfeeding after two weeks from birth stayed relatively stable with just over four in five (81%) still doing so, while the overall breastfeeding rate dropped to two-thirds (67%).
Those who gave birth in a consultant-led unit also had higher breastfeeding rates after one week (75%) and two weeks (71%) from birth, although the difference was not as pronounced as for those who had had a home birth.
Table 4.1
4.1.3 Analgesia
For the first time in 2010, mothers were asked about non-pharmacological methods of pain relief used in labour, such as using a Transcutaneous Electrical Nerve Stimulator (TENS) machine or birthing pool, as well as pharmacological methods such as gas and air.
The most commonly used pharmacological analgesic during labour was gas and air, used by 70% of mothers. Epidurals were used by a third of mothers (33%) while pethidine or similar injections were used in a slightly lower proportion of births (28%). Only 10% of mothers did not receive any pharmacological analgesic during labour (although they may have used non-pharmacological methods).
In terms of non-pharmacological methods of pain relief, nearly two in five (38%) mothers reported that they used natural methods of pain relief, such as breathing or massage, 15% used a TENS machine and 11% used water or a birthing pool. See Chapter 1 for further discussion on these findings.
Those who used a TENS machine during the birth were most likely to breastfeed initially (93% compared with 81% overall). Mothers who used a TENS machine continued to have the highest breastfeeding rates after one and two weeks from birth (86% and 83% respectively, compared with 70% and 67% overall). Those who used a birthing pool were also more likely than average to breastfeed initially (89%) and at one week (81%) and two weeks (79%). However, these rates could be explained by considering the profile of mothers who used a birthing pool or TENS machine during the birth. As discussed in Chapter 1, mothers using either of these methods tended to be older and have a managerial or professional occupation, factors associated with higher rates of breastfeeding.
Copyright © 2012, Health and Social Care Information Centre. All Rights Reserved. 5
Mothers who used pethidine had the lowest rates of breastfeeding initiation (77%): pethidine and similar analgesics can make babies more sleepy after the birth, which can make it more difficult to establish breastfeeding. This pattern continued at one week and two weeks, for example at two weeks, 61% of mothers who received pethidine or similar were still breastfeeding, compared with 67% overall. Socio-demographic factors may also have been at play here, although the pattern is less marked than for the use of TENS machines: mothers receiving pethidine were more likely to be younger and to be in routine or manual occupations, although the findings for those who had never worked matched the average (see Chapter 1).
Table 4.1
4.1.4 Prematurity and special care
Also for the first time in this longitudinal survey, mothers were asked how many weeks into their pregnancy they gave birth. The majority of babies were full term (born at 37 weeks or more) at birth (93%), 4% were born at 35-36 weeks gestation and 3% at 34 weeks or less. This is discussed further in Chapter 1.
Although there were no differences in breastfeeding initiation rates between full term and all babies born prematurely (81% for both), mothers of the most premature babies (less than 32 weeks) were most likely to initiate breastfeeding (92% compared with 81% overall). As discussed in Chapter 2, breastfeeding includes giving expressed breastmilk via a syringe, bottle or cup etc., which is of particular relevance for premature babies. Not breastfeeding presents particular health risks for premature babies; preterm babies who are not breastfed or who do not receive breastmilk are more likely to develop necrotising entercolitis1, and premature babies are likely to have different nutritional needs than babies born at full-term as they have not had the same length of time to build stores of energy and nutrients before birth, so breastmilk can be especially valuable. Mothers of premature babies may therefore be more motivated to give breastmilk to their baby, at least in the short term. This group of mothers was also more likely to be breastfeeding at one and two weeks (90% at both weeks compared with 70% at one week and 67% at two weeks overall).
Table 4.2
Mothers were asked if their baby had been given phototherapy for jaundice or had been admitted to special care. Only 7% were admitted to special care and 5% were put under a lamp; one in ten were affected by either (11%). This is discussed further in Chapter 1.
Babies starting life in special care were more likely to be given breastmilk initially (85% compared with 81% overall) and at one week (75% compared with 70% overall), although there was no difference at two weeks (70% compared with 67% overall). Spending longer in special care had a positive effect on breastfeeding prevalence at one and two weeks. Those spending two days or more were more likely to be still breastfeeding at one week (78% at two to three days and 77% at four or more days compared with 69% for those spending a day and 70% overall). Those spending four days or more were more likely to be breastfeeding at two weeks (72%), compared with 62% for those spending a day and 67% overall.
Table 4.2
It could be assumed that the longer stay in special care meant that mothers had more direct access to breastfeeding support. The relationship between prematurity and being in special care is also likely to be an influencing factor. As discussed in Chapter 1, over half of premature babies were
Copyright © 2012, Health and Social Care Information Centre. All Rights Reserved. 6
admitted to special care (53% vs. 5% of full term babies) and the proportion increased with the prematurity of the baby (37% of those born at 35-36 weeks were admitted to special care compared with 83% for those less than 32 weeks). Babies spending longer in special care were more likely to be premature (see Chapter 1 for further discussion) and mothers of such babies may receive more encouragement and feel more motivated to give breastmilk to their babies (either from the breast directly or through expressing), given the particular risks of not doing so for premature babies. As discussed earlier in this section, initiation rates for premature babies generally were in line with the average, except for the most premature, so it may be that the combination of prematurity and being in special care means these babies are more likely to be given breastmilk.
4.1.5 Length of time before skin-to-skin contact
Skin-to-skin contact soon after birth is known to help mothers to establish a first successful breastfeed. As discussed in Chapter 1, the majority of mothers (81%) had skin-to-skin contact with their baby within an hour of the birth, rising to 88% within 24 hours. This was a significant increase since 2005 (when it was 72% within an hour; 81% within 24 hours). Nearly four in five mothers said they had skin-to-skin contact for as long as they wanted (79%) in 2010.
Breastfeeding initiation was indeed much higher for babies exposed to skin-to-skin contact (84% immediately or within an hour and between one and twelve hours, compared with 61% with no such contact). The breastfeeding prevalence rates at one and two weeks were correlated with initial incidence.
Table 4.2
4.1.6 Baby Friendly Initiative
For the first time in 2010, it has been possible to compare initiation rates between hospitals which have achieved full accreditation from UNICEF’s Baby Friendly Initiative (BFI) with other hospitals. Fifteen per cent of mothers who gave birth in a hospital, birth centre or unit did so in one with full BFI accreditation (71% did not and a further 15% were unclassified as mothers did not provide enough detail about the hospital where they gave birth). However, there was considerable disparity by country. Full BFI accreditation was highest in Scotland and Northern Ireland (52% in each) and lowest in England (9%). Wales fell in the middle at 34%. BFI is discussed in more detail in Chapter 1.
Mothers who gave birth in a UK hospital, birth centre or unit which was fully BFI accredited were less likely to initiate breastfeeding than those who did not (75% and 82% respectively). This pattern was not consistent throughout the UK however. Whilst in England and Wales mothers giving birth in a hospital with full BFI accreditation were less likely to initiate breastfeeding than those in a non-BFI hospital (79% compared with 83% in England and 68% compared with 72% in Wales), in Northern Ireland the reverse was true, with mothers giving birth in a BFI accredited hospital being more likely to initiate breastfeeding (66% compared with 62% in a non-BFI hospital). In Scotland there was no statistically significant difference in incidence by BFI status (74% of mothers giving birth in a BFI hospital initiated breastfeeding compared with 73%).
Mothers who gave birth in a hospital with full BFI accreditation were also less likely to be breastfeeding at one and two weeks than those in a non-BFI hospital, which continues the pattern established at initiation. For example, at one week, 71% of mothers in hospitals without full accreditation were breastfeeding, compared with 61% in fully accredited hospitals. At two weeks, the figures were 68% and 58% respectively.
Copyright © 2012, Health and Social Care Information Centre. All Rights Reserved. 7
Breaking this down by country, in England and Wales the prevalence of breastfeeding at one and two weeks was higher among mothers who had given birth in a hospital without full BFI accreditation (69% of mothers in England and 56% of mothers in Wales were breastfeeding at two weeks, compared with 63% and 47% respectively for mothers who gave birth in a hospital with full BFI accreditation). In Scotland and Northern Ireland, however, there was no difference in prevalence at one or two weeks by BFI accreditation status.
Table 4.3
In interpreting the findings, it is worth bearing in mind that there are several stages towards full accreditation, so some hospitals which were not yet fully accredited at the time of the survey would have been at or near to the standards required by BFI. In England, over the past few years the funding to work towards BFI accreditation has been targeted at the most deprived areas, particularly in the North East where breastfeeding initiation rates were lowest: these hospitals were therefore starting from a much lower level. Conversely, in London, where initiation rates were highest, there were no hospitals with full BFI accreditation (see Chapter 1 for further details on BFI and Chapter 2 for initiation and prevalence by English region). Although specific funding was not directed in this way outside England, hospitals in the most deprived areas in the devolved nations were also more likely to have achieved full accreditation status. Thus, the lower breastfeeding initiation and prevalence rates in England and Wales for mothers giving birth in hospitals with full BFI accreditation is likely to be a reflection of the demographic profile of the area (since mothers in certain regions and more deprived areas are less likely to breastfeed). The fact that more hospitals in Scotland and Northern Ireland had achieved full accreditation than in England and Wales may also be a factor, meaning that the relationship between deprivation and full BFI accreditation had less impact in Scotland and Northern Ireland.
4.2 Experiences in the hospital, birth centre or unit and breastfeeding in the early weeks
This section investigates mothers’ experiences in the hospital, birth centre or unit separate from the hospital and how these are associated with initiation and duration of breastfeeding in the early weeks. In this section, figures are based on the large majority (95% - see Chapter 1, Section 1.9.4) who gave birth in hospital or in a birth centre or unit separate from the hospital. 2
4.2.1 Length of stay in the hospital, birth centre or unit
Table 4.4 displays the distribution of length of stay in the hospital, birth centre or unit based on all breastfeeding mothers. Nearly two-fifths (39%) spent no more than one day in the hospital, birth centre or unit with a further quarter (26%) spending up to two days. Breastfeeding mothers who had had a normal delivery spent the least amount of time in the hospital, birth centre or unit with over half (56%) spending no more than one day there. Conversely, those who had had a caesarean section spent the longest in the hospital, birth centre or unit, with two-thirds (66%) spending more than two days there. Compared with 2005, the proportion of breastfeeding mothers staying no longer than two days increased slightly to 65% (compared with 61% in 2005).
Breastfeeding mothers of premature babies tended to have longer stays in hospital than those with full term babies (56% and 14% respectively spent more than three days there). Similarly, those
Copyright © 2012, Health and Social Care Information Centre. All Rights Reserved. 8
whose babies were admitted to special care spent longer in hospital (64% spent more than three days there compared with 12% of mothers who babies were not admitted to special care).
Table 4.4
4.2.2 Breastfeeding status at the time of leaving the hospital, birth centre or unit
There has been a small increase since 2005 in the proportion of breastfeeding mothers still breastfeeding by the time they left the hospital, birth centre or unit (89% compared with 87% in 2005), although this is due to an increased proportion who were mixed feeding (16% compared with 13% in 2005), rather than only breastfeeding, which remained the same (73% compared with 74% in 2005). This may be related to the fact that the length of time mothers actually spent in the hospital, birth centre or unit also decreased slightly, so the likelihood of still breastfeeding when leaving was higher.
Although mothers who had had a caesarean had average breastfeeding initiation rates (see Table 4.1), breastfeeding mothers who had had a caesarean were less likely to be breastfeeding exclusively on leaving the hospital, birth centre or unit (62% compared with 73% overall). They had a greater likelihood to be mixed feeding at this stage (24% compared with 16% overall). This may be linked to having had a longer stay in the hospital, birth centre or unit (as shown in Table 4.4) and having had a more complicated delivery.
Breastfeeding mothers of premature babies were more likely to have introduced formula by the time they left hospital than breastfeeding mothers of full term babies (31% were mixed feeding and 15% were only giving formula). This may reflect the additional needs of these babies, meaning that there may have been a medical reason for giving formula, as well as the fact that these babies would have spent longer in hospital than full term babies (mothers of full term babies may have introduced formula after leaving hospital).
Table 4.5
4.2.3 Reasons for stopping breastfeeding in the first few weeks
Mothers who had stopped breastfeeding within the first two weeks were asked why they had stopped (reasons for stopping at later stages are covered in Chapter 6). Answers were collected in an open format and subsequently coded into categories.
The reasons given for stopping varied to some extent depending on whether mothers stopped breastfeeding within the first or second week after the birth. The most common reasons for stopping in the first week were:
baby not sucking / rejecting the breast (33%)
having painful breasts or nipples (22%)
mother feeling she had insufficient milk (17%).
Mothers who stopped breastfeeding in the second week were more likely than those stopping in the first week to say this was because they thought they had insufficient milk (28%) or because the baby was ‘too demanding’ or ‘always hungry’ (17%). Mothers saying that the baby was not sucking / rejecting the breast (22%) or that they had painful breasts or nipples (21%) were still given as key
Copyright © 2012, Health and Social Care Information Centre. All Rights Reserved. 9
reasons for stopping in the second week, both of which are likely to be linked to poor positioning and attachment to the breast.
The proportion of mothers who stopped breastfeeding because the baby would not suck or rejected the breast remained at the same level in 2010 as in 2005 (for example, 35% in 2005 and 33% in 2010 for those who stopped breastfeeding when their baby was less than one week old). However, the proportion of mothers citing insufficient milk as a reason for stopping breastfeeding decreased between 2005 and 2010, particularly at one week, but less than two weeks (42% in 2005 and 28% in 2010). The proportion of mothers who stopped breastfeeding at one week, but less than two weeks as a result of painful breasts or nipples also reduced from 30% in 2005 to 21% in 2010.
Table 4.6
4.2.4 What could have helped mothers continue to breastfeed for longer
The majority of mothers who stopped breastfeeding in the first two weeks would have liked to have carried on for longer, particularly those who had continued breastfeeding into the second week (85% of those who stopped between one and two weeks and 80% of those stopping within the first week). The main factors that mothers who breastfed for less than one week indicated could have helped them continue for longer were:
more support and guidance from hospital staff, midwives and family (23%)
if the baby could have latched on the breast easier (19%)
less pain (14%).
A similar pattern emerged for those who stopped between one and two weeks, although achieving a good latch was less of an issue (13%), not having had health problems/being on medication was more likely to be mentioned (12% compared with 6% for those stopping within the first week). Clearly these findings mirror to some extent the reasons mothers gave for stopping breastfeeding, although it is notable that nearly a quarter of mothers felt that more support could have helped them to overcome these problems.
Tables 4.7 and 4.8
4.2.5 Time taken to initiate breastfeeding
It is known that putting the baby to the breast as soon as possible after the birth helps to establish breastfeeding. Mothers breastfeeding at least initially were asked how soon after their baby was born they first put him/her to the breast. Nearly three-quarters (74%) had initiated breastfeeding within the first hour. A further 13% had initiated breastfeeding between one and four hours and 9% after more than four hours.
Copyright © 2012, Health and Social Care Information Centre. All Rights Reserved. 10
Mothers of premature babies who breastfed initially tended to take longer to put babies to the breast than mothers of full term babies; this is likely to have been because the baby needed care which precluded this or because the baby was not able to feed from the breast. For example, 31% of premature babies were put to the breast after 24 hours, compared with 2% of full term babies.
Table 4.9
4.2.6 Contact between mother and baby in the hospital, birth centre or unit
Babies being kept by the mother's side at all times helps encourage the practice of breastfeeding. The proportion of babies born in the hospital, birth centre or unit who stayed with their mother at all times has increased since 2005 - 89% of mothers who breastfed initially in 2010 compared with 84% in 2005.
Ninety-five per cent of breastfeeding mothers whose babies were not admitted to special care said their baby was with them at all times, compared with 22% of breastfeeding mothers whose babies had spent some time in special care. Only seven per cent of mothers of babies who spent four days or more in special care said they were continuously together, compared with 51% of those whose babies spent less than two days. While typically mothers would not be with their baby all the time if they were in special care, some of these mothers may have stayed in a parents’ room within the special care unit. Also, mothers whose babies only spent a very short time away from them in special care may not have counted this. Linked to this, breastfeeding mothers of full term babies (92%) were more likely to continuously be together with their baby, than mothers of premature babies (47%), who are more likely to have needed additional care.
Table 4.10
4.2.7 Formula and other drinks in the hospital, birth centre or unit
Feeding practices in the hospital, birth centre or unit where the mother gives birth can help inform mothers' future feeding choices. Around three in ten breastfed babies (31%) had been given formula, water or glucose while in the hospital, the birth centre or unit, a slight decrease since 2005 (33%). In 14% of cases, this was on advice. In one in ten cases (10%), it was because the mother wanted to. The remaining 7% said that neither of these applied.
Babies in special care who were breastfed initially and, to a lesser extent, those receiving phototherapy were more likely to have received additional feeds/liquids (73% and 63% respectively). Linked to special care, premature babies and those weighing less than 2.5 kilos were also more likely to receive additional feeds (67% and 61% respectively).
Table 4.11
Provision of formula or additional drinks was associated with an increased likelihood of stopping breastfeeding in the early weeks. By the end of the first week, 29% of breastfeeding mothers whose babies had been given one of these feeds had stopped breastfeeding, compared with 10% of those who exclusively breastfed in hospital. A similar differential was observed at two weeks (35% compared with 14%).
Copyright © 2012, Health and Social Care Information Centre. All Rights Reserved. 11
However, looking at mothers giving additional feeds in more detail, it would appear that the decision to stop breastfeeding after early exposure to formula or other liquids is often a personal choice. Only 21% of mothers advised to give formula or liquids had stopped breastfeeding in the first week, with this rising to 42% of mothers who decided early on that they wanted to give additional feeds.
Table 4.12
4.3 Problems feeding the baby and help or support given
4.3.1 Help with how to put baby to the breast in the first few days
Mothers who initially breastfed and gave birth in a hospital, birth centre or unit were asked whether anyone had shown them how to put their baby to the breast in the first few days; 69% had been shown this (a slight decrease since 2005 (72%)). Those who did not receive this help were asked whether they would have liked it. Just over one in five did not want this help (21%), but one in ten (10%) would have liked it.
Understandably, breastfeeding mothers of first babies were more likely than mothers of second or later babies to be given guidance on how to put the baby to the breast (84% and 50% respectively). A further eight per cent of first time breastfeeding mothers would have liked this help, although they did not receive it. A slightly greater proportion of breastfeeding mothers of second or later babies (12%) did not receive this help, but would have liked to.
Breastfeeding mothers in the devolved nations were more likely to have received help with breastfeeding than those in England (Wales 73%, Northern Ireland 73%, Scotland 71% compared with 68% in England).
Breastfeeding mothers of premature babies born at 35-36 weeks gestation were more likely to receive help to put the baby to the breast than full term babies (76% compared with 69%). However, breastfeeding mothers of babies who were more premature were less likely to receive this help (52% of mothers of 32-34 weeks premature babies; 25% of mothers of less than 32 weeks premature babies). This is likely to be because such premature babies would only be able to take expressed breastmilk through a tube.
Mothers in managerial and professional occupations (73%) who breastfed initially were more likely to receive help with breastfeeding than those who had not worked (52%). However, the latter group was also more likely to not want any help (33% compared with 18% of those in managerial and professional occupations).
Table 4.13
The intensity of breastfeeding support may be expected to have an effect on the mother’s continuation with breastfeeding. Therefore mothers were asked how long the person helping them stayed with them. Overall, 38% of mothers receiving help with breastfeeding said that the person helping them left once the baby was feeding, but came back to check on them, while a similar proportion (37%) said that they had been left as soon as the baby had started feeding. Only 15% said that someone had stayed with them the whole time until the end of the feed.
Copyright © 2012, Health and Social Care Information Centre. All Rights Reserved. 12
Again, there are indications that mothers in the devolved nations received more breastfeeding support than English mothers: 44% of mothers in Northern Ireland and 42% in Wales and Scotland said that someone came back to check on them, compared with 37% in England. This may relate to relative resources available in the devolved nations, compared with England.
Mothers of premature babies also received a greater intensity of support, with 24% of these mothers saying the person helping them stayed the whole time, compared with 15% for full term babies.
There were also indications that breastfeeding mothers in routine and manual occupations and those who had never worked received a greater intensity of support: 18% and 20% respectively reported that the person helping them stayed with them the whole time they were feeding, compared with 13% of mothers in managerial and professional occupations. The intensity of support for mothers of first and second or later babies was similar (not included in table).
Table 4.14
4.3.2 Recognising that the baby is getting enough milk
For the first time in 2010, mothers who breastfed initially and gave birth in a hospital, birth centre or unit were asked whether anyone had explained how to recognise that their baby was getting enough milk and whether they felt confident they could recognise this. In just under half of cases (48%), this was explained to the mother and 37% felt they were confident enough to recognise whether or not their baby was getting enough milk (nearly four out of five of those who received this explanation).
Mothers in Scotland were most likely to have been given this information (54% compared with 48% overall) and this translated into a greater proportion feeling confident they could recognise their baby was getting enough milk (42% compared with 37% overall). First time mothers were more likely to be given this information (51% compared with 44% of mothers of second or later babies), but this difference was not as marked as for help with putting the baby to the breast, suggesting that this information is being disseminated more widely.
Mothers of full term babies were more likely to be given this information than those who had premature babies (48% compared with 43%).
Table 4.15
The majority of mothers found this information very or extremely useful (89%) and two in five (40%) found it extremely useful.
Table 4.16
Copyright © 2012, Health and Social Care Information Centre. All Rights Reserved. 13
4.3.3 Problems feeding the baby in the hospital, birth centre or unit and after leaving
Mothers were asked about the existence and nature of feeding problems both while in the hospital, birth centre or unit and after leaving. Feeding problems after leaving the hospital, birth centre or unit relate to the period between leaving and the time of completion of the Stage 1 questionnaire (around four to ten weeks). Feeding problems at later stages are covered in Chapter 6. Answers relating to feeding problems were collected in an open format and then responses were later coded into categories.
Around three in ten mothers (29%) experienced problems with feeding when in the hospital, birth centre or unit and a similar proportion (30%) had experienced problems after they had left the hospital, birth centre or unit. Mothers who were only breastfeeding were more likely than mothers who were only formula feeding to experience feeding problems both while in the hospital, birth centre or unit (22% compared with 10%) and in the early weeks after leaving (30% compared with 11%).
However, by far the highest levels of problems were experienced by mothers who adopted a mixed feeding approach. Over half (52%) of mothers who used a combination of breastmilk and infant formula while in the hospital, birth centre or unit experienced problems in hospital. Similarly, in the period between leaving the hospital, birth centre or unit and completing the Stage 1 questionnaire, 42% of mothers who either introduced or switched to formula after initially breastfeeding said that they experienced problems. However, the cause and effect cannot be determined. Mothers may have adopted a mixed feeding approach because they were having problems with breastfeeding; alternatively the introduction of infant formula may in itself have caused problems or exacerbated existing ones.
Table 4.17
The problems experienced in hospital by mothers differed in nature depending on how they fed their babies in hospital. For those who breastfed only or gave breastmilk and formula, the baby not sucking, failure to latch on properly (59% and 47% respectively) and breast or nipple discomfort (17% and 10% respectively) were key problems. Additionally, just over a fifth (21%) of mixed-feeding mothers indicated that they needed to give top-ups of formula and 13% reported that their breastmilk dried up or they did not have enough. Formula feeding mothers with problems (i.e. those who did not breastfeed) were particularly likely to mention that the baby was not feeding properly or was not interested (22%) and that the baby wouldn’t suck or that they could not get the baby to latch on or attach to the breast (21%); this would suggest that the latter group attempted to initiate breastfeeding but were unable to.
Table 4.18
After leaving the hospital, birth centre or unit, the main problems experienced by mothers who were formula feeding at this stage (and who did not breastfed) were related to the health of the baby: vomiting/reflux (19% compared with 3% of mothers with problems who only breastfed and 4% of mothers with problems who introduced or switched to formula) and colic/wind (18% compared with 5% and 4% respectively).
Copyright © 2012, Health and Social Care Information Centre. All Rights Reserved. 14
As discussed above, problems encountered in the very early days by breastfeeding mothers were mainly centred on problems with attachment or failure to feed and breast or nipple discomfort. These still featured as key problems for mothers after leaving hospital, indeed the proportion of mothers with problems indicating they were suffering from breast or nipple discomfort had increased (50% for those only breastfeeding and 29% for those who introduced or switched to formula). This was also much higher than in 2005, when 12% of those only breastfeeding and 10% of those who introduced or switched to formula mentioned breast or nipple discomfort.3 The proportion mentioning problems with latching on was lower than in hospital (35% and 36% respectively), although it should be borne in mind that poor attachment is often the cause of breast or nipple discomfort so the two issues can be interlinked. For mothers introducing or switching to formula, further problems encountered were a need for top-ups of formula (21%), breastmilk having dried up/not having enough milk (18%) and the baby not being satisfied (11%). As the introduction of formula is likely to reduce the mother’s supply of breastmilk, it may have exacerbated the latter problems.
Table 4.19
4.3.4 Help or support with feeding problems
Mothers who experienced feeding problems were asked whether or not they had been given help or support with these. While in the hospital, birth centre or unit, 84% of breastfeeding mothers who had problems received help or support. After leaving the hospital, birth centre or unit there was a similar level of support for breastfeeding mothers experiencing problems (82%).
Tables 4.20
However, although only small subgroups of mothers were affected by a lack of help or support with problems, these mothers were more likely to have stopped breastfeeding within the first two weeks. Just over a third (34%) of mothers who initially breastfed and did not receive help or support in the hospital, birth centre or unit with their feeding problems had stopped within two weeks. This compares with around a quarter (26%) of breastfeeding mothers who did receive help with their feeding problems. For breastfeeding mothers experiencing problems after leaving hospital there was also a difference in breastfeeding cessation by two weeks between those receiving support (15%) and those not (27%). These findings tally with the earlier discussion on what would have helped mothers to breastfeed longer, with more support and guidance from hospital staff, midwives and family being mentioned the most.
Table 4.21 and Table 4.22
Breastfeeding mothers who had received help or support for feeding problems (either in the hospital, birth centre or unit or after leaving) were asked who provided this support. In hospital, help for breastfeeding mothers was mainly given by midwives (82%), nurses (26%) or midwifery support workers (23%). Once mothers had left hospital, midwives were still the most common source of information on feeding problems (55%), followed by the health visitor (45%). The support network once out of hospital also included breastfeeding support groups (20%), doctor / GP (17%), a partner / friend / relative (16%) and breastfeeding clinics (10%). Some mothers consulted books, leaflets or magazines (14%) and the internet (13%) for information on breastfeeding problems.
Table 4.23
Copyright © 2012, Health and Social Care Information Centre. All Rights Reserved. 15
More generally, since leaving the hospital, birth centre or unit4, nearly seven in ten mothers (69%), had been given the contact details of a voluntary organisation or community group which helps new mothers with infant feeding. Seventeen per cent of mothers had used these contact details to seek help or information (a quarter of those given the information). In nearly half of cases, the information was given in print (47%), while just over two in five (41%) received the information in conversation.
Mothers who were formula feeding only when leaving hospital were less likely to have been given these contact details than those who were breastfeeding (43% compared with 78%), and accordingly were less likely to have used the details to seek help or information (6% compared with 22%). This reflects the fact that such voluntary organisations and community groups tend to be primarily concerned with supporting mothers with breastfeeding (where the need for support is greatest) and thus this may not have been seen as relevant to mothers who were formula feeding.
There was considerable variation by country: mothers in England were most likely to have been given these contact details (70%) and mothers in Wales were the least likely (51%).
There was also variation by birth order. Nearly three-quarters (74%) of first time mothers were given contact details of a voluntary organisation or community group which helps mothers with infant feeding compared to over three in five (63%) of mothers of second or later babies.
Table 4.24
Since the last Infant Feeding Survey in 2005, a National Breastfeeding Helpline has been introduced across the UK, which is staffed by volunteers who are trained to give support and information on breastfeeding by telephone. Overall, nearly two-thirds of mothers were aware of the helpline (64%) with four per cent saying that they had used it in the UK.
Awareness of the Helpline was highest in England (65%) and lowest in Wales (51%). Usage levels by country were more in line with each other.
Table 4.25
4.3.5 Publications available to mothers
A number of publications offering information on pregnancy, infant feeding and health are available to new mothers, although these vary by country. At Stage 1 of the survey, mothers were asked which, if any, of a prompted list of publications they had received either during their pregnancy or after the birth. Most mothers (90%) in the UK recalled receiving at least one of the listed publications. A higher proportion of first time mothers (94%) recalled receiving at least one of these publications, compared with mothers of second or later babies, although the proportion still remains high (86%).
Mothers in Scotland were most likely to recall receiving ‘Ready Steady Baby’ and ‘Breastfeeding – off to a good start’ (74% and 62% of Scottish mothers respectively). In England and Wales, the most commonly recalled publications received were ‘The Birth to Five Book’ (67% and 66% respectively) and ‘The Pregnancy Book’ (60% and 57% respectively). Additionally, a similar proportion of Welsh mothers recalled receiving the ‘Breastfeeding – the best start for your new baby’ leaflet (57% of Welsh mothers). Mothers in Northern Ireland were less likely to recall receiving any of the listed publications (85% compared with 90% overall); they were most likely to recall receiving ‘Breastfeeding – off to a good start’ (66%) and ‘The Pregnancy Book’ (52%).
Table 4.26
Copyright © 2012, Health and Social Care Information Centre. All Rights Reserved. 16
4.4 The influence of own feeding experiences and friends and relatives
4.4.1 Whether the mother was breastfed as a baby
Previous surveys have shown a relationship between how mothers were fed themselves when they were babies and how long they breastfed their own children. This relationship is also evident in the 2010 survey.
Thus breastfeeding mothers who were themselves entirely formula fed were more likely to stop breastfeeding in the first two weeks (27%) than mothers who were only breastfed themselves (9%). These differences continued to be evident beyond the first fortnight: at four weeks, nearly two-thirds (63%) of mothers who were entirely formula fed as babies were still breastfeeding, compared with nearly nine in ten of those who were only breastfed (85%).
Table 4.27
4.4.2 Influence of friends and relatives
Similarly, there is a correlation between how mothers fed their own babies and how most of their friends with babies fed their children, indicating a peer influence on feeding. Table 4.27 shows that for breastfeeding mothers where most of their friends only formula fed their babies, these mothers were more likely to stop breastfeeding within two weeks (26%) than mothers where most of their friends breastfed only (6%). Twelve per cent of mothers where most of their friends breastfed and gave formula stopped within two weeks. This association again continues beyond the first fortnight, with nearly two-thirds (63%) of mothers with friends who used formula still breastfeeding at four weeks compared with nine in ten (90%) of those with friends who breastfed only and nearly four in five (79%) of those with friends who breastfed and gave formula.
Table 4.27

Copyright © 2012, Health and Social Care Information Centre. All Rights Reserved. 17
Notes and references
1 Henderson et al 2009
2 Note that in 2005, these findings were presented for mothers giving birth in hospital only, but as only two per cent of
mothers in 2010 gave birth in a midwife-led unit or birth centre separate from the hospital, the findings will be comparable. 3 See the 2005 Infant Feeding Survey Report, Chapter 4, Table 4.19 http://www.ic.nhs.uk/pubs/ifs2005
4 If the baby was born at home, mothers were asked to answer in relation to the time since the baby was born.
Copyright © 2012, Health and Social Care Information Centre. All Rights Reserved. 1
5. The use of milk other than breastmilk
Key findings
As babies got older, mothers made more use of formula, either as the sole source of milk or in addition to breastmilk. Thus, at Stage 1 (when babies were four to ten weeks old) around two-thirds of mothers (67%) had given their baby infant formula in the last seven days and nearly half (46%) had only given formula. By Stage 3 (when babies were eight to ten months old), nearly nine in ten mothers (89%) had given formula or other milk in the last seven days, with over seven in ten (73%) giving this as the sole source of milk.
At Stage 1, 56% of mothers who had used both breastmilk and formula said they had used infant formula as their predominant feed (at least half of all feeds since the baby was born). Usage among this group has declined since 2005 (64%).
At each stage of the survey mothers were asked at what age they had first given their baby any sort of milk other than breastmilk. It is not possible from the information collected in the survey to be sure of the exact type of milk other than breastmilk that mothers first gave to their baby, although in the majority of cases it can be assumed that it was infant formula.
Almost three-quarters of mothers (73%) had given their baby milk other than breastmilk by the age of six weeks. This proportion rose to nearly nine in ten (88%) by six months. It is not possible from the information collected in the survey to be sure of the exact type of milk other than breastmilk that mothers first gave to their baby, although in the majority of cases it can be assumed that it was infant formula. Mothers from managerial and professional occupations and older mothers were the most likely to introduce milk other than breastmilk at a later age, which reflects the higher levels of breastfeeding amongst these mothers.
The proportion of mothers giving their baby milk other than breastmilk was slightly lower in 2010 than in 2005 at all time points up to six months. When babies were four months old, 83% of mothers were giving milk other than breastmilk in 2010, compared with 88% in 2005.
At Stage 2 of the survey (when babies were four to six months old), most mothers who had given their baby milk other than breastmilk in the last seven days were mainly giving infant formula (88%). Use of follow-on milk or liquid cow‟s milk was low at this stage (nine and one per cent respectively). By Stage 3 of the survey, mothers were more likely to be using follow-on formula (57%) as their baby‟s main source of milk other than breastmilk, rather than infant formula (35%).
At Stage 3 of the survey, 69% of all mothers had given their baby follow-on formula, an increase from 53% in 2005.
Most mothers followed the recommendation of not giving their baby follow-on formula before the age of six months (16% had given follow-on formula when their baby was four months old, increasing to 50% at six months). Mothers from routine and manual occupations and mothers who had never worked were more likely than average to say they had given their baby follow-on formula at an earlier age (18% and 27% respectively at four months).
At Stage 3 of the survey, about two in five mothers (42%) had given their baby liquid cow‟s milk. Twenty-nine per cent had used it to mix with food while 24% had used it as an occasional drink. Only four per cent of mothers had introduced liquid cow‟s milk as their baby‟s main source of non-breastmilk by this stage of the survey.
Almost half (49%) of all mothers who had prepared powdered infant formula in the last seven days had followed all three recommendations for making up feeds (only making one feed at a
Copyright © 2012, Health and Social Care Information Centre. All Rights Reserved. 2
time, making feeds within 30 minutes of the water boiling and adding the water to the bottle before the powder). This is a substantial increase since 2005 when 13% did so.
Mothers from Black and Asian ethnic groups (72% and 64% respectively), those who had never worked (64%), those aged under 20 (63%) and those living in the most deprived IMD quintile (57%) were the most likely to follow all three recommendations on preparing powdered formula.
About two-thirds (65%) of mothers who had prepared powdered infant formula in the last seven days followed recommendations for feeding away from the home (either not using powdered formula, or doing so correctly by making up feeds with hot water or keeping pre-prepared feeds chilled). This was similar to 2005 (63%).
Four in five mothers (80%) at Stage 1 had used a bottle to feed their baby. Among mothers who used bottles, steam sterilisers were the most common sterilisation method (67%), followed by sterilising in a microwave (16%) and soaking in sterilising solution (9%).
Copyright © 2012, Health and Social Care Information Centre. All Rights Reserved. 3
This chapter examines mothers‟ use of milk other than breastmilk at each stage of the survey. It looks at what type of milk mothers were giving their babies and at what age babies were first given any sort of milk other than breastmilk. The chapter also looks specifically at mothers‟ use of both follow-on formula and liquid cow‟s milk and at what age these milks were first given. Finally, the chapter looks at whether mothers who used powdered formula were following the recommended guidelines for preparing and storing feeds and what sterilisation methods were used by all mothers using bottles.
5.1 Types of milk other than breastmilk given to babies
There are several types of milk other than breastmilk that mothers can use during their baby‟s first year.
Infant formula (or first milk) is an artificial feed, which can act as an alternative for breastmilk as the sole source of nutrition for babies until they are first given solid food. The majority of infant formulas are based on cow‟s milk with additional components and usually have whey as the dominant cow‟s milk protein. Infant formula based on soy protein is available, but is only recommended for use in exceptional circumstances. More appropriate hydrolysed protein preparations can be prescribed for babies who cannot tolerate cow‟s milk.1
As babies grow older, other types of infant formula may be introduced such as follow-on formula (or second milk) and liquid cow‟s milk. While infant formula is usually whey-based, follow-on formula is casein-based and fortified with iron. Follow-on formula takes longer to digest and it is sometimes claimed that it is especially suitable for hungrier babies, although there is no evidence for this claim.2 It is not recommended that follow-on formula is given to infants before the age of six months.3
Liquid cow‟s milk is not recommended to be given to infants as a main drink until they are a year old and at this age only full-fat milk is recommended. Semi-skimmed milk is not recommended for infants until they are two years old, while skimmed milk should not be given to children under five years old. It is acceptable, however, to introduce liquid cow‟s milk to mix in foods that are prepared for the baby from the age of six months. Other types of milk such as goat‟s milk and sheep‟s milk are not recommended to be given as drinks until infants are a year old.1
5.2 The use of different types of milk
In 2010, around a fifth of mothers (19%) in the UK did not initiate breastfeeding at birth but instead used infant formula as the sole source of nutrition for their baby. The proportion of mothers who only ever used infant formula from birth was lower in 2010 compared with the 2005 survey (when it was 24%), which is related to the increase in the incidence of breastfeeding seen in Chapter 2.
Although the majority of mothers (81%) breastfed initially, it was shown in Chapter 2 that some mothers breastfed only for a relatively short period of time before introducing infant formula. Table 5.1 shows what types of milk mothers had given their baby in the previous seven days at each stage of the survey.
At Stage 1, two-thirds of mothers (67%) had given their baby infant formula in the last seven days. Just under half of all mothers (46%) had given their baby only infant formula during this period, indicating that this was the baby‟s sole source of nutrition, while about a fifth of mothers (21%) had used mixed feeding during this period, giving their baby both breastmilk and infant formula.
Copyright © 2012, Health and Social Care Information Centre. All Rights Reserved. 4
At Stage 2 of the survey, 79% of mothers had given their baby formula in the last seven days, with three in five (60%) having only given their baby formula during this period. At Stage 3, 89% of mothers had given their baby formula in the last seven days, with over seven in ten (73%) giving this as the sole source of milk. Note that at Stage 1, mothers were asked if they had given infant formula, but at Stages 2 and 3, mothers were asked if they had given formula or other milk, reflecting the fact that as babies grow older, other types of milk may be given. For simplicity, this is referred to as formula.
This pattern of mothers increasingly using formula or other milk as their baby gets older, either as the sole source of milk or in addition to breastmilk, is in line with the fall-off in the prevalence of breastfeeding and exclusive breastfeeding that was seen in Chapter 2. Relative to 2005, however, fewer mothers had used formula in the last seven days at each stage and this was particularly the case for using formula only, indicating that mothers continued to breastfeed alongside giving formula for longer. For example, at Stage 1, the proportion of mothers giving formula had decreased from 72% in 2005 to 67% in 2010. The gap had narrowed by Stage 3, when the figures were 91% for 2005 and 89% for 2010. Regarding giving formula only, there were larger decreases between 2005 and 2010. For instance, the proportion of mothers giving formula only at Stage 1 had dropped from 53% in 2005 to 46% in 2010, and the drop was even greater at Stage 3, when there had been a decrease from 83% in 2005 to 73% in 2010.
Table 5.1
It is also useful to look specifically at the milk feeding patterns of mothers who breastfed initially, to see how these changed over the different stages of the survey. Table 5.2 shows that at Stage 1 of the survey just under three in five mothers (59%) who breastfed initially had given their baby formula in the last seven days, with a third (33%) having only given their baby formula during this period.
At Stage 2, nearly three-quarters of mothers (74%) who had breastfed initially had given their baby formula in the last seven days, with 50% having only used formula during this time. By Stage 3, the equivalent proportions were 86% and 67%.
Table 5.2
For mothers who had used both breastmilk and infant formula, it is interesting to examine what the baby‟s predominant source of nutrition was. At Stage 1 of the survey all mothers who had ever used formula were asked how often they had used formula since their baby was born.
Table 5.3 shows that across the UK, 56% of mothers who had used both breastmilk and formula at Stage 1 of the survey said that they had used infant formula as their baby‟s predominant feed, that is for at least half of all feeds since the baby was born. A further 22% of mothers who had used both breastmilk and infant formula said they had used infant formula on an occasional but regular basis (either daily or weekly) since their baby had been born, but it was not their baby‟s main source of nutrition, while 20% of mothers said they had used it on a sporadic basis since their baby had been born, perhaps on only a few occasions. In fact, 14% of mothers who had given their baby both breastmilk and infant formula said they had used infant formula only once or twice since their baby was born.
Mothers who had used both breastmilk and formula at Stage 1 used formula less frequently in 2010 than in 2005. For example, nearly two-thirds of mothers (64%) in 2005 had used infant formula for at least half of all feeds since the baby was born, but this had decreased to 56% by 2010.
Copyright © 2012, Health and Social Care Information Centre. All Rights Reserved. 5
Stage 1 mothers in Northern Ireland and Wales were most likely to have used infant formula for at least half of all feeds since the baby was born (65% each, compared with 57% in Scotland and 55% in England). This reflects the fact that mothers in Northern Ireland and in Wales were less likely to be exclusively breastfeeding from birth, and at six weeks, as discussed in section 2.5.2.
Table 5.3
5.3 Age at which milk other than breastmilk was first introduced
At each stage of the survey mothers were asked at what age they had first given their baby any sort of milk other than breastmilk. It is not possible from the information collected in the survey to be sure of the exact type of milk other than breastmilk that mothers first gave to their baby, although in the majority of cases it can be assumed that it was infant formula.
Table 5.4 shows that across the UK just under a third (31%) of mothers gave their baby infant formula at birth. Since the proportion of mothers who did not breastfeed initially was 19%, the difference between these two figures shows that more than one in ten (12%) initiated breastfeeding when their baby was born but also gave them infant formula on the first day.
By one week around half of all mothers (52%) had given their baby infant formula, while almost three-quarters (73%) had done so by six weeks. Nearly nine in ten mothers (88%) had given their baby formula by the time he or she was six months old.
The proportion of mothers giving their baby formula was slightly lower in 2010 than in 2005 at all time points up to six months. Thirty-one per cent of mothers gave their baby formula at birth in 2010, compared with 35% in 2005. When babies were four months old, 83% of mothers were giving formula in 2010, compared with 88% in 2005.
There was relatively little variation by country in terms of the age at which mothers first gave their baby infant formula. Mothers in England were the slowest to give their babies formula, with 29% of mothers in England having given their baby formula at birth compared with 37% of mothers in Scotland, 43% of mothers in Wales and 48% of mothers in Northern Ireland. This pattern tends to reflect the different levels of breastfeeding within each country seen in Chapter 2, since there is inevitably an association between the proportion of mothers who breastfeed initially and the age at which mothers first introduce infant formula.
Younger mothers tended to first give their baby formula at a younger age compared with older mothers. Over half (54%) of mothers aged under 20 gave their baby formula at birth compared with almost a quarter (24%) of mothers aged 30-34 and 35 or over. This differential also continued as the babies got older, although it was less marked at later ages (for example, at six months, 95% of mothers aged under 20 had given formula compared with 86% of those aged 30-34 and 35 or older).
Copyright © 2012, Health and Social Care Information Centre. All Rights Reserved. 6
Mothers in managerial and professional occupations tended to introduce infant formula at a later age compared with other mothers. For example, one fifth of mothers (20%) in managerial and professional occupations gave their baby formula at birth compared with almost a third of mothers (30%) in intermediate occupations, almost two-fifths (39%) of mothers in routine and manual occupations and almost half (46%) of mothers who had never worked. Mothers in managerial and professional occupations were still less likely to have introduced formula at six months, although the gap narrowed over time (85% at six months compared with 92% of those in routine and manual occupations and 89% of those who had never worked).
Table 5.4
5.4 Different types of milk other than breastmilk given to infants
As mentioned at the beginning of this chapter, mothers can give their babies different types of milk as they get older, either as their only milk feed or to supplement breastfeeding. Thus, while mothers who give their babies milk other than breastmilk at an early age will start by using infant formula, as the baby gets older they may introduce follow-on formula and eventually liquid cow‟s milk.
At Stage 1 of the survey, all mothers who were using milk other than breastmilk were assumed to be using infant formula and so were not asked any details about the specific type of milk they were giving their baby. However, by Stages 2 and 3 of the survey, all mothers who were using milk other than breastmilk were asked a series of questions about the exact type of milk they were using. Mothers were asked about the different types of milk they had ever given their baby, and the type of milk (excluding breastmilk) they had given their baby most often in the last seven days.
Table 5.5 shows that across the UK, 88% of mothers at Stage 2 who had given their baby milk other than breastmilk in the last seven days had mainly used infant formula, 9% had mainly used follow-on formula, and one per cent had mainly used liquid cow‟s milk. It should be borne in mind that mothers were asked which type of milk they had given most often in the last seven days, excluding breastmilk, so for those who were breastfeeding at this point, breastmilk may still have been the main type of milk babies were receiving. Since most babies at Stage 2 of the survey were between four and six months, it is not surprising that infant formula was the main type of milk other than breastmilk being
used, since this is what is recommended for all babies under six months.3
Of the mothers who gave milk other than breastmilk at Stage 2, mothers in Scotland were the most likely to have given their babies infant formula (92%) whilst mothers in England were the least likely to have done so (87%). Conversely, mothers in England were the most likely to have used follow-on formula (10%) whilst mothers in Scotland were the least likely (5%).
At Stage 3 of the survey, a higher proportion of mothers than at Stage 2 were using follow-on formula. Nearly three in five mothers (57%) who had given their baby milk other than breastmilk in the last seven days said that this was mainly follow-on formula. By contrast, the proportion of these mothers mainly using infant formula in the last seven days decreased from 88% at Stage 2 to 35% at Stage 3. Additionally, 4% of mothers said they had used liquid cow‟s milk as their baby‟s main source of non-breastmilk in the last seven days.
At Stage 3 (similarly to Stage 2), mothers in England who had given their baby milk other than breastmilk in the last seven days were the most likely (58%) to have mainly used follow-on formula, while mothers in Scotland (40%) were the least likely to have done so.
Copyright © 2012, Health and Social Care Information Centre. All Rights Reserved. 7
Relative to 2005, there was a slight drop at Stage 2 in the use of follow-on formula as the main type of milk other than breastmilk (9%, compared with 12% in 2005). Conversely, the use of follow-on formula had increased at Stage 3 in 2010 (57%, compared with 47% in 2005).
Table 5.5 also shows that mothers who were supplementing breastfeeding with other milk at Stage 2 were less likely to have used follow-on formula as their main type of milk other than breastmilk, when compared to those who were not breastfeeding (7% compared with 10%). There was no difference in levels of usage of infant formula.
At Stage 3 of the survey, mothers who were breastfeeding as well as giving other milk were less likely to have used formula (both infant and follow on formula) than those who were not breastfeeding (28% and 36% respectively for infant formula and 53% and 57% respectively for follow on formula). Mothers who were breastfeeding as well as giving other milk were more likely to have used liquid cow‟s milk as their main type of milk other than breastmilk (11% compared with 3% for those who were not breastfeeding). They were also more likely to say they had no main type of milk other than breastmilk (5% compared with less than 0.5%).
Table 5.5
Among mothers giving milk other than breastmilk, mothers who had mainly used infant formula or follow-on formula in the last seven days were asked whether they had used powdered or ready-to-feed formula. Table 5.5 showed that at both Stages 2 and 3 of the survey the majority of mothers used powdered formula, whether they were giving their baby infant or follow-on formula.
Table 5.6 shows the types of formula used by mothers who had mostly used formula in the last seven days (i.e. excluding those who mostly used liquid cow‟s milk or other types of milk). At Stage 2 of the survey, 19% of mothers who mainly used formula in the last seven days had used ready-to-feed formula, whilst at Stage 3 this proportion had decreased to 16%. At both Stages 2 and 3, mothers were more likely to have used a combination of powdered and ready-to-feed formula than to have solely used ready-to-feed formula (12% and 7% at Stage 2, 10% and 6% at Stage 3).
Mothers who were breastfeeding and used formula as their main type of milk other than breastmilk were more likely to use ready-to-feed formula at both stages than those who were not breastfeeding (29% compared with 16% at Stage 2 and 28% compared with 14% at Stage 3). As mentioned earlier in this section, it should be borne in mind that mothers were asked which type of milk they had given most often in the last seven days, excluding breastmilk, so for those who were breastfeeding at this point, breastmilk may still have been the main type of milk babies were receiving. Thus, mothers who were breastfeeding and giving formula may have been more likely to use ready-to-feed formula because they were using formula as an occasional feed.
At both Stages 2 and 3, mothers in England were the most likely to mainly use ready-to-feed formula (19% and 17% respectively among mothers giving formula) and mothers in Northern Ireland were the least likely (13% and 12% respectively). This may be linked to lower breastfeeding rates in Northern Ireland4: as discussed above, mothers who were breastfeeding as well as giving other milk were more likely to use ready-to-feed formula.
Table 5.6
Copyright © 2012, Health and Social Care Information Centre. All Rights Reserved. 8
5.5 Use of follow-on formula
As already mentioned, at Stages 2 and 3 of the survey mothers who had used any sort of milk other than breastmilk were asked exactly what type of milk they had used. While the previous section focused on the proportion of mothers using milk other than breastmilk in the last seven days who used follow-on formula, this section examines the proportion of all mothers who had ever given their baby follow-on formula and at what age this type of milk was first introduced.
Since there is some doubt as to whether all mothers fully understand the difference between infant formula and follow-on formula, at Stage 2 all mothers were asked if they knew the difference between the two.
Just over two thirds of mothers (68%) said they knew the difference between infant formula and follow-on formula5, with mothers in Northern Ireland most likely to claim this knowledge (76%). Just under a third (31%) of all mothers did not know the difference.
Since the results are based on all mothers, whether or not they knew the difference between the two types of formula, it is worth bearing in mind that the results are likely to contain a degree of respondent reporting error (i.e. a proportion of mothers may have reported giving their baby follow-on formula when they had not, and vice versa). Mothers who said they did not know the difference between infant formula and follow-on formula were just as likely to say they had used follow-on formula as those who did.
Table 5.7
Table 5.8 shows that at Stage 2 of the survey, when babies were between four and six months old, 10% of mothers said they had given their baby follow-on formula. At Stage 3 of the survey, when babies were between eight and ten months, this had increased to 69% of all mothers. There were few differences by country, although at Stage 3, mothers in Scotland and Northern Ireland were less likely than mothers in England or Wales to have introduced follow-on formula.
Table 5.8 also shows that at Stage 2 mothers who had never worked were the most likely to say they had given their baby follow-on formula (19%), while mothers from managerial and professional occupations were the least likely to have done so (6%). However, by Stage 3 of the survey there was little difference by occupational group.
Table 5.8
The proportion of mothers using follow-on formula at Stage 2 has remained at the same level as in 2005 (11% in 2005, 10% in 2010), but it has increased since 2005 at Stage 3 (from 53% to 69%) (also shown in Table 5.8). This may reflect active marketing of follow-on formula in recent years. At Stage 1, nearly nine in ten mothers (89%) had seen advertising on television, radio or in a magazine or newspaper for baby milks and nearly four in five mothers (79%) said this was for follow-on formula.6
Table 5.9
Copyright © 2012, Health and Social Care Information Centre. All Rights Reserved. 9
Mothers who said they had ever given their baby follow-on formula were asked at what age they had first given it to their baby. Table 5.10 shows that a small proportion of mothers (7%) reported that they had first given their baby follow-on formula by three months, while 16% said they had done so by four months. Half of mothers (50%) said they had first given their baby follow-on formula by six months, while over two thirds (70%) had done so by nine months.
As mentioned above, it is recommended that follow-on formula is not introduced before six months. Mothers from routine and manual occupation groups and mothers who had never worked were most likely not to have not followed this recommendation and to have first given their baby follow-on formula at an early age. Thus, 27% of mothers who had never worked and 18% of mothers from routine and manual occupations had given their baby follow-on formula by four months compared with 12% of mothers from managerial and professional occupations.
Table 5.10
At Stage 2 of the survey, mothers who said they had ever given their baby follow-on formula were asked their reasons for giving their baby this type of milk; answers could either be picked from a prompted list or mothers could write in other reasons. As shown in Table 5.11, the most common reason given by mothers was that they thought it provided more nutrients for the baby or was better for the baby (18%). Other reasons commonly mentioned were that mothers were advised to do so by a doctor, health visitor or other health professional (17%) and experience with previous children (13%).
First-time mothers who had introduced follow-on formula at Stage 2 were more likely to say they had done so because they thought it provided more nutrients for the baby or was better for the baby (20% compared with 15% of mothers of second or later babies). They were also more influenced by friends or relatives (12%) and leaflets/information (11%) than mothers of second or later babies (5% for each). The primary reason for mothers of second or later babies giving their baby follow-on formula, was experience with previous children (27%).
Table 5.11
5.6 Liquid cow’s milk
At Stages 2 and 3 of the survey, all mothers were asked whether they had ever given their baby liquid cow‟s milk either as a feed or to mix with food. If mothers said they had given their baby liquid cow‟s milk most often in the last seven days, this was assumed to be their baby‟s main milk drink (apart from breastmilk). If liquid cow‟s milk had not been given most often in the last seven days, it was assumed that it had only been given as an occasional milk drink. As mentioned at the start of the chapter, it is not recommended to give liquid cow‟s milk as a drink until babies are a year old but it is acceptable to introduce liquid cow‟s milk to mix with food from six months.
At Stage 2 of the survey, only four per cent of mothers said they had ever given their baby liquid cow‟s milk. Half of these mothers (2%) used it to mix with solid food.
At Stage 3 of the survey, 42% of all mothers said they had ever given their baby liquid cow‟s milk. About three in ten (29%) had used liquid cow‟s milk to mix with food, while 24% had given their baby liquid cow‟s milk as an occasional drink. Only four per cent of mothers at Stage 3 said they had given liquid cow‟s milk as their baby‟s main milk (apart from breastmilk) in the last seven days.
Copyright © 2012, Health and Social Care Information Centre. All Rights Reserved. 10
The proportion of mothers giving their baby liquid cow‟s milk by Stage 3 was slightly higher than in 2005 (up from 39% to 42%). Its use also appears to have widened – the proportion giving liquid cow‟s milk as an occasional drink has increased from 19% to 24% and usage for mixing food has increased from 23% to 29%. Mothers were a little less likely to give liquid cow‟s milk as a main drink in 2010 than in 2005 (4% compared with 6% in 2005).
Mothers who said they were giving their baby liquid cow‟s milk as a main feed at Stage 3 were asked what type of milk they were using. Most mothers who were giving their baby liquid cow‟s milk as his or her main milk were using whole milk (3% of all mothers) and less than 0.5% of all mothers were using skimmed or semi-skimmed milk.
Mothers in Scotland were less likely than mothers in other countries to have given their baby liquid cow‟s milk at Stage 3 of the survey (37% compared with 42% overall). This was primarily due to Scottish mothers being less likely to give liquid cow‟s milk as an occasional drink (21% compared to 24% of all mothers). This may reflect different public health policies and promotion activities in relation to infant feeding and nutrition information between countries.
Table 5.12
Mothers who had introduced liquid cow‟s milk as a drink at Stage 3 were asked at what age they had first given their baby such milk. Table 5.13 shows the age at which mothers first used liquid cow‟s milk and when they first used it as a main drink. It shows that usage of liquid cow‟s milk was very low before babies were six months old. By six months of age, 11% of mothers had given their baby liquid
cow‟s milk, rising to 27% at nine months7. However, only three per cent of mothers had given their
baby liquid cow‟s milk as his or her main milk feed by nine months.
Table 5.13
5.7 How mothers make up formula feeds
Powdered infant formula is not a sterile product and can be contaminated with micro-organisms such as enterobacter sakazakii and salmonella, which can cause serious illness. Younger babies and infants are likely to be more susceptible to these organisms than older infants, and it is recommended that premature and low birth weight babies should be given liquid ready-to-feed formula instead, as this is sterile. However, ready-to-feed formula is more expensive than powdered formula and is likely to be beyond the reach of most families as a main feed. It is also open to manufacturing or quality control problems as with any formula. It only avoids the problems of making up powdered formula.
Because of this concern, the correct preparation and handling of powdered formula is important and the Food Standards Agency and all the UK health departments have issued guidance about the safe preparation, storage and handling of powdered infant formula. The guidance was first issued in 2005, but it did not come out at the same time in all countries and some publications were still being updated at the time of Stage 1 fieldwork in 20058.
Beyond points of basic hygiene the key recommendation for making and storing powdered infant formula are as follows:
Copyright © 2012, Health and Social Care Information Centre. All Rights Reserved. 11
Feeds should be made up with boiled water that has been allowed to cool to no less than 70oC. In practice this means the feed should be made within 30 minutes after the water has boiled;
When making the feed the boiled water should be added to the bottle first, followed by the correct amount of powdered formula;
Once the feed is prepared it should be cooled as quickly as possible to feeding temperature; and
Ideally, powdered formula should be made up fresh for each feed rather than being stored. Although not ideal, feeds can be made up and stored below 5°C for a maximum of 24 hours.
In addition to these guidelines for preparing feeds in the home, it is recommended that if mothers need to feed their baby when out of the home they should make up fresh feeds as needed following the steps outlined above. For example, it is suggested that mothers may consider carrying a flask of just boiled water with them when they are away from the home. Alternatively, mothers may wish to use a liquid ready-to-feed formula when outside the home since these are sterile products.
In order to assess the extent to which mothers follow the main recommendations on the preparation and storage of powdered formula, mothers at Stage 1 who had used formula in the last seven days were asked a series of questions about how they prepared formula, both in the home and away from the home.
5.7.1 Preparing formula in the home
Table 5.14 shows that over seven in ten mothers who had used infant formula in the last seven days reported that they followed the recommended practices of either making up one feed at a time as they needed it (65%) or only using ready-to-feed formula (7%). The proportion of mothers making up one feed at a time has increased substantially since 2005, when only 25% were doing so (5% were only using ready-to-feed formula). A quarter of mothers (26%) who used infant formula in the last seven days said they usually made up several feeds at a time and stored them (compared with 69% in 2005). The increase in the proportion of mothers following recommended practices since the 2005 survey may be linked to the fact that the guidance was relatively new in 2005, as mentioned earlier in this section.
Mothers in Northern Ireland were most likely to follow these guidelines (76%), while mothers in Scotland were least likely to do so (67%).
Table 5.14
Focusing on mothers who had used powdered formula in the previous seven days, just over seven in ten (71%) followed recommended practice of making up one feed at a time. Mothers who were most likely to only make up one feed at a time as they needed it included mothers who had never worked (80%), mothers in the most deprived quintile (75%) and mothers from Asian (97%), Chinese or other (94%) or Black (92%) ethnic groups.
Table 5.15
Copyright © 2012, Health and Social Care Information Centre. All Rights Reserved. 12
As mentioned earlier, it is recommended that feeds are made using boiled water that has been allowed to cool to no less than 70oC. Since it was not considered feasible to ask mothers about the temperature of the water they used, all mothers were asked about how much time they usually left between the water boiling and making up the feed.
Table 5.16 shows that across the UK, over two-thirds of mothers (71%) who had made up powdered formula in the last seven days were following the recommendations by using water that had been left to cool for 30 minutes or less. This is an increase since 2005, when 59% did so. Mothers in Northern Ireland were the most likely to follow this recommendation on water temperature (77%), but findings for all countries were broadly similar.
Table 5.16
Table 5.17 shows that the majority of mothers (95%) who had made up powdered formula in the last seven days followed the guidelines by usually putting the water in the bottle first and then adding the powder, whilst five per cent put the powder in first. This was very similar to 2005 when 94% of mothers followed the guidelines and put water in the bottle first.
There was little difference in how mothers in different countries made up powdered formula in terms of adding the water or powder to the bottle first, although mothers in Northern Ireland were again the most likely to have followed the guidelines (97%).
Table 5.17
Combining all the information collected about how mothers usually make up powdered feeds, it is possible to calculate the proportion of mothers who were correctly following the guidelines. Table 5.18 shows that almost half (49%) of all mothers who had made up powdered formula in the last seven days followed all three recommendations of only making one feed at a time, making feeds within 30 minutes of the water boiling, and adding the water to the bottle before the powder. This is a substantial increase on the proportion of mothers following all three guidelines in 2005 (13%), and is likely to be primarily due to the increase in the proportion of mothers only making up one feed at a time (as discussed earlier in this section). Mothers in Northern Ireland were the most likely to have followed all three recommendations (58%), while mothers in Scotland were the least likely to have done so (45%).
Since making only one feed at a time is considered to be the ideal and it is acceptable to store formula for 24 hours under the correct conditions it is also useful to examine the proportion of mothers who at least followed the two key recommendations of making feeds within 30 minutes of the water boiling and adding the water to the bottle before the powder.
Table 5.18 shows that across the UK, 66% of mothers who had made up powdered formula in the last seven days had followed both of these recommendations. This is also an increase since 2005, when 54% followed both recommendations, although not as marked as for the proportion following all three. Again, mothers in Northern Ireland were the most likely to have followed both recommendations (73%); mothers in England were the least likely to have done so (65%).
Table 5.18 also shows that mothers who were the most likely to follow all three recommendations or both key recommendations on preparing powdered formula included mothers aged under 20 (63% and 81% respectively), mothers who had never worked (64% and 75% respectively), mothers in the
Copyright © 2012, Health and Social Care Information Centre. All Rights Reserved. 13
most deprived quintile (57% and 72% respectively) and mothers from a Black (72% and 74% respectively) ethnic background.
Table 5.18
5.7.2 Preparing formula away from the home
As mentioned earlier, when mothers need to feed their baby away from the home, the recommended options are either to use ready-to-feed formula or to make up feeds using previously boiled water, for example, carrying boiled water in a flask. However, it is recognised that in some circumstances mothers may have no alternative to making up feeds before they leave home. In these circumstances it is recommended that the feeds are chilled before transportation and kept chilled when out. When the feeds are required they should be heated to the required temperature and used immediately.
Table 5.19 shows how mothers who had made up powdered formula in the last seven days usually prepared feeds when they had to feed their baby away from the home (recommended practices are indicated in bold in the table). This shows that across the UK, 31% of mothers said they never used powdered feeds away from the home, either because they breastfed, because they used ready-to-feed formula, or because they never fed their baby outside the home. This is an increase of 11 percentage points since 20059.
Over a third of mothers who had made up powdered formula in the last seven days (37%) usually made up feeds while they were out, while just under a third (32%) made up feeds before leaving the house. Mothers who made up feeds while they were out were fairly evenly split between those who used cold or chilled water (19%) and those who used hot water (18%). Mothers who made up feeds before leaving the home were also fairly evenly split between those who kept the feed chilled while they were out (15%) and those who did not (17%).
Overall, this means that almost two thirds of mothers (65%) who had made up powdered formula in the last seven days were following the recommendations for feeding away from the home (either not using powdered formula – or doing so correctly, making up feeds with hot water or keeping pre-prepared feeds chilled), whilst the remainder (35%) were not doing so.
Relative to 2005, a greater proportion of mothers made up feeds while they were out (37% compared with 12% in 2005) and conversely, many fewer made up feeds before leaving the home (32% compared with 65% in 2005). This is in line with the earlier findings shown in Table 5.14. The proportion following recommendations for preparing powdered formula feeds or not using powdered feeds away from home was similar (63% in 2005 compared with 65% in 2010).
The way in which mothers made up powdered formula feeds away from the home was broadly similar across countries, except for Wales, where the proportion not following the guidelines was slightly higher (39% compared with 35% overall).
Table 5.19
Copyright © 2012, Health and Social Care Information Centre. All Rights Reserved. 14
5.8 Methods used to sterilise bottles
For the first time in 2010, all mothers10 were asked at Stage 1 if they had ever used a bottle to feed their baby and what methods they usually used to sterilise bottles. Across the UK, four in five mothers (80%) said that they had used a bottle to feed their baby. Usage was highest in Northern Ireland (87%), which is likely to be linked with the lower incidence of breastfeeding in that country (as discussed in Chapter 2), and lowest in England (79%).
Table 5.20
Steam sterilisers were most commonly used for sterilising bottles (67%), followed by sterilising in a microwave (16%) and soaking in sterilising solution (9%). Sterilising in a microwave is not a recommended method but some steam sterilisers are designed for use in a microwave which may account for some of the mothers who stated that this was the method they used.
Table 5.21
Copyright © 2012, Health and Social Care Information Centre. All Rights Reserved. 15
Notes and references
1 Also see the Department of Health website:
http://www.dh.gov.uk/en/Publichealth/Nutrition/Nutritionpregnancyearlyyears/DH_127640 2 See p50 of “Infant Milks in the UK”, a report published in 2011 by the Caroline Walker Trust
http://www.cwt.org.uk/pdfs/infantsmilk_web.pdf 3 See NHS Choices „Types of infant formula‟ webpage http://www.nhs.uk/Conditions/pregnancy-and-baby/Pages/types-of-
infant-formula.aspx 4 See Chapter 2, Table 2.1.
5 The questionnaire did not seek to verify whether or not mothers correctly knew the difference.
6 The question asked in 2005 is not directly comparable. Sixty-two per cent said they had seen advertising of infant
formula, but the wording was changed in 2010 since advertising is only permitted for formula for babies aged 6 months or older. 7 At Stage 3, mothers who said they had ever given cow‟s milk as a drink were asked when they had first given it. It is
possible that some mothers may have been referring to giving cow‟s milk to mix with food. 8 Food Standards Agency and Department of Health: Guidance for health professionals on safe preparation,
storage and handling of powdered infant formula, November 2005. http://www.food.gov.uk/multimedia/pdfs/formulaguidance.pdf
The Department of Health updated the „Birth to Five‟ publication in May 2005 and the Bottle Feeding leaflet in November 2005. In 2005, Stage 1 fieldwork took place between October and December. 9 See the 2005 Infant Feeding Survey Report, Chapter 5, Table 5.24 http://www.ic.nhs.uk/pubs/ifs2005
10 All mothers were asked about their usage of bottles since those who were exclusively breastfeeding could be using a
bottle to feed their baby expressed breastmilk.
Copyright © 2012, Health and Social Care Information Centre. All Rights Reserved. 1
6. Feeding and health after the early weeks
Key findings
By Stage 3 (when babies were around eight to ten months old), nearly seven in ten mothers who breastfed initially (68%) reported that they had experienced problems as a result of breastfeeding (after prompting with specific types of problem) at some point since their baby was born. The most frequently mentioned problems were engorgement (36%), worry over not having enough milk (35%) and the baby having difficulty taking the breast or sucking effectively (21%).
Over three in five mothers at Stage 3 who breastfed initially (62%) reported (after prompting) that they had experienced breast or nipple pain while breastfeeding at some point since their baby was born.
At Stage 2 (when babies were around four to six months old) 12% of all mothers had experienced problems feeding their baby in the period between Stages 1 and 2. At Stage 3, 8% of all mothers had experienced feeding problems between Stages 2 and 3.
At Stage 2 the most commonly reported problems were a perception that their baby was not feeding sufficiently well (18% of mothers who reported experiencing problems); the baby being ill (11%); vomiting or reflux (10%) and not having enough breastmilk (10%). At Stage 3, mothers were most likely to report problems relating to the introduction of solids (37% of mothers experiencing problems in this period).
Three-quarters (75%) of mothers at Stage 2 who had experienced problems had received help or information (a decrease since 2005, when the proportion was 83%) and nearly two-thirds of mothers at Stage 3 (65%) had received help (compared with 71% in 2005).
Of the mothers who had stopped breastfeeding by Stage 3, over three in five (63%) said that they would have liked to have breastfed for longer. This was a decrease since 2005 (73%), suggesting that more mothers were able to follow their own feeding preferences in 2010.
The most common reasons for stopping breastfeeding in the first week were problems with the baby rejecting the breast or not latching on properly (27%), having painful breasts or nipples (22%) and feeling that they had ‘insufficient milk’ (22%).
The proportion of mothers citing ‘insufficient milk’ as a reason for stopping breastfeeding increased to a peak of 39% at six weeks to four months , then fell to 23% at six to nine months. This was also the most frequently mentioned reason for stopping breastfeeding overall (reported by 31% of mothers who had stopped breastfeeding by Stage 3). However, this represents a decrease since 2005 when this reason was cited by 39% of mothers.
Seventy-two per cent of mothers at Stage 2 and 79% at Stage 3 reported that their baby had suffered from any type of health problem. However, only a small proportion of babies had had to stay overnight in hospital as a result of a health problem (9% at Stage 2 and 10% at Stage 3).
Common health problems suffered by babies by Stage 3 were constipation (44%), colic (42%), sickness or vomiting (39%) and diarrhoea (39%).
Babies who were exclusively breastfed for a minimum of four months were considerably less likely than babies who were never breastfed to suffer from diarrhoea (25% compared with 45% of those who were never breastfed), constipation (32% compared with 48%) and sickness or vomiting (29% compared with 41%).
Nearly all mothers (96%) had seen a health visitor by Stage 1 of the survey (when babies were four to ten weeks old).
By Stage 2 and 3, the majority of mothers took their baby to a Child Health Clinic, Children’s Centre or GP for regular check-ups or to be weighed (88% at Stage 2 and 82% at Stage 3).

Copyright © 2012, Health and Social Care Information Centre. All Rights Reserved. 2
However, the frequency of visits declined as the baby grew older (70% were visiting once a month at Stage 2, declining to 49% at Stage 3).
Copyright © 2012, Health and Social Care Information Centre. All Rights Reserved. 3
Previous chapters have explored some of the characteristics of breast and formula-feeding mothers and feeding problems they experienced in the early weeks. This chapter explores feeding and health issues beyond the initial weeks. The first part of the chapter discusses feeding problems encountered after the first stage of the survey, sources of support during this time and reasons for stopping breastfeeding. Later in the chapter, health problems experienced by babies and whether any health issues resulted in an overnight stay in hospital are covered. Finally it looks at routine contact with health professionals over the later weeks such as visits to child health clinics.
6.1 Problems experienced with feeding in later months
Problems experienced with milk feeding in the first few weeks have been reported in Chapter 4. At later stages of the survey, mothers were asked about further problems with feeding, the nature of problems experienced and the extent to which they received information or help with their problem.
At Stages 2 and 3, mothers were asked to report any problems experienced since completing the previous questionnaire. Thus the periods of reference are approximately between four to ten weeks and four to six months and between four to six months and eight to ten months. Twelve per cent of all mothers at Stage 2 had experienced problems feeding their baby in the period between Stages 1 and 2, which is in line with 2005 (also 12%). At Stage 3, 8% of all mothers had experienced feeding problems between Stages 2 and 3, which is also in line with 2005 (9%).
Table 6.1
Mothers who had encountered feeding problems were asked (in an open format question) about the nature of these problems. Responses were later coded into categories.
Problems encountered in the first few months (between about four to ten weeks and four to six months) included a perception that their baby was not feeding sufficiently well (18% of those experiencing problems); the baby being ill (11%); vomiting or reflux (10%); not having enough breastmilk (10%) and linked to this, needing to top up with formula (9%). Nine per cent of mothers also reported that breastfeeding was uncomfortable or painful.
By the later stages (between about four to six and eight to ten months), the key source of difficulties related to the introduction of solids (37% of mothers experiencing problems in this period) and a further 10% mentioned that their baby had to be started on solids. Further detail on problems experienced when weaning to solids can be found in Chapter 8. The baby not feeding properly (18%) and being ill (14%) continued to be common issues, but the other problems mentioned at Stage 2 had abated. Teething had become more of an issue by Stage 3 – it was mentioned by 12% of mothers experiencing problems (compared with 3% at Stage 2).
Table 6.2
6.1.1 Pain and problems associated with breastfeeding
In a departure from previous surveys, mothers who had breastfed their baby at least initially were asked in more detail about problems experienced while breastfeeding. Firstly, they were asked if they had experienced nipple or breast pain since their baby was born as a result of breastfeeding and secondly, whether they had ever experienced specific problems as a result of breastfeeding.
Copyright © 2012, Health and Social Care Information Centre. All Rights Reserved. 4
Over three in five mothers at Stage 3 had experienced breast or nipple pain while breastfeeding (62%) at some point since their baby was born. Around a third had experienced sore nipples which were damaged, cracked or bleeding (34%), while over a quarter had had sore nipples with no obvious damage (26%). Around three in ten reported that they had had painful breasts (31%).
Mothers who breastfed for less than two weeks were the least likely to have experienced any pain as a result of breastfeeding (54%). Likelihood of experiencing any breast or nipple pain increased with duration of breastfeeding (with the peak being for mothers who breastfed for four to six months – of whom 70% had experienced pain). The longer a mother breastfed, the greater the window of opportunity she had to experience some type of pain as a result of breastfeeding. It should be borne in mind that some mothers who breastfed for less than two weeks will have had little time to have experienced pain as a result of breastfeeding.
Looking in more detail at the type of pain mothers experienced, the overall pattern observed by duration of breastfeeding was most evident for experience of sore nipples with no obvious damage (18% less than two weeks, compared with 29% for four to six months and six months or more). However, duration of breastfeeding did not appear to play as great a role for the other types of pain. For example, mothers who breastfed for four to six months were a little more likely to suffer from sore nipples which were damaged, cracked or bleeding (37%), but otherwise there was no variation by duration. Other than for mothers with the least experience of breastfeeding (25% for those breastfeeding for less than two weeks compared with 31% overall), there was not a clear pattern by duration of breastfeeding for experience of painful breasts.
Table 6.3
Table 6.4 shows that nearly seven in ten mothers (68%) at Stage 3 reported that they had experienced problems as a result of breastfeeding at some point since their baby was born. Mothers were prompted with a range of different problems and were also able to record other problems not listed, which were later coded into categories.
The most common problems experienced by mothers by Stage 3 were engorgement (36%) and worry over not having enough milk (35%). Other frequently mentioned problems were the baby having difficulty taking the breast or sucking effectively (21%); blocked milk ducts (14%); and mastitis (12%). It is worth nothing that this question was also asked in Stage 2 and findings were almost identical to Stage 3.
The higher figures shown in Tables 6.3 and 6.4 relative to Table 6.2 are likely to be due to the fact that these problems are more likely to have been experienced in the early weeks (see Chapter 4 for further discussion on problems experienced at this stage) and also because mothers were specifically prompted about pain and problems experienced. For example, 10% of mothers reporting problems between Stage 1 and Stage 2 said they did not have enough breastmilk, compared with 35% of all mothers who said they had worried over not having enough milk at some point since their baby was born. Nine per cent of mothers reporting problems between Stage 1 and Stage 2 reported that breastfeeding was uncomfortable or painful, compared with 62% reporting they had experienced breast or nipple pain at some point since their baby was born (see Table 6.3).
As with breast or nipple pain, mothers who breastfed for four to six months were most likely to experience problems of any sort (77%) and those who breastfed for less than two weeks were least likely to have done so (55%). Seventy per cent of those who breastfed the longest (six months or more) had problems, which was slightly above average (68%).
Copyright © 2012, Health and Social Care Information Centre. All Rights Reserved. 5
The nature of problems experienced varied by duration of breastfeeding, however. The likelihood of having had engorgement, mastitis or blocked milk ducts increased with duration (for example, 46% of mothers breastfeeding for six months or more experienced engorgement, compared with 20% of those breastfeeding for less than two weeks). In contrast, those who breastfed for two weeks or less were the most likely to have had problems with their baby taking to the breast, with this problem being reported less as duration increased (31% of mothers who breastfed for less than two weeks and 14% for mothers who breastfed for six months or more).
Worry over having enough milk was most acute among those who breastfed for between six weeks and six months (44% of mothers who breastfed for six weeks to four months and 43% of mothers who breastfed for four to six months). It was lowest among those who breastfed for less than two weeks (29%), followed by those who breastfed for six months or more (32%).
Table 6.4
6.2 Help and information with feeding problems
Mothers who reported feeding difficulties (as discussed at the start of section 6.1) were asked whether they had received any help or information with their problem. Three-quarters of mothers at Stage 2 said that they had received help with a problem experienced in the period between Stages 1 and 2 (75%). At Stage 3, just under two-thirds reported they had received help with a problem in the period between Stages 2 and 3 (65%). This is a decrease since 2005, when 83% received help at Stage 2 and 71% did at Stage 3. This may be linked to staffing problems, for example, there has been a decrease in the number of health visitors.
The most frequently used sources of help or information were similar at both stages1. The most common source was the health visitor (52% at Stage 2 and 49% at Stage 3). A similar proportion referred to their doctor/GP at Stage 2 (49%), although fewer mothers turned to their doctor at Stage 3 (33%). Other key sources used by mothers were their partner, friend or relative (20% at Stage 2 and 26% at Stage 3) and the SureStart or Children’s Centre or Children’s Health Clinic (16% at Stage 2 and 17% at Stage 3). Perhaps reflecting the lower usage of the GP at Stage 3, the proportion mentioning each of these at Stage 3 increased, relative to Stage 2.
Potentially linked to the point made above, mothers were much less likely to have received help or information from a health visitor at both Stages 2 and 3 in 2010 than in 2005 (76% at Stages 2 and 3 in 2005 reducing to 52% and 49% at Stages 2 and 3 in 2010). Having said that, some of the decrease could also have been due to mothers seeing a health visitor at a SureStart, Children’s Centre or Children’s Health Clinic (16% received help from this source in 2010, compared with a negligible proportion using SureStart in 2005). Mothers were more likely to have used their GP at Stage 2 (49% in 2010 compared with 38% in 2005), although there was less difference at Stage 3 (33% in 2010 and 30% in 2005). In terms of informal sources of information, mothers relied more on the internet/web based resources in 2010 than 2005 and less on their partner, friend or relative or printed materials; at Stage 2 in 2010, 16% used the internet (1% at Stage 2 in 2005), 20% turned to their partner, friend or relative (36% in 2005) and 5% used books, leaflets or magazines (10% in 2005).
Table 6.5
Copyright © 2012, Health and Social Care Information Centre. All Rights Reserved. 6
6.3 Reasons for stopping breastfeeding after the early weeks
Chapter 2 showed that 14% of women in the UK who breastfed initially had stopped within one week and 19% had stopped within two weeks. After the initial two weeks (which have been considered in some detail in Chapter 4), the rate of giving up breastfeeding slowed: 68% of mothers who had started breastfeeding were still doing so when their babies were six weeks old and 42% continued for six months or more. This section looks at the reasons given by women for stopping breastfeeding, whether they would have liked to have breastfed for longer and what would have helped them to do so.
Mothers who had stopped breastfeeding in the survey period were asked why they had stopped. The reasons mothers gave were collected in an open format and later coded into categories. The most frequently mentioned reason was having insufficient milk, reported by 31% of mothers at Stage 3. This represents a decrease since 2005 when this problem was cited by 39%2 of mothers who had stopped breastfeeding by Stage 3.
Other common reasons for stopping breastfeeding were problems with the baby rejecting the breast or not latching on properly (19%), having painful breasts/nipples (12%), the baby feeding too often/being constantly hungry (10%) and breastfeeding taking too long / being too tiring (8%).
Reasons for stopping breastfeeding varied according to duration. The most common reasons for stopping breastfeeding in the first week were problems with the baby rejecting the breast or not latching on properly (27%), having painful breasts or nipples (22%) and insufficient milk (22%).
The first two problems gradually decreased during the later weeks and months. However, the proportion of mothers citing insufficient milk as a reason for stopping breastfeeding increased to a peak of 39% at six weeks to four months, then fell to 23% at six to nine months. Similarly, the baby feeding often/being constantly hungry was reported as the reason for stopping by five per cent of mothers who breastfed for less than a week, rising to 13% of mothers who breastfed for six weeks to six months and then falling to eight per cent of mothers who breastfed for six to nine months.
Some reasons for stopping breastfeeding only became an issue for mothers who breastfed for a longer period. Although returning to work or college was cited as the reason for stopping by six per cent of mothers overall, this increased to 13% among mothers who breastfed for four to six months and 20% of mothers who breastfed for six to nine months.
Table 6.6
6.3.1 Whether mothers would have liked to have breastfed for longer and what would have helped them to do so
In addition to being asked about reasons for stopping breastfeeding, mothers were also asked about whether they would have liked to have breastfed for longer and, if so, whether any further help or support might have helped then to do this.
Overall, 63% of mothers who stopped breastfeeding during the survey period said they would have liked to have breastfed for longer, while 26% said they breastfed for as long as they intended and 7% said they breastfed for longer than they intended. Fewer mothers said they would have liked to have breastfed for longer than in 2005 (63% compared with 73% in 2005), suggesting that more mothers
Copyright © 2012, Health and Social Care Information Centre. All Rights Reserved. 7
were able to follow their own feeding preferences in 2010. The fact that more mothers breastfed for longer in 2010 than in 2005 (as discussed in Chapter 2), may also explain why fewer felt they would have liked to have breastfed for longer than they did.
The earlier mothers stopped breastfeeding the more likely they were to say they would have liked to have breastfed for longer; 81% of mothers who breastfed for less than a week and 86% of mothers who breastfed for between one and two weeks said they would have liked to have breastfed for longer, compared with 34% of mothers who breastfed for between six and nine months.
The groups most likely to say they had breastfed for as long as they intended to were those who breastfed for between four and six months and between six and nine months (46% for both). In contrast, only 13% of mothers who breastfed for less than a week said they had done so for as long as they intended, indicating that this early discontinuation remains a problem for mothers.
Compared with older mothers, younger mothers were less likely to be content with the period they breastfed for (70% of those aged under 20 and 71% of those aged 20 to 24, compared with 59% of those aged 35 or over). This was also the case for first-time mothers, who were more likely than mothers of second or later babies to say they would have liked to have breastfed for longer (66% and 61% respectively). This is likely to reflect the fact that younger mothers, and to a lesser extent, first time mothers tended to breastfeed for a shorter period than other mothers (as discussed in Chapter 2).
Table 6.7
The main factors that could have influenced mothers to breastfeed for longer were:
More support and guidance from hospital staff, midwives and family (17%)
If the baby could have latched on the breast easier (17%)
Naturally producing more milk (15%)
Less pain / being more comfortable (10%)
These are similar to the issues mentioned by mothers in Chapter 4 and reflect the fact that a sizeable proportion of mothers stopped breastfeeding in the early weeks. They also mirror the reasons mothers gave for stopping breastfeeding, as discussed earlier in this section. As identified by mothers themselves, most problems with breastfeeding can be prevented or treated with the right support and information; this could reduce the number of mothers stopping breastfeeding before they wanted to in the future.
There was some variation in the factors which would have helped mothers breastfeed longer by duration of breastfeeding. Mothers stopping breastfeeding when their baby was less than two weeks old (who would have liked to have breastfed for longer) would have particularly valued more support and guidance (27% for less than one week; 21% for one to two weeks) and were also most likely to mention difficulties with latching the baby on to the breast (20% and 17% respectively) and pain (13% and 16% respectively). These factors decreased with duration. Linked to the findings for reasons for stopping breastfeeding, ‘naturally producing more milk’ was most likely to be mentioned as a factor between six weeks and six months (19% for six weeks to four months; 20% for four to six months). Although not mentioned by many mothers who would have liked to have breastfed for longer overall (6%), mothers who breastfed the longest (six to nine months) were considerably more likely to mention that having more time to feed would have helped them to continue breastfeeding (22%),
Copyright © 2012, Health and Social Care Information Centre. All Rights Reserved. 8
indicating that practical / logistical factors were more significant for this group than problems relating to breastfeeding in their decision to stop.
Table 6.8
6.4 Dummy usage
For the first time in 2010, mothers were asked at Stage 2 of the survey if their baby had used a dummy and at what age their baby had started using a dummy. Over half (54%) of mothers were giving their baby a dummy at Stage 2, when babies were four to six months old. A further 10% of babies had previously used one. Dummy usage was higher among mothers who had never breastfed (81%) compared with those who had breastfed (59%).
A third (33%) of mothers started giving their baby a dummy at the age of one to two weeks, rising to over half of mothers (56%) by the time babies were eight weeks old. Mothers who had never breastfed their baby tended to introduce a dummy sooner than those who had breastfed. Over half (55%) of mothers who did not breastfeed had introduced a dummy by the time their baby was two weeks old, compared with just over a quarter (27%) who breastfed at least initially. By the time babies were 8 weeks old, 74% of mothers who did not breastfeed and 50% of those who did had introduced a dummy. The UK health departments and UNICEF Baby Friendly Initiative3 recommend that dummies should not be introduced to breastfed babies until breastfeeding is established (usually when babies are around six to eight weeks old), as it can interfere with breastfeeding.
Table 6.9
6.5 Health problems with the baby
The UK health departments recommend that mothers should breastfeed exclusively up until their baby reaches six months, and continue to breastfeed (alongside giving solid foods) for as long as the mother and baby wish4 5: research has shown that breastmilk helps build immunity to infection and can reduce the risk of many health conditions in babies including gastroenteritis (vomiting and diarrhoea), ear infections and chest infections. It has also been shown that the risk of many of these conditions declines in line with the duration and exclusivity of breastfeeding; i.e. there is a dose-response effect.6
It is therefore of interest to measure the extent to which babies had suffered from these and other health conditions, and to relate prevalence of baby illnesses to incidence and duration of breastfeeding. As an indicator of the severity of the illness, for the first time in 2010, mothers were asked if any of the health problems their baby had experienced had resulted in an overnight stay in hospital.
Copyright © 2012, Health and Social Care Information Centre. All Rights Reserved. 9
6.5.1 Prevalence of health conditions at different ages
Seventy-two per cent of mothers at Stage 2 and 79% at Stage 3 reported that their baby had suffered from a health problem. In total 87% of mothers reported their baby had suffered from a health problem at either Stage 2 or Stage 3. A variety of health problems were mentioned by mothers.
By the time babies were about four to six months old, 35% of mothers reported that their baby had had colic or painful wind, 28% mentioned constipation, 20% mentioned sickness or vomiting, 18% mentioned diarrhoea and 13% mentioned chest problems or infections.
By Stage 3, the rate at which babies were suffering from the above conditions (apart from colic/wind) rose (36% of mothers reported their baby having suffered from constipation, 33% mentioned diarrhoea, 33% sickness or vomiting, and 18% chest problems or infections). Thrush (11%), failure to gain sufficient weight (10%) and ear infections (8%) were other conditions mentioned by Stage 3 mothers.
Taking both Stages 2 and 3 together, the most frequently reported problems mentioned at either Stage 2 or Stage 3 were constipation (reported by 44% of mothers at either Stage 2 or Stage 3), colic/wind (42%), sickness or vomiting (39%), diarrhoea (39%), and chest problems or infections (23%).
Table 6.10
Only small proportions of babies had had to stay overnight in hospital as a result of a health problem (9% at Stage 2 and 10% at Stage 3). By Stage 3, a stay in hospital was most common for chest problems/infections (3%) and sickness or vomiting (2%).
Table 6.11
6.5.2 Association between baby health conditions and breastfeeding
As discussed earlier, the risk of a number of health conditions declines in line with the duration and exclusivity of breastfeeding. This section begins, therefore, by comparing the two extremes – those who had never breastfed and those who breastfed exclusively for four months or more (as discussed in Chapter 2, 19% and 12% of all mothers respectively) - before going on to look at the influence of duration of breastfeeding.
Mothers who breastfed exclusively for four months or more were considerably less likely to report that their baby had suffered from diarrhoea (25% compared with 45% of those who never breastfed), constipation (32% compared with 48% respectively) and sickness or vomiting (29% compared with 41% respectively). Babies who were exclusively breastfed for four months or more were also less likely to suffer from colic/painful wind (32% compared with 41% respectively) and thrush (10% compared with 18% respectively). Although less marked, there was also a reduced likelihood of suffering from ear problems or infections (7% compared with 11% respectively). The only problem that babies who were exclusively breastfed for four months or more were more likely to have experienced was not gaining enough weight (13% compared with 8% of those who were never breastfed). There was no significant difference between the two groups in the likelihood of experiencing chest problems or infections.
Copyright © 2012, Health and Social Care Information Centre. All Rights Reserved. 10
In considering the findings by duration of breastfeeding, it should be borne in mind that by the time babies were two weeks old, 66% of mothers were breastfeeding, but only 40% were doing so exclusively. By six weeks, 55% were still breastfeeding, but only 23% were doing so exclusively. At four months, the prevalence of breastfeeding and exclusive breastfeeding had dropped to 42% and 12% respectively (see Chapter 2 for further details). Thus, health problems analysed by duration of breastfeeding will be seriously confounded by the fact that the majority of mothers after the early weeks were not breastfeeding exclusively, which will have had an impact on the extent to which babies were protected from infection.
Looking at the most common baby health problems experienced at either Stage 2 or Stage 3 of the survey, there was a gradual decline in some health problems as duration of breastfeeding increased, indicating a dose response effect even for those who were not breastfeeding exclusively. Fifty-seven per cent of those who breastfed for less than two weeks said their baby had been constipated, falling to 36% of mothers who breastfed for 6 months or more. The same pattern was true of those reporting their baby had suffered from colic (reported by 49% of those breastfeeding for two weeks or less, compared with 38% of those who breastfed for six months or more) and diarrhoea (49% falling to 28% respectively). Babies who were breastfed for less than four months were also more likely to suffer from sickness or vomiting than those who were breastfed for longer (for example, 44% less than two weeks, compared with 34% six months or more).
Eight per cent of mothers who had never breastfed and 11% of mothers who breastfed for less than two weeks reported that their baby had not gained enough weight. The rate increased to 20% among those who breastfed their baby for between four and six months, and then decreased to 16% among those who had breastfed their baby for six months or longer. This may be linked with the findings discussed earlier relating to ‘insufficient milk’, or with mothers’ and health professionals’ interpretation of weight gain. Revised growth charts for infants, based on a reference population of breastfed babies, were introduced across the UK in 20097. Previous charts were based on a reference group of babies who were predominantly formula fed; babies fed on formula show faster growth rates, which may contribute to later obesity8.. The slower, more physiological, growth rate for breastfed babies may, however, be interpreted by some parents as a cause for concern. Health professionals may also become unduly concerned if they have not been trained in the use of the new growth charts9.
As mentioned earlier, there was no significant difference in the likelihood of suffering from chest problems or infections between babies who were exclusively breastfed for four months, and those who were never breastfed. However, babies who were breastfed for only between two and six weeks were most likely to have had a chest infection (29%).
Overall, the survey results generally support the information given to mothers about the health benefits of breastfeeding for the baby, with the exception of chest problems or infections.
Table 6.12
Copyright © 2012, Health and Social Care Information Centre. All Rights Reserved. 11
6.6 Routine contact with a health professional
This section covers the experience of mothers in relation to routine contact with health professionals, including health visitor visits after the baby was born and visits to Child Health Clinics.
At Stage 1, mothers were asked whether a health visitor had been to see them since their baby was born and, if so, how old their baby was at the first visit. Nearly all mothers (96%) had seen a health visitor by the time they completed the questionnaire – that is when babies were about four to ten weeks. This proportion did not vary by country, but it does represent a slight drop since 2005, when 99% of mothers had seen a health visitor. On average, babies were seen by the health visitor at roughly two weeks old (14.1 days). Again, there was little variation by country.
Table 6.13
At later stages of the survey, mothers were asked how frequently they took their child to a Child Health Clinic, Children’s Centre or GP for regular check-ups or to be weighed.
At both Stages 2 and 3 the majority of mothers were taking their babies to see one of these health professionals (88% at Stage 2 and 82% at Stage 3). This was higher at both stages than in 2005 (85% at Stage 2; 76% at Stage 3 in 2005). By country, mothers in Wales were the most likely to be attending routine check-ups (90% at Stage 2 and 87% at Stage 3), while mothers in Northern Ireland were the least likely (72% at Stage 2 and 65% at Stage 3).
Babies were taken to see a health professional less regularly as they got older. At Stage 2 of the survey, seven in ten mothers (70%) were taking their baby to a Child Health Clinic, Children’s Centre or GP at least once a month. This proportion dropped to half (49%) of mothers at Stage 3. Compared with other countries, mothers in Northern Ireland were making less frequent trips to such clinics at both stages of the survey (at Stage 2, 27% visited less than once a month compared with 17% for the UK overall; at Stage 3, the equivalent proportions were 42% and 33% respectively).
Table 6.14
Copyright © 2012, Health and Social Care Information Centre. All Rights Reserved. 12
Notes and references
1 At Stage 2, this related to the period between completing the Stage 1 and Stage 2 questionnaire. At Stage 3, this related
to the period between completing the Stage 2 and Stage 3 questionnaire. 2 Please see 2005 Infant Feeding Report for 2005 data.
3 See Step 9 of the UNICEF Baby Friendly Initiative’s Ten Steps to Successful Breastfeeding
http://www.unicef.org.uk/Documents/Baby_Friendly/Guidance/Implementation%20Guidance/Step_9_Implementation.pdf?epslanguage=en 4 Department of Health (2003) Infant feeding recommendation (London: DH)
http://www.dh.gov.uk/prod_consum_dh/groups/dh_digitalassets/@dh/@en/documents/digitalasset/dh_4096999.pdf 5 More specifically, the WHO recommends continued breastfeeding along with appropriate complementary foods up to two
years of age or beyond. 6 See Chapter 1 for further information and references.
7 Cole, T.J., Williams, A.F., and Wright, C.M. (2011) Revised birth centiles for weight, length and head circumference in the
UK-WHO growth charts. Annals of Human Biology, 38 (1). pp. 7-11. ISSN 0301-4460
(doi:10.3109/03014460.2011.544139)See also http://www.rcpch.ac.uk/growthcharts
8 Dewey KG. Growth patterns of breastfed infants and the current status of growth charts for infants. J Hum Lact. 1998 Jun;14(2):89-92. 9 Sachs, M., Sharp, L., Bedford, H., and Wright, C.M. (2012) 'Now I understand': consulting parents on chart design and
parental information for the UK-WHO child growth charts. Child Care Health and Development, 38 (3). pp. 435-440. ISSN
0305-1862 (doi:10.1111/j.1365-2214.2011.01256.x)
Copyright © 2012, Health and Social Care Information Centre. All Rights Reserved. 1
7. Healthy Start
Key findings
At Stage 1, 24% of mothers considered they were eligible for the Healthy Start scheme; levels of eligibility remained broadly similar over the survey period.
Overall, 14% of mothers were registered on the scheme at Stage 1 and this remained at the same level at Stages 2 and 3.
The youngest mothers (those aged under 20) and those who had never worked were the most likely to report they were eligible (77% and 60% respectively) and to be registered on the scheme (54% and 45% respectively).
At Stage 1, 58% of eligible mothers had registered on the scheme. Lack of awareness of the scheme before completing the questionnaire was a key reason why eligible mothers had not registered, mentioned by 59% of these mothers at Stage 1.
Key sources of awareness among eligible mothers who were registered or at least aware of the scheme were the midwife (51%), health visitor (29%), a partner, friend or relative (24%) and the local benefit office or Jobcentre Plus (23%).
At each stage of the survey, over four in five mothers registered on the scheme said they had used their Healthy Start vouchers (84% at Stages 1 and 2 and 82% at Stage 3). Infant formula was the main item mothers on the scheme bought with their Healthy Start vouchers at Stage 1 (68%), followed by fresh fruit (52%), fresh vegetables (47%) and cow’s milk (43%).
The proportion of mothers registered on the Healthy Start scheme who breastfed initially was considerably lower than average (59% compared with 81%). The prevalence of breastfeeding at later time points was also lower than average: for example at six weeks, 32% of mothers registered on the scheme were still breastfeeding (compared with 55% on average) and at six months, 18% were still breastfeeding (compared with 34% on average).
Copyright © 2012, Health and Social Care Information Centre. All Rights Reserved. 2
7.1 Background information
Healthy Start1 is a UK-wide government scheme to improve the health of low-income pregnant women and families on benefits and tax credits. Women who are at least 10 weeks pregnant and families with children under four years old are currently eligible for Healthy Start if the family receives:
Income Support, or Income-based Jobseeker’s Allowance, or Income-related Employment and Support Allowance, or Child Tax Credit (but not Working Tax Credit unless the family is receiving Working Tax Credit
run-on2) and has an annual income of £16,1903 or less.
Women are also eligible during the whole of their pregnancy if they are under 18 when they apply, even if they did not receive any of the above benefits or tax credits. To continue receiving support from the scheme for their babies, they must meet the same eligibility criteria as other Healthy Start families.
Beneficiaries of the Healthy Start scheme receive vouchers which can be spent on milk, plain fresh or frozen fruit and vegetables, or infant formula. Vouchers can be exchanged in a wide variety of local shops and supermarkets, as well as with milkmen that have registered to take part in the scheme.
Every eight weeks, beneficiaries also receive vitamin coupons with their vouchers, which they can swap for Healthy Start vitamins in their local area. The coupons are either for Healthy Start women’s tablets (containing folic acid and vitamins C and D) or Healthy Start children’s drops (containing vitamins A, C and D). Distribution points vary by country and also from one locality to another, but they are generally available through Children’s Centres, health centres and pharmacies. These vitamin products can also be sold to members of the general public.
The Healthy Start scheme was introduced during the fieldwork phase of the 2005 Infant Feeding Survey and replaced the Welfare Food Scheme4, thus the results are not directly comparable with the 2005 survey. Additional questions were also included in 2010 in order to explore the Healthy Start scheme in more detail.
This chapter firstly looks at whether mothers thought they would be eligible for Healthy Start and whether these mothers registered on the scheme. It goes on to cover awareness of the scheme and sources of this awareness, usage of Healthy Start vouchers and reasons for not having used them. Finally, initiation and prevalence of breastfeeding by Healthy Start status are discussed. In Chapter 8, the impact of having spent Healthy Start vouchers on fresh fruit and vegetables on mothers’ likelihood to give fresh fruit and vegetables to their babies is considered. Use of Healthy Start vitamins is discussed in Chapter 9 and Chapter 11.
Copyright © 2012, Health and Social Care Information Centre. All Rights Reserved. 3
7.2 Eligibility for the Healthy Start scheme
At each stage of the survey, mothers were given a description of the Healthy Start scheme, including the eligibility criteria and asked if they were eligible based on these criteria5. It should be borne in mind that whether or not a mother was actually eligible could not be validated, for reasons of confidentiality.
At Stage 1, nearly a quarter of mothers (24%) considered that they were eligible for the Healthy Start scheme. Mothers’ eligibility for the scheme may change over time as it is dependent on whether the family is receiving the benefits or tax credits mentioned above, however levels of eligibility remained broadly similar over the survey period. The proportion of mothers who considered that they were eligible at Stage 2 was 23% and at Stage 3 it was 22%. Thirteen per cent of mothers indicated that they were unsure if they were eligible at Stage 1, although this declined to 10% at Stage 2 and remained at a similar level at Stage 3 (9%).
Table 7.1
At Stage 1, mothers in Wales (28%) and Northern Ireland (26%) were more likely to consider themselves to be eligible for the scheme than mothers in England and Scotland (24% for both). Age and socio-economic group were the key discriminators in terms of socio-demographic characteristics. The youngest mothers (77% of those aged under 20 and 42% of those aged 20-24), those who had never worked (60%) and to a lesser extent those in routine and manual occupations (36%) were most likely to report that they were eligible. By contrast, only 13% of mothers aged 30-34 and 35 or over and even fewer mothers in managerial and professional occupations (6%) thought they were eligible. The socio-demographic profile of those considering themselves eligible for the scheme is to be expected given the eligibility criteria for Healthy Start.
Ethnicity was also a factor: Black mothers were the most likely to report that they were eligible (39%), while mothers from Chinese or other ethnic groups were the least likely (16%). It should be borne in mind that findings for age, occupational group and ethnicity are inter-related (as discussed in Chapter 1).
Mothers of second or later babies were also more likely to think they were eligible than first-time mothers, although the difference was not as marked as for other characteristics (26% compared with 22%). This may be because the eligibility criteria are broader for mothers of second or later babies as it would include those receiving Child Tax Credit in relation to an older child.
Table 7.2
7.3 Registration and awareness of the Healthy Start scheme
Mothers who thought they were eligible for the Healthy Start scheme were asked if they were registered on the scheme. As shown in Table 7.1 earlier, 14% of mothers overall were registered at Stage 1 and this remained at the same level at Stages 2 and 3 (15% at both stages). There was little variation by country (hence the data have not been shown).
As with eligibility, the key discriminating factors were age and socio-economic group. At Stage 1, 54% of mothers aged under 20 and 24% of mothers aged 20-24 were registered on the scheme, compared with only 7% of mothers aged 35 or over. Forty-five per cent of those who had never
Copyright © 2012, Health and Social Care Information Centre. All Rights Reserved. 4
worked and 21% of those in routine and manual occupations were registered, compared with 2% of mothers in managerial and professional occupations.
In terms of ethnicity, Black mothers were the most likely to be registered on the scheme (22%); mothers from Chinese and other ethnic groups were the least likely (5%). Mothers of second or later babies had higher levels of registration than first time mothers (18% compared with 11%).
It is also useful to consider the proportion of eligible mothers who registered on the scheme and how this varied by subgroup, to understand if there are certain groups who are more or less likely to register, even though they consider themselves to be eligible. As subgroup differences were similar at all stages, findings are presented for Stage 1 only.
At Stage 1, 58% of eligible mothers had registered on the scheme. The youngest mothers (70% of eligible mothers aged under 20) and those who had never worked (74% of eligible mothers who had never worked), were most likely to be registered on the scheme at Stage 1. This is likely to be because all mothers aged under 18 would have qualified for the scheme during pregnancy, which may have encouraged higher take-up of the scheme among younger mothers, even though they would have had to meet the same eligibility criteria as other mothers after their baby was born. Groups which are more likely to be eligible (such as those who have never worked and younger mothers) may also be more actively targeted with information about Healthy Start. Levels of registration were relatively similar for eligible mothers in other age groups (i.e. aged 20 or more). By socio-economic group, levels of registration were lowest among eligible mothers from managerial and professional occupations (35%).
So far in this section, the groups most likely to register for Healthy Start have also been those who were the most likely to be eligible. Another group which was particularly likely to have registered for Healthy Start was mothers of second or later babies (68% compared with 48% of first time mothers). They had higher levels of eligibility as well, but the difference was not as marked as it was for registration. This may be because these mothers were more likely to have come across the scheme already through previous exposure to maternity services. Mothers of second or later babies may also have felt under more financial pressure as they already had at least one other child and therefore were more motivated to take whatever assistance was offered.
Although Black mothers were the most likely to be eligible, levels of registration among eligible Black mothers were in line with the average (57% and 58% respectively).
Table 7.3
Mothers who considered themselves eligible for the scheme but had not registered were asked if they had been aware of the scheme before completing the questionnaire. Fifty-nine per cent of these mothers reported that they had not previously been aware of it, suggesting that this may be a key reason why registration levels among eligible mothers were not higher.
Copyright © 2012, Health and Social Care Information Centre. All Rights Reserved. 5
Levels of awareness among eligible mothers who had not registered were lowest among older mothers (67% of those aged 35 or over and aged 30-34 were not aware, compared with 59% average) and mothers in managerial and professional occupations (67% not aware). As mentioned above, it is possible that information about Healthy Start has been particularly targeted at groups who are more likely to qualify for it, meaning that ‘atypical’ mothers who are eligible for the scheme may be less likely to hear about it, and therefore apply for it. Analysis of awareness of Healthy Start by ethnicity is not possible due to low base sizes.
Table 7.4
7.4 Sources of awareness of the Healthy Start scheme
Overall, three-quarters of mothers eligible for Healthy Start were aware of the scheme (before completing the questionnaire) at Stage 1 (58% had registered for it and a further 16% were aware of it although they had not registered). Mothers were most likely to have found out about the scheme through their midwife (51%). Other key sources of awareness were health visitors (29%), their partner, friend or relative (24%), the local benefit office or Jobcentre Plus (23%) or SureStart/Children’s Centre or Children’s Health Clinic (16%).
Mothers in Scotland and Wales were more likely than mothers in England and Northern Ireland to find out about the scheme through their midwife (57%, 56%, 50% and 48% respectively). Mothers in England were more likely than mothers in the other countries to mention the Sure Start/ Children’s Centre or Children’s Health Clinic (18%) and less likely to mention the health visitor (28%).
Tables 7.5 and 7.6
7.5 Usage of Healthy Start vouchers
At Stages 1 and 2 of the survey, mothers on the Healthy Start scheme were asked if they had used any Healthy Start vouchers to buy milk, infant formula, or fresh fruit and/or vegetables since the birth of their baby. At Stage 3, the time period was since they had completed the Stage 2 questionnaire.
Levels of usage of Healthy Start vouchers among those registered on the scheme was consistent over the three Stages of the survey, with over four in five mothers saying they had used them at each stage (84% at Stages 1 and 2 and 82% at Stage 3). There was no variation in usage levels by country.
Table 7.7
Copyright © 2012, Health and Social Care Information Centre. All Rights Reserved. 6
At all stages, infant formula was the main item mothers on the scheme bought with their Healthy Start vouchers (68% at Stage 1, 72% at Stage 2 and 70% at Stage 3). This was followed by fresh fruit (52%), fresh vegetables (47%) and cow’s milk (43%) at Stage 1. Usage patterns were similar at Stages 2 and 3, although by Stage 3, there had been an increase in usage of the vouchers to buy fresh fruit (57%) and fresh vegetables (55%). This may have been because by Stage 3, when babies were 8-10 months, mothers were buying these for their babies as well as themselves. Usage of the vouchers to buy cow’s milk dropped between Stages 1 and 2 (43% to 37%), but returned to a similar level to Stage 1 by Stage 3 (40%).
Table 7.8
7.6 Reasons for not using Healthy Start vouchers
At Stage 1, mothers who were on the Healthy Start scheme but had not spent their vouchers were asked why this was. The main reason was that they had not received the vouchers or that they were waiting for a response from Healthy Start. This was mentioned by 68% of these mothers. Other reasons were that:
they needed more information (6%);
the vouchers had been sent very early (6%);
the vouchers were not convenient to use (3%);
the baby was on a doctor’s prescription (3%).
Table 7.9
7.7 Incidence of breastfeeding by Healthy Start status
As discussed in Chapter 2, 81% of mothers breastfed initially in the UK. The proportion of mothers on the Healthy Start scheme who breastfed initially was considerably lower, at 59%. In comparison, those who were not eligible for the scheme had the highest breastfeeding initiation rates, at 87%, while those who were eligible but had not registered fell in-between at 76%.
This differential is likely to be because mothers who were on the Healthy Start scheme were more likely to come from demographic groups with lower breastfeeding initiation rates (younger mothers and those who had never worked – see Chapter 2). This was less likely to be the case for those who were eligible but had not registered, which may explain why their initiation rates were higher (as discussed in section 7.3). It is also worth bearing in mind that mothers on the Healthy Start scheme are able to use their vouchers to buy infant formula, although it would not cover all the formula they would need to feed their baby. This means that the cost saving of breastfeeding relative to buying infant formula will have been reduced for these mothers.
Table 7.10
Copyright © 2012, Health and Social Care Information Centre. All Rights Reserved. 7
7.8 Prevalence of breastfeeding by Healthy Start status
The pattern observed for incidence of breastfeeding continued to be the case for breastfeeding prevalence at each of the time points shown in Table 7.11, with mothers registered on the Healthy Start scheme having the lowest prevalence of breastfeeding and mothers who were not eligible having the highest prevalence. For example, when babies were six weeks old, 32% of mothers registered on the Healthy Start scheme were breastfeeding, compared with 61% of those who were not eligible. When babies were six months old, 18% of mothers registered on the Healthy Start scheme were still breastfeeding, while more than twice as many mothers who were not eligible were still doing so (39%). The findings for those who were eligible but not registered fell in between the two groups (for example, 45% at six weeks and 26% at six months). As with incidence, these differences are likely to be linked to the demographic profile of each of the groups discussed.
Table 7.11
Copyright © 2012, Health and Social Care Information Centre. All Rights Reserved. 8
Notes and references
1 The background information in this section on the Healthy Start scheme is taken from the Healthy Start website
www.healthystart.nhs.uk. Further information on the scheme can be found on this website. 2 Working Tax Credit run-on is the Working Tax Credit received in the 4 weeks immediately after a person has
stopped working for 16 hours or more per week. 3 These income figures were correct at the time of the Infant Feeding Survey 2010 fieldwork.
4 For more than 60 years, the Welfare Food Scheme provided low-income mothers and families who met certain
criteria with tokens which they could use to buy milk, both in liquid form and as infant formula. They were also provided with vitamins. It was phased out in 2005/2006, beginning with a pilot of the new Healthy Start scheme in Devon and Cornwall from November 2005, with national roll out a year later. The Healthy Start scheme is broadly similar to the old scheme, although it has been designed to have more flexibility. Vouchers can now be exchanged for fresh fruit and vegetables as well as milk or infant formula. 5 Copies of the questionnaires are provided in the Appendices.
Copyright © 2012, Health and Social Care Information Centre. All Rights Reserved. 1
8. Introduction of solid foods
Key findings
The UK health departments recommend that solid foods should be introduced when babies are around six months old. There has been a marked trend towards mothers introducing solid foods later in 2010 compared with 2005. For example, in 2005, 51% of mothers had introduced solid foods by four months, but by 2010, it had fallen to 30%. This pattern is evident in all countries and continues a longer-term trend in this direction.
However, while feeding practices are changing, most mothers in 2010 were not following the UK health department guidelines, since three-quarters of mothers (75%) had introduced solids by the time their baby was five months old.
Solid foods tended to be introduced to younger babies among mothers in Wales, younger mothers and mothers from lower socio-economic groups. At four months, 44% of mothers in Wales, 57% of mothers aged under 20 and 38% of mothers in the routine and manual category and those who had never worked had introduced solids by this time.
The most prevalent reason for introducing solid foods was a perception that the baby was no longer satisfied with milk feeds (52%). Other key reasons included experience with a previous baby (30%), that the baby was able to sit up and hold food in his/her hand (29%), advice from a health professional (27%) and that the baby was waking during the night (26%).
Early introduction of solids by mothers was more likely to be based on a perception that their baby was not satisfied with milk (64% among those introducing solids by three months and between three and four months).
Later introduction of solids tended to be influenced by formal information sources, either from a health professional or written information sources (31% and 25% among those introducing solids after six months) or a recognition of signs that a baby was ready for solids (37% of mothers introducing solids after six months mentioned that their baby was able to sit up and hold food in their hand).
Baby rice was the most common type of food first introduced to babies (57%). The majority of mothers said the food they first gave to their baby was mashed or pureed (94%), while only a small proportion gave finger food (4%).
At Stage 2 (when babies were aged four to six months), mothers were most likely to have given them fruit or vegetables on the previous day (46%), ready-made baby foods (38%), baby rice (31%) and home-made foods (28%).
By Stage 3 (when babies were aged eight to ten months), fruit and vegetables were still a key feature of babies‟ daily diets (77% of mothers gave these on the previous day), but mothers were much more likely to be giving their babies home-made foods (70%) than ready-made baby foods (44%).
In 2009, the UK Government revised its advice to the public about eating peanuts during pregnancy and whilst breastfeeding, meaning that at the time of IFS 2010, the advice was that peanuts and peanut products could be consumed, unless the mother was herself allergic to peanuts or a health professional had advised her not to. Regarding babies, it is advised that peanuts should not be given before the age of six months. Nearly half of mothers reported that they had consumed peanuts or peanut products during pregnancy (49%) and two in five mothers who breastfed at least initially (40%) said that they had done so while breastfeeding. At Stage 3, only a small minority of babies had been given peanuts or peanut products (8%).
The majority of mothers avoided the use of salt completely in the diets of their eight to ten month old babies (90%). Propensity to use salt was greater among mothers from ethnic minority
Copyright © 2012, Health and Social Care Information Centre. All Rights Reserved. 2
backgrounds (38% of mothers of Chinese or other ethnic origin, 37% of Asian mothers, 26% of Black mothers and 16% of mothers of Mixed ethnic origin, compared with 5% of White mothers).
Nearly half of mothers mentioned that they avoided giving their baby particular ingredients at Stage 3 (45%). Other than salt, the principal ingredients omitted were nuts (41%), sugar (38%), honey (19%), eggs (12%) and dairy produce (11%). The foods which mothers avoided were consistent with health guidelines (although it is only recommended to avoid eggs and dairy produce before the age of six months).
Copyright © 2012, Health and Social Care Information Centre. All Rights Reserved. 3
This chapter covers the behaviour of mothers in relation to providing their babies with solid foods. The chapter focuses initially on age of solid food introduction, how this measure has changed over time, and how it varies by country and other key demographic subgroups. The nature of solid diets given to babies at different ages is also investigated, including the balance of home and commercially prepared foods, the frequency of giving types of food, and specific ingredients avoided by mothers. In particular, the consumption of peanuts or peanut products by the mother during pregnancy or while breastfeeding and by the baby is examined, as well as whether there was a history of allergy in the family. The influences on mothers‟ decisions about when to begin and what foods to give are also explored, along with difficulties encountered when introducing solids.
Note the term „weaning‟ can be used to refer to mothers weaning babies onto solids, and mothers weaning from the breast. We have used the term „introduction of solid foods‟ instead of „weaning‟ except where referring to external sources of information, where it is assumed that the term was used in relation to the introduction of solids.
8.1 Age of introduction of solid food
The recommendations provided to mothers regarding the most appropriate age at which to introduce solid foods to their babies have changed over the decades. Between 1994 and 2000, the prevailing recommendation was that “the majority of infants should not be given solid foods before the age of four months, and a mixed diet should be offered by six months”1. In 2001, however, the World Health Organisation issued a revised global recommendation that mothers should breastfeed exclusively for around six months (with breastfeeding continuing until at least two years), and the recommendation for exclusive breastfeeding for around six months was adopted by all the UK health departments from 2003 onwards.2 NICE recommends that breastfeeding then continues for as long as the mother and baby wish.3 The prevalence of exclusive breastfeeding is discussed in Chapter 2.
Thus, at the time of the 2010 survey, the recommendation set out by all the UK health departments was to delay introduction of solid foods until around six months of age. Before this, the baby‟s digestive system is still developing, and introducing solids too early can increase the risk of infections and allergies.4 These recommendations had been in place (in most countries in the UK) for around seven years at the time of the survey5.
8.1.1 Trends over time (UK)
The results over time have shown that, in each subsequent survey wave, the age of introduction of solids has become progressively later6. These reflect the recommendations prevailing at the time of the different surveys.
In 19907, nearly seven in ten mothers had introduced solids by three months, this proportion falling rapidly over the time series to 24% in 2000, 10% in 2005 and only 5% in 2010. Between 1995 and 2000 the proportion introducing solids by four months remained relatively stable, but by 2005 there has been a marked shift from 85% in 2000 down to 51% in 2005. This reduced further to 30% in 2010. Thus, in 2010, nearly seven in ten (69%) of all mothers in the UK were introducing solids after four months, this proportion having increased from a small minority of six per cent of all mothers in 1990, to nine per cent in 1995, 15% in 2000 and 49% in 2005.
These figures clearly demonstrate a significant and marked shift over the time series towards later introduction of solids.
Copyright © 2012, Health and Social Care Information Centre. All Rights Reserved. 4
As shown in Table 8.1, the trend over the previous five years towards later introduction of solids is mainly attributable to a decrease in the proportion of mothers introducing solids between three and four months (in the UK, 25% of 2010 mothers introduced solids in this age period, compared with 41% in 2005) and a corresponding increase in the proportion of mothers doing so between four and five months (45% in 2010 compared with 31% in 2005). This meant that by five months, the gap had narrowed, although there were still fewer mothers who had introduced solids by this point in 2010 than in 2005 (75% and 82% respectively). Nearly all mothers had introduced solids by six months in 2010 (94%, compared with 98% in 2005). Only five per cent of mothers introduced solids after six months in 2010 (2% in 2005). The UK health departments recommend that solids are introduced at around six months: these findings show that, while feeding practices are changing, most mothers were not following these guidelines in 2010, since three-quarters of mothers had already introduced solids by the time their baby was five months old.
Table 8.1
8.1.2 Trend data by country
Mothers in Wales began feeding their baby solid foods earlier on average than mothers in other countries: 44% of Welsh mothers had given their baby solids by the age of four months compared with 35% of mothers in Northern Ireland, 32% in Scotland and 28% in England.
The decline in the practice of early introduction of solids between 2005 and 2010 is evident in all countries, most notably at four months (for example, it reduced from 50% in 2005 to 28% in 2010 in England). The decrease between 2005 and 2010 is most pronounced in Scotland, where the proportion of mothers introducing their baby to solids dropped from 13% in 2005 to six per cent in 2010 when babies were three months old, 60% to 32% at four months and 85% to 74% at five months.
Table 8.1
8.1.3 Variation in the age of introducing solid foods
Mother’s age
There was a clear relationship between mother‟s age and timing of introducing solids, with older mothers introducing solids when the baby was older. While only a fifth (19%) of mothers aged 35 or over had begun introducing solids by the time babies were four months old, nearly three in five (57%) of mothers aged under 20 had done so by this stage. By five months, 85% of mothers aged under 20 had introduced solids, compared with 66% of mothers aged 35 or over.
Mother’s socio-economic status (NS-SEC)
There was an association between mother‟s socio-economic status and age of introducing solids. Mothers classified to managerial and professional occupations were much less likely to have introduced solids by four months (20%) than mothers in the routine/manual occupational category or who had never worked (38% for both). However, at later ages mothers who had never worked differed from those in routine/manual occupations. At five months, mothers in routine and manual occupations were most likely to have introduced solids (81%), while those who had never worked
Copyright © 2012, Health and Social Care Information Centre. All Rights Reserved. 5
were in line with the average (76%). At six months, mothers who had never worked were a little less likely to have introduced solids (91% compared with 94% overall), while there was little difference between the other occupational groups. It is likely that the findings for women who had never worked are linked to findings by ethnicity, discussed below (since, as discussed in Chapter 1, mothers who had never worked were more likely to come from minority ethnic groups).
Table 8.2
Mother’s ethnicity
Mothers from minority ethnic backgrounds introduced solids later on average than white mothers. Nearly eight in ten (77%) of White mothers had introduced solids by the time their baby was five months old. In comparison, around two-thirds of mothers from Asian, Black, Chinese and other ethnic backgrounds had introduced solids by this stage. Mothers from Asian and Chinese or other ethnic backgrounds were the least likely to have introduced solids by four months (22% and 19% respectively, compared with 30% of White mothers).
Table 8.2
Mother’s working arrangements
The timing of a mother‟s return to work (if they do return) may affect when they decide to introduce solids. For example, some mothers may wish to begin this process before they return to work so that they can devote more time to it.
The introduction of solid foods was related to whether or not a mother had returned to work, and the timing of their return. Among working mothers, those who returned to work when their baby was between four and six months old were most likely to have introduced solids by the time their baby was four months (38%). Similarly, mothers returning to work when their baby was between four and six months old (82%) and six and nine months old (80%) were most likely to have introduced solids by five months. Mothers who had returned to work when their baby was less than four months were no more likely than average to have introduced solids at different time points: this may have been because it was too early to start solids before they returned to work, so it did not affect their decision on when to introduce them.
As discussed in more detail in Chapter 10, 29% of mothers were back at work by Stage 3 (when babies were aged eight to ten months), which was considerably fewer than the 45% who were back at work by Stage 3 in 2005. Among those who had returned to work, just over three-quarters (76%) of mothers waited to do so until their baby was at least 6 months old, compared with 57% in 2005. The changes to statutory maternity leave entitlement in 2007 may have had an impact on the time at which mothers returned to work. Thus, although the link between returning to work and earlier introduction of solids remained, the fact that more mothers were not working by Stage 3 in 2010 than in 2005 may have had an impact on the overall proportion of mothers introducing solids before their baby was six months old.
Table 8.2
8.1.4 Influences on age of introduction of solid food
Mothers were asked about any influences affecting their decision about when to begin introducing their baby to solids. Responses were chosen from a prompted list, although mothers could also give other reasons. The most prevalent reason for introducing solid foods into a baby‟s diet was a perception that their baby was no longer satisfied with their milk feeds (52%). Other key reasons
Copyright © 2012, Health and Social Care Information Centre. All Rights Reserved. 6
included experience with a previous baby (30%), that the baby was able to sit up and hold food in his/her hand (29%), advice from a health professional (27%) and that the baby was waking during the night (26%).
However, mothers‟ reasons behind their decision on when to start introducing solids varied by the timing of introduction. The main influence for mothers who had begun introducing solids by the time their baby was four months old was the perception that their baby was not satisfied with milk (64% for those introducing solids by three months and between three and four months). In contrast, only 31% of mothers introducing solids between five and six months and after six months cited this as a reason.
Those who introduced their babies to solids later were far more likely than those doing so earlier to have based their decision on formal information sources: either from a health professional (31% of those introducing solids after six months, 35% between five and six months, reducing to 20% of those introducing solids by three months) or from written information sources (25% after six months; 24% between five and six months, compared with 9% by three months).
As mentioned earlier in this chapter, the UK health departments recommend that babies should be introduced to solids at around six months. At this age, they may be able to sit up and hold food in their hand, which are signs that they are ready for solid food. Mothers who introduced solids after five months were more likely to mention this as a reason for introducing solids (35% between five and six months; 37% after six months, compared with 15% of those introducing solids by 3 months).
The UK health departments also advise that it is normal for babies aged three to five months to wake up in the night and this is not necessarily a sign of hunger or an indication that solid foods should be introduced. If babies seem hungrier at any time before the age of six months, it is recommended to give additional milk feeds.8 Just over a quarter (26%) of mothers mentioned their baby waking up in the night as an influence to begin introducing solids and this was most common among mothers who introduced solids between three and five months (30% between 3 and 4 months, 29% between four and five months). This suggests these mothers were unaware of the UK health department guidance or were not following it.
Broadly, the reasons mothers gave for introducing solids when they did were similar to those given in 2005, although mothers were less likely to mention that they felt their baby was not satisfied with milk in 2010 than 2005 (52% and 63% respectively) and that it was on advice from a health visitor or other health professional (27% and 35% respectively).
Table 8.3
Copyright © 2012, Health and Social Care Information Centre. All Rights Reserved. 7
8.2 Types of solid food given at Stage 2 and 3
8.2.1 Number of solid meals given
Solids should be introduced to a baby‟s diet gradually. When solid food is first introduced, only small amounts should be given and this should be in addition to, rather than as a replacement for, milk. It is therefore advised that babies (and particularly younger babies) should not be put on three solid meals a day too rapidly.9
Nearly three in ten mothers (28%) whose babies had been introduced to solids at Stage 2 (when babies were aged four to six months) were feeding their baby at least three meals a day at the time of survey completion. This was slightly lower than in 2005, when 30%10 were doing so. The majority of Stage 2 babies were aged four to six months at the time of survey completion. The data show a clear trend towards giving an increased number of daily meals as babies get older. Among babies on solids, only 15% of babies aged four to five months were being given three solid meals a day compared with 59% of babies aged seven months or more. The largest increase was seen between 5 to 6 months and 6 to 7 months, when the proportion of babies being given three meals a day increased from 29% to 52%. This may be linked to the fact that mothers are recommended to start giving solid food from around six months, so some mothers may see this as a sign to increase their baby‟s intake of solids.
Table 8.4
8.2.2 First solid foods given to babies
It is recommended that parents should first introduce simple foods that can be easily digested, such as vegetables, fruit or rice.. For the first time in 2010, mothers were asked about the type of solid foods they had first given their baby and whether the food they gave was mashed or pureed or finger foods (that is, food cut into pieces that are adult finger sized). Most babies can eat finger foods from about six months.
Table 8.5 shows the first solid foods given to babies. Since some mothers would not have introduced solids by Stage 2, the findings are shown for Stage 3 only. Mothers answered using a prompted list; in some cases mothers indicated that they had given more than one type of food the first time they gave solids.
Baby rice was by far the most common type of food mothers used when first introducing their baby to solids (57%). Other types of food were mentioned by relatively low proportions of mothers: for example, 12% first gave ready-made baby food, 11% gave home-made foods and 10% gave rusks.
Baby rice was the most common type of food first introduced, regardless of when mothers introduced solids, although it was most likely to be used by those introducing solids when their baby was between four and five months old (62%) and least likely to used by those introducing solids early (43% by three months) and later (44% after six months). Those introducing solids by three months were particularly likely to give their baby rusks first of all (29% compared with 10% of all Stage 3 mothers). Mothers introducing solids after five and after six months were more likely to first offer fruit and vegetables (11% and 14% respectively for fruit, compared with 8% of all Stage 3 mothers; 12% for both for vegetables, compared with 7% of all Stage 3 mothers).
Copyright © 2012, Health and Social Care Information Centre. All Rights Reserved. 8
Table 8.5
Table 8.6 shows that the majority of mothers said that the food they gave was mashed or pureed (94%), while 4% said they gave finger food.
Table 8.6
8.2.3 Balance of home and commercially prepared foods
The Committee on Medical Aspects of Food Policy (COMA) report „Weaning and the Weaning Diet‟ suggests that it is important to give home-made foods when introducing solids, in order to introduce the infant to a greater range of flavours and textures than manufactured foods can provide. It is therefore of interest to monitor the balance between the different types of food given to babies.
At Stages 2 and 3, mothers who had introduced solids were asked about the nature of foods they had ever given to their baby and the foods given on the day before they completed the questionnaire (“yesterday”). For the first time in 2010, mothers were also asked whether the food they gave the previous day was mashed or pureed. Table 8.7 summarises these data for each stage.
At Stage 2, the majority of babies who had been given solids had been given baby rice (79%). Nearly two-thirds had been introduced to fruit or vegetables (66%). Nearly three in five had been given ready-made baby food (58%), while over half (53%) had been given home-made foods. By Stage 3, baby rice was no longer the most common type of food mothers had given, reflecting the fact babies had been exposed to a broader range of food types by the time they were eight to ten months. By that point virtually all babies had been given fruit or vegetables (98%) and 93% of babies had been given home-made foods and other types of food.. Use of ready-made baby food was lower, although it had still been given to over four in five (84%) babies.
This indicates that while the use of ready-made baby food was widespread, most mothers also gave home-made food, fruit or vegetables. The categories of types of foods included in the questionnaire changed in 2010, so it is not possible to compare the findings fully with 2005, but it is clear that mothers were more likely to have given fruit or vegetables in 2010 than in 2005 (up from 53% to 66% at Stage 2 and 91% to 98% at Stage 3). The proportion of mothers giving their babies home-made foods remained broadly similar between 2005 and 2010 for both stages.11
In considering the balance between home-made and ready-made foods, it is also helpful to look at the frequency with which mothers are giving each type of food, in order to provide a more accurate picture of babies‟ daily diets. For example, some mothers may prepare home-made foods for their baby on most days, using jars or tins only occasionally or when they are away from home. To obtain a better picture of babies‟ daily diets, mothers were asked to note down the types of food eaten by their baby on the previous day. These data show that at Stage 2, mothers were most likely to have given fruit or vegetables (46%), followed by ready-made baby foods (38%), baby rice (31%) and home-made foods (28%).
By Stage 3, however, the situation had changed. Fruit and vegetables were a key feature of babies‟ daily diets (77%), but mothers were much more likely to be giving their babies home-made foods (70%) than ready-made baby foods (44%). By Stage 3, only nine per cent of mothers had given
Copyright © 2012, Health and Social Care Information Centre. All Rights Reserved. 9
baby rice the previous day, compared with 31% at Stage 2. This suggests that baby rice is more likely to be given to babies in the early stages of introducing solids.
Table 8.7 also shows in more detail how the nature of daily diets changes as the baby gets older. The use of ready-made foods was most common between the ages of five and ten months (42% of babies aged five to seven months, 45% of those aged eight to ten months, dropping to 31% of those aged ten months or older). The youngest babies (those aged four to five months) were given a more restricted range of foods – the only type of food they were given more than older babies was baby rice (37% compared with 9% of babies aged ten months or older). The consumption of home-made foods tended to increase as babies got older (from 17% at four to five months old up to 80% at more than ten months old) as did the consumption of fruit and vegetables (from 35% at four to five months old, up to 83% at more than ten months old). The oldest babies (those older than ten months) may have been more likely to be included in family meals, rather than being given food specifically for babies (such as ready-made baby foods).
Table 8.7
As discussed earlier, very few mothers gave finger food the first time they gave their baby solids, but by the time babies were between eight to ten months (Stage 3), finger food was playing a more prominent role in babies‟ daily diets. Nine in ten mothers who had given solid food the day before completing the questionnaire had offered mashed or pureed food (90%), while over two-thirds (68%) had given finger food.
Table 8.8
8.2.4 Types of food given
At Stage 3, when most babies were around eight to ten months old, mothers were asked how often they gave their baby different types of food and the results are summarised in Table 8.9. The balance between manufactured and home-made meals concurs with the data provided earlier. By Stage 3, 87% of mothers were feeding their babies fresh foods on a daily basis, compared with 41% of mothers feeding their babies ready-made foods.
In terms of food types, the majority of mothers were feeding their babies fruit (81%), vegetables (80%), breakfast cereals (80%) and dairy products (68%) at least once a day. Potatoes were consumed by the majority (82%) of babies at least once a week, along with chicken (79%), rice/pasta (76%), and bread (68%). Other types of meat were consumed less frequently: beef (54% at least once a week), pork (33%), lamb (32%). Over half (56%) of mothers were feeding their babies fish at least once a week, although this was rarely given on a daily basis (3%).
Foods which were largely avoided included eggs (73% of babies eating less than once a week), potato products (84%), tofu, quorn and textured vegetable protein (TVP) (91%) and nuts (98%). More detailed survey results on foods avoided and mothers‟ reasons for this are covered in section 8.3.
On the whole, where comparisons could be made, the feeding pattern of mothers was similar in 2010 to that in 2005 (data not shown). The only differences were lower rates of consumption of bread (27% of babies in 2010 eating it at least once a day compared with 36% in 2005).
Table 8.9
Copyright © 2012, Health and Social Care Information Centre. All Rights Reserved. 10
The nature of babies‟ diets varied by mothers‟ socio-economic group, their Healthy Start usage and status and their ethnic origin. Table 8.10 displays the proportion of mothers who gave different types of food regularly, defined as three or more times a week, by these subgroups.
The diets of babies of mothers from managerial/professional occupations were more likely than those of their counterparts who had never worked to contain regular servings of vegetables (97% of mothers in this group giving these three or more times a week reducing to 74% of mothers who had never worked); fruit (97% to 77%), fresh foods more generally (97% to 87%), breakfast cereals (90% to 73%), dairy products (88% to 71%), bread (56% to 43%) and rice or pasta (52% to 42%).
Mothers in managerial/professional occupations were less likely to provide regular servings of bought ready-made foods (45% of managerial/professional mothers increasing to 62% of mothers who had never worked); sweets/chocolates/biscuits (14% to 30%); potato products (3% to 17%); eggs (6% to 14%) and tofu, quorn and TVP (3% to 11%).
This suggests that mothers in managerial/professional occupations tended to make healthier choices in terms of the foods they gave their babies than those who had never worked (giving bought ready-made foods and sweets/chocolates/biscuits less often). This may be linked to some extent to relative income levels in different socio-economic groups12. As discussed in Chapter 7, mothers on low incomes (those in receipt of qualifying benefits or tax credits) are eligible for the Healthy Start scheme, which enables them to receive vouchers which can be spent on milk, plain fresh or frozen fruit and vegetables, or infant formula. At Stage 3 of the survey, 57% of mothers registered on the Healthy Start scheme had used their vouchers to buy fresh fruit and 55% had bought fresh vegetables since the time they completed the Stage 2 questionnaire (when babies were around four to six months) – see Table 7.8. Further information on the use of Healthy Start vouchers can be found in section 7.5.
As Table 8.10 shows, mothers who were not registered or not eligible for Healthy Start were most likely to be giving fruit and vegetables three or more times a week (94% for each), which may be linked to the fact that these mothers were more likely to be from higher socio-economic groups and be on higher incomes. However, among those registered for Healthy Start, those who had used their Healthy Start vouchers to buy fresh fruit or vegetables had given these more frequently than those registered on the scheme who had not used their vouchers for this purpose (88% compared with 80% for fruit; 87% compared with 81% for vegetables). This suggests that, among those registered on the Healthy Start scheme, the use of Healthy Start vouchers to buy fresh fruit and vegetables increases babies‟ access to these foods.
There were some clear variations in the nature of diets of babies from different cultural backgrounds. Mothers from ethnic minority backgrounds were less likely than the GB average to regularly give their babies foods such as dairy products, bread, potatoes and fat spreads and more likely to give tofu, quorn or TVP. There were specific variations by ethnic community as well. Asian mothers were the most likely to give their babies beans, lentils and chickpeas (33% compared with 15% of all mothers) and sweets/chocolates/biscuits (27% compared with 21%). They were the least likely to give any type of meat, with the exception of lamb. Conversely, Black mothers were the most likely to give chicken (48% compared with 37% of all mothers), beef (22% compared with 15%) and fish (28% compared with 16%). Mothers from Chinese or “other” ethnic groups were particularly likely to provide rice or pasta (61% compared with 47% of all mothers) and eggs (22% compared with 7%) but were much less likely than other groups to provide breakfast cereals (68% compared with 87% of all mothers) and bought ready-made foods (25% compared with 53%).
Table 8.10
Copyright © 2012, Health and Social Care Information Centre. All Rights Reserved. 11
8.2.5 Use of milk to mix food
At Stages 2 and 3, mothers who had introduced solid foods were asked about their use of milk to mix with baby food. The use of milk to mix up solid foods remained broadly consistent at each stage. At Stage 2, when babies were around four to six months, over three-quarters (77%) of babies taking solids were being given food mixed with milk, while this was the case for four in five babies (80%) at Stage 3, when babies were aged around eight to ten months. This represents a significant increase in the use of milk to mix baby food at Stage 3 since 2005, when only 51% were doing this.
At Stage 2, among mothers who gave their baby solid foods, the main type of milk used to mix baby food was infant formula (59%), while at Stage 3, there was a more even split between cow‟s milk (29%) and infant formula (26%).
At Stage 3, mothers in Scotland were most likely to be using infant formula (32%) and least likely to be using follow-on formula (15%) to mix up baby food. This is consistent with a lower level of usage of follow-on formula in Scotland more generally, as discussed in Chapter 5.
Table 8.11
8.3 Foods avoided and family history of allergy
The UK health departments advise mothers to avoid giving their babies:
salt (as their kidneys are unable to cope with large amounts of salt and over-use could affect the child‟s health in future) ;
sugar (to discourage a sweet tooth and tooth decay);
honey under one year (because of its link with infant botulism);
whole nuts (including peanuts) until the age of five, due to the risk of choking.
It is advised that foods which most commonly cause allergies (milk, eggs, wheat, nuts, seeds, fish and shellfish) should be avoided before six months. After six months, they should be introduced one at a time, so that any reaction can be spotted.13
In August 2009, the UK Government revised its advice to the public about eating peanuts during pregnancy, breastfeeding and the first few years of life, in relation to the risk of developing peanut allergy in childhood. The change in advice followed a major review of the scientific evidence that showed there is no clear evidence that eating or not eating peanuts (or foods containing peanuts) during pregnancy, breastfeeding or early childhood has any effect on the chances of a child developing a peanut allergy. Therefore, the UK Government‟s previous advice that women may wish to avoid peanuts during pregnancy and breastfeeding and not introduce peanuts into their child‟s diet before three years of age if their child has a family history of allergy, was no longer appropriate.
The advice at the time of the Infant Feeding Survey 2010 regarding peanuts and peanut products was therefore that these could be consumed during pregnancy and while breastfeeding, unless the mother was herself allergic to peanuts or a health professional had advised her not to. Regarding babies, peanuts should not be given before the age of six months. After 6 months, where there is a
Copyright © 2012, Health and Social Care Information Centre. All Rights Reserved. 12
family history of allergies, parents are advised to check with their GP or health visitor before introducing peanuts or peanut products.14
8.3.1 Family history of allergy
For the first time in 2010, mothers were asked if there was a history of allergy in the baby‟s immediate family (that is the baby, his/her parents or siblings). Allergies were defined as eczema, asthma, an allergy including a food allergy and hay-fever. Just over half of mothers indicated that there was a history of allergy in the baby‟s immediate family (51%). It is worth bearing in mind that there is sometimes confusion between allergy and food intolerance, so there may have been a degree of over-reporting of allergic conditions, though food intolerance can also cause problems, which are sometimes serious.15
Mothers in Wales were most likely to report there was a family history of allergy (54%); mothers in Northern Ireland were least likely to do so (45%). Those who had never worked were less likely than the other socio-economic groups to say there was a family history of allergy (37% compared with 51% of all mothers). White mothers were more likely to report there was a family history of allergy (54% compared to 51% on average), whilst Black mothers (44%) and Asian mothers (36%) were less likely to do so. As discussed in Chapter 1, mothers who had never worked were more likely to be from a minority ethnic background and particularly from an Asian background, so the findings by socio-economic group and ethnicity may be linked.
Table 8.12
8.3.2 Peanut consumption
As discussed at the start of this section, UK Government advice on peanut consumption during pregnancy, breastfeeding and early childhood changed in August 2009. This was covered in the Infant Feeding Survey for the first time in 2010.
Nearly half of mothers reported that they had consumed peanuts or peanut products during pregnancy (49%) and two in five mothers who breastfed at least initially (40%) said they had done so while breastfeeding. At Stage 3, when babies were around eight to ten months, only a small minority of babies had been given peanuts or peanut products (8%). Whether or not there was a history of allergy in the baby‟s immediate family did not have any bearing on mothers‟ likelihood to consume peanuts or give them to their baby.
There were some variations by country. Mothers in Wales were least likely to have consumed peanuts or peanut products during pregnancy (41%, compared with 49% overall), while mothers in Wales and Northern Ireland who breastfed initially were least likely to do so while breastfeeding (32% and 33% respectively, compared with 40% overall). There was less variation in terms of giving peanuts to babies, although mothers in England were more likely to have given peanuts or peanut products to their baby (8%) compared with mothers from Wales (5%), Scotland (5%) and Northern Ireland (4%).
Mothers in managerial and professional occupations were most likely to consume peanuts during pregnancy and while breastfeeding (for those who breastfed at least initially) (58% and 49% respectively). Conversely, mothers who had never worked were least likely to have done so (38% and 32% respectively). There was no variation by socio-economic group in terms of giving peanuts to babies.
Copyright © 2012, Health and Social Care Information Centre. All Rights Reserved. 13
Tables 8.13, 8.14, 8.15
8.3.3 Use of salt
The UK health departments recommend that babies should not have any salt added to their solid meals, as their kidneys are unable to cope with large amounts of salt, and over-use could affect the child‟s health in the future.
In the UK, the majority of mothers in 2010 avoided the use of salt completely (90% of mothers of Stage 3 babies aged about eight to ten months). This did not vary greatly by country, but was slightly more likely to be the case in Scotland and Northern Ireland (94% in each).
Use of salt did however vary by mothers‟ socio-economic group and by their cultural origin. Mothers who had never worked were four times more likely to use salt at least “sometimes” (24%) than mothers from managerial or professional occupations (6%). Salt was also more prevalent in the diets of babies of minority ethnic mothers than the diets provided by White mothers. While only five per cent of White mothers had ever used salt, this proportion rose to 38% of mothers of Chinese or other ethnic origin and 37% of Asian mothers, 26% of Black mothers, and 16% of mothers of Mixed ethnic origin. As discussed in the previous section, the findings by socio-economic group and ethnicity may be linked.
Table 8.16
8.3.4 Other foods avoided
At Stage 3, when babies were around eight to ten months, mothers were asked whether there were any particular ingredients they avoided giving their baby. Nearly half (45%) mentioned at least one ingredient, which is slightly lower than in 2005 (47%). Mothers in Northern Ireland were much less likely to mention they avoided giving certain ingredients than mothers in other countries (13% compared with 45% overall).
Table 8.17
Among the subset of mothers avoiding at least one ingredient, the principal ingredients omitted from diets were salt (54%), nuts (41%), sugar (38%), honey (19%), eggs (12%) and dairy produce (11%). The foods which mothers avoided were consistent with health guidelines (although it is only recommended to avoid eggs and dairy produce before six months). The questionnaire itself relied on spontaneous mentions by mothers of certain foods – we know from the discussion earlier that a much higher proportion of mothers avoided the use of salt in their baby‟s food. Nevertheless the foods mentioned by mothers at this question indicate those which come to mind first when mothers think about what they omit from their babies‟ diets and comparisons can be made with previous surveys where data were collected in the same way.
The types of food avoided were broadly the same as in 2005, although there have been some changes. Most notably, the proportion of mothers mentioning that they avoided honey has increased from 13% in 2005 to 19% in 2010, while fewer mothers avoided nuts (48% in 2005, 41% in 2010). This may reflect the change in guidance on peanuts discussed earlier in this section. Mothers were also less likely to mention avoiding foods containing additives (9% in 2005 and 5% in 2010).
Copyright © 2012, Health and Social Care Information Centre. All Rights Reserved. 14
Table 8.18
Mothers avoiding certain foods were asked their reasons for this. Among mothers who cited at least one food avoidance, the most common reason was a concern about allergies (36%). Other more generic answers included a perception that this food was not beneficial (27% down from 39% in 2005), or that it was harmful for baby (21% down from 37% in 2005).
Although the proportion of mothers mentioning each of these reasons has decreased since 2005, they have returned to a similar level to 2000 (allergies: 36% in 2010; 43% in 2005; 35% in 2000; not beneficial: 27%, 39% and 26% respectively; harmful: 21%, 37%, 20% respectively). In contrast, the proportion of mothers mentioning that they avoided certain foods on advice has increased since 2000 and 2005 (7% and 8% respectively to 14% in 2010). Mothers mentioned their baby being too young (17%) and choking (8%) as a reason for avoiding certain foods for the first time in 2010. This suggests mothers may have been more aware of specific reasons for avoiding certain foods than in 2005, when more general reasons such as „not beneficial‟ or „harmful‟ were more likely to be given.
Table 8.19
Different reasons were attributed to different foods avoided. Table 8.20 displays the reasons given for avoiding the seven main food types mentioned in Table 8.19; only answers given by at least five per cent of mothers in each subset are shown.
As discussed earlier, when describing why certain foods were avoided, many mothers gave generic answers such as not being beneficial or being harmful to their baby‟s health, particularly in relation to sugar, salt and additives. Focussing on the more specific reasons given, it can be seen that omission of sugar from a baby‟s diet was linked to its effect on teeth (23%) and a desire to avoid baby developing a sweet tooth (11%) and additives were avoided on the grounds that mothers preferred giving fresh or organic foods (20%). Eggs were linked to allergies (40%) and food poisoning (16%) or were avoided as the baby was too young (18%). In relation to honey, mothers were particularly likely to mention they avoided it on advice (29%), because of a risk of food poisoning (including infant botulism) (30%) or because their baby was too young (29%). Dairy products and nuts were both mainly linked to allergies (47% and 63% respectively) and the baby being too young (16% and 15% respectively). Once again, these concerns are generally consistent with the prevailing health advice linked to these foods.
Table 8.20
Copyright © 2012, Health and Social Care Information Centre. All Rights Reserved. 15
8.4 Information about giving solid foods
At Stage 3, mothers who had introduced solid foods were asked whether they had received information relating to either when to start giving solid foods (see also section 8.5) or what types of solid food to give.
Over four in five mothers (86%) reported receiving information on either topic, 84% reported receiving information on when to start giving solids and 82% reporting receiving information on the types of food to give. This represents an increase since 2005, when the proportions reporting receiving information or advice on each topic were 71% and 68% respectively.
Mothers in Scotland and Northern Ireland were most likely to report receiving information on either topic (93% in both countries); mothers in England and in Wales were least likely (86% in both countries). This may relate to different infant feeding communication strategies and publications across the UK.
There were also variations by mother‟s socio-economic classification. Mothers in managerial and professional roles were the most likely to report receiving information on either topic (90% compared to 80% of mothers who had never worked).
Table 8.21
The question on sources of information was asked generically to all mothers who had received information on either topic, but most mothers reported receiving information on both topics in any case. The principal source of information on these topics was the health visitor, mentioned by 65% of mothers at Stage 3 who had reported receiving information on either topic. Other key sources were written materials both off-line (books, leaflets and magazines) (53%) and online (29%), SureStart, Children‟s Centre or Child Health Clinic (40%) and the mother‟s partner, friend or relative (37%).
Mothers in England who had reported receiving information relating to solid foods were least likely of the four UK nations to cite their health visitor (62%) as the source of this information and were most likely to cite the SureStart, Children‟s Centre or Child Health Clinic (44%). There was little difference in the likelihood of mentioning these sources between the other devolved nations of the UK. As mentioned earlier, this may reflect differences in the delivery of information on the introduction of solids between England and the devolved nations. The SureStart programme and Children‟s Centres are discussed further in Chapter 1.
Partners, friends and relatives and the internet were also sources of information most commonly used in England (38% and 30% respectively). They were least commonly used in Northern Ireland (26% and 20% respectively).
Although the prompted list of options changed between 2005 and 2010 and mothers were asked about sources of information in 2010, as opposed to advice or information received in 2005, it is still possible to compare the data collected. Although health visitors were still the principal source of information/advice, fewer mothers had received information from them in 2010 than in 2005 (65% and 87% respectively). This is in line with the decrease since 2005 in mothers mentioning advice
Copyright © 2012, Health and Social Care Information Centre. All Rights Reserved. 16
from a health visitor or other health professional as an influence on introducing solids when they did (see Table 8.3). Mothers also relied more on written materials in 2010 than 2005 (53% up from 44% for books/leaflets/magazines and 29% up from 7% for the internet). While a small proportion of mothers mentioned SureStart spontaneously in 2005, by 2010, 40% of mothers had received information from a SureStart, Children‟s Centre or Children‟s Health Clinic.
Table 8.22
8.5 Difficulties with introducing solid food
The COMA report1 recommends that “by the age of one year the diet should be mixed and varied”. Mothers at Stage 3 were asked to describe the variety of food their baby (then aged about eight to ten months) generally ate. Over seven in ten (72%) described their baby as “eating most things”, and one in four (24%) as eating a “reasonable variety”. Only four per cent described their baby as having “fussy” eating habits. These findings were similar to 2005 where the equivalent results were 69%, 25% and 5% respectively.
Chinese or “other”, Black and Asian ethnic backgrounds were less likely than mothers from a White or Mixed background to describe their baby as eating “most things” (57%, 55% and 47% respectively, compared with 75% of White mothers and 77% of mixed ethnic origin).
Table 8.23
Mothers at Stage 3 were also asked whether they had had any difficulties introducing their baby to solid foods and, if so, what the nature of these difficulties were. Overall, 11% of mothers in the UK had experienced difficulties.
This proportion did not generally vary between the main demographic groups, although mothers from Chinese or “other” and Asian ethnic backgrounds were more likely than White mothers to cite difficulties (18% and 16% respectively compared with 10% of White mothers). In addition, those who introduced solids later were more likely than average to cite problems (17% for those introducing solids between five and six months and after six months). Mothers introducing solids between three and four months were least likely to experience difficulties (7%).
Table 8.24
Among those mothers where difficulties had been encountered, problems included a refusal to eat either certain solids (42%) or any solids (32%); a general disinterest in food (29%), a preference for drinks (19%) or a dislike of eating from a spoon (19%). Mothers experiencing difficulties who introduced solids by three months were more likely to say that their baby would only take certain solids (59%) or to mention vomiting (28%). Mothers experiencing problems who introduced solids between five and six months were more likely to mention their baby‟s refusal to take, or disinterest in, solid foods (38% and 37% respectively). The findings for mothers who introduced solids when their baby was older than six months did not differ significantly from the average (N.B. the base sizes for this group and for those introducing solids by three months were low, so findings should be treated with caution).
Table 8.25
Copyright © 2012, Health and Social Care Information Centre. All Rights Reserved. 17
Notes and references
1 Department of Health. Weaning and the Weaning Diet, Report of the Working group on the weaning Diet of the Committee
on Medical Aspects of Food Policy. HMSO (London: 1994) 2 See DH‟s Infant Feeding Recommendation published in May 2003:
http://www.dh.gov.uk/prod_consum_dh/groups/dh_digitalassets/@dh/@en/documents/digitalasset/dh_4096999.pdf 3 NICE public health guidance 11 http://www.nice.org.uk/nicemedia/live/11943/40097/40097.pdf
4 See page 40 of DH‟s “Birth to Five” publication, “Introducing your baby to solid food” chapter, published October 2009:
http://webarchive.nationalarchives.gov.uk/*/www.dh.gov.uk/prod_consum_dh/groups/dh_digitalassets/documents/digitalasset/dh_107710.pdf 5 Although in Northern Ireland, the recommendations were announced later (during 2004).
6 For detailed statistics relating to surveys before 2005, see Hamlyn B, Brooker S, Oleinikova K, Wands S Infant Feeding
Survey 2000 HMSO (London 2002) and Foster, K, Lader D, Cheeseborough S Infant Feeding 1995 HMSO (London 1997) 7 Data for surveys prior to 2005 not shown. The figures from 2000 or earlier were taken from Chapter 7 of the Infant
Feeding Survey 2005 report, section 7.1.1 http://www.ic.nhs.uk/pubs/ifs2005 8 See pages 40 and 41 of DH‟s “Birth to Five publication, “Introducing your baby to solid food” chapter (link as above)
9 See page 44 of DH‟s “Birth to Five” publication, “Introducing your baby to solid food” chapter (link as above). Also see
http://publications.nice.org.uk/maternal-and-child-nutrition-ph11/considerations 10
For the 2005 figures, see Chapter 7 of the Infant Feeding Survey 2005 report, Table 7.10 http://www.ic.nhs.uk/pubs/ifs2005 11
For the 2005 figures, see Chapter 7 of the Infant Feeding Survey 2005 report, Table 7.11 http://www.ic.nhs.uk/pubs/ifs2005 12
See Choosing a Better Diet: a food and health action plan, DH, 2005 and at:
http://www.dh.gov.uk/prod_consum_dh/groups/dh_digitalassets/@dh/@en/documents/digitalasset/dh_4105709.pdf 13 See NHS Choices “Foods to avoid giving your baby” webpage: http://www.nhs.uk/conditions/pregnancy-and-baby/pages/foods-to-avoid-baby.aspx 14 See the Food Standard Agency‟s recommendations on peanut consumption during pregnancy, breastfeeding and early childhood (this also covers other foods which can trigger allergies) published in August 2009. http://www.food.gov.uk/policy-advice/allergyintol/peanutspregnancy 15
See the NHS website “Food allergy – introduction”: http://www.nhs.uk/conditions/food-allergy/Pages/Intro1.aspx#close
Copyright © 2012, Health and Social Care Information Centre. All Rights Reserved. 1
9. Additional drinks and supplementary vitamins
Key findings
The advice given to mothers is that babies should be breastfed exclusively for the first six months of life. Thus, there should be no need to give babies additional drinks such as water or juice during this period. Babies who are formula fed in the first six months may be given additional cooled, boiled tap water in hot weather. Nearly three in ten mothers were giving drinks in addition to breastmilk or formula by four weeks (27%). This had risen to over half by four months (55%) and just over four in five by six months (81%).
Fewer mothers had given additional drinks at all ages up to six months than in 2005, but this was most evident at four months, when it had dropped from 64% in 2005 to 55% in 2010.
Up to when babies were four months old, mothers in Northern Ireland were more likely to provide additional drinks at an earlier stage than mothers from the other countries (for example, 27% of mothers in Northern Ireland had given additional drinks when their baby was two weeks old, compared with 16% in Wales, 14% in England and 12% in Scotland).
Mothers aged under 20 were more likely than mothers aged 35 or over to have first given their baby other drinks at an early age (64% and 24% when babies were six weeks old respectively).
Mothers from routine and manual occupation groups and those who had never worked were more likely than mothers from managerial and professional occupation groups to have first given their babies other drinks at an early age (48%, 44% and 25% respectively when babies were six weeks old).
Mothers who breastfed initially were less likely to give additional drinks than mothers who formula fed from birth at all ages through until six months (78% compared with 92% respectively).
At Stage 1 of the survey (when babies were four to ten weeks), most mothers said they were giving additional drinks to help with constipation (48%) or to help colic / wind / indigestion (42%). By Stages 2 and 3 (when babies were four to six months and eight to ten months respectively), the main reason for giving drinks was because their baby was thirsty (56% at Stage 2 and 86% at Stage 3).
It is recommended that from six months, infants should be introduced to drinking from cups and beakers. This helps to reduce bottle use and improve dental health. On average in 2010, mothers were introducing cups and beakers earlier than they were in 2005. By six months over half (54%) of all mothers had introduced a cup or beaker compared with 48% of all mothers in 2005.
The UK health departments currently recommend (and did so at the time of the 2005 and 2010 surveys) that all children from six months to five years old are given a vitamin supplement containing vitamins A, C and D, unless they are receiving more than 500ml of infant formula per day. If there is any doubt about the vitamin status of the mother (e.g. if she did not take a vitamin D supplement during her pregnancy), then breastfed babies may also benefit from properly administered vitamin supplements from one month. Premature babies may also benefit from properly administered vitamin supplements before the age of six months. Just seven per cent of babies at Stage 1 were being given vitamin drops, rising to 14% at Stage 3. This does, however, represent an increase since 2005, when the equivalent proportions were three and seven per cent respectively.
Mothers from minority ethnic backgrounds were more likely to be giving their baby vitamin drops than White mothers, particularly when babies were older. By Stage 3, 41% of Black mothers, 38% of Asian mothers and 33% of mothers from Chinese or other ethnic groups were giving vitamin drops, compared with just 10% of White mothers. This may be because mothers from minority ethnic backgrounds were more aware than White mothers of the need to give vitamin D supplements, as people with darker skin are at greater risk of vitamin D deficiency.
Copyright © 2012, Health and Social Care Information Centre. All Rights Reserved. 2
Premature babies were more likely than full term babies to be given vitamin drops at all three stages (31% at Stage 1, 27% at Stage 2 and 30% at Stage 3 for premature babies compared with 5%, 7% and 13% respectively for full term babies).
Breastfeeding mothers were more likely to be giving vitamin drops than those feeding with formula, particularly at Stage 3 (22% and 11% respectively).
Mothers who were registered with Healthy Start were more likely to be giving their babies vitamin drops at all three stages of the survey. By Stage 3, 19% of mothers who were registered with Healthy Start were giving their babies vitamin drops, compared with 13% of those who were not registered.
Women are advised to take vitamin D supplements during pregnancy and while breastfeeding. Women may take other vitamin or iron supplements after birth; for example iron supplements may be taken to counter post-natal iron deficiency. Two in five breastfeeding mothers were taking vitamin or iron supplements at Stage 1 (43%). This proportion fell to 37% by Stage 2 and 33% by Stage 3. This is an increase since 2005, when 33%, 28% and 23% respectively took vitamin or iron supplements.
Copyright © 2012, Health and Social Care Information Centre. All Rights Reserved. 3
This chapter looks at the provision of additional drinks and supplementary vitamins to babies at different ages. The chapter initially looks at the age at which mothers first gave their babies additional drinks such as water, fruit juice, squash, or herbal drinks, and the reasons for giving babies these drinks. It also looks at the age at which mothers first gave their babies a beaker or cup to drink from. Finally, it examines the provision of supplementary vitamins to babies, and the use of vitamins by mothers themselves.
9.1 Additional drinks
As already discussed in Chapters 2 and 8, the official advice to mothers is that babies should be breastfed exclusively for the first six months of life, since breastmilk provides all the nutrients a baby needs during this period. By extension, this means that there should be no need for mothers to give their babies additional drinks such as water or juice during this period. Babies who are formula fed in the first six months may be given additional cooled, boiled tap water in hot weather.1 This advice is different to the guidelines which existed before 2001, whereby mothers were advised not to give babies additional drinks before the first four to six months – this was in line with the prevailing guidelines at the time. The series of questions about when mothers first gave their babies other (non-milk) drinks was reviewed in 2005 (and retained in 2010), meaning that comparisons can be made with 2005, but not with earlier surveys.
9.2 Age of introduction of additional drinks
At each of the three stages of the survey, mothers were asked if they had ever given their baby anything to drink other than milk. This could have included water, fruit juice, squash or herbal drinks. If they had given babies any additional drinks they were then asked when they had first given this to their baby.
By the time babies were two weeks old, about 14% of mothers across the UK had given their baby some other drink, apart from milk, and this rose to almost 27% by four weeks. By four months, 55% had given their baby other drinks, while 81% had done so by six months.
Fewer mothers had given additional drinks at all ages up to six months than in 2005, but this was most evident at four months, when it had dropped from 64% in 2005 to 55% in 2010.
As in the 2005 survey, up to when babies were four months old, mothers in Northern Ireland were more likely than mothers in other countries to have given their babies additional drinks. For example, at two weeks, 27% of mothers in Northern Ireland had given their babies other drinks compared with 16% in Wales, 14% in England and 12% in Scotland. Mothers in Scotland and England were the least likely to give their babies additional drinks at ages up to six weeks. At six weeks, 35% of mothers in Scotland and 36% of mothers in England had given their babies other drinks compared with 45% in Wales and 55% in Northern Ireland.
The age at which mothers first gave babies any other drink apart from milk varied by their socio-demographic characteristics. These patterns are similar to those seen in the 2005 survey. Thus, on average, mothers from managerial and professional occupation groups and older mothers introduced additional drinks later than other mothers.
Copyright © 2012, Health and Social Care Information Centre. All Rights Reserved. 4
Mothers from routine and manual occupation groups and those who had never worked were more likely than mothers from managerial and professional occupation groups to have first given their babies other drinks at an earlier age (for example, when babies were six weeks old, 48% of mothers from routine and manual occupations and 44% of those who had never worked had given additional drinks, compared with 25% of mothers from managerial and professional occupations). This difference was apparent up to when the baby was aged six months, when 72% of mothers from managerial and professional occupations had given their babies additional drinks, compared with 89% of mothers from routine or manual occupations and 87% of mothers who had never worked.
The age at which mothers first gave their babies any other drink apart from milk varied according to the mother’s age. Younger mothers were more likely than older mothers to have first given their baby other drinks at an early age. This difference was most pronounced at six weeks, with 64% of mothers aged under 20 having introduced additional drinks, compared with 24% of mothers aged 35 and over.
Mothers from a Black ethnic background were most likely to have first introduced other drinks at an early age and mothers from Asian and Mixed ethnic backgrounds were least likely to have done so. For example, when babies were six weeks old, 41% of mothers from a Black ethnic background had introduced other drinks, compared with 28% of mothers from an Asian background and 27% of mothers from a Mixed background. A higher proportion of mothers from a Black background continued to introduce other drinks up to when babies were six months old (91%). From four months, the findings for mothers from Asian and Mixed ethnic backgrounds matched the average for Great Britain (GB). The findings for mothers from White and Chinese or other ethnic backgrounds were in line with the GB average for all ages of baby.
The age mothers first gave their babies any other drinks also varied according to whether or not they had breastfed initially. This difference was most noticeable when babies were between four weeks and four months old. By one week, just 5% of mothers who had initiated breastfeeding had given their babies other drinks compared with 14% of mothers who formula fed from birth, while at four months, 49% and 78% of mothers respectively had done so. By six months, the difference was less pronounced (78% compared with 92% respectively).
Table 9.1
Copyright © 2012, Health and Social Care Information Centre. All Rights Reserved. 5
9.3 Reasons for giving additional drinks
At all three stages of the survey, mothers who had given additional drinks were asked to state why they had done so. Answers were chosen from a prompted list although mothers could also give other reasons. At Stage 1 the most common reason given was ‘to help with constipation’ (48%), followed by ‘to help with colic/wind’ (42%), then ‘because (s)he was thirsty’ (37%), then ‘to settle him/her’ (19%). By Stages 2 and 3, mothers giving drinks were less likely to base this on health factors such as constipation or colic. Rather, a perception that the baby was thirsty was the major reason for giving drinks at these stages (56% at Stage 2 and 86% at Stage 3).
Table 9.2 The reasons that mothers gave for giving their babies additional drinks varied according to whether they were breastfeeding or not at that time. At Stages 1 and 2, mothers giving drinks while formula-feeding were more likely to do so because they felt their baby was thirsty (for example, 42% compared with 25% of breastfeeding mothers at Stage 1) or to help with constipation (53% compared with 36% respectively at Stage 1). The latter finding is supported by the results in Chapter 6 which indicate that mothers who breastfed for longer were less likely to report that their baby suffered from constipation.
Table 9.3
9.4 Use of cup or beaker
Various sources including the World Health Organisation and the UK health departments1
recommend that from six months, infants should be introduced to drinking from cups and beakers. This helps to reduce bottle use and improve dental health. Parents are advised to aim to have their baby drinking from a cup (and no longer using bottles) by their first birthday. Mothers were asked at Stage 3 of the survey whether their child had ever drunk from a cup or beaker with a spout and, if so, at what age they had first been given a cup. There has been an increase since 2005 in the proportion saying their baby had started to use a cup/beaker by the age of six months (up from 48% in 2005 to 54% in 2010). The increase has been sharpest in Scotland, where 62% of mothers reported their babies being introduced to a cup/beaker by six months, compared with 50% in 2005. As a result, the introduction of a cup/beaker by six months was more common in Scotland than in the other three countries.
Table 9.4
9.5 Vitamin and iron supplements
The UK health departments currently recommend (and did so at the time of the 2005 and 2010 surveys) that all children from six months to five years old are given a vitamin supplement containing vitamins A, C and D, unless they are receiving more than 500ml of infant formula per day. If there is any doubt about the vitamin status of the mother (e.g. if she did not take a vitamin D supplement during her pregnancy), then breastfed babies may also benefit from properly administered vitamin supplements from one month. Premature babies may also benefit from properly administered vitamin supplements before the age of six months.
It is felt that babies and young children may not get enough vitamins A and C, particularly if they do not eat a varied diet. It is difficult to get enough vitamin D through food alone and the main source of
Copyright © 2012, Health and Social Care Information Centre. All Rights Reserved. 6
vitamin D is through direct sunlight on skin. In addition to babies and young children, pregnant and breastfeeding women are also at risk of vitamin D deficiency. Women are therefore advised to take vitamin D supplements during pregnancy and while breastfeeding, to ensure their own needs for vitamin D are met and so that their baby is born with enough stores of vitamin D for the first few months of life. People who have darker skin and people who are not exposed to much sun, for
example those who cover their skin, are most likely to be at risk of vitamin D deficiency.2
As discussed in Chapter 7, mothers on low incomes may be eligible for the Healthy Start scheme, which entitles them to receive vitamin coupons every eight weeks, which they can exchange for Healthy Start children’s vitamin drops (containing vitamins A, C and D) or Healthy Start women’s tablets (containing folic acid and vitamins C and D). Distribution points vary by country and also from one locality to another, but they are generally available through Children’s Centres, health centres and pharmacies. Mothers not eligible for the Healthy Start scheme can purchase Healthy Start vitamins or they can buy other brands of vitamins from their local pharmacy.
9.5.1 Vitamin drops for the baby
In 2010, few mothers were giving vitamin drops to their babies at each stage of the survey, with seven per cent giving vitamins at Stage 1, nine per cent at Stage 2 and 14% at Stage 3. This indicates that only a minority of mothers are following the advice to give supplements from the age of six months. This does, however, represent an increase since 2005, when the equivalent proportions were three, four and seven per cent. At all three stages, babies in England were most likely to be given vitamin drops, and babies in Northern Ireland were least likely to be given them.
Table 9.5 As in 2005, provision of vitamin drops was much more common at all stages if the baby’s birth weight was low and/or the baby had been in special care after the birth. Nearly one in four babies who had been admitted to special care (23%) were being given vitamin drops at Stage 1, compared with only five per cent of those who had not been in special care. Special care babies continued to be more likely to receive vitamin drops at later ages, with 24% being given vitamin drops at Stage 3 compared with 13% of those who had not been in special care. ‘Low birthweight’ babies (under 2.5kg) were also much more likely to be given vitamin drops at all three stages. Of those under 2.5kg at birth, nearly one in three (32%) were being given vitamin drops at Stage 1, 28% at Stage 2 and 30% at Stage 3 (the figures for all mothers were 7%, 9% and 14% respectively). Linked to these two factors, premature babies were also more likely than full term babies to be given vitamin drops at all three stages (31% at Stage 1, 27% at Stage 2 and 30% at Stage 3 for premature babies compared with 5%, 7% and 13% respectively for full term babies). The 2005 survey observed substantial differences in the likelihood of giving vitamin drops by the mother’s ethnic group. This was still apparent in 2010, with mothers from minority ethnic groups being more likely than White mothers to give their babies vitamin drops. This difference existed at Stage 1 of the survey but was more noticeable at later stages. For example, at Stage 2 of the survey 33% of Black mothers, 24% of Asian mothers and 21% of mothers of Chinese or other ethnic groups were giving their babies vitamin drops compared with only six per cent of White mothers. By Stage 3, 41% of Black mothers, 38% of Asian mothers and 33% of mothers of Chinese or other ethnic groups were giving their babies vitamins compared with just 10% of White mothers. These differences might be partly explained by the fact that babies of Asian mothers tended to be smaller on average compared with babies of White mothers (see Chapter 1). However, in 2010 the
Copyright © 2012, Health and Social Care Information Centre. All Rights Reserved. 7
differences by ethnic group were even more marked than they were in 2005. This may be because mothers from minority ethnic backgrounds were more aware than White mothers of the need to give vitamin D supplements, as people with darker skin are at greater risk of vitamin D deficiency. At all three stages of the survey, breastfeeding mothers were more likely than those feeding with formula to be giving their babies vitamin drops (9% and 4% respectively at Stage 1; 11% and 7% respectively at Stage 2). By Stage 3, the gap had widened (22% of breastfeeding mothers and 11% of formula feeding mothers were giving their babies vitamin drops). As mentioned earlier, babies aged six months or older do not need to be given vitamins until they are receiving less than 500mls of formula per day, which is likely to explain these differences. Mothers who were registered with Healthy Start were more likely to be giving their babies vitamin drops at all three stages of the survey, indicating that the scheme is having an impact in terms of encouraging mothers to give their babies vitamin drops. For example, at Stage 2, 13% of mothers who were registered with Healthy Start were giving their babies vitamin drops, compared with 8% of those who were not registered. By Stage 3, a similar differential was observed (19% of those who were registered compared with 13% of those who were not).
Table 9.6 Mothers who gave their babies vitamin drops were asked how they obtained the vitamins. At Stages 1 and 2, around three in five got them free either through Healthy Start (30% at both stages) or on prescription (30% and 27% respectively). At Stage 3, 28% of mothers who gave their babies vitamin drops got free Healthy Start vitamins and 15% got vitamins on prescription. The older the baby, the more likely it was that the mother paid for vitamin drops; at Stage 1, 22% of those who gave vitamins said they bought them from a retailer or from Healthy Start, rising to 37% of those who gave vitamins at Stage 2 and 56% of those who gave them at Stage 3.
Table 9.7 Not surprisingly, those who were registered with Healthy Start and gave vitamin drops were most likely to say they got their babies’ vitamin drops free from Healthy Start (73% compared with 16% of those not registered with Healthy Start at Stage 3). A small proportion of mothers registered with Healthy Start said that they bought the Healthy Start vitamins (3% of those registered, compared with 12% of those not registered at Stage 3). A minority of mothers registered with Healthy Start had bought vitamins from a retailer at Stage 3 (14%). Although this is much lower than for those not registered with the scheme (54%), it suggests that some mothers may have had difficulty obtaining the free vitamins they are entitled to or were not aware they were entitled to free vitamins as part of the scheme. It could also be because they wanted to give their baby vitamins other than A, C and D.
Table 9.8
9.5.2 Supplementary vitamins or iron for the mother
This section looks at the proportion of mothers who were taking vitamin or iron supplements themselves at each of the three stages of the survey. As discussed above, women are advised to take vitamin D supplements during pregnancy and while breastfeeding. Mothers may also take vitamin or iron supplements for other reasons; for example iron supplements may be taken in the weeks after the birth to counter post-natal iron-deficiency (anaemia). At Stage 1, 43% of breastfeeding mothers were taking vitamin or iron supplements. This had dropped to 37% at Stage 2, and to 33% by Stage 3. This decrease in the proportion of mothers taking vitamins and iron supplements as the baby gets older was consistent with the findings from previous surveys. However, the proportion of breastfeeding mothers taking vitamin or iron supplements has
Copyright © 2012, Health and Social Care Information Centre. All Rights Reserved. 8
increased at each stage since 2005, when it was 33%, 28% and 23% respectively3. This increase
may be due to efforts to raise awareness of the recommendations on vitamin D, following a 2007 report from the Scientific Advisory Committee on Nutrition (SACN), which highlighted that a significant proportion of the UK population had low vitamin D status, with pregnant and breastfeeding women, infants, elderly people and BME groups being identified as at-risk groups.4 At Stage 1 of the survey, breastfeeding mothers in Northern Ireland were most likely to be taking supplements (52%) and breastfeeding mothers in Wales were least likely to be doing so (40%). This difference was not evident at later stages. At Stage 1, breastfeeding mothers who were registered for Healthy Start were less likely than breastfeeding mothers who were not registered to say they were taking supplementary vitamins or iron (35% and 44% respectively). At Stages 2 and 3, the gap had disappeared. This is in contrast with the earlier section on vitamin drops for babies, where mothers registered on the Healthy Start scheme were more likely to be giving vitamins to their babies than mothers who were not registered. However, a greater proportion of mothers were taking supplements themselves than giving them to their babies, so it may be that this was more common practice among mothers generally than was the case for giving vitamin drops to babies.
Table 9.9 Breastfeeding mothers who were taking vitamin or iron supplements were asked to indicate what type of supplements they were taking. At all stages of the survey, the most commonly taken supplements were combined multi-vitamin and iron supplements (at Stage 1, 32% of breastfeeding mothers who were taking supplements used this type of supplement, rising to 36% for both Stages 2 and 3). Use of iron-only supplements was more prevalent at Stage 1 than at Stages 2 and 3 (24% at Stage 1, 10% at Stage 2 and 13% at Stage 3). Overall, a small proportion of breastfeeding mothers who took supplements reported taking Healthy Start vitamins (6% at Stage 1, 7% at Stage 2 and 11% at Stage 3). Among those registered for Healthy Start, however, these figures were higher at 30%, 30% and 44% respectively (compared with five per cent for both Stages 1 and 2 and eight per cent at Stage 3 among those who were not registered).
Table 9.10
Copyright © 2012, Health and Social Care Information Centre. All Rights Reserved. 9
Notes and references
1 See NHS Choices website on drinks and cups for children http://www.nhs.uk/Conditions/pregnancy-and-
baby/Pages/drinks-and-cups-children.aspx#close 2 See NHS Choices webpage on vitamins for children http://www.nhs.uk/Conditions/pregnancy-and-baby/Pages/vitamins-
for-children.aspx#close
And also the NHS Choices webpage on Vitamin D and sunlight: http://www.nhs.uk/Livewell/Summerhealth/Pages/vitamin-D-sunlight.aspx
For more detailed information see the 2007 SACN report Update on Vitamin D http://www.sacn.gov.uk/pdfs/sacn_position_vitamin_d_2007_05_07.pdf 3 See Infant Feeding Survey 2005 report http://www.ic.nhs.uk/pubs/ifs2005, Chapter 8, Table 8.16
4 See Nursing Times, January 2008 http://www.nursingtimes.net/Journals/2012/04/27/g/e/k/080108UpdateVitD.pdf
For more detailed information, see the 2007 SACN report Update on Vitamin D http://www.sacn.gov.uk/pdfs/sacn_position_vitamin_d_2007_05_07.pdf
Copyright © 2012, Health and Social Care Information Centre. All Rights Reserved. 1
10. Feeding outside the home
Key findings
By Stage 3 (when babies were eight to ten months old), nearly three in ten (29%) mothers had returned to work, considerably fewer than the 45% who were back at work by Stage 3 in 2005. Just over three-quarters (76%) of these mothers had waited until their baby was at least six months old before their return to work, compared with 57% in 2005. These findings are likely to be linked to a change in maternity leave entitlements in 2007.
Most mothers who had returned to work by Stage 3 were working part-time: 13% were working less than 15 hours per week and a further 53% were working between 15 and 30 hours.
Nearly one in five (19%) working mothers said that they were provided with facilities to either express milk or to breastfeed at work (up from 15% in 2005). Mothers in Scotland were more likely than average to report such facilities (24%) and mothers in Northern Ireland were less likely to do so (14%).
Nearly one in five mothers who were working at Stage 3 felt that their return to work had affected the way they fed their baby (19%), with over half of these mothers saying it had caused them to stop or cut down breastfeeding (56%).
The Breastfeeding etc. (Scotland) Act was passed in Scotland in March 2005, making it an offence to stop mothers from breastfeeding their children under the age of two in public places. The Equality Act 2010, which came into effect in October 2010, introduced protection from discrimination for women who are breastfeeding across the whole of Great Britain, up until babies are 26 weeks old. In Northern Ireland, breastfeeding mothers are protected by sex discrimination legislation. At Stage 2 (when babies were four to six months old), half of mothers (49%) were aware of legislation protecting their right to breastfeed in public. Awareness was highest in Scotland (73%), where legislation has been in place for longer.
Nearly three-fifths of mothers breastfeeding initially had breastfed in public by Stage 3 (58%), up from around half in 2005 (51%). Breastfeeding in public was particularly associated with mothers of second or later babies (63%), mothers who were older (66% aged 30 – 34, 69% aged 35 or over), mothers who lived in the least deprived quintile (66%) or mothers who were classified to the managerial/professional socio-economic group (70%). Breastfeeding mothers from an Asian ethnic background were considerably less likely than other mothers to have breastfed in public (39%).
Just over one in ten (11%) mothers who had breastfed in public said that they had been stopped or been made to feel uncomfortable doing so. Nearly half of these mothers (47%) had encountered problems finding somewhere suitable to breastfeed.
Eight per cent of mothers who breastfed initially said that they had not breastfed in public but wanted or tried to do so.
Mothers in Scotland (60%) and England (59%) who breastfed initially were more likely to have breastfed in public than mothers in other countries (52% in Wales, 42% in Northern Ireland). Mothers in Scotland also tended to have more positive experiences when breastfeeding in public. They were more comfortable about feeding in public without going to a special place (12% compared with 8% overall), were less likely to report problems finding a suitable venue (36% compared with 47% overall) and were also less likely to report being stopped or made to feel uncomfortable (8% compared with 11% overall).
Just under half of mothers who breastfed initially reported that they felt uncomfortable breastfeeding their baby in front of other people (45%). Discomfort was most acute in public

Copyright © 2012, Health and Social Care Information Centre. All Rights Reserved. 2
places (43%), but for some it was an issue in their own home (13%). Most of these mothers felt uncomfortable breastfeeding in front of male relatives or friends (73%), with others feeling uncomfortable in front of female relatives or friends (27%) or their doctor/GP (15%).
Copyright © 2012, Health and Social Care Information Centre. All Rights Reserved. 3
This chapter covers the experiences of mothers when feeding their babies outside the home. Two main topics are covered: firstly the relationship between how a mother feeds her baby and her working status and conditions, and secondly women’s experiences of and feelings about feeding when other people are present. Emphasis is placed on the prevalence of breastfeeding in public places, the places where mothers prefer to breastfeed, and the barriers that exist for mothers wanting to do this. Results are placed in the context of sex discrimination legislation in Northern Ireland, amended in 20081, which banned discrimination against women on the grounds that they have recently given birth and the Equality Act 20102, which introduced protection from discrimination for women across Great Britain who are breastfeeding (including in public places). Legislation protecting the rights of mothers to breastfeed in public has been in place in Scotland since March 20053. The Scottish legislation made it illegal for anyone in Scotland to ask a breastfeeding woman to leave a public place such as a café, shop or public transport.
10.1 Feeding the baby after returning to work
This section investigates in more detail the relationship between mothers’ working arrangements and feeding patterns including timing of return, working hours and facilities for breastfeeding or expressing breastmilk. However, in order to present these findings in context, we first describe some background statistics relating to mothers’ working patterns and (where comparative data are available) how these have changed since previous surveys.
10.1.1 Maternity leave
Since the last Infant Feeding Survey in 2005 was carried out, statutory maternity entitlements for women in the UK have changed: in April 2007, these entitlements increased to nine months’ paid leave together with a further three months’ unpaid leave for those wishing to take it. 4 This was an increase from the previous entitlements (introduced in April 2003) of six months’ paid leave and a further six months’ unpaid.
The Infant Feeding Survey data seem to reflect some of these policy changes in maternity leave entitlements. At Stage 1 of the survey (when babies were four to ten weeks old), mothers in 2010 were just as likely as mothers in 2005 to be on maternity leave (60% and 59% respectively), but more likely to be on maternity leave than mothers in 2000 (50%). At Stages 2 and 3, mothers in 2010 were much more likely than mothers in 2005 to be on maternity leave. At Stage 2 (when babies were four to six months old), 57% of mothers were still on maternity leave, compared with 43% in 2005 and 22% in 2000. At Stage 3 (when babies were eight to ten months old) 31% were still on maternity leave, compared with 14% in 2005 and two per cent in 2000.
The increased proportion of mothers on maternity leave at Stages 2 and 3 is reflected in the decreased proportion of mothers who were back at work at these stages of the survey. In 2010, a very small proportion (6%) of mothers were working by the time of the Stage 2 survey (compared with 13% in 2005). By Stage 3, 29% were back at work; considerably fewer than the 45% who were back at work by Stage 3 in 2005.
It is worth noting that babies were on average three weeks younger at Stage 3 in 2010 than in 2005 (as discussed in Chapter 1). Due to the changes in maternity leave policy discussed above, it is helpful to compare the proportion of mothers back at work when babies were nine months or older. In 2010, 35% of mothers whose babies were nine months or older were back at work, compared with
Copyright © 2012, Health and Social Care Information Centre. All Rights Reserved. 4
26% of mothers of younger babies. In 2005, there was less variation by age, with 46% of mothers whose babies were nine months or older having returned to work, compared with 42% of mothers of younger babies. While there is less of an increase between 2005 and 2010 for mothers of babies aged 9 months or older, it is still clear that mothers returned to work later in 2010 than in 2005.
There was little variation in the proportion of mothers working at Stage 2 by country, although mothers in Northern Ireland were most likely to be on paid maternity leave at Stage 2 (60%), while mothers in England were the least likely (52%) . By Stage 3 of IFS 2010, mothers in Northern Ireland (36%) and Wales (34%) were more likely to have returned to work, whilst those in England (29%) and Scotland (26%) were less likely to have done so. Mothers in Scotland were most likely to be on paid maternity leave (30% vs. 21% average), while mothers in England were most likely not to be working (40% vs. 39% average).
Table 10.1
10.1.2 Age of baby when mother returned to work
The changes to statutory maternity leave entitlement in 2007 may have had an impact on the time at which mothers returned to work. By Stage 3 of IFS 2010, just over three-quarters (76%) of mothers returning to work waited until their baby was at least 6 months old, compared with 57% in 2005. There was no significant variation by country.
The tendency towards longer maternity leave is evident across all occupational groupings, but the change has been most marked among those in routine and manual occupations, who tended to return to work later on average (81% for 6 months or older) than mothers returning to managerial/professional and intermediate occupations (74% for 6 months or older for both). This is the opposite pattern to that observed in 2005 (where 62% of mothers in managerial positions and 50% of mothers in routine and manual occupations waited until their baby was 6 months or older before returning to work).
Table 10.2
10.1.3 Working hours
The majority of mothers (66%) who had returned to work by Stage 3 were working part-time – that is up to 30 hours a week. Thirteen per cent were working less than 15 hours a week and a further 53% between 15 and 30 hours. The profile of working hours remains similar to that found in 2005. However, as in 2005, there were some variations in working hours by country and other factors. The key distinguishing factor was the mother’s occupational group: mothers in managerial/professional occupations were nearly three times as likely to be working full-time as mothers in routine/manual occupations (44% compared with 15%). Mothers in Northern Ireland were also more likely to be working full-time than mothers in other countries (42% compared with 32% overall). Mothers returning after their first baby were more likely to be working full-time than mothers returning after a later baby (34% compared with 28%).
Table 10.3
Copyright © 2012, Health and Social Care Information Centre. All Rights Reserved. 5
10.1.4 Facilities to breastfeed or express milk
One in six working mothers in the UK (16%) said that their employer offered facilities to express milk, eight per cent said that they could breastfeed at work, and 19% said that at least one of these facilities were offered (up from 15% in 2005). These figures may be under-estimates, as mothers who have no need to use such facilities may not be aware of whether or not they are offered. Working mothers who were breastfeeding at Stage 3 were among those most likely to say that such facilities were offered (35%). This may be an indication that breastfeeding women are more likely than non-breastfeeding mothers to be aware of workplace breastfeeding facilities, but equally it may be an indication that the existence of such facilities allowed women to continue breastfeeding for longer.
As in 2005, working mothers in Northern Ireland were least likely to report being provided with such facilities (14%), while working mothers in Scotland were most likely to report that they had these facilities at work (24%). This finding may well be linked with the law that came into force in March 2005 to protect the right of mothers in Scotland to feed in public places. While it did not cover breastfeeding in the workplace as such, it may have helped to create a more supportive environment for breastfeeding. Legislation offering similar protection came into effect later in the rest of the UK (2008 in Northern Ireland and 2010 in England and Wales), so future rounds of the IFS may observe less of a gap between Scotland and the rest of the UK on this measure. See section 10.2 for further discussion on this.
Table 10.4
10.1.5 How feeding has been affected by return to work
Various sections of this report have explored the relationship between feeding behaviour and return to work after a baby is born. For example, Chapter 2 noted that there was no clear relationship between the age of the baby when the mother returned to work and the duration of breastfeeding. This is a change since 2005, when it was observed that mothers returning to work after six months, or not at all, were more likely than mothers returning earlier to still be breastfeeding at this stage. In Chapter 6, a small proportion of mothers who had stopped breastfeeding identified returning to work or college as one of the factors behind stopping breastfeeding (6%), although this increased to 20% among mothers who stopped breastfeeding when their baby was between six and nine months. In Chapter 8, we observed that mothers returning to work when their baby was between four and six months old were most likely to have introduced solids by the time their baby was four months old (38% compared with 30% overall). Similarly, mothers returning to work when their baby was between four and six months old and six and nine months old were most likely to have introduced solids by five months (82% and 80% respectively).
Mothers who were working at Stage 3 were asked specifically whether their return to work had affected the way they fed their baby. Overall, 19% of mothers working at this stage said that this was the case (the same proportion as in 2005). Working mothers in England were most likely to say this (20%) and mothers in Northern Ireland were least likely to do so (13%).
Copyright © 2012, Health and Social Care Information Centre. All Rights Reserved. 6
As in 2005, mothers working in managerial or professional occupations in 2010 were more likely than other working mothers to say that feeding had been affected (29% compared with 9% of mothers working in routine or manual occupations). Linked to this, mothers returning to work full-time were also more likely than those working part-time to say this (28% compared with 12% working less than 15 hours).
Table 10.5
Mothers who said their baby’s feeding had been affected by work were asked in what ways this had been the case; answers were collected in an open format and later coded. The responses given were dominated by mothers saying that returning to work had caused them to stop or cut down on breastfeeding (56% of mothers whose feeding had been affected, a drop from 69% in 2005). Other changes were that the baby had to feed from a bottle (16%), that someone else had to feed the baby (12%) and that the mother had only continued with morning/evening or night feeds (11%).
Although mothers’ return to work still had some impact on feeding practices, it would appear, looking at the findings discussed in various chapters, that it had less influence than in 2005.
Table 10.6
10.2 Feeding in public places
Throughout the survey series, the Infant Feeding Survey has measured the extent to which mothers have fed their baby in public, whether they have encountered problems when doing this, and their views on the provision of facilities for feeding babies – especially for breastfeeding.
The Breastfeeding etc. (Scotland) Act was passed in Scotland in March 2005, making it an offence to stop mothers from breastfeeding their children under the age of two in public places such as restaurants, bars, buses and shopping centres. In Scotland, therefore, the law had been in place for about five years before the babies included in the 2010 IFS were born. In Northern Ireland, since April 2008, the Sex Discrimination (Northern Ireland) Order 1976, as amended, has banned discrimination against women on the grounds that they have recently (i.e. within the last 26 weeks) given birth. This protection applies in relation to the provision of goods, facilities and services to the public. The law was in place about two years before the babies included in the 2010 IFS were born. The Equality Act 2010, which came into effect in October 2010, introduced protection from discrimination for women who are breastfeeding across Great Britain, up until babies are 26 weeks old. As the babies included in the 2010 IFS were born between August and October 2010, this means that the majority of mothers taking part in the 2010 Infant Feeding Survey who lived in England and Wales would have benefited from this protection from when their babies were quite young, but not from birth.
As well as measuring awareness of the legislation across the UK for the first time, the survey covered mothers’ awareness of stickers or leaflets promoting locations in their area where breastfeeding is welcome.
Copyright © 2012, Health and Social Care Information Centre. All Rights Reserved. 7
10.2.1 Awareness of the right to breastfeed in public
At Stage 2, half (49%) of mothers said they were aware of legislation protecting their right to breastfeed in public. Given that the legislation has been in place for longer in Scotland, it is not surprising that awareness was highest among mothers in Scotland (73%). Awareness was also relatively high in Northern Ireland at 55%, compared with 47% in England and 44% in Wales. Stage 2 fieldwork started in January 2011, so the Equality Act 2010 would have been in place across Great Britain for around three months when mothers completed the questionnaire. It is also worth bearing in mind that in Scotland, two years of active public debate preceded the legislation, which will have helped to raise awareness of the issue of breastfeeding in public. This did not happen for the Equality Act covering the whole of Great Britain and, as it covers a broader range of issues than the Scottish law, it is less likely that the public would be aware that it included protection from discrimination for women who are breastfeeding. The higher level of awareness in Northern Ireland than England and Wales may be related to the Breastfeeding Welcome scheme, which has been in place in Northern Ireland since 20055. Local businesses and council facilities display stickers and certificates showing that breastfeeding is welcome there, to encourage mothers to breastfeed in public. This is also discussed in the next section.
Those who initially breastfed were more likely to have heard of the legislation than those who had never breastfed (51% and 40% respectively).
Those in managerial and professional occupations had relatively high awareness of the legislation (55%, compared with 47% of those in intermediate occupations, 46% of those in routine and manual occupations and 40% of those who had never worked). Younger mothers were less likely to be aware of the legislation than average (43% of mothers aged under 20 and aged 20-24). These characteristics correlate with mothers’ initiation and duration of breastfeeding (see Chapter 2) and therefore it is not surprising that these variables are also related to awareness of the legislation.
Table 10.7
10.2.2 Awareness of stickers or leaflets promoting locations where breastfeeding is welcome
For the first time in 2010, mothers were also asked whether they had seen stickers or leaflets promoting locations in their area where breastfeeding is welcome, in order to measure awareness of Breastfeeding Welcome schemes which have been established in some areas in the UK. As mentioned in the previous section, local businesses and council facilities can join the scheme to encourage mothers to breastfeed in public. In Northern Ireland and Wales, there are national schemes, established in 2005 and 2006 respectively. There is no national Breastfeeding Welcome Scheme in Scotland, but there are a number of local schemes, which are run by NHS Boards and local authorities. Similarly, in England, some local schemes are in operation.
One in three (33%) said they had seen stickers or leaflets, with recall highest among mothers in Northern Ireland (53%), followed by those in Scotland (41%), Wales (35%) and England (32%).
Copyright © 2012, Health and Social Care Information Centre. All Rights Reserved. 8
Those who initially breastfed were more likely to recall seeing stickers or leaflets than those who had never breastfed (34% and 29% respectively).
Table 10.8
10.2.3 Prevalence of feeding in public by country
By Stage 2, nearly all mothers had fed in public places (92%). Across the UK as a whole, 46% said they had breastfed in public (up from 39% in 2005), 63% had bottle-fed in public, and just 8% had never fed in public. By Stage 3, the proportion who had breastfed in public was at a similar level to Stage 2 at 47% while the proportion having bottle-fed in public rose to 71% (reflecting the increased use of formula by this stage), and just 6% had never fed in public. Again, the proportion who had breastfed in public was higher than in 2005 (39% in 2005 compared with 47%).
By country, the prevalence of breastfeeding in public reflected the differential breastfeeding rates by country (see Chapter 2); thus the rate of breastfeeding in public was highest in England (47% at Stage 2, 48% at Stage 3) and lowest in Northern Ireland (27% at both Stages 2 and 3).
Table 10.9
10.2.4 Prevalence of breastfeeding in public among breastfeeding mothers
While important for benchmarking purposes, the figures presented in Table 10.10 simply reflect the differential breastfeeding rates by country. Perhaps of more interest is the proportion of breastfeeding mothers who have breastfed in public.
Nearly three in five (58%) of mothers who breastfed initially, had done so in public by Stage 3 (up from 51% in 2005). This proportion was higher in Scotland (60%) and England (59%) than in Wales (52%) and Northern Ireland (42%). Since 2005, the proportions had increased in Scotland (up from 55%), England (from 52%) and Wales (from 44%), but not in Northern Ireland (from 40% in 2005, which was not a statistically significant increase).6
There was a large degree of variation in the prevalence of public breastfeeding by different demographic subgroups. Table 10.10 displays how this proportion varies by the mother’s socio-economic group, IMD, age and ethnicity and awareness of the new legislation. The key variations were as follows:
Mothers breastfeeding initially who were in managerial or professional occupations were more likely than their counterparts in other occupational groups, or who had never worked, to breastfeed in public. In the UK, 70% of breastfeeding mothers in managerial/professional occupations had fed this way in public, compared with 51% of those in routine/manual occupations and just 35% of those who had never worked.
Mothers breastfeeding initially who lived in the least deprived areas were more likely to breastfeed in public than those living in more deprived areas (66% in the least deprived IMD quintile compared with 49% in the most deprived IMD quintile)
Older mothers who breastfed initially were more likely than younger mothers to have breastfed in public (69% of breastfeeding mothers aged 35 or over, compared with 33% of those under the age of 20).
Copyright © 2012, Health and Social Care Information Centre. All Rights Reserved. 9
Mothers of second or later babies were more likely to have breastfed their baby in public than first-time mothers (63% compared with 54%).
As observed in section 2.4, mothers in higher occupational groups, older mothers and mothers of a second or later baby, all breastfed for longer than average, so the above variations may be associated with duration of breastfeeding (i.e. the longer a mother breastfeeds, the more likely she is to do it in public). Older, professional women and more experienced mothers may also have more confidence about feeding in public and feel less embarrassed or worried about what others think. The mother’s local environment may also be a factor. As breastfeeding is more prevalent in the least deprived areas, this may create a greater tolerance of breastfeeding in public in the local area.
By ethnicity, there are differences in the rates of breastfeeding in public which cannot be linked to duration of breastfeeding. Section 2.4 showed that mothers from Black, Chinese/other and mixed ethnic backgrounds, and to a lesser extent Asian mothers, breastfed for longer on average than White mothers. Accordingly, breastfeeding mothers of Mixed ethnic origin (77%) and Black mothers (67%) were more likely to have breastfed in public than White mothers (60%). However, Asian breastfeeding mothers were considerably less likely to have breastfed in public (39%). This would indicate that the propensity to breastfeed in public may be linked to different cultural practices associated with mothers from an Asian ethnic background. There were no statistically significant differences for mothers from a Chinese or other ethnic background, due to the small sample size for this subgroup.
Mothers who were aware of legislation protecting their right to breastfeed in public were also more likely to have done so than those who were not aware of this protection (61% compared with 57%), although differences were not as marked as for the demographic characteristics discussed above.
Table 10.10
10.3 How mothers prefer to breastfeed in public
Mothers who had ever breastfed in public were asked at Stage 2 about their preference between: using special facilities such as a ‘mother and baby room’; breastfeeding where they are but finding a quiet place to sit; or breastfeeding where they are without going to any special place.
Most mothers (88%) expressed a preference, with a large majority preferring to make some kind of special arrangement to breastfeed (43% said they preferred a quiet place to sit, and 36% that they preferred a mother and baby room; just 8% said they preferred to breastfeed where they were without going to special place). Since 2005, there has been a drop in the proportion preferring to breastfeed in a mother and baby room (down from 42% to 36%), which suggests that mothers have become more confident about breastfeeding in public.
Mothers in Scotland were most likely to say they preferred breastfeeding where they are without going anywhere special (12%, compared with 8% overall) and correspondingly, were least likely to say they preferred to use a mother and baby room (30% compared with 36% overall). This is perhaps related to the fact that the legislation discussed earlier was introduced in Scotland before the rest of the UK (see Section 10.2).
A preference for breastfeeding in a mother and baby room was associated with awareness of the new legislation (among those who had breastfed in public, 40% of those who were not aware of the
Copyright © 2012, Health and Social Care Information Centre. All Rights Reserved. 10
legislation preferred a mother and baby room, compared with 33% of those who were aware of the legislation).
It was noted in section 10.2.4 that Asian mothers were much less likely than mothers from White or other ethnic groups to breastfeed in public. Among those who had breastfed in public, there was a stronger preference for a private room in which to breastfeed (66% of Asian mothers who breastfed in public preferred a mother and baby room, compared with 33% among White mothers).
Table 10.11
10.4 Barriers to breastfeeding in public
It is clear from the above discussion that many breastfeeding mothers do breastfeed in public, although most feel more comfortable feeding in a discreet location, either in a quiet place or in a special mother and baby room. This section explores the extent and nature of problems encountered by women when attempting to breastfeed in public, as well as investigating the factors which deter mothers who would like to breastfeed in public but have not done so.
Mothers who had ever breastfed in public were asked whether they had ever:
had problems finding somewhere to breastfeed their baby in public;
been stopped or made to feel uncomfortable about breastfeeding in public.
The results of these measures were the same at Stage 2 and Stage 3. At Stage 2, just under half (47%) of those who had ever breastfed in public said that they had encountered problems finding somewhere to feed, and 11% said that they had been stopped from breastfeeding or made to feel uncomfortable. On these two measures, little has changed since 2005, when 46% said they had encountered problems findings somewhere to feed, and 13% that they had been stopped or made to feel uncomfortable. This suggests that, although the new legislation may have contributed to mothers feeling more confident about breastfeeding in public (see Sections 10.2 and 10.3), it had had little effect on the attitudes of others by Stage 2 of the survey (although it should be borne in mind that the Equality Act had only been in place for a few months when mothers completed the Stage 2 questionnaire).
Among those who had ever breastfed in public, mothers in Scotland were less likely than mothers in other parts of the UK to report these problems (36% said they had had problems finding somewhere to feed and 8% that they had been stopped or made to feel uncomfortable). This pattern was also evident in 2005 (when the figures were 33% and 8% respectively).7 As legislation in Scotland had been in place for nearly a year when Stage 2 took place in 2005, this may be the reason for the more positive experiences of Scottish mothers at that time. There has been no further reduction in problems experienced by Scottish mothers since 2005, but the situation for Scottish mothers remains more positive than for mothers in other parts of the UK.
Given that most Asian mothers prefer to use special mother and baby facilities (see earlier), it is not surprising that a higher than average proportion of Asian mothers who have breastfed in public reported problems finding somewhere to feed (62% compared with 47% overall).
Table 10.12
Copyright © 2012, Health and Social Care Information Centre. All Rights Reserved. 11
Mothers who had been stopped or made to feel uncomfortable about breastfeeding in a public place were asked where this had occurred. Answers were collected in an open format and later coded into categories. Table 10.13 displays categories mentioned by at least four per cent of mothers at Stage 3. Not all mothers mentioned a specific place, although 48% said that this had occurred in a café or restaurant, 17% in a shop or shopping centre, five per cent at a park/play area and five per cent on public transport. Many mothers mentioned more general feelings of discomfort rather than a specific place – predominantly disapproving looks or negative reactions from the public (31%), or being made to feel embarrassed or self-conscious (17%). The relatively high proportions mentioning these more general feelings suggest that mothers in this situation are rarely asked to stop breastfeeding, but instead made to feel uncomfortable in more subtle ways.
Table 10.13
All mothers who had breastfed in public were asked what factors had discouraged them from breastfeeding in a public place; answers were chosen from a prompted list. Responses given were similar at Stage 2 and 3, so answers have only been presented for the latter. In the UK, three main factors were given: lack of suitable places (48%), lack of confidence (29%) and concerns about hygiene (28%). Nearly a fifth cited concerns about being made to feel uncomfortable (19%), although this relatively low proportion (together with the 2% who said they had been stopped) confirms the findings reported above – that few mothers are actually stopped or discouraged from breastfeeding due to overt negative public reaction. Instead, mothers appear to be more concerned about the presence and suitability of places to breastfeed.
The pattern of results was fairly similar by country, although Scottish mothers breastfeeding in public were less likely than other mothers to say that there was a lack of suitable facilities (41% compared with 48% overall), while mothers in Wales were more likely to mention this (52%). These findings complement those reported for Scottish mothers in section 10.3 – that they are generally less concerned about such facilities.
Table 10.14
Mothers who had not breastfed in public were asked whether they had ever wanted or tried to do so. Of the 42% who had not breastfed in public, most (80%8) had not wanted or tried to, but one in five (20%8) had wanted or tried to (representing 8% of mothers who initially breastfed).
Table 10.15
Mothers who would have liked to have breastfed in public but who had not done so, were asked why this was the case. Answers were picked from a prompted list. As shown in Table 10.16, the main barriers to breastfeeding in public for this group were lack of confidence (56%) and a perceived lack of suitable venues (37%). However, 41% of this subgroup, although they may have liked to have fed in public, said that they simply preferred to feed at home.
Table 10.16
Copyright © 2012, Health and Social Care Information Centre. All Rights Reserved. 12
10.5 Mothers’ feelings about feeding in front of other people
In 2010, mothers’ feelings about feeding in front of others, whether in their own home or in public, were explored for the first time. At Stage 2, all mothers were asked whether they had ever felt uncomfortable about feeding their baby in front of other people. Not surprisingly, mothers were much more likely to report feeling uncomfortable when breastfeeding than when bottle feeding. Among those who had initially breastfed, just under half (45%) said they had felt uncomfortable breastfeeding in front of others. Among those who had ever given milk other than breastmilk, just seven per cent said they had felt uncomfortable bottle feeding.
Discomfort about breastfeeding in front of others was most acute in public places (43% of those who had ever breastfed reported feeling uncomfortable when feeding in public places), but for some it is an issue even at home (13% reported feeling uncomfortable breastfeeding in front of others in their own home). Those who reported that they actually had breastfed in public were more likely to say they felt uncomfortable doing so than those who had not (50% and 33% respectively). This indicates that the 43% of breastfeeding mothers feeling uncomfortable feeding in public places included some mothers who had been put off from doing so altogether.
Among those who breastfed initially, mothers in England were most likely to say they have felt uncomfortable breastfeeding in front of other people (46%), while mothers in Scotland were least likely (39%). As discussed earlier in this section, the fact that legislation protecting mothers’ right to breastfeed in public has been in place in Scotland for longer than the rest of the UK may have engendered a more supportive environment and given mothers greater confidence to breastfeed in front of others.
Those who reported having felt uncomfortable when breastfeeding in front of others were asked to state which people they did not feel confident to feed in front of. By far the most common response was ‘some male relatives or friends’ (73%). Just over a quarter (27%) cited ‘some female relatives or friends’ and 15% said their ‘doctor/GP’.
Linked to earlier findings, Asian mothers were more likely to feel uncomfortable breastfeeding in front of others, as were mothers from Chinese and other ethnic groups (59% and 58% respectively compared with 45% overall). Asian breastfeeding mothers also mentioned a broader range of people they felt uncomfortable feeding in front of than other ethnic groups: they were more likely to feel uncomfortable feeding in front of male (84%) and female (33%) relatives or friends, their doctor/GP (31%) and their midwife (10%).
Although the youngest mothers (those aged under 20) were the least likely to feel uncomfortable feeding in front of others (34% compared with 45% overall), those that did were more likely to indicate feelings of discomfort about feeding in front of health professionals (doctor (32%), health visitor (22%), nurse (19%), midwife (15%)), and peer supporters (19%) than older mothers.
Tables 10.17, 10.18 and 10.19
Copyright © 2012, Health and Social Care Information Centre. All Rights Reserved. 13
10.6 Where should facilities be available for breast and bottle-feeding mothers
All mothers (however their baby was fed) were also asked where they considered it important to have facilities for feeding babies – whether by breast or bottle. Answers were selected from a prompted list, but mothers could also record other places which they felt should have these facilities. The majority of mothers at Stage 2 (90%) agreed that shops/shopping centres should provide such facilities, and there was also widespread support for this at restaurants (75%), doctors’ surgeries (64%) and Children’s Centres and Child Health Clinics (60%).
Results were broadly similar by feeding status, although there were a few differences. Mothers who were only breastfeeding were more likely to mention a need for facilities for feeding babies in libraries (44%), public transport (42%) and public toilets (31%). Mothers who were only formula feeding were more likely think these facilities should be provided in restaurants (78%).
Table 10.20
Copyright © 2012, Health and Social Care Information Centre. All Rights Reserved. 14
Notes and references
1 http://www.equalityni.org/archive/pdf/Sexdiscrim(Amendment)Regs2008uksi20080963en.pdf
2 http://www.legislation.gov.uk/ukpga/2010/15/contents
3 http://www.legislation.gov.uk/asp/2005/1/contents
4http://www.direct.gov.uk/en/Parents/Moneyandworkentitlements/WorkAndFamilies/Pregnancyandmaternityrights/index.htm
5 For more information on the scheme in Northern Ireland, which is facilitated by the Public Health Agency, see
http://breastfedbabies.org/welcomehere Schemes in the rest of the UK are discussed in section 10.2.2 6 See Chapter 9 of the 2005 Infant Feeding Survey report, Table 9.20 http://www.ic.nhs.uk/pubs/ifs2005
7 See Chapter 9 of the 2005 Infant Feeding Survey report, Table 9.25 http://www.ic.nhs.uk/pubs/ifs2005
8 Data not shown.
Copyright © 2012, The Health and Social Care Information Centre. All Rights Reserved. 1
11. Dietary supplements, smoking and drinking during pregnancy
Key findings
The UK health departments advise pregnant women to take a daily supplement of 400 micrograms of folic acid prior to conception and during the first 12 weeks of pregnancy to reduce the risk of neural tube defects, such as spina bifida, in unborn babies. Most mothers (94%) reported that they took folic acid either before or during pregnancy. More than a third (37%) said they took folic acid before they were pregnant, increasing to 79% who reported taking it during the first three months of pregnancy, while 23% took it later on in pregnancy.
Almost two thirds (64%) of all mothers took vitamin or iron supplements (apart from folic acid taken by itself) during pregnancy, which was higher than in 2005 (54%).
Around a quarter of mothers (26%) in the UK smoked in the 12 months before or during their pregnancy, which was down from a third (33%) in 2005. Lower levels of smoking were seen in all countries in the UK.
Mothers in Wales were the most likely to have smoked before or during pregnancy (33%) and mothers in England the least likely (26%).
Twelve per cent of mothers continued to smoke throughout their pregnancy, down from 17% in 2005.
Of mothers who smoked before or during their pregnancy, over half (54%) gave up at some point before the birth.
The highest levels of smoking before or during pregnancy were found among mothers in routine and manual occupations (40%) and among those aged under 20 (57%). Mothers aged under 20 were also the least likely to have given up smoking at some point before or during pregnancy (38%), but by socio-economic group, mothers who had never worked were the least likely to have done so (29%).
Almost nine in ten mothers (88%) who were smoking before or during pregnancy received some type of information on smoking. Midwives were the most common source of information, mentioned by 85% of mothers who had received information. Almost a third of mothers (32%) lived in a household where at least one person smoked during their pregnancy, including just under one in five (19%) where only other people smoked (not the mother herself).
At Stages 2 and 3 (when babies were around four to six months old and eight to ten months old respectively), three per cent of infants lived in a household where at least one person ever smoked in the home.
The UK health departments recommend that women should avoid drinking alcohol before and during pregnancy. Recommendations on drinking during pregnancy have tightened since the 2005 survey, when the guidelines were that drinking up to one or two units of alcohol no more than once or twice a week was regarded as safe. In 2010, two in five mothers (40%) drank alcohol during pregnancy, which was fewer than in 2005 (54%). Mothers aged 35 or over (52%), mothers from managerial and professional occupations (51%) and mothers from a White ethnic background (46%) were more likely to drink during pregnancy. Mothers in England (41%) and Wales (39%) were more likely to drink during pregnancy than mothers in Scotland and Northern Ireland (35% in each).
Copyright © 2012, The Health and Social Care Information Centre. All Rights Reserved. 2
Among mothers who drank during pregnancy consumption levels were low. Only three per cent of all mothers drank more than two units of alcohol per week on average.
Around seven in ten mothers (71%) who drank before pregnancy received information about drinking, with midwives being the most common source (for 81% of mothers who had received any information).
Copyright © 2012, The Health and Social Care Information Centre. All Rights Reserved. 3
This chapter covers dietary supplementation practices: awareness and incidence of folic acid and other supplementation. Although the primary purpose of the survey has always been to monitor infant feeding practices, the survey has also been used to measure the proportion of mothers who smoke and drink during pregnancy and to look at how mothers’ smoking and drinking behaviour changes as a result of their pregnancy. This chapter therefore also examines smoking and drinking behaviour before, during and after pregnancy.
11.1 Taking of dietary supplements during pregnancy
11.1.1 Folic acid
Increasing the intake of folic acid in early pregnancy helps to reduce the risk of neural tube defects, such as spina bifida, in unborn babies1. The UK health departments advise pregnant women to take a daily supplement of 400 micrograms of folic acid prior to conception and during the first 12 weeks of pregnancy. Women with a prior history of neural tube defects, with epilepsy or diabetes are advised to discuss the need to take an increased dose of 5mg folic acid with their doctor.
Awareness of why folic acid is recommended At Stage 1 of the survey all mothers were asked if they knew why increasing their intake of folic acid is recommended either when planning or during pregnancy. Across the UK, 71% of mothers reported that they knew why increasing the intake of folic acid when planning or during pregnancy was recommended, a decrease since 2005 when 79%2 were aware of this recommendation. It is possible that this decrease is at least partially due to a small change in the question wording: in 2005 mothers were asked whether they were aware of the benefits ‘immediately before or during pregnancy’ whilst in 2010 they were asked about the benefits ‘either when planning or during pregnancy’. Mothers in Northern Ireland (78%) and Scotland (75%) were more likely than mothers in other countries to say that they knew why increasing the intake of folic acid was recommended. Mothers from managerial and professional groups (86%) and older mothers (85% of those aged 35 or over) were the most likely to know why increased intake of folic acid was recommended before and during early pregnancy. Mothers who said they knew why increasing their intake of folic acid was recommended were asked if they knew the reasons for this recommendation. Answers were collected in an open format and later coded into categories.
Table 11.1 also shows that just under half of all mothers (47%) who said they knew why increased folic acid was recommended before or during pregnancy mentioned the reduced risk of spina bifida, while a further 12% mentioned something to do with the spine or spinal cord.
Some mothers knew that increasing folic acid intake had a positive impact on the development of the baby, without being able to be more precise. For example, 16% of mothers said that increased folic acid intake helped with the growth or development of the baby, while 8% said that it helped to reduce the risks of abnormalities.
Table 11.1
Copyright © 2012, The Health and Social Care Information Centre. All Rights Reserved. 4
Taking folic acid before or during pregnancy All mothers were asked whether they had taken folic acid before they became pregnant, during the first three months of pregnancy, or later on in the pregnancy. The question was changed in 2010, so results are not directly comparable with the 2005 survey. Table 11.2 shows that most mothers (94%) reported taking folic acid either before or during their pregnancy. More than a third (37%) said they took folic acid before they were pregnant, increasing to 79% who reported taking it during the first three months of pregnancy, while 23% took it later on in pregnancy. Mothers in Northern Ireland (97%) were most likely to have taken folic acid before or during pregnancy. They were also the most likely group to have taken folic acid before pregnancy (42%) while mothers in Wales were least likely (34%). Mothers from managerial and professional and intermediate occupations were more likely than other mothers to have taken folic acid before or during pregnancy (98% and 97% respectively). Although it was lower for mothers from routine and manual occupations (93%), the differential was most marked for mothers who had never worked, where only 82% had taken folic acid. The greatest variation by socio-economic group was seen for taking folic acid before pregnancy. Fifty-two per cent of managerial and professional mothers reported taking folic acid prior to pregnancy, compared with 39% of intermediate occupations, 25% of routine and manual occupations and just 15% of those who had never worked. Young mothers under the age of 20 were less likely to take folic acid than average (83% compared with 94%). Older mothers were much more likely than younger mothers to have taken folic acid prior to pregnancy, increasing from 7% of mothers aged under 20 to 52% of those aged 35 or over. White mothers were a little more likely to have taken folic acid (95%) than mothers from ethnic minority groups (91% of Black mothers, 90% of Asian mothers and 89% for both mothers of Mixed and Chinese or other ethnic origin). This pattern was most pronounced among those taking folic acid prior to pregnancy; 39% of White mothers did so, compared with 27% of Asian mothers, 25% of mothers from a Mixed ethnic background and 23% of Black mothers. The findings for mothers from Chinese or other ethnic groups were slightly different: they were as likely as White mothers to take folic acid prior to pregnancy (39%), however they were less likely than average to take folic acid in the first three months of pregnancy (68%). There was an association between mothers’ awareness of the benefits of taking folic acid before or during pregnancy and taking folic acid. Overall, 97% of mothers aware of the benefits took folic acid either before or during pregnancy, compared with 87% of those who were unaware. The strongest association was for taking folic acid before pregnancy: 44% of those aware of the benefits took folic acid before they were pregnant, compared with 19% of those who were not aware.
Table 11.2
11.1.2 Other dietary supplements taken during pregnancy
Apart from increasing their intake of folic acid, pregnant women are recommended to ensure they take sufficient iron and vitamin D during pregnancy.3 Women are advised to take vitamin D supplements during pregnancy and while breastfeeding, to ensure their own needs for vitamin D are met and so that their baby is born with enough stores of vitamin D for the first few months of life. Other groups at risk of vitamin D deficiency include people who have darker skin and people who are not exposed to a sufficient level of sunlight (since the main source of vitamin D is direct sunlight on skin), for example those who cover their skin.
Copyright © 2012, The Health and Social Care Information Centre. All Rights Reserved. 5
Pregnant women can generally get sufficient iron through their diet, but may be recommended to take iron supplements during pregnancy by their health professional if they are low on iron. Pregnant women are also specifically recommended to avoid taking supplements with high levels of vitamin A. At Stage 1 of the survey all mothers were asked if they had taken extra vitamin or iron supplements while they were pregnant (apart from folic acid).
Table 11.3 shows that 64% of mothers across the UK took some form of vitamin or mineral supplements (apart from folic acid by itself) during their pregnancy. This was higher than reported in 2005, when the figure was 54%. Mothers in Northern Ireland were the most likely to have taken supplements during pregnancy (73%), while mothers in Scotland and Wales were the least likely (both 60%).
There was some variation in the proportion of mothers taking supplements during pregnancy by socio-demographic characteristics, as with taking folic acid. For example, 71% of mothers from managerial and professional occupation groups took some form of dietary supplements compared with 59% of mothers from routine and manual occupations and 58% of those who had never worked. Younger mothers were less likely to have taken supplements during pregnancy than older mothers (54% of mothers aged under 20 compared with 68% of mothers aged 30-34 and 69% of mothers aged 35 or older.)
As in 2005, the most common type of supplement taken by mothers during their pregnancy was iron, taken either as a single supplement or in combination with vitamins. Across the UK, almost three in ten (28%) mothers took an iron only supplement during pregnancy, while a further 18% took iron combined with multi-vitamins. Eleven per cent took multi-vitamins only and six per cent took a combined vitamin, iron and folic acid supplement. Three per cent specifically mentioned they had taken Healthy Start vitamins (which contain folic acid and vitamins C and D) and the same proportion mentioned taking a vitamin D supplement.
Mothers in Northern Ireland were the most likely to take some form of iron supplement (39% iron only; 22% multi-vitamins and iron combined, compared with 28% and 18% respectively overall). Mothers aged under 20 and those who had never worked were more likely to take iron only (37% for each). Mothers aged 30-34 and 35 or over and those in managerial and professional occupations were more likely to take multi-vitamins and iron combined (23%, 23% and 26% respectively).
The proportion of mothers taking iron only and vitamins and iron has remained similar to 2005 (28% compared with 29% in 2005; 18% compared with 17% in 2005). The increase since 2005 has therefore come from other types of supplement. Taking vitamins only increased from 7% in 2005 to 11% in 2010. A wider range of other types of supplement were mentioned in 2010 than was the case in 2005.
Table 11.3
Copyright © 2012, The Health and Social Care Information Centre. All Rights Reserved. 6
11.2 Smoking
Government policies relating to smoking during pregnancy in England include Every Child Matters (HM Government, 2004), Maternity Matters: choice, access and continuity of care in a safe service (DH, 2007), the Cancer Reform Strategy (DH, 2007), Health Inequalities: progress and next steps (DH 2008), and the Implementation Plan for reducing health inequalities in infant mortality: a good practice guide (DH, 2007). In June 2010, NICE issued guidance on how to stop smoking during pregnancy and following childbirth.4
Most recently, the Department of Health's (DH) Tobacco Control Plan for England5, published in March 2011, outlined the action that the Government will take nationally until 2015 to continue to drive down the prevalence of smoking and to support comprehensive tobacco control in local areas. It includes a national target to reduce smoking during pregnancy to 11% or less by the end of 2015 (baseline measure of 14.1% in 2009/10). This target is to be specifically measured by the smoking status at time of delivery statistical collection (SSATOD6, recorded at the time of giving birth) published by HSCIC (previously DH). These data (which are also available quarterly) show that the proportion of mothers smoking at delivery in England was 13.5% in 2010/11, lower than the 2009/10 outturn (14.1%) and 2008/09 outturn (14.4%).7 The nearest IFS estimate which could be used as a proxy measure is the proportion of mothers who smoked throughout pregnancy.
There was a further national target in Scotland to reduce smoking during pregnancy, which sought a reduction in the proportion of women who smoke during pregnancy from 29% to 23% between 1995 and 2005 and to 20% by 2010. The proportion of women in Scotland smoking during pregnancy in 2009/10 it was 18.8%.8
More generally, a key policy development since the 2005 Infant Feeding Survey has been the introduction of smokefree legislation across the UK. Legislation came into force in Wales in April 2007 and England in July 2007, making it against the law to smoke in virtually all 'enclosed' and 'substantially enclosed' public places and workplaces.9 Similar legislation was also introduced in Scotland in March 200610 and in Northern Ireland in April 200711. This has had a wider impact on smoking behaviour which may in turn have affected the smoking behaviour of mothers and their families.
More recently, the Scottish Government recognised the need for increased emphasis on preventing smoking uptake in the first place and, in May 2008, published a new Smoking Prevention Action Plan "Scotland's Future is Smoke-free" setting out a programme of measures in this respect. These proposals were incorporated in the Tobacco and Primary Medical Services (Scotland) Act 2010 which updates the law relating to the sale and display of tobacco products. As a result a number of new controls on the sale of tobacco came into force with effect from 1 April 2011 and 1 October 2011 including a registration scheme for tobacco retailers.
A Tobacco Control Action Plan for Wales has been published recently, which includes smoking in pregnancy, using this survey as an indicator.12
A new ten-year strategy for the future of tobacco control in Northern Ireland was published in February 2012.13 While the strategy is aimed at the entire population, it identifies pregnant women, and their partners who smoke as a key priority group requiring more focused action. An aspirational target has been included in the strategy to reduce the proportion of pregnant women who smoke to 9% by 2020.
Copyright © 2012, The Health and Social Care Information Centre. All Rights Reserved. 7
At Stage 1 of the survey, when most babies were between four and ten weeks, all mothers were asked a number of questions about their smoking: if they had ever smoked, if they had smoked at all in the two years before the survey, if they smoked at all now and if they smoked at all during pregnancy, after they found out they were pregnant. They were also asked questions about the smoking habits of other people who lived with them. At Stages 2 and 3 of the survey, mothers were asked about their current smoking behaviour meaning that any changes to their smoking behaviour could be tracked after the birth.
11.2.1 Smoking during pregnancy
Table 11.4 shows a detailed breakdown of mothers smoking behaviour in each country. Over seven in ten mothers (74%) across the UK were classified as non-smokers. Over half of all mothers (58%) had never smoked, while a further 16% had given up smoking more than a year before their current pregnancy. Over a quarter of mothers (26%) were classified as smokers, meaning that they smoked during their pregnancy or in the year before it. Twelve per cent of mothers smoked throughout their pregnancy, while 14% of mothers smoked in the year before but gave up at some point either before or during their pregnancy.
Of the 14% of mothers who gave up before or during pregnancy, four per cent gave up in the year before pregnancy; nine per cent gave up on confirmation of their pregnancy, while one per cent gave up later in pregnancy and stayed stopped throughout.
Of the 12% of mothers who smoked throughout their pregnancy, one per cent tried to give up during
pregnancy but started again before the birth, while nine per cent cut down the amount they smoked.
Table 11.4
Copyright © 2012, The Health and Social Care Information Centre. All Rights Reserved. 8
The rest of the analysis on mothers’ smoking behaviour summarises the detailed information presented in Table 11.4 into three main categories as follows:
Smoked before or during pregnancy is the proportion of women who smoked at all in the two years before they completed Stage 1 of the survey. This roughly covers the period of their pregnancy plus the year before conception.
Smoked throughout pregnancy is the proportion of women who smoked in the two years before they completed Stage 1 of the survey and who were smoking at the time of their baby’s birth. It included women who may have given up smoking before or during their pregnancy, but who had restarted before the birth.
Gave up smoking before or during pregnancy is the proportion of women who smoked in the two years before they completed Stage 1 of the survey and who gave up during this period and had not restarted before the birth of their baby.
Table 11.5 shows that in 2010, around a quarter (26%) of mothers in the UK smoked before or during their pregnancy. Smoking levels before or during pregnancy were highest in Wales (33%) and lowest in England (26%).
Among mothers who smoked before or during pregnancy, over half (54%) gave up at some stage before the birth. Mothers in England were most likely to give up smoking before or during pregnancy (55%), whereas those in Northern Ireland were the least likely to give up (47%).
Across the UK, one in eight mothers (12%) continued to smoke throughout pregnancy, and were still smoking after the baby was born. Mothers in Wales were most likely to smoke throughout their pregnancy (16%).
Across the UK, the proportion of mothers smoking before or during pregnancy fell from 33% to 26% between 2005 and 2010. Lower levels of smoking were seen in all countries in 2010 compared to 2005. The most significant decreases in smoking levels before or during pregnancy were in Scotland, where smoking levels fell from 35% to 27%, and in England, where they fell from 32% to 26%.
Mothers who smoked were more likely to give up before or during pregnancy in 2010 than in 2005 (54% and 48% respectively). Hence, a smaller proportion of all mothers smoked throughout pregnancy in 2010 (12% compared to 17% in 2005, in line with the downward trend of the SSATOD data and set target). This is true for all countries where time trend data are available.
Table 11.5 and Figure 11.1
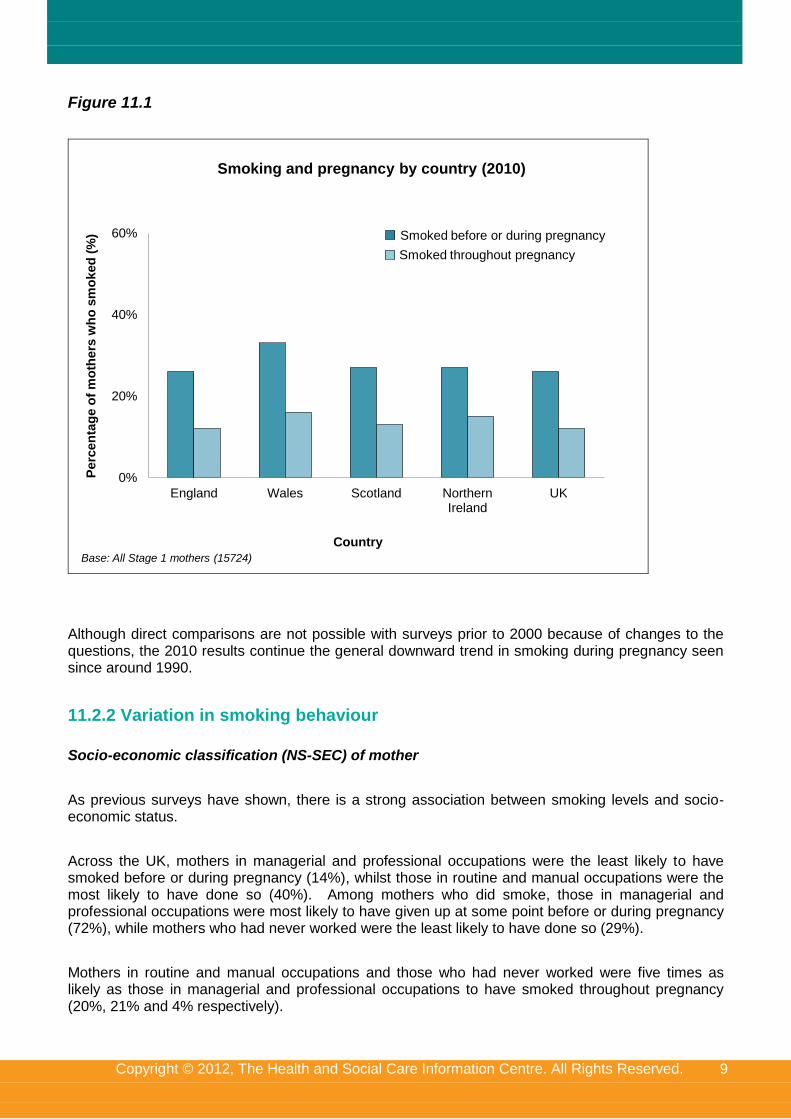
Copyright © 2012, The Health and Social Care Information Centre. All Rights Reserved. 9
Figure 11.1
0%
20%
40%
60%
England Wales Scotland Northern Ireland
UK
Perc
en
tag
e o
f m
oth
ers
wh
o s
mo
ked
(%
)
Base: All Stage 1 mothers (15724)
Smoking and pregnancy by country (2010)
Country
Smoked before or during pregnancy
Smoked throughout pregnancy
Although direct comparisons are not possible with surveys prior to 2000 because of changes to the questions, the 2010 results continue the general downward trend in smoking during pregnancy seen since around 1990.
11.2.2 Variation in smoking behaviour
Socio-economic classification (NS-SEC) of mother
As previous surveys have shown, there is a strong association between smoking levels and socio-economic status.
Across the UK, mothers in managerial and professional occupations were the least likely to have smoked before or during pregnancy (14%), whilst those in routine and manual occupations were the most likely to have done so (40%). Among mothers who did smoke, those in managerial and professional occupations were most likely to have given up at some point before or during pregnancy (72%), while mothers who had never worked were the least likely to have done so (29%).
Mothers in routine and manual occupations and those who had never worked were five times as likely as those in managerial and professional occupations to have smoked throughout pregnancy (20%, 21% and 4% respectively).
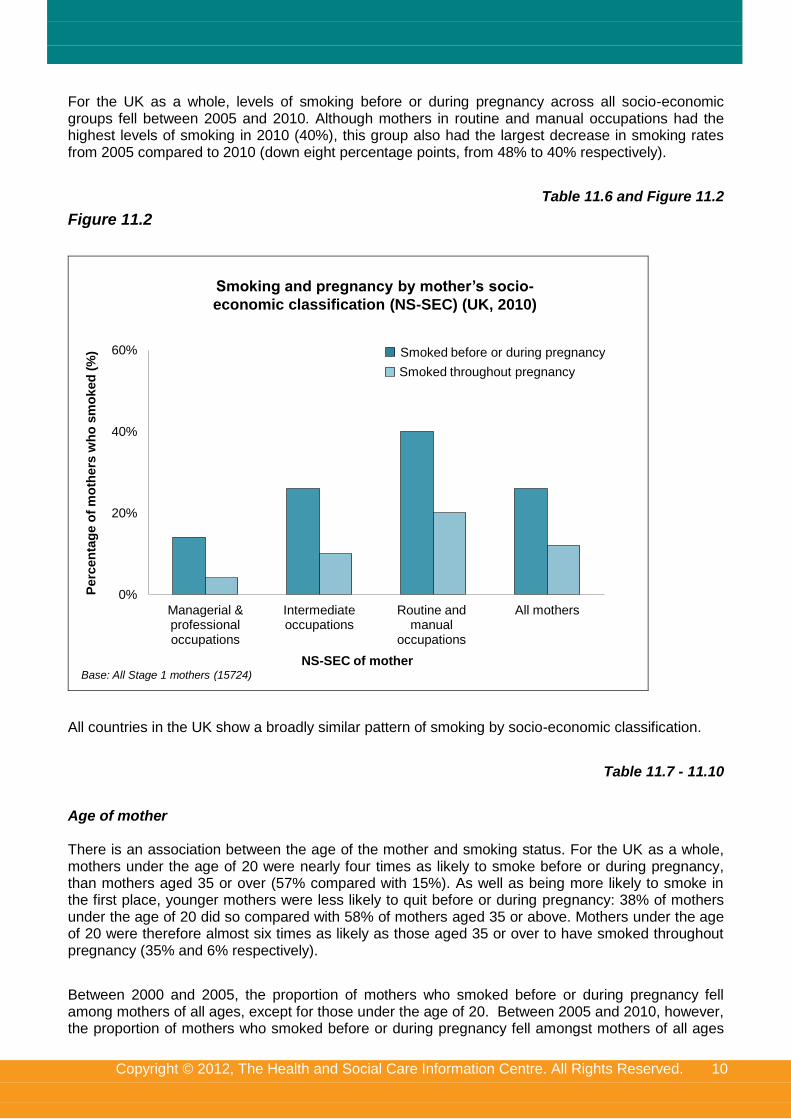
Copyright © 2012, The Health and Social Care Information Centre. All Rights Reserved. 10
For the UK as a whole, levels of smoking before or during pregnancy across all socio-economic groups fell between 2005 and 2010. Although mothers in routine and manual occupations had the highest levels of smoking in 2010 (40%), this group also had the largest decrease in smoking rates from 2005 compared to 2010 (down eight percentage points, from 48% to 40% respectively).
Table 11.6 and Figure 11.2
Figure 11.2
0%
20%
40%
60%
Managerial & professional occupations
Intermediate occupations
Routine and manual
occupations
All mothers
Perc
en
tag
e o
f m
oth
ers
wh
o s
mo
ked
(%
)
Base: All Stage 1 mothers (15724)
Smoking and pregnancy by mother’s socio-
economic classification (NS-SEC) (UK, 2010)
Smoked before or during pregnancy
Smoked throughout pregnancy
NS-SEC of mother
All countries in the UK show a broadly similar pattern of smoking by socio-economic classification.
Table 11.7 - 11.10
Age of mother There is an association between the age of the mother and smoking status. For the UK as a whole, mothers under the age of 20 were nearly four times as likely to smoke before or during pregnancy, than mothers aged 35 or over (57% compared with 15%). As well as being more likely to smoke in the first place, younger mothers were less likely to quit before or during pregnancy: 38% of mothers under the age of 20 did so compared with 58% of mothers aged 35 or above. Mothers under the age of 20 were therefore almost six times as likely as those aged 35 or over to have smoked throughout pregnancy (35% and 6% respectively).
Between 2000 and 2005, the proportion of mothers who smoked before or during pregnancy fell among mothers of all ages, except for those under the age of 20. Between 2005 and 2010, however, the proportion of mothers who smoked before or during pregnancy fell amongst mothers of all ages
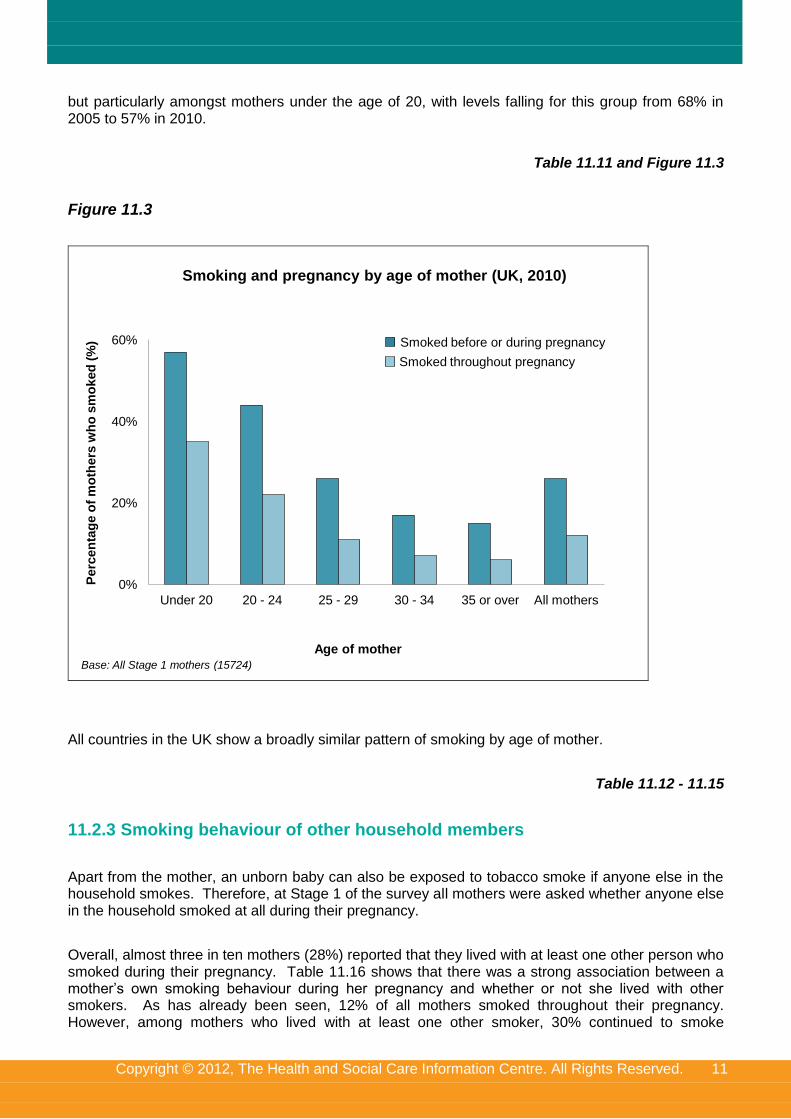
Copyright © 2012, The Health and Social Care Information Centre. All Rights Reserved. 11
but particularly amongst mothers under the age of 20, with levels falling for this group from 68% in 2005 to 57% in 2010.
Table 11.11 and Figure 11.3
Figure 11.3
0%
20%
40%
60%
Under 20 20 - 24 25 - 29 30 - 34 35 or over All mothers
Perc
en
tag
e o
f m
oth
ers
wh
o s
mo
ked
(%
)
Base: All Stage 1 mothers (15724)
Smoking and pregnancy by age of mother (UK, 2010)
Age of mother
Smoked before or during pregnancy
Smoked throughout pregnancy
All countries in the UK show a broadly similar pattern of smoking by age of mother.
Table 11.12 - 11.15
11.2.3 Smoking behaviour of other household members
Apart from the mother, an unborn baby can also be exposed to tobacco smoke if anyone else in the household smokes. Therefore, at Stage 1 of the survey all mothers were asked whether anyone else in the household smoked at all during their pregnancy.
Overall, almost three in ten mothers (28%) reported that they lived with at least one other person who smoked during their pregnancy. Table 11.16 shows that there was a strong association between a mother’s own smoking behaviour during her pregnancy and whether or not she lived with other smokers. As has already been seen, 12% of all mothers smoked throughout their pregnancy. However, among mothers who lived with at least one other smoker, 30% continued to smoke
Copyright © 2012, The Health and Social Care Information Centre. All Rights Reserved. 12
throughout their pregnancy compared with only five per cent of mothers who did not live with any other smokers.
Table 11.16
By considering the smoking behaviour of everyone in the household it is possible to work out the proportion of mothers who had any exposure to tobacco smoke in the home during their pregnancy.
Table 11.17 shows that across the UK 68% of mothers lived in a household where no-one, including themselves, smoked during their pregnancy, an increase from 62% in 2005. Conversely, 32% lived in a household where at least one person smoked during their pregnancy. Just under one in five mothers (19%) lived in a household where only other people smoked, while four per cent lived in households where only the mother herself smoked during pregnancy. In eight per cent of households both the mother and others in the household smoked during the pregnancy.
Mothers in Wales were a little more likely than average to live in a household where at least one person smoked during their pregnancy (36%), compared with mothers in England (31%), Northern Ireland (33%) and Scotland (32%).
Table 11.17
11.2.4 Information received on smoking during pregnancy
Mothers were asked whether or not they had received any information about smoking during their pregnancy. Those who reported that they had received some information were asked what sort of information they had received. Mothers could choose from a list and/or write in other types of information they had received. Almost nine in ten mothers (88%) who were smoking before or during their pregnancy said they had received some type of information about smoking, a similar proportion to 2005 (87%)14. Nearly four-fifths (79%) of mothers who were smoking before or during pregnancy said they received information on the effects of smoking on the baby, and around three-fifths had received information about the dangers of sharing a bed with their baby and smoking (60%) and the risks to continuing to smoke in pregnancy (59%). Over half (53%) had been given information on how to stop smoking, and a third each had received information on how to cut down smoking (32%) and how their partner could stop smoking (33%).
Mothers in Northern Ireland who were smoking before or during pregnancy were most likely to have received information about smoking (93% compared with 88% across the UK). They were also more likely to have received a number of specific types of information, in particular about dangers of sharing a bed with your baby and smoking (70% compared with 60% overall) and the risks of continuing to smoke in pregnancy (67% compared with 59% overall).
Table 11.18
Midwives were the most common source of information about smoking, mentioned by 85% of mothers who had received information about smoking. A fifth (20%) of those who received information on smoking mentioned health visitors as a source of information, while a similar proportion (19%) mentioned doctors. Books, leaflets or magazines were also an important source of information, with 29% using these.
Copyright © 2012, The Health and Social Care Information Centre. All Rights Reserved. 13
Sources of smoking information were broadly similar in all countries. However, mothers in Wales were the most likely to have received information about smoking from a midwife (89%) and least likely to have done so from a doctor (16%). Mothers in Northern Ireland were more likely than mothers in other countries to have received information about smoking from a doctor (33% compared with 19% overall) or a nurse (11% compared with 5% overall).
Relative to 2005, mothers mentioned a smaller range of sources of information15 and were much less likely to mention receiving information from their doctor/GP (34% in 2005 and 19% in 2010) or a partner, friend or relative (27% and 8% respectively). Television and radio also had less influence in 2010 than in 2005, dropping from 17% in 2005 to 5% in 2010. However, the proportion of mothers mentioning the midwife was only slightly lower in 2010 than 2005 (89% in 2005 and 85% in 2010).
Table 11.19
11.2.5 Smoking behaviour after the birth
Although the survey was primarily interested in smoking behaviour during pregnancy, questions about smoking after the birth were also asked at all stages of the survey. Using this information it is possible to examine whether mothers who gave up during pregnancy remained stopped in the months after the birth, and also whether mothers who smoked throughout pregnancy changed their smoking behaviour after the baby was born.
Table 11.20 shows that a quarter of mothers (25%) were smoking before or during pregnancy16. At Stage 1 of the survey, the proportion of mothers who reported they were currently smoking (i.e. when the baby was about four to six weeks old) was 13%, reflecting the fact that many mothers had quit during pregnancy and had remained stopped after the birth. At Stages 2 and 3 of the survey a similar proportion of mothers reported currently smoking (14% at Stage 2 and 15% at Stage 3).
Although these figures might suggest that there was not much change in the smoking behaviour of mothers in the year after birth, the overall smoking rate at each stage of the survey actually hides the fact that a lot of mothers did change their smoking behaviour during this period, although these changes tended to cancel each other out. In other words, while some mothers who had stopped smoking during pregnancy started again after the birth, others who had smoked throughout pregnancy stopped or made attempts to stop once their baby was born.
Table 11.20 shows the smoking behaviour of mothers after birth broken down by their smoking behaviour during pregnancy. This shows that while most mothers who gave up before or during pregnancy managed to stay stopped after the birth, a minority did start smoking again. At Stage 1, 80% of mothers who had quit before or during pregnancy were still not smoking, although this had fallen to 75% by Stage 2 and to 69% by Stage 3. This means that less than a year after the birth of their baby, over three in ten mothers (31%) who had stopped during pregnancy were smoking again.
Among mothers who continued to smoke throughout pregnancy, nine in ten (91%) were smoking at Stage 1 of the survey, while 87% were smoking at Stage 2 and 87% at Stage 3. This means that at both Stages 2 and 3 of the survey over one in ten mothers who had smoked throughout their pregnancy were not currently smoking. It is worth noting, however, that the 13% of these mothers who had stopped smoking at Stage 2 and the 13% who had stopped smoking at Stage 3 were not all the same mothers. In fact, among mothers who had smoked throughout pregnancy only nine per cent were not smoking at both Stage 2 and Stage 3 of the survey (data not shown). This suggests that there is a fair amount of fluctuation in mothers’ smoking behaviour, with some mothers making
Copyright © 2012, The Health and Social Care Information Centre. All Rights Reserved. 14
repeated quit attempts in the period immediately after birth and going from smoking to not smoking at different times.
Table 11.20
11.2.6 Smoking behaviour of partners after the birth
At all stages of the survey mothers were also asked whether anyone else in the household was currently smoking, meaning that a similar analysis of changes in partners’ smoking behaviour after the birth can be done.
Table 11.21 shows that 23% of all mothers had a partner who smoked during their pregnancy. At Stage 1 of the survey, 20% of mothers reported that their partner currently smoked, while at both Stages 2 and 3 it was 18%. The decrease of five percentage points from 23% during pregnancy to 18% at Stage 3 suggests that while pregnancy and the birth of their baby did motivate some partners to quit smoking, the impact was not as great as it was on mothers’ smoking behaviour (which went down ten percentage points from 25% during pregnancy to 15% at Stage 3).
However, some partners who smoked during the pregnancy did try to give up after the birth. Thus, 14% of partners who smoked during the pregnancy were not smoking at Stage 1, and this had risen to 26% at Stage 2 and 28% at Stage 3. As with mothers themselves, there was quite a bit of fluctuation in smoking behaviour over time. Thus, only ten per cent of partners who smoked during pregnancy were not smoking at all three stages after the birth (data not shown).
Table 11.21
11.2.7 Smoking in the home
At Stages 2 and 3 of the survey mothers were asked not only whether they or anyone else in the household smoked, but also whether anyone ever smoked inside the home. This gives some indication of the proportion of young infants who are likely to be exposed to tobacco smoke in the home.
Table 11.22 shows that at Stage 2 of the survey only 13% of mothers who were currently smoking said they ever smoked in the home. Mothers in Scotland were the most likely to say they ever smoked in the home (24%), while mothers in Northern Ireland were the least likely to smoke in the home (7%). At Stage 3 of the survey, the proportion of mothers who smoked saying they ever smoked in the home had decreased to 9%, with a broadly similar pattern evident by country (from 15% in Scotland to 4% in Northern Ireland).
In households where there were other smokers, at Stage 2 of the survey 12% of mothers across the UK said they lived with at least one other smoker who ever smoked in the home. Again, mothers in Scotland were most likely to live with a smoker who ever smoked in the home (18%). At Stage 3, 10% of mothers said that they lived with at least one other person who ever smoked in the home.
Table 11.22
Copyright © 2012, The Health and Social Care Information Centre. All Rights Reserved. 15
Table 11.23 shows the proportion of all households where someone ever smoked in the home at Stage 2 or Stage 3 of the survey. At Stage 2, two per cent of all mothers said they smoked in the home, while three per cent of mothers said they lived with at least one other person who ever smoked in the home. Overall, this meant that three per cent of infants lived in a household where at least one person ever smoked in the home. Infants in Scotland and Wales were more likely than children in other countries to live in a household where someone ever smoked in the home (5% and 4% respectively at Stage 2). At Stage 3 the proportion of infants living in a household where at least one person ever smoked in the home was three per cent.
Table 11.23
11.2.8 Information received on smoking after the birth
For the first time in 2010, all mothers were asked at Stage 3 whether or not they had received any information about smoking after their baby was born. Almost one third (32%) of all mothers said they had received some type of information about smoking after their baby was born. As with information on smoking during pregnancy, mothers in Northern Ireland the most likely to have received such information (36%).
Over a quarter (27%) of mothers said they received information on the effects of smoking on the baby, and around one fifth had been told about the dangers of sharing a bed with your baby and smoking (19%). Around one in seven (15%) had been given information on how to stop smoking, and one in ten had received information on how to cut down smoking (10%) and how their partner could stop smoking (10%). Six per cent specifically mentioned that they had been given information on using a nicotine patch to help them stop smoking.
Mothers in Northern Ireland were more likely than mothers in other countries to have received information on the effects of smoking on the baby (30%) and the dangers of bed sharing and smoking (22%).
Table 11.24
Health visitors were the most common source of information about smoking, mentioned by over half (52%) of mothers who had received information about smoking. Almost half (45%) of mothers who had received information, mentioned their midwife as a source of information. Around a third (32%) of those who received information on smoking mentioned written materials (books, leaflets or magazines), whilst around one in five (21%) mentioned a SureStart or Children’s Centre / Children’s Health Clinic. Just under one in five (18%) got information about smoking from their GP or doctor.
Mothers in Northern Ireland were more likely to have received information from a health visitor (62%) or a doctor or GP (22%). Mothers in England were more likely to have received information from books, leaflets or magazines (33%) or a SureStart or Children’s Centre / Children’s Health Clinic (23%).
Table 11.25
Copyright © 2012, The Health and Social Care Information Centre. All Rights Reserved. 16
11.3 Drinking during pregnancy
The UK health departments recommend that women should avoid drinking alcohol before and during pregnancy.17 Recommendations on drinking during pregnancy have tightened since the 2005 survey, when the guidelines were that drinking up to one or two units of alcohol no more than once or twice a week was regarded as safe for pregnant women18.
At Stage 1 of the survey mothers were asked whether they had drunk alcohol in the past two years19 and asked about their drinking behaviour during pregnancy. Mothers who had drunk during pregnancy were asked how often they drank different types of alcohol and the amount they usually consumed each time they had a drink. From this information it was possible to assess the number of units consumed per week during pregnancy. The questions on drinking asked in the 2010 survey included low alcohol drinks as an option for the first time but otherwise were the same as in 2005, so comparisons should be made with caution.
11.3.1 Trends in drinking during pregnancy by country
In 2010, 81% of mothers across the UK had drunk alcohol in the two previous years, similar to the proportion found in 2005 (83%). However, only 40% of mothers in 2010 had drunk during pregnancy, a reduction on the 2005 figure of 54%.
Mothers in Northern Ireland (35%) and Scotland (35%) were less likely to have drunk during pregnancy compared with mothers in England (41%) and Wales (39%). The decrease in the proportion of mothers drinking during pregnancy since 2005 was seen in all countries (from 55% in 2005 to 41% in 2010 in England, 55% to 39% respectively in Wales, 50% to 35% respectively in Scotland and 46% to 35% respectively in Northern Ireland.
Among mothers who drank alcohol before pregnancy, almost half (49%) gave up drinking completely during pregnancy, whilst a slightly lower proportion (46%) cut down the amount they drank. This compares with 34% giving up alcohol during pregnancy and 61% cutting down in 2005. Only two per cent of mothers who drank before pregnancy said they made no change to their drinking behaviour as a result of their pregnancy.
Mothers who drank before pregnancy in Scotland, Northern Ireland and Wales were the most likely to give up drinking during pregnancy (59%, 58% and 55% respectively compared with 48% of mothers in England), whilst mothers in England were more likely to say they drank less (47% compared with 42% in Wales, 38% in Northern Ireland and 37% in Scotland). Again, the increase in the proportion of mothers who drank before pregnancy giving up drinking was evident in all countries. It increased from 33% in 2005 to 48% in 2010 in England, 37% to 55% respectively in Wales, 41% to 59% respectively in Scotland and 43% to 58% respectively in Northern Ireland.
Table 11.26
Table 11.27 outlines the most common reasons given by mothers for giving up or cutting down on drinking was because of a concern that alcohol might harm the baby, which was mentioned by 86% of mothers who cut down or stopped. Other reasons mentioned by mothers were because they disliked the taste of alcohol (8%) and because it made them feel sick or unwell (8%).
Table 11.27
Copyright © 2012, The Health and Social Care Information Centre. All Rights Reserved. 17
11.3.2 Variations in drinking during pregnancy
Socio-economic classification (NS-SEC) of mother
Table 11.26 shows that mothers from managerial and professional occupations (90%) and from intermediate occupations (87%) were the most likely to drink before pregnancy, while mothers from routine and manual occupations (81%) were less likely and mothers who had never worked (46%) were the least likely. A similar difference was evident in terms of drinking during pregnancy, with 51% of mothers from managerial and professional occupations drinking during pregnancy compared with only 18% of mothers who had never worked.
Among mothers who drank before pregnancy, mothers who had never worked (59%) and mothers from routine and manual occupations (55%) were the most likely to have given up drinking, while mothers from managerial and professional occupations (43%) were the least likely to have given up.
Ethnicity of mother
The differences seen by socio-economic classification are linked to ethnicity. As discussed in Chapter 1, mothers of minority ethnic groups, and particularly those from an Asian background, are more likely to be in the ‘never worked’ category; both groups were less likely to drink before and during pregnancy.
As shown in Table 11.26, White mothers were the most likely to drink before pregnancy (90% compared with mothers from Mixed (76%), Black (49%), Chinese or other (48%) and Asian (24%) backgrounds) and were also more likely to drink during pregnancy (46% compared with mothers from Mixed (34%), Black (23%), Chinese or other (23%) and Asian (6%) backgrounds).
Among mothers who drank before pregnancy, White mothers were least likely to give up drinking whilst pregnant (49%) and mothers from an Asian background the most likely (71%).
Age of mother
Table 11.26 also shows that across the UK there was no clear pattern between drinking before pregnancy and the age of the mother. For example, 84% of mothers aged under 20 drank alcohol in the two years before pregnancy compared with 85% of mothers aged 35 or over.
However, there was a clear association between drinking during pregnancy and mother’s age, with older mothers being more likely than younger mothers to do so. Thus, 28% of mothers aged under 20 drank during pregnancy compared with 52% of mothers aged 35 or over.
Among mothers who drank before pregnancy, younger mothers were more likely than older mothers to give up. For example, 66% of mothers aged under 20 who drank before pregnancy gave up drinking alcohol during their pregnancy compared with 38% of mothers aged 35 or over. By contrast, older mothers were more likely to cut down compared with younger mothers. Thus, 57% of mothers aged 35 or over cut down on drinking during pregnancy compared with 29% of mothers aged under 20.
Table 11.27
Copyright © 2012, The Health and Social Care Information Centre. All Rights Reserved. 18
11.3.3 Consumption of alcohol during pregnancy
Mothers had an extremely low alcohol consumption level in terms of average weekly units. Across the UK, 93% of mothers either did not drink at all during pregnancy or drank less than one unit per week on average.20 A further four per cent of mothers drank one to two units per week on average.
Only three per cent of mothers drank more than two units per week on average.
As shown in Table 11.28, levels of alcohol consumption were broadly the same across all countries, although mothers in England were slightly less likely to have not drunk at all (64% compared with 66% in Wales and 69% each in Scotland and Northern Ireland).
Table 11.28
11.3.4 Information received on drinking during pregnancy
Seven in ten mothers (71%) who drank before pregnancy received some sort of information about drinking during pregnancy. Mothers in Northern Ireland (80%) and Scotland (77%) were the most likely to receive information about drinking.
Over three-fifths (62%) of those who drank before pregnancy said they had been given general information about the effects of drinking alcohol on the baby. Two-fifths (41%) said they had been given information on the dangers of sharing a bed with your baby and drinking alcohol. More than a third (36%) said they had been given information on how to cut down or limit the amount they drank during pregnancy, while almost three in ten (29%) said they had been given information on stopping drinking alcohol completely.
Table 11.29
Among those who received information about drinking the most common source of information was from a midwife (81%), followed by information from leaflets, booklets or magazines (34%), or from a doctor (13%) or a health visitor (14%). Mothers in Northern Ireland were the most likely to receive information about drinking from a doctor (20%), while mothers in Wales were the least likely (9%). These patterns are similar to those found in 2005.
Table 11.30
Table 11.31 shows that receiving information on drinking during pregnancy had little effect on how mothers actually changed their drinking behaviour. Mothers who had received some form of information about drinking during pregnancy were slightly more likely than mothers who had not received information to drink less (48% compared with 42%) but were consequently less likely to have given up drinking alcohol completely (48% compared with 52%).
Table 11.31
As has already been seen, some mothers received information on stopping drinking completely, while other mothers got information on limiting the amount of alcohol they drank and others just received general information about the health effects of drinking. Some mothers reported that they
Copyright © 2012, The Health and Social Care Information Centre. All Rights Reserved. 19
had received information from more than one source and had been given mixed messages in terms of what they should do. In particular, some mothers said they had received information both on stopping drinking completely and on limiting the amount they drank.
Among mothers who had received information about drinking during their pregnancy, the type of information they received was associated with how they actually changed their behaviour.
Mothers who had only received information on stopping drinking were much more likely to have actually given up drinking during pregnancy compared with mothers who had only got information on limiting the amount of alcohol they drank (54% and 31% respectively). By contrast mothers who had only had information on limiting the amount they drank were much more likely to cut down compared with those who had received information on stopping completely (66% and 42% respectively).
Mothers who reported they had received information both on stopping drinking completely during pregnancy and on limiting the amount of alcohol they drank were slightly more likely to stop completely than to cut down on the amount they drank (50% stopped completely compared with 46% who cut down). This reverses the trend from 2005, where those receiving mixed messages were more likely to cut down (71% cut down and 23% stopped completely).21
Table 11.32
11.3.5 Information received on drinking after the birth
For the first time in 2010, all mothers were asked at Stage 3 whether or not they had received any information about drinking after their baby was born. Just under a third of mothers (30%) received some sort of information after their baby was born about drinking. As with information recveived on drinking during pregnancy, mothers in Northern Ireland (36%) and Scotland (33%) were the most likely to receive information about drinking.
Almost a quarter (23%) said they had received information on the effects of drinking alcohol whilst breastfeeding on their baby, whilst one in five (20%) said they had received information on the dangers of sharing a bed with their baby and drinking alcohol. Around one in seven (14%) said they had been given information on limiting the amount they drank, while just over one in ten (11%) said they had been given information on stopping drinking alcohol completely while breastfeeding.
Mothers in Northern Ireland were particularly likely to have received information on the dangers of sharing a bed with their baby and drinking alcohol (27%).
Table 11.33
Among those who received information about drinking, the most common source of information was a health visitor (56%), followed by a midwife (46%), books, leaflets or magazines (36%), or a SureStart or Children’s Centre / Children’s Health Clinic (26%). Around one in seven mentioned receiving information from the internet (14%) or their doctor / GP (14%). Mothers in Northern Ireland were more likely to receive information about drinking from a health visitor (75%). Mothers in England were more likely to have received information from a SureStart / Children’s Centre or Children’s Health Clinic (29%).
Table 11.34
Copyright © 2012, The Health and Social Care Information Centre. All Rights Reserved. 20
Notes and references
1 http://www.nhs.uk/Conditions/vitamins-minerals/Pages/Vitamin-B.aspx
2 See Chapter 10 of the Infant Feeding Survey 2005 report, Table 10.1 http://www.ic.nhs.uk/pubs/ifs2005
3 See http://www.nhs.uk/conditions/pregnancy-and-baby/pages/vitamins-minerals-supplements-pregnant.aspx#close
and also the NHS Choices webpage on vitamin D and sunlight: http://www.nhs.uk/Livewell/Summerhealth/Pages/vitamin-D-sunlight.aspx 4 http://www.nice.org.uk/nicemedia/live/13023/49345/49345.pdf
5 http://www.dh.gov.uk/en/Publicationsandstatistics/Publications/PublicationsPolicyAndGuidance/DH_124917
6 For further information on SSATOD, please see:
http://www.ic.nhs.uk/services/omnibus-survey/using-the-service/data-collections/smoking-at-time-of-delivery 7 The most recent data shows that the proportion of mothers smoking at delivery in England was 13.2% in 2011/2012, lower
than in 2010/11. 8 See the Smoking at Booking table on the Births in Scottish Hospitals publication at: http://www.isdscotland.org/Health-
Topics/Maternity-and-Births/Publications/2011-08-30/mat_bb_table8.xls#Scotland 9 http://www.legislation.gov.uk/ukpga/2006/28/contents
10 http://www.legislation.gov.uk//asp/2005/13
11 http://www.dhsspsni.gov.uk/index/phealth/php/health_promotion/smoking_ni_order_2006.htm
12 http://wales.gov.uk/topics/health/improvement/index/tobaccoplan/?lang=en
13 http://www.dhsspsni.gov.uk/tobacco_strategy_-_final.pdf
14 See Chapter 10 of the 2005 Infant Feeding Survey Report, Table 10.22. http://www.ic.nhs.uk/pubs/ifs2005
N.B. In 2005, mothers were asked if they had received advice or information about smoking during pregnancy. 15
In 2005, mothers were asked about sources of advice, rather than information. 16
This figure is slightly different from the 26% quoted in Table 11.4 because the analysis is based only on mothers who completed all three stages of the survey. 17
NHS Choices website “Can I drink alcohol if I’m pregnant?’ webpage
http://www.nhs.uk/chq/Pages/2270.aspx?CategoryID=54&SubCategoryID=130#close 18
Department of Health (2006) How much is too much? Pregnancy and Alcohol http://www.dh.gov.uk/prod_consum_dh/groups/dh_digitalassets/@dh/@en/documents/digitalasset/dh_080105.pdf 19
To be precise, mothers were asked if they drank alcohol at all now, and if not, whether they had drunk alcohol at all in the last two years. Therefore the definition assumes that those drinking currently (at the time of the survey) had also drunk within the last two years. 20
Mothers for whom units could not be calculated have been excluded from this analysis. 21
See Chapter 10 of the Infant Feeding Survey 2005 report, Table 10.35 http://www.ic.nhs.uk/pubs/ifs2005