industry sector report 20 - economic...
TRANSCRIPT
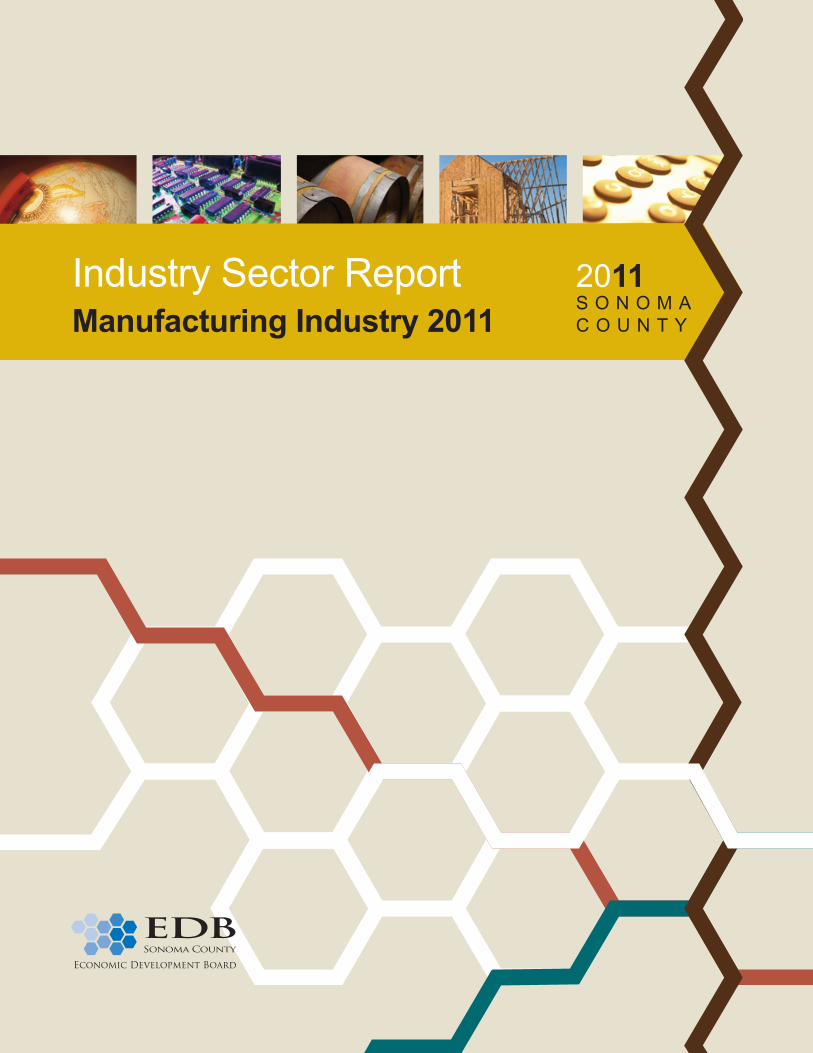
Industry Sector ReportManufacturing Industry 2011
2011S O N O M AC O U N T Y
Table of Contents
1 Section I: The Current State of Manufacturing
8 Section II: Why Manufacturing Matters
11 Section III: Results of the Manufacturing Survey 2011
21 Manufacturing Can Lead to a Greener Environment
23 Where to go from Here?
24 Methodology
Executive Summary and Overview
www.sonomaedb.org
I
August 2011
The Sonoma County Economic Development Board (EDB) is pleased to present the 2011 Sonoma County Manufacturing Industry Report. This industry report is the first detailed report on the manufacturing industry of Sonoma Country and offers an overview of current trends, challenges and potential for manufacturing within Sonoma County. The report tries to establish a snap-shot of the current state of manufacturing as well as identify the development of the sector over the next years. Both current and projected analyses are essential for the manufacturing industry as well as other related industries and sectors that impact the manuf-acturing supply chain.
Key findings in this report include:
• The decline of national manufacturing employment of 30% and more since 2000 is much more a structural industry problem as opposed to the impact of the dot-com bubble or the financial crisis. Increased productivity and technology as well as outsourcing of labor intensive purposes have led to this development.
• The most important factor of running a manufacturing business in Sonoma Country is the availability and cost of skilled labor.
• Manufacturers show willingness to improve the availability of skilled labor in this region and to introduce young talent towards jobs in manufacturing. Apprenticeship programs are highly appreciated by companies as well as students.
Top future developments & challenges in this report include:
• The manufacturing industry in Sonoma County is gaining strength since the economic downturn in 2008/09.
• Increased investment activity in machinery, technology and product lines will be seen during the next three years.
• Sonoma County is struggling to maintain its competitiveness as a manufacturing site. High costs of living, land and labor are the main disadvantages described by manufacturers.
The report intends to establish a foundation for further plans and actions to improve opportuni-ties for the manufacturing sector in Sonoma County. This can be done through mutual exchange of ideas among companies, trade groups, public agencies and educational institu-tions.
The recent Innovation Action Council cluster survey process included a focus on the manufac-turing cluster. Many of the topics discussed in the cluster survey process are expected to be addressed in this cluster‘s activities in partnership with 101 MFG and the Santa Rosa Chamber‘s BEST program.
Yours sincerely,
Ben Stone
www.sonomaedb.org
1
Section I:
The Current State of Manufacturing
This section provides an overview of the manufacturing situation in different areas and includes:
- How other countries are performing - International Competition- The current state of manufacturing in the US- The current state of manufacturing in California- The current State of manufacturing in Sonoma County
How Other Countries Perform
www.sonomaedb.org
2
International Environment
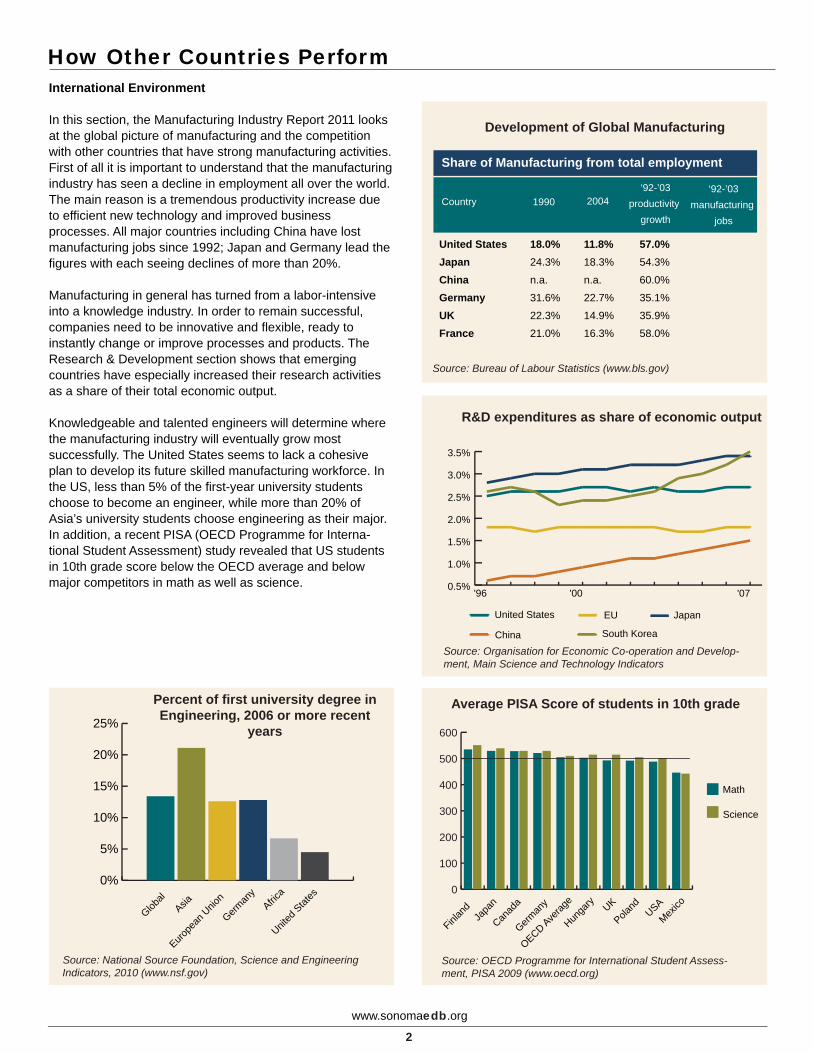
In this section, the Manufacturing Industry Report 2011 looks at the global picture of manufacturing and the competition with other countries that have strong manufacturing activities. First of all it is important to understand that the manufacturing industry has seen a decline in employment all over the world. The main reason is a tremendous productivity increase due to efficient new technology and improved business processes. All major countries including China have lost manufacturing jobs since 1992; Japan and Germany lead the figures with each seeing declines of more than 20%. Manufacturing in general has turned from a labor-intensive into a knowledge industry. In order to remain successful, companies need to be innovative and flexible, ready to instantly change or improve processes and products. The Research & Development section shows that emerging countries have especially increased their research activities as a share of their total economic output.
Knowledgeable and talented engineers will determine where the manufacturing industry will eventually grow most successfully. The United States seems to lack a cohesive plan to develop its future skilled manufacturing workforce. In the US, less than 5% of the first-year university students choose to become an engineer, while more than 20% of Asia’s university students choose engineering as their major. In addition, a recent PISA (OECD Programme for Interna-tional Student Assessment) study revealed that US students in 10th grade score below the OECD average and below major competitors in math as well as science.
63
5
20
5
63
5
20
5
Source: National Source Foundation, Science and Engineering Indicators, 2010 (www.nsf.gov)
Percent of first university degree in Engineering, 2006 or more recent
years
0%
5%
10%
15%
20%
25%
United
Stat
esAfric
a
German
y
Europe
an U
nion
AsiaGlob
al
63
5
20
5
63
5
20
5
Source: Organisation for Economic Co-operation and Develop-ment, Main Science and Technology Indicators
R&D expenditures as share of economic output
0.5%
1.0%
1.5%
2.0%
2.5%
3.0%
3.5%
South KoreaChina
JapanEUUnited States
'07'00'96
63
20
63
20
Source: OECD Programme for International Student Assess-ment, PISA 2009 (www.oecd.org)
Average PISA Score of students in 10th grade
0
100
200
300
400
500
600
Science
Math
Mexico
USA
PolandUK
Hunga
ry
OECD Averag
e
German
y
Canad
aJa
pan
Finlan
d
Development of Global Manufacturing
Share of Manufacturing from total employment
Country 1990 2004‘92-’03
productivity growth
‘92-’03manufacturing
jobs
United States 18.0% 11.8% 57.0%JapanChina
636324.3%
n.a.
18.3%
n.a.
54.3%
60.0%
GermanyUKFrance
31.6%
22.3%
21.0%
22.7%
5514.9%202016.3%
35.1%
35.9%
58.0%55
Source: Bureau of Labour Statistics (www.bls.gov)
The Current State of Manufacturing
www.sonomaedb.org
3
USA
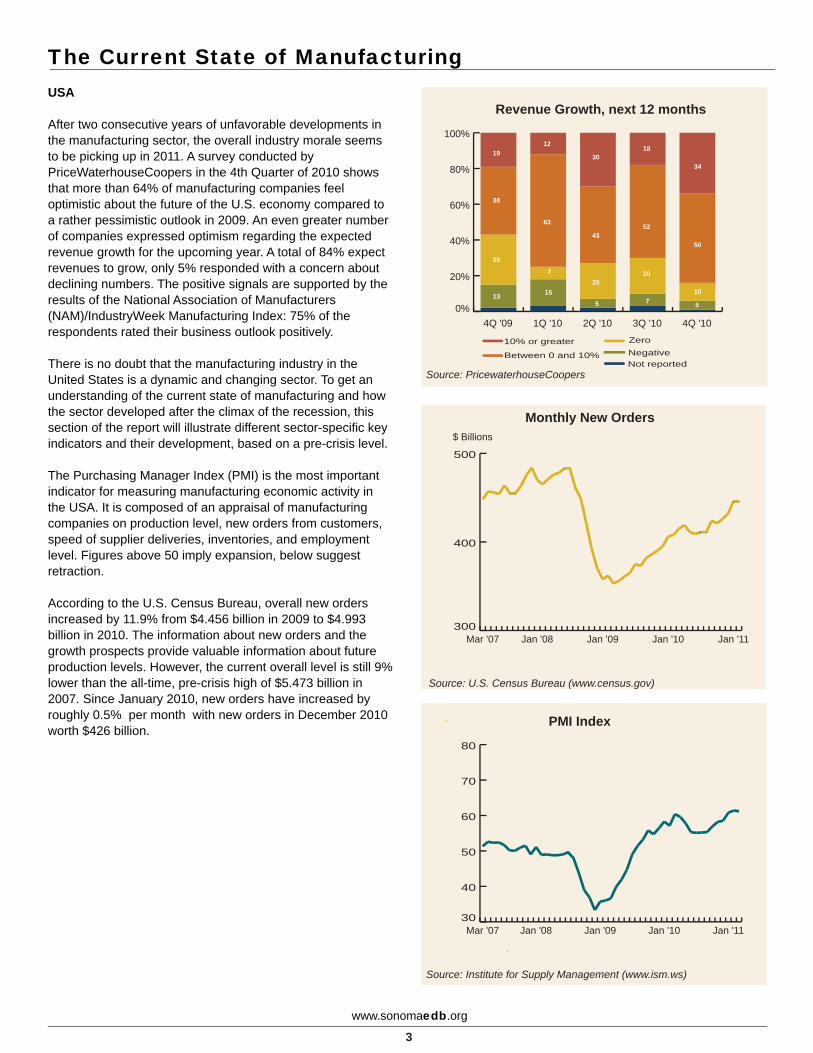
After two consecutive years of unfavorable developments in the manufacturing sector, the overall industry morale seems to be picking up in 2011. A survey conducted by PriceWaterhouseCoopers in the 4th Quarter of 2010 shows that more than 64% of manufacturing companies feel optimistic about the future of the U.S. economy compared to a rather pessimistic outlook in 2009. An even greater number of companies expressed optimism regarding the expected revenue growth for the upcoming year. A total of 84% expect revenues to grow, only 5% responded with a concern about declining numbers. The positive signals are supported by the results of the National Association of Manufacturers (NAM)/IndustryWeek Manufacturing Index: 75% of the respondents rated their business outlook positively.
There is no doubt that the manufacturing industry in the United States is a dynamic and changing sector. To get an understanding of the current state of manufacturing and how the sector developed after the climax of the recession, this section of the report will illustrate different sector-specific key indicators and their development, based on a pre-crisis level.
The Purchasing Manager Index (PMI) is the most important indicator for measuring manufacturing economic activity in the USA. It is composed of an appraisal of manufacturing companies on production level, new orders from customers, speed of supplier deliveries, inventories, and employment level. Figures above 50 imply expansion, below suggest retraction.
According to the U.S. Census Bureau, overall new orders increased by 11.9% from $4.456 billion in 2009 to $4.993 billion in 2010. The information about new orders and the growth prospects provide valuable information about future production levels. However, the current overall level is still 9% lower than the all-time, pre-crisis high of $5.473 billion in 2007. Since January 2010, new orders have increased by roughly 0.5% per month with new orders in December 2010 worth $426 billion.
Revenue Growth, next 12 months
0%
20%
40%
60%
80%
100%
4Q '103Q '102Q '101Q '104Q '09
Not reportedNegativeZero
Between 0 and 10%
10% or greater
Source: PricewaterhouseCoopers
34
50
10
5
18
52
20
7
30
43
20
5
12
63
7
15
19
38
28
13
Source: U.S. Census Bureau (www.census.gov)
300
400
500
Jan '11Jan '10Jan '09Jan '08Mar '07
Monthly New Orders$ Billions
30
40
50
60
70
80
Jan '11Jan '10Jan '09Jan '08Mar '07
Source: Institute for Supply Management (www.ism.ws)
PMI Index
The Current State of Manufacturing
www.sonomaedb.org
4
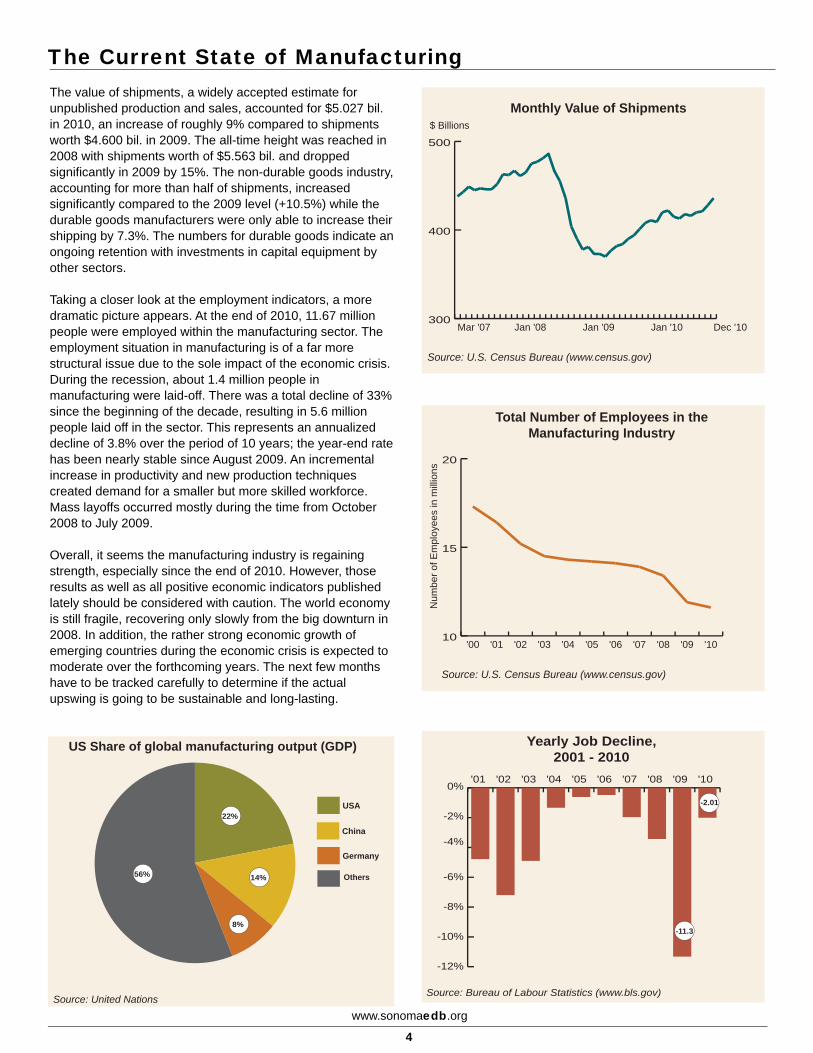
The value of shipments, a widely accepted estimate for unpublished production and sales, accounted for $5.027 bil. in 2010, an increase of roughly 9% compared to shipments worth $4.600 bil. in 2009. The all-time height was reached in 2008 with shipments worth of $5.563 bil. and dropped significantly in 2009 by 15%. The non-durable goods industry, accounting for more than half of shipments, increased significantly compared to the 2009 level (+10.5%) while the durable goods manufacturers were only able to increase their shipping by 7.3%. The numbers for durable goods indicate an ongoing retention with investments in capital equipment by other sectors.
Taking a closer look at the employment indicators, a more dramatic picture appears. At the end of 2010, 11.67 million people were employed within the manufacturing sector. The employment situation in manufacturing is of a far more structural issue due to the sole impact of the economic crisis. During the recession, about 1.4 million people in manufacturing were laid-off. There was a total decline of 33% since the beginning of the decade, resulting in 5.6 million people laid off in the sector. This represents an annualized decline of 3.8% over the period of 10 years; the year-end rate has been nearly stable since August 2009. An incremental increase in productivity and new production techniques created demand for a smaller but more skilled workforce. Mass layoffs occurred mostly during the time from October 2008 to July 2009.
Overall, it seems the manufacturing industry is regaining strength, especially since the end of 2010. However, those results as well as all positive economic indicators published lately should be considered with caution. The world economy is still fragile, recovering only slowly from the big downturn in 2008. In addition, the rather strong economic growth of emerging countries during the economic crisis is expected to moderate over the forthcoming years. The next few months have to be tracked carefully to determine if the actual upswing is going to be sustainable and long-lasting.
Source: U.S. Census Bureau (www.census.gov)
Monthly Value of Shipments
300
400
500
Dec '10Jan '10Jan '09Jan '08Mar '07
$ Billions
Source: U.S. Census Bureau (www.census.gov)
10
15
20
'10'09'08'07'06'05'04'03'02'01'00
Num
ber o
f Em
ploy
ees
in m
illio
nsTotal Number of Employees in the
Manufacturing Industry
Germany
China
USA
Others
Source: United Nations
US Share of global manufacturing output (GDP)
56%
22%
14%
8%
Source: Bureau of Labour Statistics (www.bls.gov)
Yearly Job Decline,2001 - 2010
-12%
-10%
-8%
-6%
-4%
-2%
0%'10'09'08'07'06'05'04'03'02'01
-11.3
-2.01
The Current State of Manufacturing
www.sonomaedb.org
5
California
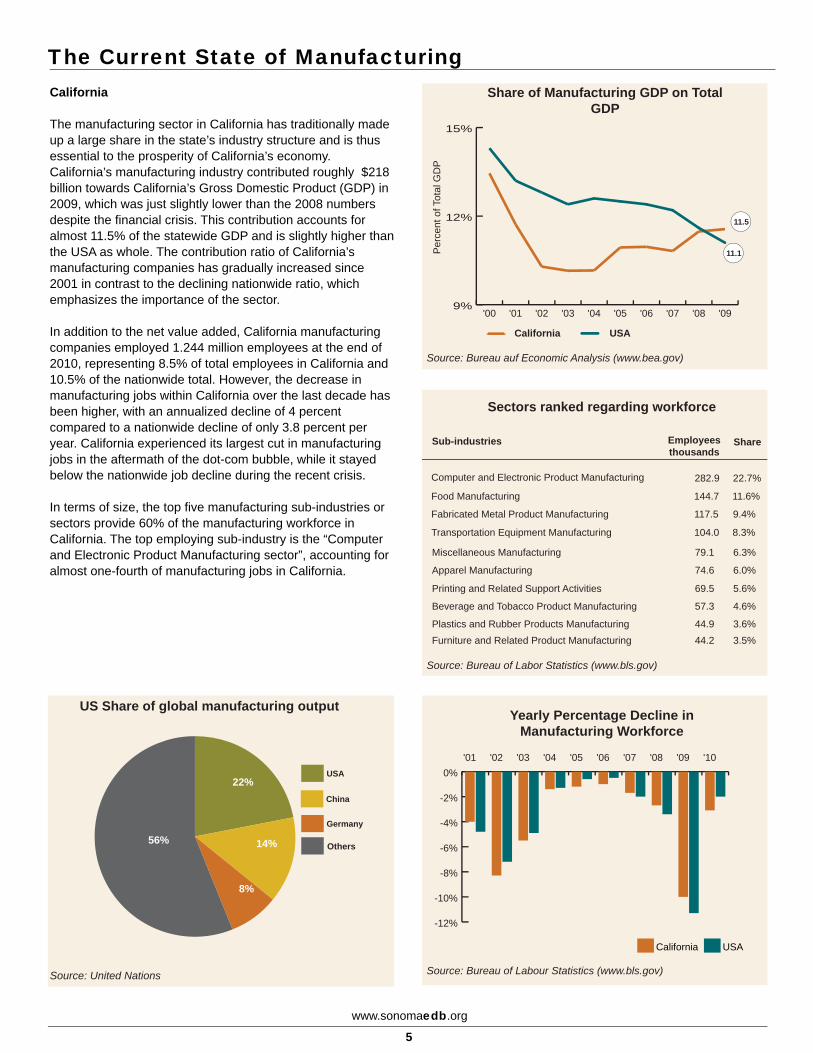
The manufacturing sector in California has traditionally made up a large share in the state’s industry structure and is thus essential to the prosperity of California’s economy. California’s manufacturing industry contributed roughly $218 billion towards California’s Gross Domestic Product (GDP) in 2009, which was just slightly lower than the 2008 numbers despite the financial crisis. This contribution accounts for almost 11.5% of the statewide GDP and is slightly higher than the USA as whole. The contribution ratio of California’s manufacturing companies has gradually increased since 2001 in contrast to the declining nationwide ratio, which emphasizes the importance of the sector.
In addition to the net value added, California manufacturing companies employed 1.244 million employees at the end of 2010, representing 8.5% of total employees in California and 10.5% of the nationwide total. However, the decrease in manufacturing jobs within California over the last decade has been higher, with an annualized decline of 4 percent compared to a nationwide decline of only 3.8 percent per year. California experienced its largest cut in manufacturing jobs in the aftermath of the dot-com bubble, while it stayed below the nationwide job decline during the recent crisis.
In terms of size, the top five manufacturing sub-industries or sectors provide 60% of the manufacturing workforce in California. The top employing sub-industry is the “Computer and Electronic Product Manufacturing sector”, accounting for almost one-fourth of manufacturing jobs in California.
Germany
China
USA
Others
Source: United Nations
US Share of global manufacturing output
22%
14%
8%
56%
Source: Bureau auf Economic Analysis (www.bea.gov)
9%
12%
15%
'09'08'07'06'05'04'03'02'01'00
Share of Manufacturing GDP on Total GDP
California USA
11.5
11.1Per
cent
of T
otal
GD
P
Source: Bureau of Labour Statistics (www.bls.gov)
-12%
-10%
-8%
-6%
-4%
-2%
0%
USACalifornia
'10'09'08'07'06'05'04'03'02'01
Yearly Percentage Decline in Manufacturing Workforce
Sectors ranked regarding workforce
Sub-industries Employeesthousands
Share
Computer and Electronic Product Manufacturing 282.9 22.7%
Food Manufacturing 144.7 11.6%
Fabricated Metal Product Manufacturing 117.5 9.4%
Transportation Equipment Manufacturing 104.0 8.3%
Miscellaneous Manufacturing 79.1 6.3%
Apparel Manufacturing 74.6 6.0%
Printing and Related Support Activities 69.5 5.6%
Beverage and Tobacco Product Manufacturing 57.3 4.6%
Plastics and Rubber Products Manufacturing 44.9 3.6%Furniture and Related Product Manufacturing 44.2 3.5%
Source: Bureau of Labor Statistics (www.bls.gov)
The Current State of Manufacturing
www.sonomaedb.org
6
California
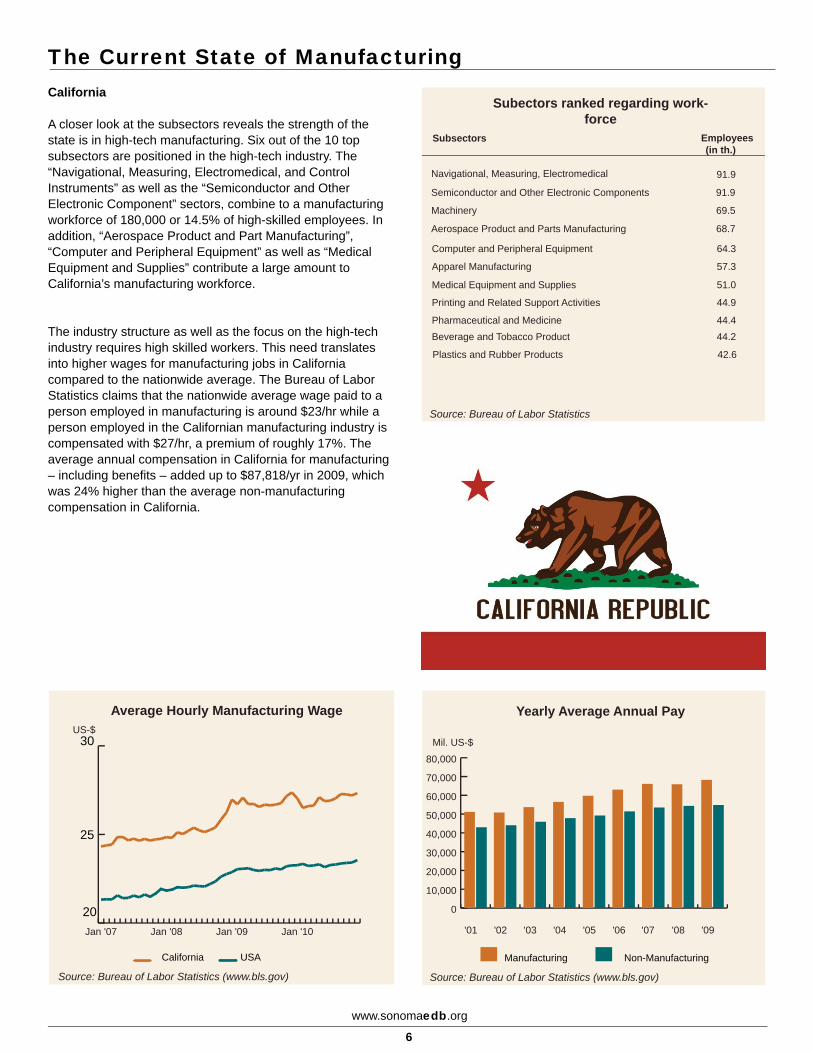
A closer look at the subsectors reveals the strength of the state is in high-tech manufacturing. Six out of the 10 top subsectors are positioned in the high-tech industry. The “Navigational, Measuring, Electromedical, and Control Instruments” as well as the “Semiconductor and Other Electronic Component” sectors, combine to a manufacturing workforce of 180,000 or 14.5% of high-skilled employees. In addition, “Aerospace Product and Part Manufacturing”, “Computer and Peripheral Equipment” as well as “Medical Equipment and Supplies” contribute a large amount to California’s manufacturing workforce.
The industry structure as well as the focus on the high-tech industry requires high skilled workers. This need translates into higher wages for manufacturing jobs in California compared to the nationwide average. The Bureau of Labor Statistics claims that the nationwide average wage paid to a person employed in manufacturing is around $23/hr while a person employed in the Californian manufacturing industry is compensated with $27/hr, a premium of roughly 17%. The average annual compensation in California for manufacturing – including benefits – added up to $87,818/yr in 2009, which was 24% higher than the average non-manufacturing compensation in California.
20
25
30
Jan '10Jan '09Jan '08Jan '07
USACalifornia
Average Hourly Manufacturing WageUS-$
Source: Bureau of Labor Statistics (www.bls.gov) Source: Bureau of Labor Statistics (www.bls.gov)
0
10,000
20,000
30,000
40,000
50,000
60,000
70,000
80,000
Non-ManufacturingManufacturing
'09'08'07'06'05'04'03'02'01
Yearly Average Annual Pay
Mil. US-$
Subectors ranked regarding work-force
Subsectors Employees (in th.)
Navigational, Measuring, Electromedical 91.9
Semiconductor and Other Electronic Components 91.9
Machinery 69.5
Aerospace Product and Parts Manufacturing 68.7
Computer and Peripheral Equipment 64.3
Apparel Manufacturing 57.3
Medical Equipment and Supplies 51.0
Printing and Related Support Activities 44.9
Pharmaceutical and Medicine 44.4 Beverage and Tobacco Product 44.2
Plastics and Rubber Products 42.6
Source: Bureau of Labor Statistics
The Current State of Manufacturing
www.sonomaedb.org
7
Sonoma County
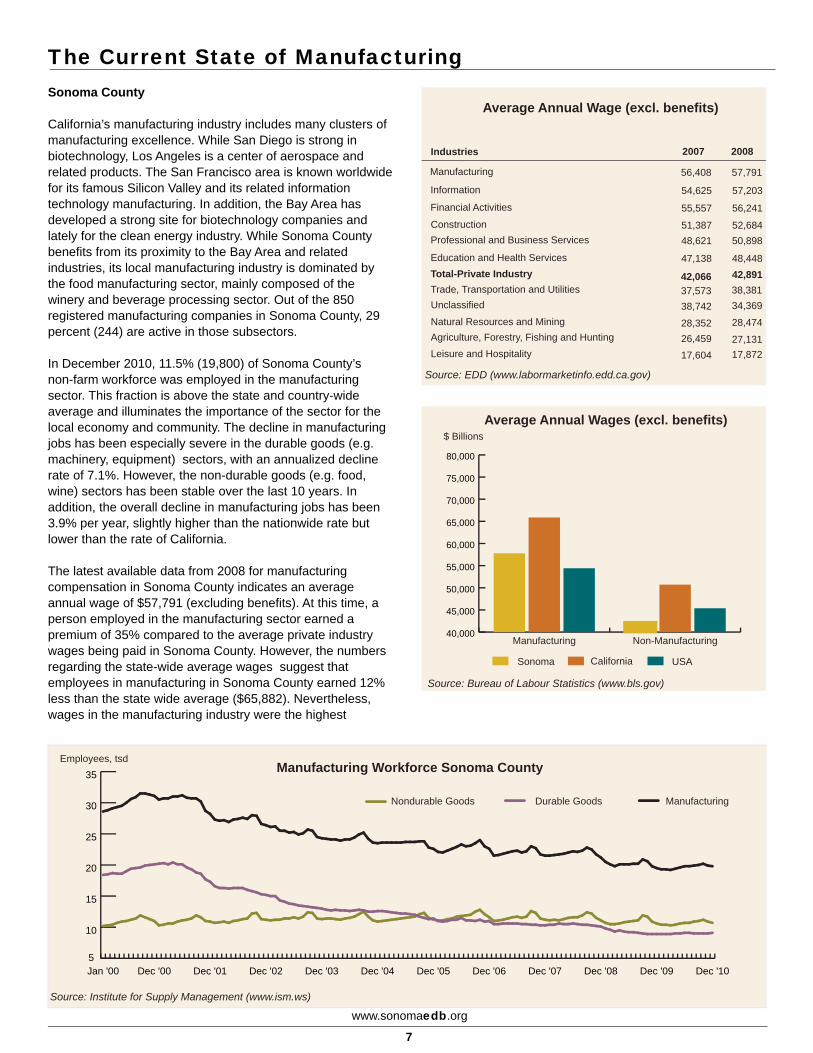
California’s manufacturing industry includes many clusters of manufacturing excellence. While San Diego is strong in biotechnology, Los Angeles is a center of aerospace and related products. The San Francisco area is known worldwide for its famous Silicon Valley and its related information technology manufacturing. In addition, the Bay Area has developed a strong site for biotechnology companies and lately for the clean energy industry. While Sonoma County benefits from its proximity to the Bay Area and related industries, its local manufacturing industry is dominated by the food manufacturing sector, mainly composed of the winery and beverage processing sector. Out of the 850 registered manufacturing companies in Sonoma County, 29 percent (244) are active in those subsectors.
In December 2010, 11.5% (19,800) of Sonoma County’s non-farm workforce was employed in the manufacturing sector. This fraction is above the state and country-wide average and illuminates the importance of the sector for the local economy and community. The decline in manufacturing jobs has been especially severe in the durable goods (e.g. machinery, equipment) sectors, with an annualized decline rate of 7.1%. However, the non-durable goods (e.g. food, wine) sectors has been stable over the last 10 years. In addition, the overall decline in manufacturing jobs has been 3.9% per year, slightly higher than the nationwide rate but lower than the rate of California.
The latest available data from 2008 for manufacturing compensation in Sonoma County indicates an average annual wage of $57,791 (excluding benefits). At this time, a person employed in the manufacturing sector earned a premium of 35% compared to the average private industry wages being paid in Sonoma County. However, the numbers regarding the state-wide average wages suggest that employees in manufacturing in Sonoma County earned 12% less than the state wide average ($65,882). Nevertheless, wages in the manufacturing industry were the highest
Source: Bureau of Labour Statistics (www.bls.gov)
40,000
45,000
50,000
55,000
60,000
65,000
70,000
75,000
80,000
USACaliforniaSonoma
Non-ManufacturingManufacturing
Average Annual Wages (excl. benefits)$ Billions
Source: Institute for Supply Management (www.ism.ws)
Manufacturing Workforce Sonoma County
5
10
15
20
25
30
35
Nondurable Goods Durable Goods Manufacturing
Dec '10Dec '09Dec '08Dec '07Dec '06Dec '05Dec '04Dec '03Dec '02Dec '01Dec '00Jan '00
Employees, tsd
Average Annual Wage (excl. benefits)
Industries 2007 2008
Manufacturing
Information
Financial Activities
ConstructionProfessional and Business Services
Education and Health ServicesTotal-Private IndustryTrade, Transportation and UtilitiesUnclassified
Natural Resources and MiningAgriculture, Forestry, Fishing and HuntingLeisure and Hospitality
Source: EDD (www.labormarketinfo.edd.ca.gov)
56,408
54,625
55,557
51,38748,621
47,138
42,06637,57338,742
28,35226,45917,604
57,791
57,203
56,241
52,68450,898
48,44842,89138,38134,369
28,474
27,13117,872
www.sonomaedb.org
8
Section II:
Why Manufacturing Matters
This section describes the importance of manufacturing for other industries & the economy and includes:
- Multiplier Effect- Research & Development- Productivity- High Income & Benefits
Why Manufacturing Matters
www.sonomaedb.org
9
Multiplier Effect
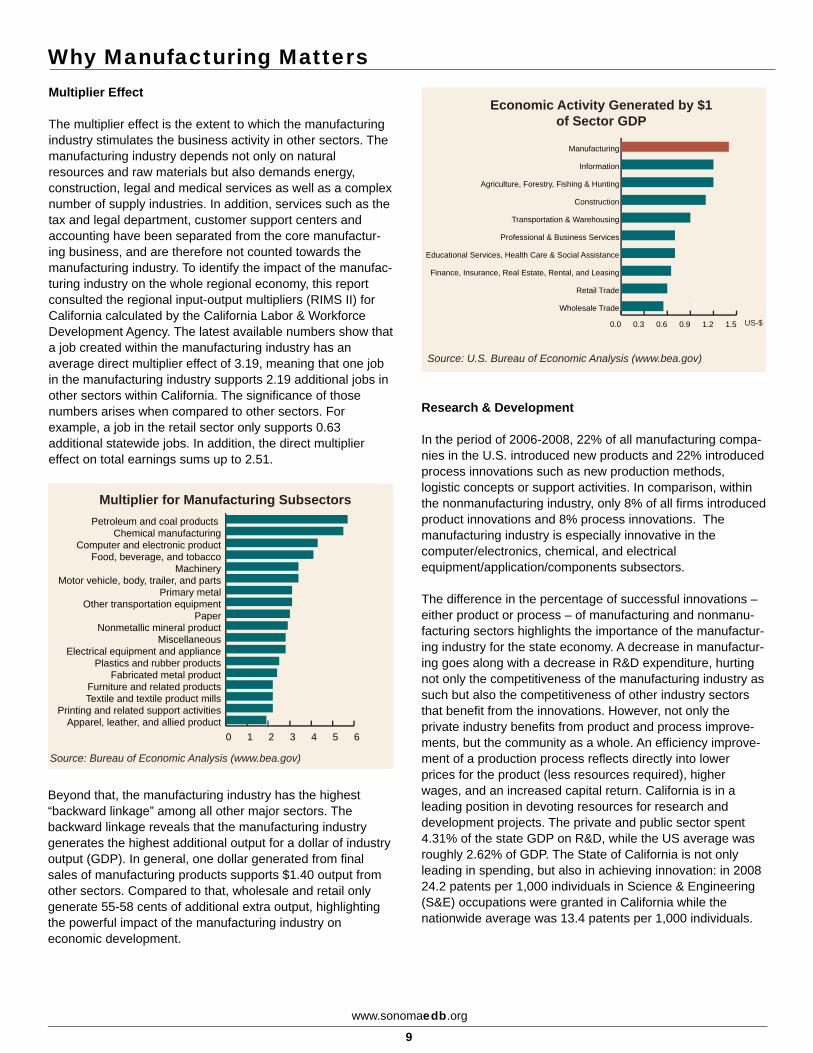
The multiplier effect is the extent to which the manufacturing industry stimulates the business activity in other sectors. The manufacturing industry depends not only on natural resources and raw materials but also demands energy, construction, legal and medical services as well as a complex number of supply industries. In addition, services such as the tax and legal department, customer support centers and accounting have been separated from the core manufactur-ing business, and are therefore not counted towards the manufacturing industry. To identify the impact of the manufac-turing industry on the whole regional economy, this report consulted the regional input-output multipliers (RIMS II) for California calculated by the California Labor & Workforce Development Agency. The latest available numbers show that a job created within the manufacturing industry has an average direct multiplier effect of 3.19, meaning that one job in the manufacturing industry supports 2.19 additional jobs in other sectors within California. The significance of those numbers arises when compared to other sectors. For example, a job in the retail sector only supports 0.63 additional statewide jobs. In addition, the direct multiplier effect on total earnings sums up to 2.51.
0 1 2 3 4 5 6Apparel, leather, and allied product
Printing and related support activitiesTextile and textile product millsFurniture and related products
Fabricated metal productPlastics and rubber products
Electrical equipment and applianceMiscellaneous
Nonmetallic mineral productPaper
Other transportation equipmentPrimary metal
Motor vehicle, body, trailer, and partsMachinery
Food, beverage, and tobaccoComputer and electronic product
Chemical manufacturingPetroleum and coal products
Source: Bureau of Economic Analysis (www.bea.gov)
Multiplier for Manufacturing Subsectors
Beyond that, the manufacturing industry has the highest “backward linkage” among all other major sectors. The backward linkage reveals that the manufacturing industry generates the highest additional output for a dollar of industry output (GDP). In general, one dollar generated from final sales of manufacturing products supports $1.40 output from other sectors. Compared to that, wholesale and retail only generate 55-58 cents of additional extra output, highlighting the powerful impact of the manufacturing industry on economic development.
6363
Source: U.S. Bureau of Economic Analysis (www.bea.gov)
0.0 0.3 0.6 0.9 1.2 1.5
Wholesale Trade
Retail Trade
Finance, Insurance, Real Estate, Rental, and Leasing
Educational Services, Health Care & Social Assistance
Professional & Business Services
Transportation & Warehousing
Construction
Agriculture, Forestry, Fishing & Hunting
Information
Manufacturing
5
20
5
Economic Activity Generated by $1 of Sector GDP
US-$
Research & Development
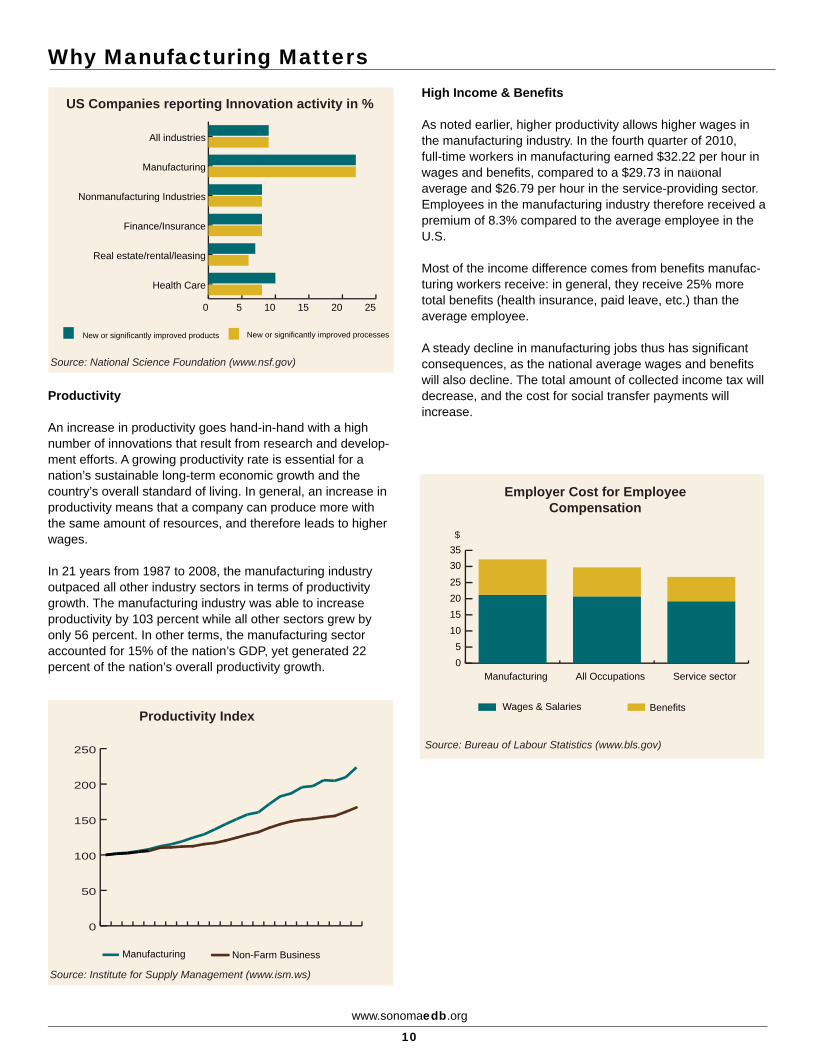
In the period of 2006-2008, 22% of all manufacturing compa-nies in the U.S. introduced new products and 22% introduced process innovations such as new production methods, logistic concepts or support activities. In comparison, within the nonmanufacturing industry, only 8% of all firms introduced product innovations and 8% process innovations. The manufacturing industry is especially innovative in the computer/electronics, chemical, and electrical equipment/application/components subsectors.
The difference in the percentage of successful innovations – either product or process – of manufacturing and nonmanu-facturing sectors highlights the importance of the manufactur-ing industry for the state economy. A decrease in manufactur-ing goes along with a decrease in R&D expenditure, hurting not only the competitiveness of the manufacturing industry as such but also the competitiveness of other industry sectors that benefit from the innovations. However, not only the private industry benefits from product and process improve-ments, but the community as a whole. An efficiency improve-ment of a production process reflects directly into lower prices for the product (less resources required), higher wages, and an increased capital return. California is in a leading position in devoting resources for research and development projects. The private and public sector spent 4.31% of the state GDP on R&D, while the US average was roughly 2.62% of GDP. The State of California is not only leading in spending, but also in achieving innovation: in 2008 24.2 patents per 1,000 individuals in Science & Engineering (S&E) occupations were granted in California while the nationwide average was 13.4 patents per 1,000 individuals.
Why Manufacturing Matters
www.sonomaedb.org
10
0 5 10 15 20 25
New or significantly improved processesNew or significantly improved products
Health Care
Real estate/rental/leasing
Finance/Insurance
Nonmanufacturing Industries
Manufacturing
All industries
Source: National Science Foundation (www.nsf.gov)
US Companies reporting Innovation activity in %
Productivity
An increase in productivity goes hand-in-hand with a high number of innovations that result from research and develop-ment efforts. A growing productivity rate is essential for a nation’s sustainable long-term economic growth and the country’s overall standard of living. In general, an increase in productivity means that a company can produce more with the same amount of resources, and therefore leads to higher wages.
In 21 years from 1987 to 2008, the manufacturing industry outpaced all other industry sectors in terms of productivity growth. The manufacturing industry was able to increase productivity by 103 percent while all other sectors grew by only 56 percent. In other terms, the manufacturing sector accounted for 15% of the nation’s GDP, yet generated 22 percent of the nation’s overall productivity growth.
0
50
100
150
200
250
Non-Farm BusinessManufacturing
Source: Institute for Supply Management (www.ism.ws)
Productivity Index
High Income & Benefits
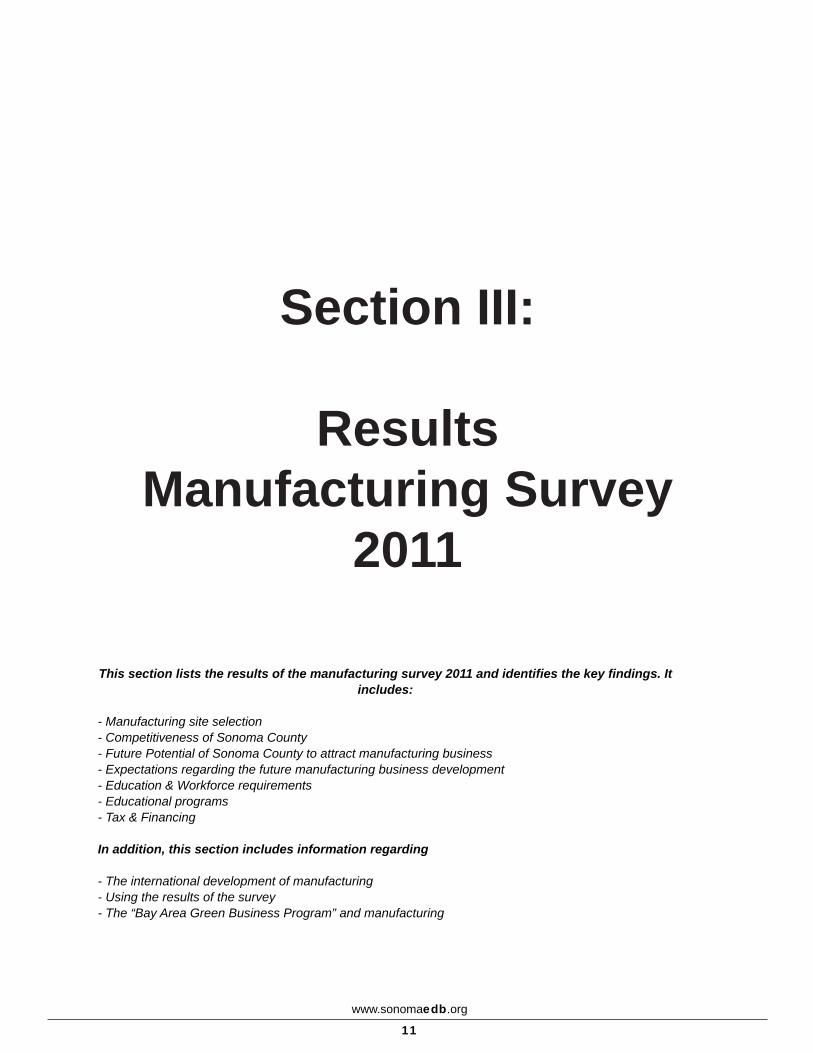
As noted earlier, higher productivity allows higher wages in the manufacturing industry. In the fourth quarter of 2010, full-time workers in manufacturing earned $32.22 per hour in wages and benefits, compared to a $29.73 in national 34
average and $26.79 per hour in the service-providing sector. Employees in the manufacturing industry therefore received a premium of 8.3% compared to the average employee in the U.S.
5010
Most of the income difference comes from benefits manufac-turing workers receive: in general, they receive 25% more total benefits (health insurance, paid leave, etc.) than the 10
5average employee.
A steady decline in manufacturing jobs thus has significant consequences, as the national average wages and benefits will also decline. The total amount of collected income tax will decrease, and the cost for social transfer payments will increase.
Source: Bureau of Labour Statistics (www.bls.gov)
Employer Cost for Employee Compensation
$
05
10152025
3035
BenefitsWages & Salaries
Service sectorAll OccupationsManufacturing
www.sonomaedb.org
11
Section III:
Results Manufacturing Survey
2011
This section lists the results of the manufacturing survey 2011 and identifies the key findings. It includes:
- Manufacturing site selection- Competitiveness of Sonoma County- Future Potential of Sonoma County to attract manufacturing business- Expectations regarding the future manufacturing business development- Education & Workforce requirements- Educational programs- Tax & Financing
In addition, this section includes information regarding
- The international development of manufacturing- Using the results of the survey- The “Bay Area Green Business Program” and manufacturing
Manufacturing Survey 2011
www.sonomaedb.org
12
This section summarizes the result of the first Sonoma County manufacturing survey, which was conducted in the first quarter of 2011 (Q1/2011). As indicated in the preceding section, the manufacturing industry is vital for the local economy and society. With this survey, the Economic Devel-opment Board tries to capture the current status of manufac-turing in Sonoma County as well as the expectations of the manufacturing industry for the forthcoming years. The results will, in addition, have valuable significance on the prospects of other industry sectors. If manufacturing companies are running successfully, the local economy will benefit exponen-tially.
The survey, however, is not only intended to capture the bigger picture of manufacturing industry in Sonoma County. It also identifies the current challenges faced by the manufac-turing companies in the county and identifies the opportunities offered by Sonoma County for further development of the industry sector in the region. There is a special focus on the educational situation in the area as well as requirements for the industry.
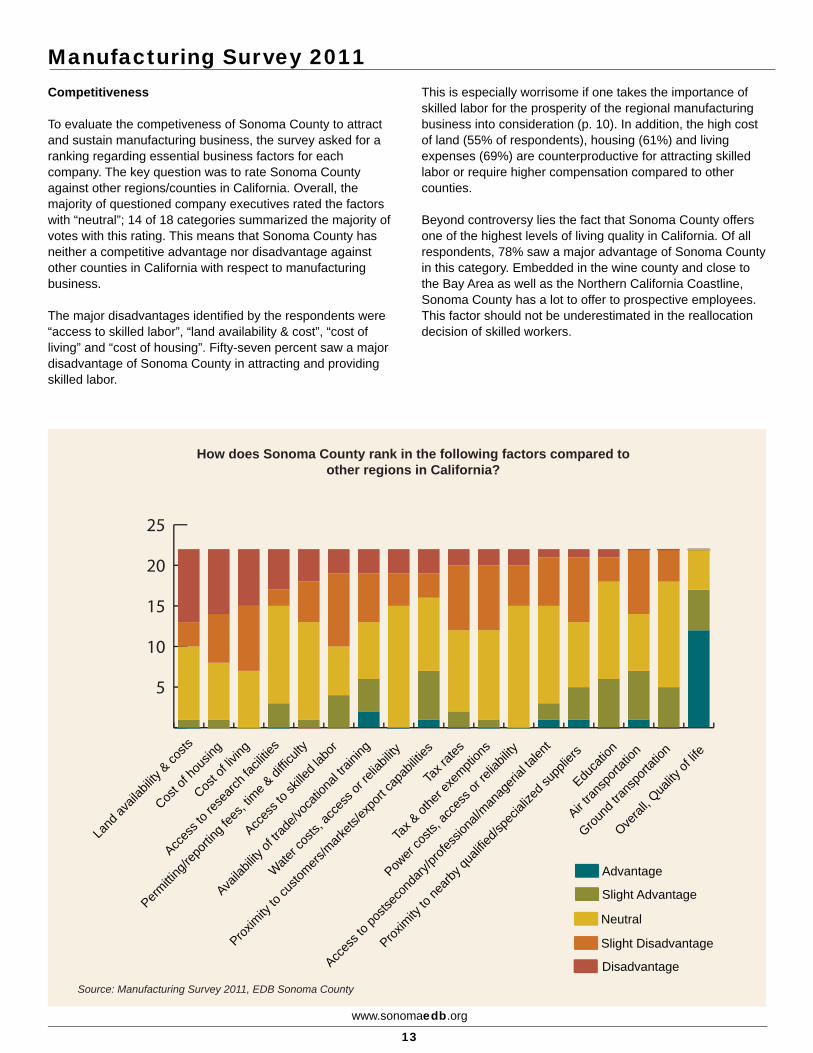
Manufacturing Site
To understand more thouroughly the decision-making process of manufacturing companies in regards to site selection, the survey asked for the three most important external factors in running their business. The most crucial factors when choos-ing a manufacturing site were related. More than 50% of all companies see either “labor costs” or “availability of skilled labor” as the most important factor for the success of their business. Less than 10% voted for “availability of land”, “energy availability and costs”, “infrastructure” or “land
cost/rent”. This evaluation leads to the assumption that Sonoma County attracts mostly labor-intensive, low-volume manufacturing companies. Those companies are either highly specialized in low volume, high value manufacturing or focus on the assembly and product development, while the high-volume manufacturing is done overseas. Nevertheless, this does not imply that high-volume companies are non-existent in Sonoma County, since some products require a close proximity to major markets and customers.
Very disappointed
Disappointed
Okay
Satisfied
“What has been your overall experience of Sonoma County as a manufacturing
site?”
Source: Manufacturing Survey 2011, EDB Sonoma County
38%
46%
10%
20%
30%
40%
50%
60%
70%
80%
Acces
s to u
nivers
ities
Availa
bility
of la
nd
Energy
avail
abilit
y and
costs
Proxim
ity to
majo
r sup
pliers
Constr
uctio
n cos
ts
Infras
tructu
re
Land
cost/
rent
Tax e
xempti
ons
State &
Loca
l ince
ntive
s
Corpora
te tax
rate
Proxim
ity to
majo
r mark
ets
Availia
bility
of sk
illed l
abor
Labo
r cos
ts
Source: Manufacturing Survey 2011, EDB Sonoma County
The most important external factors in running a manufacturing business
Manufacturing Survey 2011
www.sonomaedb.org
13
Competitiveness
To evaluate the competiveness of Sonoma County to attract and sustain manufacturing business, the survey asked for a ranking regarding essential business factors for each company. The key question was to rate Sonoma County against other regions/counties in California. Overall, the majority of questioned company executives rated the factors with “neutral”; 14 of 18 categories summarized the majority of votes with this rating. This means that Sonoma County has neither a competitive advantage nor disadvantage against other counties in California with respect to manufacturing business. The major disadvantages identified by the respondents were “access to skilled labor”, “land availability & cost”, “cost of living” and “cost of housing”. Fifty-seven percent saw a major disadvantage of Sonoma County in attracting and providing skilled labor.
This is especially worrisome if one takes the importance of skilled labor for the prosperity of the regional manufacturing business into consideration (p. 10). In addition, the high cost of land (55% of respondents), housing (61%) and living expenses (69%) are counterproductive for attracting skilled labor or require higher compensation compared to other counties.
Beyond controversy lies the fact that Sonoma County offers one of the highest levels of living quality in California. Of all respondents, 78% saw a major advantage of Sonoma County in this category. Embedded in the wine county and close to the Bay Area as well as the Northern California Coastline, Sonoma County has a lot to offer to prospective employees. This factor should not be underestimated in the reallocation decision of skilled workers.
5
10
15
20
25
How does Sonoma County rank in the following factors compared to other regions in California?
Disadvantage
Slight Disadvantage
Neutral
Slight Advantage
Advantage
Overal
l, Qua
lity of
life
Educa
tion
Cost o
f hou
sing
Cost o
f livin
g
Ground
trans
porta
tion
Air tran
sport
ation
Proxim
ity to
custo
mers/m
arkets
/expo
rt cap
abilit
ies
Proxim
ity to
nearb
y qua
lified
/spec
ialize
d sup
pliers
Water c
osts,
acce
ss or
relia
bility
Power
costs
, acc
ess o
r reli
abilit
y
Land
avail
abilit
y & co
sts
Availa
bility
of tra
de/vo
catio
nal tr
aining
Acces
s to r
esea
rch fa
cilitie
s
Acces
s to s
killed
labo
r
Acces
s to p
ostse
cond
ary/pr
ofess
ional/
manag
erial
talen
t
Permitti
ng/re
portin
g fee
s, tim
e & di
fficult
y
Tax &
othe
r exe
mption
s
Tax r
ates
Source: Manufacturing Survey 2011, EDB Sonoma County
Manufacturing Survey 2011 - Outlook
www.sonomaedb.org
14
Future Potential
While this data reflects the current situation of the attractiveness of Sonoma County for manufacturing companies, it is also essential to ask for the future potential of the county to attract and retain manufacturing firms. None of the respondents think that Sonoma County has a high potential in doing so, while at least 42% rate the future desirability of companies to settle in Sonoma County with a “medium potential”. Over half of the companies asked, however, think the region has none or only a low potential to lure new manufacturing businesses.
Source: Manufacturing Survey 2011, EDB Sonoma County
Sonoma County's current and future potential for attracting and retaining
manufacturing firms?
Low potential
Medium potential42%
58%
The survey also raised the question if manufacturing companies would consider moving their operations into another state or country. Suprisingly, only 19% of all companies have considered moving their business or outsourcing their operations to another country like China or Mexico. This statement supports the earlier assumption that manufacturing companies in Sonoma County do not necessarily operate in high-volume, low-value manufacturing. Relocation into another country is therefore less attractive because of the necessity of high-skilled labor. Lower production costs due to the availability of cheap, low-skilled labor is not a primary allocation factor for those companies. It also indicates an overall high education level in the United States.
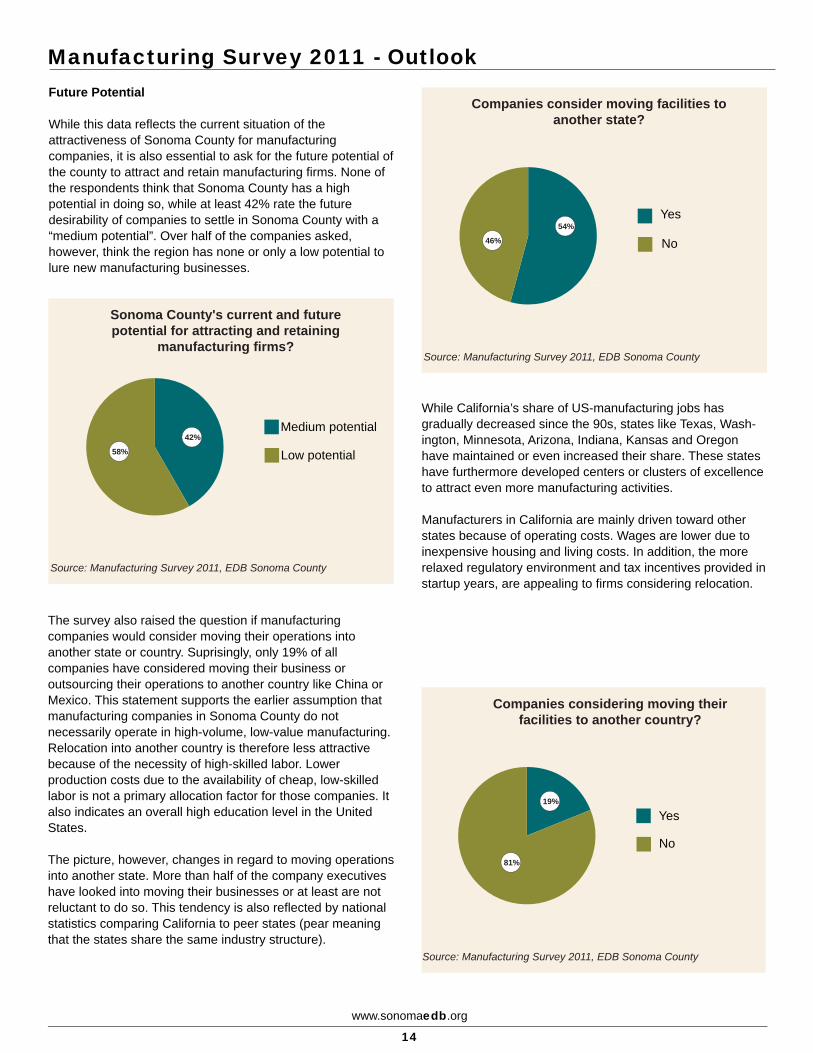
The picture, however, changes in regard to moving operations into another state. More than half of the company executives have looked into moving their businesses or at least are not reluctant to do so. This tendency is also reflected by national statistics comparing California to peer states (pear meaning that the states share the same industry structure).
63
5
20
5
63
5
20
5
Source: Manufacturing Survey 2011, EDB Sonoma County
Companies consider moving facilities to another state?
No
Yes54%
46%
While California’s share of US-manufacturing jobs has gradually decreased since the 90s, states like Texas, Wash-ington, Minnesota, Arizona, Indiana, Kansas and Oregon have maintained or even increased their share. These states have furthermore developed centers or clusters of excellence to attract even more manufacturing activities.
Manufacturers in California are mainly driven toward other states because of operating costs. Wages are lower due to inexpensive housing and living costs. In addition, the more relaxed regulatory environment and tax incentives provided in startup years, are appealing to firms considering relocation.
Source: Manufacturing Survey 2011, EDB Sonoma County
No
Yes19%
81%
Companies considering moving their facilities to another country?
Manufacturing Survey 2011 - Outlook
Expectations
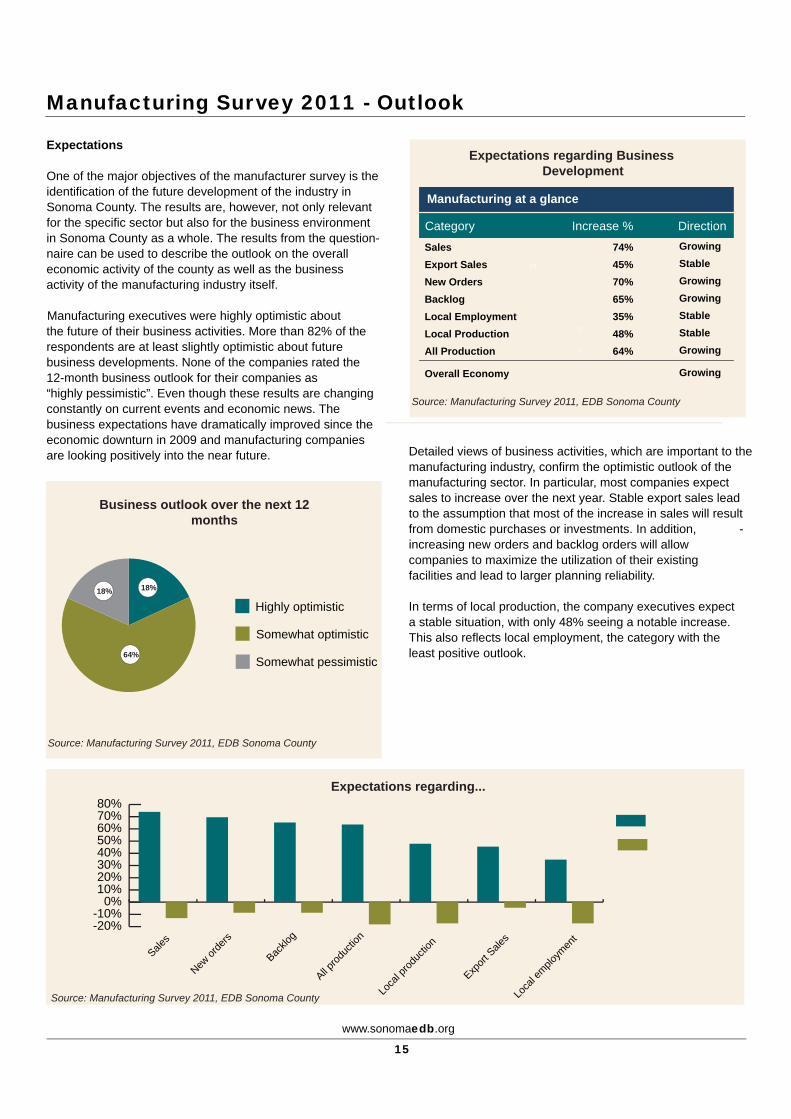
One of the major objectives of the manufacturer survey is the identification of the future development of the industry in Sonoma County. The results are, however, not only relevant for the specific sector but also for the business environment in Sonoma County as a whole. The results from the question-naire can be used to describe the outlook on the overall economic activity of the county as well as the business activity of the manufacturing industry itself. Manufacturing executives were highly optimistic aboutthe future of their business activities. More than 82% of the respondents are at least slightly optimistic about future business developments. None of the companies rated the 12-month business outlook for their companies as “highly pessimistic”. Even though these results are changing constantly on current events and economic news. Thebusiness expectations have dramatically improved since the economic downturn in 2009 and manufacturing companies are looking positively into the near future.
Source: Manufacturing Survey 2011, EDB Sonoma County
Business outlook over the next 12 months
Somewhat pessimistic
Somewhat optimistic
Highly optimistic
64%
18%18%
Source: Manufacturing Survey 2011, EDB Sonoma County
-20%-10%
0%10%20%30%40%50%60%70%80%
Expectations regarding...
All prod
uctio
n
Loca
l prod
uctio
n
Loca
l emplo
ymen
t
Backlo
g
New or
ders
Export
Sale
sSale
s
Expectations regarding Business Development
Manufacturing at a glance
Category Increase % Direction
Sales 74% Growing
Export Sales 6363 45% Stable
New Orders 70% Growing
Backlog 65% Growing
Local Employment 35% Stable2020Local Production 48% Stable
All Production 55 64% 55Growing
Overall Economy Growing
Source: Manufacturing Survey 2011, EDB Sonoma County
www.sonomaedb.org
15
Detailed views of business activities, which are important to the manufacturing industry, confirm the optimistic outlook of the manufacturing sector. In particular, most companies expect sales to increase over the next year. Stable export sales lead to the assumption that most of the increase in sales will result from domestic purchases or investments. In addition, -increasing new orders and backlog orders will allow companies to maximize the utilization of their existing facilities and lead to larger planning reliability. .
In terms of local production, the company executives expect a stable situation, with only 48% seeing a notable increase. This also reflects local employment, the category with the least positive outlook.
Manufacturing Survey 2011
www.sonomaedb.org
16
Investments
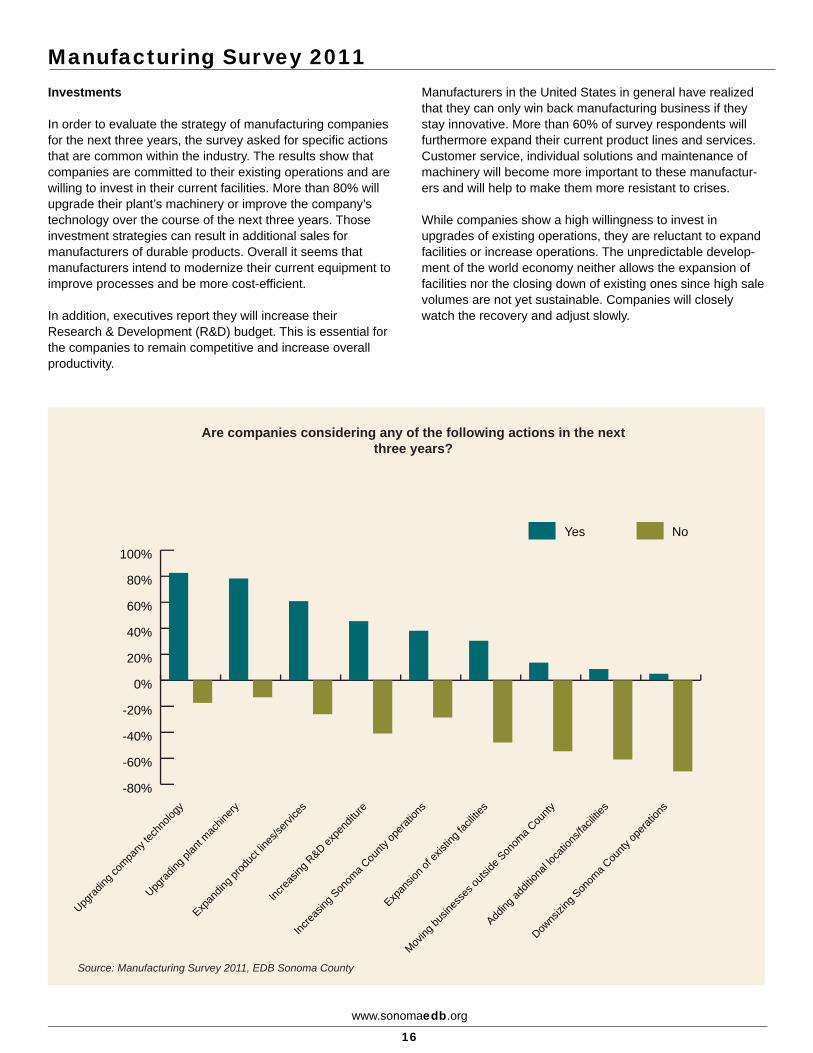
In order to evaluate the strategy of manufacturing companies for the next three years, the survey asked for specific actions that are common within the industry. The results show that companies are committed to their existing operations and are willing to invest in their current facilities. More than 80% will upgrade their plant’s machinery or improve the company’s technology over the course of the next three years. Those investment strategies can result in additional sales for manufacturers of durable products. Overall it seems that manufacturers intend to modernize their current equipment to improve processes and be more cost-efficient.
In addition, executives report they will increase their Research & Development (R&D) budget. This is essential for the companies to remain competitive and increase overall productivity.
Manufacturers in the United States in general have realized that they can only win back manufacturing business if they stay innovative. More than 60% of survey respondents will furthermore expand their current product lines and services. Customer service, individual solutions and maintenance of machinery will become more important to these manufactur-ers and will help to make them more resistant to crises.
While companies show a high willingness to invest in upgrades of existing operations, they are reluctant to expand facilities or increase operations. The unpredictable develop-ment of the world economy neither allows the expansion of facilities nor the closing down of existing ones since high sale volumes are not yet sustainable. Companies will closely watch the recovery and adjust slowly.
Are companies considering any of the following actions in the next three years?
Source: Manufacturing Survey 2011, EDB Sonoma County
-80%
-60%
-40%
-20%
0%
20%
40%
60%
80%
100%
NoYes
Downs
izing
Son
oma C
ounty
opera
tions
Adding
addit
ional
locati
ons/f
acilit
ies
Moving
busin
esse
s outs
ide S
onom
a Cou
nty
Expan
sion o
f exis
ting f
acilit
ies
Increa
sing S
onom
a Cou
nty op
eratio
ns
Increa
sing R
&D expe
nditu
re
Expan
ding p
roduc
t line
s/serv
ices
Upgrad
ing pl
ant m
achin
ery
Upgrad
ing co
mpany
tech
nolog
y
Manufacturing Survey 2011 - Education
www.sonomaedb.org
17
Source: Manufacturing Survey 2011, EDB Sonoma County
Does Sonoma County provide a sufficient pool of skilled labor from which to meet
most of the employment needs?
No
Somewhat
Yes41%
41%
18%
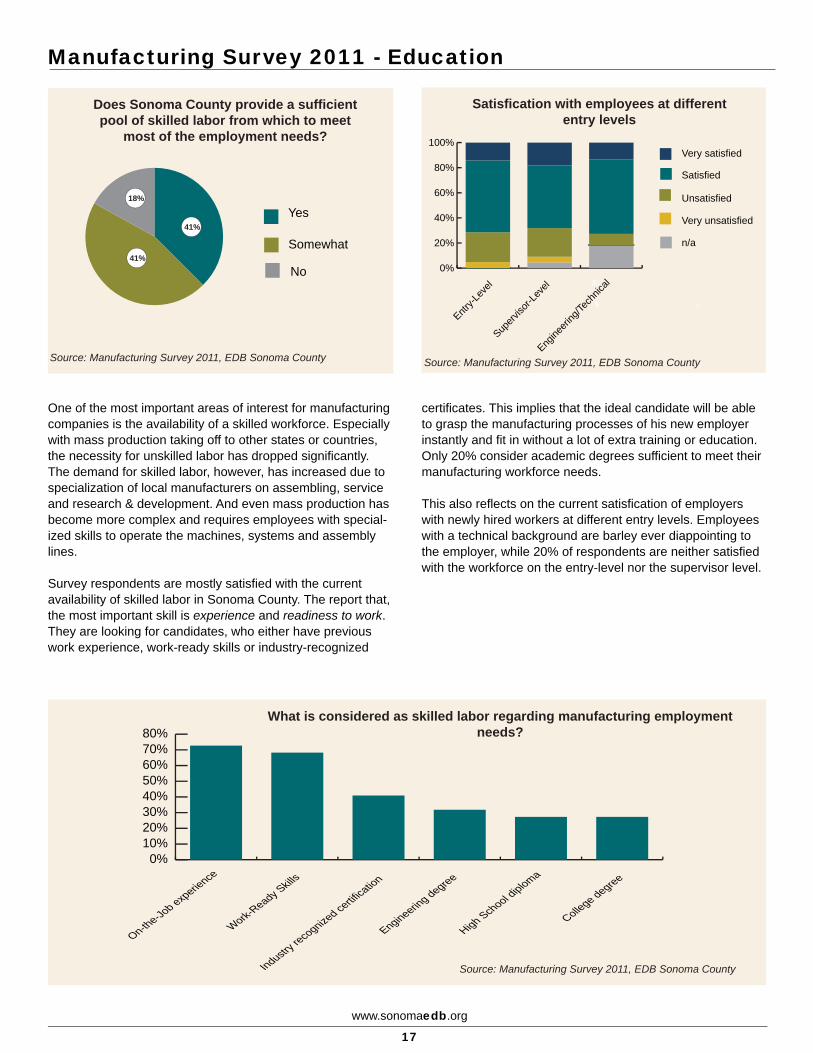
One of the most important areas of interest for manufacturing companies is the availability of a skilled workforce. Especially with mass production taking off to other states or countries, the necessity for unskilled labor has dropped significantly. The demand for skilled labor, however, has increased due to specialization of local manufacturers on assembling, service and research & development. And even mass production has become more complex and requires employees with special-ized skills to operate the machines, systems and assembly lines.
Survey respondents are mostly satisfied with the current availability of skilled labor in Sonoma County. The report that, the most important skill is experience and readiness to work. They are looking for candidates, who either have previous work experience, work-ready skills or industry-recognized
certificates. This implies that the ideal candidate will be able to grasp the manufacturing processes of his new employer instantly and fit in without a lot of extra training or education. Only 20% consider academic degrees sufficient to meet their manufacturing workforce needs.
This also reflects on the current satisfication of employers with newly hired workers at different entry levels. Employees with a technical background are barley ever diappointing to the employer, while 20% of respondents are neither satisfied with the workforce on the entry-level nor the supervisor level.
Satisfication with employees at different entry levels
100%Very satisfied
80%Satisfied
60% Unsatisfied
40% 6363 Very unsatisfied
20% n/a
0%
Entry-L
evel
Superv
isor-L
evel
echn
ical2200
Engine
ering
/T55 55
Source: Manufacturing Survey 2011, EDB Sonoma County
Source: Manufacturing Survey 2011, EDB Sonoma County
What is considered as skilled labor regarding manufacturing employment needs?
0%10%20%30%40%50%60%70%80%
College degree
High School diploma
Engineering degree
Industry r
ecognized ce
rtifica
tion
Work-Ready S
kills
On-the-Jo
b experience
Manufacturing Survey 2011 - Education
www.sonomaedb.org
18
63
5
20
5
63
5
20
5
Source: Manufacturing Survey 2011, EDB Sonoma County
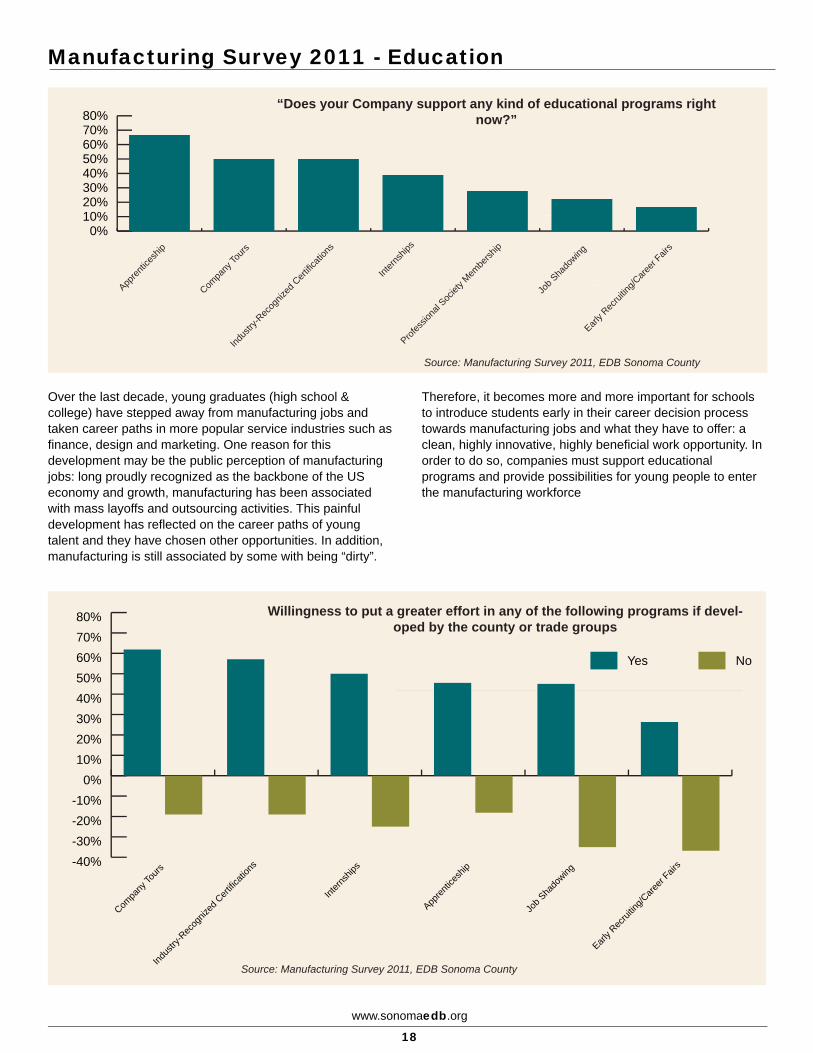
“Does your Company support any kind of educational programs right now?”
0%10%20%30%40%50%60%70%80%
Early R
ecrui
ting/C
areer
Fairs
Job S
hado
wing
Profes
siona
l Soc
iety M
embe
rship
Intern
ships
Indus
try-R
ecog
nized
Cert
ificati
ons
Compa
ny To
urs
Appren
tices
hip
Over the last decade, young graduates (high school & college) have stepped away from manufacturing jobs and taken career paths in more popular service industries such as finance, design and marketing. One reason for this development may be the public perception of manufacturing jobs: long proudly recognized as the backbone of the US economy and growth, manufacturing has been associated with mass layoffs and outsourcing activities. This painful development has reflected on the career paths of young talent and they have chosen other opportunities. In addition, manufacturing is still associated by some with being “dirty”.
Therefore, it becomes more and more important for schools to introduce students early in their career decision process towards manufacturing jobs and what they have to offer: a clean, highly innovative, highly beneficial work opportunity. In order to do so, companies must support educational programs and provide possibilities for young people to enter the manufacturing workforce
Source: Manufacturing Survey 2011, EDB Sonoma County
Willingness to put a greater effort in any of the following programs if devel-oped by the county or trade groups
-40%-30%-20%-10%
0%10%20%30%40%50%60%70%80%
Early R
ecrui
ting/C
areer
Fairs
Job S
hado
wing
Appren
tices
hip
Intern
ships
Indus
try-R
ecog
nized
Cert
ificati
ons
Compa
ny To
urs
NoYes
Manufacturing Survey 2011 - Education
www.sonomaedb.org
19
Educational Programs
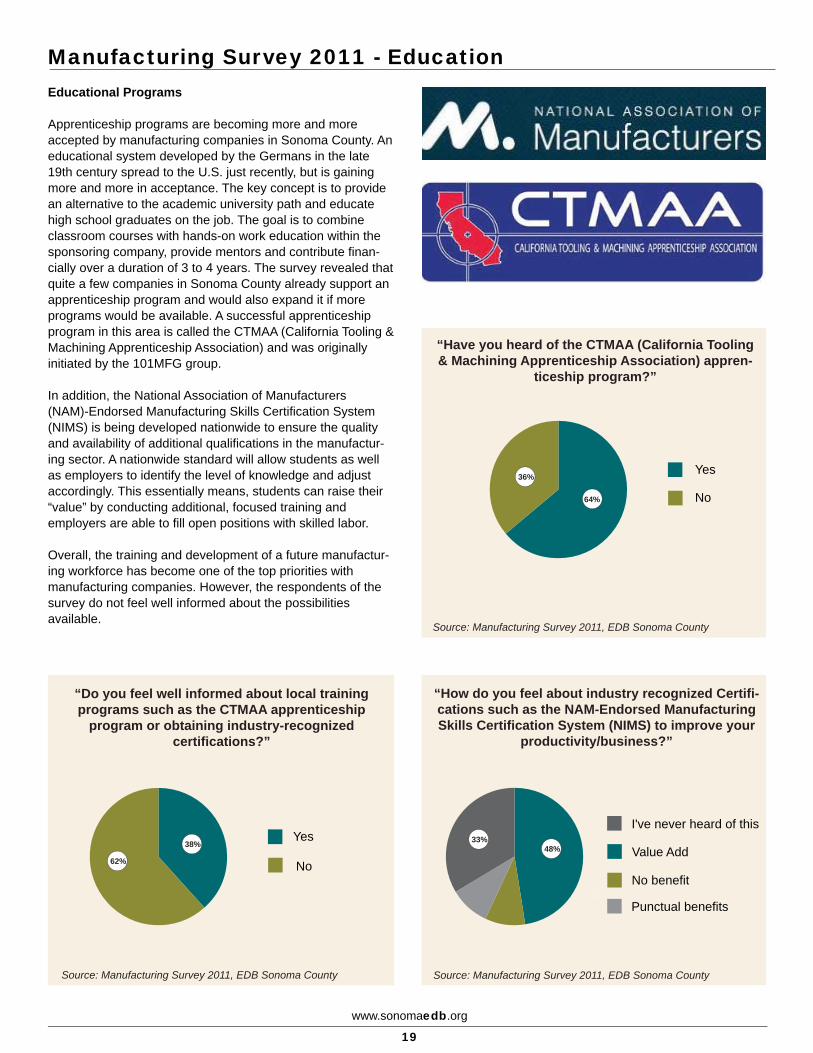
Apprenticeship programs are becoming more and more accepted by manufacturing companies in Sonoma County. An educational system developed by the Germans in the late 19th century spread to the U.S. just recently, but is gaining more and more in acceptance. The key concept is to provide an alternative to the academic university path and educate high school graduates on the job. The goal is to combine classroom courses with hands-on work education within the sponsoring company, provide mentors and contribute finan-cially over a duration of 3 to 4 years. The survey revealed that quite a few companies in Sonoma County already support an apprenticeship program and would also expand it if more programs would be available. A successful apprenticeship program in this area is called the CTMAA (California Tooling & Machining Apprenticeship Association) and was originally initiated by the 101MFG group.
In addition, the National Association of Manufacturers (NAM)-Endorsed Manufacturing Skills Certification System (NIMS) is being developed nationwide to ensure the quality and availability of additional qualifications in the manufactur-ing sector. A nationwide standard will allow students as well as employers to identify the level of knowledge and adjust accordingly. This essentially means, students can raise their “value” by conducting additional, focused training and employers are able to fill open positions with skilled labor.
Overall, the training and development of a future manufactur-ing workforce has become one of the top priorities with manufacturing companies. However, the respondents of the survey do not feel well informed about the possibilities available.
63
5
20
5
63
5
20
5
Source: Manufacturing Survey 2011, EDB Sonoma County
No
Yes
64%
36%
“Have you heard of the CTMAA (California Tooling & Machining Apprenticeship Association) appren-
ticeship program?”
63
5
20
5
63
5
20
5
Source: Manufacturing Survey 2011, EDB Sonoma County
“Do you feel well informed about local training programs such as the CTMAA apprenticeship
program or obtaining industry-recognized certifications?”
No
Yes
62%
38%
63
5
20
5
63
5
20
5
Source: Manufacturing Survey 2011, EDB Sonoma County
“How do you feel about industry recognized Certifi-cations such as the NAM-Endorsed Manufacturing Skills Certification System (NIMS) to improve your
productivity/business?”
I've never heard of this
No benefit
Punctual benefits
Value Add48%33%
Manufacturing Survey 2011
www.sonomaedb.org
20
Tax & Financing
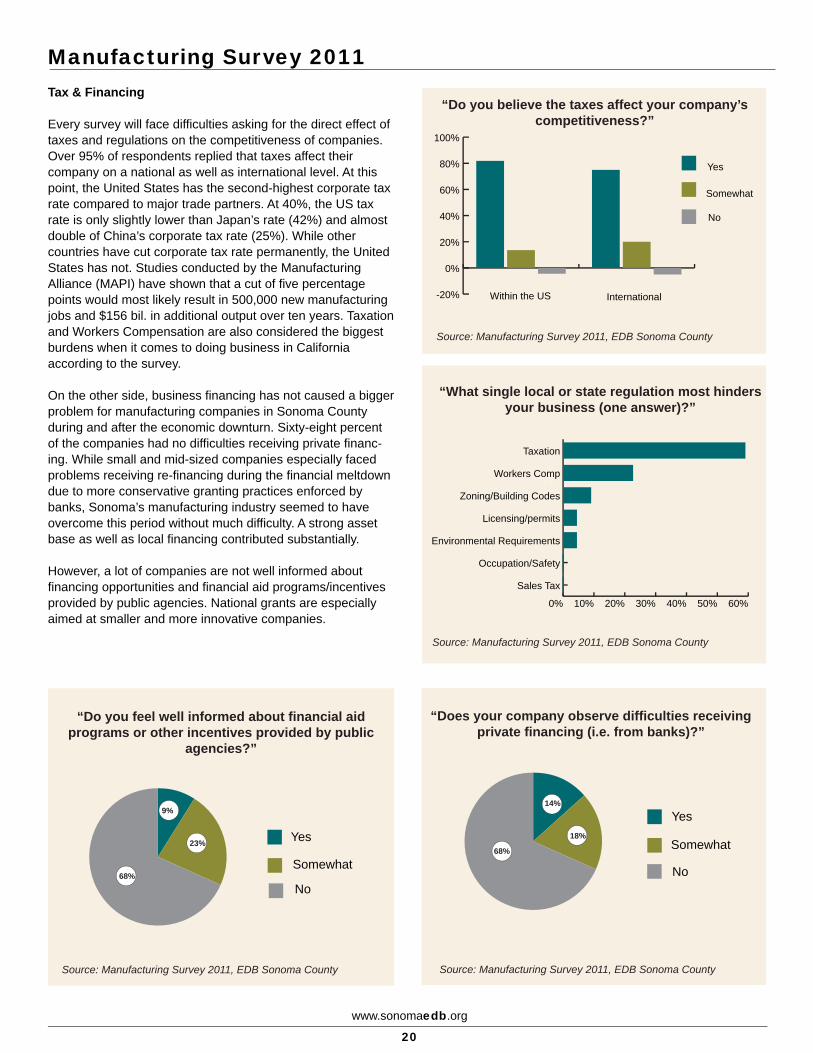
Every survey will face difficulties asking for the direct effect of taxes and regulations on the competitiveness of companies. Over 95% of respondents replied that taxes affect their company on a national as well as international level. At this point, the United States has the second-highest corporate tax rate compared to major trade partners. At 40%, the US tax rate is only slightly lower than Japan’s rate (42%) and almost double of China’s corporate tax rate (25%). While other countries have cut corporate tax rate permanently, the United States has not. Studies conducted by the Manufacturing Alliance (MAPI) have shown that a cut of five percentage points would most likely result in 500,000 new manufacturing jobs and $156 bil. in additional output over ten years. Taxation and Workers Compensation are also considered the biggest burdens when it comes to doing business in California according to the survey.
On the other side, business financing has not caused a bigger problem for manufacturing companies in Sonoma County during and after the economic downturn. Sixty-eight percent of the companies had no difficulties receiving private financ-ing. While small and mid-sized companies especially faced problems receiving re-financing during the financial meltdown due to more conservative granting practices enforced by banks, Sonoma’s manufacturing industry seemed to have overcome this period without much difficulty. A strong asset base as well as local financing contributed substantially.
However, a lot of companies are not well informed about financing opportunities and financial aid programs/incentives provided by public agencies. National grants are especially aimed at smaller and more innovative companies.
Source: Manufacturing Survey 2011, EDB Sonoma County
-20%
0%
20%
40%
60%
80%
100%
No
Somewhat
Yes
InternationalWithin the US
“Do you believe the taxes affect your company’s competitiveness?”
63
5
20
5
63
5
20
5
Source: Manufacturing Survey 2011, EDB Sonoma County
0% 10% 20% 30% 40% 50% 60%
Sales Tax
Occupation/Safety
Environmental Requirements
Licensing/permits
Zoning/Building Codes
Workers Comp
Taxation
“What single local or state regulation most hinders your business (one answer)?”
63
5
20
5
63
5
20
5
Source: Manufacturing Survey 2011, EDB Sonoma County
“Do you feel well informed about financial aid programs or other incentives provided by public
agencies?”
No
Somewhat
Yes
68%
23%
9%
63
5
20
5
63
5
20
5
Source: Manufacturing Survey 2011, EDB Sonoma County
“Does your company observe difficulties receiving private financing (i.e. from banks)?”
No
Somewhat
Yes18%
14%
68%

Manufacturing Can Lead to a Greener Environment!
www.sonomaedb.org
21
Sustainability
There are basically two ways for companies to clean up the environment and help to decrease CO2 emissions. First, they can increase their sustainability by improving the energy-efficiency of their own business. This can be achieved in many different ways: improve business processes intelli-gently, remodel office buildings and plants for energy savings, compensate emissions and handle resources economically. Another alternative is the continuous improvement in produc-tivity through technology to save energy and avoid carbon emissions. Manufacturing companies participate in both ways and therefore account for a large portion of improving the environment. Innovative products and efficient processes developed by the manufacturing sector allow companies and individuals worldwide to improve their personal carbon footprint.
In Sonoma County, businesses have the opportunity to participate in the “Bay Area Green Business Program” which is administered by the Economic Development Board. The program is designed to support companies that want to operate in a more environmentally responsible way and helps them comply with environmental regulations. If the compa-nies succeed in meeting the program standards, including ways to conserve resources, prevent pollution and minimize waste, they can be certified as a “Green Business”. The certification is not only recognized with consumers, compa-nies and agencies in California, but also adds credibility to the certified businesses.
Quite a lot of companies in Sonoma County have already taken the step to become environmentally friendly and received their certification accordingly. Manufacturing compa-nies have also become more interested in turning green and want to show that their products can make a big difference.
A Greener Business…6363
- Strengthens its bottom line through operating efficiencies- Improves employee morale and creates an overall healthy workplace
2200
- Demonstrates community good will55 55
- Holds a marketing edge- Is recognized as an environmental leader
More information on www.greenbiz.ca.gov
P&L Specialities of Santa Rosa, CA
P&L Specialities is a manufacturing company located in 6363
Santa Rosa, and they focus mainly on high quality stainless steel equipment and aluminum structures for the winemaking industry. The product line includes mainly the grape reception and selection equipment. P&L2020 took the steps to comply with the Sonoma Green Business 55 55
Program in 2009, and was the second manufacturer in Sonoma County to receive the “Green Business” certifi-cate in February 2010.
During the certification process all employees were involved and as a team they worked towards the certifica-tion from making big changes, such as the use of high 6363
efficiency electronics in their products to small improve-ments like eliminating the usage of bottled water. Overall, the company made big progress in becoming environmentally friendly and the public response towards 2020
the certification was very positive.
Source: NorthBaybiz Interview with Ed Barr, CEO of P&L Specialities
“Receiving the green business certification was much more powerful for me than I`d originally expected” - Ed Barr, president/CEO of P&L Specialities
Why Germany is Performing Well
www.sonomaedb.org
22
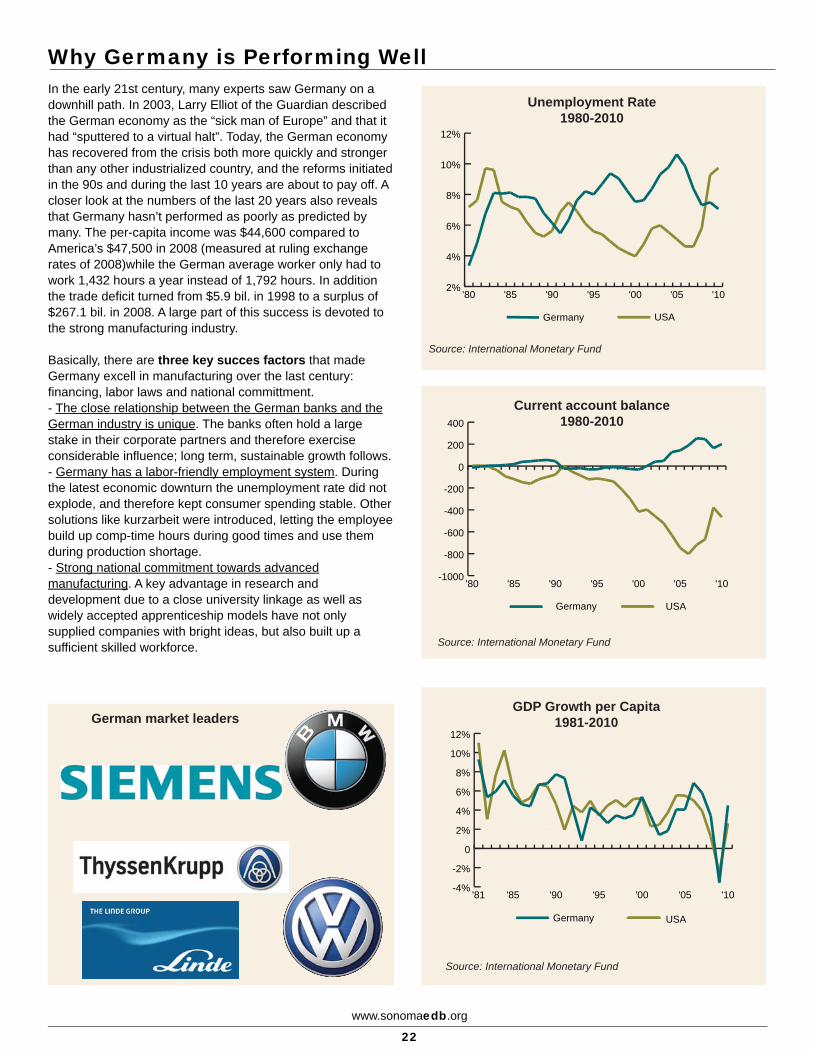
In the early 21st century, many experts saw Germany on a downhill path. In 2003, Larry Elliot of the Guardian described the German economy as the “sick man of Europe” and that it had “sputtered to a virtual halt”. Today, the German economy has recovered from the crisis both more quickly and stronger than any other industrialized country, and the reforms initiated in the 90s and during the last 10 years are about to pay off. A closer look at the numbers of the last 20 years also reveals that Germany hasn’t performed as poorly as predicted by many. The per-capita income was $44,600 compared to America’s $47,500 in 2008 (measured at ruling exchange rates of 2008)while the German average worker only had to work 1,432 hours a year instead of 1,792 hours. In addition the trade deficit turned from $5.9 bil. in 1998 to a surplus of $267.1 bil. in 2008. A large part of this success is devoted to the strong manufacturing industry.
Basically, there are three key succes factors that made Germany excell in manufacturing over the last century: financing, labor laws and national committment. - The close relationship between the German banks and the German industry is unique. The banks often hold a large stake in their corporate partners and therefore exercise considerable influence; long term, sustainable growth follows. - Germany has a labor-friendly employment system. During the latest economic downturn the unemployment rate did not explode, and therefore kept consumer spending stable. Other solutions like kurzarbeit were introduced, letting the employee build up comp-time hours during good times and use them during production shortage.- Strong national commitment towards advanced manufacturing. A key advantage in research and development due to a close university linkage as well as widely accepted apprenticeship models have not only supplied companies with bright ideas, but also built up a sufficient skilled workforce.
2%
4%
6%
8%
10%
12%
USAGermany
'10'05'00'95'90'85'80
Unemployment Rate1980-2010
Source: International Monetary Fund
63
5
20
5
63
5
20
5
-1000
-800
-600
-400
-200
0
200
400
USAGermany
'10'05'00'95'90'85'80
Current account balance1980-2010
Source: International Monetary Fund
63
20
63
20-4%
-2%
0
2%
4%
6%
8%
10%
12%
USAGermany
'10'05'00'95'90'85'81
GDP Growth per Capita1981-2010
Source: International Monetary Fund
63
5
20
5
63
5
20
5
German market leaders
Where to go from Here?
www.sonomaedb.org
23
General
The report itself and the results of the survey have highlighted some interesting areas and identified some problems that the U.S., California and Sonoma County have to face eventually. The manufacturing companies in Sonoma County are of the most innovative kind and they still hold leadership in high-tech manufacturing, which still gives them an advantage above international competition. The structural decline in manufacturing jobs results mainly from an increase in productivity and efficiency in manufacturing processes. The decline in manufacturing jobs, however, does not mean that there is excess skilled labor available in the US. Manufacturing has become more and more complex, and the biggest problem the U.S. manufacturers face right now is the availability of skilled and trained employees.
The lack of a sufficient workforce has many different origins. One of the most concerning is the public perception of the manufacturing industry, possibly percieved to be a low-skill, low-pay industry. High school and college students neither learn nor acknowledge the benefits a manufacturer has to offer, and therefore choose other career paths in the service industry.
For the future of high-tech manufacturing in Sonoma County it is therefore essential to develop programs and partnerships to improve the availability of skilled labor in the area. Companies, trade groups as well as governmental and educational organizations have to work more closely together to initiate programs and motivate students to pursue a career in manufacturing.
In a first step, this can be achieved by bringing students and manufacturers together. The survey revealed that companies would be more than willing to offer company tours to classes, educate them about the potential of the manufacturing industry and show them what a career in manufacturing would look like. This is an important step towards improving the perception of the industry sector with its future workforce. In addition, internships can provide an in-depth manufacturing experience for those interested.
An even larger requirement is to show young talent the alternative career paths they can take to become a skilled worker in manufacturing. Especially in manufacturing, it is not always important to attend college or university. On-the-job and hands-on work experience are seen as good qualifications by employers and are valued as highly as university degrees. Therefore, apprenticeship models and work-specific training programs have proven to be quite successful in the past. These programs provide the students with basic skills and additionally educate them on the job – either in the factory or in workshops.
Methodology
www.sonomabea.org
24
The Sonoma County Manufacturing Industry Survey 2011 was mailed to 120 business executives during the spring of 2011. The survey was also available on the web, with e-mails linking to the online survey sent to approximately 100 of the same business executives. Responses were received from 35 businesses, for a response rate of 29%. This survey retains the critical themes that are common to the majority of industry reports, but has been tailored to fit Sonoma County’s unique environment and economy. The companies surveyed included all fields of manufacturing as well as companies of different sizes.
The data here represent the opinion of the businesses that responded via the Internet, postal mail, or fax. The EDB Manufacturing Industry Report 2011 is meant to gauge the current situation of Sonoma County manufactur-ing businesses and identify challenges and opportunities for program improvement from survey data.
Please note that all data contained in this report is based on information self-reported by survey respondents, and was not factually verified by the EDB. The responses were then gathered into a database for analysis. Due to the fact that survey respondents may provide no responses to some questions, the category percentages indicated in the graphs for those questions may not add up to 100 percent. In the cases where replies are mutu-ally exclusive, percentages may be slightly off due to rounding. Where replies are not mutually exclusive, percent-ages may total more than 100 percent. The intent is to obtain averages that provide a general “snapshot” of the manufacturing situation in Sonoma County businesses. Accordingly, the averages have not been weighted by any factor or interest. The data presented is as accurate as the polling technology permits.
The Economic Development Board makes no claim that the information presented in this report is an accurate reflection of the business practices of every manufacturing company in Sonoma County.
Acknowledgements
Many people contributed their valuable time and ideas to this project. The MFG101 group played a particularly important role in defining the scope of the project and encouraging participation. Without the work of this dedicated group of businesspeople, neither this study nor the valuable work of the EDB would be possible. Moritz Werner, the current Research Analyst for the EDB, spearheaded the design, compilation, and organiza-tion of the report. In addition, he designed the survey, completed initial mailings and analysed the survey findings. He also presented the results to the EDB Board. Sarah Deming contributed greatly in the collection of the surveys and initial design.
However, the recognition belongs to the companies that chose to participate in the first Manufacturing Survey and the local businesses that steer the way to environmental excellence. Their dedication and participation is crucial to the success of this program. The EDB honors their commitment.
The Business Environmental Alliance is a project of the Sonoma County Economic Development Board. The EDB provides assistance services directed toward encouraging the startup, retention and expansion of Sonoma County businesses and jobs, particularly with small businesses. By providing referral services and developing and disseminating data, the EDB strives to help the local business community startup, grow and thrive. The EDB encourages interested readers to provide feedback to improve our current and future publications. For additional information and past reports, please visit www.sonomaedb.org. If you have questions or comments, please contact us at (707) 565-7170.
The EDB believes all data contained within this report to be accurate and the most current available, but does not guarantee its accuracy. Use of data from an outside source does not represent an endorsement of any product or service by the EDB, its members or affiliates. This publication is available in alternative formats like Braille, large print, audiotape, or computer disk. Please allow 72 hours for your request to be processed.
Economic Development Board401 College Avenue, Suite DSanta Rosa, CA 95401(707) 565-7170www.sonomaedb.org
With acknowledgement and appreciation to local key businessessupporting Sonoma County Economic Development:
Director
Sponsors
Executive
RE PUBLIC
CALIFORNIA
A G R I C U LT U R EI N D U S T R Y
R E C R E A T I O N
SONOMA COUN
TY
■ County of Sonoma General Services, Real Estate Division ■ County of Sonoma Board of Supervisors ■ Sonoma County Health Services ■ Sonoma County Transportation & Public Works ■