industry growth in pakistan
DESCRIPTION
Industry Growth in PakistanDetailed...TRANSCRIPT
39 Civil Lines, Mayo Road Rawalpindi
Phone: 051-511051-4 Fax: 051-5111055 Email: [email protected]
The Rawalpindi Chamber
Of Commerce & Industry
Compiled by: Sadaf Jaleel (R & D Officer) Research & Development Department
PAKISTAN INDUSTRIAL GROWTH
SUMMARY
Industrial Sector is of great importance for economic development of every country. It is
historical fact that countries with strong industrial sector have showed more economic growth
and development.
Pakistan Industrial Sector is the second largest individual sector of the economy accounting for
25% of the GDP. This industrial sector comprised of large, medium and small-scale.
At the time of independence the total large scales industrial contribution was only 1.8 percent to
GDP. The small-scale industries however, contributed 4.6 percent to GDP. Now from 2010-11
the large scale industries contributes 4.4 % to the real GDP growth rate while the small scale
industries contributes 7.5 %.
It is evident that even after six decades our industrial sector did not play its role despite having
the potential. Most of the current economic problems in Pakistan are ultimately linked to the
slow pace of industrial development. Rapid industrialization is considered by the economic
experts as the sovereign remedy to put our economy on a sound basis.
The report is segmented into the following sectors.
Major industries in Pakistan and their performance since 1947.
Share and growth rate of different sectors in national GDP.
Pakistan industrial sector’s share in real GDP growth rate and growth trend from
2006-11 along with the rationales.
Major impediments along with the recommendations.
The data collection followed both primary and secondary source. Primary source of data were
the telephonic interviews. On the other hand secondary data were research articles, internet,
economic survey of Pakistan, Federal Bureau of statistics and State bank of Pakistan.

Compiled by: Sadaf Jaleel (R&D Officer)
CONTENTS
1. HISTORICAL BACKGROUND ......................................................................................................................................................... 1
1.1. GROWTH OF INDUSTRIAL SECTOR IN PAKISTAN ................................................................................................ 1
1.1.1. Growth of Industrial Sector from 1947 to 1950 ............................................................................................... 1
1.1.2. Growth of Industrial Sector in 1950's ................................................................................................................... 1
1.1.3. Performance of Industrial Sector in 1960's ........................................................................................................ 2
1.1.4. Performance of Industrial Sector in 1970's ........................................................................................................ 2
2. SECTORAL SHARE IN REAL GDP GROWTH RATE ............................................................................................................. 3
2.1. SECTORAL SHARE GDP in 2010-11 ............................................................................................................................... 3
2.2. INDUSTRIAL SECTOR SHARE IN REAL GDP GROWTH RATE .......................................................................... 4
3. INDUSTRIES IN PAKISTAN ............................................................................................................................................................ 7
3.1. Pakistan Major Industries Growth Trends 2006-11 .......................................................................................... 8
3.1.1. AUTOMOBILE .................................................................................................................................................................. 8
3.1.2. LEATHER PRODUCTS ................................................................................................................................................. 8
3.1.3. Paper & board .............................................................................................................................................................. 10
3.1.4. Pharmaceuticals ......................................................................................................................................................... 10
3.1.5. Chemical .......................................................................................................................................................................... 11
3.1.6. Engineering items ...................................................................................................................................................... 11
3.1.7. Textile ............................................................................................................................................................................... 12
3.1.8. Electronic ........................................................................................................................................................................ 12
3.1.9. Non-metallic minerals ............................................................................................................................................. 13
3.1.10. Petroleum products ............................................................................................................................................ 13
3.1.11. Fertilizers .................................................................................................................................................................. 14
3.1.12. Food, beverages & tobacco .............................................................................................................................. 14
3.1.13. Mining and Quarrying ........................................................................................................................................ 15
3.1.14. Services Sector ....................................................................................................................................................... 15
3.1.15. Agriculture ................................................................................................................................................................ 16
3.1.16. Live Stock ................................................................................................................................................................... 16
3.1.17. Steel .............................................................................................................................................................................. 17
3.1.18. Cement ........................................................................................................................................................................ 17
3.1.19. Electricity and Gas ................................................................................................................................................ 18
3.2. Positive Growth trends in industrial sectors in 2010-11 .............................................................................. 19
3.3. Negative growth trends in industrial sectors in 2010-11 ............................................................................. 20
3.4. Causes Of Industrial Backwardness In Pakistan ....................................................................................................... 21
Recommendations ..................................................................................................................................................................................... 24
Page | 1 Compiled by: Sadaf Jaleel (R&D Officer)
P A K I S T A N I N D U S T R I A L S E C T O R
1. HISTORICAL BACKGROUND
Pakistan at the time of partition in 1947 had a negligible industrial base. It got only 34 industries
out of total 955, while remaining were held by India. Such a small number of industries were not
enough for a newly born country to face the industrialized world. With the passage of time
Pakistan utilized it’s all available resources domestic as well as external for rapid development of
manufacturing sector.
1.1. GROWTH OF INDUSTRIAL SECTOR IN PAKISTAN
The industrial performance in terms of growth/productivity is examined in the following periods
of time:
1. Growth of industrial sector from 1947 to 1950.
2. Growth of industrial sector in 1950's.
3. Performance of industrial sector in 1960's.
4. Performance of industrial sector in 1970's.
1.1.1. GROWTH OF INDUSTRIAL SECTOR FROM 1947 TO 1950
Out of 955 industrial units operating in the British India, Pakistan got only 34 industries i.e. 4%
of the total industries established in the Subcontinent. The rest were located in India. The
industries which came to the share of Pakistan were of a comparatively small size and were
based on raw material. These industries included small sugar mills, cotton ginning factories,
flour mills, rice husking mills and canning factories etc.
In 1947 it was suggested in the Industrial conference of Pakistan to establish industries, which
use locally produced raw material like jute, cotton, hide and skins. The Government also set up
an Industrial Finance Corporation and an Industrial Investment and Credit Corporation in 1948.
In the period from 1947 to 1950, the private entrepreneurs invested in those industries which
showed the highest profit. The contribution of industrial sector was 6.9% to GDP in 1950.
1.1.2. GROWTH OF INDUSTRIAL SECTOR IN 1950'S
In 1952 the Government took the initiative and established Pakistan Industrial Development
Corporation (PIDC) to invest in those industries which require heavy initial investment. PIDC
major investment was in paper and paper board, cement, fertilizer, jute mills and the Sui Karachi
gas pipeline. PIDC by June, 1971 had completed 59 industrial units and created a base for self
sustained growth in the industrial sector.

Page | 2 Compiled by: Sadaf Jaleel (R&D Officer)
A large number of new industries were established. The production capacity of the already
existing units like fertilizers, jute and paper was considerably expanded. The reduction of export
duties and the introduction of Export Bonus Scheme in 1958 increased export of the
manufactured goods. There was all round development of industries particularly in agricultural
processing food products and textiles. The share of industrial sector to GDP rose from 9.7% in
1954-55 to 11.9% in 1959-60.
1.1.3. PERFORMANCE OF INDUSTRIAL SECTOR IN 1960'S
In 1960’s there was a shift in the establishment of consumer goods industries to heavy industries
such as machine tools, petro-chemical, electrical complex and iron and steel. The industrial
performance in terms of growth, export and productivity increased during the Second Five Year
Plan period. The share of industrial sector to GNP went up to 11.8% from 1960 to 1965.
The manufacturing sector could achieve a growth rate of 7.8% against the Plan target of 10%.
1.1.4. PERFORMANCE OF INDUSTRIAL SECTOR IN 1970'S
The industrial performance in terms of growth, exports and production was disappointing from
1971 to 1977. There were various reasons for the poor performance of the manufacturing sector.
One wing of the country (East Pakistan) was forcibly separated. The Country had to fight a war
with India in 1970. The suspension of foreign aid, loss of indigenous market (East Pakistan), fall
in exports, devaluation to the extent of 131% nationalization of industries labor unrest,
unfavorable investment climate, floods, recession in world trade and reduction in investment
incentives caused a fall in the output of large scale industries.
The annual growth rate fell to 2.8% in the industrial sector in this period.
From July, 1977 to 1980, the Government initiated a large number of measures to revise the
economy. Cotton ginning rice husking and flour milling were denationalized. The private sector
was encouraged to invest in large scale industries.
The annual growth rate in manufacturing sector was 8.2% in the 1989's. The growth of large
scale manufacturing slowed down to an average of 4.7% in the first half and further to 2.5% in
the 2nd half of the 1990's.
Page | 3 Compiled by: Sadaf Jaleel (R&D Officer)
2. SECTORAL SHARE IN REAL GDP GROWTH RATE 2006-11
(Percent)
SECTOR 2006 2007 2008 2009 2010
Agriculture 6.3 4.1 1.0 4.0 2.0
Industry 4.1 8.8 1.4 -1.9 4.9
Services 6.5 7.0 6.0 1.6 4.6
Source: Federal Bureau of Statistics
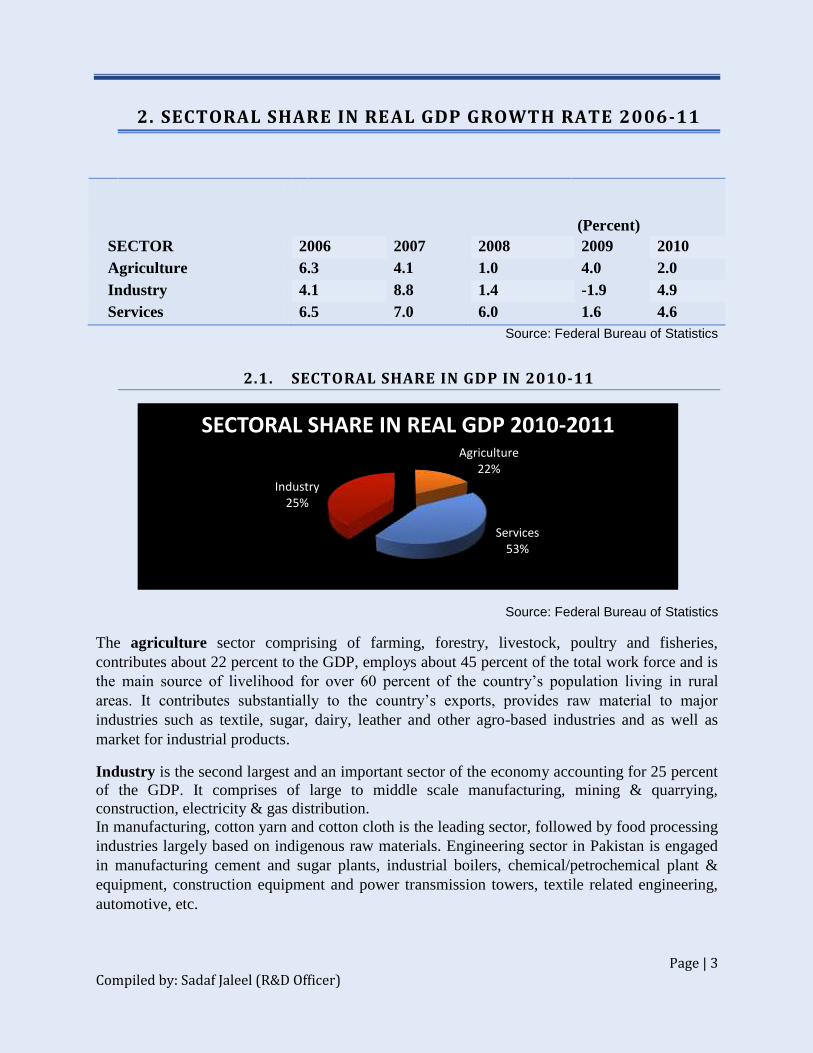
2.1. SECTORAL SHARE IN GDP IN 2010-11
Source: Federal Bureau of Statistics
The agriculture sector comprising of farming, forestry, livestock, poultry and fisheries,
contributes about 22 percent to the GDP, employs about 45 percent of the total work force and is
the main source of livelihood for over 60 percent of the country’s population living in rural
areas. It contributes substantially to the country’s exports, provides raw material to major
industries such as textile, sugar, dairy, leather and other agro-based industries and as well as
market for industrial products.
Industry is the second largest and an important sector of the economy accounting for 25 percent
of the GDP. It comprises of large to middle scale manufacturing, mining & quarrying,
construction, electricity & gas distribution.
In manufacturing, cotton yarn and cotton cloth is the leading sector, followed by food processing
industries largely based on indigenous raw materials. Engineering sector in Pakistan is engaged
in manufacturing cement and sugar plants, industrial boilers, chemical/petrochemical plant &
equipment, construction equipment and power transmission towers, textile related engineering,
automotive, etc.
Agriculture 22%
Industry 25%
Services 53%
SECTORAL SHARE IN REAL GDP 2010-2011
The services sector is becoming an increasingly important dimension of Pakistan’s economy due
to its major contribution of about 53 percent in the GDP. Wholesale & retail trade, transport &
storage, communication, community & social services and personal services are leading service
activities in Pakistan. Other services are finance and insurance, ownership of dwellings, public
administration.
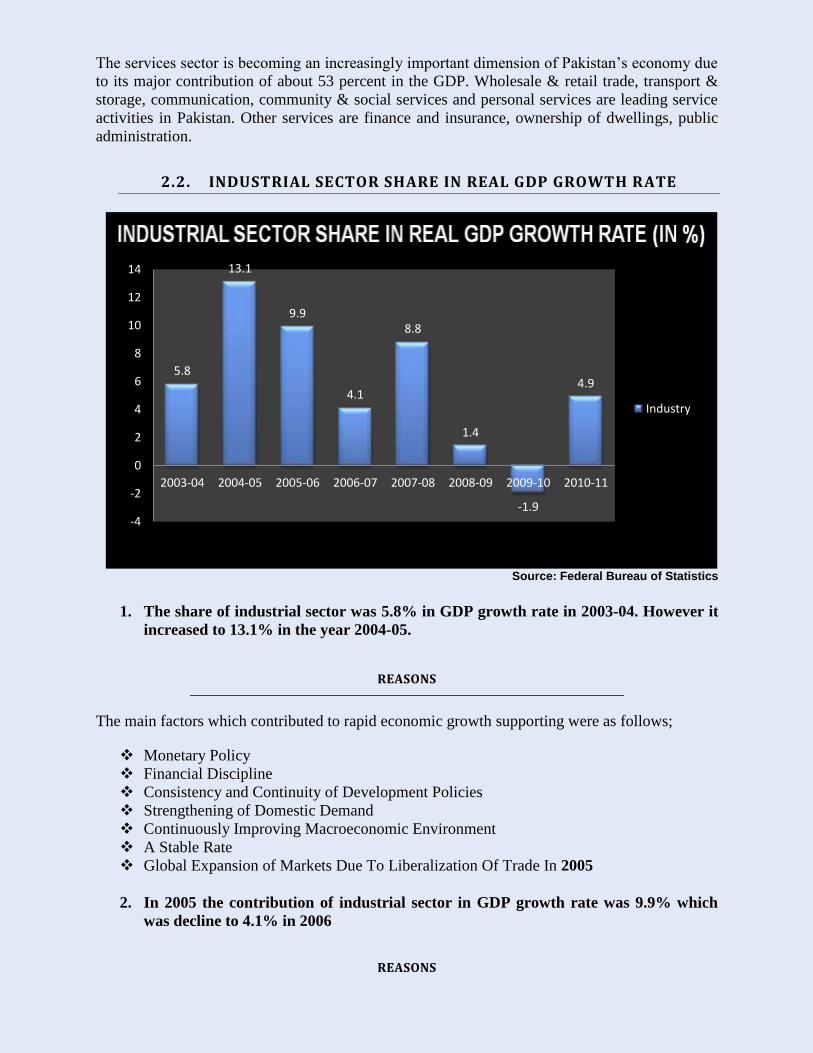
2.2. INDUSTRIAL SECTOR SHARE IN REAL GDP GROWTH RATE
Source: Federal Bureau of Statistics
1. The share of industrial sector was 5.8% in GDP growth rate in 2003-04. However it
increased to 13.1% in the year 2004-05.
REASONS
The main factors which contributed to rapid economic growth supporting were as follows;
Monetary Policy
Financial Discipline
Consistency and Continuity of Development Policies
Strengthening of Domestic Demand
Continuously Improving Macroeconomic Environment
A Stable Rate
Global Expansion of Markets Due To Liberalization Of Trade In 2005
2. In 2005 the contribution of industrial sector in GDP growth rate was 9.9% which
was decline to 4.1% in 2006
REASONS
5.8
13.1
9.9
4.1
8.8
1.4
-1.9
4.9
-4
-2
0
2
4
6
8
10
12
14
2003-04 2004-05 2005-06 2006-07 2007-08 2008-09 2009-10 2010-11
Industry

The decline in manufacturing sector is due to multiple reasons like the reduced production of
cotton crops, sugar shortage, steel and iron problems and global oil price.
Page | 6 Compiled by: Sadaf Jaleel (R&D Officer)
3 From 2006 to 2007 there was an increase in the industrial sector contribution
towards the GDP growth rate.
REASONS
Major reasons for the growth in 2007 was production of sugar which was estimated at
61.5Million Metric Ton (MMT), an increase of 12% over previous year due to increase in
area under cultivation and yield.
In 2007, the industrial sector grew by 14% and accounted for 27% of the gross domestic
product (GDP) based on purchasing power parity.
Foreign direct investment in mining and quarrying and oil and gas exploration increased
by 34% and 74%, respectively, in 2007 compared with that of 2006.
Textile exports in 1999 were $5.2 billion and rose to become $10.5 billion by 2007.
In 2007 The Government of Pakistan has offered a number of incentives for encouraging
the use of CNG in the country.
4 In 2008 and 2009 there was a drastic decline in the industrial sector contribution
towards the GDP growth rate.
REASONS
The industrial sector has recorded its weakest growth in a decade during fiscal year 2008-
09.
Main contributors towards this broad based decline were;
The impact of severe energy shortages.
Decline in domestic law and order situation.
Sharp depreciation in rupee vis-a-vis US dollar.
Weak external demand on the back of global recession coupled with slowdown in
domestic demand.
The economic development has been slowed down in 2008 because of the large price
increase of some commodities such as oil and food, global financial Crisis, and national
political issues that affect the industrial growth.
The trade deficit, which was 3.7 in 2007 may widen further to about 17 percent in 2009
due to rise in domestic demand.
The increasing trend in inflation also affected consumers to curtail expenditure on
durable goods.
The performance of steel mill was unsatisfactory during the current fiscal year. The
production value slid down from Rs 11133 million in 2007-08 to Rs 9971 million in the
current financial year, witnessing a decrease of 10.44 percent.
Page | 7 Compiled by: Sadaf Jaleel (R&D Officer)
5. During the FY 2010-11, the domestic industrial sector recovered from the longest-
ever decline (seen in the previous year) to record a decent growth of 4.9 percent.
REASONS
The recovery came mainly due to supportive macroeconomic policies, relatively lower
inflation, improved prospects of global economy, and relatively better credit availability.
The growth in FY 2010-11 was the fourth highest growth rate in the decade, but was still
below the 10-year average of 5.7 percent.
The industrial growth during FY2010-11 is mainly from a rebound in manufacturing and
construction sectors as government reversed some taxes imposed last year.
The resultant price adjustments were immediately followed by the pick-up in domestic
demand which coupled with available capacities, ensured positive growth rate in most
sectors.
3. INDUSTRIES IN PAKISTAN
Pakistan ranks forty-first in the world in factory output.
Pakistan's industrial sector accounts for about 25% of GDP.
Following are the main industries of our country
Textile Industry
Sports Industry
Sugar Industry
Cement Industry
Fertilizer Industry
Other major industries include:
Automobile
Leather products
Paper & board
Pharmaceuticals
Chemical
Engineering items
Electronic
Non-metallic minerals
Petroleum products
Food, beverages & tobacco
Mining and Quarrying
Services Sector
Agriculture
Live Stock
Steel
Electricity and Gas
Page | 8 Compiled by: Sadaf Jaleel (R&D Officer)
The government is privatizing large-scale Government owned units, and the public sector
accounts for a shrinking proportion of industrial output, while growth in overall industrial
output (including the private sector) has accelerated. Government policies aim to diversify
the country's industrial base and bolster export industries.
The Pakistan Major industries growth trends from 2006 to 2011 are as follows;
3.1. PAKISTAN MAJOR INDUSTRIES GROWTH TRENDS 2006-11
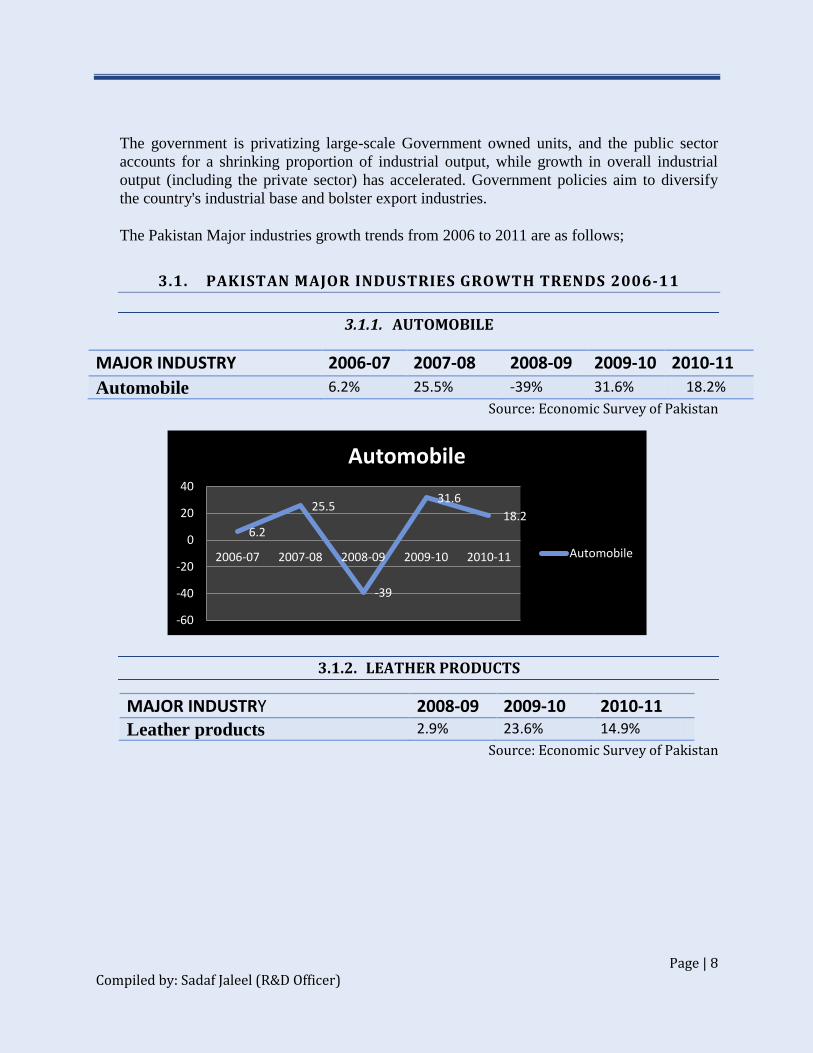
3.1.1. AUTOMOBILE
MAJOR INDUSTRY 2006-07 2007-08 2008-09 2009-10 2010-11
Automobile 6.2% 25.5% -39% 31.6% 18.2%
Source: Economic Survey of Pakistan
3.1.2. LEATHER PRODUCTS
MAJOR INDUSTRY 2008-09 2009-10 2010-11
Leather products 2.9% 23.6% 14.9%
Source: Economic Survey of Pakistan
6.2
25.5
-39
31.6
18.2
-60
-40
-20
0
20
40
2006-07 2007-08 2008-09 2009-10 2010-11
Automobile
Automobile

2.9
23.6
14.9
0
10
20
30
2006-07 2007-08 2008-09 2009-10 2010-11
Leather Products
Leather products
Page | 10 Compiled by: Sadaf Jaleel (R&D Officer)
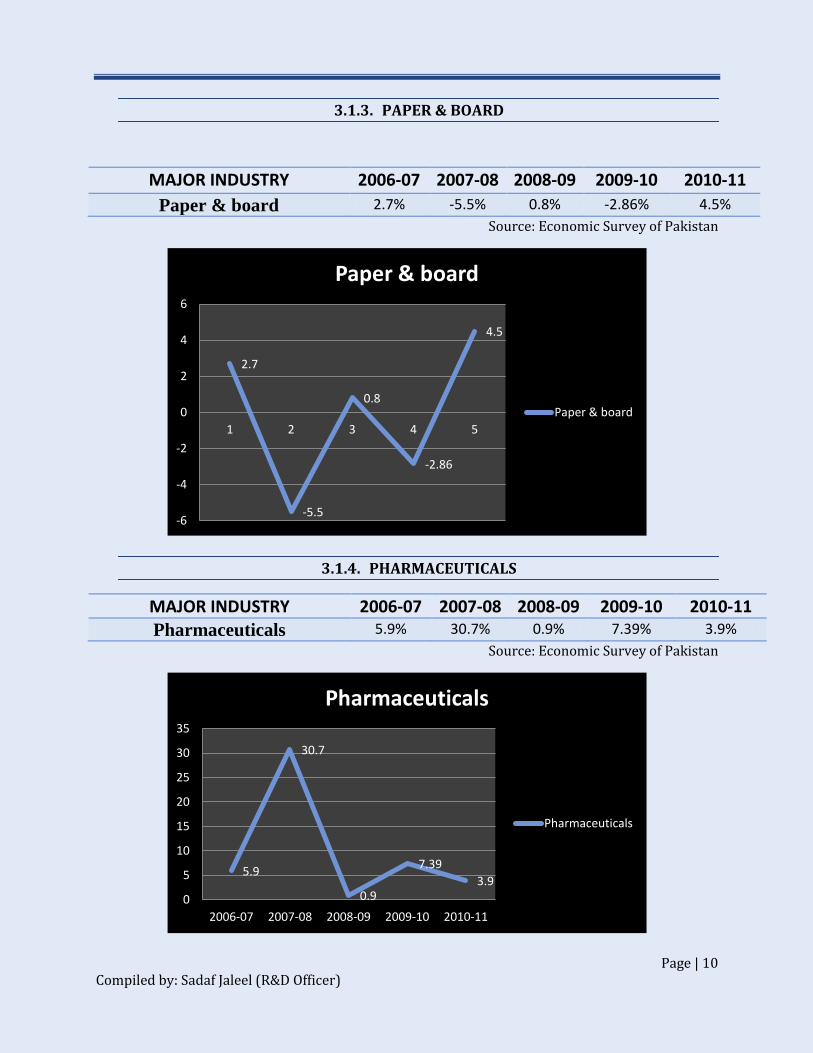
3.1.3. PAPER & BOARD
MAJOR INDUSTRY 2006-07 2007-08 2008-09 2009-10 2010-11
Paper & board 2.7% -5.5% 0.8% -2.86% 4.5%
Source: Economic Survey of Pakistan
3.1.4. PHARMACEUTICALS
MAJOR INDUSTRY 2006-07 2007-08 2008-09 2009-10 2010-11
Pharmaceuticals 5.9% 30.7% 0.9% 7.39% 3.9%
Source: Economic Survey of Pakistan
2.7
-5.5
0.8
-2.86
4.5
-6
-4
-2
0
2
4
6
1 2 3 4 5
Paper & board
Paper & board
5.9
30.7
0.9
7.39
3.9
0
5
10
15
20
25
30
35
2006-07 2007-08 2008-09 2009-10 2010-11
Pharmaceuticals
Pharmaceuticals
Page | 11 Compiled by: Sadaf Jaleel (R&D Officer)
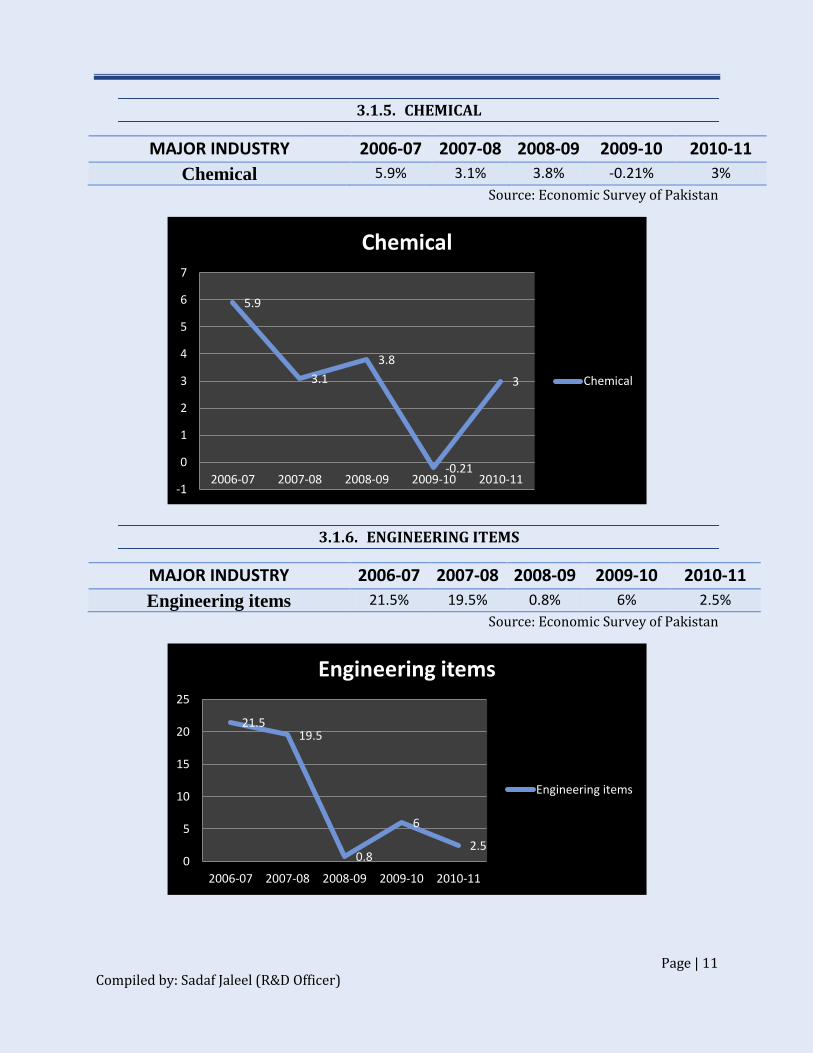
3.1.5. CHEMICAL
MAJOR INDUSTRY 2006-07 2007-08 2008-09 2009-10 2010-11
Chemical 5.9% 3.1% 3.8% -0.21% 3%
Source: Economic Survey of Pakistan
3.1.6. ENGINEERING ITEMS
MAJOR INDUSTRY 2006-07 2007-08 2008-09 2009-10 2010-11
Engineering items 21.5% 19.5% 0.8% 6% 2.5%
Source: Economic Survey of Pakistan
5.9
3.1
3.8
-0.21
3
-1
0
1
2
3
4
5
6
7
2006-07 2007-08 2008-09 2009-10 2010-11
Chemical
Chemical
21.5 19.5
0.8
6
2.5 0
5
10
15
20
25
2006-07 2007-08 2008-09 2009-10 2010-11
Engineering items
Engineering items
Page | 12 Compiled by: Sadaf Jaleel (R&D Officer)
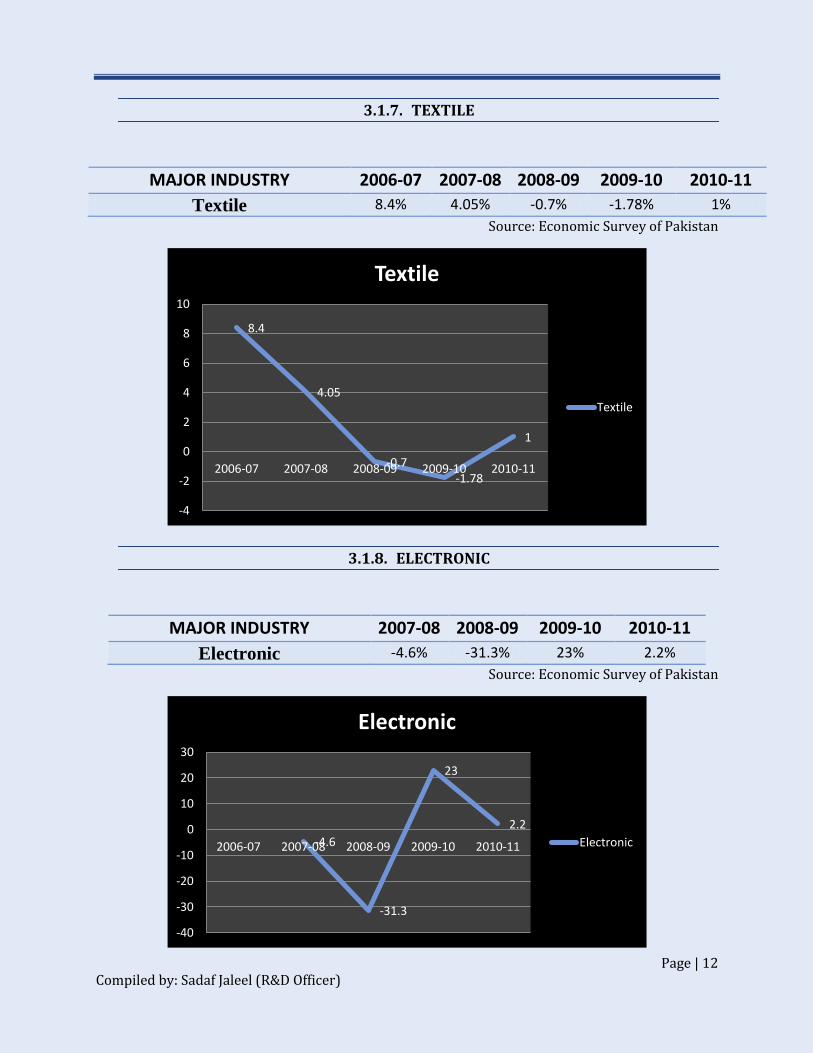
3.1.7. TEXTILE
MAJOR INDUSTRY 2006-07 2007-08 2008-09 2009-10 2010-11
Textile 8.4% 4.05% -0.7% -1.78% 1%
Source: Economic Survey of Pakistan
3.1.8. ELECTRONIC
MAJOR INDUSTRY 2007-08 2008-09 2009-10 2010-11
Electronic -4.6% -31.3% 23% 2.2%
Source: Economic Survey of Pakistan
8.4
4.05
-0.7 -1.78
1
-4
-2
0
2
4
6
8
10
2006-07 2007-08 2008-09 2009-10 2010-11
Textile
Textile
-4.6
-31.3
23
2.2
-40
-30
-20
-10
0
10
20
30
2006-07 2007-08 2008-09 2009-10 2010-11
Electronic
Electronic
Page | 13 Compiled by: Sadaf Jaleel (R&D Officer)
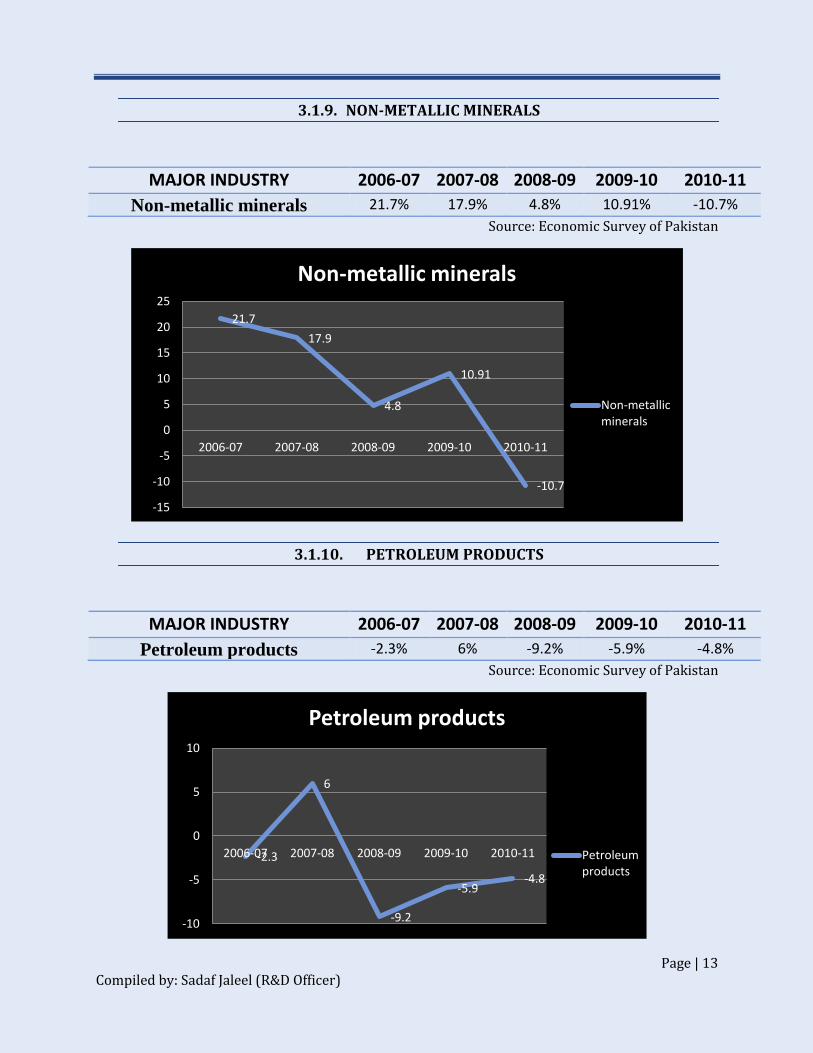
3.1.9. NON-METALLIC MINERALS
MAJOR INDUSTRY 2006-07 2007-08 2008-09 2009-10 2010-11
Non-metallic minerals 21.7% 17.9% 4.8% 10.91% -10.7%
Source: Economic Survey of Pakistan
3.1.10. PETROLEUM PRODUCTS
MAJOR INDUSTRY 2006-07 2007-08 2008-09 2009-10 2010-11
Petroleum products -2.3% 6% -9.2% -5.9% -4.8%
Source: Economic Survey of Pakistan
21.7
17.9
4.8
10.91
-10.7
-15
-10
-5
0
5
10
15
20
25
2006-07 2007-08 2008-09 2009-10 2010-11
Non-metallic minerals
Non-metallic minerals
-2.3
6
-9.2
-5.9 -4.8
-10
-5
0
5
10
2006-07 2007-08 2008-09 2009-10 2010-11
Petroleum products
Petroleum products
Page | 14 Compiled by: Sadaf Jaleel (R&D Officer)
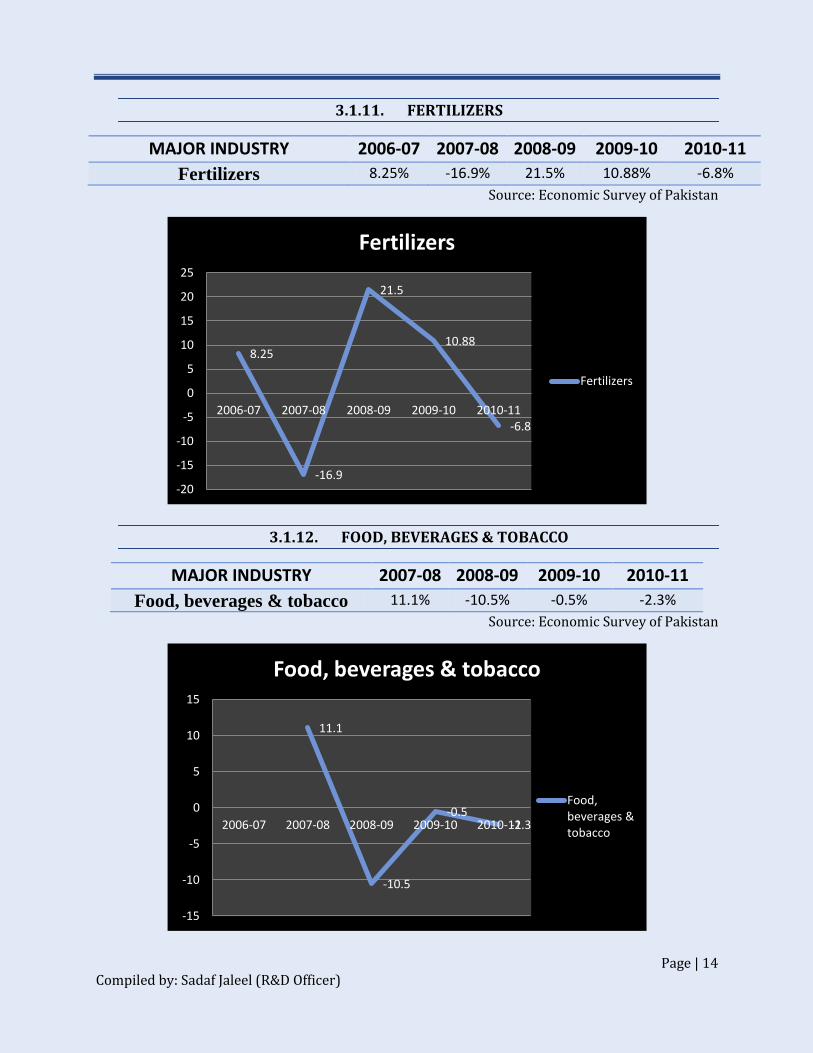
3.1.11. FERTILIZERS
MAJOR INDUSTRY 2006-07 2007-08 2008-09 2009-10 2010-11
Fertilizers 8.25% -16.9% 21.5% 10.88% -6.8%
Source: Economic Survey of Pakistan
3.1.12. FOOD, BEVERAGES & TOBACCO
MAJOR INDUSTRY 2007-08 2008-09 2009-10 2010-11
Food, beverages & tobacco 11.1% -10.5% -0.5% -2.3%
Source: Economic Survey of Pakistan
8.25
-16.9
21.5
10.88
-6.8
-20
-15
-10
-5
0
5
10
15
20
25
2006-07 2007-08 2008-09 2009-10 2010-11
Fertilizers
Fertilizers
11.1
-10.5
-0.5 -2.3
-15
-10
-5
0
5
10
15
2006-07 2007-08 2008-09 2009-10 2010-11
Food, beverages & tobacco
Food, beverages & tobacco
Page | 15 Compiled by: Sadaf Jaleel (R&D Officer)
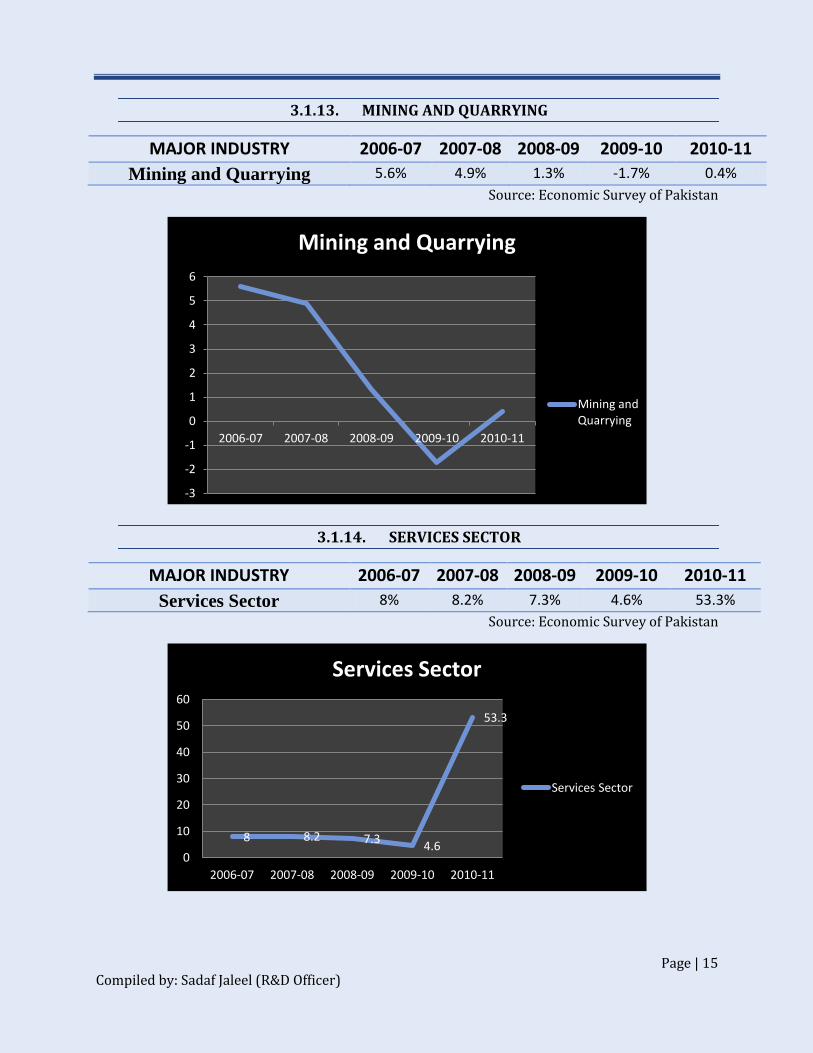
3.1.13. MINING AND QUARRYING
MAJOR INDUSTRY 2006-07 2007-08 2008-09 2009-10 2010-11
Mining and Quarrying 5.6% 4.9% 1.3% -1.7% 0.4%
Source: Economic Survey of Pakistan
3.1.14. SERVICES SECTOR
MAJOR INDUSTRY 2006-07 2007-08 2008-09 2009-10 2010-11
Services Sector 8% 8.2% 7.3% 4.6% 53.3%
Source: Economic Survey of Pakistan
-3
-2
-1
0
1
2
3
4
5
6
2006-07 2007-08 2008-09 2009-10 2010-11
Mining and Quarrying
Mining and Quarrying
8 8.2 7.3 4.6
53.3
0
10
20
30
40
50
60
2006-07 2007-08 2008-09 2009-10 2010-11
Services Sector
Services Sector
Page | 16 Compiled by: Sadaf Jaleel (R&D Officer)
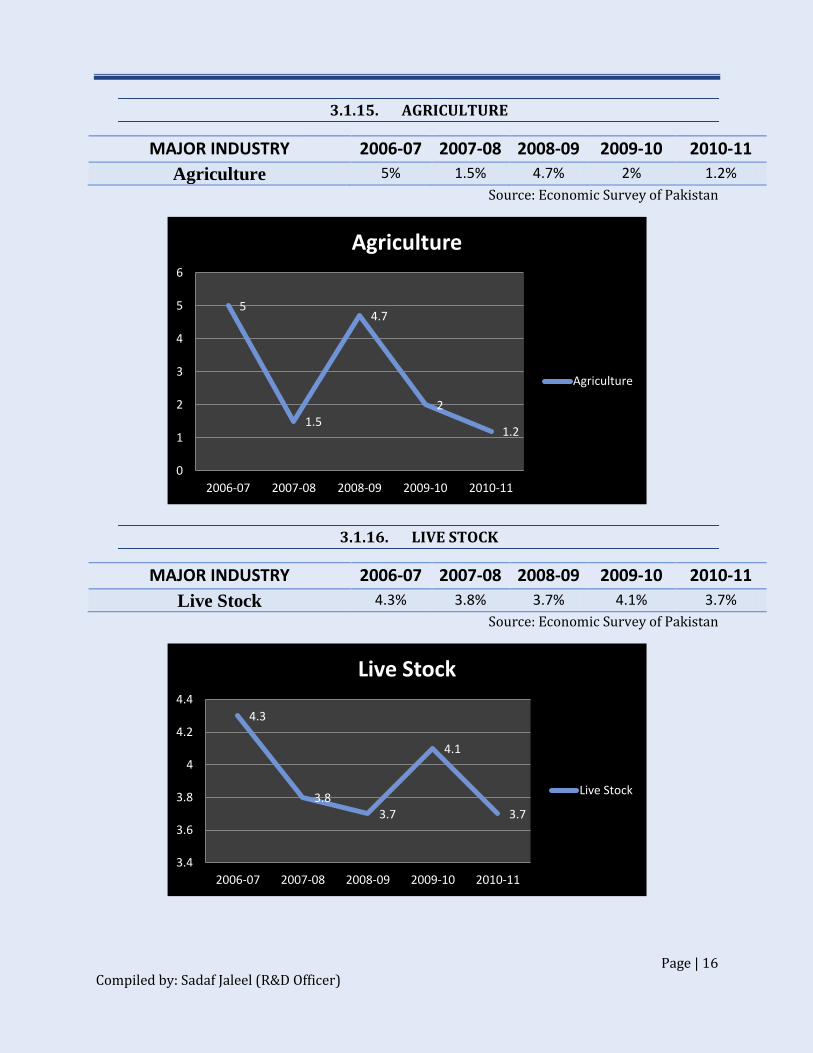
3.1.15. AGRICULTURE
MAJOR INDUSTRY 2006-07 2007-08 2008-09 2009-10 2010-11
Agriculture 5% 1.5% 4.7% 2% 1.2%
Source: Economic Survey of Pakistan
3.1.16. LIVE STOCK
MAJOR INDUSTRY 2006-07 2007-08 2008-09 2009-10 2010-11
Live Stock 4.3% 3.8% 3.7% 4.1% 3.7%
Source: Economic Survey of Pakistan
5
1.5
4.7
2
1.2
0
1
2
3
4
5
6
2006-07 2007-08 2008-09 2009-10 2010-11
Agriculture
Agriculture
4.3
3.8 3.7
4.1
3.7
3.4
3.6
3.8
4
4.2
4.4
2006-07 2007-08 2008-09 2009-10 2010-11
Live Stock
Live Stock
Page | 17 Compiled by: Sadaf Jaleel (R&D Officer)
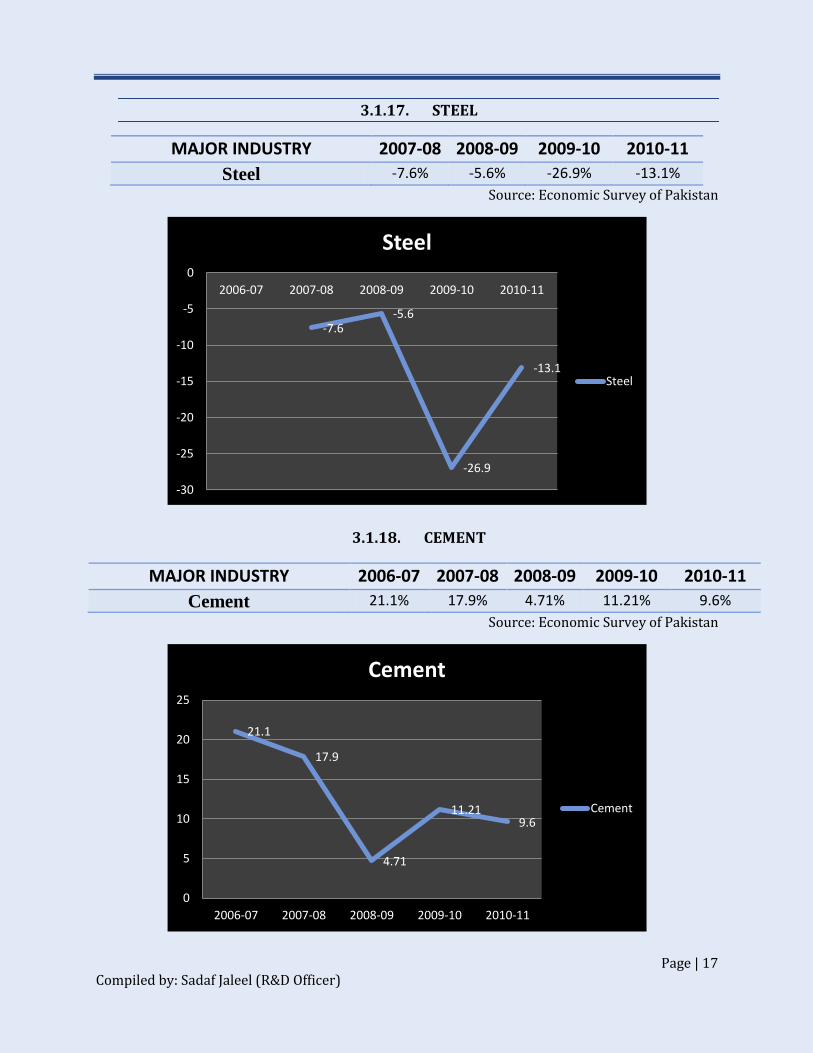
3.1.17. STEEL
MAJOR INDUSTRY 2007-08 2008-09 2009-10 2010-11
Steel -7.6% -5.6% -26.9% -13.1%
Source: Economic Survey of Pakistan
3.1.18. CEMENT
MAJOR INDUSTRY 2006-07 2007-08 2008-09 2009-10 2010-11
Cement 21.1% 17.9% 4.71% 11.21% 9.6%
Source: Economic Survey of Pakistan
-7.6 -5.6
-26.9
-13.1
-30
-25
-20
-15
-10
-5
0
2006-07 2007-08 2008-09 2009-10 2010-11
Steel
Steel
21.1
17.9
4.71
11.21 9.6
0
5
10
15
20
25
2006-07 2007-08 2008-09 2009-10 2010-11
Cement
Cement
Page | 18 Compiled by: Sadaf Jaleel (R&D Officer)
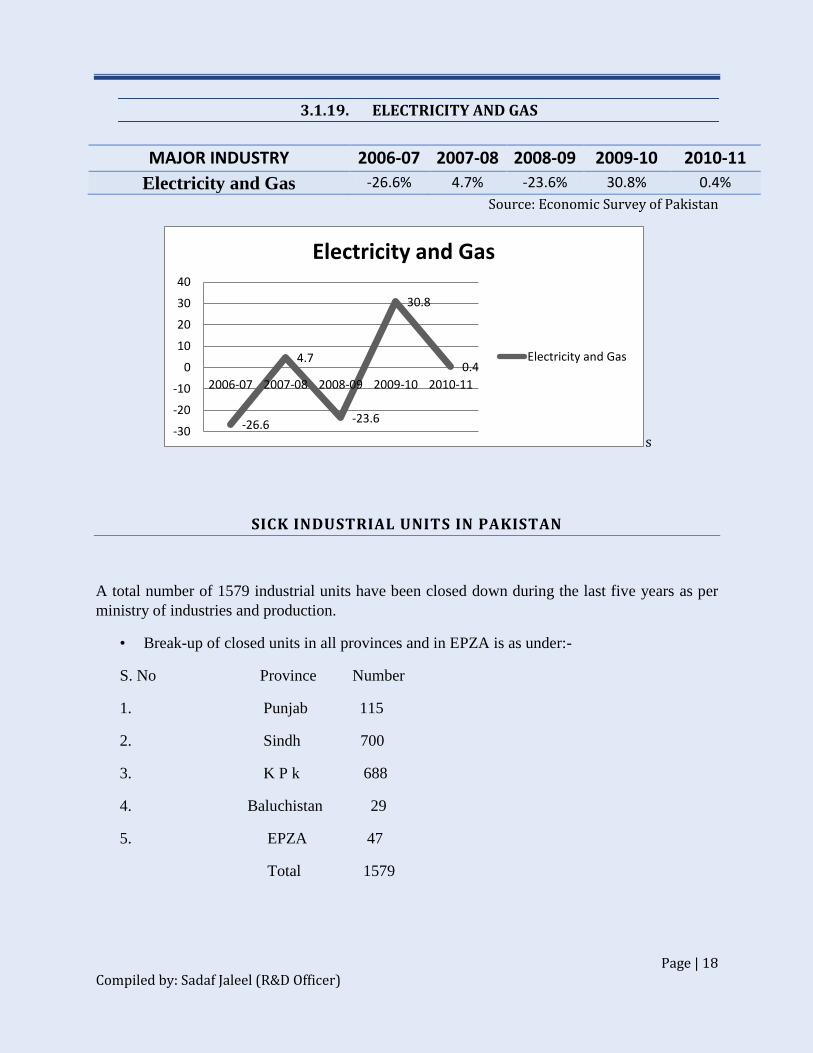
3.1.19. ELECTRICITY AND GAS
Source: Economic Survey of Pakistan
s
SICK INDUSTRIAL UNITS IN PAKISTAN
A total number of 1579 industrial units have been closed down during the last five years as per
ministry of industries and production.
• Break-up of closed units in all provinces and in EPZA is as under:-
S. No Province Number
1. Punjab 115
2. Sindh 700
3. K P k 688
4. Baluchistan 29
5. EPZA 47
Total 1579
-26.6
4.7
-23.6
30.8
0.4
-30
-20
-10
0
10
20
30
40
2006-07 2007-08 2008-09 2009-10 2010-11
Electricity and Gas
Electricity and Gas
MAJOR INDUSTRY 2006-07 2007-08 2008-09 2009-10 2010-11
Electricity and Gas -26.6% 4.7% -23.6% 30.8% 0.4%
Page | 19 Compiled by: Sadaf Jaleel (R&D Officer)
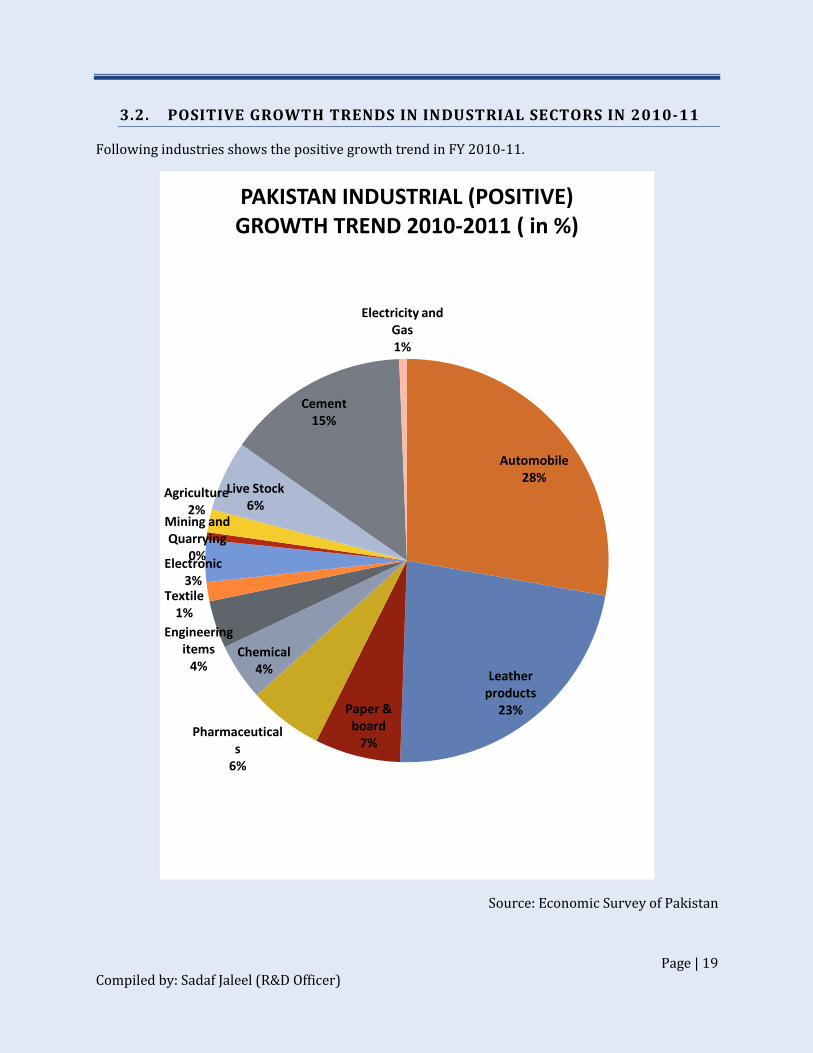
3.2. POSITIVE GROWTH TRENDS IN INDUSTRIAL SECTORS IN 2010-11
Following industries shows the positive growth trend in FY 2010-11.
Source: Economic Survey of Pakistan
Automobile 28%
Leather products
23% Paper & board
7% Pharmaceutical
s 6%
Chemical 4%
Engineering items
4%
Textile 1%
Electronic 3%
Mining and Quarrying
0%
Agriculture 2%
Live Stock 6%
Cement 15%
Electricity and Gas 1%
PAKISTAN INDUSTRIAL (POSITIVE) GROWTH TREND 2010-2011 ( in %)
Page | 20 Compiled by: Sadaf Jaleel (R&D Officer)
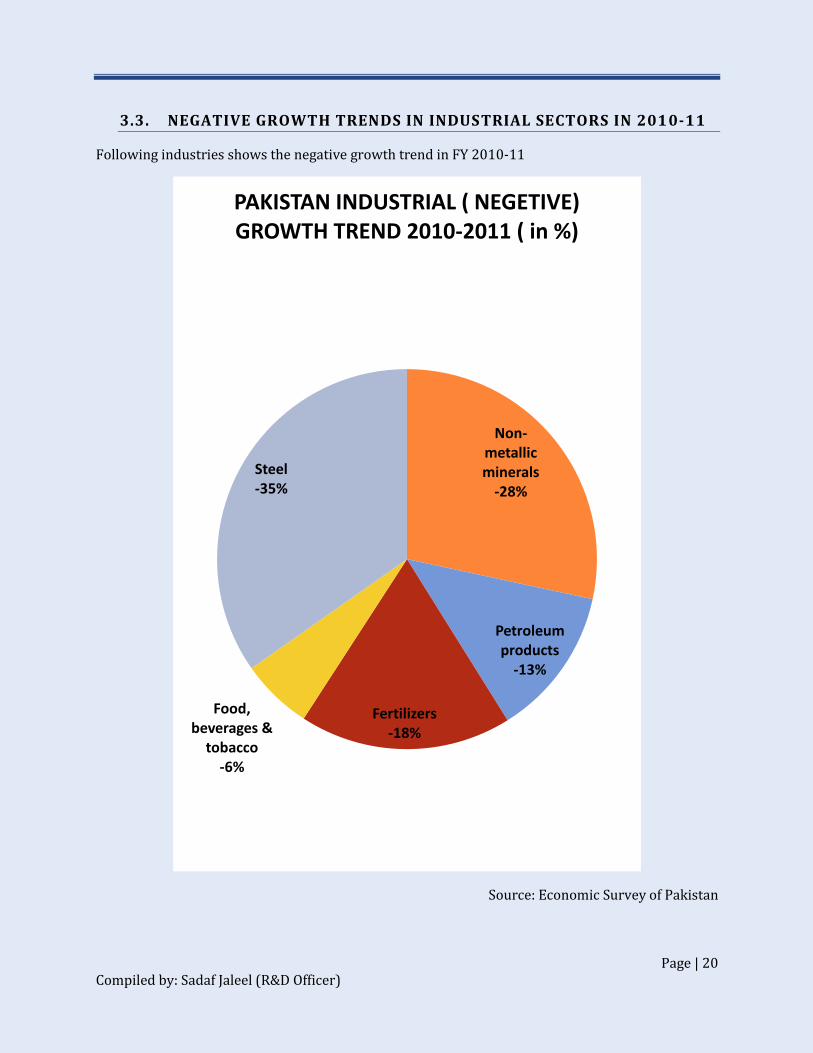
3.3. NEGATIVE GROWTH TRENDS IN INDUSTRIAL SECTORS IN 2010-11
Following industries shows the negative growth trend in FY 2010-11
Source: Economic Survey of Pakistan
Non-metallic minerals
-28%
Petroleum products
-13%
Fertilizers -18%
Food, beverages &
tobacco -6%
Steel -35%
PAKISTAN INDUSTRIAL ( NEGETIVE) GROWTH TREND 2010-2011 ( in %)
Page | 21 Compiled by: Sadaf Jaleel (R&D Officer)
3.5. CAUSES OF INDUSTRIAL BACKWARDNESS IN PAKISTAN
The causes of industrial backwardness in Pakistan are varied and complex. The Government of
Pakistan since 1947 is trying to develop industries and infrastructure facilities for the growth of
industrial sector, yet it has not achieved success to the desired extent. In the last over three
decades the main obstacles which have slowed and retarded industrial development in Pakistan
are as follows:
POLITICAL INSTABILITY
The first and the foremost cause of the backwardness of the industry has been the political
instability which has led to instability of policies. Each successive government unveils its own
policies and disposes of all policies of previous government after it takes over. In the wake of
such negligence from government’s part, the industrial sector is suffering a great setback.
LACK OF CAPITAL
Furthermore the lack of capital is a major hurdle in attaining self-sufficiency in industrial sector.
Every industry requires a large sum of capital to keep its wheel moving. But due to the lack of
capital and loan facilities the progress of industry is lingering.
LIMITED MARKET
Limited market is also the major cause of industrial decline. Pakistan manufacturing sector have
high costs, low labor productivity and inefficient production processes. There is a threat by the
Chinese and Indian manufacturers to gain most of the market share. Owing to government’s
indifference, our domestic markets have not expanded to an extent to accommodate the home-
made goods.
PEOPLES’ LIKING TO FOREIGN GOODS
Moreover our peoples’ liking to foreign goods is also giving a severe blow to our industry.
UNDER UTILIZATION OF LABORS’ POTENTIAL
The proper utilization of the capabilities of the labor plays a very vital role in the progress of the
industry. By fully utilizing labor capabilities the production can be improved and increased. But
unfortunately, under utilization of labors’ potential on right place is causing a great loss and
industry is lagging behind to compete with the world.
Page | 22 Compiled by: Sadaf Jaleel (R&D Officer)
COMMUNICATION AND TRANSPORTATION
Communication plays a very important and vital role in industry’s progress. If communication is
in disorder, industry fails to survive. Due to lack of transportation and absence of basic
infrastructure like roads, water supply, sanitation and proper disposal of waste water and solid
wastes, our industry is lagging behind. Lack of basic infrastructure along with the expensiveness
of means of transportation and communication is also contributing to industrial failure.
TECHNICAL KNOW HOW
The significance of technical knowledge to industry cannot be negated. Industrial progress is
dissatisfied in the absence of workers equipped with technological knowledge. The scarcity of
such technically experienced labor force makes the journey towards industrialization
challenging.
ENERGY CRISIS
Energy crisis is further a bolt from blue for our industry. Our country is starving in electricity, oil
and gas which are the most essential requirements to run industry. In spite of having vast
resources of gas, oil, coal etc. our country is unable to provide uninterrupted supply of fuel to
industry which is creating havoc to this sector.
ECONOMIC RESTRICTIONS
Economic restrictions imposed by donor countries and lack of effective exploitation of the World
Market are also contributing to our industry’s failure.
LACK MODERN TECHNOLOGY
To a large extent, all segments of the textile sector from cotton cultivation to manufacturing of
garments lack modern technology.
APTMA has highlighted that the Pakistan textile industry faces tough competition from the
Indian, Bangladeshi and Chinese textile industries through modern equipment and machinery.
The inability to timely modernize the equipment and machinery has led to the decline of
Pakistani textile competitiveness.
NEW COMPETITORS
Pakistan is facing new competitors (Bangladesh, Vietnam and Turkey) in industrial sector.
Though we cannot avoid competition but we can always stay ahead of them by reforming our
strategies and educating our entrepreneurs so as to move one step forward in every aspect.
Page | 23 Compiled by: Sadaf Jaleel (R&D Officer)
LOW FOREIGN INVESTMENT
Low foreign and local investment is a matter of concern. Due to terrorism and security concerns
in Pakistan the foreign investors are reluctant to invest in industries so that net foreign
investment in Pakistani industries is only 0.5% of GDP.
Not only local businessmen but also foreign investors are not ready to set up new industries and
make investments. They are reluctant to invest their time and money in the country which is
lacking in basic infrastructure and where law and order situation is deteriorating day by day. All
these things are acting as repellent for industrialists and in turn industrial development.
GRANTING MFN STATUS TO INDIA
Granting MFN status to India will negatively affect the domestic industry of Pakistan as the
industry will have to face tough competition in the terms of price and quality. The imported
finished products from India will be available at lesser price as compared to our domestically
produced items. The major reason is our high cost of production which includes cost of energy,
raw material, cost of capital and high wage rate as a result of inflation. However the better
option can be the import raw material, modern technology and equipment for lowering the cost
and quality of our own products and thus increasing the exports and becoming competitive in the
local market as well.
HIGH INTEREST RATE
Bangladesh, India and China enjoy comparatively low interest rates than Pakistan. The interest
rates in 2011 are as following, 8.5 to 9.0 per cent in Bangladesh, 5.25 per cent in India (market
rate is 10.25 per cent, however exemption of 5 percent is provided to the textile industry) and
5.58 per cent in China. Meanwhile, in Pakistan, the interest rate is 13.25 percent. The high
interest rates increase the cost of capital that is a discouraging factor for the business man and
future entrepreneurs. This also de motivate the foreign direct investment.
Page | 24 Compiled by: Sadaf Jaleel (R&D Officer)
RECOMMENDATIONS
Here are some suggestions to stabilize the industrial sector:
Government must unveil a solid industrial policy keeping in view the global
requirements.
In order to increase the share of the industrial sector in the GDP there is dire need to
establish new industrial estate in the country
To enhance the contribution of existing industrial estates in the economy they should be
facilitated by the government policies.
Industrialists be given loans on easy installments, so as they could run industries
smoothly.
New markets for the local products are explored and the quality of local products be
improved to increase the demand abroad.
A coherent plan should be devised by the Pakistani government that allows some sort of
exemption/concession such as in India; the Export-Import Bank was set up for the
purpose of financing and facilitating the industries, especially textile.
New technical universities and institutions be established for the guidance of the labor
and equip them with the modern techniques being used in the industry.
Means of communication and basic infrastructure required for industry like roads,
transportation etc. should improved and enhanced to make the access easy.
New and emerging entrepreneurs must be encouraged to lead the industrial sector and
make investments.
The crisis of energy must be resolved on priority basis and interrupted supply of energy
to industry be ensured.
Law and order situation be improved to allure the investors to invest their money and
time.
More attentions should be given to increase export.
Import substitution products are produced to encourage people to use local products.
Realistic and up-to-date statistics is provided to this sector.