indoor air quality and thermal comfort in naturally...
TRANSCRIPT
5
Indoor Air Quality and Thermal Comfort in Naturally Ventilated
Low-Energy Residential Houses
M. Krzaczek and J. Tejchman Gdańsk University of Technology,
Faculty of Civil and Environmental Engineering, Gdańsk, Poland
1. Introduction
The indoor environmental quality (IEQ) and occupant comfort are closely related. The current indoor environmental assessment includes four aspects, namely thermal comfort (TC), indoor air quality (IAQ), visual comfort (VC) and aural comfort (AC). IAQ, as the nature of air in an indoor environment with relation to the occupant health and comfort is not an easily defined concept. In a broad context, it is the result of complex interactions between building, building systems and people. Comparative risk studies performed by the United States Environmental Protection Agency (USEPA) ranked IAQ as one of the 5 top environmental risks to the public health. Over the past decades, exposure to indoor air pollutants increased due to a variety of factors including: construction of tightly sealed buildings, reduction of ventilation rates (for energy saving) and use of synthetic building materials and furnishings as well as chemically formulated personal care products, pesticides and household cleaners. The effect of chemical pollutants on the perceived IAQ was investigated in several studies. The volatile organic compounds (VOCs) were suspected to cause ‘‘sick-building’’ symptoms, like headache, eye and mucous membrane irritation, fatigue and asthmatic symptoms (Redlich et al. 1997). The WHO air quality guidelines exist for major ambient air pollutants such as nitrogen dioxide and ozone, a few organic pollutants including mainly chlorinated and aromatic hydrocarbons (World Health Organization, 2000). The International Agency of Cancer Research recently upgraded formaldehyde to the group 1, known human carcinogen (IARC, 2004). However, there are still inadequate data about health effects of other VOCs. The total amount of VOCs and TVOC was not proven to correlate with symptoms. Investigations of all types of indoor air pollutants for the general air quality monitoring and assessment are complicated. In many studies, it was suggested that the measurement and analysis of the indoor carbon dioxide (CO2) concentration could be useful for understanding the Indoor Air Quality (IAQ) and ventilation effectiveness. Healthy people can tolerate the CO2 level up to 10,000 ppm without serious health effects. An acceptable indoor CO2 level should be kept below 1000 ppm or 650 ppm above the ambient level in order to prevent any accumulation of associated human body odors. The indoor carbon dioxide is relatively easy to measure and its low level in the indoor air usually corresponds to a low level of VOCs.
www.intechopen.com
Air Quality – Monitoring and Modeling 80
The chapter focuses on the concentration of CO2 in the indoor air. The term comfort is not commonly used in relation to the indoor air quality and it is mainly linked with the lack of the discomfort due to odor and sensory irritations. The acceptable air quality is defined as “air in which there are not known contaminants at harmful concentrations as determined by cognizant authorities and with which, a substantial majority (80% or more) of people do not express a dissatisfaction”. Consequently most standards including requirements for the indoor air quality define conditions by providing the minimum percentage of persons who are dissatisfied with the air quality. They are mainly based on the discomfort and annoyance caused for visitors in indoor spaces. Recently, some standards also deal with requirements for occupants.
A problem of the thermal and indoor air quality rises in low-energy buildings. The low-
energy buildings are tight and impermeable. A relative contribution of the heat
consumption due to the ventilation in the total heat consumption in low-energy buildings is
very high. Thus, the ventilation system significantly affects the thermal comfort and indoor
air quality in low-energy buildings. However, the mechanical ventilation and air-
conditioning of buildings are responsible for a lot of the non-renewable fossil-based energy
consumption in the world. Therefore, the natural ventilation can be used as a cheap air-
exchange system for buildings. The natural ventilation effectiveness depends on many
factors such as: size and location of openings (Hummelgaard et al. 2007, Stavrakakis et al.
2010), location of inlet gaps, ambient climate conditions, etc. During the natural ventilation,
the air exchange is caused by temperature gradients, but can be enforced by fans located in
the exhaust duct inlets (outlets of the indoor zone). The air quality and thermal comfort in
buildings equipped with the natural ventilation depend strongly on air flow patterns which
are influenced by a type of the space heating system.
In the chapter, the indoor air quality and thermal comfort in the naturally ventilated low-energy buildings are discussed. The investigations are limited to residential houses equipped with the natural ventilation system with and without exhaust ventilators only. Two locations of the fresh air inlets are considered: above and below the window. The CFD simulations were carried out for two heating systems: a radiator heating system and a floor heating system. The results of numerical investigations are compared with the corresponding experimental measurements.
2. Low-energy buildings
The term ‘low-energy building’ is not well defined. The definition is different in several countries and in national and international standards and regulations. However, modern residential buildings can be characterized by the following features with respect to ventilation systems (Meyer 1993, Reinmuth 1994):
a. relative contribution of the heat consumption due to ventilation in the total heat consumption can be even higher than 50% (thus, the influence of the mechanical ventilation on the heat consumption is very high),
b. buildings are tight and impermeable; however, they must be ventilated due to the minimum air exchange rate related to hygienic requirements in order to reach the appropriate air quality in rooms and good comfort perception of residents; thus, the type of ventilation system has a great meaning for a comfort perception,
www.intechopen.com

Indoor Air Quality and Thermal Comfort in Naturally Ventilated Low-Energy Residential Houses 81
c. buildings with a low heat consumption consume heat by 1/3 less than conventional houses,
d. buildings equipped with ventilation systems do not reach a theoretically calculated level of the heat consumption,
e. consumption of the electric energy by ventilators and water pumps increases the consumption of the electric energy in buildings up to 50%,
f. when installing a ventilation system, the demand for the ventilation heat per year can be reduced by 5%, and in the case of heat exchangers even by 20%.
Low-energy houses that use very small amounts of energy for heating purposes do not need any conventional heating system. If windows have low transmission losses, the risk of drafts is minimized and the heating appliances (i.e. radiators) are redundant (Karlsson & Moshfegh 2006). When a house can be designed to require less than 10 W/m2 of the heating capacity to maintain 20°C by −10 °C ambient conditions, a conventional heating system (i.e. a gas fired furnace, circulation pipes and radiators) can be omitted and the total energy consumption drops to a small fraction of normal levels. The result is a drastic reduction in both operating costs and environmental impacts. Hastings (2004) studied five building projects as example of successful solutions. He reported that the estimated space heating demand varied from 12.6 kWh/(m2 a) up to 22.4 kWh/(m2 a), while the thickness of the insulation layers varied between 30-50 cm. In apartment projects, the ventilation system typically ran 24 h/day and 365 days/year. He concluded that high performance housing depended on keeping the heat in. To achieve the required U-values, the walls had to be too thick. The superior glazing (U=0.5 W/m2 K) together with highly insulating frame constructions are already on the market today, but they are still too expensive and are one of several reasons for a lager cost of the high performance housing. The ventilation is ambiguously related to the energy saving rationale originating from the global warming problem and non-renewable energy sources saving. Since it makes up for about half of the energy consumption in well-insulated buildings, it is an attractive target for energy saving measures.
However, simply reducing ventilation rates has unwanted repercussions on the indoor air quality. Advances in several disciplines of the knowledge such as the growing understanding of the global warming (IPCC, 2007) and its effects on our environment, the increasing evidence of the limited nature of our major energy supply and large costs, both economical and human, of the air pollution related illnesses are dramatically altering the goals of innovations in the building technology. The focus is shifted towards low-energy, ‘green’ or sustainable buildings, seeking concepts that allow to maintain or even further increase the comfort level that we are accustomed to, while significantly to reduce the associated energy used in every aspect of the human life. Consequently, this field represents a massive gross energy saving potential. Simply reducing ventilation rates, however, deteriorate the indoor air quality and therefore cause unwanted effects such as an increase in the incidence of the respiratory illness and loss of productivity. The purpose of each ventilation system is to provide an acceptable micro-climate (in this context, the micro-climate refers to the thermal environment and air quality). The process to create an acceptable interior micro-climate can be conducted basically by two sides: ventilation to achieve a good air quality and heating or cooling inside air to have a thermal comfort. It is relatively easy to control mechanical ventilation systems to maintain the best air exchange rate (Wong |& Huang 2004, Ho et al. 2011, Paul et al. 2010, Laverge et al. 2011). However, the mechanical ventilation and air-conditioning of buildings are responsible for a lot of non-
www.intechopen.com

Air Quality – Monitoring and Modeling 82
renewable fossil-based energy consumptions in the world. Therefore, the natural ventilation can be used as a cheap air-exchange system for buildings.
The comfort and health factors are the major elements for designing proper indoor environments. However, they often act opposite to each other (Behne 1999). This opposing behavior of design elements is often not taken into account. In contrast, modern designers make an imaginative use of glass and space to create well-lit and attractive interiors. These buildings are perfectly isolated from outdoors, and often create unusual conditions leading to a violation of traditional ‘‘rules of thumb’’ for the thermal comfort and hygiene (Hastings 2004). Poorly designed naturally ventilated buildings are uncomfortable to live and work in and lead to a reduced quality of the life and loss of productivity. The natural ventilation is an energy-efficient alternative for reducing the energy use in buildings and, with a proper design, it is able to create the thermal comfort and healthy indoor conditions. Typically, the energy cost of naturally ventilated building is 40% less than that of air-conditioned buildings (Energy Consumption Guide 1993)
3. Reference measurements
3.1 Reference buildings
To investigate the indoor air quality and thermal comfort in the naturally ventilated low-energy buildings, the colony of identical residential houses located in Germany by Leipzig was chosen for experiments to obtain reliable experimental results (Maier et al. 2009) and to compare them to the results of our CFD simulations. From the total number of 149 houses, 22 houses standing in one row were chosen for measurements (Fig.1). They were situated in the central part of the entire complex. The residential area of the medium size house was 114 m2, where 102 m2 was the heating area (the ratio of the area to the volume was A/V=0.54). Each measured object had two external walls exposed to the air influence. The residential rooms with a large window area were oriented towards the south. The transmission heat coefficient U was 0.35 W/(m2 K) (ground floor), 0.22 W/(m2 K) (external walls), 1.30 W/(m2 K) (windows) and 0.22 W/(m2 K) (roof). The theoretical heat demand per year in the houses was 36.8 kWh/(m2 a). For further investigations, only two residential houses were considered:
a. equipped with natural gravitational ventilation (Fig.2), b. equipped with natural ventilation enforced by single exhaust ventilators (Fig.3).
Fig. 1. The reference house for experiments (Maier et al. 2009)
www.intechopen.com

Indoor Air Quality and Thermal Comfort in Naturally Ventilated Low-Energy Residential Houses 83
Fig. 2. Natural ventilation without mechanical exhaust ventilators (Maier et al. 2009)
Fig. 3. Natural ventilation with mechanical exhaust ventilators (Maier et al. 2009)
www.intechopen.com

Air Quality – Monitoring and Modeling 84
In the case of the natural ventilation with exhaust ventilators, the area of the air supply included children rooms, living rooms and bedrooms. However, a bathroom, toilet and rooms with the internal building installation were associated to the area of the air outlet. The single air ventilators were used, and each of them operated separately. The output of the stream in the mode of the basic ventilation was around 0.32 Wh/m3. The value of 0.25 Wh/m3 for the ventilation output friendly for users was unfortunately exceeded. The following parameters were monitored in houses by sensors: air humidity, air quality (expressed by the emission of both CO2 and malodors), temperature, electricity consumption, gas consumption, heat consumption, working time of the window ventilation (windows totally and slightly open), working time of the mechanical ventilation and number of residents. The low-temperature radiation was not measured due to high costs of transducers. In addition, sun radiation, wind power, wind direction, air humidity, air quality and the air temperature were registered outside houses. Figure 4 shows the location of measuring sensors in residential houses.
3.2 Weather conditions
The weather conditions during both heating periods were similar (Maier et al. 2009). The
time interval between consecutive measurements was 1 hour. According to the occurrence
frequency concept (Stavrakakis et al. 2010), the prevailing climatic data were determined as
recorded-range weighted averages for the time period between 8:00 and 18:00, i.e. the
weights used were the occurrence frequencies of the weather data ranges. Consequently, the
mean values of temperature, total solar radiation and wind speed were 4.0 °C, 20.0 W/m2
and 1.6 m/s respectively. Referring to the associated wind direction, south-west (SW) wind
directions were dominant, as they corresponded to the occurrence frequency of
approximately 39%.
3.3 Experimental results
The experimental results covered a long time period of 2 years. The weather conditions
during both heating periods were similar. Thus, the relationships were established only
between the mean values for the sake of readability (maximum and minimum values were
not shown). To establish relationships between experimental results, a linear regression
method was used. All ventilation systems showed the lower heat consumption than the
theoretically calculated one. The average year heat consumption for all systems (22 houses)
was 3063 kWh: for the gravitational ventilation 3168 kWh and natural ventilation with
exhaust ventilators 3586 kWh. Any relation between the ventilation time and the parameters
of the indoor climate was not found. The average concentration of CO2 for each system was:
for the gravitational ventilation 1266 ppm and for the natural ventilation with exhaust
ventilators 647 ppm. The house with a gravitational ventilation system had the worst air
quality, but it had also the highest number of residents (5 persons) what was the second
reason for a poor air quality. However, the air quality in all houses was in a permissible
comfort range (<1500 ppm) (ISO 2008). In the case of the relative air humidity and air
quality (Fig.5), the number of residents realistically depicted a distribution of their values.
A strong relationship between the concentration of CO2 per resident and opening time of windows is visible in Fig.6 (including 22 houses with different ventilation systems).
www.intechopen.com

Indoor Air Quality and Thermal Comfort in Naturally Ventilated Low-Energy Residential Houses 85
Fig. 4. Location of measuring sensors in residential houses (Maier et al. 2009)
Fig. 5. The relationship between number of residents and air quality (Maier et al. 2009)
www.intechopen.com

Air Quality – Monitoring and Modeling 86
Fig. 6. Results of experimental measurements: time of windows opening and CO2 concentration/residents number (Maier et al. 2009)
3.4 Analysis of questionnaire results
After the measurements program was finished, a detailed questionnaire program was
performed (Maier et al. 2009). The results obtained from questionnaires performed in 21
houses equipped with different ventilation systems were compared (Fig.7). In the case of the
natural ventilation with exhaust ventilators, the new designed in-take ventilator elements
did not disappoint expectations. No problems took place in reference to the air draught. The
operational elements were estimated positively. Considering the air quality in rooms and
installation regulation, the residents saw the necessity for introducing several improvements
(however, from the technical point of view it was impossible). Any negative opinion of the
comfort perception or ventilation system was not found. The air quality and comfort
perception obtained the notes “good” and “very good” for all ventilation systems and no
evident differences of the level of the residents’ satisfaction with the ventilation system were
detected. In spite of “good” and “very good” notes in questionnaires, in all cases occupants
adapted the thermal environment to improve their comfort perception by opening operable
windows. It was an unexpected observation because notes in questionnaires were high and
the measured air quality was in the comfort range.
www.intechopen.com

Indoor Air Quality and Thermal Comfort in Naturally Ventilated Low-Energy Residential Houses 87
Fig. 7. Acceptance level of separate ventilation systems in residential houses (on the basis of the questionnaire) (Maier et al. 2009)
4. Physical model of ventilated zone
To investigate the fluid flow patterns and to track CO2 concentration in the indoor air for two inlet gap configurations and two natural ventilation systems, the reference house was considered as one indoor zone which represented the dining and living room (Figs.2 and 3). The indoor zone was modeled together with exhaust ducts and created one fluid flow domain (Fig.8). The exhaust duct was added to the model to make it more realistic, especially in the case of the natural ventilation without fans, induced by the mixture temperature differences.
Fig. 8. Geometry of ventilated zone and fluid domain
www.intechopen.com

Air Quality – Monitoring and Modeling 88
Two different locations of the fresh air inlet are the most common in the engineering practice. Hence, the two inlet gap configurations were considered: above the window (Fig.9a) and below the window (Fig.9b). Two space heating systems, the most common in engineering practice, were considered: radiator space heating system and floor space heating system. The natural ventilation was either induced by air temperature differences or enforced by a fan located in the outlet gap (the exhaust duct inlet). The complete physical model is presented in Fig.10.
a)
b)
Fig. 9. The inlet gap configurations: a) above window, b) below window
5. Mathematical model of ventilated zone
In the ventilated zone (Fig.10), the fluid velocity magnitude can reach 1.6 m/s. It corresponds with the Reynolds number of 21000. Thus, turbulent flow of the compressible fluid is to be considered. Considerations for the governing equations are: steady state, two-dimensional state, Newtonian and compressible fluid flow in turbulent regime. The fluid flow problem is defined by the law of the conservation of mass, momentum and energy. It is assumed that there is only one phase. From the law of mass conservation, the continuity equation is derived:
項喧項建 + 項岫貢懸掴岻項捲 + 項盤貢懸槻匪項検 = ど (1)
www.intechopen.com

Indoor Air Quality and Thermal Comfort in Naturally Ventilated Low-Energy Residential Houses 89
where 懸掴 and 懸槻 are components of the velocity vector in the x and y direction, respectively,
ρ is density (kg/m3) and t is time.
For the Newtonian fluid, the momentum equations including the viscous loss terms Tx and Ty, are as follows:
劇掴 = 項項捲 磐航 項懸掴項捲 卑 + 項項検 峭航 項懸槻項捲 嶌 (2)
劇槻 = 項項捲 磐航 項懸掴項検 卑 + 項項検 峭航 項懸槻項検 嶌. (3)
Fig. 10. The complete physical model of ventilated zone
The complete energy equation is solved in the compressible case with the heat transfer. In terms of the total (or stagnation) temperature, the energy equation is:
項項建 盤貢潔椎劇待匪 + 項項捲 盤貢懸掴潔椎劇待匪 + 項項検 盤貢懸槻潔椎劇待匪= 項項捲 磐膏 項劇待項捲 卑 + 項項検 磐膏 項劇待項検 卑 + 激蝶 + 継賃 + 芸蝶 + Φ+ 項鶏項建 , (4)
where: cp - specific heat [J/(kg K)], To - total (or stagnation) temperature [°C], λ - thermal conductivity [W/(m K)], Wv - viscous work term, Qv - volumetric heat source, Φ - viscous heat generation term and Ek - kinetic energy.
www.intechopen.com
Air Quality – Monitoring and Modeling 90
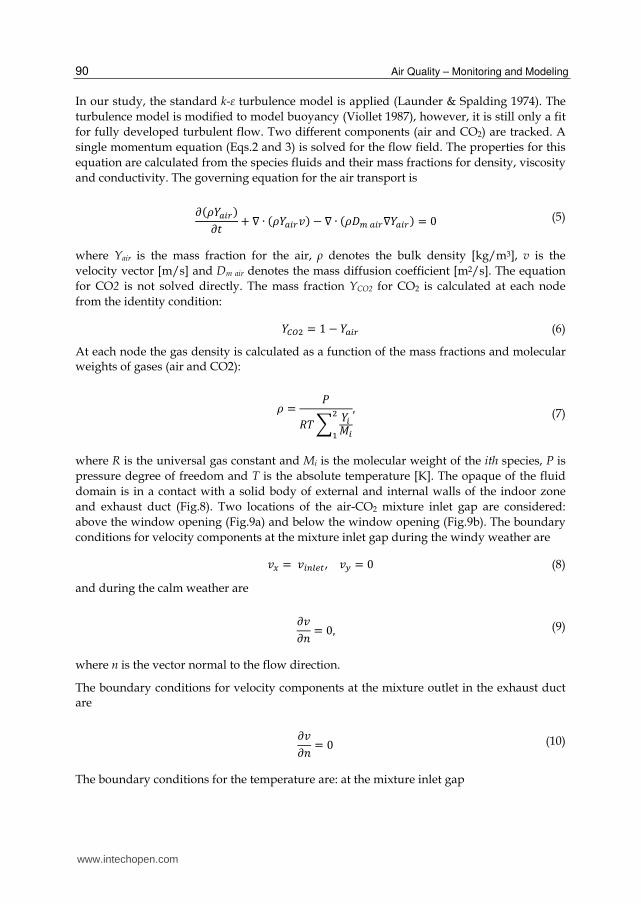
In our study, the standard k-ε turbulence model is applied (Launder & Spalding 1974). The
turbulence model is modified to model buoyancy (Viollet 1987), however, it is still only a fit
for fully developed turbulent flow. Two different components (air and CO2) are tracked. A
single momentum equation (Eqs.2 and 3) is solved for the flow field. The properties for this
equation are calculated from the species fluids and their mass fractions for density, viscosity
and conductivity. The governing equation for the air transport is
項岫貢桁銚沈追岻項建 + ∇ ∙ 岫貢桁銚沈追懸岻 − ∇ ∙ 岫貢経陳 銚沈追∇桁銚沈追岻 = ど (5)
where Yair is the mass fraction for the air, ρ denotes the bulk density [kg/m3], v is the
velocity vector [m/s] and Dm air denotes the mass diffusion coefficient [m2/s]. The equation
for CO2 is not solved directly. The mass fraction YCO2 for CO2 is calculated at each node
from the identity condition:
桁寵潮態 = な − 桁銚沈追 (6)
At each node the gas density is calculated as a function of the mass fractions and molecular weights of gases (air and CO2):
貢 = 鶏迎劇 布 桁沈警沈態怠, (7)
where R is the universal gas constant and Mi is the molecular weight of the ith species, P is
pressure degree of freedom and T is the absolute temperature [K]. The opaque of the fluid
domain is in a contact with a solid body of external and internal walls of the indoor zone
and exhaust duct (Fig.8). Two locations of the air-CO2 mixture inlet gap are considered:
above the window opening (Fig.9a) and below the window opening (Fig.9b). The boundary
conditions for velocity components at the mixture inlet gap during the windy weather are
懸掴 = 懸沈津鎮勅痛, 懸槻 = ど (8)
and during the calm weather are 項懸項券 = ど, (9)
where n is the vector normal to the flow direction.
The boundary conditions for velocity components at the mixture outlet in the exhaust duct are 項懸項券 = ど (10)
The boundary conditions for the temperature are: at the mixture inlet gap
www.intechopen.com
Indoor Air Quality and Thermal Comfort in Naturally Ventilated Low-Energy Residential Houses 91
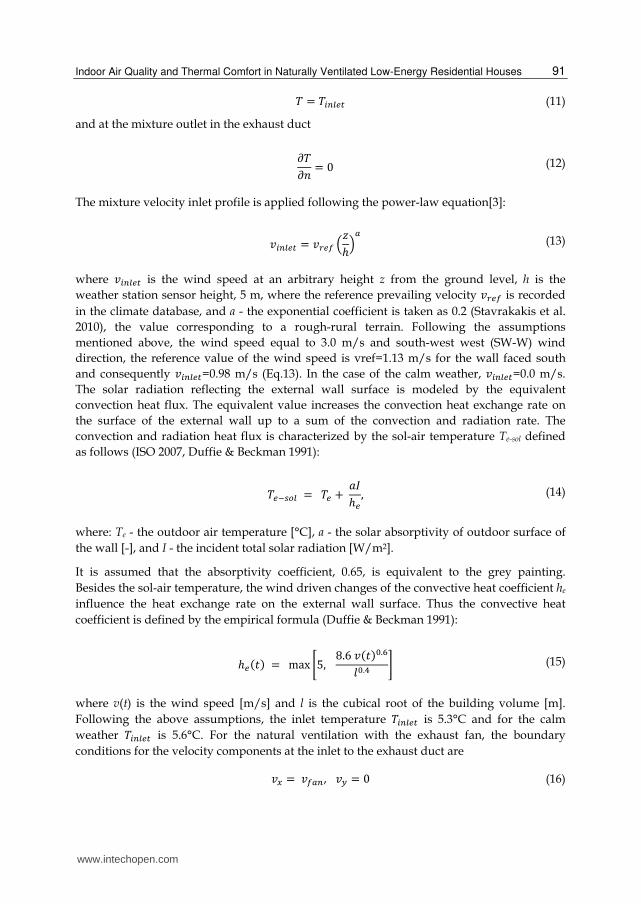
劇 = 劇沈津鎮勅痛 (11)
and at the mixture outlet in the exhaust duct
項劇項券 = ど (12)
The mixture velocity inlet profile is applied following the power-law equation[3]:
懸沈津鎮勅痛 = 懸追勅捗 岾権ℎ峇銚 (13)
where 懸沈津鎮勅痛 is the wind speed at an arbitrary height z from the ground level, h is the
weather station sensor height, 5 m, where the reference prevailing velocity 懸追勅捗 is recorded
in the climate database, and a - the exponential coefficient is taken as 0.2 (Stavrakakis et al.
2010), the value corresponding to a rough-rural terrain. Following the assumptions
mentioned above, the wind speed equal to 3.0 m/s and south-west west (SW-W) wind
direction, the reference value of the wind speed is vref=1.13 m/s for the wall faced south
and consequently 懸沈津鎮勅痛=0.98 m/s (Eq.13). In the case of the calm weather, 懸沈津鎮勅痛=0.0 m/s.
The solar radiation reflecting the external wall surface is modeled by the equivalent
convection heat flux. The equivalent value increases the convection heat exchange rate on
the surface of the external wall up to a sum of the convection and radiation rate. The
convection and radiation heat flux is characterized by the sol-air temperature Te-sol defined
as follows (ISO 2007, Duffie & Beckman 1991):
劇勅貸鎚墜鎮 = 劇勅 + 欠荊ℎ勅 , (14)
where: Te - the outdoor air temperature [°C], a - the solar absorptivity of outdoor surface of
the wall [-], and I - the incident total solar radiation [W/m2].
It is assumed that the absorptivity coefficient, 0.65, is equivalent to the grey painting.
Besides the sol-air temperature, the wind driven changes of the convective heat coefficient he
influence the heat exchange rate on the external wall surface. Thus the convective heat
coefficient is defined by the empirical formula (Duffie & Beckman 1991):
ℎ勅岫建岻 = max 峪の, ぱ.は 懸岫建岻待.滞健待.替 崋 (15)
where v(t) is the wind speed [m/s] and l is the cubical root of the building volume [m].
Following the above assumptions, the inlet temperature 劇沈津鎮勅痛 is 5.3°C and for the calm
weather 劇沈津鎮勅痛 is 5.6°C. For the natural ventilation with the exhaust fan, the boundary
conditions for the velocity components at the inlet to the exhaust duct are
懸掴 = 懸捗銚津, 懸槻 = ど (16)
www.intechopen.com

Air Quality – Monitoring and Modeling 92
and for the temperature are 擢脹擢津 = ど. The ‘x’ component of the velocity at the inlet to the
exhaust duct is computed according to the assumption of the air exchange rate in the
ventilated zone of 0.5 1/h. Hence, 懸捗銚津 is 0.23 m/s. The boundary conditions for the velocity
components on the surfaces in a contact with internal walls, floor, ceiling and the exhaust
duct are
懸掴 = ど and 懸槻 = ど (17)
On the boundary with the external wall and window, the equivalent convection is assumed
(Fig.11):
圏 = ℎ勅勅槌塚岫劇庁沈 − 劇勅岻 (18)
where TFi is the temperature of the internal surface of the wall or window [°C], Te is the ambient air temperature [°C] and he eqv is the equivalent convective heat transfer coefficient [W/(m K)]. The convection heat flux q is characterized by the equivalent convective heat transfer coefficient he eqv. For steady-state heat transfer problems, the convective heat transfer coefficient he eqv is independent of ambient and indoor climate conditions. The conduction heat flux qcond in a steady-state heat transfer for the external wall and window is:
圏頂墜津鳥 = 戟岫劇沈 − 劇勅岻 (19)
and the equivalent convection heat flux qe eqv is
圏勅勅槌塚 = ℎ勅勅槌塚岫劇庁沈 − 劇勅岻, (20)
where U is the coefficient of the heat transmission [W/(m2 K)], Te is the ambient air
temperature [°C] and Ti is the indoor AIR-CO2 mixture temperature [°C].
Fig. 11. The equivalent convection heat flux at boundary with external wall and window
According to the assumption 圏頂墜津鳥 equals to 圏勅勅槌塚, the convective heat transfer coefficient he
eqv is
www.intechopen.com

Indoor Air Quality and Thermal Comfort in Naturally Ventilated Low-Energy Residential Houses 93
ℎ勅勅槌塚 = 腸岫脹日貸脹賑岻岾脹日貸腸岫脹日貸脹賑岻 迭廿賑貸脹賑峇 (21)
where he is the convective heat transfer coefficient (ISO 2007) on the internal surface of the external wall or window. For the above assumptions, the convective heat transfer coefficient he eqv=0.222 W/m2 K and 1.370 W/ m2 K, for the external wall and window, respectively. Opposite to surfaces in a contact with the external wall and window, other surfaces of the fluid domain are considered to be adiabatic. To simplify an analysis of flow patterns in the indoor zone, it is assumed that the only heat source in the indoor zone is a resident. The human body is concentrated in one heat source which is distributed over the edges of the rectangle (0.3 m × 1.6 m). Figure 12 presents the location of the heat source in the fluid domain. Murakami el at. (2000) studied a problem of airflow, thermal radiation and moisture transport for predicting a heat release from a human body. They reported that a heat release from a human body (in a standing position) to the surrounding environment by convection was 29.14 W/m2 and the mean value of the convective heat transfer coefficient was 4.95 W/m2 K. Following the above conclusions and considering the skin surface area of 1.5696 m2 (Murakami et al. 2000), the constant heat flux of 13.26 W/m2 along the human body’s rectangle edges is assumed.
In a composite gas analysis, the species concentration depends strongly on boundary and initial conditions. The boundary conditions are defined by the CO2 concentration over the fluid domain boundaries and the initial conditions are defined by the initial CO2 distribution over the fluid domain. According to the research results of Li et al. (2010), it is assumed that the ambient CO2 concentration is approximately 700 mg/m3 (389 ppm). Consequently, the CO2 concentration at the inlet gap Cinl =389 ppm. The same assumption is taken for initial conditions over the fluid domain. For any other boundaries of the fluid domain, one took: 項系項券 = ど (22)
In the indoor zone model, the main CO2 sources are residents. To track the CO2 concentration, two residents occupying the indoor zone are assumed. The respiration process of human beings was investigated by several researchers (Lawrence & Braun 2007, Hyun & Kleinstreuer 2001). They concluded that the frequency of respiration under light physical work is 17 times per minute with the time-mean rate of 8.4 l/min. Following their conclusions, a steady inhalation process is assumed. Consequently, it is chosen that a
resident exhales CO2 into the indoor zone with a rate 鯨岌 of 0.14×10⁻³ m3/s. According to research results of Yanes et al., the average value of the CO2 concentration in exhaled air by human beings is 55.100 ppm. Hence, the CO2 source is modeled as the source generating the mixture of 55,100 ppm CO2 concentration with the velocity 懸掴 = 懸勅掴朕 and 懸槻 = ど m/s.
6. Numerical input data
The Ansys FLOTRAN software package (2007) is used to solve Eqs.1-5. In numerical simulations, the two fluid domain configurations are considered: the inlet gap located above the window (Fig.13a) and the inlet gap located below the window (Fig.13b). A fine mesh generation requires the mesh to be well suited to the boundary conditions, heat and CO2 sources, etc. Thus, the fluid domain is simulated as a multi-area region and a variable mesh density is applied (Fig.14). To compute the IAQ indices, the average breathing zone is modeled according to the international guideline EN ISO (2007) (Fig.15).
www.intechopen.com

Air Quality – Monitoring and Modeling 94
Fig. 12. Location of heat source and CO2 source in fluid domain
a) b)
Fig. 13. Fluid domain configurations: a) inlet gap located above window, b) inlet gap located below window
7. Thermal comfort and IAQ indices
The comfort indices used in this study are PMV and PD. The calculation procedure is
performed by means of a special post-processing algorithm, which predicts the indices in
each node and element of the FE mesh. The PMV nodal value is computed according to the
algorithm defined by ISO (2005):
PMV沈 = 範ど.ぬどぬ結岫貸待.待戴滞暢岻 + ど.どにぱ飯劇詣 (23)
www.intechopen.com

Indoor Air Quality and Thermal Comfort in Naturally Ventilated Low-Energy Residential Houses 95
where M is the initial standard value of the prescribed activity level and TL is the thermal load on the body. For PMV, the metabolic rate for a standing position and light activity is considered. The local indices values of PMV are averaged within the area of the occupied zone as follows:
PMVavg = ∑ PMV賃 ∙ 畦賃津賃退怠∑ 畦賃津賃退怠 (24)
where PMV賃 is averaged over the k-th element, 畦賃 is the area of the k-th element and n is the number of finite elements. If the floor is too warm or too cool, the occupants feel uncomfortable owing to thermal sensation of their feet.
a) b)
Fig. 14. The FE mesh: a) inlet gap located above window, b) inlet gap located below window
Fig. 15. The breathing zone location in fluid domain
The percentage dissatisfied PD as a function of the floor temperature [%], is computed as follows (ISO 2005):
鶏経 = などど − ひね ∙ exp盤−な.ぬぱば + ど.ななぱ ∙ 劇捗 − ど.どどにの ∙ 劇捗態匪, (25)
www.intechopen.com
Air Quality – Monitoring and Modeling 96
where 劇捗 is the average floor temperature in [°C]. The overall ventilation effectiveness for the temperature distribution 綱痛̅ provides a quantitative index related to the way in which the heat is distributed inside the indoor zone. The higher value of 綱痛̅ the more is the homogeneous temperature distribution. Following the expression by Awbi (2003), the overall ventilation effectiveness for the temperature distribution 綱痛̅ is defined as
綱痛̅ = 劇墜通痛鎮勅痛 − 劇沈津鎮勅痛劇銚塚勅追銚直勅 − 劇沈津鎮勅痛 (26)
where 劇墜通痛鎮勅痛 is the average temperature for the air-CO2 mixture at the outlet, 劇銚塚勅追銚直勅 denotes the average temperature for the air-CO2 mixture all over the breathing zone and 劇沈津鎮勅痛 is the average temperature for the air-CO2 mixture at the inlet. The temperatures 劇銚塚勅追銚直勅, 劇墜通痛鎮勅痛 and 劇沈津鎮勅痛 are computed by the following equations:
劇銚塚勅追銚直勅 = 完 劇 穴畦凋年畦佃 (27)
劇墜通痛鎮勅痛 = 完 劇 穴鯨聴認 鯨追 (28)
劇沈津鎮勅痛 = 完 劇 穴鯨聴濡 鯨鎚 (29)
where Az is the area of the breathing zone, T is temperature in point of (x, y), 鯨追 is the outlet surface and 鯨鎚 is the inlet surface. The indoor air quality is investigated in terms of the ventilation effectiveness, which is based on the CO2 concentration in the breathing zone (Fig.11). The ventilation effectiveness 考蝶 (Lawrence & Braun 2007) is a measure of how the supply airflow mixes with the breathing zone for a removal of CO2 or other pollutants:
考蝶 = 系追 − 系鎚系佃 − 系鎚, (30)
where 系追 - average CO2 return concentration [ppm], 系鎚 - average CO2 supply concentration [ppm], 系佃 - average CO2 concentration in the breathing zone [ppm]. The average CO2 concentrations 系追, 系鎚 and 系佃 are computed from:
系佃 = 完 系 穴畦凋年畦佃 , (31)
系追 = 完 系 穴鯨聴認 鯨追 (32)
系鎚 = 完 系 穴鯨聴濡 鯨鎚 (33)
where C is the CO2 concentration at the point of (x, y).
www.intechopen.com

Indoor Air Quality and Thermal Comfort in Naturally Ventilated Low-Energy Residential Houses 97
8. Results and discussion
The simulation results are divided into two main groups, called:
House 1: residential house equipped with natural, gravitational ventilation (cases 1 – 12), House 2: residential house equipped with natural ventilation with exhaust ventilators (cases 13 – 24).
Next, the main 2 groups (houses) are divided into the groups which differ in the space heating system and ventilation type:
Group (a): gravitational ventilation and radiator heating system (cases 1 – 6), Group (b): gravitational ventilation and floor heating system (cases 13 – 18), Group (c): with exhaust ventilators and radiator heating system (cases 7 – 12), Group (d): with exhaust ventilators and floor heating system (cases 19 – 24).
Finally, the subgroups differ in the air inlet location:
Subgroup (i): air inlet located above window, Subgroup (ii): air inlet located below window.
For each subgroup, three ambient climate and operating conditions are considered: windy weather and windows closed, calm weather and windows closed, windy weather and windows opened. The simulation cases are presented in Tab.1.
The health and toxicity implications of CO2 on the human health were reviewed by
Hodgson from University of Connecticut Health Sciences Center. His investigations
indicated that there was no evidence that CO2 influenced the normal functions of human
beings, if the concentration of CO2 remained lower than 8500 ppm. However, for normal
living conditions, the measured values of CO2 above 1000 ppm resulted in people
dissatisfaction. Hence, all figures presenting the investigations results of the CO2
concentration are limited up to 8500 ppm. Alike CO2 concentration, the figures presenting
PMV index are limited to the seven point-scale defined by ISO (2004). All results of the
simulations are presented in Tab.2.
8.1 Influence of air-CO2 mixture flow characteristics on local air quality
The average CO2 concentration in the breathing zone is a main index which assesses the
indoor air quality. However, the resident’s body can disturb the mixture flow pattern in the
indoor zone and change local values of the index. Thus, the following analysis focuses on
the local indoor quality in the zone located at the front of the resident’s head. The figures
show the distribution of the air velocity for different air inlet locations and different space
heating systems supported or not by the mechanical exhaust ventilators. The plotted colors
show the velocity and the CO2 concentration distribution. In the case of the windy weather
(case 1) and radiator heating system installed without exhaust ventilators, the upward flow
is dominated by the forced convection from the imposed inlet velocity. Next, main flow
bends down to the resident’s head with the velocity of about 0.36 m/s. The air mixture,
enforced by the breathing affect, flows down along a body of the resident reaching the flow
velocity of 0.7 m/s (Fig.16a). At the bottom of the indoor zone, the main flow turns back to
the external wall and circulates in the closed cell. The cell is bounded by the floor, ceiling,
www.intechopen.com
Air Quality – Monitoring and Modeling 98
human’s body and the external wall. The cell height is about 1.8 m. This flow pattern results
in a fresh air zone located at the front of the resident’s face (Fig.16b). The average CO2
concentration in a cellular zone (diameter of 1.0 m) at the front of the resident’s head is 735
ppm, while over the breathing zone 1015 ppm.
Case name House Group SubgroupInlet
locationWeather
Open window
Exhaust fan
Heating system
Gra
vit
atio
nal
Case 1
1
a
i
UP Windy NO NO Radiator
Case 2 UP Calm NO NO Radiator
Case 3 UP Windy YES NO Radiator
Case 4
ii
DOWN Windy NO NO Radiator
Case 5 DOWN Calm NO NO Radiator
Case 6 DOWN Windy YES NO Radiator
Case 7
b
i
UP Windy NO NO Floor
Case 8 UP Calm NO NO Floor
Case 9 UP Windy YES NO Floor
Case 10
ii
DOWN Windy NO NO Floor
Case 11 DOWN Calm NO NO Floor
Case 12 DOWN Windy YES NO Floor
Mec
han
ical
ex
hau
st
Case 13
2
c
i
UP Windy NO YES Radiator
Case 14 UP Calm NO YES Radiator
Case 15 UP Windy YES YES Radiator
Case 16
ii
DOWN Windy NO YES Radiator
Case 17 DOWN Calm NO YES Radiator
Case 18 DOWN Windy YES YES Radiator
Case 19
d
i
UP Windy NO YES Floor
Case 20 UP Calm NO YES Floor
Case 21 UP Windy YES YES Floor
Case 22
ii
DOWN Windy NO YES Floor
Case 23 DOWN Calm NO YES Floor
Case 24 DOWN Windy YES YES Floor
Table 1. Specification of the simulation cases
www.intechopen.com

Indoor Air Quality and Thermal Comfort in Naturally Ventilated Low-Energy Residential Houses 99
Case Cz
[ppm]PMVavg
[-]雌惨
[-] 皿拶[%]
資博嗣[-]
Case 1 1015 0,81 0,1917 6,0 1,0139
Case 2 1007 1,22 0,3300 6,1 0,8265
Case 3 729 -1,88 0,0500 10,6 2,3943
Case 4 1243 0,92 0,3244 6,4 0,9408
Case 5 991 1,07 0,3455 6,0 0,8278
Case 6 1776 -0,44 0,2206 8,0 1,6427
Case 7 1016 0,77 0,1914 13,8 0,9668
Case 8 1008 1,15 0,3344 13,7 0,9068
Case 9 1266 -3.00 0,1676 13,5 1,7275
Case 10 1243 0,93 0,3244 13,9 0,9783
Case 11 991 1,18 0,3455 13,7 0,9058
Case 12 1776 -1,01 0,1846 13,5 1,6528
Case 13 743 0,77 0,2571 6,6 0,9581
Case 14 688 1,24 0,0010 7,0 0,8974
Case 15 645 -1,34 0,4805 8,5 1,9367
Case 16 904 1,11 0,2738 6,9 0,9330
Case 17 688 1,05 0,0010 7,0 0,9004
Case 18 967 -1,49 0,3443 7,7 1,6136
Case 19 743 0,52 0,2571 13,8 0,9666
Case 20 688 1,07 0,0010 13,9 0,8913
Case 21 957 -0,53 0,2165 13,7 1,5133
Case 22 904 -2,78 0,2738 13,9 0,9483
Case 23 688 1,06 0,0010 13,8 0,8913
Case 24 962 -1,30 0,3473 13,5 1,5942
Table 2. The CFD simulation results
Figure 17a shows the distributions of the air velocity for the air inlet located below the window (case 4). The indoor space is heated by radiators without exhaust ventilators. Unlikely the air inlet located above the window, in the case of windy weather, the downward flow is still dominated by the forced convection from the imposed inlet velocity. However, main flow moves forward, parallel to the floor, just to the resident body with the velocity of about 0.63 m/s (Fig.17a). The air mixture reaches the resident body at the height of 0.6 m and turns down along the body, slowing down to the velocity of about 0.33 m/s. At the bottom of the indoor zone, the main flow turns back to the external wall and circulates in the closed cell. The cell is bounded by the floor, horizontal surface located at the height of 0.6 m, human body and external wall. The height of the cell is about 0.6 m. This flow pattern results in a poor air zone located just above the floor (Fig.17b). Unlikely the air inlet located above window, the fresh air zone is moved up and out of the resident face. A resident is not in a contact with the fresh air zone.
www.intechopen.com

Air Quality – Monitoring and Modeling 100
In the case of the floor heating system (case 7), the flow pattern is alike the radiator heating
system. However, main flow bends down to the resident head and reaches the velocity of
about 0.51 m/s (Fig.18a). It is much higher than in the case of the radiator heating system
(0.36 m/s). The air mixture, enforced by the breathing affect, flows down along a body of
the resident reaching the flow velocity of 0.57 m/s and is smaller than in the case of the
radiator heating system (Fig.18b). Even though, the CO2 concentrations in the breathing
zone for the radiator and floor heating system are almost the same and equal to 1015 ppm
and 1016 ppm, respectively, the fresh air zone at the front of the resident is bigger for the
radiator heating system. The average CO2 concentration in a cellular zone (diameter of 1.0
m) at the front of the resident head is 628 ppm.
The exhaust ventilators installation does not change the flow pattern significantly. In case of
the radiator heating system applied and the air inlet located above the window, for the
windy weather, the main flow bends down to the resident head with a slightly higher
velocity of 0.43 m/s (Fig.19a). The air-CO2 mixture flows down and back to the external
wall, creating a cellular flow pattern in front of the resident. The average flow velocity in the
cell is 0.24 m/s and the average CO2 concentration in a cellular zone (diameter of 1.0 m) at
the front of the resident head is 453 ppm (Fig.19b), while the average CO2 concentration in
the breathing zone is 743 ppm.
The calm weather is more unfavorable for the natural ventilation. In the case of the calm
weather, when the gravitational ventilation and the radiator heating system are applied, for
the air inlet located above the window there is no fresh air zone at the front of the resident
(Fig.20a). There can be observed the mixture flow along the resident body downward to the
floor with the velocity of 0.4 m/s and the mixture flow upward and along the radiator, and
the window with the velocity of 0.082 m/s. These two mixture streams are not able to create
a clear cellular flow of the fresh air. Thus, at the front of the resident head, the CO2
concentration is high, about 1900 ppm (Fig.20b), while the average CO2 concentration is 1002
ppm in the breathing zone.
a) b)
Fig. 16. The air-CO2 mixture local flow characteristics (case 1): a) velocity vector field, b) CO2 concentration distribution
www.intechopen.com
Indoor Air Quality and Thermal Comfort in Naturally Ventilated Low-Energy Residential Houses 101
a) b)
Fig. 17. The air-CO2 mixture local flow characteristics (case 4): a) velocity vector field, b) CO2 concentration distribution
In the case of the calm weather, the location of the air inlet below the window is better. The air-CO2 mixture flows along the resident body downward to the floor with the velocity of 0.27 m/s (Fig.21a). Next, it turns back to the external wall and slows down to the velocity of 0.13 m/s. This flow pattern and flow velocities are enough to create the fresh air zone at the front of the resident head. The CO2 concentration of 1352 ppm in the fresh air zone is still high (Fig.21b), but significantly lower than at the location of the air inlet above the window. The average CO2 concentration in the breathing zone is 991 ppm.
The exchange of the heating system into the floor heating system can improve a little the air quality in the fresh air zone located at the front of the resident’s head during the calm weather. Opposite to the radiator heating system, the floor heating system decreases slightly the flow intensity, but surprisingly it results in a creation of the cellular “fresh” air zone at the front of the resident’s head (Fig.22a). Even though the “fresh” air zone is created, the average CO2 concentration is high and equals to 1425 ppm (Fig.22b), while the average CO2 concentration in the breathing zone is 1008 ppm. It can results in the resident dissatisfaction.
a) b)
Fig. 18. The air-CO2 mixture local flow characteristics (case 7): a) velocity vector field, b) CO2 concentration distribution
www.intechopen.com

Air Quality – Monitoring and Modeling 102
a) b)
Fig. 19. The air-CO2 mixture local flow characteristics (case 13): a) velocity vector field, b) CO2 concentration distribution
Moving down the air inlet location below the window, the air-CO2 mixture flow pattern is
not changed (Fig.23a) and the average value of the CO2 concentration in the “fresh” air zone
is reduced down to 1390 ppm (Fig.23b), while the average CO2 concentration in the
breathing zone is 991 ppm. However, this still can result in the resident’s dissatisfaction.
In the case of the calm weather, the exhaust ventilators slightly improve the indoor air
quality. In the following discussion, only the fresh air inlet located above the window is
considered and two simulation cases are discussed: radiator heating system and floor
heating system. For the radiator heating system installed, there is not a clear cellular fresh
air zone (Fig.24a). However, the average CO2 concentration at the front of the resident’s
head is 986 ppm (Fig.24b) and the value is still in the comfort range, while the average CO2
concentration in the breathing zone is 688 ppm.
The heating system exchange into the floor heating system improves significantly the air
quality near the resident head, however there is not a clear cellular fresh air zone
(Fig.25a). In contrast to the radiator heating system, when the floor system is installed, the
zone of the fresh air is significantly larger and the average value of the CO2 concentration
near the resident’s head is about 583 ppm (Fig.25b). It means that the air quality near the
resident head is excellent, while the average CO2 concentration in the breathing zone is
622 ppm.
Analyzing the FE results, it can be concluded that the local air quality in the zone located
at the front of the resident head can be significantly different than the one predicted by
indices concerning the breathing zone. It can result in the unpredicted resident
dissatisfaction. This conclusion is confirmed by experiments (Section 3.3). The momentary
dissatisfaction of the local air quality results in actions aiming at the comfort level
recovery (e.g. windows opening), while the overall indoor air quality indices indicate IAQ
in a comfort range.
www.intechopen.com

Indoor Air Quality and Thermal Comfort in Naturally Ventilated Low-Energy Residential Houses 103
a) b)
Fig. 20. The air-CO2 mixture local flow characteristics (case 2): a) velocity vector field, b) CO2 concentration distribution
a) b)
Fig. 21. The air-CO2 mixture local flow characteristics (case 5): a) velocity vector field, b) CO2 concentration distribution
a) b)
Fig. 22. The air-CO2 mixture local flow characteristics (case 8): a) velocity vector field, b) CO2 concentration distribution
www.intechopen.com

Air Quality – Monitoring and Modeling 104
a) b)
Fig. 23. The air-CO2 mixture local flow characteristics (case 11): a) velocity vector field, b) CO2 concentration distribution
a) b)
Fig. 24. The air-CO2 mixture local flow characteristics (case 14): a) velocity vector field, b) CO2 concentration distribution
a) b)
Fig. 25. The air-CO2 mixture local flow characteristics (case 20): a) velocity vector field, b) CO2 concentration distribution
www.intechopen.com
Indoor Air Quality and Thermal Comfort in Naturally Ventilated Low-Energy Residential Houses 105
8.2 Overall indoor air quality
The indoor air quality is usually assessed by indices averaged over the average breathing zone according to the international guideline EN ISO (2004): the average CO2 concentration Cz and the ventilation effectiveness 考蝶 (which is a measure of how well the supply airflow mixes with the breathing zone for a removal of CO2). In this study, the average breathing zone is modeled as a separate area (Fig.15). The average CO2 concentration over the breathing zone is computed according to Eq.31. The results of simulations for the house equipped with the natural ventilation without exhaust ventilators (gravitational) are presented in Fig.26.
a)
b)
c)
d)
Fig. 26. The average CO2 concentration Cz in breathing zone for house equipped with natural ventilation without exhaust ventilators
www.intechopen.com
Air Quality – Monitoring and Modeling 106
a)
b)
c)
d)
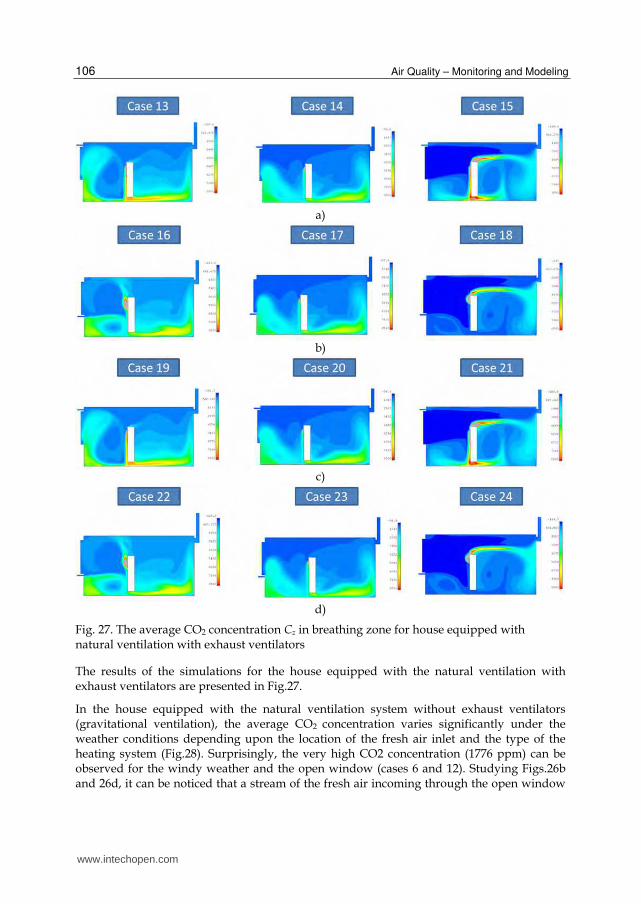
Fig. 27. The average CO2 concentration Cz in breathing zone for house equipped with natural ventilation with exhaust ventilators
The results of the simulations for the house equipped with the natural ventilation with exhaust ventilators are presented in Fig.27.
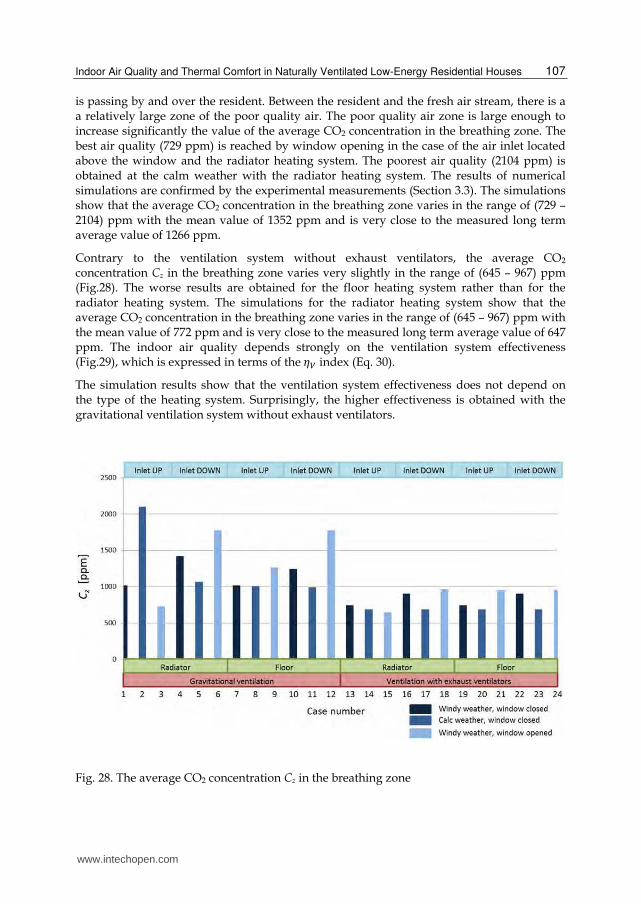
In the house equipped with the natural ventilation system without exhaust ventilators (gravitational ventilation), the average CO2 concentration varies significantly under the weather conditions depending upon the location of the fresh air inlet and the type of the heating system (Fig.28). Surprisingly, the very high CO2 concentration (1776 ppm) can be observed for the windy weather and the open window (cases 6 and 12). Studying Figs.26b and 26d, it can be noticed that a stream of the fresh air incoming through the open window
www.intechopen.com
Indoor Air Quality and Thermal Comfort in Naturally Ventilated Low-Energy Residential Houses 107
is passing by and over the resident. Between the resident and the fresh air stream, there is a a relatively large zone of the poor quality air. The poor quality air zone is large enough to increase significantly the value of the average CO2 concentration in the breathing zone. The best air quality (729 ppm) is reached by window opening in the case of the air inlet located above the window and the radiator heating system. The poorest air quality (2104 ppm) is obtained at the calm weather with the radiator heating system. The results of numerical simulations are confirmed by the experimental measurements (Section 3.3). The simulations show that the average CO2 concentration in the breathing zone varies in the range of (729 – 2104) ppm with the mean value of 1352 ppm and is very close to the measured long term average value of 1266 ppm.
Contrary to the ventilation system without exhaust ventilators, the average CO2 concentration Cz in the breathing zone varies very slightly in the range of (645 – 967) ppm (Fig.28). The worse results are obtained for the floor heating system rather than for the radiator heating system. The simulations for the radiator heating system show that the average CO2 concentration in the breathing zone varies in the range of (645 – 967) ppm with the mean value of 772 ppm and is very close to the measured long term average value of 647 ppm. The indoor air quality depends strongly on the ventilation system effectiveness (Fig.29), which is expressed in terms of the 考蝶 index (Eq. 30).
The simulation results show that the ventilation system effectiveness does not depend on the type of the heating system. Surprisingly, the higher effectiveness is obtained with the gravitational ventilation system without exhaust ventilators.
Fig. 28. The average CO2 concentration Cz in the breathing zone
www.intechopen.com
Air Quality – Monitoring and Modeling 108
Fig. 29. The ventilation effectiveness in terms of 考蝶 index
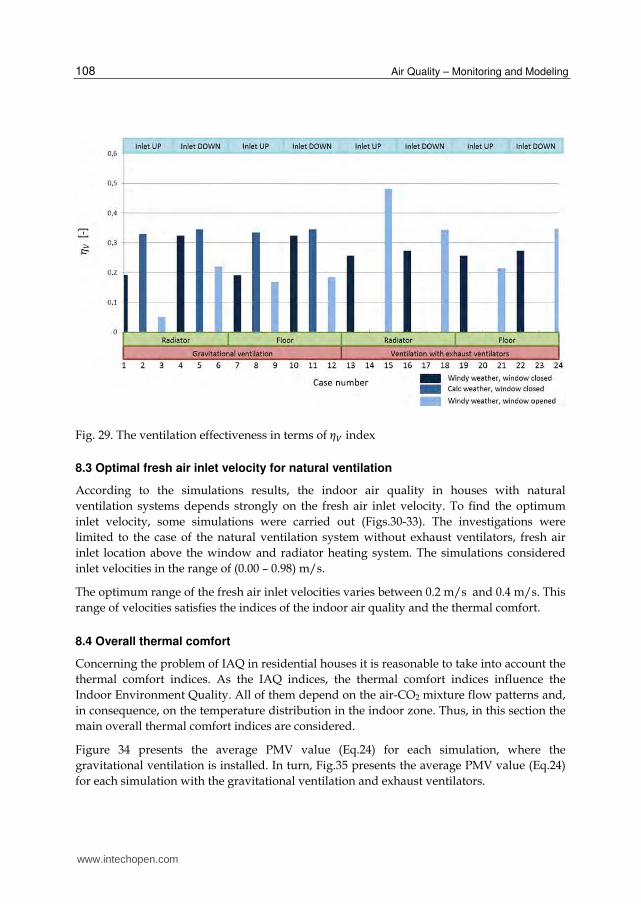
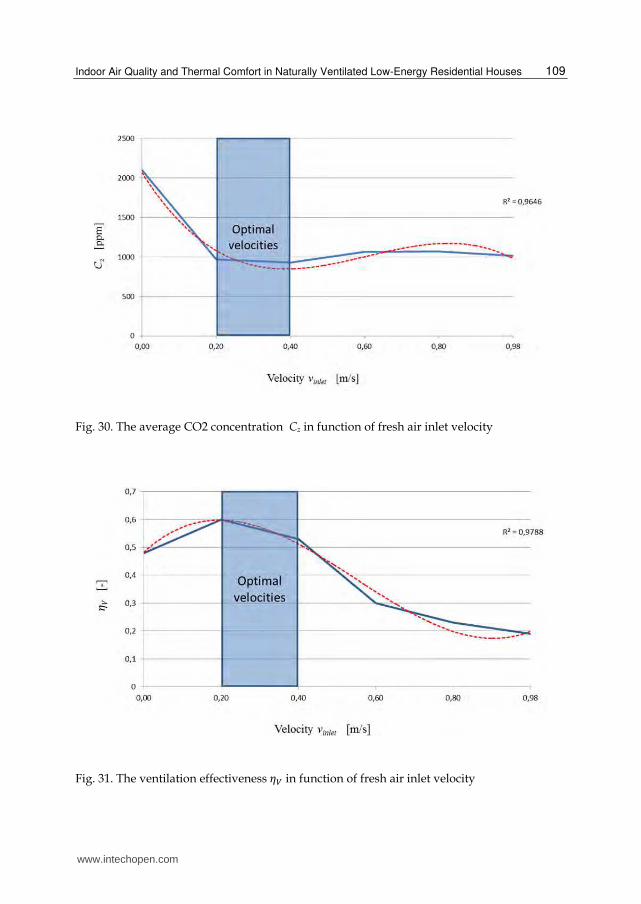
8.3 Optimal fresh air inlet velocity for natural ventilation
According to the simulations results, the indoor air quality in houses with natural
ventilation systems depends strongly on the fresh air inlet velocity. To find the optimum
inlet velocity, some simulations were carried out (Figs.30-33). The investigations were
limited to the case of the natural ventilation system without exhaust ventilators, fresh air
inlet location above the window and radiator heating system. The simulations considered
inlet velocities in the range of (0.00 – 0.98) m/s.
The optimum range of the fresh air inlet velocities varies between 0.2 m/s and 0.4 m/s. This
range of velocities satisfies the indices of the indoor air quality and the thermal comfort.
8.4 Overall thermal comfort
Concerning the problem of IAQ in residential houses it is reasonable to take into account the
thermal comfort indices. As the IAQ indices, the thermal comfort indices influence the
Indoor Environment Quality. All of them depend on the air-CO2 mixture flow patterns and,
in consequence, on the temperature distribution in the indoor zone. Thus, in this section the
main overall thermal comfort indices are considered.
Figure 34 presents the average PMV value (Eq.24) for each simulation, where the
gravitational ventilation is installed. In turn, Fig.35 presents the average PMV value (Eq.24)
for each simulation with the gravitational ventilation and exhaust ventilators.
www.intechopen.com
Indoor Air Quality and Thermal Comfort in Naturally Ventilated Low-Energy Residential Houses 109
Fig. 30. The average CO2 concentration Cz in function of fresh air inlet velocity
Fig. 31. The ventilation effectiveness 考蝶 in function of fresh air inlet velocity
www.intechopen.com

Air Quality – Monitoring and Modeling 110
Fig. 32. The percentage dissatisfied PD in function of fresh air inlet velocity
Fig. 33. The overall ventilation effectiveness for temperature distribution 綱痛̅ in function of fresh air inlet velocity
www.intechopen.com

Indoor Air Quality and Thermal Comfort in Naturally Ventilated Low-Energy Residential Houses 111
a)
b
c)
d)
Fig. 34. The PMV index distribution for houses with natural ventilation and without exhaust ventilators
www.intechopen.com
Air Quality – Monitoring and Modeling 112
a)
b)
c)
d)
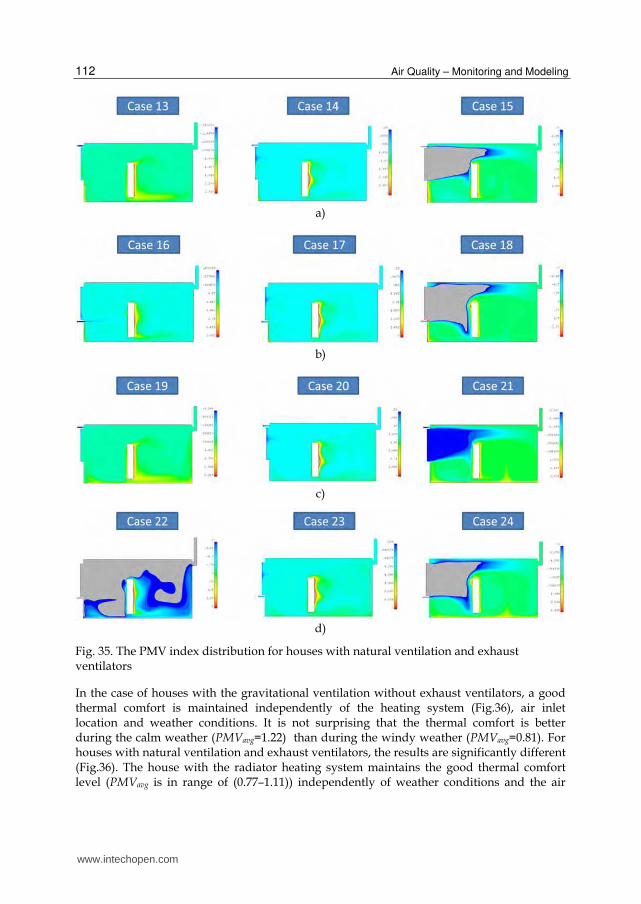
Fig. 35. The PMV index distribution for houses with natural ventilation and exhaust ventilators
In the case of houses with the gravitational ventilation without exhaust ventilators, a good thermal comfort is maintained independently of the heating system (Fig.36), air inlet location and weather conditions. It is not surprising that the thermal comfort is better during the calm weather (PMVavg=1.22) than during the windy weather (PMVavg=0.81). For houses with natural ventilation and exhaust ventilators, the results are significantly different (Fig.36). The house with the radiator heating system maintains the good thermal comfort level (PMVavg is in range of (0.77–1.11)) independently of weather conditions and the air
www.intechopen.com
Indoor Air Quality and Thermal Comfort in Naturally Ventilated Low-Energy Residential Houses 113
inlet location, while for the floor heating system, the thermal comfort strongly varies and depends on weather conditions and the air inlet location. Surprisingly, the best comfort level is reached in the house equipped with the radiator heating system and air inlet located below the window (PMVavg=1.11), while the worst result is obtained in the house with the floor heating system and air inlet located below the window (PMVavg=-2.78).
According to the PMVavg index, it can be concluded that the best comfort level is observed in
the house with the natural ventilation and without exhaust ventilators. More precise
conclusions can be derived by studying the simulations results of the PD index (Fig. 37). It
can be noted that the percentage of dissatisfied ones (PD index) depends only on the type of
the heating system installed. The biggest values of the PD index of 13.9 % are obtained for
the floor heating system.
The overall ventilation effectiveness for a temperature distribution is provided by the
quantitative index 綱痛̅ related to the way in which the heat is distributed over the indoor zone
(Fig.38). However, for all investigated cases, the 綱痛̅ index is almost the same (varies in the
range of (0.8265 – 1.0139)). It means that a temperature homogeneity level is high enough.
The only exception is observed for the cases with open windows; the 綱痛̅ index reaches
2.3943. However, the open window is an abnormal situation and the corresponding values
of the 綱痛̅ index are artificial and thus can’t be taken into account. Analyzing the above
results, it can be seen that the natural ventilation without exhaust ventilators can maintain
the satisfying thermal comfort level. It can be even higher by installing the radiator heating
system. The location of the air inlet gap does not influence the thermal comfort when using
the natural ventilation system with or without exhaust ventilators.
Fig. 36. The average PMVavg index for houses with natural ventilation
www.intechopen.com

Air Quality – Monitoring and Modeling 114
Fig. 37. The average PD index for houses with natural ventilation
Fig. 38. The average ventilation effectiveness for temperature distribution 綱痛̅ in houses with natural ventilation
9. Conclusions
The CFD simulations were carried out to study the indoor air quality and the thermal comfort in residential houses with the natural ventilation and with or without exhaust ventilators. The average results were compared with the experimental measurements and a good correlation was found between them.
www.intechopen.com

Indoor Air Quality and Thermal Comfort in Naturally Ventilated Low-Energy Residential Houses 115
The fresh air inlet location above the window opening leads to a better indoor air quality, however decreases the thermal comfort.
A type of the heating system does not influence the indoor air quality, while strongly affects the thermal comfort. From the thermal comfort point of view, the radiator heating system is significantly better (based on the PD index) than the floor one.
The installation of exhaust ventilators significantly improves the indoor air quality, however, slightly deteriorates the thermal comfort. The exhaust ventilators installed in houses with the fresh air inlet located below the window deteriorate the thermal comfort even stronger.
The CZ index of the average CO2 concentration in the breathing zone as the assessment method is not well suited for the natural ventilation in residential houses located in cold-climate regions. The results indicate significant differences between the CZ index and the average CO2 concentration in the local fresh air zone located at the front of the resident’s head. It can be a main reason of the dissatisfaction, leading to the unpredicted resident’s actions aimed at recovering the satisfaction, e.g. by windows opening.
The natural ventilation without exhaust ventilators can maintain the good thermal comfort and acceptable indoor air quality, but the fresh air inlet has to be installed above the window and the radiator heating system should be applied. However, this type of ventilation is very sensitive to ambient conditions, thus the fresh air inlets should be controlled in order to maintain a constant optimum air velocity.
Our further research will focus on experimental investigations of the local fresh air zone and its influence on the subjective satisfaction sensation.
10. References
Ansys Inc., ANSYS Release 11.0 Documentation for ANSYS, 2007. Awbi, H. (2003). Ventilation of building, E & FN Spon, 2003. Behne, M. (1999). Indoor air quality in rooms with cooled ceilings. Mixing ventilation or
rather displacement ventilation? Energy and Buildings, 30(2), pp.155–66 Duffie, J. A. & Beckman, W. A. (1991). Solar Engineering of Thermal Processes, New York:
John Wiley and Sons Energy Consumption Guide 19, Energy efficiency in offices, London: Energy Efficiency
Office/HMSO, 1993. Hastings, S. R. (2004). Breaking the “heating barrier”. Learning from the first houses without
conventional heating. Energy and Buildings, 26, pp.373-380 Ho, S. H., Rosario, L. & Rahman, R. R. (2011). Comparison of underfloor and overhead air
distribution systems in an office environment. Building and Environment, 46, pp.1415-1427
Hummelgaard, J., Juhl, P., Sebjornsson, K. O., Clausen G., Toftum, J. & Langkilde, G. (2007). Indoor air quality and occupant satisfaction in five mechanically and four naturally ventilated open-plan office buildings. Building and Environment, 42, pp.4051–4058
Hyun, S. & Kleinstreuer, C. (2001). Numerical simulation of mixed convection heat and mass transfer in a human inhalation test chamber. International Journal of Heat and Mass Transfer, 44, pp.2247–60
www.intechopen.com

Air Quality – Monitoring and Modeling 116
ISO 16000-1, (2004). E, Indoor air - part 1: General aspects of sampling strategy ISO 16814 (2008), Building environment design - Indoor air quality - Methods of expressing
the quality of indoor air for human occupancy ISO 6946:2007, Building components and building elements. Thermal resistance and thermal
transmittance. Calculation method, 2007. ISO 7730:2005, Ergonomics of the thermal environment. Analytical determination and
interpretation of thermal comfort using calculation of the PMV and PPD indices and local thermal comfort criteria, Annex D, 2005.
Karlsson, J. F. & Moshfegh, B. (2006). Energy demand and indoor climate in a low energy building – changed control strategies and boundary condition. Energy and Building, 38, pp.315-326
Launder, B. E. & Spalding, D. B. (1974). The Numerical Computation of Turbulent Flows. Computer Methods in Applied Mechanics and Engineering, Vol. 3, pp 269-289
Laverge, J., Van Den Bossche, N., Heijmans, N. & Janssens, A. (2011). Energy saving potential and repercussions on indoor air quality of demand controlled residential ventilation strategies. Building and Environment, 46, pp.1497-1503
Lawrence, T. M. & Braun, J. E. (2007). A methodology for estimating occupant CO2 source generation rates from measurements in small commercial buildings. Building and Environment, 42, pp.623-639
Li, J., Way, O. W. H., Li,Y. S., Zhan, J., Ho, Y. A., Li, J. & Lam, E. (2010). Effect of green roof on ambient CO2 concentration. Building and Environment, 45, pp.2644-2651
Maier, T., Krzaczek, M. & Tejchman, J. (2009). Comparison of physical performances of the ventilation systems in low-energy residential houses. Energy and Building, 41, pp.337-353
Meyer, F. (1993). Niedrigenergiehäuser Heidenheim: Hauskonzepte und erste Meßergebnisse, Eggenstein-Leopoldshafen: Fachinformationszentrum, Bine Projekt Info-Service Nr. 9, Karlsruhe
Murakami, S., Kato, S. & Zeng J. (2000). Combined simulation of airflow, radiation and moisture transport for heat release from a human body. Building and Environment, 35, pp.489–500
Paul, T., Sree, D. & Aglan, H. (2010). Effect of mechanically induced ventilation on the indoor air quality of building envelopes. Energy and Buildings, 42, pp. 326–332
Redlich, C. A., Sparer, J. & Cullen M. R. (1997). Sick-building syndrome. Lancet, 349 (9057), pp.1013–6
Reinmuth, F. (1994). Energieeinsparung in der Gebäudetechnik: Baukörper und technische Systeme der Energieverwendung, Vogel Verlag, Würzburg
Stavrakakis, G. M., Zervas, P. L., Sarimveis, H. & Markatos, N. C. (2010) Development of a computational tool to quantify architectural design effects on thermal comfort in naturally ventilated rural houses. Building and Environment, 45(1), pp.65-80
Viollet, P. L. (1987). The Modelling of Turbulent Re-circulating flows for the purpose of reactor thermal-hydraulic analysis. Nuclear Engineering and Design, 99, pp.365-377
Wong, N. H. & Huang, B. (2004). Comparative study of the indoor air quality of naturally ventilated and air-conditioned bedrooms of residential buildings in Singapore. Building and Environment, 39, pp.1115-1123
www.intechopen.com

Air Quality - Monitoring and ModelingEdited by Dr. Sunil Kumar
ISBN 978-953-51-0161-1Hard cover, 230 pagesPublisher InTechPublished online 29, February, 2012Published in print edition February, 2012
InTech EuropeUniversity Campus STeP Ri Slavka Krautzeka 83/A 51000 Rijeka, Croatia Phone: +385 (51) 770 447 Fax: +385 (51) 686 166www.intechopen.com
InTech ChinaUnit 405, Office Block, Hotel Equatorial Shanghai No.65, Yan An Road (West), Shanghai, 200040, China
Phone: +86-21-62489820 Fax: +86-21-62489821
The book reports research on relationship between fungal contamination and its health effects in large Asiancities, estimation of ambient air quality in Delhi, a qualitative study of air pollutants from road traffic, air qualityin low-energy buildings, some aspects of the Sentinel method for pollution problem, evaluation of dryatmospheric deposition at sites in the vicinity of fuel oil fired power, particles especially PM 10 in the indoorenvironment, etc.
How to referenceIn order to correctly reference this scholarly work, feel free to copy and paste the following:
M. Krzaczek and J. Tejchman (2012). Indoor Air Quality and Thermal Comfort in Naturally Ventilated Low-Energy Residential Houses, Air Quality - Monitoring and Modeling, Dr. Sunil Kumar (Ed.), ISBN: 978-953-51-0161-1, InTech, Available from: http://www.intechopen.com/books/air-quality-monitoring-and-modeling/air-quality-in-low-energy-buildings