indonesian consumer update - dewapurnama · source: asosiasi industri sepeda motor indonesia. 13...
TRANSCRIPT
1Confidential & Proprietary ● Copyright © 2006 ACNielsen ● a VNU business
Indonesian Consumer Update
Prepared for Network ClubSeptember 12, 2006
2
Confidential & Proprietary ● Copyright © 2006 ACNielsen ● a VNU businessNetwork ClubSeptember 12, 2006
VNU Companies in Indonesia
●ACNielsen Indonesia–FMCG retail tracking–Consumer panel–Customised
●Nielsen Media Research–Print and radio research–Advertising expenditure monitoring
●AGB Nielsen Media Research–Television Ratings
3
Confidential & Proprietary ● Copyright © 2006 ACNielsen ● a VNU businessNetwork ClubSeptember 12, 2006
Topics
● Spending Power● Retail FMCG Sales● Growth of the Modern Trade ● The Media Scene ● Consumer Attitudes● World Cup Survey
16.0
1.06
©AC
Nie
lsen
200
6
Spending Power
We use Expenditure level to measure spending power...
• household spending on day-to-day goods and services eg: routine household expenses on food, washing and cleaning products, children’s school fees, electricity, water, cigarettes, wages of household helpers, petrol, monthly house rental & otherroutine expenses
• excludes major items - cars, houses, etc.
• so does not cover all spending
• validates well with durables ownership and lifestyle
• Long-term trend
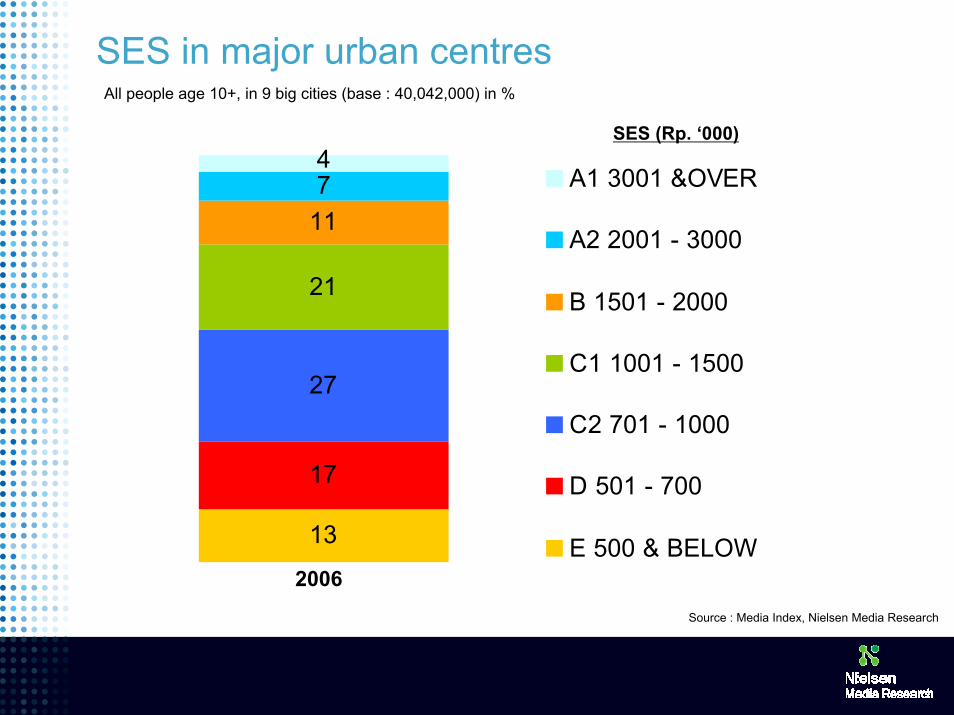
SES in major urban centresAll people age 10+, in 9 big cities (base : 40,042,000) in %
13
17
27
21
1174
A1 3001 &OVER
A2 2001 - 3000
B 1501 - 2000
C1 1001 - 1500
C2 701 - 1000
D 501 - 700
E 500 & BELOW2006
Source : Media Index, Nielsen Media Research
SES (Rp. ‘000)
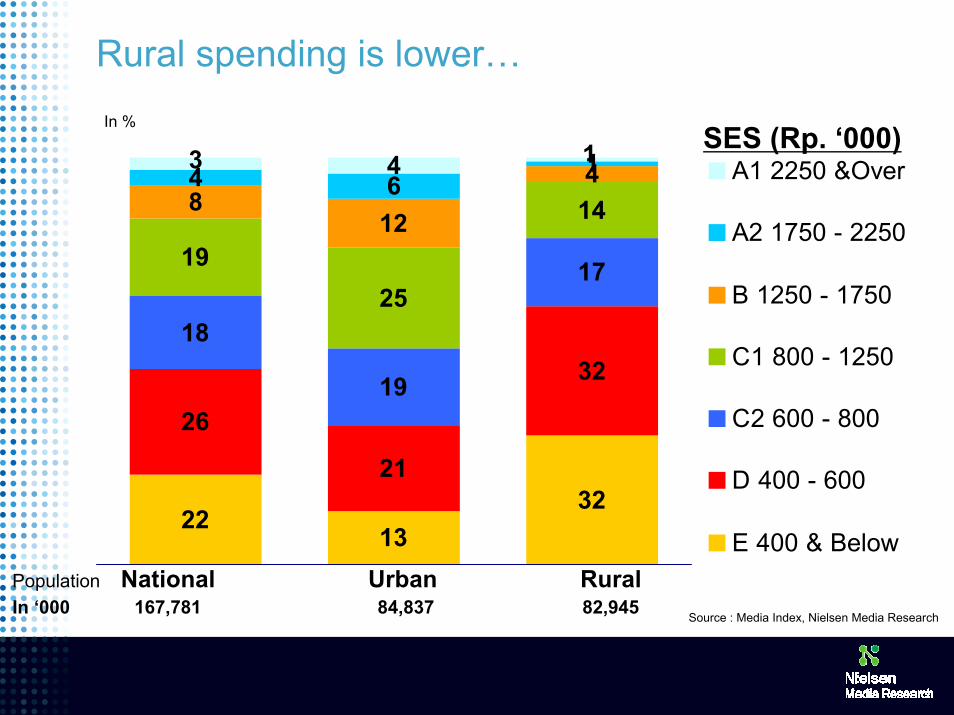
Rural spending is lower…
2213
32
26
21
3218
19
171925
14812
44 614 13 A1 2250 &Over
A2 1750 - 2250
B 1250 - 1750
C1 800 - 1250
C2 600 - 800
D 400 - 600
E 400 & BelowPopulation National Urban RuralIn ‘000 167,781 84,837 82,945
SES (Rp. ‘000)
Source : Media Index, Nielsen Media Research
In %
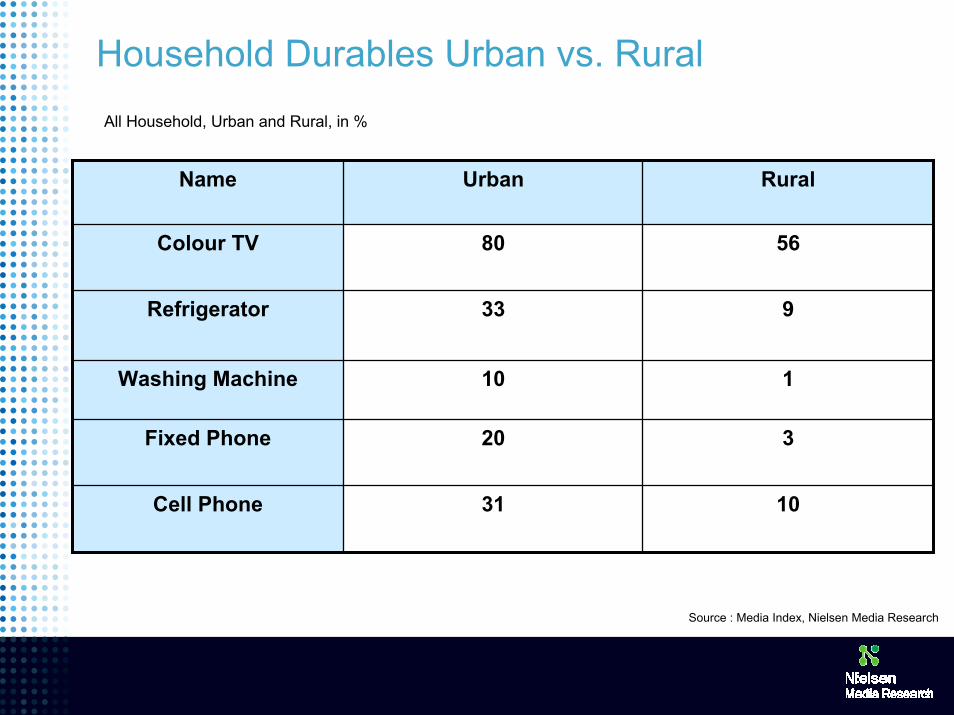
Household Durables Urban vs. RuralAll Household, Urban and Rural, in %
320Fixed Phone
1031Cell Phone
110Washing Machine
933Refrigerator
5680Colour TV
Rural UrbanName
Source : Media Index, Nielsen Media Research
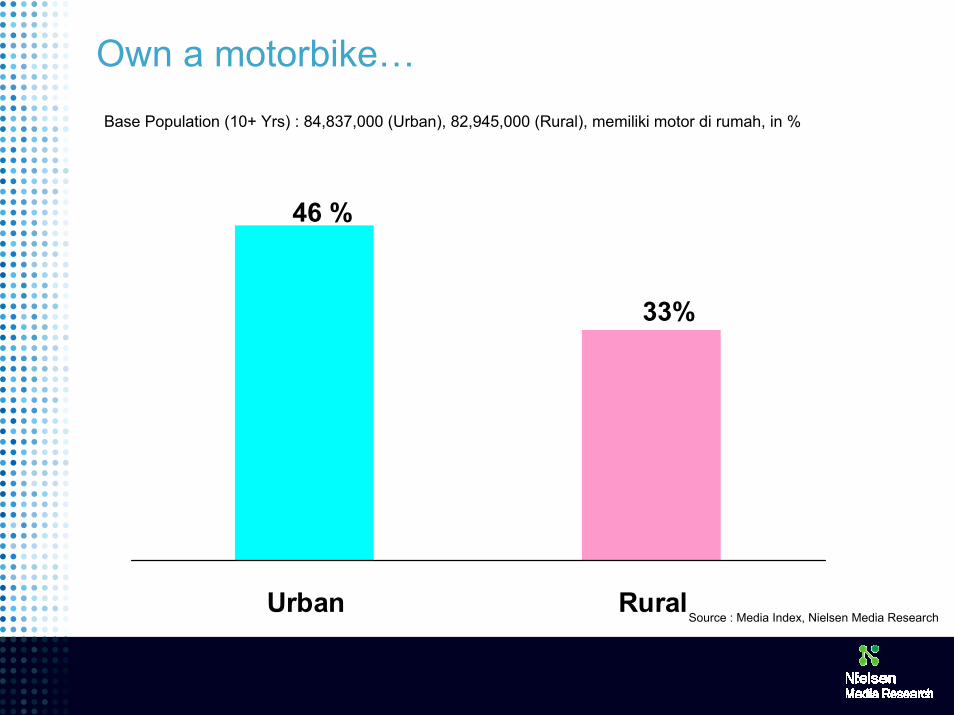
Own a motorbike…Base Population (10+ Yrs) : 84,837,000 (Urban), 82,945,000 (Rural), memiliki motor di rumah, in %
Urban Rural
46 %
33%
Source : Media Index, Nielsen Media Research
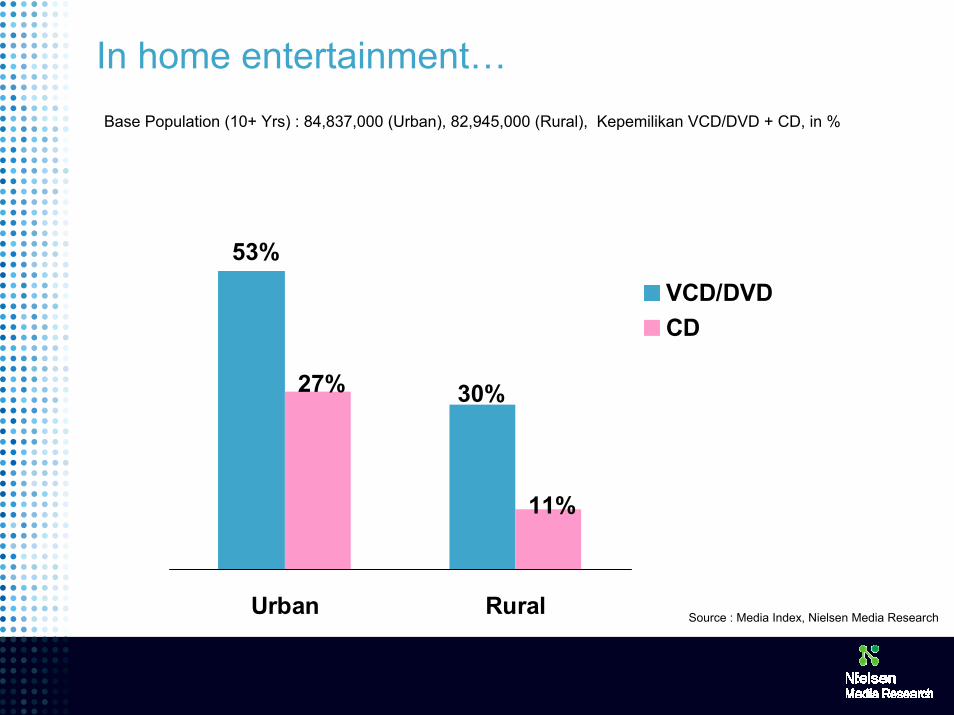
In home entertainment…Base Population (10+ Yrs) : 84,837,000 (Urban), 82,945,000 (Rural), Kepemilikan VCD/DVD + CD, in %
Urban Rural
VCD/DVDCD
53%
30%27%
11%
Source : Media Index, Nielsen Media Research
11
Confidential & Proprietary ● Copyright © 2006 ACNielsen ● a VNU businessNetwork ClubSeptember 12, 2006
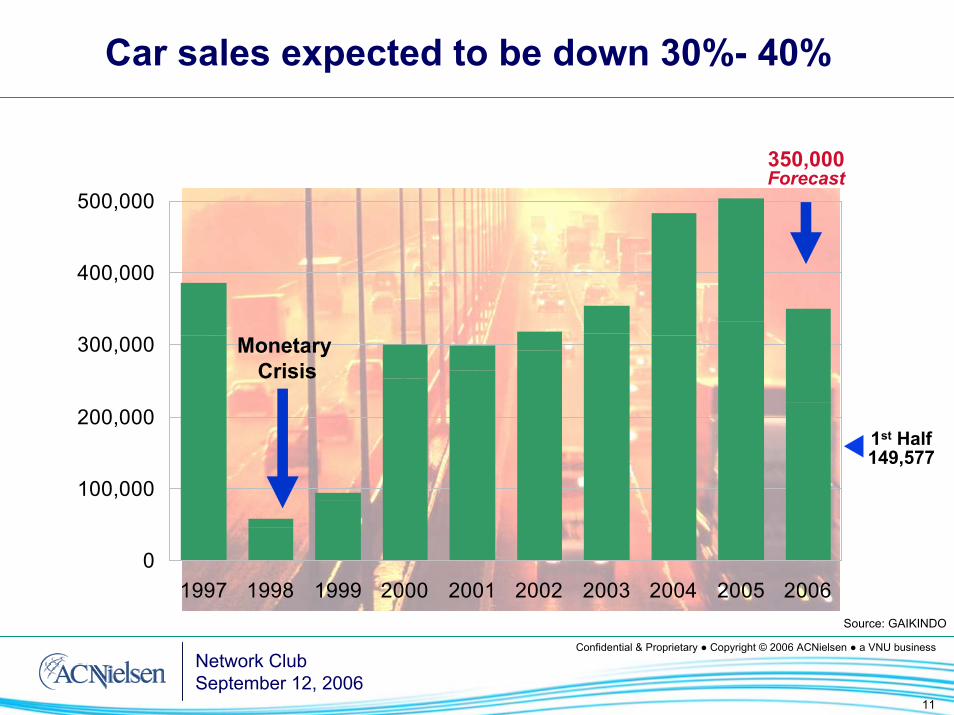
Car sales expected to be down 30%- 40%
0
100,000
200,000
300,000
400,000
500,000
1997 1998 1999 2000 2001 2002 2003 2004 2005 2006
Monetary Crisis
350,000 Forecast
1st Half149,577
Source: GAIKINDO
12
Confidential & Proprietary ● Copyright © 2006 ACNielsen ● a VNU businessNetwork ClubSeptember 12, 2006
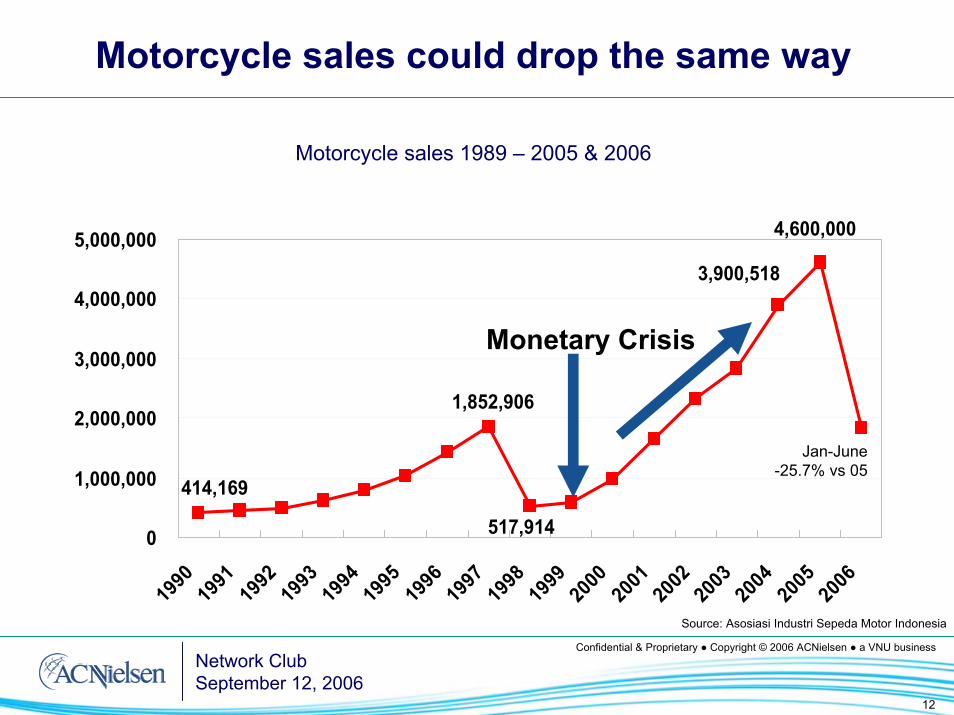
Motorcycle sales could drop the same way
Motorcycle sales 1989 – 2005 & 2006
414,169
1,852,906
517,914
3,900,518
4,600,000
0
1,000,000
2,000,000
3,000,000
4,000,000
5,000,000
1990
1991
1992
1993
1994
1995
1996
1997
1998
1999
2000
2001
2002
2003
2004
2005
2006
Monetary Crisis
Jan-June-25.7% vs 05
Source: Asosiasi Industri Sepeda Motor Indonesia

13
Confidential & Proprietary ● Copyright © 2006 ACNielsen ● a VNU businessNetwork ClubSeptember 12, 2006
Expectations of National Economic Conditions6 Months From Now
% A little / much better
Base: Urban Adults; N=1,731Q. Six months from now, how much better or worse do you think the economic situation will be … [SA]* No data was collected between February and April 2006
26 27 2932
3538 37
32
4649
45
36 37
26
20
29 2926
30
24
16 1720 22
18
24
Jan-
04
Feb-
04
Mar
-04
Apr
-04
May
-04
Jun-
04
Jul-0
4
Aug
-04
Sep-
04
Oct
-04
Nov
-04
Dec
-04
Jan-
05
Feb-
05
Mar
-05
Apr
-05
May
-05
Jun-
05
Jul-0
5
Aug
-05
Sep-
05
Oct
-05
Nov
-05
Dec
-05
Jan-
06
May
-06
Fuel Increase
Fuel Increase
Presidential Election round 2
Presidential Election round 1
Source: ACNielsen Omnibus
14
Confidential & Proprietary ● Copyright © 2006 ACNielsen ● a VNU businessNetwork ClubSeptember 12, 2006
Retail FMCG Sales
15
Confidential & Proprietary ● Copyright © 2006 ACNielsen ● a VNU businessNetwork ClubSeptember 12, 2006
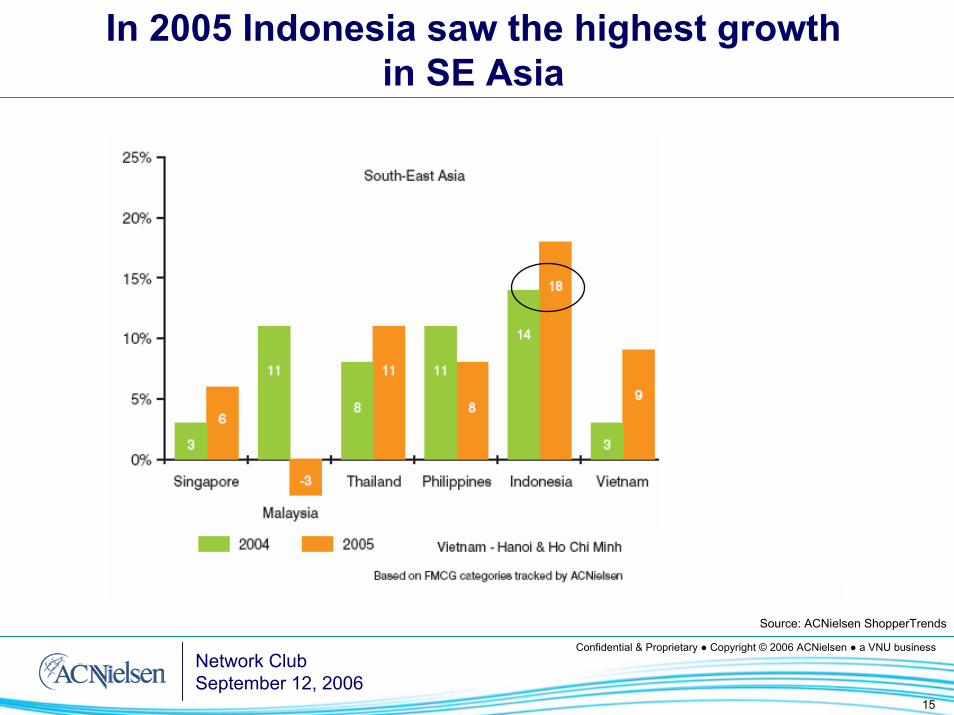
In 2005 Indonesia saw the highest growth in SE Asia
Source: ACNielsen ShopperTrends
16
Confidential & Proprietary ● Copyright © 2006 ACNielsen ● a VNU businessNetwork ClubSeptember 12, 2006
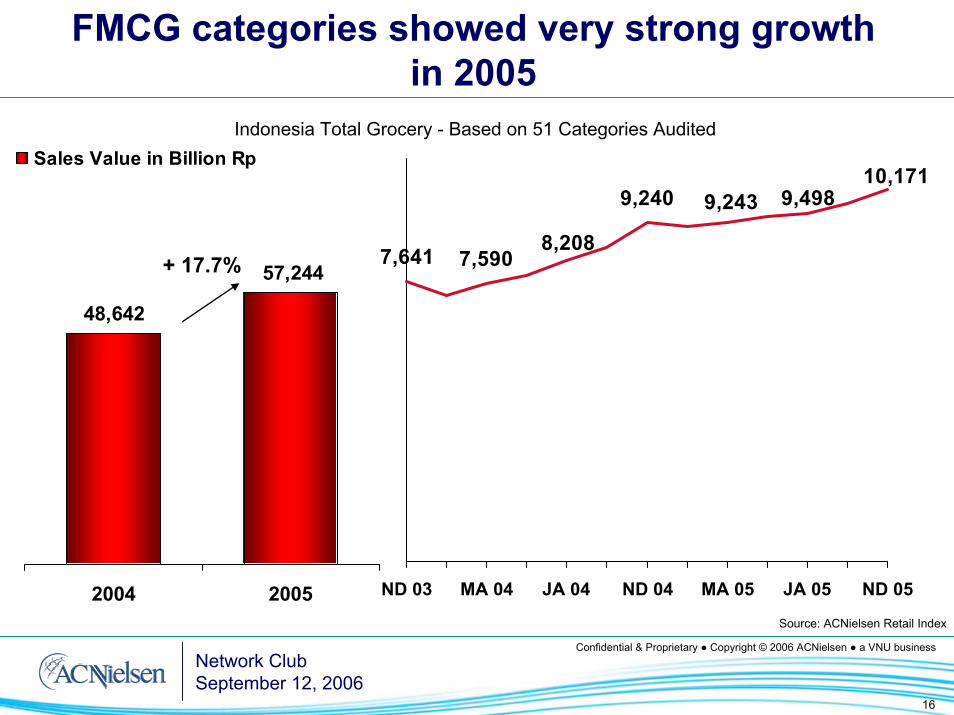
FMCG categories showed very strong growth in 2005
7,5907,641
9,243 9,498
8,208
9,24010,171
ND 03 MA 04 JA 04 ND 04 MA 05 JA 05 ND 05
48,642
57,244
2004 2005
Sales Value in Billion RpIndonesia Total Grocery - Based on 51 Categories Audited
+ 17.7%
Source: ACNielsen Retail Index
17
Confidential & Proprietary ● Copyright © 2006 ACNielsen ● a VNU businessNetwork ClubSeptember 12, 2006
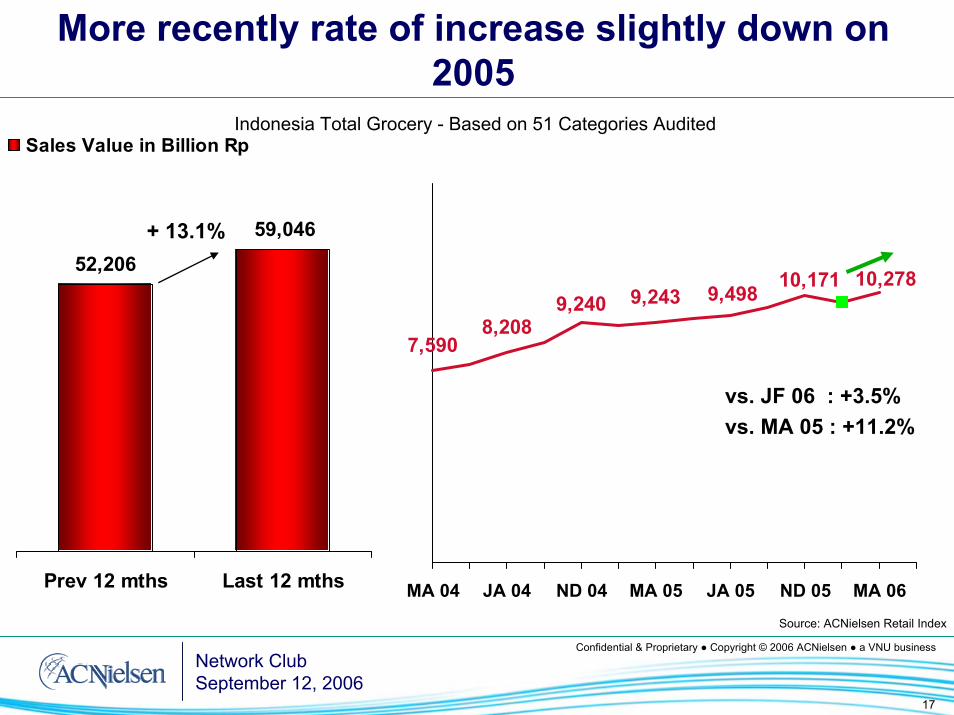
More recently rate of increase slightly down on 2005
8,2087,590
9,49810,171
9,240 9,24310,278
MA 04 JA 04 ND 04 MA 05 JA 05 ND 05 MA 06
52,206
59,046
Prev 12 mths Last 12 mths
Sales Value in Billion RpIndonesia Total Grocery - Based on 51 Categories Audited
+ 13.1%
vs. JF 06 : +3.5%vs. MA 05 : +11.2%
Source: ACNielsen Retail Index
18
Confidential & Proprietary ● Copyright © 2006 ACNielsen ● a VNU businessNetwork ClubSeptember 12, 2006
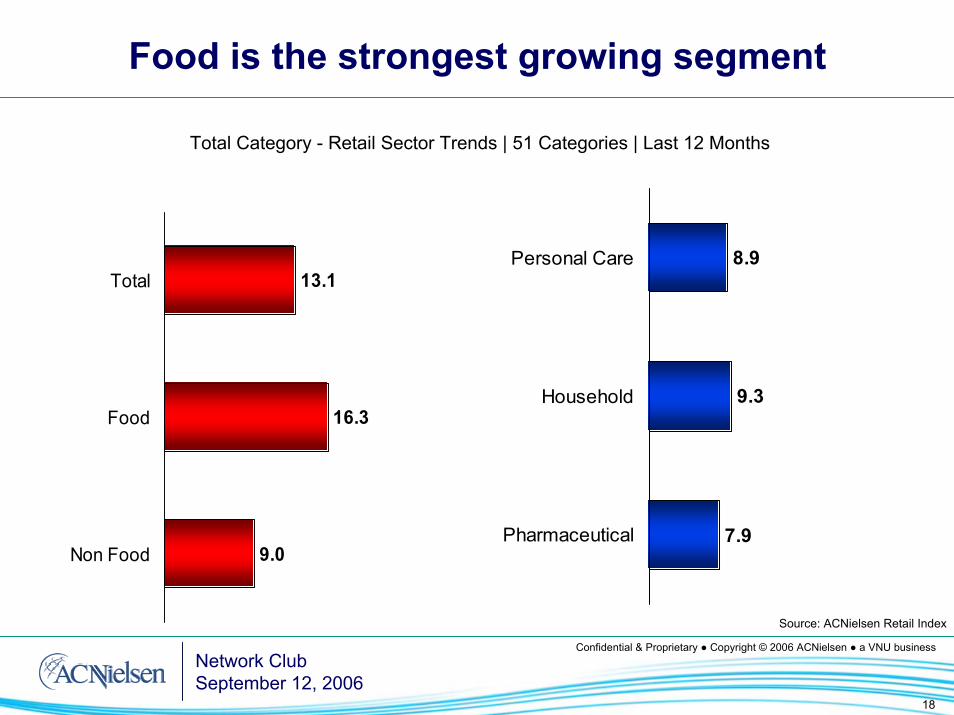
Food is the strongest growing segment
Total Category - Retail Sector Trends | 51 Categories | Last 12 Months
8.9
9.3
7.9
Personal Care
Household
Pharmaceutical
13.1
16.3
9.0
Total
Food
Non Food
Source: ACNielsen Retail Index
19
Confidential & Proprietary ● Copyright © 2006 ACNielsen ● a VNU businessNetwork ClubSeptember 12, 2006
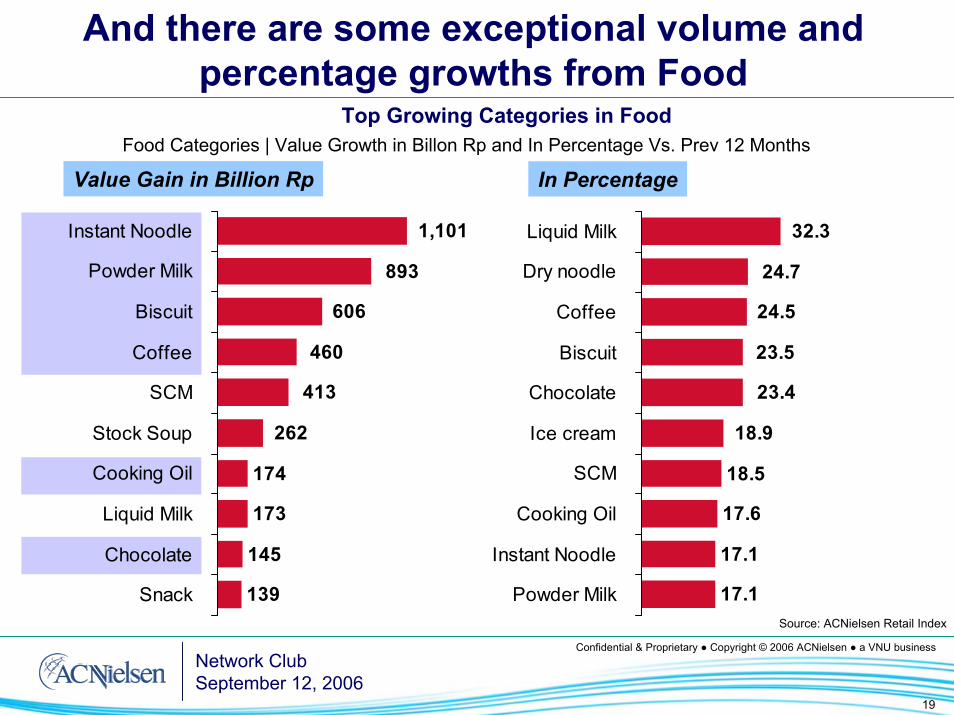
And there are some exceptional volume and percentage growths from Food
Top Growing Categories in FoodFood Categories | Value Growth in Billon Rp and In Percentage Vs. Prev 12 Months
174
173
145
139
262
413
460
606
893
1,101Instant Noodle
Powder Milk
Biscuit
Coffee
SCM
Stock Soup
Cooking Oil
Liquid Milk
Chocolate
Snack
In PercentageValue Gain in Billion Rp
18.5
17.6
17.1
17.1
18.9
23.4
23.5
24.5
24.7
32.3Liquid Milk
Dry noodle
Coffee
Biscuit
Chocolate
Ice cream
SCM
Cooking Oil
Instant Noodle
Powder Milk Source: ACNielsen Retail Index
20
Confidential & Proprietary ● Copyright © 2006 ACNielsen ● a VNU businessNetwork ClubSeptember 12, 2006
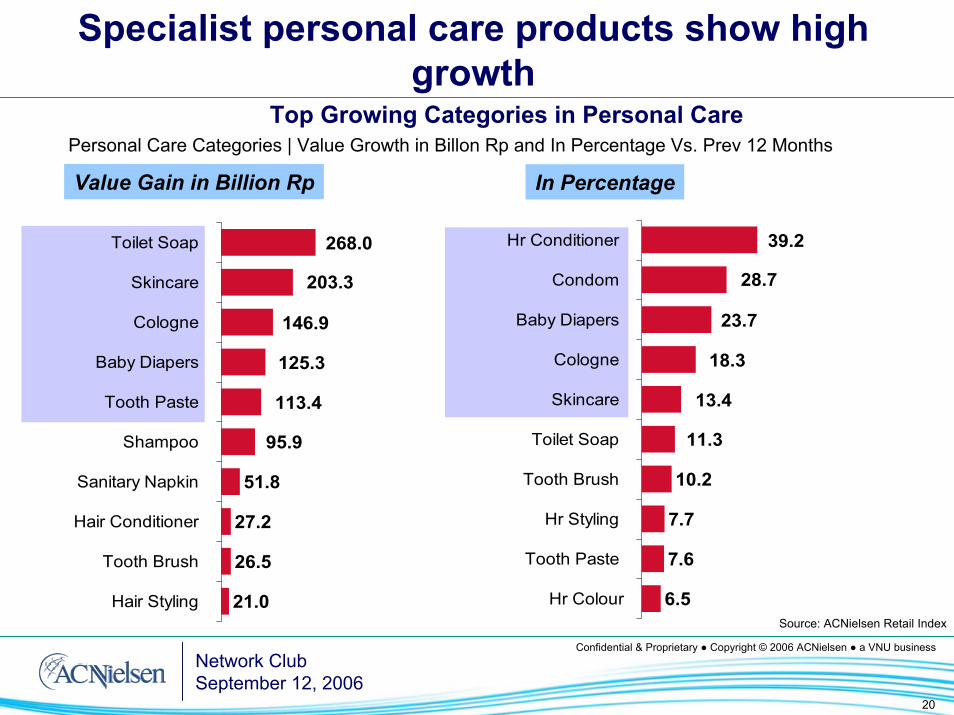
Top Growing Categories in Personal Care
Specialist personal care products show high growth
Personal Care Categories | Value Growth in Billon Rp and In Percentage Vs. Prev 12 Months
Value Gain in Billion Rp In Percentage
51.8
27.2
26.5
21.0
95.9
113.4
125.3
146.9
203.3
268.0Toilet Soap
Skincare
Cologne
Baby Diapers
Tooth Paste
Shampoo
Sanitary Napkin
Hair Conditioner
Tooth Brush
Hair Styling
10.2
7.7
7.6
6.5
11.3
13.4
18.3
23.7
28.7
39.2Hr Conditioner
Condom
Baby Diapers
Cologne
Skincare
Toilet Soap
Tooth Brush
Hr Styling
Tooth Paste
Hr Colour Source: ACNielsen Retail Index
21
Confidential & Proprietary ● Copyright © 2006 ACNielsen ● a VNU businessNetwork ClubSeptember 12, 2006
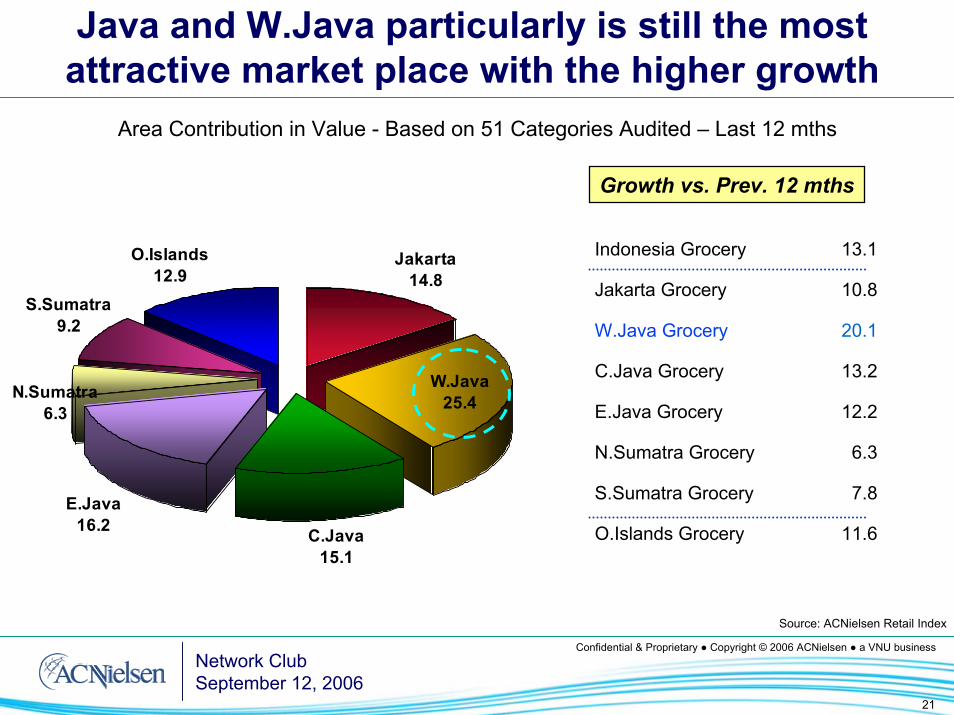
Java and W.Java particularly is still the most attractive market place with the higher growth
Area Contribution in Value - Based on 51 Categories Audited – Last 12 mths
Growth vs. Prev. 12 mths
Jakarta14.8
C.Java 15.1
E.Java 16.2
W.Java 25.4N.Sumatra
6.3
S.Sumatra 9.2
O.Islands 12.9
11.6O.Islands Grocery
7.8S.Sumatra Grocery
6.3N.Sumatra Grocery
12.2E.Java Grocery
13.2C.Java Grocery
20.1W.Java Grocery
10.8Jakarta Grocery
13.1Indonesia Grocery
Source: ACNielsen Retail Index
22
Confidential & Proprietary ● Copyright © 2006 ACNielsen ● a VNU businessNetwork ClubSeptember 12, 2006
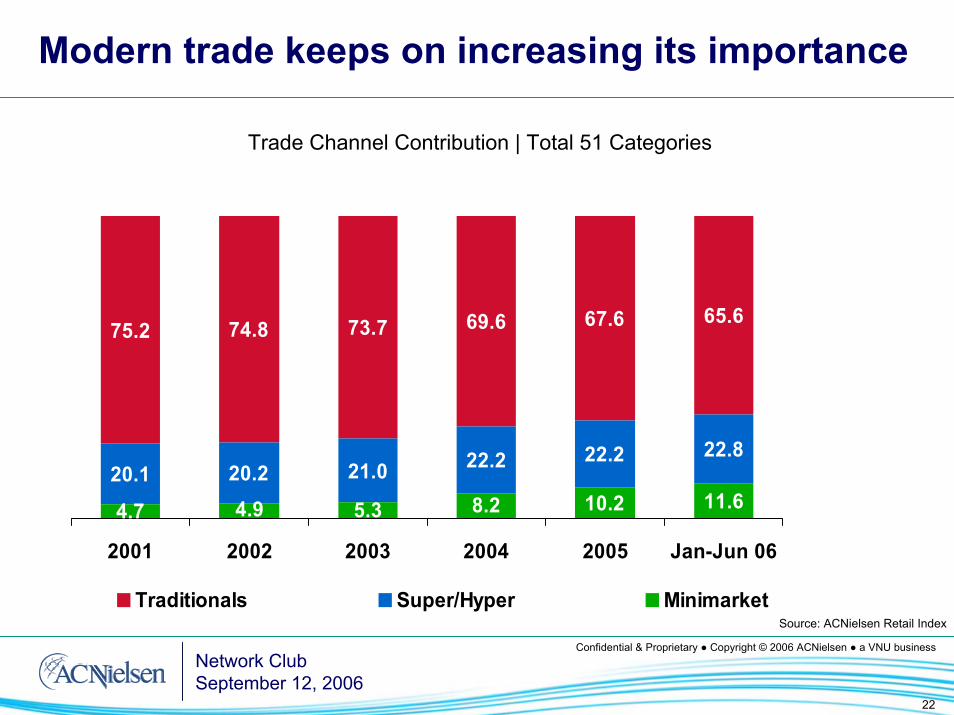
Modern trade keeps on increasing its importance
75.2 74.8 73.7 69.6 67.6 65.6
20.1 20.2 21.0 22.2 22.2 22.8
10.2 11.68.25.34.94.7
2001 2002 2003 2004 2005 Jan-Jun 06
Traditionals Super/Hyper Minimarket
Trade Channel Contribution | Total 51 Categories
Source: ACNielsen Retail Index
23
Confidential & Proprietary ● Copyright © 2006 ACNielsen ● a VNU businessNetwork ClubSeptember 12, 2006
Growth of the Modern Trade
24
Confidential & Proprietary ● Copyright © 2006 ACNielsen ● a VNU businessNetwork ClubSeptember 12, 2006
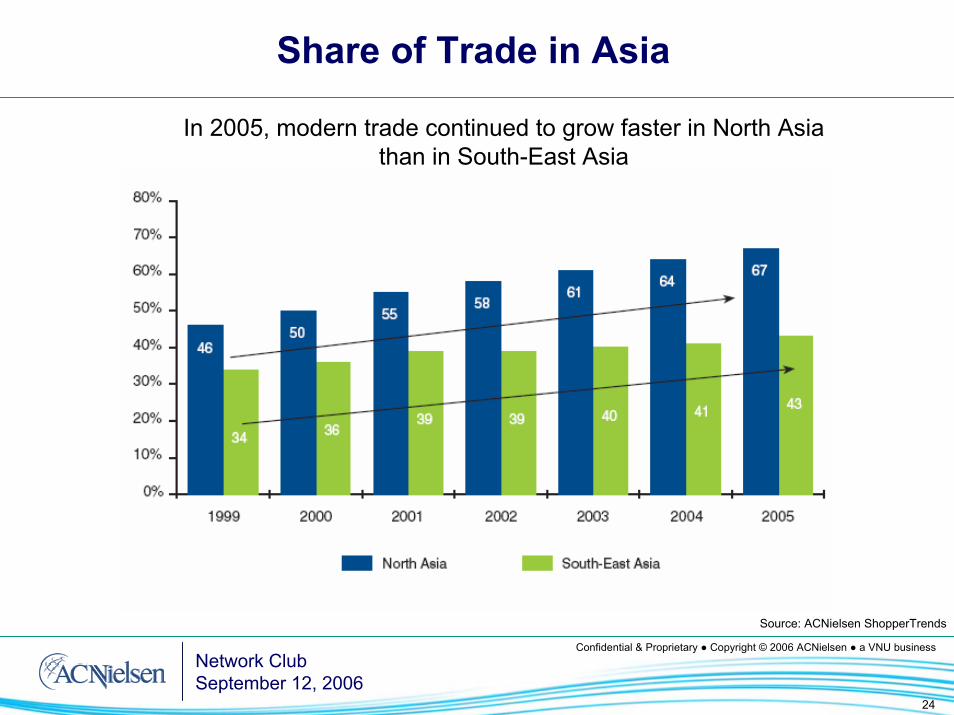
Share of Trade in Asia
In 2005, modern trade continued to grow faster in North Asia than in South-East Asia
Source: ACNielsen ShopperTrends
25
Confidential & Proprietary ● Copyright © 2006 ACNielsen ● a VNU businessNetwork ClubSeptember 12, 2006
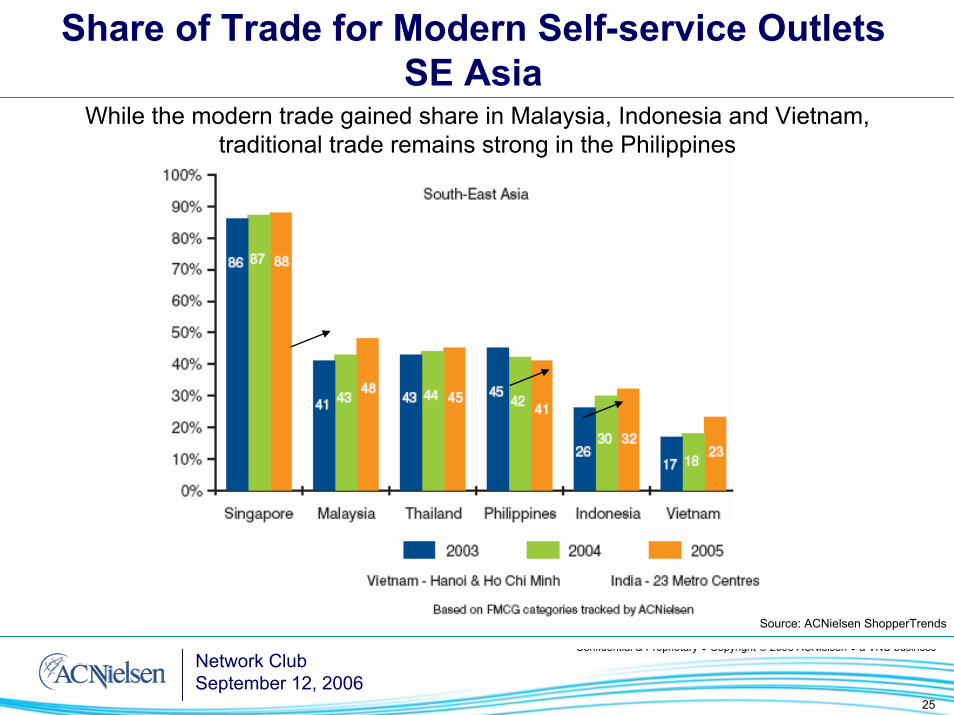
Share of Trade for Modern Self-service Outlets SE Asia
Source: ACNielsen ShopperTrends
While the modern trade gained share in Malaysia, Indonesia and Vietnam, traditional trade remains strong in the Philippines
26
Confidential & Proprietary ● Copyright © 2006 ACNielsen ● a VNU businessNetwork ClubSeptember 12, 2006
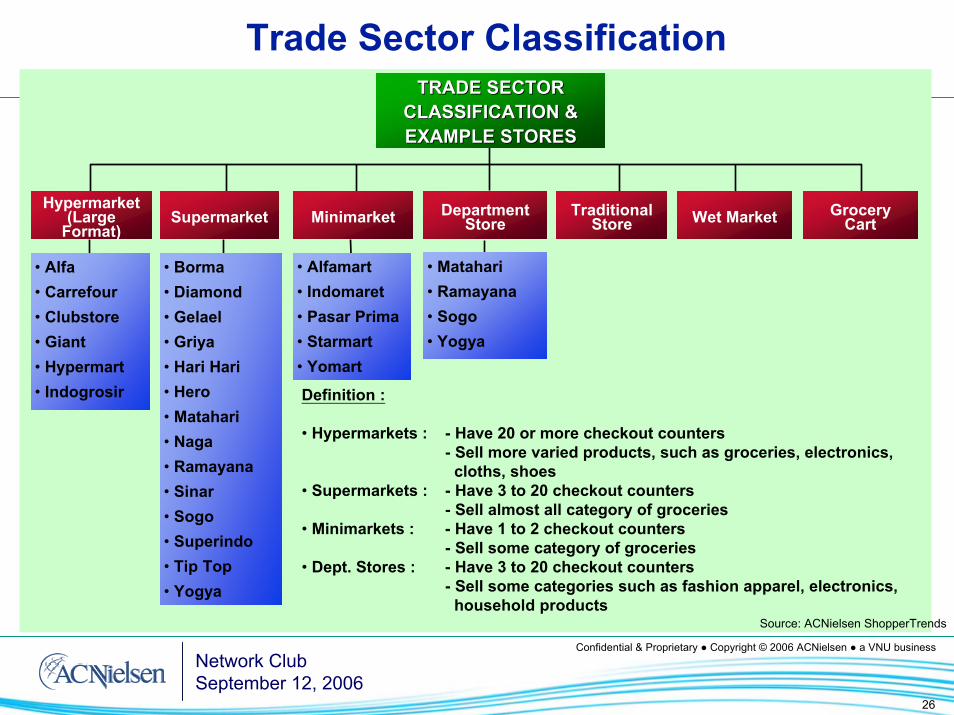
Trade Sector ClassificationTRADE SECTOR TRADE SECTOR
CLASSIFICATION & CLASSIFICATION & EXAMPLE STORESEXAMPLE STORES
Traditional StoreMinimarket Wet Market
Hypermarket(Large
Format)Grocery
CartDepartment
StoreSupermarket
• Alfa• Carrefour• Clubstore• Giant• Hypermart• Indogrosir
• Alfamart• Indomaret• Pasar Prima• Starmart• Yomart
• Borma• Diamond• Gelael• Griya• Hari Hari• Hero• Matahari• Naga• Ramayana• Sinar• Sogo• Superindo• Tip Top• Yogya
• Matahari• Ramayana• Sogo• Yogya
Definition :
• Hypermarkets : - Have 20 or more checkout counters- Sell more varied products, such as groceries, electronics,
cloths, shoes• Supermarkets : - Have 3 to 20 checkout counters
- Sell almost all category of groceries• Minimarkets : - Have 1 to 2 checkout counters
- Sell some category of groceries• Dept. Stores : - Have 3 to 20 checkout counters
- Sell some categories such as fashion apparel, electronics,household products
Source: ACNielsen ShopperTrends
27
Confidential & Proprietary ● Copyright © 2006 ACNielsen ● a VNU businessNetwork ClubSeptember 12, 2006
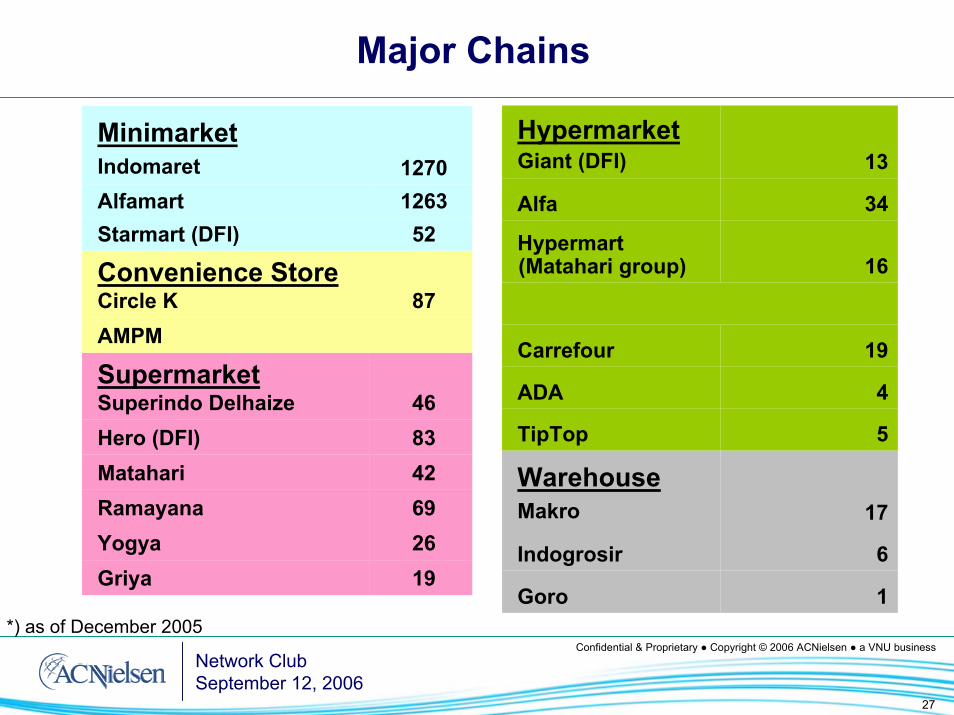
Major Chains
19Griya26Yogya69Ramayana42Matahari83Hero (DFI)46
SupermarketSuperindo Delhaize
AMPM87
Convenience StoreCircle K
52Starmart (DFI)1263Alfamart1270
MinimarketIndomaret
1Goro
6Indogrosir
17WarehouseMakro
5TipTop
4ADA
19Carrefour
16Hypermart(Matahari group)
34Alfa
13HypermarketGiant (DFI)
*) as of December 2005
28
Confidential & Proprietary ● Copyright © 2006 ACNielsen ● a VNU businessNetwork ClubSeptember 12, 2006
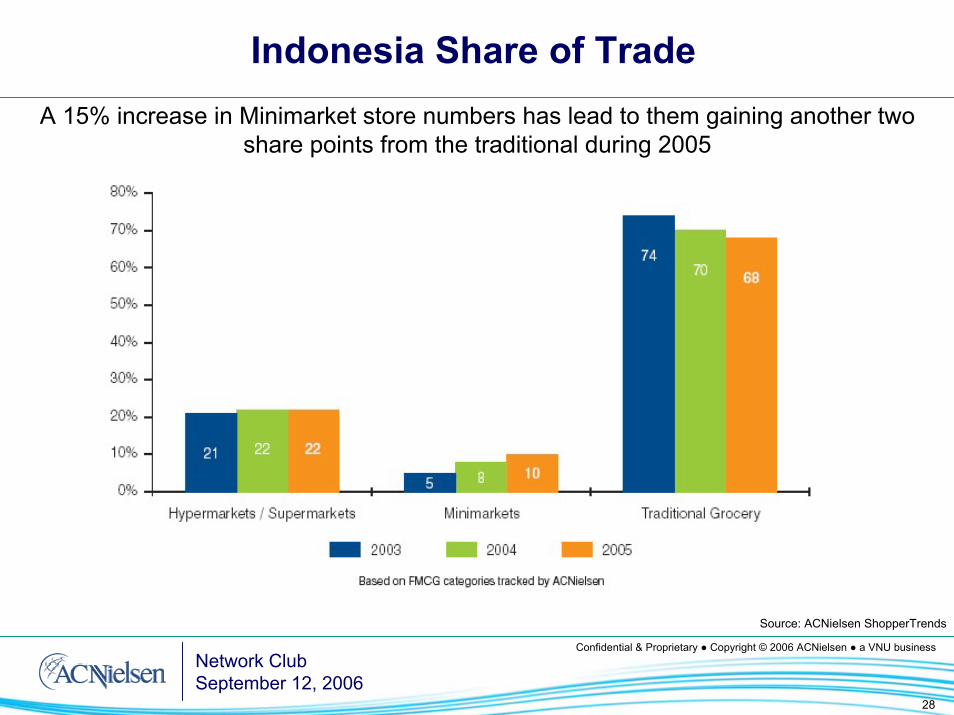
Indonesia Share of TradeA 15% increase in Minimarket store numbers has lead to them gaining another two
share points from the traditional during 2005
Source: ACNielsen ShopperTrends
29
Confidential & Proprietary ● Copyright © 2006 ACNielsen ● a VNU businessNetwork ClubSeptember 12, 2006
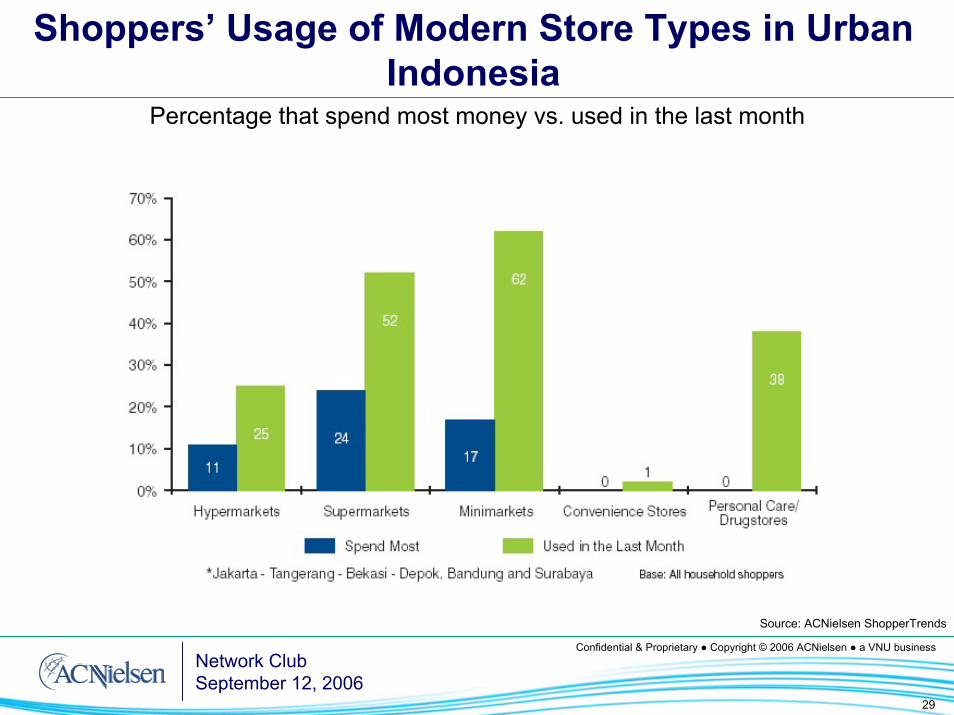
Shoppers’ Usage of Modern Store Types in Urban Indonesia
Percentage that spend most money vs. used in the last month
Source: ACNielsen ShopperTrends
30
Confidential & Proprietary ● Copyright © 2006 ACNielsen ● a VNU businessNetwork ClubSeptember 12, 2006
Retail Channels going forward
Hypermarket and minimarket will continue to lead growth
Supermarkets leverage thru assortment and differentiate thru unique items not available at otherstores, developing loyalty
Convenience operators will redefine themselves via foodservice as they lessen their dependence on cigarettes
Drugstores will develop packaged foods range
Retailers will define themselves more by the customers they service than by the products they sell
31
Confidential & Proprietary ● Copyright © 2006 ACNielsen ● a VNU businessNetwork ClubSeptember 12, 2006
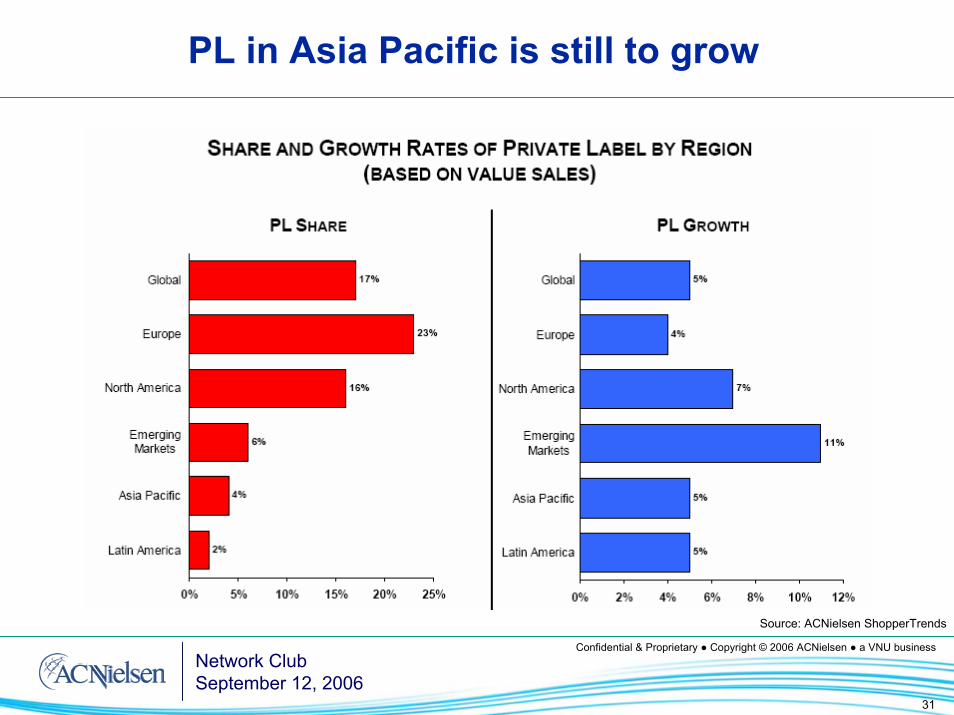
PL in Asia Pacific is still to grow
Source: ACNielsen ShopperTrends
32
Confidential & Proprietary ● Copyright © 2006 ACNielsen ● a VNU businessNetwork ClubSeptember 12, 2006
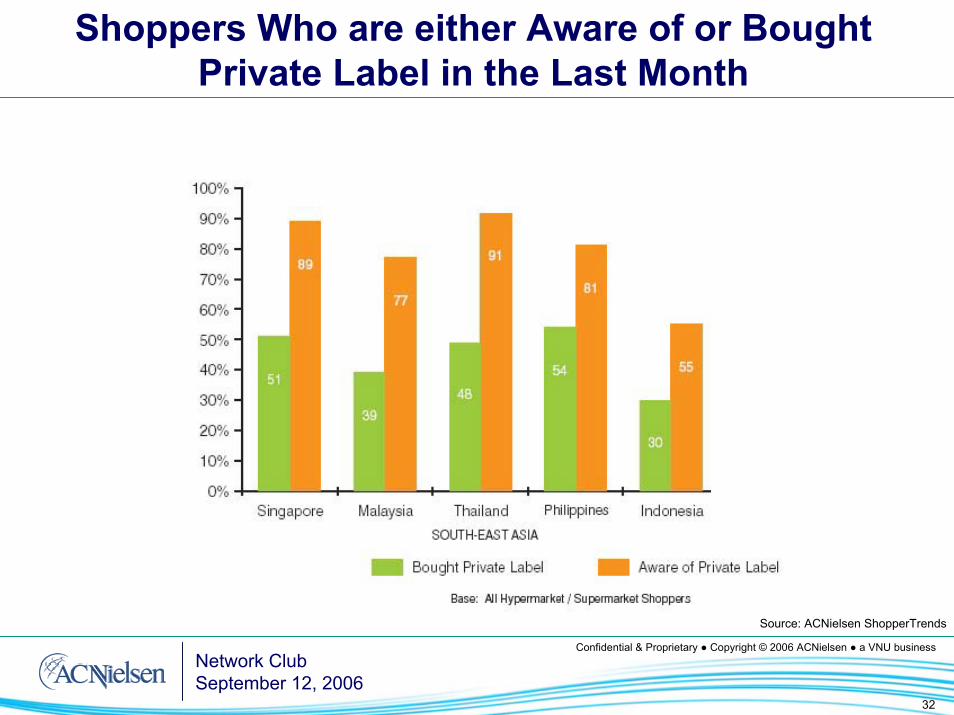
Shoppers Who are either Aware of or Bought Private Label in the Last Month
Source: ACNielsen ShopperTrends
33
Confidential & Proprietary ● Copyright © 2006 ACNielsen ● a VNU businessNetwork ClubSeptember 12, 2006
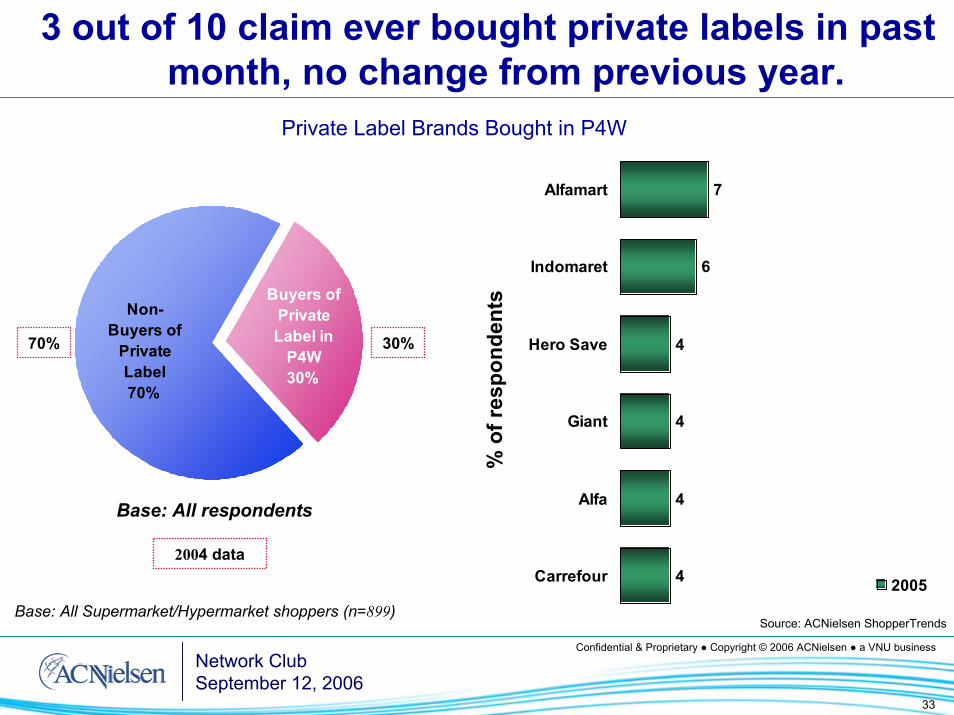
3 out of 10 claim ever bought private labels in past month, no change from previous year.
Private Label Brands Bought in P4W
7
6
4
4
4
4
Alfamart
Indomaret
Hero Save
Giant
Alfa
Carrefour 2005
Non-Buyers of
Private Label70%
Buyers of Private Label in
P4W30%
Base: All respondents%
of r
espo
nden
ts
Base: All Supermarket/Hypermarket shoppers (n=899)
2004 data
30%70%
Source: ACNielsen ShopperTrends
34
Confidential & Proprietary ● Copyright © 2006 ACNielsen ● a VNU businessNetwork ClubSeptember 12, 2006
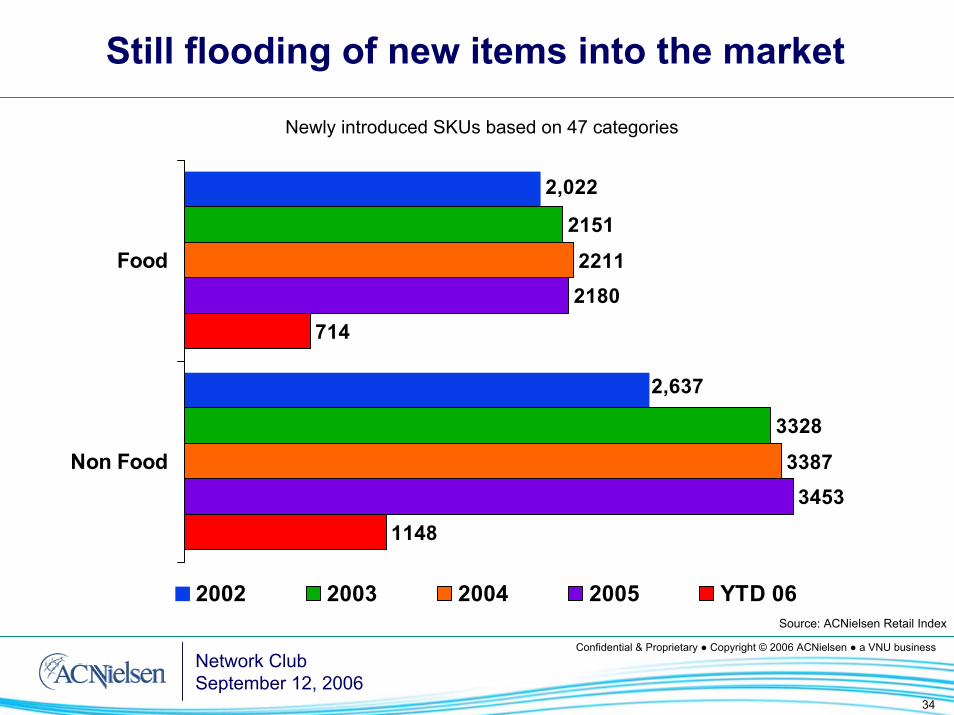
Still flooding of new items into the market
Newly introduced SKUs based on 47 categories
2151
3328
2211
3387
2180
3453
714
1148
2,637
2,022
Food
Non Food
2002 2003 2004 2005 YTD 06Source: ACNielsen Retail Index

The Media Scene
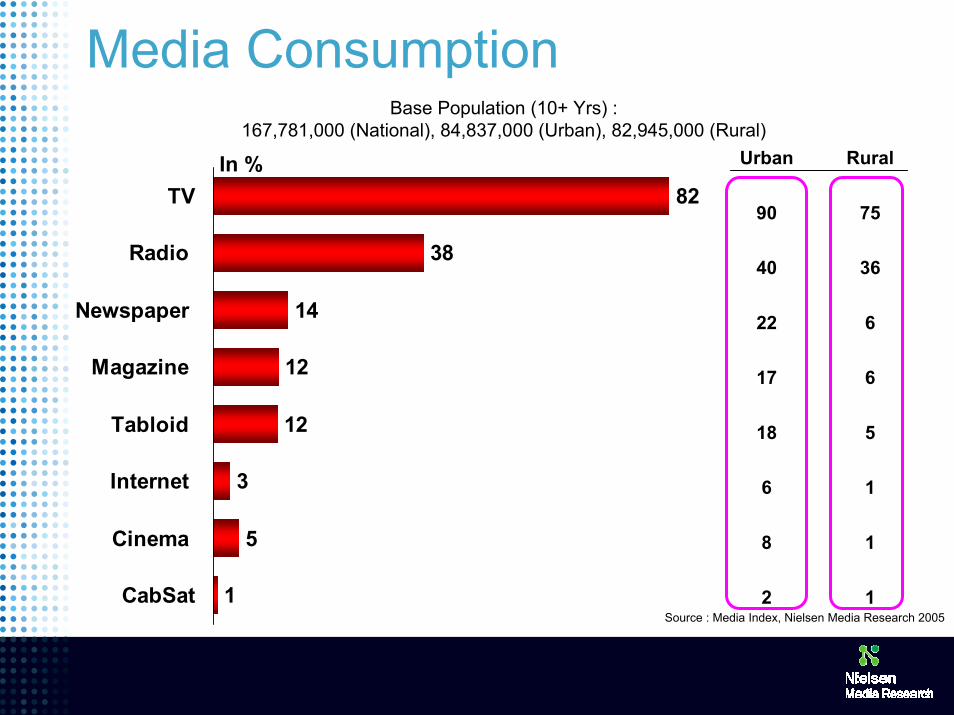
Media ConsumptionBase Population (10+ Yrs) :
167,781,000 (National), 84,837,000 (Urban), 82,945,000 (Rural)
1
5
3
12
12
14
38
82
CabSat
Cinema
Internet
Tabloid
Magazine
Newspaper
Radio
TVIn %
12
18
16
518
617
622
3640
7590
RuralUrban
Source : Media Index, Nielsen Media Research 2005
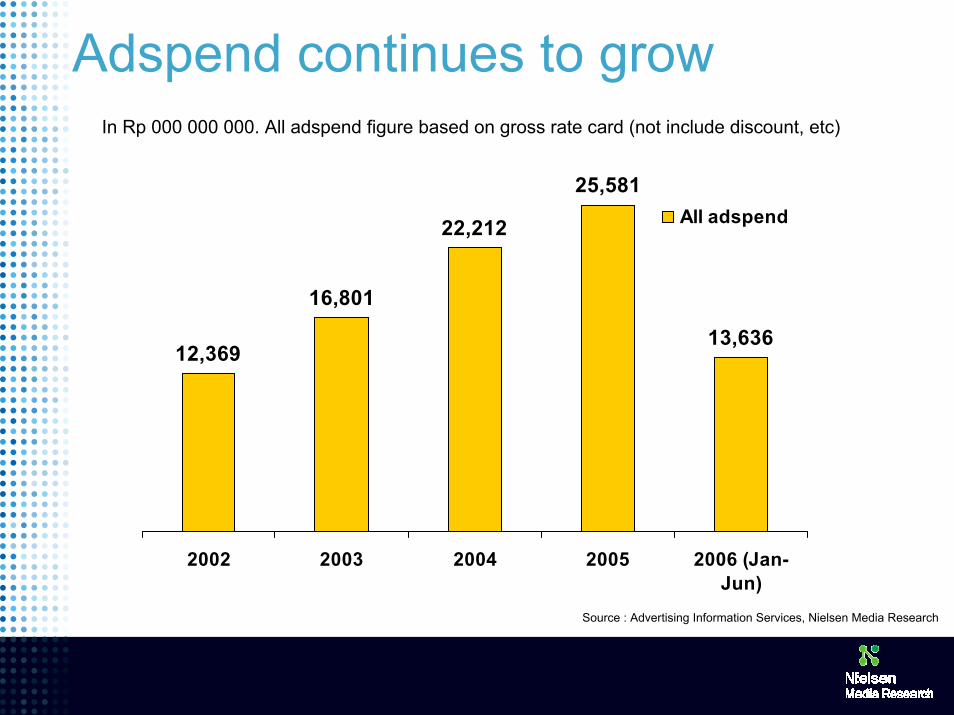
Adspend continues to grow
12,369
16,801
22,212
25,581
13,636
2002 2003 2004 2005 2006 (Jan-Jun)
All adspend
In Rp 000 000 000. All adspend figure based on gross rate card (not include discount, etc)
Source : Advertising Information Services, Nielsen Media Research
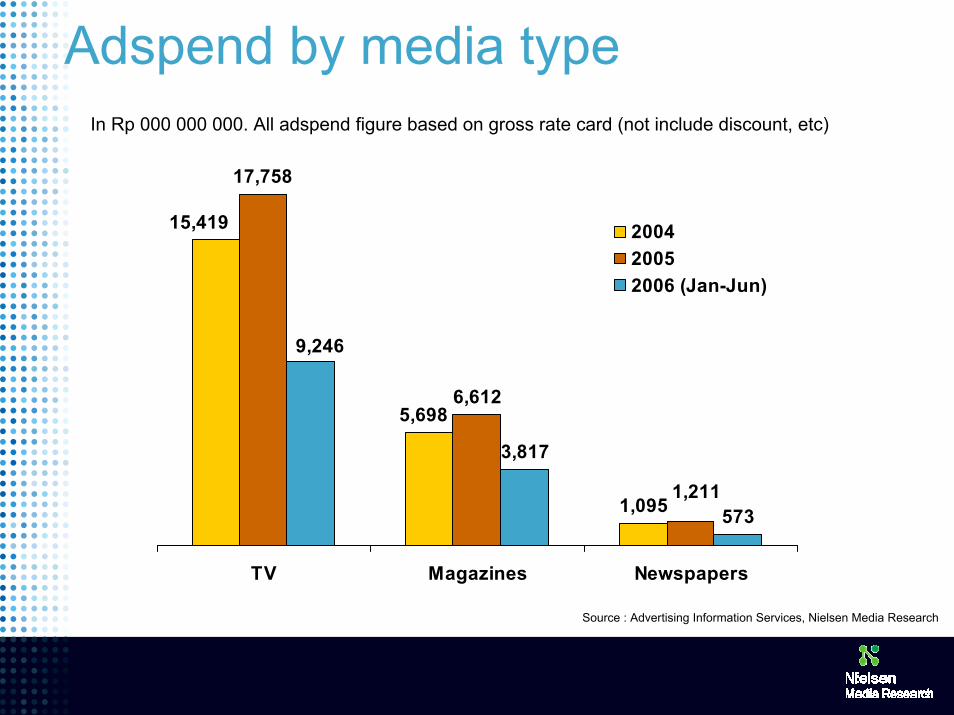
Adspend by media type
1,095
17,758
6,612
3,817
573
5,698
15,419
1,211
9,246
TV Magazines Newspapers
200420052006 (Jan-Jun)
In Rp 000 000 000. All adspend figure based on gross rate card (not include discount, etc)
Source : Advertising Information Services, Nielsen Media Research
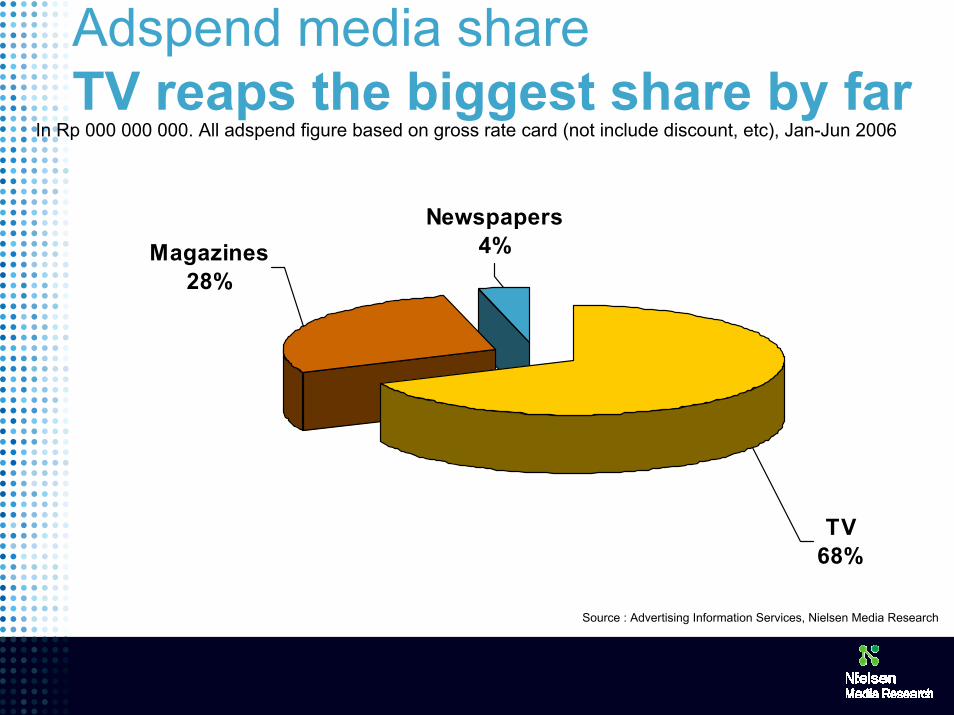
Adspend media shareTV reaps the biggest share by far
In Rp 000 000 000. All adspend figure based on gross rate card (not include discount, etc), Jan-Jun 2006
Newspapers4%Magazines
28%
TV68%
Source : Advertising Information Services, Nielsen Media Research
40
Confidential & Proprietary ● Copyright © 2006 ACNielsen ● a VNU businessNetwork ClubSeptember 12, 2006
Consumer Attitudes
41
Confidential & Proprietary ● Copyright © 2006 ACNielsen ● a VNU businessNetwork ClubSeptember 12, 2006
Survey Method
● Interviewed over 23,300 regular Internet users
● In 42 markets worldwide
● In Indonesia we estimate Internet use at 9%, among urban people.
● These results are not for the whole population, but rather for Internet users
● It is interesting to see how Internet users in Indonesia compare to those around the World
42
Confidential & Proprietary ● Copyright © 2006 ACNielsen ● a VNU businessNetwork ClubSeptember 12, 2006
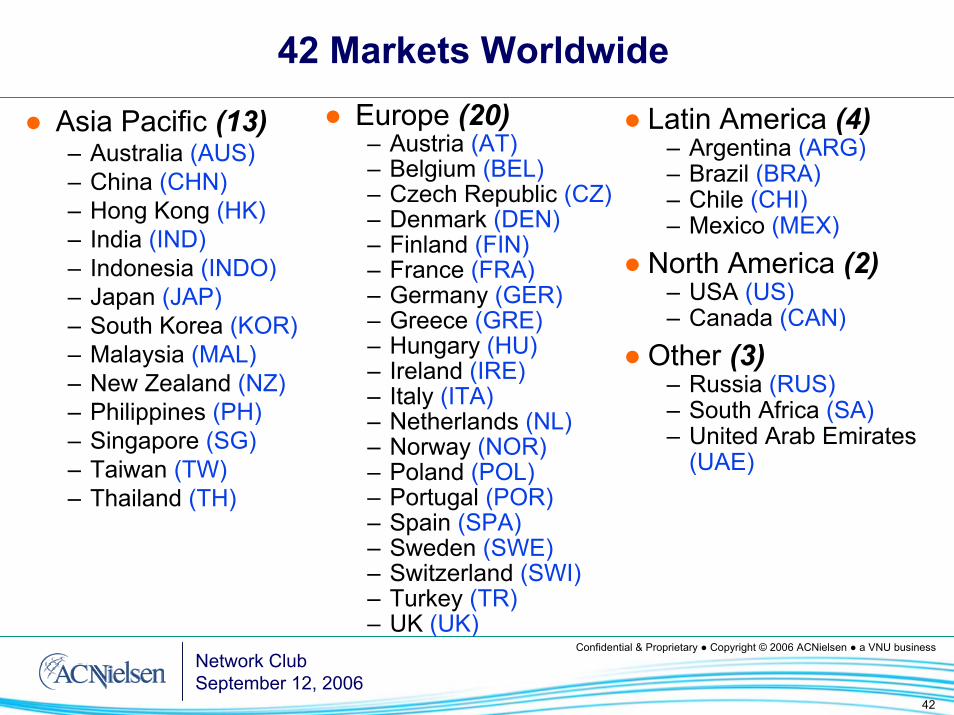
42 Markets Worldwide
● Asia Pacific (13)– Australia (AUS)– China (CHN)– Hong Kong (HK)– India (IND)– Indonesia (INDO)– Japan (JAP)– South Korea (KOR)– Malaysia (MAL)– New Zealand (NZ)– Philippines (PH)– Singapore (SG)– Taiwan (TW)– Thailand (TH)
● Europe (20)– Austria (AT)– Belgium (BEL)– Czech Republic (CZ)– Denmark (DEN)– Finland (FIN)– France (FRA)– Germany (GER)– Greece (GRE)– Hungary (HU)– Ireland (IRE)– Italy (ITA)– Netherlands (NL)– Norway (NOR)– Poland (POL)– Portugal (POR)– Spain (SPA)– Sweden (SWE)– Switzerland (SWI)– Turkey (TR)– UK (UK)
● Latin America (4)– Argentina (ARG)– Brazil (BRA)– Chile (CHI)– Mexico (MEX)
● North America (2)– USA (US)– Canada (CAN)
● Other (3)– Russia (RUS)– South Africa (SA)– United Arab Emirates
(UAE)
43
Confidential & Proprietary ● Copyright © 2006 ACNielsen ● a VNU businessNetwork ClubSeptember 12, 2006
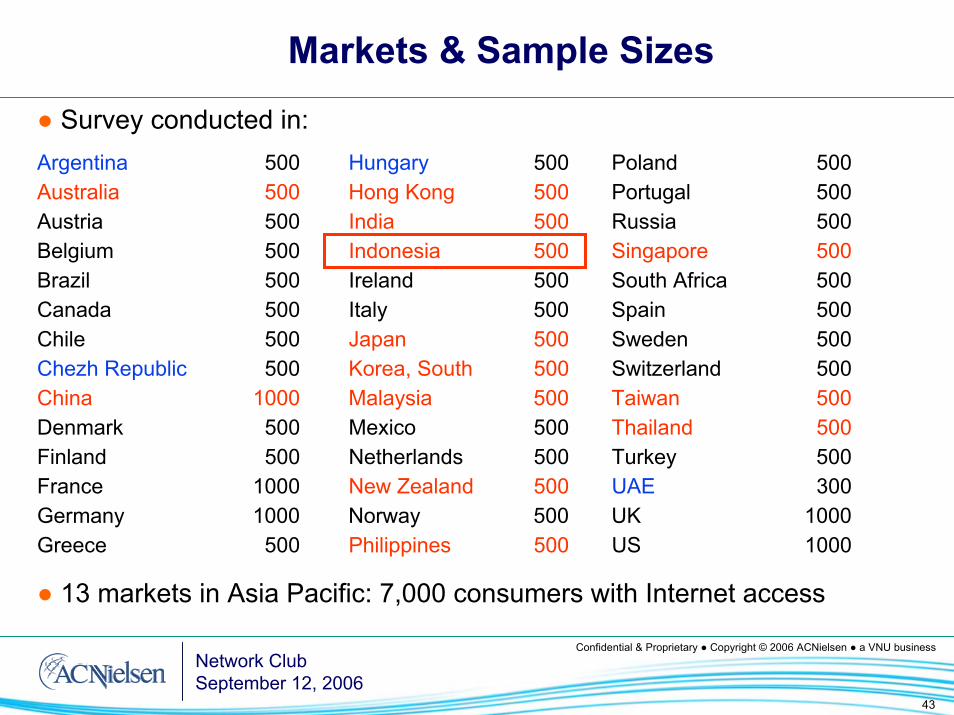
Markets & Sample Sizes
● Survey conducted in:Argentina 500 Hungary 500 Poland 500Australia 500 Hong Kong 500 Portugal 500Austria 500 India 500 Russia 500Belgium 500 Indonesia 500 Singapore 500Brazil 500 Ireland 500 South Africa 500Canada 500 Italy 500 Spain 500Chile 500 Japan 500 Sweden 500Chezh Republic 500 Korea, South 500 Switzerland 500China 1000 Malaysia 500 Taiwan 500Denmark 500 Mexico 500 Thailand 500Finland 500 Netherlands 500 Turkey 500France 1000 New Zealand 500 UAE 300Germany 1000 Norway 500 UK 1000Greece 500 Philippines 500 US 1000
● 13 markets in Asia Pacific: 7,000 consumers with Internet access
44Confidential & Proprietary ● Copyright © 2006 ACNielsen ● a VNU business
Fuel Prices Survey

45
Confidential & Proprietary ● Copyright © 2006 ACNielsen ● a VNU businessNetwork ClubSeptember 12, 2006
Survey Focus
● Do you have a vehicle for which you must buy fuel?
● Are the increases in the prices of fuel affecting you in any way?
● What impact, if any, has higher fuel prices had on your household’s habits?
● Interviewed over 23,500 regular Internet users
● In 42 markets worldwide
46
Confidential & Proprietary ● Copyright © 2006 ACNielsen ● a VNU businessNetwork ClubSeptember 12, 2006
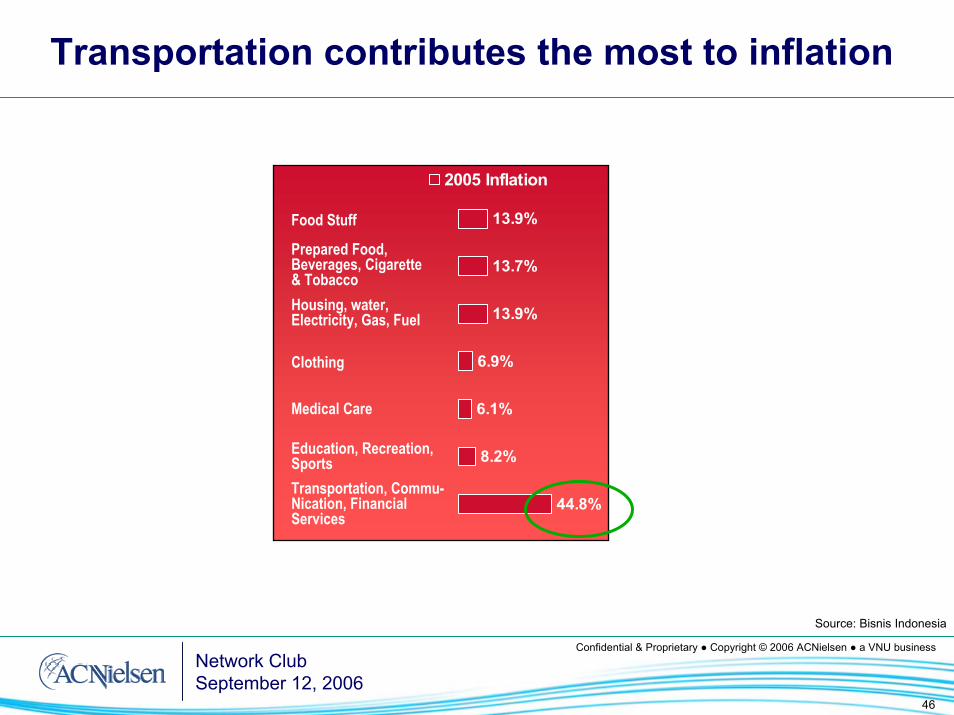
Transportation contributes the most to inflation
13.9%
13.7%
13.9%
6.9%
6.1%
8.2%
44.8%
2005 Inflation
Food Stuff
Transportation, Commu-Nication, Financial Services
Prepared Food, Beverages, Cigarette & TobaccoHousing, water,Electricity, Gas, Fuel
Clothing
Medical Care
Education, Recreation, Sports
Source: Bisnis Indonesia
47
Confidential & Proprietary ● Copyright © 2006 ACNielsen ● a VNU businessNetwork ClubSeptember 12, 2006
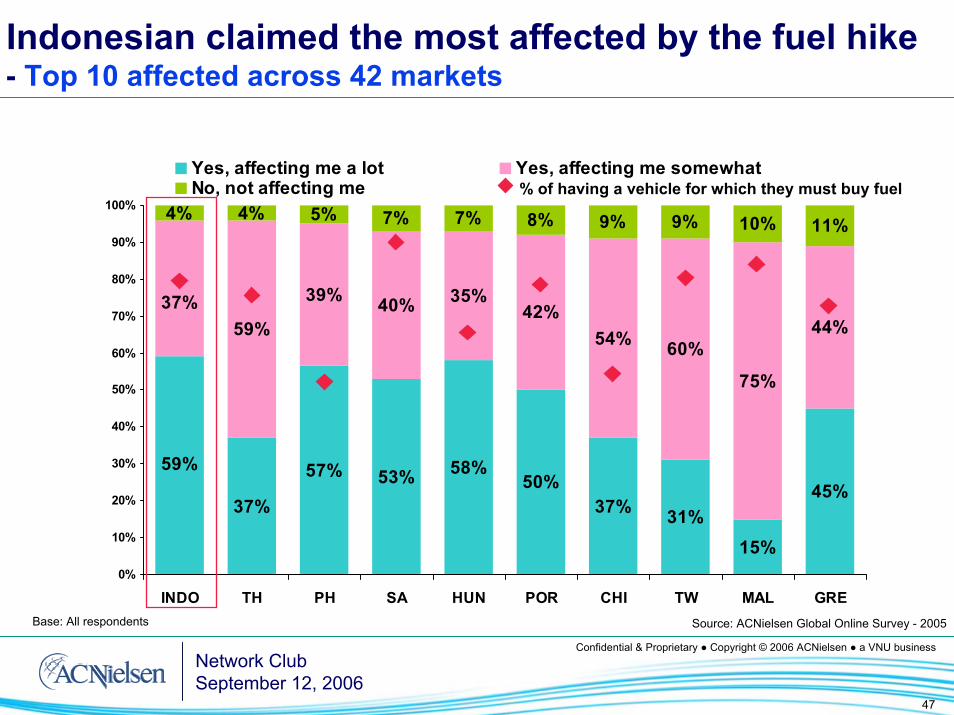
Indonesian claimed the most affected by the fuel hike- Top 10 affected across 42 markets
37%
57% 53% 58%50%
37% 31%15%
45%
59%
39% 40% 35%42%
54% 60%
75%
44%
4% 4% 5% 7% 7% 8% 9% 9% 10% 11%
59%
37%
0%
10%
20%
30%
40%
50%
60%
70%
80%
90%
100%
INDO TH PH SA HUN POR CHI TW MAL GRE
Yes, affecting me a lot Yes, affecting me somewhatNo, not affecting me
Base: All respondents
% of having a vehicle for which they must buy fuel
Source: ACNielsen Global Online Survey - 2005
48
Confidential & Proprietary ● Copyright © 2006 ACNielsen ● a VNU businessNetwork ClubSeptember 12, 2006
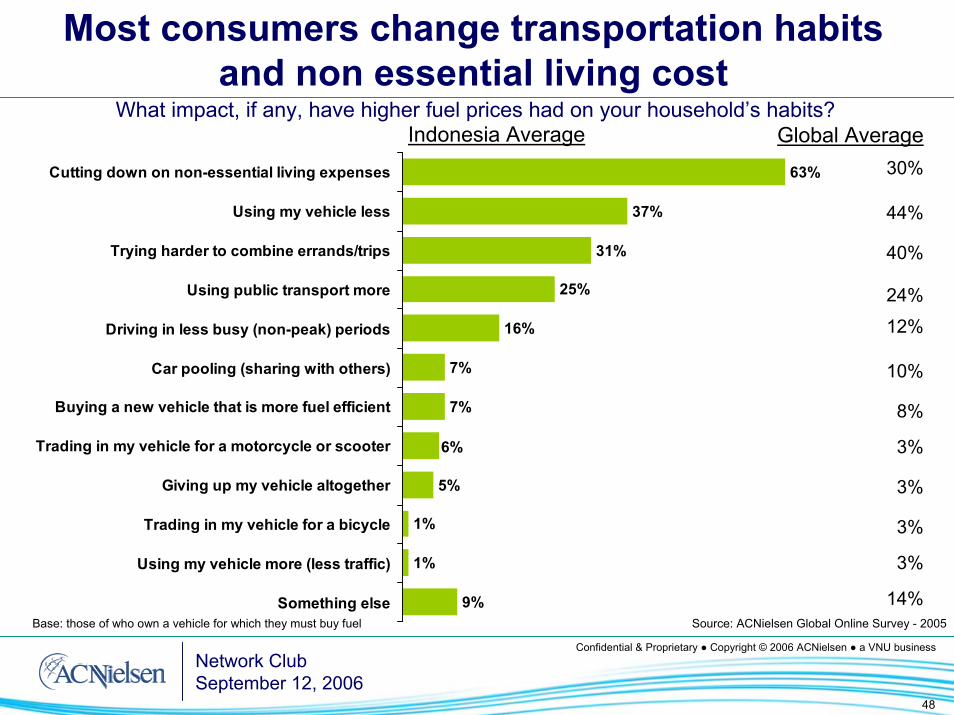
63%
37%
31%
25%
16%
7%
7%
5%
1%
1%
9%
6%
Cutting down on non-essential living expenses
Using my vehicle less
Trying harder to combine errands/trips
Using public transport more
Driving in less busy (non-peak) periods
Car pooling (sharing with others)
Buying a new vehicle that is more fuel efficient
Trading in my vehicle for a motorcycle or scooter
Giving up my vehicle altogether
Trading in my vehicle for a bicycle
Using my vehicle more (less traffic)
Something elseBase: those of who own a vehicle for which they must buy fuel
Most consumers change transportation habits and non essential living cost
What impact, if any, have higher fuel prices had on your household’s habits?
Source: ACNielsen Global Online Survey - 2005
Global Average30%
44%
40%
24%
12%
10%
8%
3%
3%
3%
3%
14%
Indonesia Average
49Confidential & Proprietary ● Copyright © 2006 ACNielsen ● a VNU business
When Money Gets Tight
50
Confidential & Proprietary ● Copyright © 2006 ACNielsen ● a VNU businessNetwork ClubSeptember 12, 2006
Survey Focus
● At times when the cost of living is rising rapidly, what actions do you take in order to stay within your budget?
51
Confidential & Proprietary ● Copyright © 2006 ACNielsen ● a VNU businessNetwork ClubSeptember 12, 2006
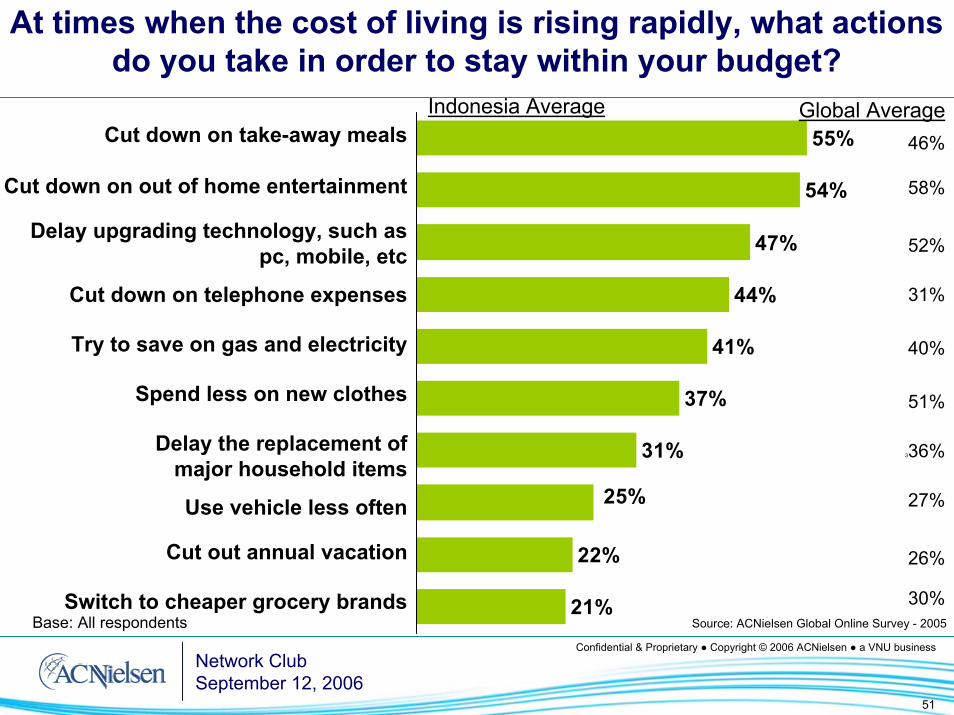
At times when the cost of living is rising rapidly, what actionsdo you take in order to stay within your budget?
55%
54%
47%
44%
41%
37%
31%
22%
21%
25%
Base: All respondents
Cut down on take-away meals
Cut down on out of home entertainment
Delay upgrading technology, such as pc, mobile, etc
Cut down on telephone expenses
Try to save on gas and electricity
Spend less on new clothes
Delay the replacement of major household items
Use vehicle less often
Cut out annual vacation
Switch to cheaper grocery brandsSource: ACNielsen Global Online Survey - 2005
Global Average46%
58%
52%
31%
40%
51%
336%
27%
26%
30%
Indonesia Average
52Confidential & Proprietary ● Copyright © 2006 ACNielsen ● a VNU business
Consumers and Employment
53
Confidential & Proprietary ● Copyright © 2006 ACNielsen ● a VNU businessNetwork ClubSeptember 12, 2006
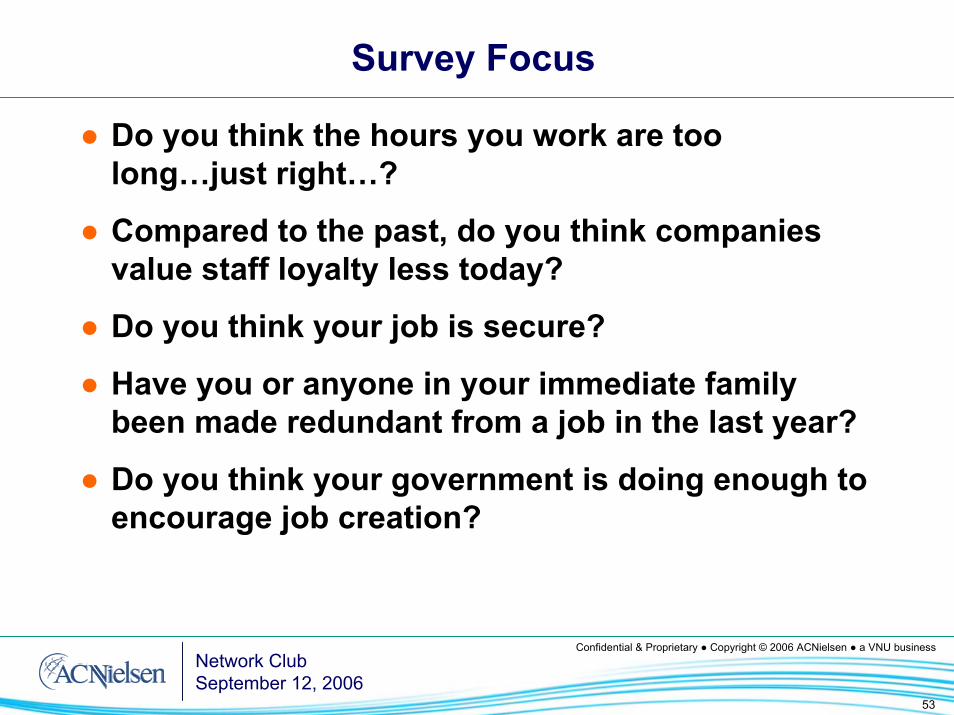
Survey Focus
● Do you think the hours you work are too long…just right…?
● Compared to the past, do you think companies value staff loyalty less today?
● Do you think your job is secure?
● Have you or anyone in your immediate family been made redundant from a job in the last year?
● Do you think your government is doing enough to encourage job creation?
54
Confidential & Proprietary ● Copyright © 2006 ACNielsen ● a VNU businessNetwork ClubSeptember 12, 2006
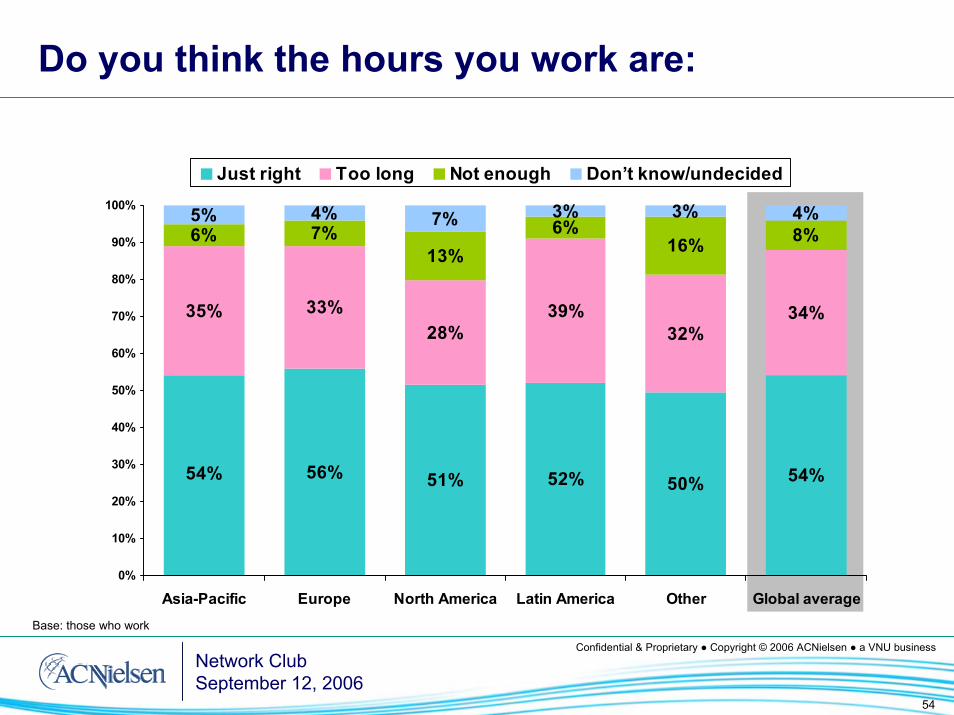
Do you think the hours you work are:
56% 51% 52% 50% 54%
35% 33%28%
39%32%
34%
6% 7%13%
6%16% 8%
5% 4% 7% 3% 3% 4%
54%
0%
10%
20%
30%
40%
50%
60%
70%
80%
90%
100%
Asia-Pacific Europe North America Latin America Other Global average
Just right Too long Not enough Don’t know/undecided
Base: those who work
55
Confidential & Proprietary ● Copyright © 2006 ACNielsen ● a VNU businessNetwork ClubSeptember 12, 2006
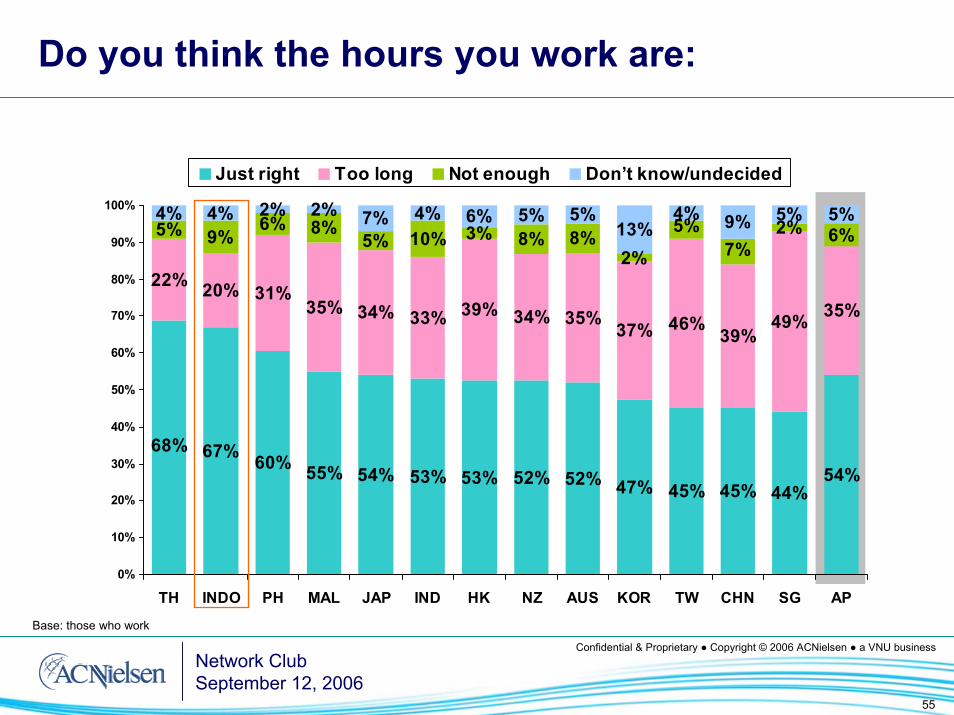
Do you think the hours you work are:
67% 60% 55% 54% 53% 53% 52% 52% 47% 45% 45% 44%54%
22% 20% 31%35% 34% 33% 39% 34% 35% 37% 46% 39%
49% 35%
5% 9%6% 8%
5% 10% 3% 8% 8%2%
2% 6%4% 4% 2% 2% 7% 4% 6% 5% 5%
13%4% 9% 5% 5%
68%
5%7%
0%
10%
20%
30%
40%
50%
60%
70%
80%
90%
100%
TH INDO PH MAL JAP IND HK NZ AUS KOR TW CHN SG AP
Just right Too long Not enough Don’t know/undecided
Base: those who work
56
Confidential & Proprietary ● Copyright © 2006 ACNielsen ● a VNU businessNetwork ClubSeptember 12, 2006
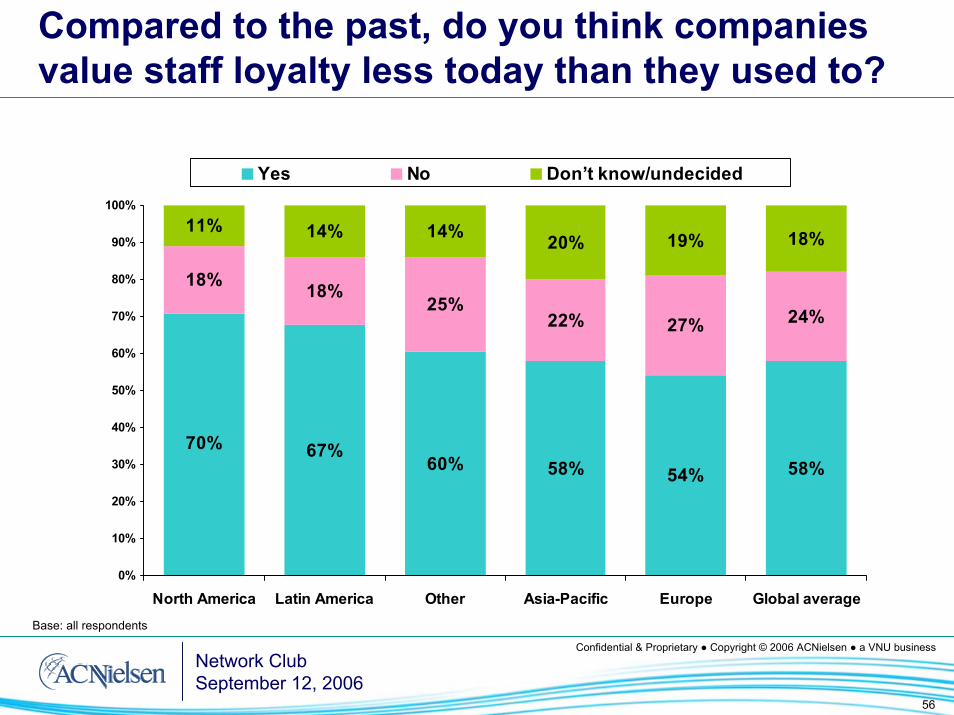
Compared to the past, do you think companies value staff loyalty less today than they used to?
67%60% 58% 54% 58%
18% 18%25%
22% 27% 24%
11% 14% 14% 20% 19% 18%
70%
0%
10%
20%
30%
40%
50%
60%
70%
80%
90%
100%
North America Latin America Other Asia-Pacific Europe Global average
Yes No Don’t know/undecided
Base: all respondents
57
Confidential & Proprietary ● Copyright © 2006 ACNielsen ● a VNU businessNetwork ClubSeptember 12, 2006
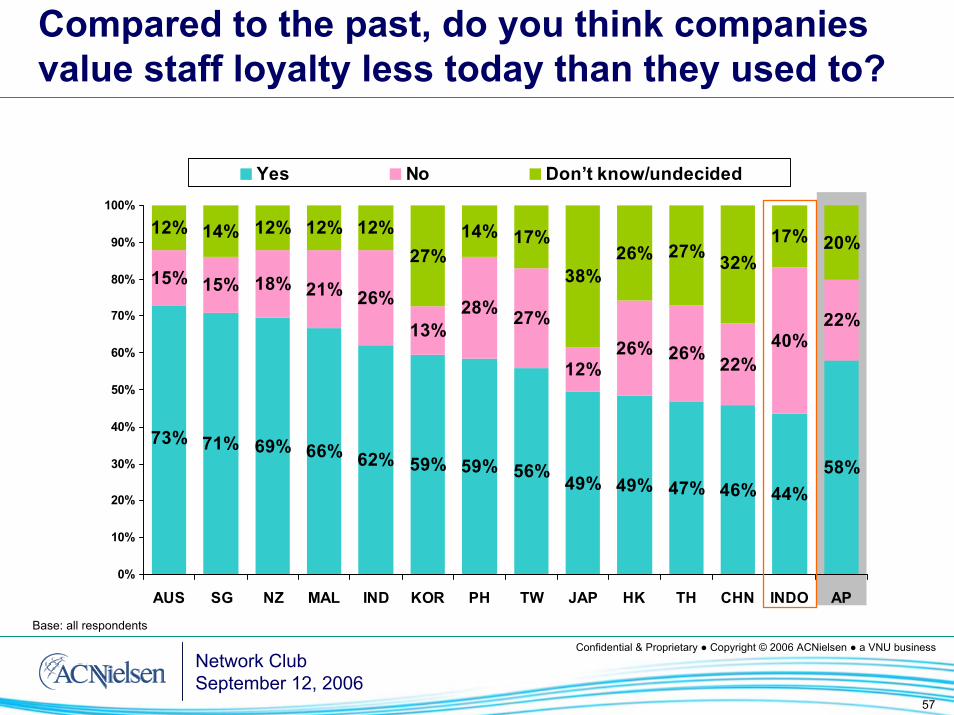
Compared to the past, do you think companies value staff loyalty less today than they used to?
71% 69% 66% 62% 59% 59% 56% 49% 49% 47% 46% 44%58%
15% 15% 18% 21% 26%
13%28% 27%
12%26% 26% 22%
40%22%
12% 14% 12% 12% 12%27%
14% 17%
38%26%
17% 20%
73%
27% 32%
0%
10%
20%
30%
40%
50%
60%
70%
80%
90%
100%
AUS SG NZ MAL IND KOR PH TW JAP HK TH CHN INDO AP
Yes No Don’t know/undecided
Base: all respondents
58
Confidential & Proprietary ● Copyright © 2006 ACNielsen ● a VNU businessNetwork ClubSeptember 12, 2006
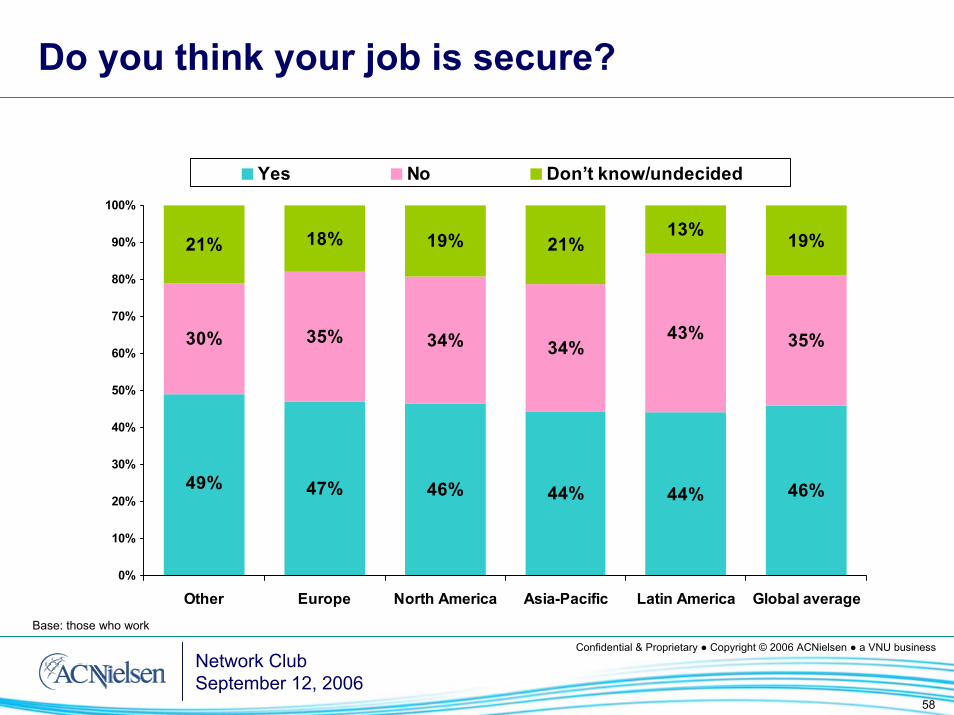
Do you think your job is secure?
47% 46% 44% 44% 46%
30% 35% 34% 34%43% 35%
21% 18% 19% 21%13% 19%
49%
0%
10%
20%
30%
40%
50%
60%
70%
80%
90%
100%
Other Europe North America Asia-Pacific Latin America Global average
Yes No Don’t know/undecided
Base: those who work
59
Confidential & Proprietary ● Copyright © 2006 ACNielsen ● a VNU businessNetwork ClubSeptember 12, 2006
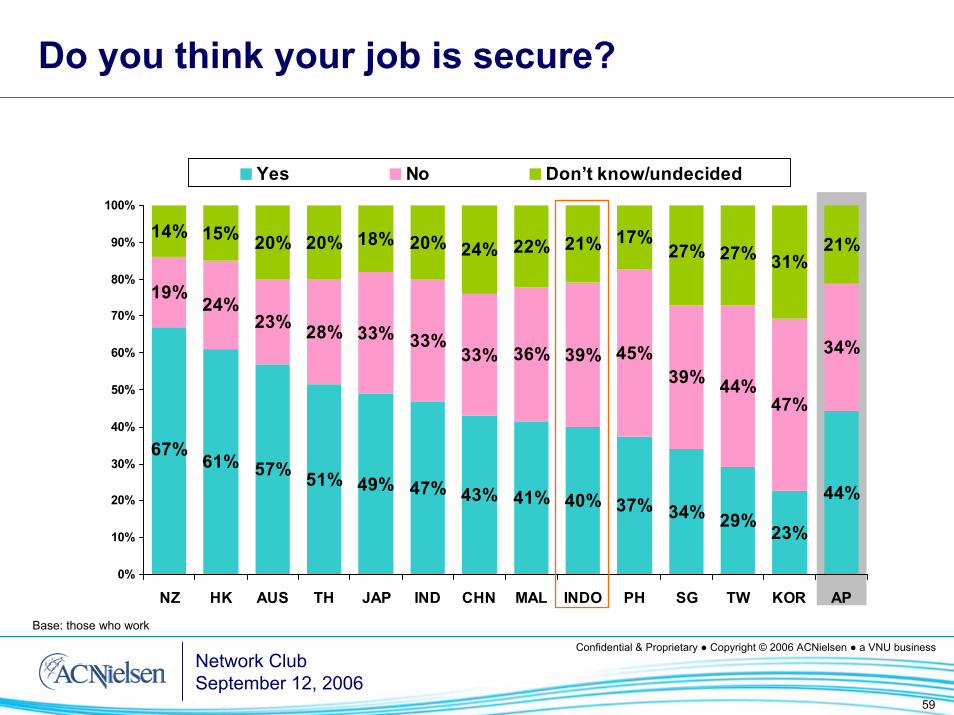
Do you think your job is secure?
61% 57% 51% 49% 47% 43% 41% 40% 37% 34% 29% 23%
44%
19% 24%23% 28% 33% 33%
33% 36% 39% 45%39% 44%
47%
34%
14% 15% 20% 20% 18% 20% 24% 22% 21% 17%31%
21%
67%
27% 27%
0%
10%
20%
30%
40%
50%
60%
70%
80%
90%
100%
NZ HK AUS TH JAP IND CHN MAL INDO PH SG TW KOR AP
Yes No Don’t know/undecided
Base: those who work
60
Confidential & Proprietary ● Copyright © 2006 ACNielsen ● a VNU businessNetwork ClubSeptember 12, 2006
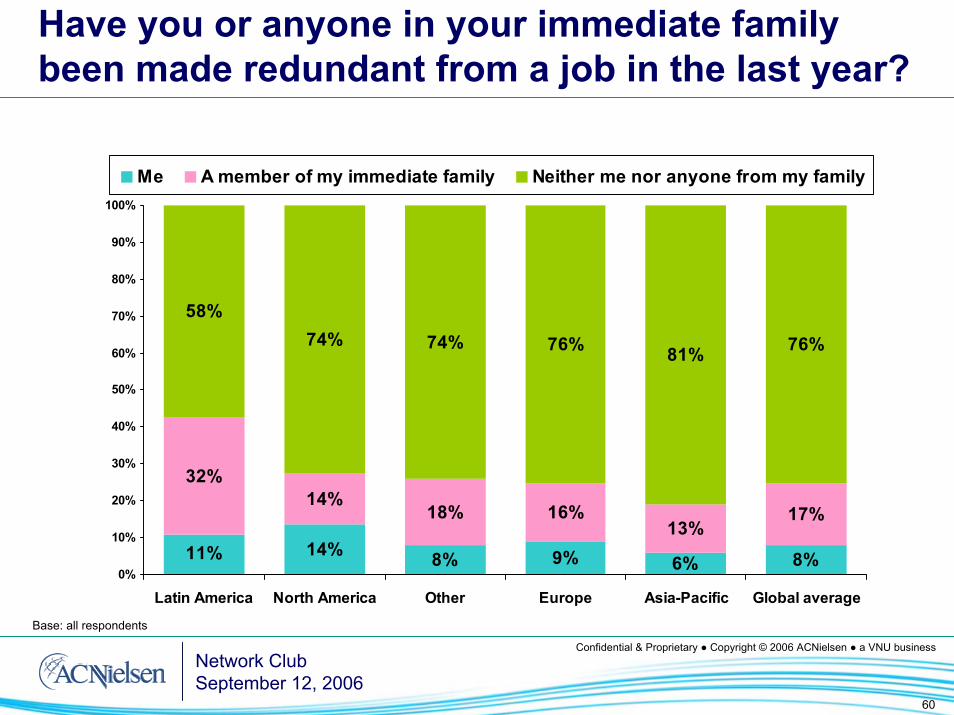
Have you or anyone in your immediate family been made redundant from a job in the last year?
14% 8% 9% 6% 8%
32%14%
18% 16%13%
17%
58%74% 74% 76% 81% 76%
11%0%
10%
20%
30%
40%
50%
60%
70%
80%
90%
100%
Latin America North America Other Europe Asia-Pacific Global average
Me A member of my immediate family Neither me nor anyone from my family
Base: all respondents
61
Confidential & Proprietary ● Copyright © 2006 ACNielsen ● a VNU businessNetwork ClubSeptember 12, 2006
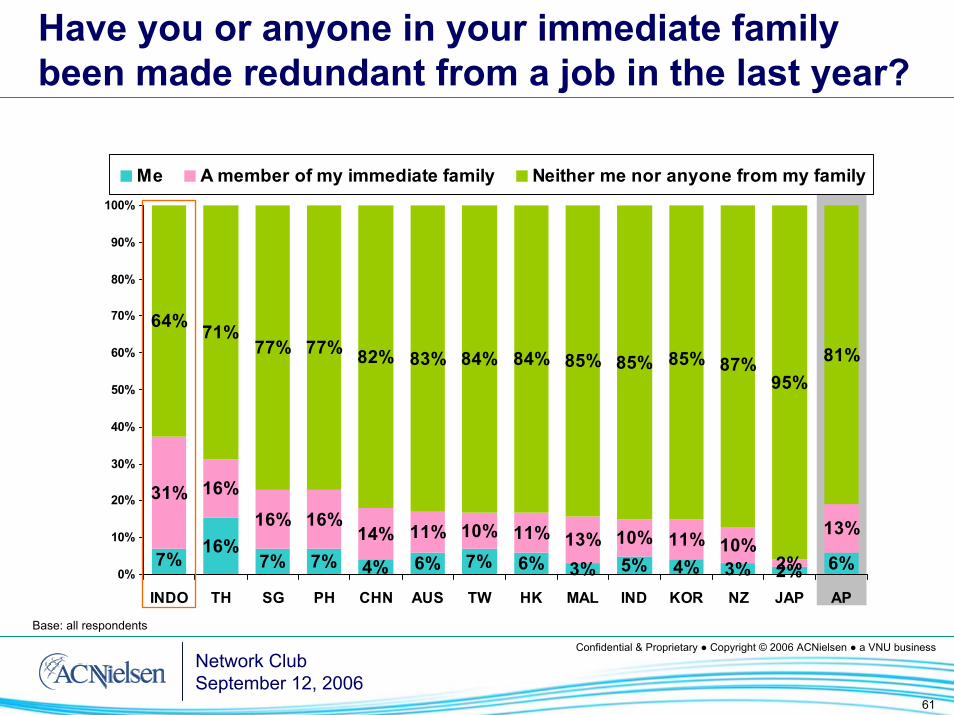
Have you or anyone in your immediate family been made redundant from a job in the last year?
16%7% 7% 4% 6% 7% 6% 3% 5% 4% 3% 2% 6%
31% 16%
16% 16%14% 11% 10% 11% 13% 10% 11% 10%
2%
13%
64% 71%77% 77% 82% 83% 84% 84% 85% 85%
95%81%
7%
85% 87%
0%
10%
20%
30%
40%
50%
60%
70%
80%
90%
100%
INDO TH SG PH CHN AUS TW HK MAL IND KOR NZ JAP AP
Me A member of my immediate family Neither me nor anyone from my family
Base: all respondents
62Confidential & Proprietary ● Copyright © 2006 ACNielsen ● a VNU business
Consumers and Designer Brands
63
Confidential & Proprietary ● Copyright © 2006 ACNielsen ● a VNU businessNetwork ClubSeptember 12, 2006
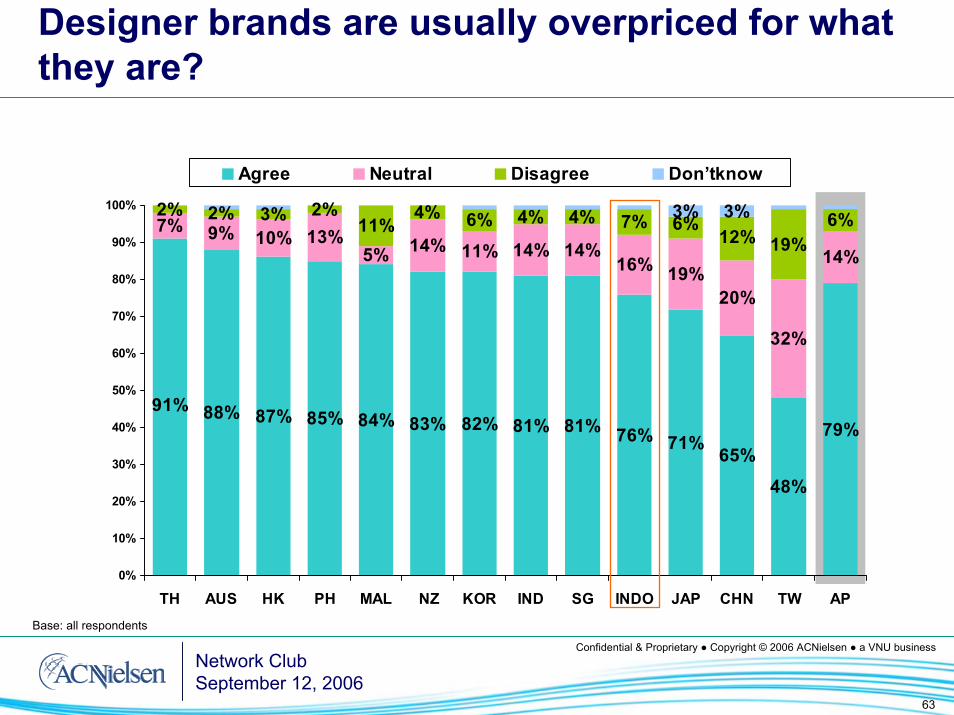
Designer brands are usually overpriced for what they are?
88% 87% 85% 84% 83% 82% 81% 81% 76% 71% 65%
48%
79%
7% 9% 10% 13%5% 14% 11% 14% 14%
16% 19%20%
32%
14%
2% 2% 3% 2%11%
4% 6% 4% 4% 7%19%
6%3% 3%
91%
6%12%
0%
10%
20%
30%
40%
50%
60%
70%
80%
90%
100%
TH AUS HK PH MAL NZ KOR IND SG INDO JAP CHN TW AP
Agree Neutral Disagree Don’tknow
Base: all respondents
64
Confidential & Proprietary ● Copyright © 2006 ACNielsen ● a VNU businessNetwork ClubSeptember 12, 2006
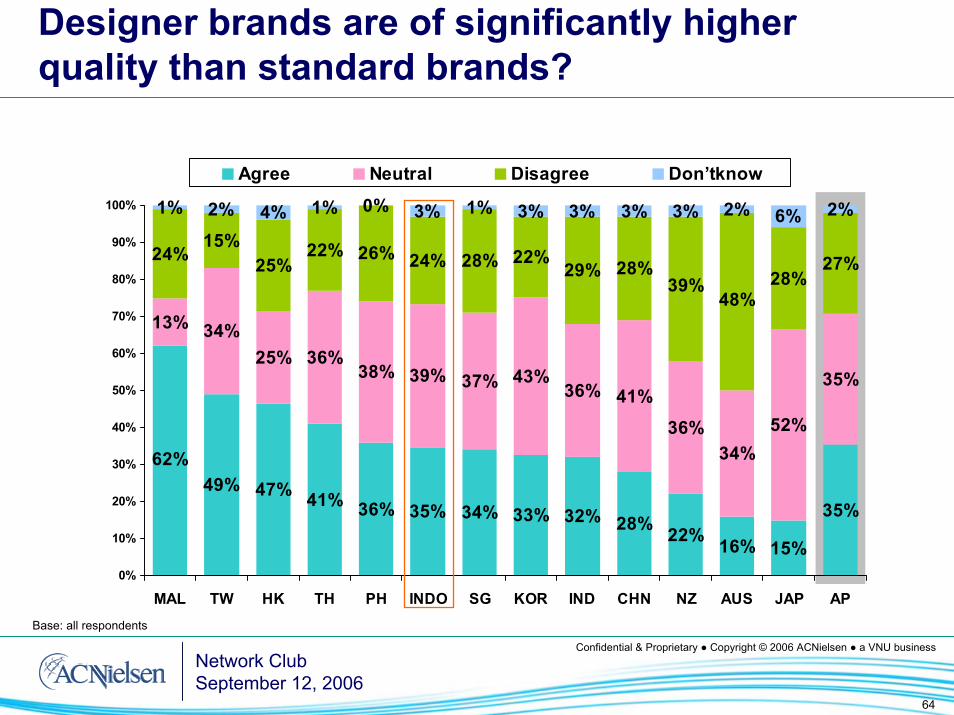
Designer brands are of significantly higher quality than standard brands?
49% 47% 41% 36% 35% 34% 33% 32% 28% 22% 16% 15%
35%
13% 34%25% 36%
38% 39% 37% 43%36% 41%
36%34%
52%
35%
24%15%
25%22% 26% 24% 28% 22%
29% 28% 28%27%
3% 2%
62%
39%48%
6% 2%3%1% 3% 3%4% 3%0%1%2%1%
0%
10%
20%
30%
40%
50%
60%
70%
80%
90%
100%
MAL TW HK TH PH INDO SG KOR IND CHN NZ AUS JAP AP
Agree Neutral Disagree Don’tknow
Base: all respondents
65
Confidential & Proprietary ● Copyright © 2006 ACNielsen ● a VNU businessNetwork ClubSeptember 12, 2006
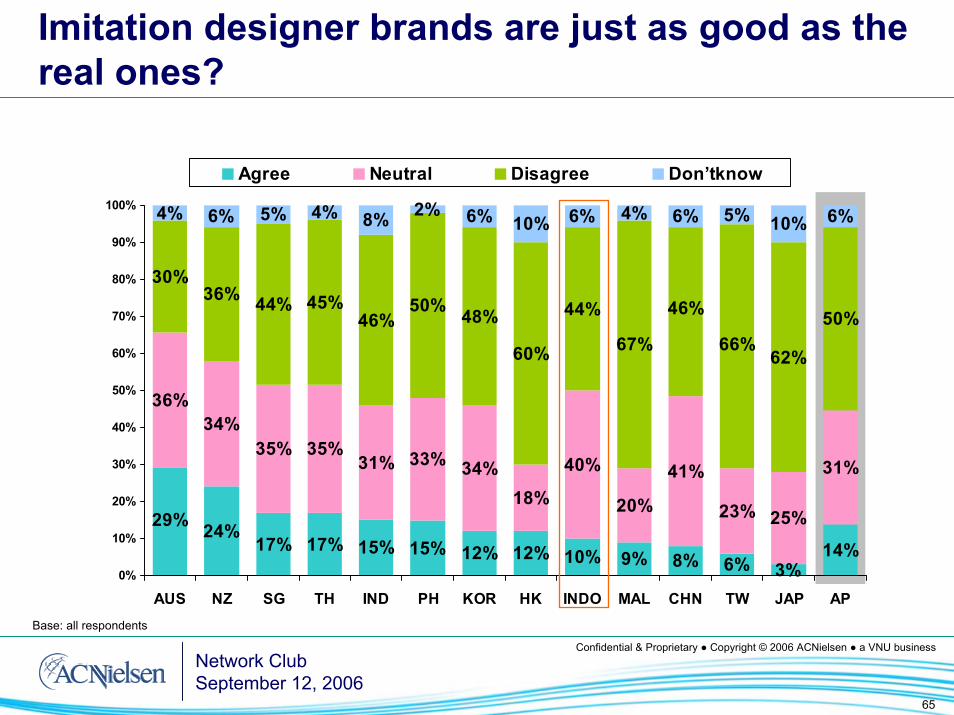
Imitation designer brands are just as good as the real ones?
24%17% 17% 15% 15% 12% 12% 10% 9% 8% 6% 3%
14%
36%34%
35% 35%31% 33% 34%
18%
40%
20%
41%
23% 25%
31%
30%36% 44% 45%
46%50% 48%
60%
44%
67%62%
50%
6% 5%
29%
46%
66%
10% 6%4%6% 10% 6%5% 2%8%4%6%4%
0%
10%
20%
30%
40%
50%
60%
70%
80%
90%
100%
AUS NZ SG TH IND PH KOR HK INDO MAL CHN TW JAP AP
Agree Neutral Disagree Don’tknow
Base: all respondents
66
Confidential & Proprietary ● Copyright © 2006 ACNielsen ● a VNU businessNetwork ClubSeptember 12, 2006
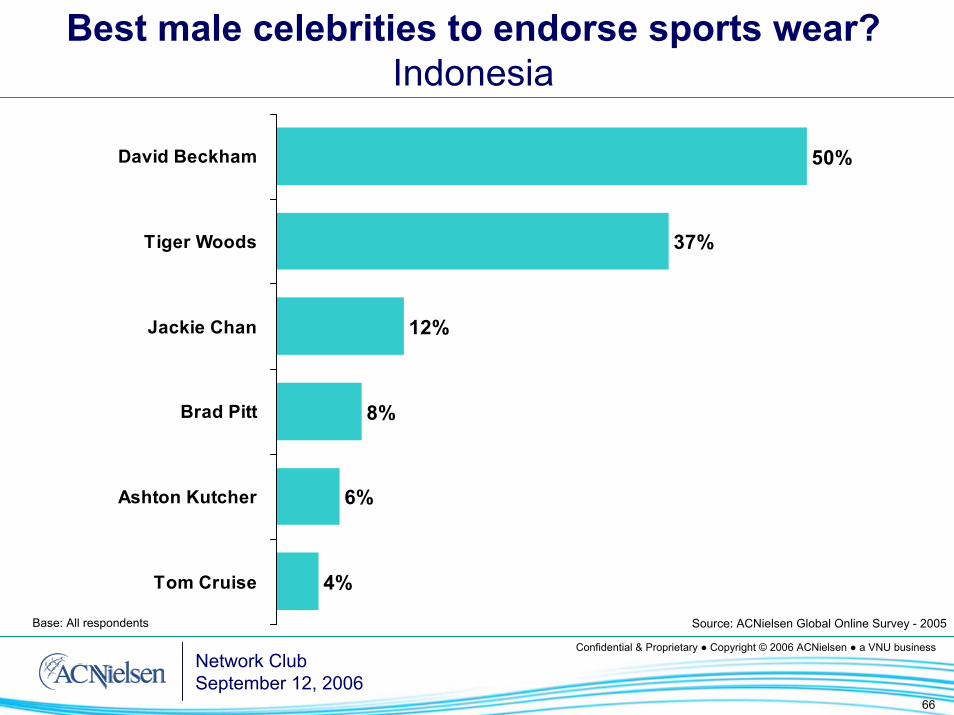
Best male celebrities to endorse sports wear?Indonesia
50%
37%
12%
8%
6%
4%
David Beckham
Tiger Woods
Jackie Chan
Brad Pitt
Ashton Kutcher
Tom Cruise
Base: All respondents Source: ACNielsen Global Online Survey - 2005
67
Confidential & Proprietary ● Copyright © 2006 ACNielsen ● a VNU businessNetwork ClubSeptember 12, 2006
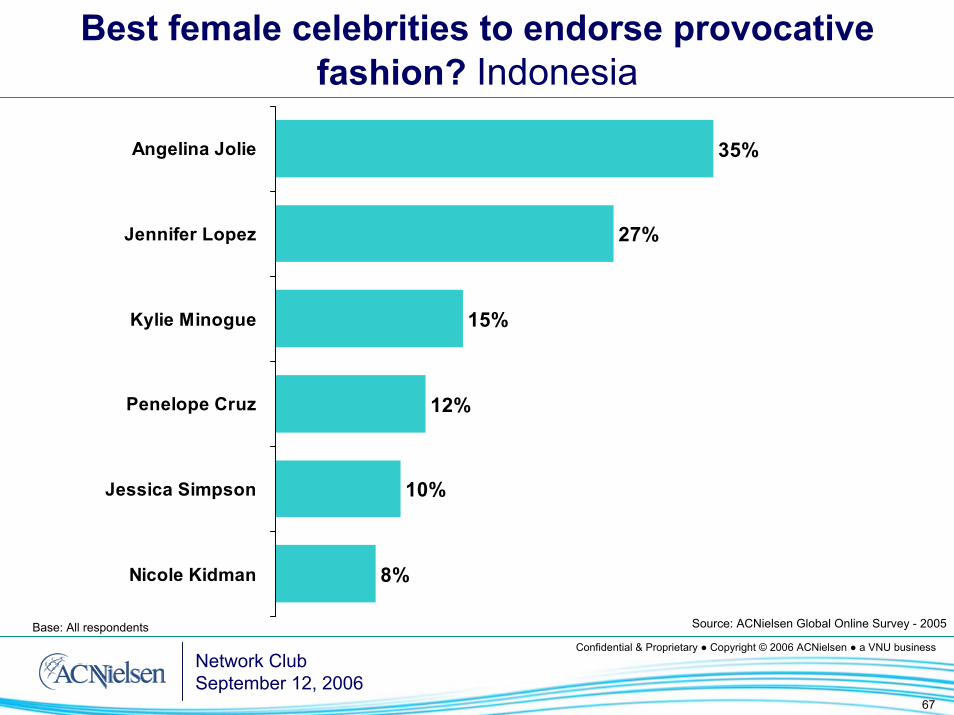
Best female celebrities to endorse provocative fashion? Indonesia
35%
27%
15%
12%
10%
8%
Angelina Jolie
Jennifer Lopez
Kylie Minogue
Penelope Cruz
Jessica Simpson
Nicole Kidman
Base: All respondents Source: ACNielsen Global Online Survey - 2005
68
Confidential & Proprietary ● Copyright © 2006 ACNielsen ● a VNU businessNetwork ClubSeptember 12, 2006
And now for something completely different
69Confidential & Proprietary ● Copyright © 2006 ACNielsen ● a VNU business
ACNielsen IndonesiaWorld Cup Survey
Which team do people want to win?Which player is the favorite?Amongst 300 Jakarta respondents
June 2006
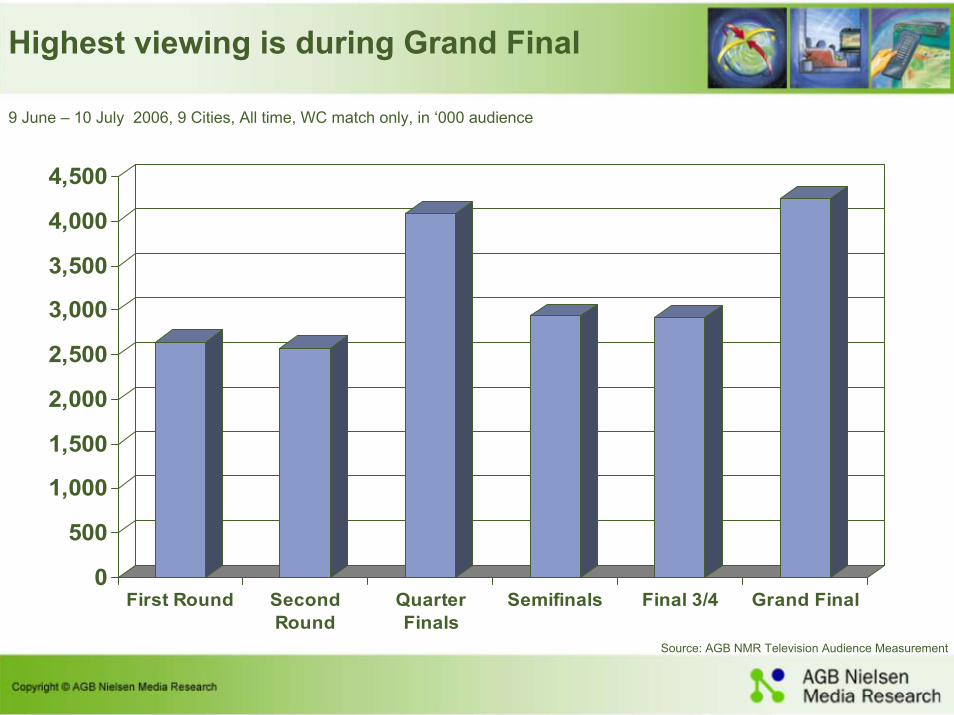
Highest viewing is during Grand Final
9 June – 10 July 2006, 9 Cities, All time, WC match only, in ‘000 audience
0
500
1,000
1,500
2,000
2,500
3,000
3,500
4,000
4,500
First Round SecondRound
QuarterFinals
Semifinals Final 3/4 Grand Final
Source: AGB NMR Television Audience Measurement
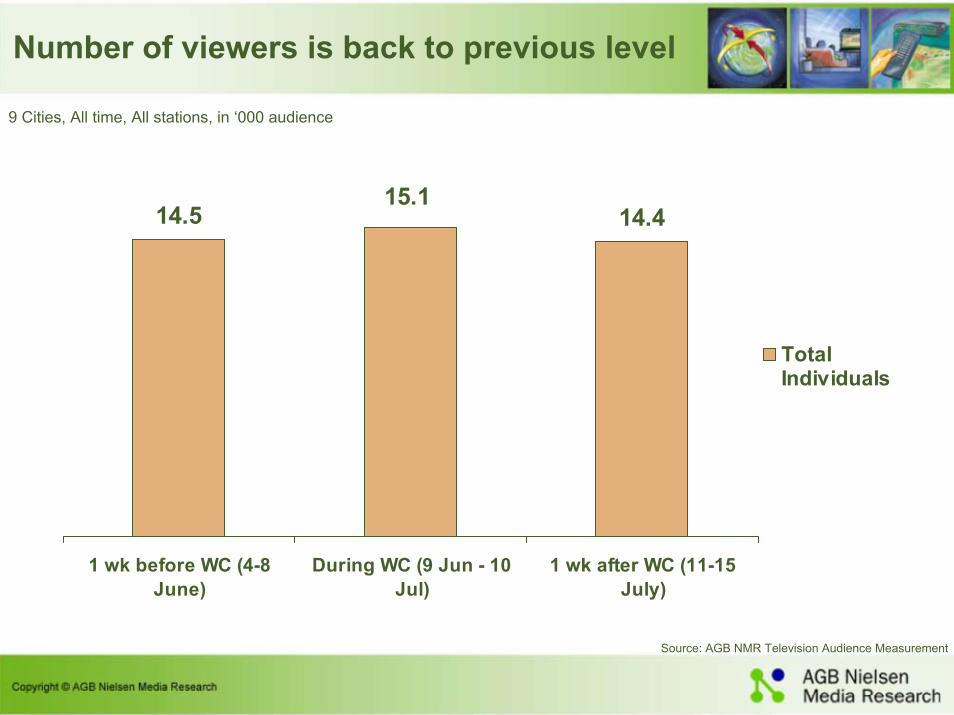
Number of viewers is back to previous level
9 Cities, All time, All stations, in ‘000 audience
14.5 14.415.1
1 wk before WC (4-8June)
During WC (9 Jun - 10Jul)
1 wk after WC (11-15July)
TotalIndividuals
Source: AGB NMR Television Audience Measurement
72
Confidential & Proprietary ● Copyright © 2006 ACNielsen ● a VNU businessNetwork ClubSeptember 12, 2006
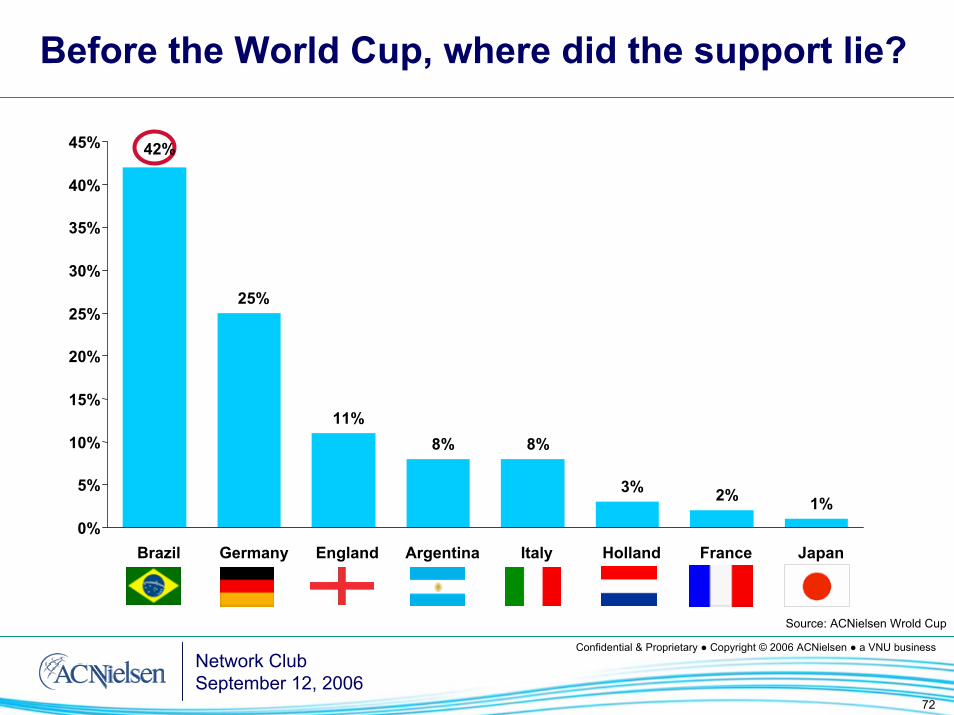
Before the World Cup, where did the support lie?
42%45%
40%
35%
30%25%
25%
20%
15%11%
8% 8%10%
3%5% 2% 1%0%
Brazil Germany England Argentina Italy Holland France Japan
Source: ACNielsen Wrold Cup
73
Confidential & Proprietary ● Copyright © 2006 ACNielsen ● a VNU businessNetwork ClubSeptember 12, 2006
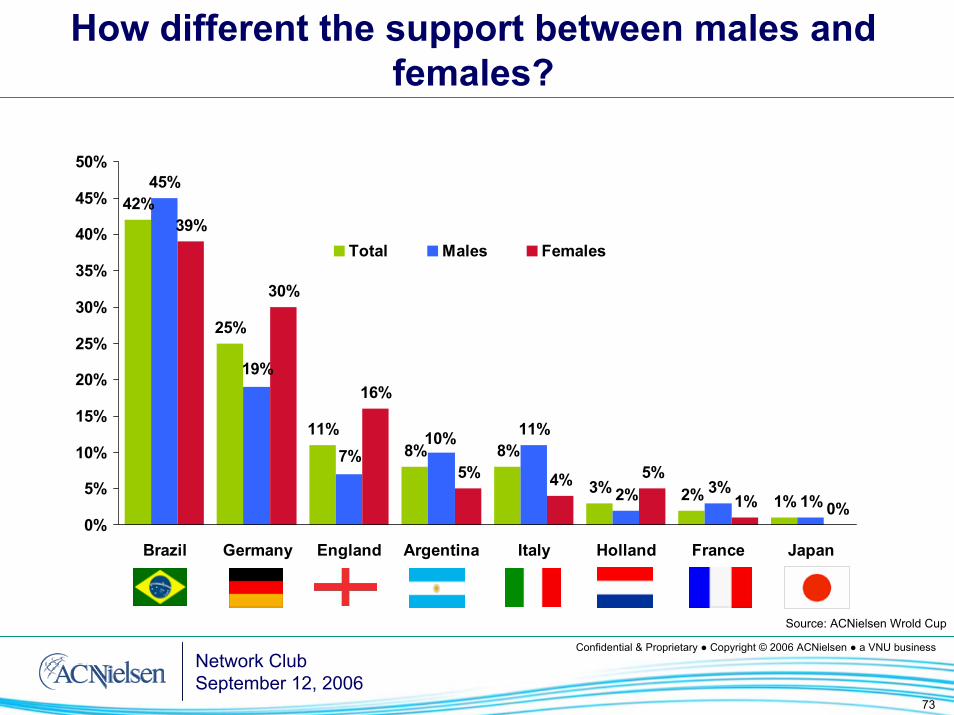
How different the support between males and females?
42%
25%
11%8% 8%
3% 2% 1%
45%
11%
3%1%
39%
30%
16%
5% 4% 5%
1% 0%2%
10%7%
19%
0%
5%
10%
15%
20%
25%
30%
35%
40%
45%
50%
Brazil Germany England Argentina Italy Holland France Japan
Total Males Females
Source: ACNielsen Wrold Cup
74
Confidential & Proprietary ● Copyright © 2006 ACNielsen ● a VNU businessNetwork ClubSeptember 12, 2006
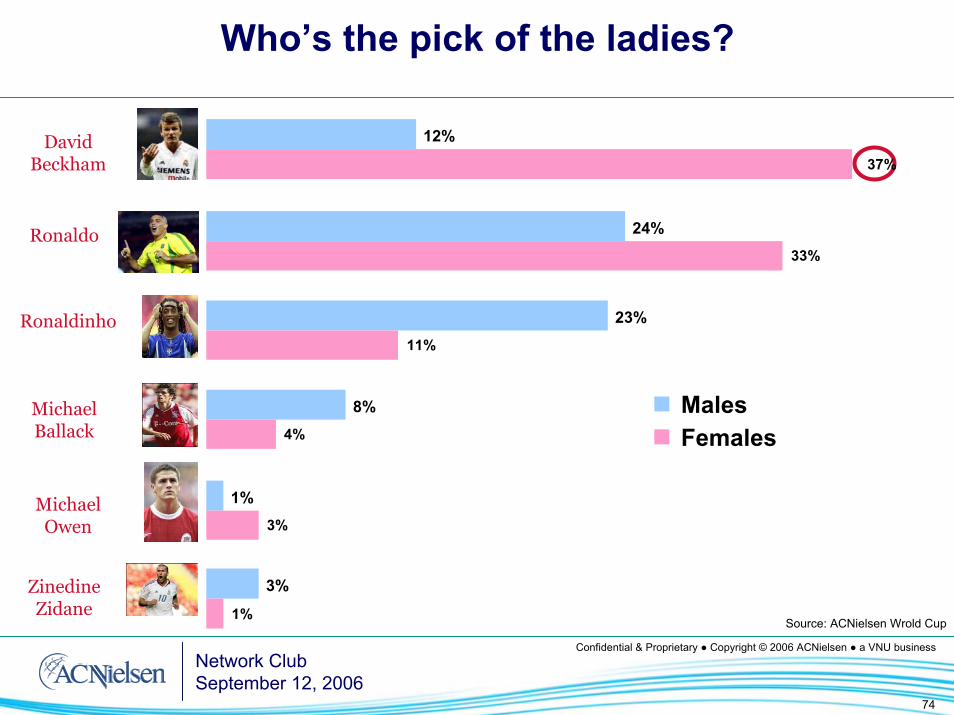
Who’s the pick of the ladies?
23%
8%
1%
33%
11%
4%
3%
24%
MalesFemales
37%
12%
3%
1%Source: ACNielsen Wrold Cup
David Beckham
Ronaldo
Ronaldinho
MichaelBallack
MichaelOwen
ZinedineZidane
75
Confidential & Proprietary ● Copyright © 2006 ACNielsen ● a VNU businessNetwork ClubSeptember 12, 2006
In Summary
● Indonesian consumers have tightened their belts by slowing down on items such as cars, motorcycles whilst FMCG products have surged
●Adspend for all media segments is on the increase●As elsewhere in Asia, the modern trade continues to
flourish and drive volumes. There are now almost eighty hypermarkets across Indonesia
●New products/variants/SKUs continue to flood the market at around 5000 per year and most importantly….
●Will David Beckham continue to be the superstar?