india’s global resource footprint in food, energy and …€¦ · · 2015-03-30report on...
TRANSCRIPT
Report on India’s Global Resource Footprint in Food, Energy and Water (FEW) 1 | P a g e
KNOWLEDGE PARTNERSHIP PROGRAMME
Scoping Study:
India’s Global Resource Footprint in Food, Energy and Water (FEW)
By
Shiv Kumar
Indira Khurana
Sobhanbabu PRK
March, 2014
Report on India’s Global Resource Footprint in Food, Energy and Water (FEW)
Final Report
India’s Global Resource Footprint in Food,
Energy and Water (FEW)
Prepared by
Indira Khurana | Shiv Kumar C | Sobhanbabu PRK
Report on India’s Global Resource Footprint in Food, Energy and Water (FEW)
Abbreviations
ANEX Annexure
BCF Billion cubic feet
BCM Billion cubic meters
BCUM Billion Cubic Meters
BEE Bureau of Energy Efficiency
Bn Billion
CAGR Compound Annual Growth Rate
CBM Coal bed methane
CDM Clean Development Mechanism
CEC Cation Exchange Capacity
CFB Circulating Fluidised bed
CII Confederation of Indian Industry
CIL Coal India Limited
CIPHET Central Institute for Post Harvesting Engineering and
Technology
DAP Di Ammonium Phosphate
DDG Decentralised distributed generation
DFID Department for International Development
DSM Demand side management
E&P Exploration and Production
EC Act 2001 Energy Conservation Act 2001
ECBC Energy conservation building code
EJ Exa Joule (1018 Joules)
FAO Food and Agriculture Organisation
FDI Foreign Direct Investment
FICCI Federation of Indian Chambers of Commerce and Industry
G/GRMS Gram/Grams
GDP Gross Domestic Product
GHG Green House Gases
GIS Geographical Information Society
GOI Government of India
GRIHA Green Rating for Integrated Habitat Assessment
GRMS Gram/Grams
Gt Gigatonnes
GW Giga Watt
HA/HEC Hectare/s
HDI Human development Index
HIG High Income growth
HVDS
ICAR
High Voltage Distribution Systems
Indian Council of Agriculture Research
Report on India’s Global Resource Footprint in Food, Energy and Water (FEW)
ICS Integrated communication methods
ICT Interactive communication technology
IIP Institute for Industrial Productivity
IMR Infant Mortality Rate
ISOPOM Integrated Scheme Of Oilseeds, Pulses, Oil palm & Maize
KG Kilograms
kWh Kilo Watt-hour
LEG Low Income Growth
LIC Low-Income Countries
LIGs Low Income Groups
LPCD Litres per capita per day
Lpcd Litres per capita per day
MDGs Millennium Development Goals
MFNS Most Favoured Nation Status
MGNREGA Mahatma Gandhi National Rural Employment Guarantee Act
MHA Million Hectares
MI Micro Irrigation
MMA Macro Management of Agriculture
MMR Maternal Mortality Rate
Mn Million
MNRE Ministry of New and Renewable Energy
MOFPI Ministry of Food Processing Industries
MoP Ministry of Power
MoWR Ministry of Water Resources
Mt Million tonnes
MTOE Million tonnes of oil equivalent
NABARD National Bank for Agriculture Reconstruction and
Development
NAPCC National Action Plan on Climate Change
NCIWRD National Commission on Integrated Water Resources
Development
NFSM National Food Security Mission
NMEEE National Mission on Enhanced Energy Efficiency
NMSA National Mission for Sustainable Agriculture
NSFM National Food Security Mission
Pa Per annum
PDS Public Distribution System
PJ Peta Joule (1015 Joules)
PPD Persons per day
PPP
PSU
Purchase Power Parity
Public Sector Undertaking
R&R Rehabilitation and Resettlement
RE Renewable energy
Report on India’s Global Resource Footprint in Food, Energy and Water (FEW)
REF Reference
RET Renewable energy technology
RKVY Rashtriya Krishi Vikas Yojana
RPO Renewable Purchase Obligation
SCCL Singareni Coal Collieries Limited
SDGs Sustainable Development Goals
SOIA GOI Publication-State of Indian Agriculture
SPV Solar Photovoltaic
SRI System of Rice Intensification
TCF Trillion cubic feet
TOE Tonnes of oil equivalent
TPED Total primary energy demand
TWh Tera Watt-hour (109 kWh)
UNEP United Nations Environment Programme
VEC Village energy committee
WRG Water Resources Group
Report on India’s Global Resource Footprint in Food, Energy and Water (FEW)
Acknowledgement
At the outset, the authors would like to thank DFID, New Delhi for having encouraged individuals and think tanks in their Knowledge Partnership Programme, along with IPE Global India and IIP, New Delhi for awarding this prestigious study ―Synthesis of India‘s Global Resource Footprint in Food, Energy, and Water‖ to us. Our sincere thanks are due to all members of the IPE Global team and the IIP team at New Delhi who extended unstinting support. Our special thanks to Ritu Bharadwaj, Policy Lead (Resource Scarcity, Food Security and Climate Change) from IIP for this study for her in depth discussions with the team and feedback on the report, and to Daljeet Kaur, Pooja Kotiyal, and Sandeep Lama from IPE Global Private Limited, for their support in developing the various diagrams and maps. The authors also acknowledge the mutual support given to one another, in this nexus venture. Indira Khurana | Shiv Kumar C | Sobhanbabu PRK
Report on India’s Global Resource Footprint in Food, Energy and Water (FEW)
Executive summary ..................................................................................................................................................... i
1.0 Introduction .................................................................................................................................................... 1
1.1 The rationale and objectives of the study ............................................................................................ 1
1.2 Scope of the work ........................................................................................................................................... 1
1.3 Current resources consumption trends in India and future demand....................................... 2
1.4 Impact of resource extraction and trade on LICs .............................................................................. 3
1.5 Global hot spots driven by future resource extractions and trade ............................................ 5
1.6 Food, energy, water inter linkages and effects .................................................................................. 7
1.7 Nexus approach to address resource management ......................................................................... 9
2.0 Food ................................................................................................................................................................ 12
2.1 Changing context of food supply security-key takeaways .......................................................... 12
2.2 Land and productivity constraints ........................................................................................................ 14
2.3 Food resource consumptions trends and patterns in India ....................................................... 16
2.4 Spatial distribution of food production and consumption. ......................................................... 16
2.5 Bridging the resource gap. India’s Global footprint ....................................................................... 17
2.6 Contribution of food to growth, human development, and poverty reduction in India . 20
2.7 Projected demand and consumption trends for 2025 & 2050 and its global impact - BAU (Business As Usual) Scenario ........................................................................................................ 20
2.8 Impact of resource extractions- IN A BAU SCENARIO .................................................................. 21
2.9 Technology and policy leading to impact mitigation .................................................................... 22
2.10 India’s best practices that have replication potential in LIC ...................................................... 24
2.11 Sustainable and climate resilient agriculture ................................................................................... 24
2.12 Public-Private Participation in Indian Agriculture......................................................................... 24
3.0 Energy ............................................................................................................................................................ 26
3.1 Changing context of supply security .................................................................................................... 26
3.2 Consumption of energy resources in India ........................................................................................ 27
3.2.1 Consumption of energy resources ......................................................................................... 28
TABLE OF CONTENTS
Report on India’s Global Resource Footprint in Food, Energy and Water (FEW)
3.2.1 Contribution of energy consumption trends to growth, human development, and poverty reduction in India ........................................................................................................................ 29
3.3 India’s impact on global resource extraction and trade ............................................................... 30
3.31 Spatial distribution of India’s extraction of and trade in energy sources ............. 30
3.3.2 Impacts of India’s extraction of energy resources .......................................................... 31
3.4 Projected energy demand and consumption trends for 2020 & 2050................................... 32
3.4.1 Fossil fuel energy demand ........................................................................................................ 32
3.4.2 Overview of energy scenario in LICs ....................................................................................... 33
3.4.3 Impact of energy resource extractions in business as usual scenario on LICs .......... 34
3.4.4 India’s best practices in energy sector ................................................................................ 36
3.4.5 India’s best practices that have replication potential for LICs .................................. 38
4.0 Water .............................................................................................................................................................. 40
4.1 Changing context of supply security ................................................................................................... 40
4.2 Current consumption in India ................................................................................................................. 41
4.3 India’s impact on global resource extraction and trade ............................................................... 43
4.4 Future scenarios ........................................................................................................................................... 45
4.4.1 Water for food ............................................................................................................................... 46
4.4.2 Domestic demand ......................................................................................................................... 46
4.4.3 Industrial demand ........................................................................................................................ 46
4.5 Impact of climate change on water ....................................................................................................... 48
4.6 Business opportunities in water sector .............................................................................................. 49
4.7 Way forward ................................................................................................................................................... 49
References ................................................................................................................................................................. 52
Report on India’s Global Resource Footprint in Food, Energy and Water (FEW)
List of Tables
Table 1.1: Resources scarcity in India and impacts on LICs ....................................................................................... 3 Table 2.1: Total Food Demand Projections In India: 2025 And 2050 IN Mmt ................................................. 20 Table 4.1: Water demand for various sectors in 2010 ................................................................................................ 42 Table 4.2: Water requirements for different crops ...................................................................................................... 42 Table 4.3: Water use in across various sectors .............................................................................................................. 43 Table 4.4: Present and future water demand .................................................................................................................. 47
List of Figures
Figure 1.1: India’s Global Resource Footprint .................................................................................................................. 5 Figure 1.2: India’s food exports- global hotspot countries .......................................................................................... 6 Figure 1.3: India’s extraction and trade of energy resources and hotpots in LICs ............................................ 6 Figure 1.4: Projected Scenarios of Ground Water Extraction and Implications for Transboundary
Aquifers ............................................................................................................................................................................................. 7 Figure 2.1: Food & Agriculture: Rising Demand & Declining Supply .................................................................... 12 Figure 2.2: Global Land Grabs ................................................................................................................................................ 15 Figure 2.3: Correlation between India's GDP and Agri GDP and Growth Comparisons (FY01-11) .......... 19 Figure 2.4: Food Processing Industry ................................................................................................................................. 19 Figure 2.5: World calorie demand ....................................................................................................................................... 20 Figure 2.6: Prices of cereals in different agriculture knowledge scenarios (AKST) ...................................... 21 Figure 2.7: Breakdown of Public and Private Sector investment in agriculture (FY01-09) ........................ 24 Figure 3.1: Total energy consumption in India, 2011.................................................................................................. 27 Figure 3.2: Sectoral consumption of TPED ....................................................................................................................... 27 Figure 3.3: Share of energy sources in domestic energy production (Mtoe) in 1990 and 2009 ............... 27 Figure 3.4: Energy imports and import dependence ................................................................................................... 27 Figure 3.5: Installed capacity and generated electricity share by fuels in 2012 .............................................. 28 Figure 3.6: Energy consumption and HDI......................................................................................................................... 29 Figure 3.7: Per-capita energy consumption and per-capita income...................................................................... 30 Figure 3.8: Key coal exports to India 2010 ....................................................................................................................... 30 Figure 3.9: Spatial distribution of energy resources in India ................................................................................... 30 Figure 3.10: Reference case and two low carbon scenarios ..................................................................................... 32 Figure 3.11: World’s incremental energy demand 2008-2050 ............................................................................... 35 Figure 4.1: Percentage share of surface and groundwater by different sectors ............................................... 42
Report on India’s Global Resource Footprint in Food, Energy and Water (FEW) i | P a g e
Executive summary
The Knowledge Partnership Programme (KPP) funded by the UK Department for International Development (DFID) and managed by a Consortium led by IPE Global Private Limited under its Knowledge Initiative, aims to support evidence generation and uptake on issues central to India‘s national development and its impact on global poverty, and promote sharing of Indian evidence, best practice and expertise for lesson learning on a global level. The purpose of the programme is to strengthen India‘s engagement in Africa – especially in African least developed countries (LDCs) – through improved trade relations and technological collaboration with a view, on the one hand, of supporting growth and structural transformation in Africa‘s poorest economies and, on the other, enabling India to effectively implement its international commitments as an emerging economy.
Resources are needed to power India‘s economic growth, both from domestic and external sources. One of the serious challenges in India is relating to adequate food production and the key inputs that are required to produce it, namely energy and water. This has major global implications particularly for global rates and patterns of resource extraction, particularly in supply chains related to food, water and energy.
This study aims to synthesise current knowledge and evidence on India‘s resource footprint related to food, water and energy, in order to assess the global impact and implications of India‘s current growth and development paradigm. In the quest for food safety, modernisation, and to meet population demands, today India has unbridled extraction scenario. This study effectively analyses the current unbridled and inefficient use of water, energy and agriculture inputs, which will lead to resource scarcities in India. This study also aims to charter the cause and effect of business as usual scenario phenomena and identify the warning bells and the way forward for a green pathway and technology management of natural resources in future. It provides an initial evidence base to inform further programming options and is focussed on: (a) the changing context of supply security; (b) current consumption in India; (c) India‘s impact on global resource extraction and trade; and, (d) future scenarios for 2020, 2050, outlining the most promising opportunities for India to promote and apply these models of enhanced resource use efficiency with LICs, with specific reference to innovations, instruments, potential LIC partners/ clients. It suggests practical and tested options for addressing gaps that can be actualised in India now and up to 2050 and replicated in the LICs. Some of these options include interventions at the legal, policy, financial, institutional, technological, and community level.
Food, water, and energy are interlinked and there is deep interdependence. India is the largest groundwater user in the world and about 90 per cent of ground water is used for food production. Energy is a vital input in agriculture for irrigation, harvesting, post harvesting, processing, value addition, storage, and transportation and agriculture accounts for 19% of total electricity consumption and 12% of total diesel consumption in India. Therefore, any rise in energy costs will result in higher cost of food production and therefore rise in food prices. Energy and water linkage is also critical as energy is needed for water extraction, transportation, distribution, and treatment and on the other hand water is required for energy generation from hydro and thermal power plants.
The policies aiming at security in one sector often can have repercussions on resources in other sectors. Improved water, energy and food security can be achieved through a nexus approach- an approach that integrates management and governance across sectors and scales. A nexus approach can support the transition to a Green Economy, which aims, among other things, at resource use efficiency and greater policy coherence. The policy and practices in India, subsequent to the Bonn convention, have focused towards a knowledge based bio economy and to effectively develop a transitional pathway through 2025 to optimize water and energy utilization in relation to food production. These are based on nanotechnology for micro fertigation and bringing about massive conservation of water and energy in fertilizer and chemical use. There are policy initiatives that encourage demand side management, increasing efficiency of pump sets
Report on India’s Global Resource Footprint in Food, Energy and Water (FEW) ii | P a g e
(from 20-30% to 40-50%), and institutional reforms in the agriculture sector, that can pave the way forward not only for significantly reducing energy consumption for agriculture sector but improving farm productivity and water conservation. Converting the groundwater pumps to more efficient
irrigation models powered by solar energy is also being contemplated, as this could lead to rise in crop production in India and save about US$ 6 billion a year in power and diesel subsidies. Increasing fresh water availability through wastewater recycling and reuse, desalination, and reducing water demand in various end-use sectors through technological interventions are being explored as part of the nexus approach. Food
► By 2050 the world‘s population will reach 9.2 billion, 34 percent higher than today. Nearly all of this population increase will occur in developing countries. Annual cereal production will need to rise to about 3 billion tons, from 2.1 billion today, and annual meat production will need to rise by over 200 million tons to reach 470 million tons. India will require 713 Mmt of basic foods, in addition to meat, poultry eggs, milk (self-sufficient meeting global per capita standards), to feed its population estimated at 1.580 billion, in the same period.
► Globally and in India, food price volatility, inflation and non-availability are the prime resource constraints. In India econometric analysis clearly reveals that the biggest culprit behind high food inflation is abnormally high fiscal deficit. This is followed by rising farm wages, high oil prices, and global food prices.
► Land is finite and essential for food production and arable land availability is decreasing in India effecting production (131.16 Mha in 1986 to120.16 currently). This is despite reclamation of 23 Mha and increase in cropping cycle (Annexure 7). The per capita availability of land is only 0.23 Ha, thus constraining mechanisation and productivity on economy of scale.
► Climate factors like temperature rises, GHG methane concentration, El Niño and El Nina effects are effecting arable land, soil water and climate symbiosis, creating rain shadow areas, effecting CO2 sinks, productivity and the food safety nets due to draughts (causing famine and cattle losses, in 2002 and 2007-2008).
► The growth rates of Indian agricultural production and crop yields have slowed down. Despite a 100% rise in fertilizer use, yields have increased by only 28%, indicating other constraints (micro nutrient use) and only 25% of agriculture is currently under crop protection cover. Mono clone crop culture, stall farming of hybrid cattle, and intensive inland river and sea shore, cultivation of commercial fishery, is destroying bio diversity and wild fish stocks.
► There may be current excesses in cereals and reduced per capita consumption. However, the true consideration is the demand on an expanded population, base, progressively. This indicates cereals shortages for human consumption as also due to the growing use of coarse cereals as cattle feed for higher milk and meat production, reflecting change in feed habits.[2] and (Annexure,1&2,3) Feed grain demand was 8 Mmt in 2000 and is expected to be 211 Mmt by 2050 indicating Severe shortages). Examples like self-sufficiency in milk and sugar to global standards need replication in other food crops.
► However, serious factors of non-diversification to health need crops, (coarse cereals millets, sorghum, corn, etc.) and other resource gaps (edible oil & pulses), if not addressed will lead to a mal nutrition, and shortages, especially in a large vegetarian population.
► Demand-supply gap in India for essential, synergistic foods like edible oils (net Rs8,500 Crore imports), pulses, and lentils (net Rs7,149 Crore imports), nuts, legumes, need to be addressed at national and local Levels as the gap is widening quickly (Annexure 8- imports fig).
► India is home to more than 265 million of people needing basic nutrition [8]. The poor and vulnerable LIGs (subsidised low income groups) have necessitated a robust subsidized public distribution system [10], midday meal scheme (to combat mal nutrition in children) [9] and finally the enactment of the food security act.
Report on India’s Global Resource Footprint in Food, Energy and Water (FEW) iii | P a g e
► Various social and people oriented policies, like the PDS, midday meal nutrition for children, and the food security policy has ensured human development, health and addressed hunger. However, this has meant less food in circulation and consequent high prices and spikes. These factors will have a constant impact on overall food prices, which is rising sharply effecting, supply and demand, in India and globally to its importers and their terms of trade.
► Targeted GDP growth of 4% has not been achieved in agriculture. Inadequate growth and the ever increasing capital and current a/c gaps, will exert pressure on debt servicing, resulting in lower fiscal allotments for subsidies, development, lesser social programmes, and seriously impact India‘s capacity to hold buffer stocks for the food security programme.
► The per capita GDP will grow from $463 to $1765 and $6735 through 2000, 2025 to 2050. The ―want and need ―matrix, of better quality, higher meat and dairy consumptions for more calories [5] and a balanced nutrition basket, will be dictated by a young and more affluent generation. The nutritional intake per capita will rise from 2495, to 2775 and 3000 calories progressively up to 2050. This will lead to quantum shifts in ―production and consumption‖ [3] as most of this will come from meat poultry, and eggs.
► The rising middle class with both genders employed[6] and the younger generations (estimated at 68%) will demand leaner, cleaner, safer and more nutritious processed foods, restructuring demand and supply in terms of quantity, quality and taste,
► Non grain food will form 50% of the nutritional intake.(Uppali A et al) Life expectancy is currently at 65 years, and availability of sanitation, clean water, medical systems and energy will see it rise further. Food demand will be driven further by this factor, and population dynamics.
► New marketing and supply chain structures, (both rural and urban) symbiotic to modern retail development in India, development of logistics, cold storage, road infrastructure and value added products including convenience foods will impact the food scenario completely. This is being rapidly seen in the last decade wherein modern retailing formats has reached $12 billion and expected to grow to$ 50 billion, by 2020 on the back of FDI involvement. The Indian food service market (catering both formal and ethnic) is pegged at $12.25 billion, currently and is growing at a CAGR of 11%.
► There is a global and national fall in food diversity consumption and human diets dependant on cereals, corn, soy oil, meat, dairy and energy dense foods are becoming universal. With sizeable decrease in leafy vegetable, fruit, and coarse grain consumption especially in the urban population. Accelerated increase is seen in the life style diseases, in India of obesity, diabetes, and heart diseases (International centre for tropical agriculture Colombia)
► India‘s utilisation of food resources is severely impacted, by its domestic food waste, which is estimated between 30-40% (Emerson energy & CIPHET reports). Waste management will form the back bone of sustainable agriculture and provide much needed organic fertilizer and bio-energy
► India heavily extracts resources for food production domestically and has a global footprint in resource sourcing in essential foods and importantly in agriculture inputs. Large amount of coarse grains, pulses and nuts are imported from the LICs. India exports food to more than twenty eight LICs. Any change in policy, price and quantity will have severe impacts on Afghanistan, Bangladesh, Myanmar, Nepal, Kenya, Mozambique, Ethiopia, Liberia and Sri Lanka, and resulting ―Global food hot spots‖ (ref. Resource and hot spot maps- food in introduction).
► To overcome domestic and export resource scarcities and overt threats, and transit on a responsible green pathway globally, Indian policy makers have embarked on a robust and holistic policy. These include technical action, price stabilisation, socio economic growth and equality, sustainable systems, bio conservation, climate mitigation and critical supply chains to the LIC in its latest five year food vision. This will ensure that it meets the challenging resource
Report on India’s Global Resource Footprint in Food, Energy and Water (FEW) iv | P a g e
input -output needs of 2025/2050 successfully. Best examples, are the RGKVY schemes, sustainable agriculture, and the dynamic PPP models, explained in detail in the note.
Energy
► India‘s energy sector is unable to deliver a secure supply of energy amid growing demand and fuel imports and the key drivers of energy resources scarcity are: stagnating supplies of coal, monopoly of coal sector, which is closed to private sector, inefficient coal mining technologies employed, limited reserves of coking coal; low proven hydrocarbon resources and poorly explored resource basins; environmental and safety concerns of hydro and nuclear sources; populist economic schemes (free electricity, highly subsidised petroleum products); and use of inefficient and obsolete technologies in major sectors.
► India is the third largest in primary energy consumer in the world after China and the United States and it accounts for more than 4.6% total annual global energy consumption in the last five years. The energy demand more than doubled from 319 Mtoe in 1990 to 775 Mtoe in 2012. The energy mix transformed significantly from predominantly biomass to coal, driven by industrialization and economic development. Coal is the mainstay of India‘s energy sector accounting for over 41% of primary energy demand and 72% the total electricity generated; oil and gas constitute the next big share of energy portfolio with a combined share of over one-third of the total energy consumption. Renewable energy has been making inroads into energy mix with policies conducive for mainstreaming. Though high energy consumption trends and economic growth have contributed positively to human development, growth, and poverty alleviation in India, it is still a long way to reach respectable HDI. The per capita energy consumption at 0.58 toe remains very low compared to the world average of 1.8, OECD 4.28, and China 1.7 and nearly one-fourth of India‘s population still lack access to electricity and this shows it is a long way for India to reach saturation.
► India relies heavily on imports of coal, crude oil (75% of demand), and gas (28%) in 2011, sourced from across the globe including a few LICs. The energy demand is projected to increase several fold from 28 EJ in 2010 to 39.5 EJ in 2020 and 110 EJ in 2050, a large part of which will have to be met through imports. In the business as usual scenario, coal will remain as main energy source with increased role for RE.
► India is highly dependent on imports of crude oil and natural gas and the import dependence is expected to increase to 80% for crude oil by 2016-17 (from 76% in 2011-12) and 35% for natural gas by 2016-17 (from 21% in 2011-12). High import dependence amounts to high vulnerability and compromised energy security. The Arab Spring was a significant cause of concern for India, owing to high dependence on the region for energy supplies. Further, the GDP growth rate becomes dependable on external factors like oil prices and there will be concerns of increasing fiscal deficit and depleting foreign reserves. Increasing competition for resources outside India for oil and gas makes it difficult for Indian companies to source energy at a competitive price.
► Globally, oil will remain the dominant source of energy over the next 25 years. The crude oil prices will continue to rise in the global market driven by shortage of supplies and rapidly increasing energy demand in countries like China and India. The increase in oil prices will in turn increase food prices and transport costs in LICs. There are some benefits from rising fuel prices for oil and gas exporting sub-Saharan countries like Nigeria, Angola and Sudan in terms of economic growth, job creation, and government revenues. However, for other LICs that rely on energy imports such as Ethiopia, Kenya and Malawi, rising prices and increasing volatility in energy markets are likely to have negative impacts- rising fuel prices, the rising cost of energy-intensive nitrogen fertilisers hence increase in food prices, and increased costs of kerosene or LPG affecting the households.
► LICs are low energy consumers and their average per capita energy consumption in 2010 was 363 kgoe compared with a world average of 1,851 kgoe and 7164 kgoe in the USA [32]. Across all LICs, 77% of TPES in 2009 was from renewable energy sources and 23% from
Report on India’s Global Resource Footprint in Food, Energy and Water (FEW) v | P a g e
fossil fuels. The large portion of renewables in TPES is dominated by biomass (75% of TPES), which is predominantly used for domestic cooking. Across 16 LICs for which data is available, household energy averaged 49% of total final energy consumption in 2005, against a world average of 16%. Most African LICs have good potential for hydropower, only a small portion of which has been exploited. All LICs are net importers of oil and oil products; two LICs- Myanmar and Mozambique are net exporters of natural gas; four LICs- North Korea, Mozambique, Myanmar, and Zimbabwe are net exporters of coal. Oil accounted for 15% of TPES in 2010 in LICs against the world average of 32.4%. LICs are all net importers of oil, but recent reserves are discovered in Ghana, Uganda, and Kenya. Coal is consumed in 14 LICs and nearly 70% of these LICs have coal contributing to less than 5% of their energy mix compared to the world average of 27.3%. The production and consumption of biofuels in LICs has been quite limited to date. According to IRENA, solar energy has high potential in the majority of African LICs.
► India emphasises low-carbon growth path and has several successful examples and best practices encompassing policy (NAPCC, NMEEE, PAT, BEE SME, JICA MSME Energy Saving Project, JNNSM, AgDSM), technology (clean coal technologies, RETs, bioenergy), business models (rural electrification- DESI, SBA Hydro, Tata BP Solar, Husk Power), innovation (Carbon Credits, Institutional structures, integration of income generating activities), financing (fiscal incentives, National Clean Energy Fund) that has resulted in offsetting some demand on fossil fuel resources in India
► The priority areas identified for transfer of Indian best practices to LICs, after matching with demand and the needs are: (i) PAT scheme for large and energy intensive industrial segment (e.g. cement, iron & steel, pulp & paper, thermal power) to foster resource use efficiency; (ii) SME sector development through BEE SME-EE program and JICA MSME Energy Saving Project; (iii) Agricultural DSM (Ag DSM) programme for the Agriculture sector to reduce electricity consumption, enhance farm productivity, water conservation; (iv) S&L programme to help LICs transform markets for supply of energy efficient models of electric appliances/ equipment for residential sector; and (v) rural energy policy initiatives- RGGVY, Guidelines for village electrification through DDG projects, the innovative off-grid DDG models for promoting RE based projects like DESI Power, Husk Power, SBA Hydro, Tata BP Solar; and policy initiatives, fiscal/ financial incentives of GOI for promoting grid-tied RE power generation.
Water
► Water is an essential factor for survival, socioeconomic development and is a human right. It is critical for conservation of ecosystems. It is a required resource for agriculture and food production, human consumption and domestic use, energy generation and industry.
► India faces an uncertain future with respect to its water resources in terms of availability, quality, per capita consumption and equitable access.
► There are differences in estimates regarding the total utilisable water available, and future demand projections. While the Ministry of Water Resources (MoWR) states the total utilisable water to be 1,123 BCM, another group estimates it at 634 BCM. One study indicates that there will be a gap of almost 50% between demand and supply in 2030, will the MoWR estimates a surplus in 2025 and a gap of 324 BCM in 2050. The National Commission on Integrated Water Resources Development has projected a different scenario. These differences make planning for a water-secure future a challenge.
► The water-related impacts of climate change are compounding the uncertainties through erratic monsoon, and abnormal rainfall patterns.
► The country is rapidly drying up as groundwater and surface waters are being mined to unsustainable levels and the per capita availability of water is declining. Per capita availability declined from 2,209 cubic meters in 1991 to 1,820 in 2001 and 1,545 in 2011. Trends indicate that India will move into water stressed state by 2025, when the per capita availability will further decline to 1,341 cubic meters.
Report on India’s Global Resource Footprint in Food, Energy and Water (FEW) vi | P a g e
► Within states the virtual water trade is exacerbating scarcities in water scarce states. Between 1997 and 2001, 2 per cent of the water footprint of Indian consumers was from outside the country.
► India is heavily dependent upon groundwater and is the largest groundwater extractor in the world. Estimates indicate that by 2050 ten of the major river basins will see a groundwater abstraction of more than 75 per cent.
► With the increasing population, rapid urbanisation, focus on GDP growth, growing aspirations of the people, changing food habits, inefficiency in use and mismanagement of available resources; water is set to become a resources bottleneck. With the largest share of water (more than 85 per cent) being used for agriculture, food production and security is a cause for concern. Increasing energy production will also demand huge amounts of water as an input while water extraction, transportation and distribution will itself require energy. Between 1950 and 2010 while there was a ten-fold increase in energy demand but a 25 fold increase in agricultural energy demand.
► Options such as encouraging Indian companies to purchase land for food production in African and South American countries is being explored. This trend could affect the water resources and access to these by the African and South American local population. Research is needed to review the impact of these acquisitions on local communities vis-à-vis land and water access and ownership and, livelihood and local food security.
► Some of the rivers transcend political boundaries: Negotiations on equitable sharing between riparian countries is intensely political and sensitive, for example between India and Bangladesh, Nepal and Pakistan. This has implications for regional peace.
► India shares eight transboundary aquifers with neighbouring countries. The transboundary aquifer systems between Punjab, India and Pakistan and West Bengal, India and Bangladesh are under stress due to overexploitation and contamination, which need prioritised attention. More research is needed to better understand the groundwater flows and the linkage between surface and groundwater in these transboundary aquifers.
► One of the options to reduce gap between demand and supply is to reduce demand. Given that the agricultural sector is a major user of water, reduced water demand by this sector through increasing water productivity will make a significant difference in overall water demand. In addition, augmentation of water availability through reuse and rainwater harvesting must also be called up.
► The government, civil society, the people themselves and the private sector are generating models for improved and equitable sharing of water. Policy recommendations for a paradigm shift have been made in the 12th Five Year Plan (2012-17). These include aquifer mapping and management, developing a national water law framework, large irrigation reform, breaking the groundwater nexus, watershed restoration, water database development and industrial water management. Some of these can be propagated for further use within the country, and explored for addressing water-related problems.
Report on India’s Global Resource Footprint in Food, Energy and Water (FEW) 1 | P a g e
1.0 Introduction
1.1 The rationale and objectives of the study
The Knowledge Partnership Programme (KPP) is funded by the UK Department for International Development (DFID) and managed by a Consortium led by IPE Global Private Limited under its Knowledge Initiative. The KPP aims to support evidence generation and uptake on issues central to India‘s national development and its impact on global poverty and promote sharing of Indian evidence, best practice and expertise for lesson learning on a global level. The purpose of the programme is to strengthen India‘s engagement in Africa – especially in African least developed countries (LDCs) – through improved trade relations and technological collaboration with a view, on the one hand, of supporting growth and structural transformation in Africa‘s poorest economies and, on the other, enabling India to effectively implement its international commitments as an emerging economy.
The KPP supports three strategic objectives: gathering and uptake of evidence on issues central to India‘s national development that have potential for replication in LDCs; gathering and uptake of evidence on issues central to India‘s impact on global poverty; and promote sharing of Indian evidence, best practice and expertise with LDCs in order to facilitate evidence-gathering and uptake.
Globally, there is mounting pressure on natural resources, driven by economic growth, unsustainable patterns of consumption and production, urbanisation, population growth, technology shifts, and climate change. The stresses on resources to date stem largely from historic growth in the developed world, but fast growth observed in the developing countries like China and India in the recent times imposes additional pressure.
Resources are needed to power India‘s economic growth, both from domestic and external sources. This has major implications for global rates and patterns of resource extraction, particularly in supply chains related to food, water and energy.
India‘s approach to promoting development through public and private efforts has been entwined with extraction and use of resources from other countries. China and India have had major impacts on multiple resource markets in this way. India accounts for around 10% of growth in palm oil, wheat, oil, and coal. It is also a major producer of rice, sugar, timber, and heavily extracts water resources and nitrogen for agricultural inputs.
The current business as usual approach to addressing demand for food, energy and water in 2020 and 2050 may not fulfil the demand and aspirations of the people in various scenarios. These scenarios throw a challenge for better understanding and management of resources and stretching these so that more output can be produced with lesser input. There are several best practise examples from India, which need to be scaled up. The knowledge from these examples can also be transferred to LICs for adoption after suitable modification.
Adopting a nexus approach between food, energy and water offers an opportunity to better understand the interdependency and implications of these resources, leading to improved analysis and understanding, with policy and practise implications.
1.2 Scope of the work
The purpose of this paper is to understand the food, energy and water nexus in India, future scenarios for 2020 and 2050 and understand global implications. Based on literature review and secondary data, this study aims to synthesise current knowledge and evidence on India‘s resource footprint related to food, water and energy, in order to assess the global impact and implications of India‘s current growth and development paradigm. It provides an initial evidence base to inform further programming options for KPP and is focussed on: (a) Understanding the changing context of supply security; (b) current consumption in India; (c) India‘s impact on global resource extraction and trade; and, (d) future scenarios for 2020, 2050, outlining the most promising opportunities for India to promote and apply these models of enhanced resource use efficiency with LICs, with specific reference to innovations, instruments, and potential LIC partners/ clients. The report
Report on India’s Global Resource Footprint in Food, Energy and Water (FEW) 2 | P a g e
provides an analytical overview of the food, energy, water nexus in India, mapping future scenarios, the global resource footprint of India and possible implications for LICs. It suggests practical and tested interventions for addressing resource gaps that can be up scaled within the country and those having replication potential in LICs. Some of these measures include interventions at the legal, policy, financial, institutional, technological, and community level.
1.3 Methodology
This research is primarily a review of secondary data published and available in the electronic media. The methodology adopted was to assess the current availability of food, energy and water, past and future scenarios from most acceptable and logically reliable research papers as of today. The methodology matrix derives various components in each sector. The methodology covers trends in sectors and extraction of cereals, coarse grain, sugar, meat poultry, as well as availability of energy fossil fuels, hydro, nuclear and that of water from rainfall, ground water, and river basins etc. Primary methodology adopted was ―impact assessment and the inter play of various factors and the cause and effect, leading to the nexus approach and description. The methodology also called for subtle analysis of policies of the GOI, interconnectivity and repercussions, especially of the impact on human development through the use of water and energy and the consequent ramification on food security. The methodology studies global, regional, and national trends and relies on per capita consumption of food, energy, and water and their future demands. The current geo-political situation and the economic progress of the LICs had a large impact in developing the methodology matrix for the assessment, especially in that of recommendations made for adoption. The report relies on various charts, graphs, pictorials and especially ―key resource maps, and hotspot maps‖ for greater impact and quick information delivery. The annexure provide a key to the systems adopted which are mainly analytical, with key interconnected observations and statistics derived exclusively by inter correlation.‖
1.4 Current resources consumption trends in India and future demand
One of the serious challenges for India is relating to adequate food production and the key inputs that are required to produce it, namely energy and water. In a business as usual scenario, the future demand for gross food is estimated to be 578 Mt in 2025 and 713 Mt in 2050. Though there is decrease in per capita consumption of cereals from 13.8 kg in 1985 to 11.35 kg in 2009, the expanding population will mean a higher overall requirement by 2025. Currently, we have a feed stock shortage, and a high per capita edible oil consumption of 13.6 kg. India is near self-sufficient in sugar and milk, but there is a large gap in pulses which are imported. The recommended per capita consumption per annum of edible oils is 10.8 kg whereas the Indian consumption is excessive at 14.6 kg per annum.
India‘s energy mix witnessed significant transformation since economic reforms in 1991 from predominantly biomass to coal, driven largely by the growth in electricity sector. Coal remains the mainstay of India‘s energy resource footprint, representing 42% of energy mix and 70% of electricity generation. India relies heavily on imports constituting nearly 30% of total demand in 2012 with crude oil as the largest source of import (nearly 75% of crude oil requirement is imported by India in 2012). With one-sixth of world‘s population, India‘s per capita energy consumption was 585 kgoe in 2009, far lower than the global average of 1,797. With expected high growth rate in the future, the per-capita energy consumption is expected to be more than doubled by 2031-32. India‘s total primary energy demand has been projected to increase from 28 EJ in 2009 to 39.5 EJ by 2020 and 110 EJ by 2050 with further increased dependence on import of energy resources.
The water demand across various sectors in 2010 was pegged at 813 BCM and estimated to increase to 1,093 BCM in 2025 and 1,447 BCM in 2050. The per capita availability of water declined from 2,209 cum in 1991 to 1,820 cum in 2001 and 1,545 cum in 2011. Estimates indicate that per capita availability will further decline to 1,341 in 2025, making it a water stressed nation. A gap between demand and supply of these resources may lead to unaffordable skyrocketing of prices globally, affecting human development and leading to possible conflict. The global population will reach 9.2 billion by 2050 and there will be a 70% increase in demand for food and a
Report on India’s Global Resource Footprint in Food, Energy and Water (FEW) 3 | P a g e
40% rise in energy demand. Further, by 2030, the world will have to confront a water supply shortage of 40%.
1.5 Impact of resource extraction and trade on LICs
To match India‘s projected food demand, the rates of extraction of agricultural inputs (energy and water) will have to rise significantly in a competitive global market. The prices of cereals in different agriculture knowledge scenarios shows significant rise. There will be total dependency on imports of fertilizers to meet food demand, which would be beyond resource availability. The soaring demand for coarse cereals and edible oils will pressurise international markets and result in non-availability and high prices in LICs. Rising stocks of food grain for consumption by burgeoning population of India and for its food security program will mean less food in circulation globally, resulting in higher prices especially in LICs. LICs are characterized by low natural resources for exports and as such their terms of trade will decrease significantly. The further impact of India‘s business as usual extraction especially on LICs will be food shortage on the lines of 2008 food crisis, which in turn effected LICs- Haiti, West African conflict countries, Uganda, Mozambique, and Kenya.
Water and energy are two critical inputs necessary for agricultural production. These are also two resources that share a symbiotic relationship given that water is needed for energy production and vice versa. While, currently, the net outflow of water in the form of agricultural produce is more than the import (2%), in future, given the gap between water availability and demand, there could be implications for LIC countries. For example, one of the reasons for acquiring land in African countries is for agriculture. Land acquisition also implies ownership of the water resources and this could have implications for access to water, sanitation and hygiene in these countries. Moreover, the rapid decline in groundwater tables in the ‗rice and wheat‘ belt of India in the Indo-Gangetic Plains could have implications for groundwater availability in neighbouring countries and LICs such as Bangladesh , Nepal and Myanmar given that India shares eight trans boundary aquifers with its neighbours Bangladesh, Bhutan, Nepal, Myanmar, Pakistan and China (Tibet). However, further studies are required to better understand groundwater behaviour.
Global energy demand is estimated to grow by one-third over the next two decades with non-OECD countries accounting for 90% of this increase, driven largely by India and China. Oil will remain the dominant energy resource over the next 25 years and oil prices will continue to rise against the backdrop of limited global supplies. The rising oil prices and increasing volatility in energy markets are likely to have negative impacts on LICs that rely on energy imports (example Ethiopia, Kenya and Malawi) ranging from rising cost of energy-intensive nitrogen fertilisers and transport hence rise in food prices, reduction in GDP, increased poverty, and decreased energy access. On the other hand, the LICs which export energy resources (example Ghana, Uganda, Kenya, and Myanmar) may stand benefited from rise in fuel prices [Energy 38].
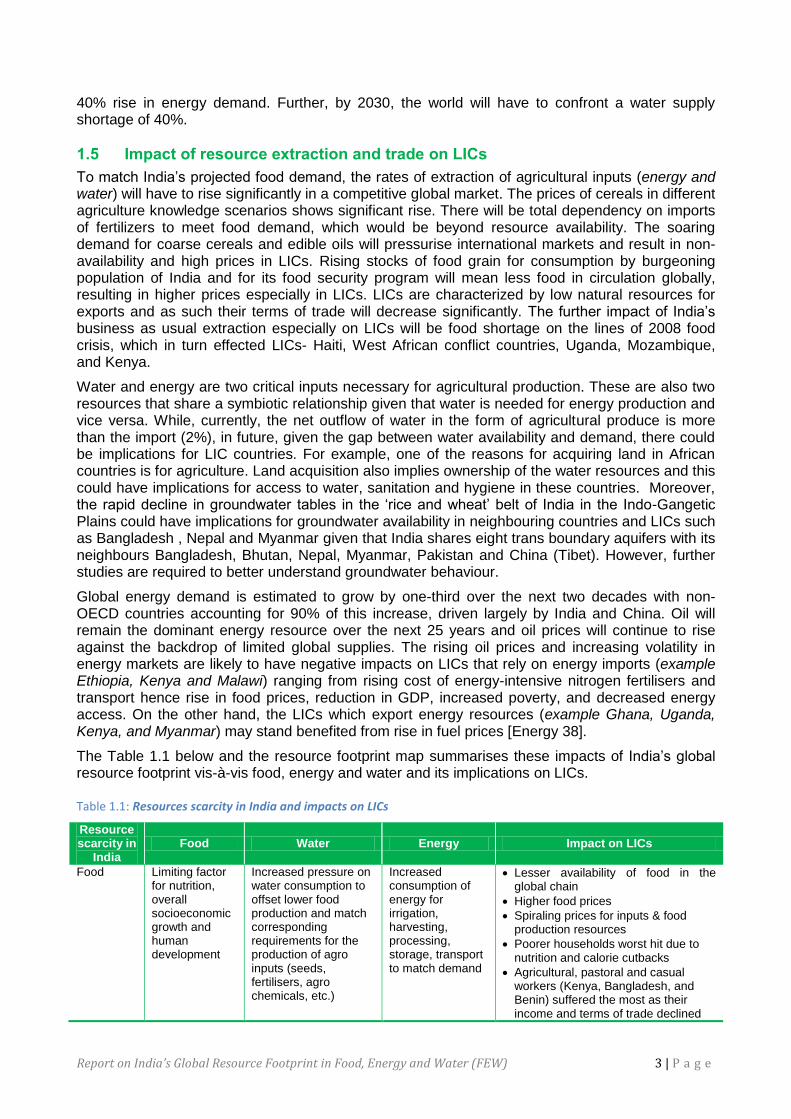
The Table 1.1 below and the resource footprint map summarises these impacts of India‘s global resource footprint vis-à-vis food, energy and water and its implications on LICs. Table 1.1: Resources scarcity in India and impacts on LICs
Resource scarcity in
India Food Water Energy Impact on LICs
Food Limiting factor for nutrition, overall socioeconomic growth and human development
Increased pressure on water consumption to offset lower food production and match corresponding requirements for the production of agro inputs (seeds, fertilisers, agro chemicals, etc.)
Increased consumption of energy for irrigation, harvesting, processing, storage, transport to match demand
Lesser availability of food in the global chain
Higher food prices
Spiraling prices for inputs & food production resources
Poorer households worst hit due to nutrition and calorie cutbacks
Agricultural, pastoral and casual workers (Kenya, Bangladesh, and Benin) suffered the most as their income and terms of trade declined
Report on India’s Global Resource Footprint in Food, Energy and Water (FEW) 4 | P a g e
Resource scarcity in
India Food Water Energy Impact on LICs
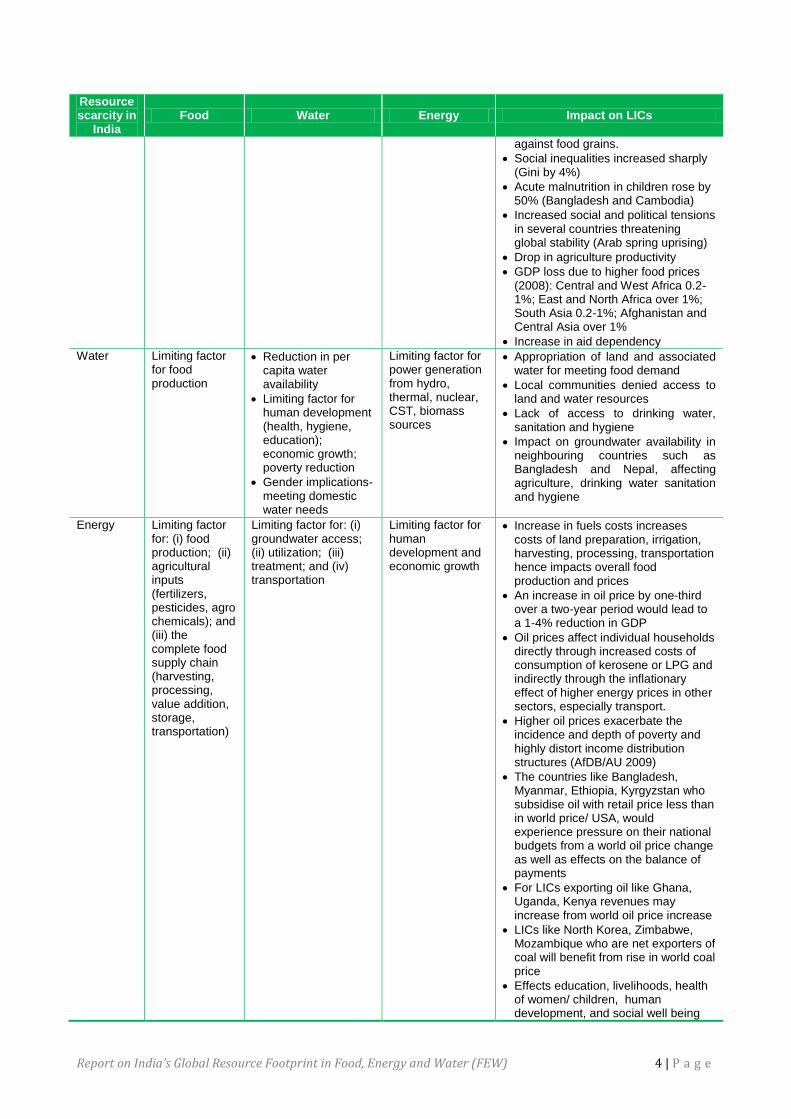
against food grains.
Social inequalities increased sharply (Gini by 4%)
Acute malnutrition in children rose by 50% (Bangladesh and Cambodia)
Increased social and political tensions in several countries threatening global stability (Arab spring uprising)
Drop in agriculture productivity
GDP loss due to higher food prices (2008): Central and West Africa 0.2-1%; East and North Africa over 1%; South Asia 0.2-1%; Afghanistan and Central Asia over 1%
Increase in aid dependency
Water Limiting factor for food production
Reduction in per capita water availability
Limiting factor for human development (health, hygiene, education); economic growth; poverty reduction
Gender implications- meeting domestic water needs
Limiting factor for power generation from hydro, thermal, nuclear, CST, biomass sources
Appropriation of land and associated water for meeting food demand
Local communities denied access to land and water resources
Lack of access to drinking water, sanitation and hygiene
Impact on groundwater availability in neighbouring countries such as Bangladesh and Nepal, affecting agriculture, drinking water sanitation and hygiene
Energy Limiting factor for: (i) food production; (ii) agricultural inputs (fertilizers, pesticides, agro chemicals); and (iii) the complete food supply chain (harvesting, processing, value addition, storage, transportation)
Limiting factor for: (i) groundwater access; (ii) utilization; (iii) treatment; and (iv) transportation
Limiting factor for human development and economic growth
Increase in fuels costs increases costs of land preparation, irrigation, harvesting, processing, transportation hence impacts overall food production and prices
An increase in oil price by one-third over a two-year period would lead to a 1-4% reduction in GDP
Oil prices affect individual households directly through increased costs of consumption of kerosene or LPG and indirectly through the inflationary effect of higher energy prices in other sectors, especially transport.
Higher oil prices exacerbate the incidence and depth of poverty and highly distort income distribution structures (AfDB/AU 2009)
The countries like Bangladesh, Myanmar, Ethiopia, Kyrgyzstan who subsidise oil with retail price less than in world price/ USA, would experience pressure on their national budgets from a world oil price change as well as effects on the balance of payments
For LICs exporting oil like Ghana, Uganda, Kenya revenues may increase from world oil price increase
LICs like North Korea, Zimbabwe, Mozambique who are net exporters of coal will benefit from rise in world coal price
Effects education, livelihoods, health of women/ children, human development, and social well being
Report on India’s Global Resource Footprint in Food, Energy and Water (FEW) 5 | P a g e
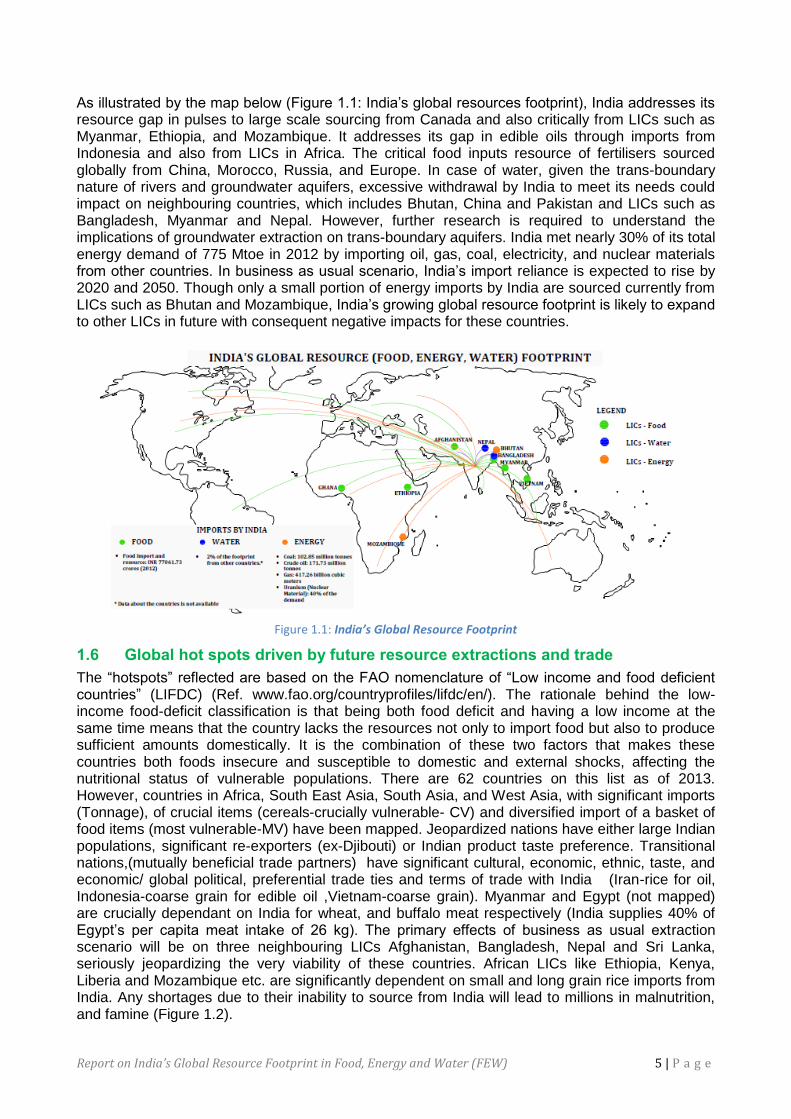
As illustrated by the map below (Figure 1.1: India‘s global resources footprint), India addresses its resource gap in pulses to large scale sourcing from Canada and also critically from LICs such as Myanmar, Ethiopia, and Mozambique. It addresses its gap in edible oils through imports from Indonesia and also from LICs in Africa. The critical food inputs resource of fertilisers sourced globally from China, Morocco, Russia, and Europe. In case of water, given the trans-boundary nature of rivers and groundwater aquifers, excessive withdrawal by India to meet its needs could impact on neighbouring countries, which includes Bhutan, China and Pakistan and LICs such as Bangladesh, Myanmar and Nepal. However, further research is required to understand the implications of groundwater extraction on trans-boundary aquifers. India met nearly 30% of its total energy demand of 775 Mtoe in 2012 by importing oil, gas, coal, electricity, and nuclear materials from other countries. In business as usual scenario, India‘s import reliance is expected to rise by 2020 and 2050. Though only a small portion of energy imports by India are sourced currently from LICs such as Bhutan and Mozambique, India‘s growing global resource footprint is likely to expand to other LICs in future with consequent negative impacts for these countries.
Figure 1.1: India’s Global Resource Footprint
1.6 Global hot spots driven by future resource extractions and trade
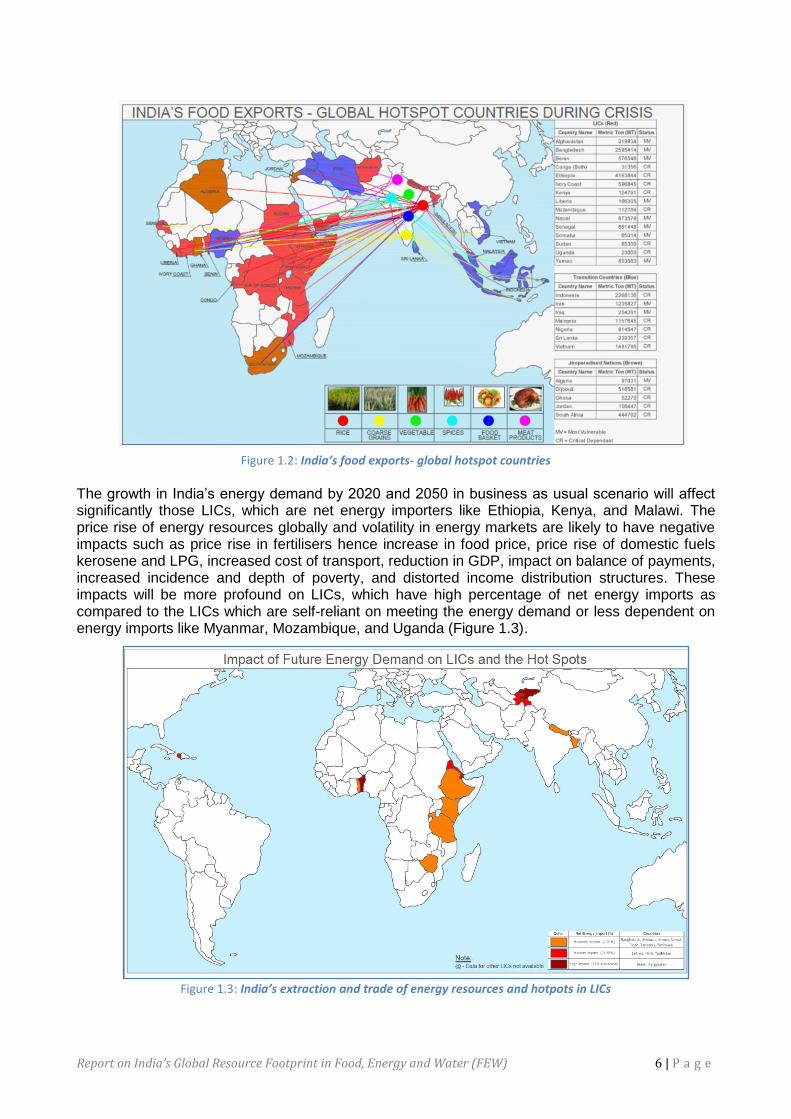
The ―hotspots‖ reflected are based on the FAO nomenclature of ―Low income and food deficient countries‖ (LIFDC) (Ref. www.fao.org/countryprofiles/lifdc/en/). The rationale behind the low-income food-deficit classification is that being both food deficit and having a low income at the same time means that the country lacks the resources not only to import food but also to produce sufficient amounts domestically. It is the combination of these two factors that makes these countries both foods insecure and susceptible to domestic and external shocks, affecting the nutritional status of vulnerable populations. There are 62 countries on this list as of 2013. However, countries in Africa, South East Asia, South Asia, and West Asia, with significant imports (Tonnage), of crucial items (cereals-crucially vulnerable- CV) and diversified import of a basket of food items (most vulnerable-MV) have been mapped. Jeopardized nations have either large Indian populations, significant re-exporters (ex-Djibouti) or Indian product taste preference. Transitional nations,(mutually beneficial trade partners) have significant cultural, economic, ethnic, taste, and economic/ global political, preferential trade ties and terms of trade with India (Iran-rice for oil, Indonesia-coarse grain for edible oil ,Vietnam-coarse grain). Myanmar and Egypt (not mapped) are crucially dependant on India for wheat, and buffalo meat respectively (India supplies 40% of Egypt‘s per capita meat intake of 26 kg). The primary effects of business as usual extraction scenario will be on three neighbouring LICs Afghanistan, Bangladesh, Nepal and Sri Lanka, seriously jeopardizing the very viability of these countries. African LICs like Ethiopia, Kenya, Liberia and Mozambique etc. are significantly dependent on small and long grain rice imports from India. Any shortages due to their inability to source from India will lead to millions in malnutrition, and famine (Figure 1.2).
Report on India’s Global Resource Footprint in Food, Energy and Water (FEW) 6 | P a g e
Figure 1.2: India’s food exports- global hotspot countries
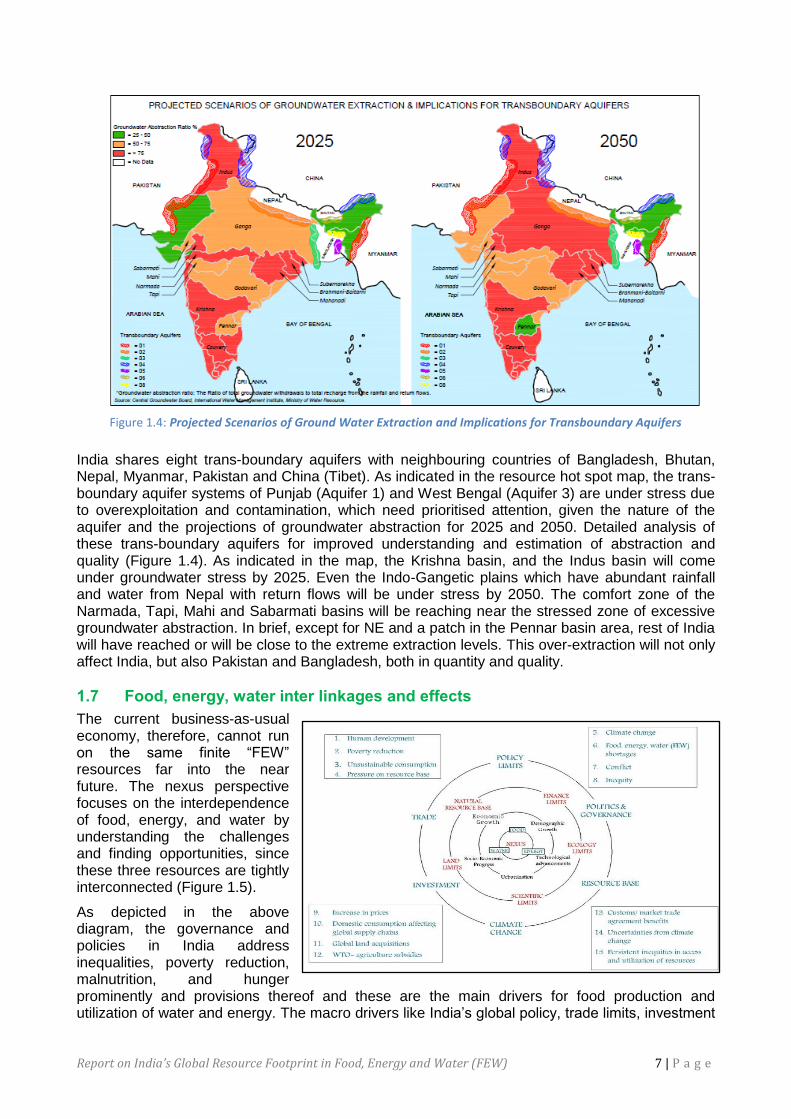
The growth in India‘s energy demand by 2020 and 2050 in business as usual scenario will affect significantly those LICs, which are net energy importers like Ethiopia, Kenya, and Malawi. The price rise of energy resources globally and volatility in energy markets are likely to have negative impacts such as price rise in fertilisers hence increase in food price, price rise of domestic fuels kerosene and LPG, increased cost of transport, reduction in GDP, impact on balance of payments, increased incidence and depth of poverty, and distorted income distribution structures. These impacts will be more profound on LICs, which have high percentage of net energy imports as compared to the LICs which are self-reliant on meeting the energy demand or less dependent on energy imports like Myanmar, Mozambique, and Uganda (Figure 1.3).
Figure 1.3: India’s extraction and trade of energy resources and hotpots in LICs
Report on India’s Global Resource Footprint in Food, Energy and Water (FEW) 7 | P a g e
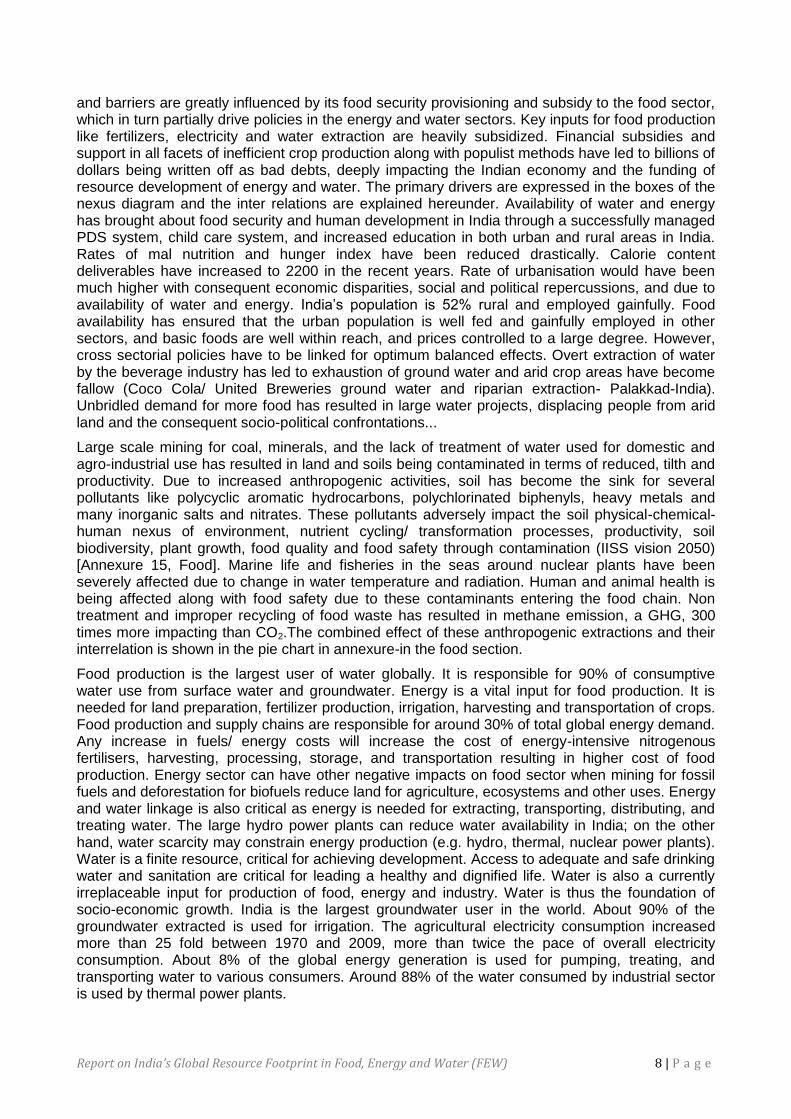
Figure 1.4: Projected Scenarios of Ground Water Extraction and Implications for Transboundary Aquifers
India shares eight trans-boundary aquifers with neighbouring countries of Bangladesh, Bhutan, Nepal, Myanmar, Pakistan and China (Tibet). As indicated in the resource hot spot map, the trans-boundary aquifer systems of Punjab (Aquifer 1) and West Bengal (Aquifer 3) are under stress due to overexploitation and contamination, which need prioritised attention, given the nature of the aquifer and the projections of groundwater abstraction for 2025 and 2050. Detailed analysis of these trans-boundary aquifers for improved understanding and estimation of abstraction and quality (Figure 1.4). As indicated in the map, the Krishna basin, and the Indus basin will come under groundwater stress by 2025. Even the Indo-Gangetic plains which have abundant rainfall and water from Nepal with return flows will be under stress by 2050. The comfort zone of the Narmada, Tapi, Mahi and Sabarmati basins will be reaching near the stressed zone of excessive groundwater abstraction. In brief, except for NE and a patch in the Pennar basin area, rest of India will have reached or will be close to the extreme extraction levels. This over-extraction will not only affect India, but also Pakistan and Bangladesh, both in quantity and quality.
1.7 Food, energy, water inter linkages and effects
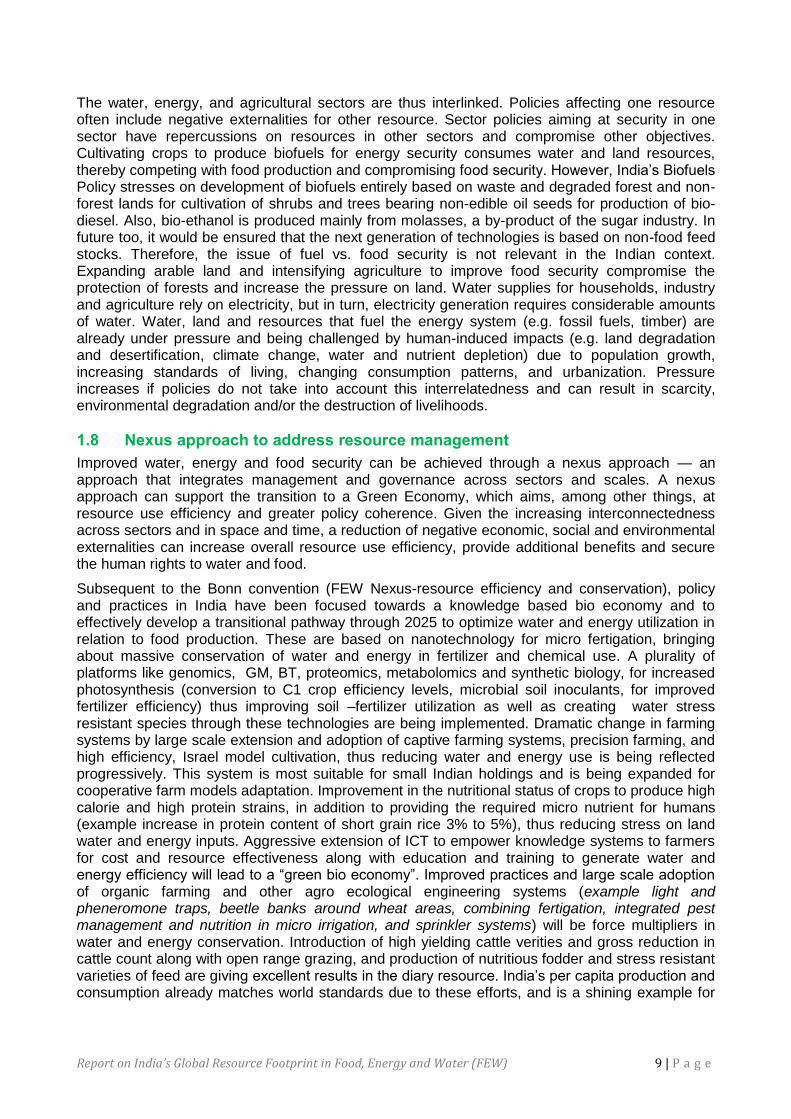
The current business-as-usual economy, therefore, cannot run on the same finite ―FEW‖ resources far into the near future. The nexus perspective focuses on the interdependence of food, energy, and water by understanding the challenges and finding opportunities, since these three resources are tightly interconnected (Figure 1.5).
As depicted in the above diagram, the governance and policies in India address inequalities, poverty reduction, malnutrition, and hunger prominently and provisions thereof and these are the main drivers for food production and utilization of water and energy. The macro drivers like India‘s global policy, trade limits, investment
Figure 1.1: Food, energy and water nexus
Report on India’s Global Resource Footprint in Food, Energy and Water (FEW) 8 | P a g e
and barriers are greatly influenced by its food security provisioning and subsidy to the food sector, which in turn partially drive policies in the energy and water sectors. Key inputs for food production like fertilizers, electricity and water extraction are heavily subsidized. Financial subsidies and support in all facets of inefficient crop production along with populist methods have led to billions of dollars being written off as bad debts, deeply impacting the Indian economy and the funding of resource development of energy and water. The primary drivers are expressed in the boxes of the nexus diagram and the inter relations are explained hereunder. Availability of water and energy has brought about food security and human development in India through a successfully managed PDS system, child care system, and increased education in both urban and rural areas in India. Rates of mal nutrition and hunger index have been reduced drastically. Calorie content deliverables have increased to 2200 in the recent years. Rate of urbanisation would have been much higher with consequent economic disparities, social and political repercussions, and due to availability of water and energy. India‘s population is 52% rural and employed gainfully. Food availability has ensured that the urban population is well fed and gainfully employed in other sectors, and basic foods are well within reach, and prices controlled to a large degree. However, cross sectorial policies have to be linked for optimum balanced effects. Overt extraction of water by the beverage industry has led to exhaustion of ground water and arid crop areas have become fallow (Coco Cola/ United Breweries ground water and riparian extraction- Palakkad-India). Unbridled demand for more food has resulted in large water projects, displacing people from arid land and the consequent socio-political confrontations...
Large scale mining for coal, minerals, and the lack of treatment of water used for domestic and agro-industrial use has resulted in land and soils being contaminated in terms of reduced, tilth and productivity. Due to increased anthropogenic activities, soil has become the sink for several pollutants like polycyclic aromatic hydrocarbons, polychlorinated biphenyls, heavy metals and many inorganic salts and nitrates. These pollutants adversely impact the soil physical-chemical-human nexus of environment, nutrient cycling/ transformation processes, productivity, soil biodiversity, plant growth, food quality and food safety through contamination (IISS vision 2050) [Annexure 15, Food]. Marine life and fisheries in the seas around nuclear plants have been severely affected due to change in water temperature and radiation. Human and animal health is being affected along with food safety due to these contaminants entering the food chain. Non treatment and improper recycling of food waste has resulted in methane emission, a GHG, 300 times more impacting than CO2.The combined effect of these anthropogenic extractions and their interrelation is shown in the pie chart in annexure-in the food section.
Food production is the largest user of water globally. It is responsible for 90% of consumptive water use from surface water and groundwater. Energy is a vital input for food production. It is needed for land preparation, fertilizer production, irrigation, harvesting and transportation of crops. Food production and supply chains are responsible for around 30% of total global energy demand. Any increase in fuels/ energy costs will increase the cost of energy-intensive nitrogenous fertilisers, harvesting, processing, storage, and transportation resulting in higher cost of food production. Energy sector can have other negative impacts on food sector when mining for fossil fuels and deforestation for biofuels reduce land for agriculture, ecosystems and other uses. Energy and water linkage is also critical as energy is needed for extracting, transporting, distributing, and treating water. The large hydro power plants can reduce water availability in India; on the other hand, water scarcity may constrain energy production (e.g. hydro, thermal, nuclear power plants). Water is a finite resource, critical for achieving development. Access to adequate and safe drinking water and sanitation are critical for leading a healthy and dignified life. Water is also a currently irreplaceable input for production of food, energy and industry. Water is thus the foundation of socio-economic growth. India is the largest groundwater user in the world. About 90% of the groundwater extracted is used for irrigation. The agricultural electricity consumption increased more than 25 fold between 1970 and 2009, more than twice the pace of overall electricity consumption. About 8% of the global energy generation is used for pumping, treating, and transporting water to various consumers. Around 88% of the water consumed by industrial sector is used by thermal power plants.
Report on India’s Global Resource Footprint in Food, Energy and Water (FEW) 9 | P a g e
The water, energy, and agricultural sectors are thus interlinked. Policies affecting one resource often include negative externalities for other resource. Sector policies aiming at security in one sector have repercussions on resources in other sectors and compromise other objectives. Cultivating crops to produce biofuels for energy security consumes water and land resources, thereby competing with food production and compromising food security. However, India‘s Biofuels Policy stresses on development of biofuels entirely based on waste and degraded forest and non-forest lands for cultivation of shrubs and trees bearing non-edible oil seeds for production of bio-diesel. Also, bio-ethanol is produced mainly from molasses, a by-product of the sugar industry. In future too, it would be ensured that the next generation of technologies is based on non-food feed stocks. Therefore, the issue of fuel vs. food security is not relevant in the Indian context. Expanding arable land and intensifying agriculture to improve food security compromise the protection of forests and increase the pressure on land. Water supplies for households, industry and agriculture rely on electricity, but in turn, electricity generation requires considerable amounts of water. Water, land and resources that fuel the energy system (e.g. fossil fuels, timber) are already under pressure and being challenged by human-induced impacts (e.g. land degradation and desertification, climate change, water and nutrient depletion) due to population growth, increasing standards of living, changing consumption patterns, and urbanization. Pressure increases if policies do not take into account this interrelatedness and can result in scarcity, environmental degradation and/or the destruction of livelihoods.
1.8 Nexus approach to address resource management
Improved water, energy and food security can be achieved through a nexus approach — an approach that integrates management and governance across sectors and scales. A nexus approach can support the transition to a Green Economy, which aims, among other things, at resource use efficiency and greater policy coherence. Given the increasing interconnectedness across sectors and in space and time, a reduction of negative economic, social and environmental externalities can increase overall resource use efficiency, provide additional benefits and secure the human rights to water and food.
Subsequent to the Bonn convention (FEW Nexus-resource efficiency and conservation), policy and practices in India have been focused towards a knowledge based bio economy and to effectively develop a transitional pathway through 2025 to optimize water and energy utilization in relation to food production. These are based on nanotechnology for micro fertigation, bringing about massive conservation of water and energy in fertilizer and chemical use. A plurality of platforms like genomics, GM, BT, proteomics, metabolomics and synthetic biology, for increased photosynthesis (conversion to C1 crop efficiency levels, microbial soil inoculants, for improved fertilizer efficiency) thus improving soil –fertilizer utilization as well as creating water stress resistant species through these technologies are being implemented. Dramatic change in farming systems by large scale extension and adoption of captive farming systems, precision farming, and high efficiency, Israel model cultivation, thus reducing water and energy use is being reflected progressively. This system is most suitable for small Indian holdings and is being expanded for cooperative farm models adaptation. Improvement in the nutritional status of crops to produce high calorie and high protein strains, in addition to providing the required micro nutrient for humans (example increase in protein content of short grain rice 3% to 5%), thus reducing stress on land water and energy inputs. Aggressive extension of ICT to empower knowledge systems to farmers for cost and resource effectiveness along with education and training to generate water and energy efficiency will lead to a ―green bio economy‖. Improved practices and large scale adoption of organic farming and other agro ecological engineering systems (example light and pheneromone traps, beetle banks around wheat areas, combining fertigation, integrated pest management and nutrition in micro irrigation, and sprinkler systems) will be force multipliers in water and energy conservation. Introduction of high yielding cattle verities and gross reduction in cattle count along with open range grazing, and production of nutritious fodder and stress resistant varieties of feed are giving excellent results in the diary resource. India‘s per capita production and consumption already matches world standards due to these efforts, and is a shining example for
Report on India’s Global Resource Footprint in Food, Energy and Water (FEW) 10 | P a g e
what can be achieved overall. These are also suggested as way forward examples for replication in the LICs.
The agriculture sector in India accounts for a major share in India‘s total energy consumption. The 26 million pump sets in India consume a whopping 132 billion kWh per annum accounting for 19% of total electricity generated and 12% of the total diesel consumption. While the farmers in eastern India depend on diesel run pump sets, the rest of India use electrical pump sets for irrigation. The high fossil fuel consumption by agriculture sector also leads to high GHG emissions hence climate change. The three components of the nexus- groundwater, electricity, and agriculture are state subjects. Interestingly, different states in India have adopted different ways of managing this nexus. In case of West Bengal- an eastern state of India endowed with alluvial aquifers and high rainfall and recharge replaced the flat rate for electricity consumption by metering all electric tube wells and charge a metered tariff, which is equivalent to the cost of electricity supply. Thus a strong signal was sent to farmers to make efficient use of electricity and ground water for agriculture and therefore break the invidious nexus. Punjab is a semi-arid state with alluvial aquifer that has been over exploited for over 30 years. The Punjab government gives free electricity to farmers for groundwater pumping, but the amount of electricity is strictly rationed through separation of feeders into agricultural feeders and non-agricultural feeders. The electricity utility has been encouraged to do better energy accounting, lower their technical losses and to improve quality of power to farmers through installation of HVDS. Karnataka, a drought prone state in India provides another contrast to Punjab and West Bengal. Agriculture here is precariously dependent on groundwater and aquifers with limited storage capacity have been depleted. The government has taken upon a scheme to separate agricultural and non-agricultural feeders and ration electricity to agriculture, but the design of this scheme is such that it has defeated the very purpose of rationing. For instance, in segregated agricultural feeders, three-phase electricity is provided for 6 hours, but single phase electricity is provided for another 10-12 hours. This enables farmers to withdraw groundwater using a single phase electric pump. Thus the three states have used very different approaches for managing this nexus—ranging from economics text book solution in West Bengal, to second best solution in Punjab, to anarchy in Karnataka. This underlines the importance of politics and governance in managing water-food –energy nexus in India. Understanding the importance of FEW nexus approach to tackle unsustainable consumption of energy and water, and its associated benefits, the GoI plans to convert all the groundwater pumps to more efficient models powered by solar energy as this could lead to rise in crop production in India and save about US$ 6 billion a year in power and diesel subsidies. However, the risk of drawing excessive amounts of water by farmers using solar pumps may be mitigated by promoting water-saving technologies such as drip irrigation in exchange for subsidies to buy solar water pumps [39]. Similarly, subsidy in power supply for agriculture sector may be incentivized in such a manner that it brings in most efficient irrigation technologies. The GoI has also come up with policy initiatives that encourage demand side management, increasing efficiency of pump sets (from 20-30% to 40-50%), and institutional reforms in the agriculture sector, that can pave the way forward not only for significantly reducing energy consumption for agriculture sector but improving farm productivity and water conservation.
Given that (a) agriculture is the largest consumer of water and (b) water demand is expected to rise across all sectors, options for water, energy food secure future rest on (a) increasing fresh water availability and (b) reducing demand. Increasing fresh water availability is possible through options such as wastewater reuse, desalination and technological interventions that reduce water use. These options however have cost and environmental implications, and in the case of desalination, energy implications as well, unless renewable energy sources are used. Since agriculture is the largest consumer of water – more than 8% – a reduction in agricultural water use would result in significantly reducing demand, thus freeing water for use by other sectors. Expanded use of water saving cultivation technologies and advancement in cultivation technologies could allow for this. However, given past experience, improving crop productivity has been slow and other water use sectors also need to gear up to improve efficiency and reduce demand. In addition, water that is wasted during monsoon and flooding could be channelled to groundwater aquifers through artificial recharge and other rainwater harvesting measures.
Report on India’s Global Resource Footprint in Food, Energy and Water (FEW) 11 | P a g e
There is a profound nexus between the extraction and use of water and energy for the production of food. This is also affected by policies and associated with human and economic development of India. The policy planners being aware of the effects of overt extraction have engaged several green technology measures in the transient pathway to bring about resource conservation through 2020 to 2050. This Indian paradigm can also be adopted by the LICs for their benefit.
The following chapters analyse food, energy and water resources consumption, extraction and trade in detail, their cause and effects, and several resource efficiency methods. It explains the Indian paradigm and forms a base for future planning for India and potential Indian best practices that can be considered for implementation in LICs.
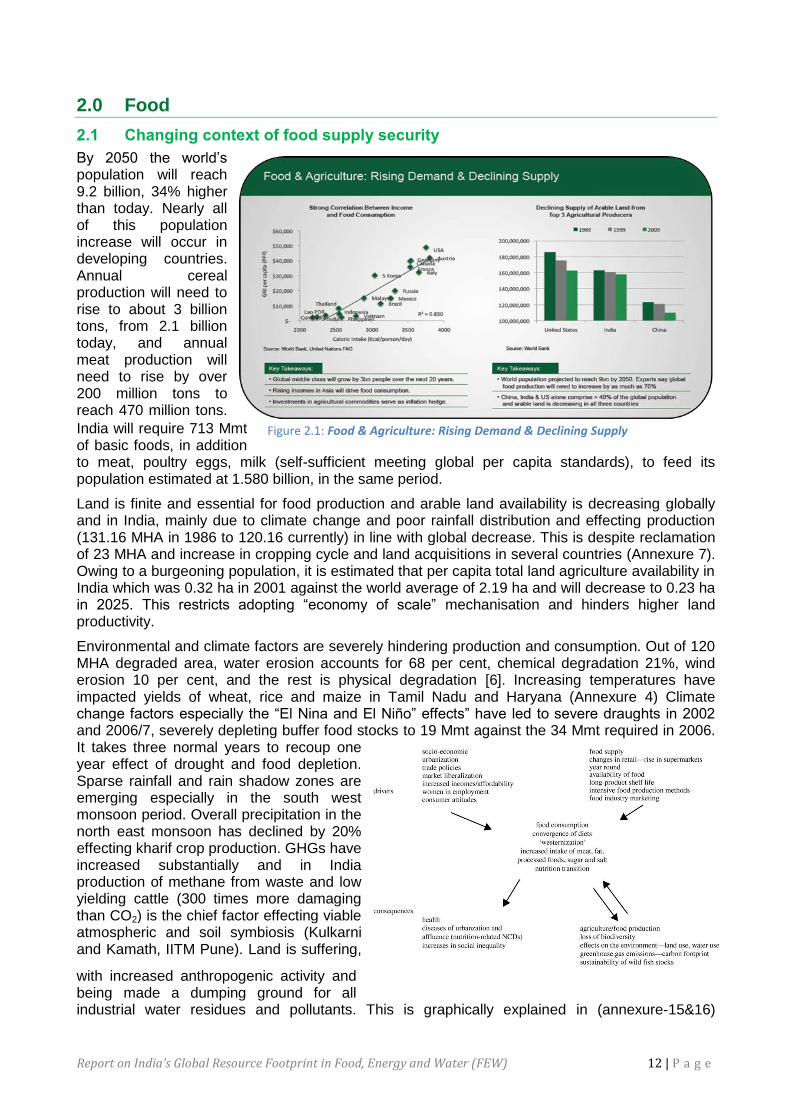
Report on India’s Global Resource Footprint in Food, Energy and Water (FEW) 12 | P a g e
2.0 Food
2.1 Changing context of food supply security
By 2050 the world‘s population will reach 9.2 billion, 34% higher than today. Nearly all of this population increase will occur in developing countries. Annual cereal production will need to rise to about 3 billion tons, from 2.1 billion today, and annual meat production will need to rise by over 200 million tons to reach 470 million tons.
India will require 713 Mmt of basic foods, in addition to meat, poultry eggs, milk (self-sufficient meeting global per capita standards), to feed its population estimated at 1.580 billion, in the same period.
Land is finite and essential for food production and arable land availability is decreasing globally and in India, mainly due to climate change and poor rainfall distribution and effecting production (131.16 MHA in 1986 to 120.16 currently) in line with global decrease. This is despite reclamation of 23 MHA and increase in cropping cycle and land acquisitions in several countries (Annexure 7). Owing to a burgeoning population, it is estimated that per capita total land agriculture availability in India which was 0.32 ha in 2001 against the world average of 2.19 ha and will decrease to 0.23 ha in 2025. This restricts adopting ―economy of scale‖ mechanisation and hinders higher land productivity.
Environmental and climate factors are severely hindering production and consumption. Out of 120 MHA degraded area, water erosion accounts for 68 per cent, chemical degradation 21%, wind erosion 10 per cent, and the rest is physical degradation [6]. Increasing temperatures have impacted yields of wheat, rice and maize in Tamil Nadu and Haryana (Annexure 4) Climate change factors especially the ―El Nina and El Niño‖ effects‖ have led to severe draughts in 2002 and 2006/7, severely depleting buffer food stocks to 19 Mmt against the 34 Mmt required in 2006. It takes three normal years to recoup one year effect of drought and food depletion. Sparse rainfall and rain shadow zones are emerging especially in the south west monsoon period. Overall precipitation in the north east monsoon has declined by 20% effecting kharif crop production. GHGs have increased substantially and in India production of methane from waste and low yielding cattle (300 times more damaging than CO2) is the chief factor effecting viable atmospheric and soil symbiosis (Kulkarni and Kamath, IITM Pune). Land is suffering,
with increased anthropogenic activity and being made a dumping ground for all industrial water residues and pollutants. This is graphically explained in (annexure-15&16)
Figure 2.1: Food & Agriculture: Rising Demand & Declining Supply
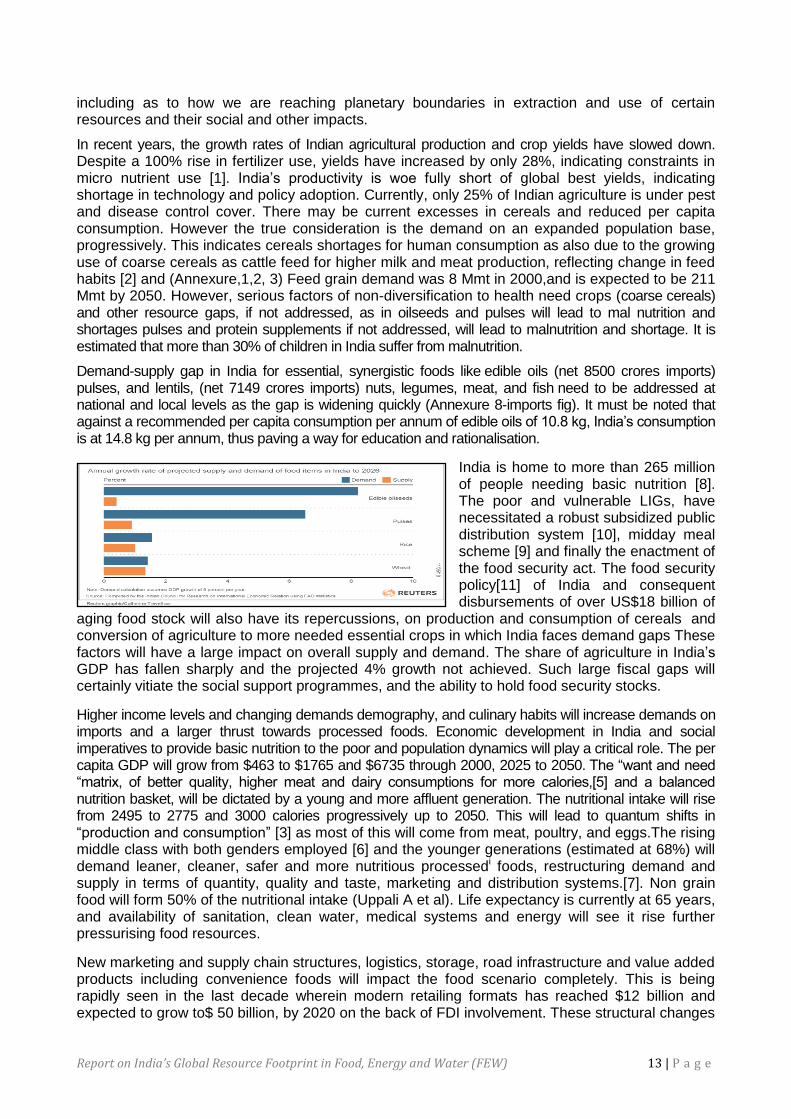
Report on India’s Global Resource Footprint in Food, Energy and Water (FEW) 13 | P a g e
including as to how we are reaching planetary boundaries in extraction and use of certain resources and their social and other impacts.
In recent years, the growth rates of Indian agricultural production and crop yields have slowed down. Despite a 100% rise in fertilizer use, yields have increased by only 28%, indicating constraints in micro nutrient use [1]. India‘s productivity is woe fully short of global best yields, indicating shortage in technology and policy adoption. Currently, only 25% of Indian agriculture is under pest and disease control cover. There may be current excesses in cereals and reduced per capita consumption. However the true consideration is the demand on an expanded population base, progressively. This indicates cereals shortages for human consumption as also due to the growing use of coarse cereals as cattle feed for higher milk and meat production, reflecting change in feed habits [2] and (Annexure,1,2, 3) Feed grain demand was 8 Mmt in 2000,and is expected to be 211 Mmt by 2050. However, serious factors of non-diversification to health need crops (coarse cereals) and other resource gaps, if not addressed, as in oilseeds and pulses will lead to mal nutrition and shortages pulses and protein supplements if not addressed, will lead to malnutrition and shortage. It is estimated that more than 30% of children in India suffer from malnutrition.
Demand-supply gap in India for essential, synergistic foods like edible oils (net 8500 crores imports) pulses, and lentils, (net 7149 crores imports) nuts, legumes, meat, and fish need to be addressed at national and local levels as the gap is widening quickly (Annexure 8-imports fig). It must be noted that against a recommended per capita consumption per annum of edible oils of 10.8 kg, India‘s consumption is at 14.8 kg per annum, thus paving a way for education and rationalisation.
India is home to more than 265 million of people needing basic nutrition [8]. The poor and vulnerable LIGs, have necessitated a robust subsidized public distribution system [10], midday meal scheme [9] and finally the enactment of the food security act. The food security policy[11] of India and consequent disbursements of over US$18 billion of
aging food stock will also have its repercussions, on production and consumption of cereals and conversion of agriculture to more needed essential crops in which India faces demand gaps These factors will have a large impact on overall supply and demand. The share of agriculture in India‘s GDP has fallen sharply and the projected 4% growth not achieved. Such large fiscal gaps will certainly vitiate the social support programmes, and the ability to hold food security stocks.
Higher income levels and changing demands demography, and culinary habits will increase demands on imports and a larger thrust towards processed foods. Economic development in India and social imperatives to provide basic nutrition to the poor and population dynamics will play a critical role. The per capita GDP will grow from $463 to $1765 and $6735 through 2000, 2025 to 2050. The ―want and need ―matrix, of better quality, higher meat and dairy consumptions for more calories,[5] and a balanced nutrition basket, will be dictated by a young and more affluent generation. The nutritional intake will rise from 2495 to 2775 and 3000 calories progressively up to 2050. This will lead to quantum shifts in ―production and consumption‖ [3] as most of this will come from meat, poultry, and eggs.The rising middle class with both genders employed [6] and the younger generations (estimated at 68%) will demand leaner, cleaner, safer and more nutritious processedi foods, restructuring demand and supply in terms of quantity, quality and taste, marketing and distribution systems.[7]. Non grain food will form 50% of the nutritional intake (Uppali A et al). Life expectancy is currently at 65 years, and availability of sanitation, clean water, medical systems and energy will see it rise further pressurising food resources.
New marketing and supply chain structures, logistics, storage, road infrastructure and value added products including convenience foods will impact the food scenario completely. This is being rapidly seen in the last decade wherein modern retailing formats has reached $12 billion and expected to grow to$ 50 billion, by 2020 on the back of FDI involvement. These structural changes
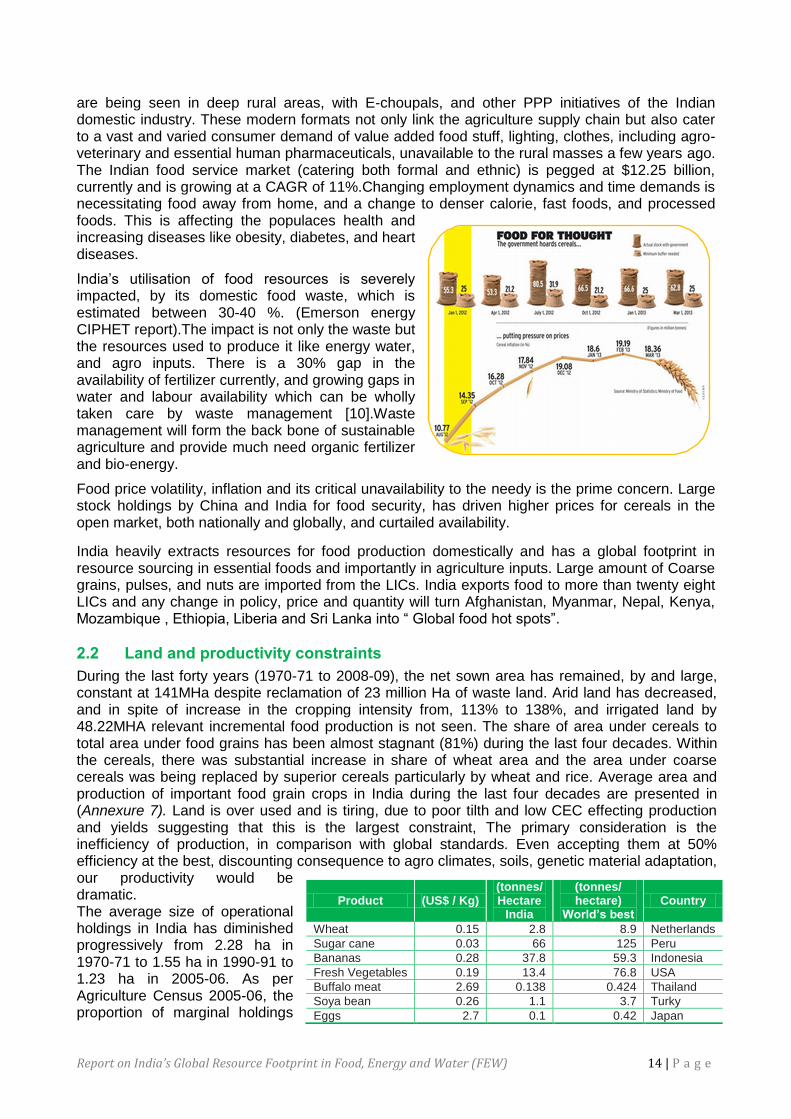
Report on India’s Global Resource Footprint in Food, Energy and Water (FEW) 14 | P a g e
are being seen in deep rural areas, with E-choupals, and other PPP initiatives of the Indian domestic industry. These modern formats not only link the agriculture supply chain but also cater to a vast and varied consumer demand of value added food stuff, lighting, clothes, including agro- veterinary and essential human pharmaceuticals, unavailable to the rural masses a few years ago. The Indian food service market (catering both formal and ethnic) is pegged at $12.25 billion, currently and is growing at a CAGR of 11%.Changing employment dynamics and time demands is necessitating food away from home, and a change to denser calorie, fast foods, and processed foods. This is affecting the populaces health and increasing diseases like obesity, diabetes, and heart diseases.
India‘s utilisation of food resources is severely impacted, by its domestic food waste, which is estimated between 30-40 %. (Emerson energy CIPHET report).The impact is not only the waste but the resources used to produce it like energy water, and agro inputs. There is a 30% gap in the availability of fertilizer currently, and growing gaps in water and labour availability which can be wholly taken care by waste management [10].Waste management will form the back bone of sustainable agriculture and provide much need organic fertilizer and bio-energy.
Food price volatility, inflation and its critical unavailability to the needy is the prime concern. Large stock holdings by China and India for food security, has driven higher prices for cereals in the open market, both nationally and globally, and curtailed availability.
India heavily extracts resources for food production domestically and has a global footprint in resource sourcing in essential foods and importantly in agriculture inputs. Large amount of Coarse grains, pulses, and nuts are imported from the LICs. India exports food to more than twenty eight LICs and any change in policy, price and quantity will turn Afghanistan, Myanmar, Nepal, Kenya, Mozambique , Ethiopia, Liberia and Sri Lanka into ― Global food hot spots‖.
2.2 Land and productivity constraints
During the last forty years (1970-71 to 2008-09), the net sown area has remained, by and large, constant at 141MHa despite reclamation of 23 million Ha of waste land. Arid land has decreased, and in spite of increase in the cropping intensity from, 113% to 138%, and irrigated land by 48.22MHA relevant incremental food production is not seen. The share of area under cereals to total area under food grains has been almost stagnant (81%) during the last four decades. Within the cereals, there was substantial increase in share of wheat area and the area under coarse cereals was being replaced by superior cereals particularly by wheat and rice. Average area and production of important food grain crops in India during the last four decades are presented in (Annexure 7). Land is over used and is tiring, due to poor tilth and low CEC effecting production and yields suggesting that this is the largest constraint, The primary consideration is the inefficiency of production, in comparison with global standards. Even accepting them at 50% efficiency at the best, discounting consequence to agro climates, soils, genetic material adaptation, our productivity would be dramatic. The average size of operational holdings in India has diminished progressively from 2.28 ha in 1970-71 to 1.55 ha in 1990-91 to 1.23 ha in 2005-06. As per Agriculture Census 2005-06, the proportion of marginal holdings
Product (US$ / Kg) (tonnes/ Hectare
India
(tonnes/ hectare)
World’s best Country
Wheat 0.15 2.8 8.9 Netherlands
Sugar cane 0.03 66 125 Peru
Bananas 0.28 37.8 59.3 Indonesia
Fresh Vegetables 0.19 13.4 76.8 USA
Buffalo meat 2.69 0.138 0.424 Thailand
Soya bean 0.26 1.1 3.7 Turky
Eggs 2.7 0.1 0.42 Japan
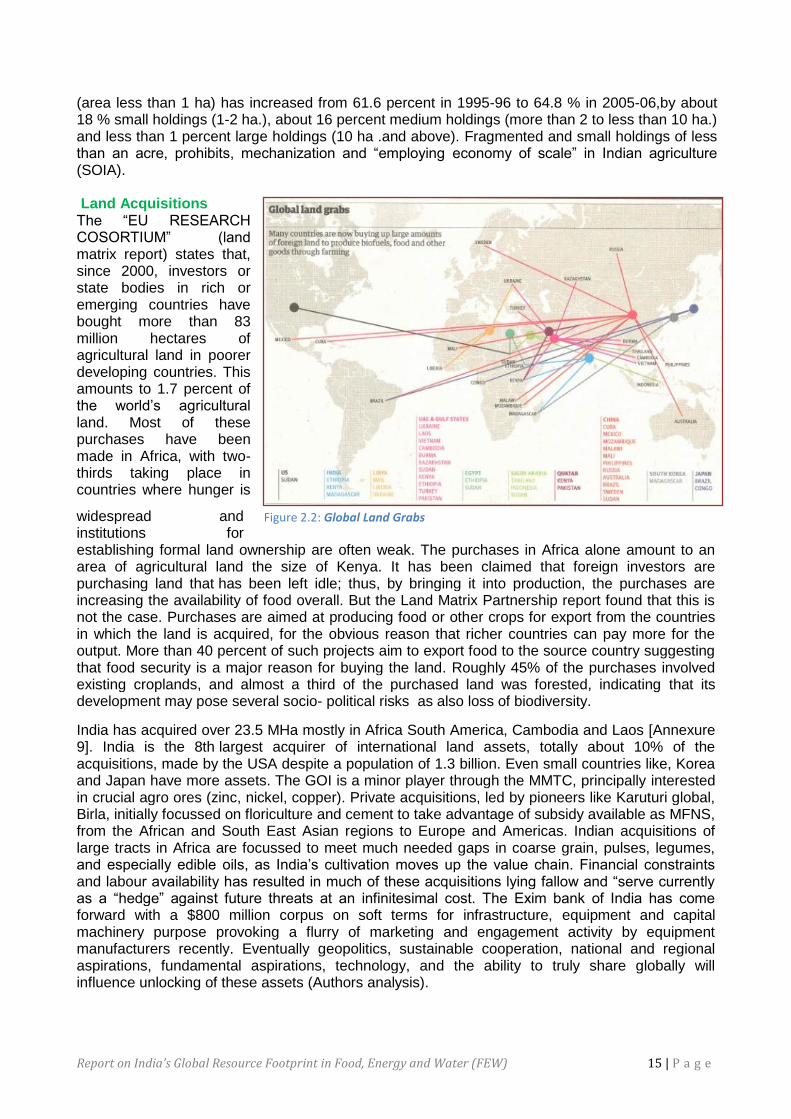
Report on India’s Global Resource Footprint in Food, Energy and Water (FEW) 15 | P a g e
(area less than 1 ha) has increased from 61.6 percent in 1995-96 to 64.8 % in 2005-06,by about 18 % small holdings (1-2 ha.), about 16 percent medium holdings (more than 2 to less than 10 ha.) and less than 1 percent large holdings (10 ha .and above). Fragmented and small holdings of less than an acre, prohibits, mechanization and ―employing economy of scale‖ in Indian agriculture (SOIA). Land Acquisitions The ―EU RESEARCH COSORTIUM‖ (land matrix report) states that, since 2000, investors or state bodies in rich or emerging countries have bought more than 83 million hectares of agricultural land in poorer developing countries. This amounts to 1.7 percent of the world‘s agricultural land. Most of these purchases have been made in Africa, with two-thirds taking place in countries where hunger is
widespread and institutions for establishing formal land ownership are often weak. The purchases in Africa alone amount to an area of agricultural land the size of Kenya. It has been claimed that foreign investors are purchasing land that has been left idle; thus, by bringing it into production, the purchases are increasing the availability of food overall. But the Land Matrix Partnership report found that this is not the case. Purchases are aimed at producing food or other crops for export from the countries in which the land is acquired, for the obvious reason that richer countries can pay more for the output. More than 40 percent of such projects aim to export food to the source country suggesting that food security is a major reason for buying the land. Roughly 45% of the purchases involved existing croplands, and almost a third of the purchased land was forested, indicating that its development may pose several socio- political risks as also loss of biodiversity.
India has acquired over 23.5 MHa mostly in Africa South America, Cambodia and Laos [Annexure 9]. India is the 8th largest acquirer of international land assets, totally about 10% of the acquisitions, made by the USA despite a population of 1.3 billion. Even small countries like, Korea and Japan have more assets. The GOI is a minor player through the MMTC, principally interested in crucial agro ores (zinc, nickel, copper). Private acquisitions, led by pioneers like Karuturi global, Birla, initially focussed on floriculture and cement to take advantage of subsidy available as MFNS, from the African and South East Asian regions to Europe and Americas. Indian acquisitions of large tracts in Africa are focussed to meet much needed gaps in coarse grain, pulses, legumes, and especially edible oils, as India‘s cultivation moves up the value chain. Financial constraints and labour availability has resulted in much of these acquisitions lying fallow and ―serve currently as a ―hedge‖ against future threats at an infinitesimal cost. The Exim bank of India has come forward with a $800 million corpus on soft terms for infrastructure, equipment and capital machinery purpose provoking a flurry of marketing and engagement activity by equipment manufacturers recently. Eventually geopolitics, sustainable cooperation, national and regional aspirations, fundamental aspirations, technology, and the ability to truly share globally will influence unlocking of these assets (Authors analysis).
Figure 2.2: Global Land Grabs
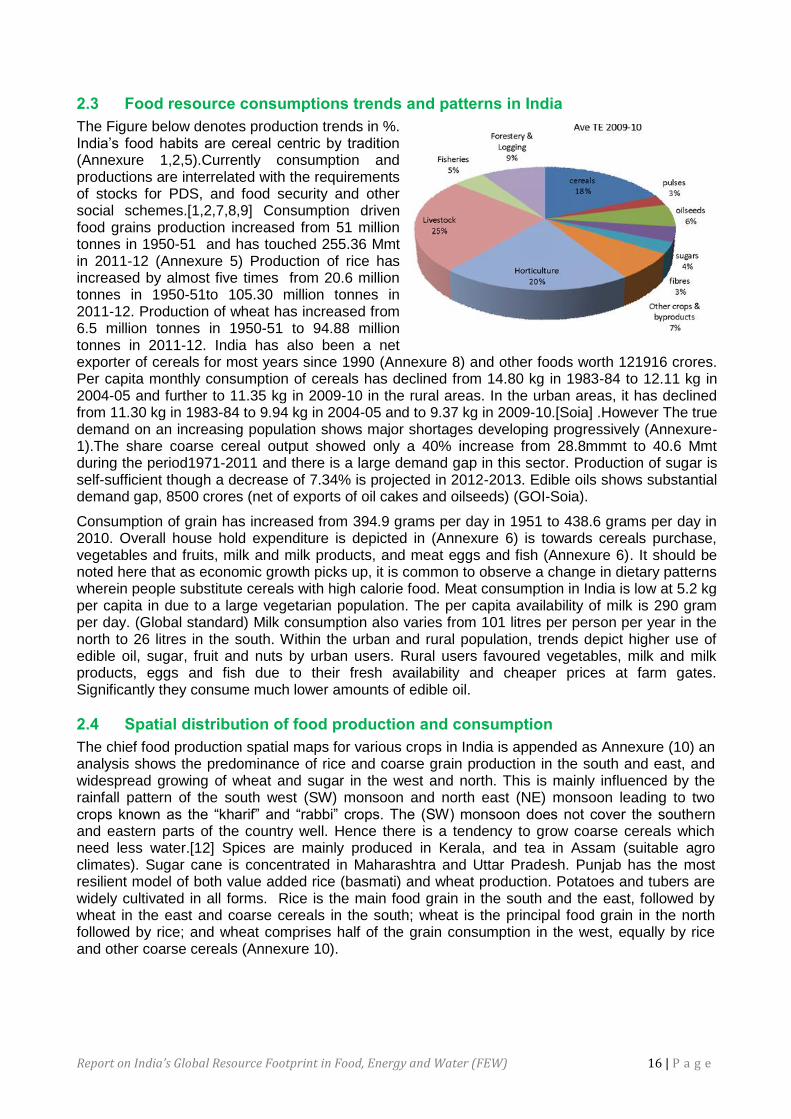
Report on India’s Global Resource Footprint in Food, Energy and Water (FEW) 16 | P a g e
2.3 Food resource consumptions trends and patterns in India
The Figure below denotes production trends in %. India‘s food habits are cereal centric by tradition (Annexure 1,2,5).Currently consumption and productions are interrelated with the requirements of stocks for PDS, and food security and other social schemes.[1,2,7,8,9] Consumption driven food grains production increased from 51 million tonnes in 1950-51 and has touched 255.36 Mmt in 2011-12 (Annexure 5) Production of rice has increased by almost five times from 20.6 million tonnes in 1950-51to 105.30 million tonnes in 2011-12. Production of wheat has increased from 6.5 million tonnes in 1950-51 to 94.88 million tonnes in 2011-12. India has also been a net exporter of cereals for most years since 1990 (Annexure 8) and other foods worth 121916 crores. Per capita monthly consumption of cereals has declined from 14.80 kg in 1983-84 to 12.11 kg in 2004-05 and further to 11.35 kg in 2009-10 in the rural areas. In the urban areas, it has declined from 11.30 kg in 1983-84 to 9.94 kg in 2004-05 and to 9.37 kg in 2009-10.[Soia] .However The true demand on an increasing population shows major shortages developing progressively (Annexure-1).The share coarse cereal output showed only a 40% increase from 28.8mmmt to 40.6 Mmt during the period1971-2011 and there is a large demand gap in this sector. Production of sugar is self-sufficient though a decrease of 7.34% is projected in 2012-2013. Edible oils shows substantial demand gap, 8500 crores (net of exports of oil cakes and oilseeds) (GOI-Soia).
Consumption of grain has increased from 394.9 grams per day in 1951 to 438.6 grams per day in 2010. Overall house hold expenditure is depicted in (Annexure 6) is towards cereals purchase, vegetables and fruits, milk and milk products, and meat eggs and fish (Annexure 6). It should be noted here that as economic growth picks up, it is common to observe a change in dietary patterns wherein people substitute cereals with high calorie food. Meat consumption in India is low at 5.2 kg per capita in due to a large vegetarian population. The per capita availability of milk is 290 gram per day. (Global standard) Milk consumption also varies from 101 litres per person per year in the north to 26 litres in the south. Within the urban and rural population, trends depict higher use of edible oil, sugar, fruit and nuts by urban users. Rural users favoured vegetables, milk and milk products, eggs and fish due to their fresh availability and cheaper prices at farm gates. Significantly they consume much lower amounts of edible oil.
2.4 Spatial distribution of food production and consumption
The chief food production spatial maps for various crops in India is appended as Annexure (10) an analysis shows the predominance of rice and coarse grain production in the south and east, and widespread growing of wheat and sugar in the west and north. This is mainly influenced by the rainfall pattern of the south west (SW) monsoon and north east (NE) monsoon leading to two crops known as the ―kharif‖ and ―rabbi‖ crops. The (SW) monsoon does not cover the southern and eastern parts of the country well. Hence there is a tendency to grow coarse cereals which need less water.[12] Spices are mainly produced in Kerala, and tea in Assam (suitable agro climates). Sugar cane is concentrated in Maharashtra and Uttar Pradesh. Punjab has the most resilient model of both value added rice (basmati) and wheat production. Potatoes and tubers are widely cultivated in all forms. Rice is the main food grain in the south and the east, followed by wheat in the east and coarse cereals in the south; wheat is the principal food grain in the north followed by rice; and wheat comprises half of the grain consumption in the west, equally by rice and other coarse cereals (Annexure 10).
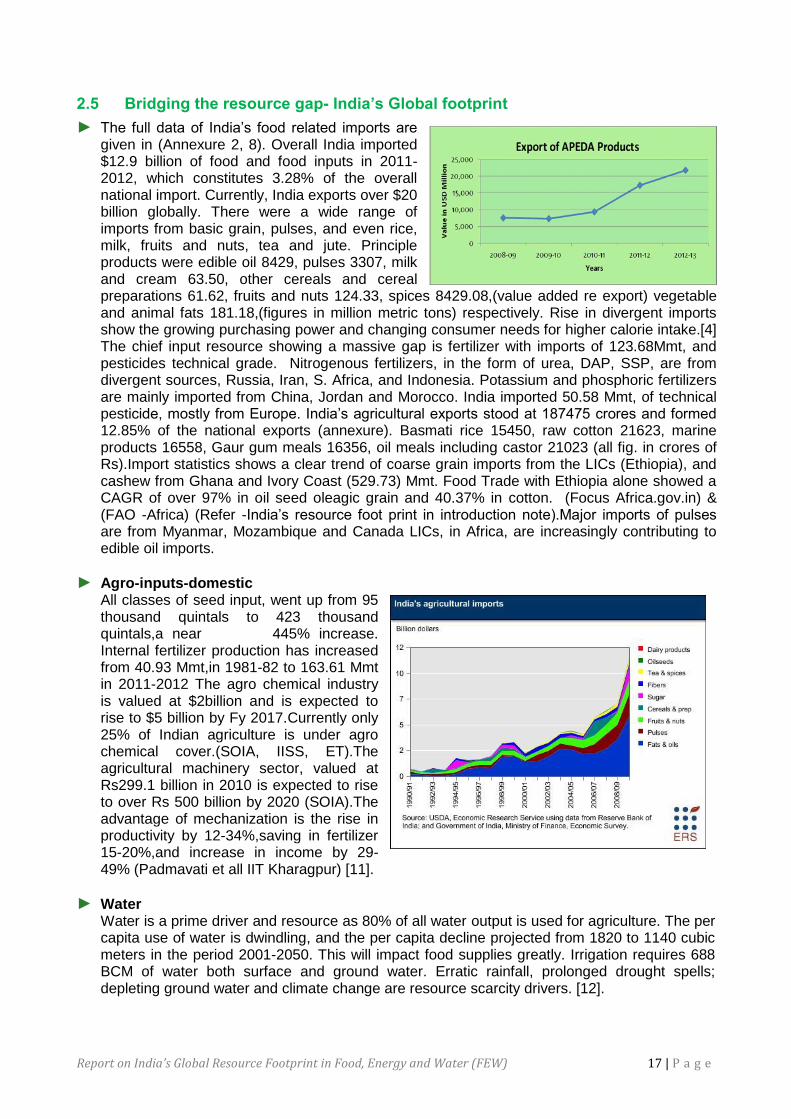
Report on India’s Global Resource Footprint in Food, Energy and Water (FEW) 17 | P a g e
2.5 Bridging the resource gap- India’s Global footprint
► The full data of India‘s food related imports are given in (Annexure 2, 8). Overall India imported $12.9 billion of food and food inputs in 2011-2012, which constitutes 3.28% of the overall national import. Currently, India exports over $20 billion globally. There were a wide range of imports from basic grain, pulses, and even rice, milk, fruits and nuts, tea and jute. Principle products were edible oil 8429, pulses 3307, milk and cream 63.50, other cereals and cereal preparations 61.62, fruits and nuts 124.33, spices 8429.08,(value added re export) vegetable and animal fats 181.18,(figures in million metric tons) respectively. Rise in divergent imports show the growing purchasing power and changing consumer needs for higher calorie intake.[4] The chief input resource showing a massive gap is fertilizer with imports of 123.68Mmt, and pesticides technical grade. Nitrogenous fertilizers, in the form of urea, DAP, SSP, are from divergent sources, Russia, Iran, S. Africa, and Indonesia. Potassium and phosphoric fertilizers are mainly imported from China, Jordan and Morocco. India imported 50.58 Mmt, of technical pesticide, mostly from Europe. India‘s agricultural exports stood at 187475 crores and formed 12.85% of the national exports (annexure). Basmati rice 15450, raw cotton 21623, marine products 16558, Gaur gum meals 16356, oil meals including castor 21023 (all fig. in crores of Rs).Import statistics shows a clear trend of coarse grain imports from the LICs (Ethiopia), and cashew from Ghana and Ivory Coast (529.73) Mmt. Food Trade with Ethiopia alone showed a CAGR of over 97% in oil seed oleagic grain and 40.37% in cotton. (Focus Africa.gov.in) & (FAO -Africa) (Refer -India‘s resource foot print in introduction note).Major imports of pulses are from Myanmar, Mozambique and Canada LICs, in Africa, are increasingly contributing to edible oil imports.
► Agro-inputs-domestic All classes of seed input, went up from 95 thousand quintals to 423 thousand quintals,a near 445% increase. Internal fertilizer production has increased from 40.93 Mmt,in 1981-82 to 163.61 Mmt in 2011-2012 The agro chemical industry is valued at $2billion and is expected to rise to $5 billion by Fy 2017.Currently only 25% of Indian agriculture is under agro chemical cover.(SOIA, IISS, ET).The agricultural machinery sector, valued at Rs299.1 billion in 2010 is expected to rise to over Rs 500 billion by 2020 (SOIA).The advantage of mechanization is the rise in productivity by 12-34%,saving in fertilizer 15-20%,and increase in income by 29-49% (Padmavati et all IIT Kharagpur) [11].
► Water Water is a prime driver and resource as 80% of all water output is used for agriculture. The per capita use of water is dwindling, and the per capita decline projected from 1820 to 1140 cubic meters in the period 2001-2050. This will impact food supplies greatly. Irrigation requires 688 BCM of water both surface and ground water. Erratic rainfall, prolonged drought spells; depleting ground water and climate change are resource scarcity drivers. [12].
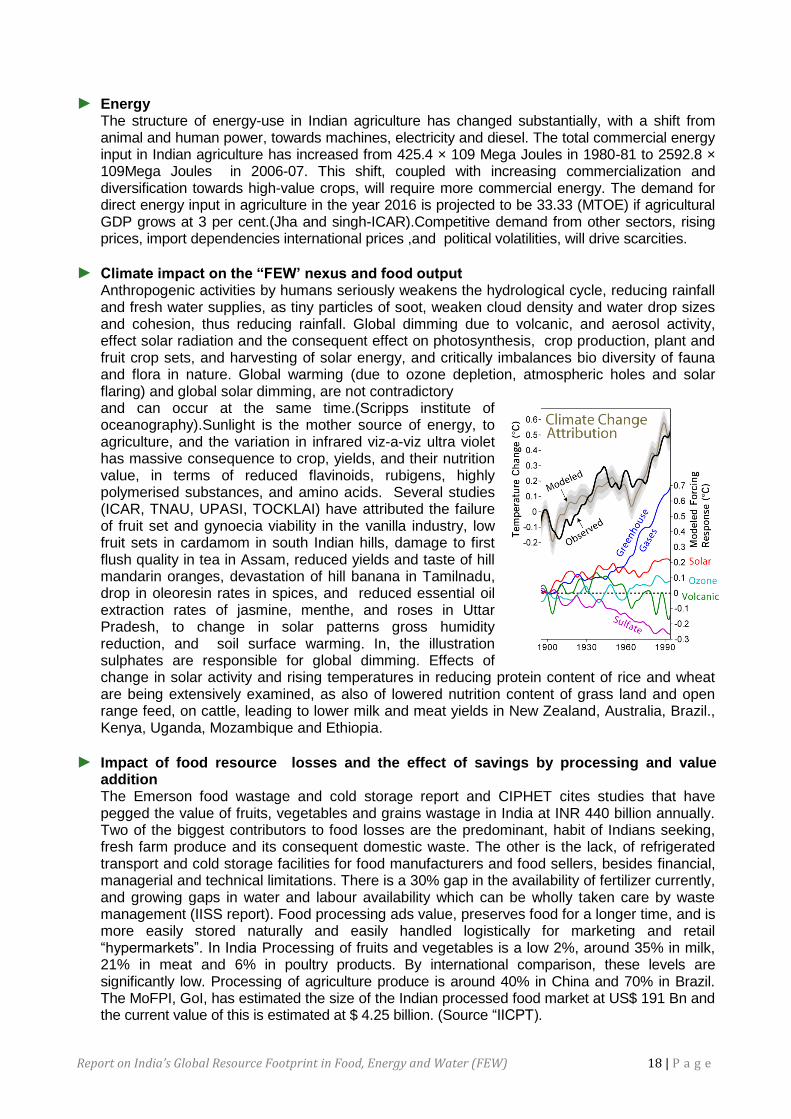
Report on India’s Global Resource Footprint in Food, Energy and Water (FEW) 18 | P a g e
► Energy The structure of energy-use in Indian agriculture has changed substantially, with a shift from animal and human power, towards machines, electricity and diesel. The total commercial energy input in Indian agriculture has increased from 425.4 × 10⁹ Mega Joules in 1980-81 to 2592.8 × 109Mega Joules in 2006-07. This shift, coupled with increasing commercialization and diversification towards high-value crops, will require more commercial energy. The demand for direct energy input in agriculture in the year 2016 is projected to be 33.33 (MTOE) if agricultural GDP grows at 3 per cent.(Jha and singh-ICAR).Competitive demand from other sectors, rising prices, import dependencies international prices ,and political volatilities, will drive scarcities.
► Climate impact on the “FEW’ nexus and food output Anthropogenic activities by humans seriously weakens the hydrological cycle, reducing rainfall and fresh water supplies, as tiny particles of soot, weaken cloud density and water drop sizes and cohesion, thus reducing rainfall. Global dimming due to volcanic, and aerosol activity, effect solar radiation and the consequent effect on photosynthesis, crop production, plant and fruit crop sets, and harvesting of solar energy, and critically imbalances bio diversity of fauna and flora in nature. Global warming (due to ozone depletion, atmospheric holes and solar flaring) and global solar dimming, are not contradictory and can occur at the same time.(Scripps institute of oceanography).Sunlight is the mother source of energy, to agriculture, and the variation in infrared viz-a-viz ultra violet has massive consequence to crop, yields, and their nutrition value, in terms of reduced flavinoids, rubigens, highly polymerised substances, and amino acids. Several studies (ICAR, TNAU, UPASI, TOCKLAI) have attributed the failure of fruit set and gynoecia viability in the vanilla industry, low fruit sets in cardamom in south Indian hills, damage to first flush quality in tea in Assam, reduced yields and taste of hill mandarin oranges, devastation of hill banana in Tamilnadu, drop in oleoresin rates in spices, and reduced essential oil extraction rates of jasmine, menthe, and roses in Uttar Pradesh, to change in solar patterns gross humidity reduction, and soil surface warming. In, the illustration sulphates are responsible for global dimming. Effects of change in solar activity and rising temperatures in reducing protein content of rice and wheat are being extensively examined, as also of lowered nutrition content of grass land and open range feed, on cattle, leading to lower milk and meat yields in New Zealand, Australia, Brazil., Kenya, Uganda, Mozambique and Ethiopia.
► Impact of food resource losses and the effect of savings by processing and value addition The Emerson food wastage and cold storage report and CIPHET cites studies that have pegged the value of fruits, vegetables and grains wastage in India at INR 440 billion annually. Two of the biggest contributors to food losses are the predominant, habit of Indians seeking, fresh farm produce and its consequent domestic waste. The other is the lack, of refrigerated transport and cold storage facilities for food manufacturers and food sellers, besides financial, managerial and technical limitations. There is a 30% gap in the availability of fertilizer currently, and growing gaps in water and labour availability which can be wholly taken care by waste management (IISS report). Food processing ads value, preserves food for a longer time, and is more easily stored naturally and easily handled logistically for marketing and retail ―hypermarkets‖. In India Processing of fruits and vegetables is a low 2%, around 35% in milk, 21% in meat and 6% in poultry products. By international comparison, these levels are significantly low. Processing of agriculture produce is around 40% in China and 70% in Brazil. The MoFPI, GoI, has estimated the size of the Indian processed food market at US$ 191 Bn and the current value of this is estimated at $ 4.25 billion. (Source ―IICPT).
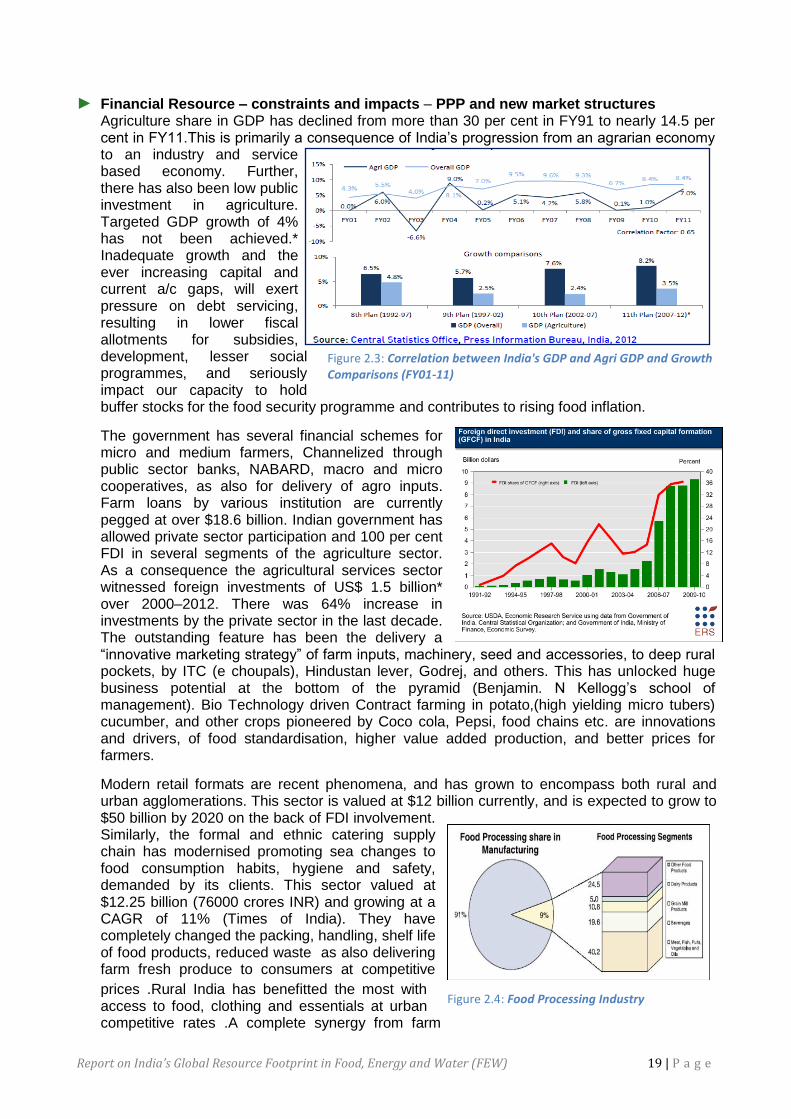
Report on India’s Global Resource Footprint in Food, Energy and Water (FEW) 19 | P a g e
► Financial Resource – constraints and impacts – PPP and new market structures Agriculture share in GDP has declined from more than 30 per cent in FY91 to nearly 14.5 per cent in FY11.This is primarily a consequence of India‘s progression from an agrarian economy to an industry and service based economy. Further, there has also been low public investment in agriculture. Targeted GDP growth of 4% has not been achieved.* Inadequate growth and the ever increasing capital and current a/c gaps, will exert pressure on debt servicing, resulting in lower fiscal allotments for subsidies, development, lesser social programmes, and seriously impact our capacity to hold buffer stocks for the food security programme and contributes to rising food inflation.
The government has several financial schemes for micro and medium farmers, Channelized through public sector banks, NABARD, macro and micro cooperatives, as also for delivery of agro inputs. Farm loans by various institution are currently pegged at over $18.6 billion. Indian government has allowed private sector participation and 100 per cent FDI in several segments of the agriculture sector. As a consequence the agricultural services sector witnessed foreign investments of US$ 1.5 billion* over 2000–2012. There was 64% increase in investments by the private sector in the last decade. The outstanding feature has been the delivery a ―innovative marketing strategy‖ of farm inputs, machinery, seed and accessories, to deep rural pockets, by ITC (e choupals), Hindustan lever, Godrej, and others. This has unlocked huge business potential at the bottom of the pyramid (Benjamin. N Kellogg‘s school of management). Bio Technology driven Contract farming in potato,(high yielding micro tubers) cucumber, and other crops pioneered by Coco cola, Pepsi, food chains etc. are innovations and drivers, of food standardisation, higher value added production, and better prices for farmers.
Modern retail formats are recent phenomena, and has grown to encompass both rural and urban agglomerations. This sector is valued at $12 billion currently, and is expected to grow to $50 billion by 2020 on the back of FDI involvement. Similarly, the formal and ethnic catering supply chain has modernised promoting sea changes to food consumption habits, hygiene and safety, demanded by its clients. This sector valued at $12.25 billion (76000 crores INR) and growing at a CAGR of 11% (Times of India). They have completely changed the packing, handling, shelf life of food products, reduced waste as also delivering farm fresh produce to consumers at competitive
prices .Rural India has benefitted the most with access to food, clothing and essentials at urban competitive rates .A complete synergy from farm
Figure 2.3: Correlation between India's GDP and Agri GDP and Growth Comparisons (FY01-11)
Figure 2.4: Food Processing Industry
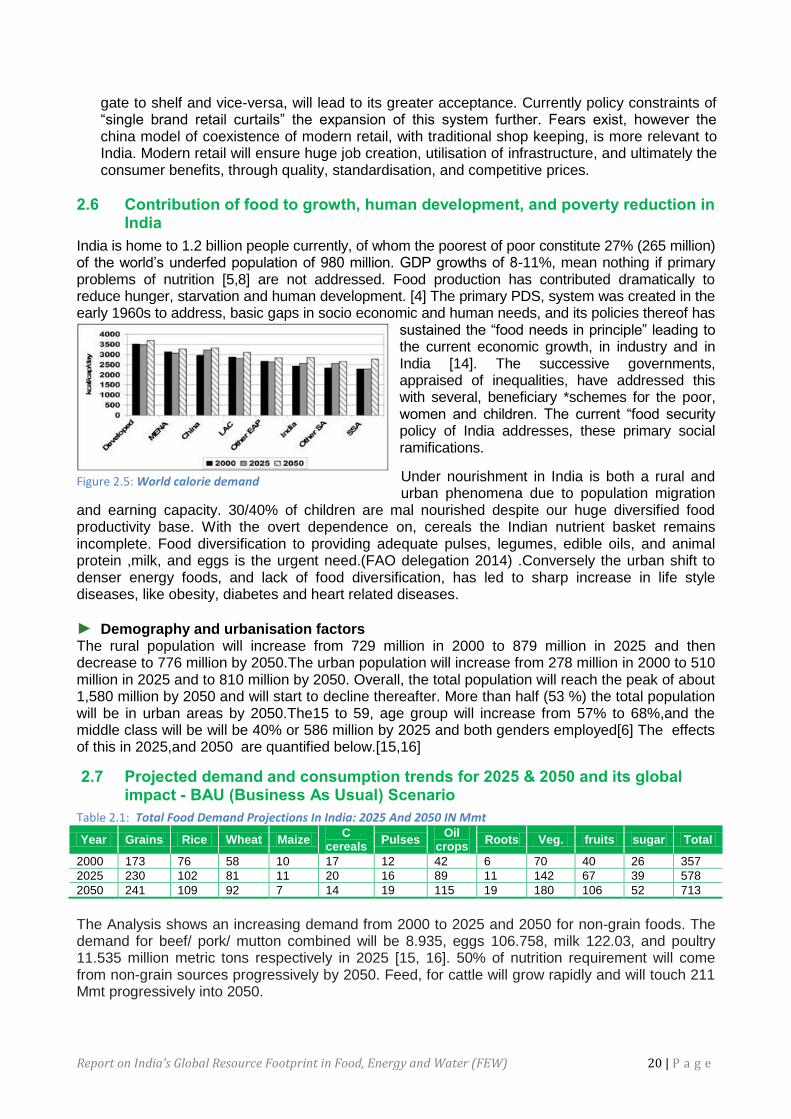
Report on India’s Global Resource Footprint in Food, Energy and Water (FEW) 20 | P a g e
gate to shelf and vice-versa, will lead to its greater acceptance. Currently policy constraints of ―single brand retail curtails‖ the expansion of this system further. Fears exist, however the china model of coexistence of modern retail, with traditional shop keeping, is more relevant to India. Modern retail will ensure huge job creation, utilisation of infrastructure, and ultimately the consumer benefits, through quality, standardisation, and competitive prices.
2.6 Contribution of food to growth, human development, and poverty reduction in India
India is home to 1.2 billion people currently, of whom the poorest of poor constitute 27% (265 million) of the world‘s underfed population of 980 million. GDP growths of 8-11%, mean nothing if primary problems of nutrition [5,8] are not addressed. Food production has contributed dramatically to reduce hunger, starvation and human development. [4] The primary PDS, system was created in the early 1960s to address, basic gaps in socio economic and human needs, and its policies thereof has
sustained the ―food needs in principle‖ leading to the current economic growth, in industry and in India [14]. The successive governments, appraised of inequalities, have addressed this with several, beneficiary *schemes for the poor, women and children. The current ―food security policy of India addresses, these primary social ramifications.
Under nourishment in India is both a rural and urban phenomena due to population migration
and earning capacity. 30/40% of children are mal nourished despite our huge diversified food productivity base. With the overt dependence on, cereals the Indian nutrient basket remains incomplete. Food diversification to providing adequate pulses, legumes, edible oils, and animal protein ,milk, and eggs is the urgent need.(FAO delegation 2014) .Conversely the urban shift to denser energy foods, and lack of food diversification, has led to sharp increase in life style diseases, like obesity, diabetes and heart related diseases.
► Demography and urbanisation factors The rural population will increase from 729 million in 2000 to 879 million in 2025 and then decrease to 776 million by 2050.The urban population will increase from 278 million in 2000 to 510 million in 2025 and to 810 million by 2050. Overall, the total population will reach the peak of about 1,580 million by 2050 and will start to decline thereafter. More than half (53 %) the total population will be in urban areas by 2050.The15 to 59, age group will increase from 57% to 68%,and the middle class will be will be 40% or 586 million by 2025 and both genders employed[6] The effects of this in 2025,and 2050 are quantified below.[15,16]
2.7 Projected demand and consumption trends for 2025 & 2050 and its global impact - BAU (Business As Usual) Scenario
Table 2.1: Total Food Demand Projections In India: 2025 And 2050 IN Mmt
Year Grains Rice Wheat Maize C
cereals Pulses
Oil crops
Roots Veg. fruits sugar Total
2000 173 76 58 10 17 12 42 6 70 40 26 357
2025 230 102 81 11 20 16 89 11 142 67 39 578
2050 241 109 92 7 14 19 115 19 180 106 52 713
The Analysis shows an increasing demand from 2000 to 2025 and 2050 for non-grain foods. The demand for beef/ pork/ mutton combined will be 8.935, eggs 106.758, milk 122.03, and poultry 11.535 million metric tons respectively in 2025 [15, 16]. 50% of nutrition requirement will come from non-grain sources progressively by 2050. Feed, for cattle will grow rapidly and will touch 211 Mmt progressively into 2050.
Figure 2.5: World calorie demand
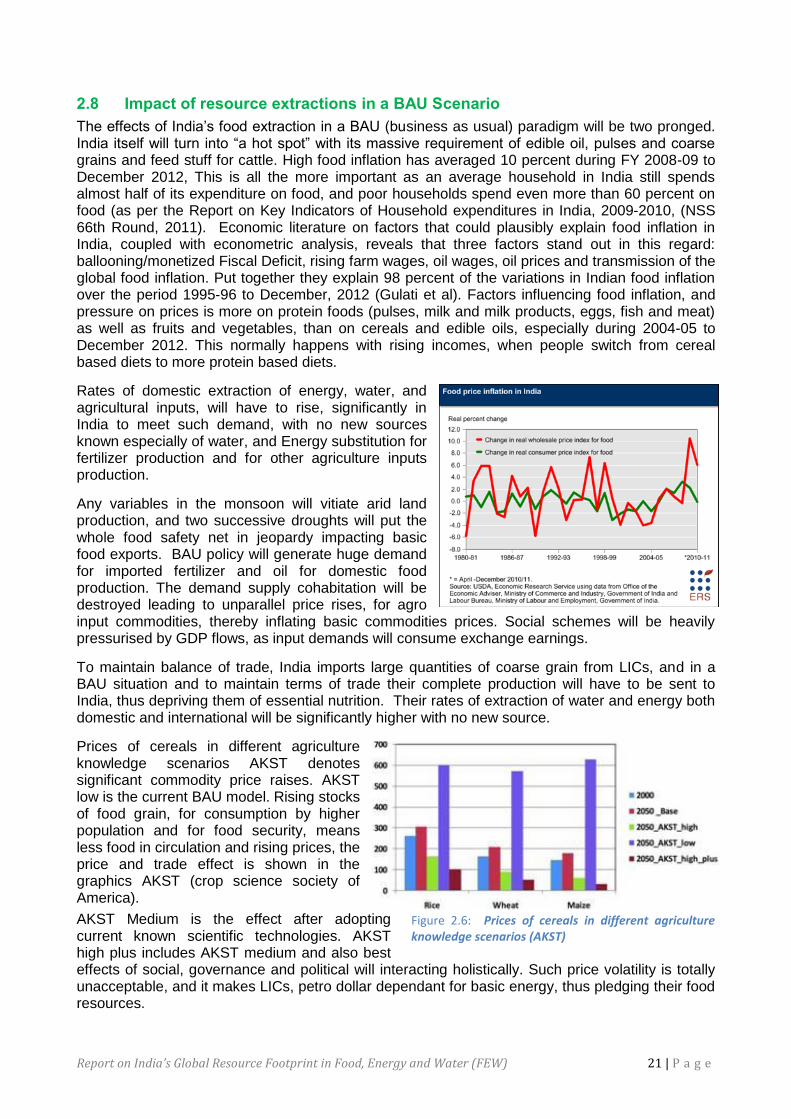
Report on India’s Global Resource Footprint in Food, Energy and Water (FEW) 21 | P a g e
2.8 Impact of resource extractions in a BAU Scenario
The effects of India‘s food extraction in a BAU (business as usual) paradigm will be two pronged. India itself will turn into ―a hot spot‖ with its massive requirement of edible oil, pulses and coarse grains and feed stuff for cattle. High food inflation has averaged 10 percent during FY 2008-09 to December 2012, This is all the more important as an average household in India still spends almost half of its expenditure on food, and poor households spend even more than 60 percent on food (as per the Report on Key Indicators of Household expenditures in India, 2009-2010, (NSS 66th Round, 2011). Economic literature on factors that could plausibly explain food inflation in India, coupled with econometric analysis, reveals that three factors stand out in this regard: ballooning/monetized Fiscal Deficit, rising farm wages, oil wages, oil prices and transmission of the global food inflation. Put together they explain 98 percent of the variations in Indian food inflation over the period 1995-96 to December, 2012 (Gulati et al). Factors influencing food inflation, and pressure on prices is more on protein foods (pulses, milk and milk products, eggs, fish and meat) as well as fruits and vegetables, than on cereals and edible oils, especially during 2004-05 to December 2012. This normally happens with rising incomes, when people switch from cereal based diets to more protein based diets.
Rates of domestic extraction of energy, water, and agricultural inputs, will have to rise, significantly in India to meet such demand, with no new sources known especially of water, and Energy substitution for fertilizer production and for other agriculture inputs production.
Any variables in the monsoon will vitiate arid land production, and two successive droughts will put the whole food safety net in jeopardy impacting basic food exports. BAU policy will generate huge demand for imported fertilizer and oil for domestic food production. The demand supply cohabitation will be destroyed leading to unparallel price rises, for agro input commodities, thereby inflating basic commodities prices. Social schemes will be heavily pressurised by GDP flows, as input demands will consume exchange earnings.
To maintain balance of trade, India imports large quantities of coarse grain from LICs, and in a BAU situation and to maintain terms of trade their complete production will have to be sent to India, thus depriving them of essential nutrition. Their rates of extraction of water and energy both domestic and international will be significantly higher with no new source.
Prices of cereals in different agriculture knowledge scenarios AKST denotes significant commodity price raises. AKST low is the current BAU model. Rising stocks of food grain, for consumption by higher population and for food security, means less food in circulation and rising prices, the price and trade effect is shown in the graphics AKST (crop science society of America).
AKST Medium is the effect after adopting current known scientific technologies. AKST high plus includes AKST medium and also best effects of social, governance and political will interacting holistically. Such price volatility is totally unacceptable, and it makes LICs, petro dollar dependant for basic energy, thus pledging their food resources.
Figure 2.6: Prices of cereals in different agriculture knowledge scenarios (AKST)
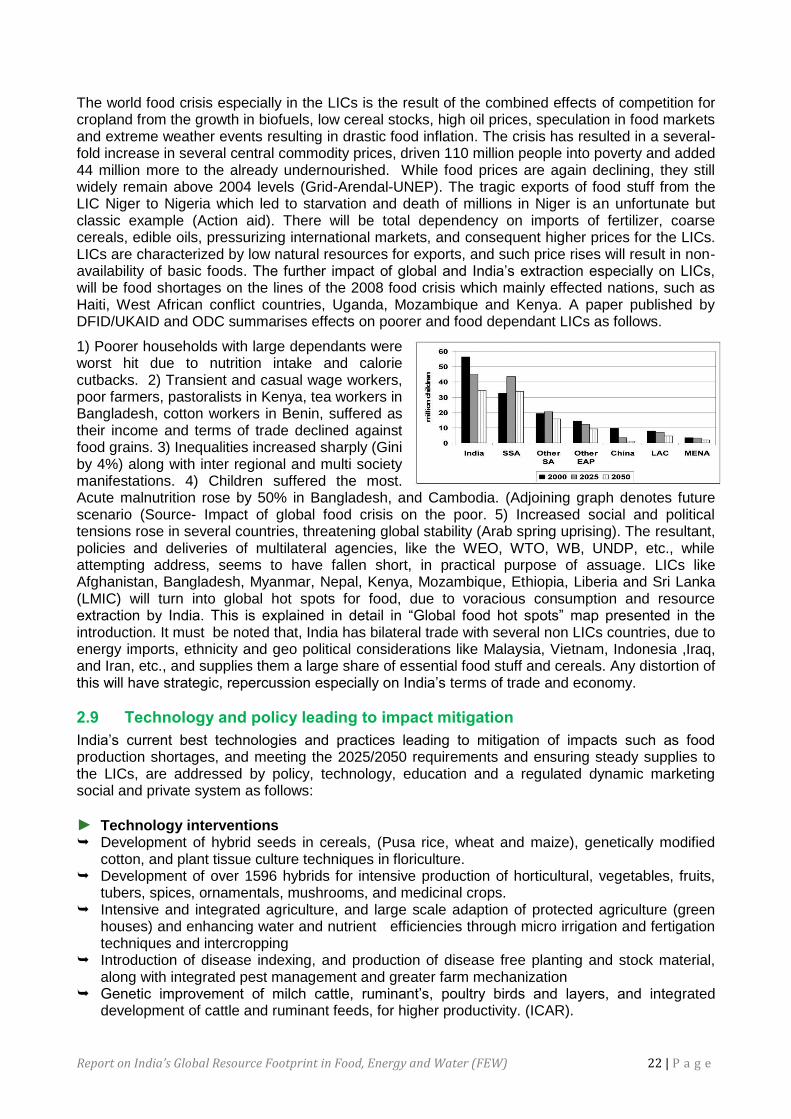
Report on India’s Global Resource Footprint in Food, Energy and Water (FEW) 22 | P a g e
The world food crisis especially in the LICs is the result of the combined effects of competition for cropland from the growth in biofuels, low cereal stocks, high oil prices, speculation in food markets and extreme weather events resulting in drastic food inflation. The crisis has resulted in a several-fold increase in several central commodity prices, driven 110 million people into poverty and added 44 million more to the already undernourished. While food prices are again declining, they still widely remain above 2004 levels (Grid-Arendal-UNEP). The tragic exports of food stuff from the LIC Niger to Nigeria which led to starvation and death of millions in Niger is an unfortunate but classic example (Action aid). There will be total dependency on imports of fertilizer, coarse cereals, edible oils, pressurizing international markets, and consequent higher prices for the LICs. LICs are characterized by low natural resources for exports, and such price rises will result in non-availability of basic foods. The further impact of global and India‘s extraction especially on LICs, will be food shortages on the lines of the 2008 food crisis which mainly effected nations, such as Haiti, West African conflict countries, Uganda, Mozambique and Kenya. A paper published by DFID/UKAID and ODC summarises effects on poorer and food dependant LICs as follows.
1) Poorer households with large dependants were worst hit due to nutrition intake and calorie cutbacks. 2) Transient and casual wage workers, poor farmers, pastoralists in Kenya, tea workers in Bangladesh, cotton workers in Benin, suffered as their income and terms of trade declined against food grains. 3) Inequalities increased sharply (Gini by 4%) along with inter regional and multi society manifestations. 4) Children suffered the most. Acute malnutrition rose by 50% in Bangladesh, and Cambodia. (Adjoining graph denotes future scenario (Source- Impact of global food crisis on the poor. 5) Increased social and political tensions rose in several countries, threatening global stability (Arab spring uprising). The resultant, policies and deliveries of multilateral agencies, like the WEO, WTO, WB, UNDP, etc., while attempting address, seems to have fallen short, in practical purpose of assuage. LICs like Afghanistan, Bangladesh, Myanmar, Nepal, Kenya, Mozambique, Ethiopia, Liberia and Sri Lanka (LMIC) will turn into global hot spots for food, due to voracious consumption and resource extraction by India. This is explained in detail in ―Global food hot spots‖ map presented in the introduction. It must be noted that, India has bilateral trade with several non LICs countries, due to energy imports, ethnicity and geo political considerations like Malaysia, Vietnam, Indonesia ,Iraq, and Iran, etc., and supplies them a large share of essential food stuff and cereals. Any distortion of this will have strategic, repercussion especially on India‘s terms of trade and economy.
2.9 Technology and policy leading to impact mitigation
India‘s current best technologies and practices leading to mitigation of impacts such as food production shortages, and meeting the 2025/2050 requirements and ensuring steady supplies to the LICs, are addressed by policy, technology, education and a regulated dynamic marketing social and private system as follows:
► Technology interventions Development of hybrid seeds in cereals, (Pusa rice, wheat and maize), genetically modified
cotton, and plant tissue culture techniques in floriculture. Development of over 1596 hybrids for intensive production of horticultural, vegetables, fruits,
tubers, spices, ornamentals, mushrooms, and medicinal crops. Intensive and integrated agriculture, and large scale adaption of protected agriculture (green
houses) and enhancing water and nutrient efficiencies through micro irrigation and fertigation techniques and intercropping
Introduction of disease indexing, and production of disease free planting and stock material, along with integrated pest management and greater farm mechanization
Genetic improvement of milch cattle, ruminant‘s, poultry birds and layers, and integrated development of cattle and ruminant feeds, for higher productivity. (ICAR).
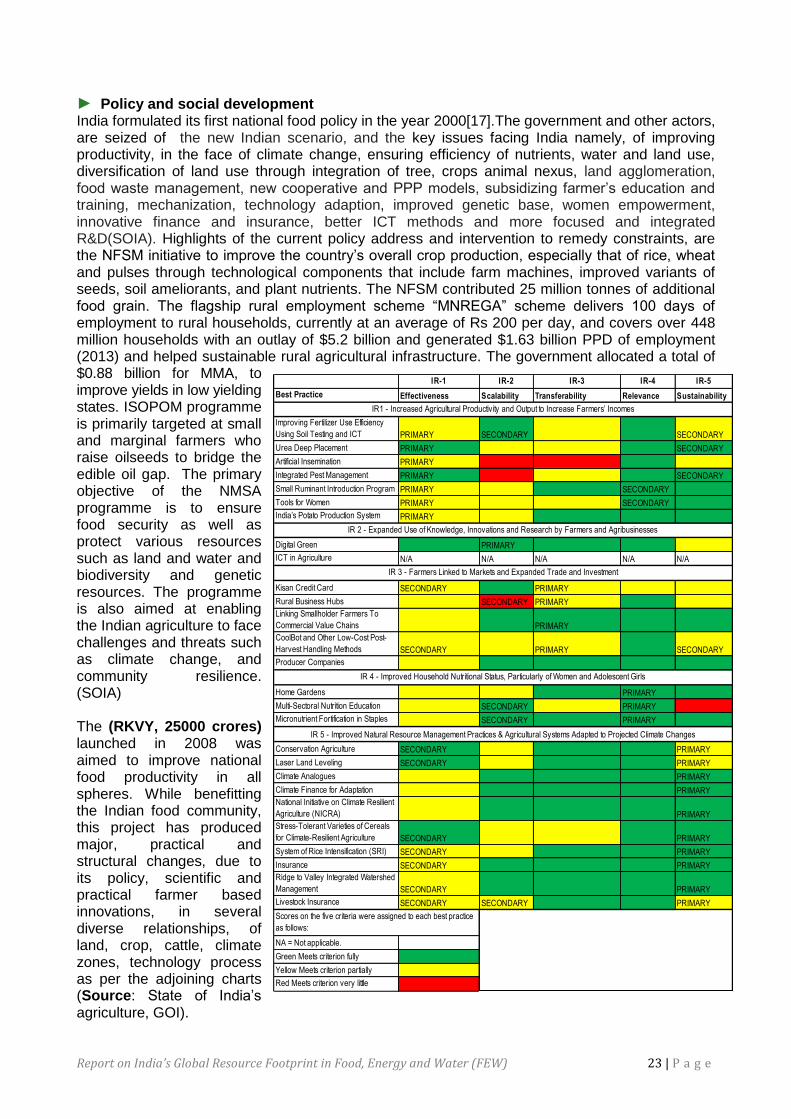
Report on India’s Global Resource Footprint in Food, Energy and Water (FEW) 23 | P a g e
► Policy and social development India formulated its first national food policy in the year 2000[17].The government and other actors, are seized of the new Indian scenario, and the key issues facing India namely, of improving productivity, in the face of climate change, ensuring efficiency of nutrients, water and land use, diversification of land use through integration of tree, crops animal nexus, land agglomeration, food waste management, new cooperative and PPP models, subsidizing farmer‘s education and training, mechanization, technology adaption, improved genetic base, women empowerment, innovative finance and insurance, better ICT methods and more focused and integrated R&D(SOIA). Highlights of the current policy address and intervention to remedy constraints, are the NFSM initiative to improve the country‘s overall crop production, especially that of rice, wheat and pulses through technological components that include farm machines, improved variants of seeds, soil ameliorants, and plant nutrients. The NFSM contributed 25 million tonnes of additional food grain. The flagship rural employment scheme ―MNREGA‖ scheme delivers 100 days of employment to rural households, currently at an average of Rs 200 per day, and covers over 448 million households with an outlay of $5.2 billion and generated $1.63 billion PPD of employment (2013) and helped sustainable rural agricultural infrastructure. The government allocated a total of $0.88 billion for MMA, to improve yields in low yielding states. ISOPOM programme is primarily targeted at small and marginal farmers who raise oilseeds to bridge the edible oil gap. The primary objective of the NMSA programme is to ensure food security as well as protect various resources such as land and water and biodiversity and genetic resources. The programme is also aimed at enabling the Indian agriculture to face challenges and threats such as climate change, and community resilience. (SOIA) The (RKVY, 25000 crores) launched in 2008 was aimed to improve national food productivity in all spheres. While benefitting the Indian food community, this project has produced major, practical and structural changes, due to its policy, scientific and practical farmer based innovations, in several diverse relationships, of land, crop, cattle, climate zones, technology process as per the adjoining charts (Source: State of India‘s agriculture, GOI).
IR-1 IR-2 IR-3 IR-4 IR-5
Best Practice Effectiveness Scalability Transferability Relevance Sustainability
Improving Fertilizer Use Efficiency
Using Soil Testing and ICT PRIMARY SECONDARY SECONDARY
Urea Deep Placement PRIMARY SECONDARY
Artificial Insemination PRIMARY
Integrated Pest Management PRIMARY SECONDARY
Small Ruminant Introduction Program PRIMARY SECONDARY
Tools for Women PRIMARY SECONDARY
India’s Potato Production System PRIMARY
Digital Green PRIMARY
ICT in Agriculture N/A N/A N/A N/A N/A
Kisan Credit Card SECONDARY PRIMARY
Rural Business Hubs SECONDARY PRIMARY
Linking Smallholder Farmers To
Commercial Value Chains PRIMARY
CoolBot and Other Low-Cost Post-
Harvest Handling Methods SECONDARY PRIMARY SECONDARY
Producer Companies
Home Gardens PRIMARY
Multi-Sectoral Nutrition Education SECONDARY PRIMARY
Micronutrient Fortification in Staples SECONDARY PRIMARY
Conservation Agriculture SECONDARY PRIMARY
Laser Land Leveling SECONDARY PRIMARY
Climate Analogues PRIMARY
Climate Finance for Adaptation PRIMARY
National Initiative on Climate Resilient
Agriculture (NICRA) PRIMARY
Stress-Tolerant Varieties of Cereals
for Climate-Resilient Agriculture SECONDARY PRIMARY
System of Rice Intensification (SRI) SECONDARY PRIMARYWeather Index-Based Crop
Insurance SECONDARY PRIMARY
Ridge to Valley Integrated Watershed
Management SECONDARY PRIMARY
Livestock Insurance SECONDARY SECONDARY PRIMARY
NA = Not applicable.
Green Meets criterion fully
Yellow Meets criterion partially
Red Meets criterion very little
Scores on the five criteria were assigned to each best practice
as follows:
IR1 - Increased Agricultural Productivity and Output to Increase Farmers’ Incomes
IR 2 - Expanded Use of Knowledge, Innovations and Research by Farmers and Agribusinesses
IR 3 - Farmers Linked to Markets and Expanded Trade and Investment
IR 4 - Improved Household Nutritional Status, Particularly of Women and Adolescent Girls
IR 5 - Improved Natural Resource Management Practices & Agricultural Systems Adapted to Projected Climate Changes
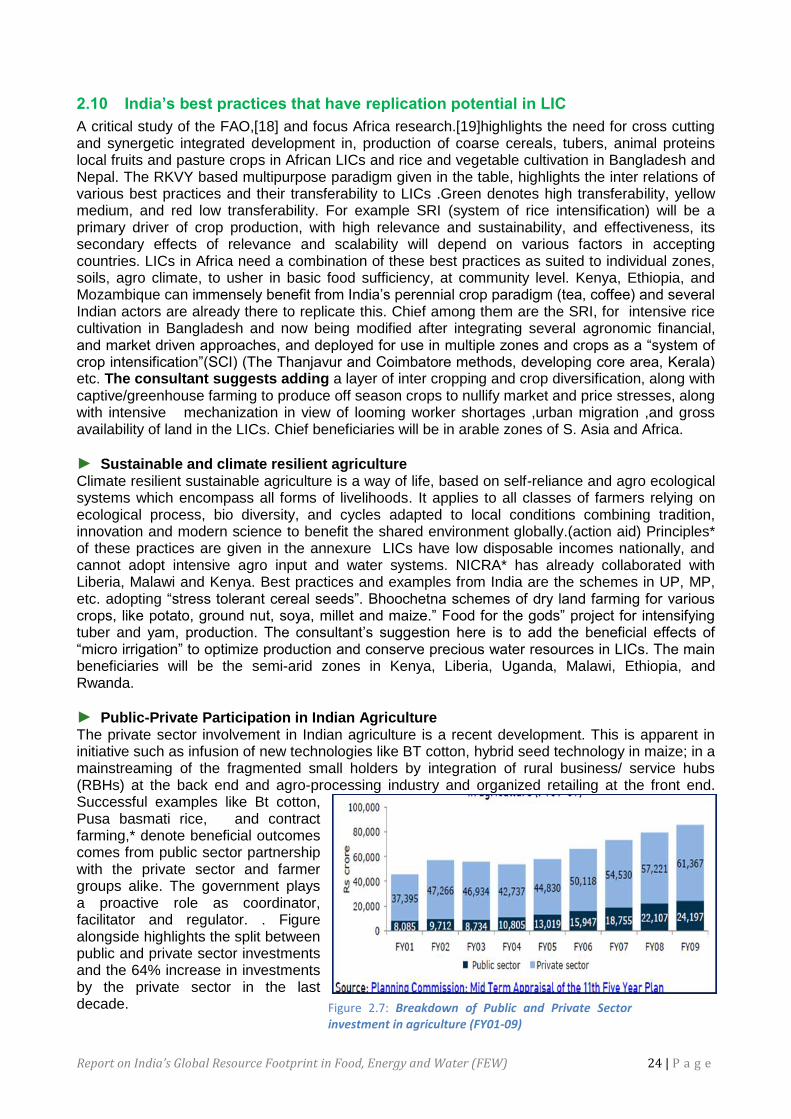
Report on India’s Global Resource Footprint in Food, Energy and Water (FEW) 24 | P a g e
2.10 India’s best practices that have replication potential in LIC
A critical study of the FAO,[18] and focus Africa research.[19]highlights the need for cross cutting and synergetic integrated development in, production of coarse cereals, tubers, animal proteins local fruits and pasture crops in African LICs and rice and vegetable cultivation in Bangladesh and Nepal. The RKVY based multipurpose paradigm given in the table, highlights the inter relations of various best practices and their transferability to LICs .Green denotes high transferability, yellow medium, and red low transferability. For example SRI (system of rice intensification) will be a primary driver of crop production, with high relevance and sustainability, and effectiveness, its secondary effects of relevance and scalability will depend on various factors in accepting countries. LICs in Africa need a combination of these best practices as suited to individual zones, soils, agro climate, to usher in basic food sufficiency, at community level. Kenya, Ethiopia, and Mozambique can immensely benefit from India‘s perennial crop paradigm (tea, coffee) and several Indian actors are already there to replicate this. Chief among them are the SRI, for intensive rice cultivation in Bangladesh and now being modified after integrating several agronomic financial, and market driven approaches, and deployed for use in multiple zones and crops as a ―system of crop intensification‖(SCI) (The Thanjavur and Coimbatore methods, developing core area, Kerala) etc. The consultant suggests adding a layer of inter cropping and crop diversification, along with captive/greenhouse farming to produce off season crops to nullify market and price stresses, along with intensive mechanization in view of looming worker shortages ,urban migration ,and gross availability of land in the LICs. Chief beneficiaries will be in arable zones of S. Asia and Africa.
► Sustainable and climate resilient agriculture Climate resilient sustainable agriculture is a way of life, based on self-reliance and agro ecological systems which encompass all forms of livelihoods. It applies to all classes of farmers relying on ecological process, bio diversity, and cycles adapted to local conditions combining tradition, innovation and modern science to benefit the shared environment globally.(action aid) Principles* of these practices are given in the annexure LICs have low disposable incomes nationally, and cannot adopt intensive agro input and water systems. NICRA* has already collaborated with Liberia, Malawi and Kenya. Best practices and examples from India are the schemes in UP, MP, etc. adopting ―stress tolerant cereal seeds‖. Bhoochetna schemes of dry land farming for various crops, like potato, ground nut, soya, millet and maize.‖ Food for the gods‖ project for intensifying tuber and yam, production. The consultant‘s suggestion here is to add the beneficial effects of ―micro irrigation‖ to optimize production and conserve precious water resources in LICs. The main beneficiaries will be the semi-arid zones in Kenya, Liberia, Uganda, Malawi, Ethiopia, and Rwanda.
► Public-Private Participation in Indian Agriculture The private sector involvement in Indian agriculture is a recent development. This is apparent in initiative such as infusion of new technologies like BT cotton, hybrid seed technology in maize; in a mainstreaming of the fragmented small holders by integration of rural business/ service hubs (RBHs) at the back end and agro-processing industry and organized retailing at the front end. Successful examples like Bt cotton, Pusa basmati rice, and contract farming,* denote beneficial outcomes comes from public sector partnership with the private sector and farmer groups alike. The government plays a proactive role as coordinator, facilitator and regulator. . Figure alongside highlights the split between public and private sector investments and the 64% increase in investments by the private sector in the last decade.
Figure 2.7: Breakdown of Public and Private Sector investment in agriculture (FY01-09)
Report on India’s Global Resource Footprint in Food, Energy and Water (FEW) 25 | P a g e
Higher investment in basic infrastructure by the government like roads, canal waters, watersheds, check dams, etc. will attract private investment in other areas of the supply chain. Future breakthrough technologies in agriculture will come increasingly from the private sector, and India‘s private sector has the strength to multiply those technologies and to reach millions of farmers (big and small) in the fastest possible way. There is a urgent need to adopt this in all the LICs and this will be the most powerful engine for poverty reduction and food sufficiency. There is no need to reinvent the wheel in the LICs, as there are sufficient models and lesson learnt examples from India that can be employed. The consultant suggests the embedding of ―micro finance‖ and linking the NGO sector for effective and timely remedial of financial stress, that occurs constantly in small farmer based agriculture.[20],in critical stages of agronomy, leading to major crop and livelihood losses. Special reference is called to annexure 15/16 which highlight the consultants‘ suggestions for immediate practical micro efficiency deliveries to the LICs and the need for global empathy in knowledge deliveries. CONCLUSIONS The challenge before the policy makers is how to rationalize farm loans ($18billion), food security stocks ($38billion) fuel, water, fertilizer, and social scheme subsidy (MNREGA $6billion) which are the cause of huge fiscal deficit, driving food inflation. The other major priority is to bring responsibility in rapacious self-destructing resource consumption, adopt green pathways, and rationalize subsidies, in a calibrated manner without shocks to growth rate of the economy. Globally, at the WEO and WTO, vast changes are imminent, and require compliance by India sooner than later. Tariffs and protectionist policies will have to be dismantled, in a global economy that practices free trade and competitive markets. All this calls for greater efficiency in the food value chain. Effects of policies, practices, technology and innovations, in India as highlighted in the study, need in-depth investigation, before any attempts at transfers to LICs are made. This is to ensure that all the pitfalls are eliminated, and the ―wheel is not reinvented‖ in both success and failures. This will greatly reduce the learning gap, and implementation time frames in the LICS. Individual LICs, and their agro zones, people and culture, require rigorous study for knowledge transfer success. This primary study and further efforts of DFID, in this sphere is indeed laudable, and will bring succour to many poor and improvised LIC countries
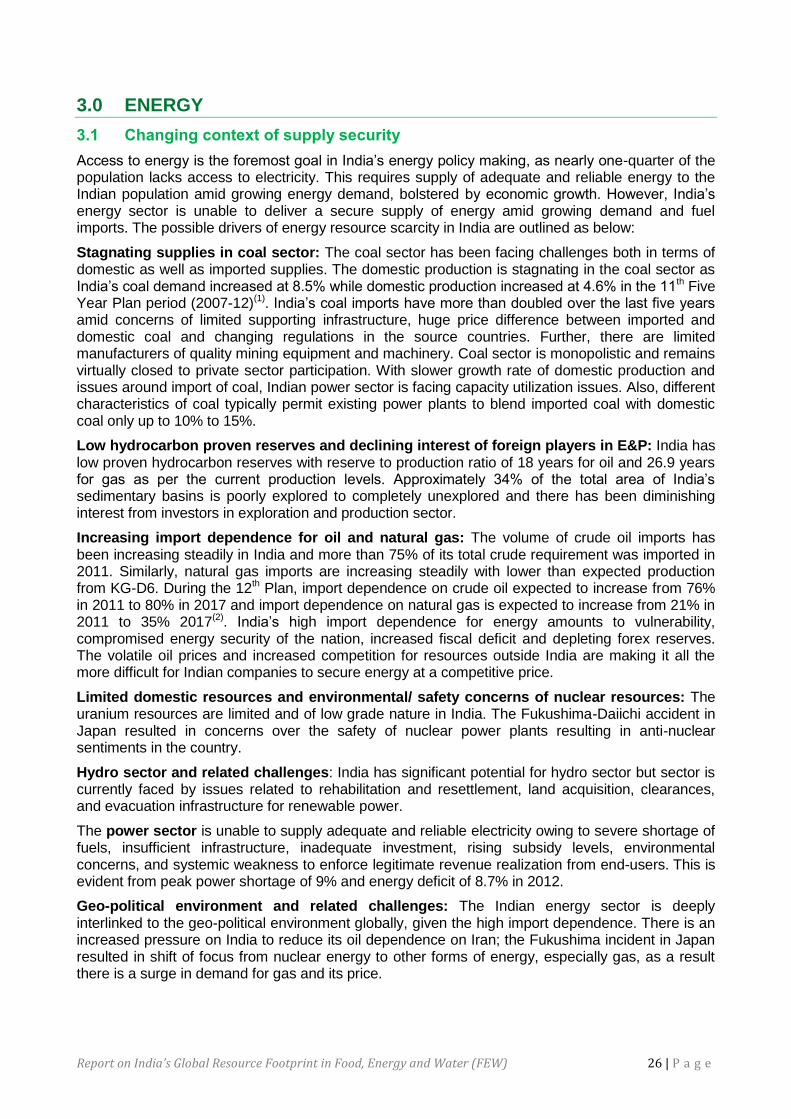
Report on India’s Global Resource Footprint in Food, Energy and Water (FEW) 26 | P a g e
3.0 ENERGY
3.1 Changing context of supply security
Access to energy is the foremost goal in India‘s energy policy making, as nearly one-quarter of the population lacks access to electricity. This requires supply of adequate and reliable energy to the Indian population amid growing energy demand, bolstered by economic growth. However, India‘s energy sector is unable to deliver a secure supply of energy amid growing demand and fuel imports. The possible drivers of energy resource scarcity in India are outlined as below:
Stagnating supplies in coal sector: The coal sector has been facing challenges both in terms of domestic as well as imported supplies. The domestic production is stagnating in the coal sector as India‘s coal demand increased at 8.5% while domestic production increased at 4.6% in the 11th Five Year Plan period (2007-12)(1). India‘s coal imports have more than doubled over the last five years amid concerns of limited supporting infrastructure, huge price difference between imported and domestic coal and changing regulations in the source countries. Further, there are limited manufacturers of quality mining equipment and machinery. Coal sector is monopolistic and remains virtually closed to private sector participation. With slower growth rate of domestic production and issues around import of coal, Indian power sector is facing capacity utilization issues. Also, different characteristics of coal typically permit existing power plants to blend imported coal with domestic coal only up to 10% to 15%.
Low hydrocarbon proven reserves and declining interest of foreign players in E&P: India has low proven hydrocarbon reserves with reserve to production ratio of 18 years for oil and 26.9 years for gas as per the current production levels. Approximately 34% of the total area of India‘s sedimentary basins is poorly explored to completely unexplored and there has been diminishing interest from investors in exploration and production sector.
Increasing import dependence for oil and natural gas: The volume of crude oil imports has been increasing steadily in India and more than 75% of its total crude requirement was imported in 2011. Similarly, natural gas imports are increasing steadily with lower than expected production from KG-D6. During the 12th Plan, import dependence on crude oil expected to increase from 76% in 2011 to 80% in 2017 and import dependence on natural gas is expected to increase from 21% in 2011 to 35% 2017(2). India‘s high import dependence for energy amounts to vulnerability, compromised energy security of the nation, increased fiscal deficit and depleting forex reserves. The volatile oil prices and increased competition for resources outside India are making it all the more difficult for Indian companies to secure energy at a competitive price.
Limited domestic resources and environmental/ safety concerns of nuclear resources: The uranium resources are limited and of low grade nature in India. The Fukushima-Daiichi accident in Japan resulted in concerns over the safety of nuclear power plants resulting in anti-nuclear sentiments in the country.
Hydro sector and related challenges: India has significant potential for hydro sector but sector is currently faced by issues related to rehabilitation and resettlement, land acquisition, clearances, and evacuation infrastructure for renewable power.
The power sector is unable to supply adequate and reliable electricity owing to severe shortage of fuels, insufficient infrastructure, inadequate investment, rising subsidy levels, environmental concerns, and systemic weakness to enforce legitimate revenue realization from end-users. This is evident from peak power shortage of 9% and energy deficit of 8.7% in 2012.
Geo-political environment and related challenges: The Indian energy sector is deeply interlinked to the geo-political environment globally, given the high import dependence. There is an increased pressure on India to reduce its oil dependence on Iran; the Fukushima incident in Japan resulted in shift of focus from nuclear energy to other forms of energy, especially gas, as a result there is a surge in demand for gas and its price.
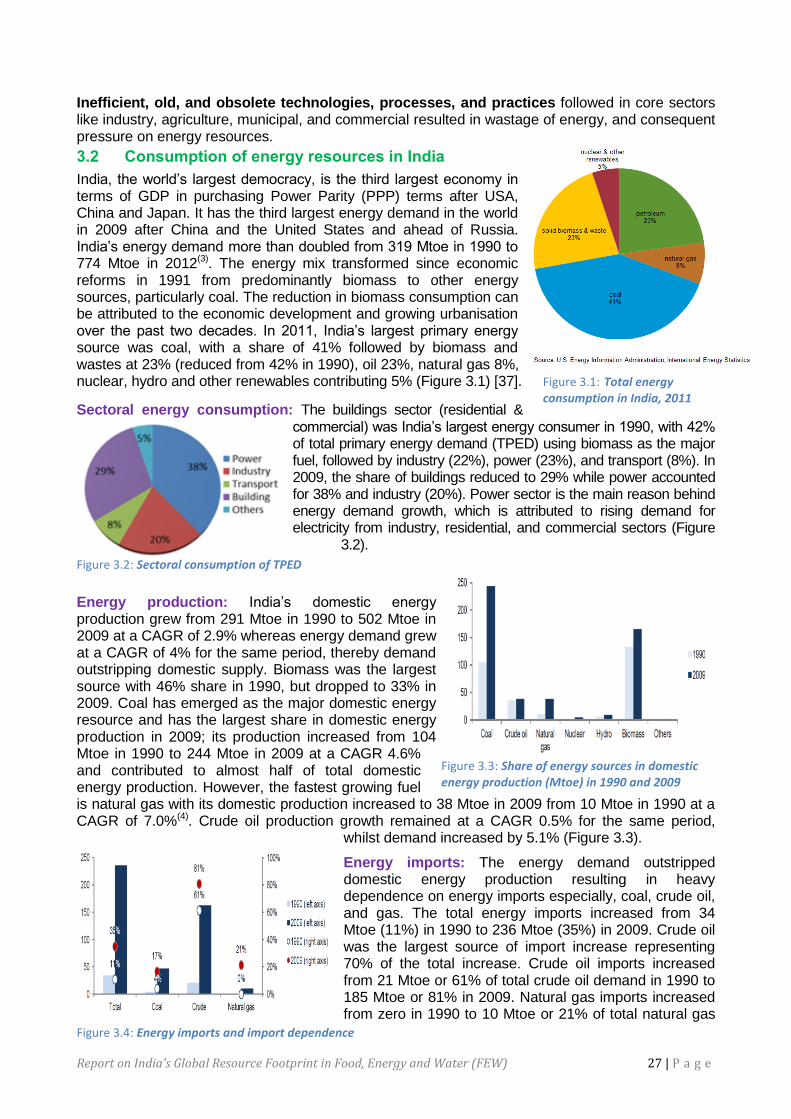
Report on India’s Global Resource Footprint in Food, Energy and Water (FEW) 27 | P a g e
Inefficient, old, and obsolete technologies, processes, and practices followed in core sectors like industry, agriculture, municipal, and commercial resulted in wastage of energy, and consequent pressure on energy resources.
3.2 Consumption of energy resources in India
India, the world‘s largest democracy, is the third largest economy in terms of GDP in purchasing Power Parity (PPP) terms after USA, China and Japan. It has the third largest energy demand in the world in 2009 after China and the United States and ahead of Russia. India‘s energy demand more than doubled from 319 Mtoe in 1990 to 774 Mtoe in 2012(3). The energy mix transformed since economic reforms in 1991 from predominantly biomass to other energy sources, particularly coal. The reduction in biomass consumption can be attributed to the economic development and growing urbanisation over the past two decades. In 2011, India‘s largest primary energy source was coal, with a share of 41% followed by biomass and wastes at 23% (reduced from 42% in 1990), oil 23%, natural gas 8%, nuclear, hydro and other renewables contributing 5% (Figure 3.1) [37].
Sectoral energy consumption: The buildings sector (residential & commercial) was India‘s largest energy consumer in 1990, with 42% of total primary energy demand (TPED) using biomass as the major fuel, followed by industry (22%), power (23%), and transport (8%). In 2009, the share of buildings reduced to 29% while power accounted for 38% and industry (20%). Power sector is the main reason behind energy demand growth, which is attributed to rising demand for electricity from industry, residential, and commercial sectors (Figure
3.2).
Energy production: India‘s domestic energy production grew from 291 Mtoe in 1990 to 502 Mtoe in 2009 at a CAGR of 2.9% whereas energy demand grew at a CAGR of 4% for the same period, thereby demand outstripping domestic supply. Biomass was the largest source with 46% share in 1990, but dropped to 33% in 2009. Coal has emerged as the major domestic energy resource and has the largest share in domestic energy production in 2009; its production increased from 104 Mtoe in 1990 to 244 Mtoe in 2009 at a CAGR 4.6% and contributed to almost half of total domestic energy production. However, the fastest growing fuel is natural gas with its domestic production increased to 38 Mtoe in 2009 from 10 Mtoe in 1990 at a CAGR of 7.0%(4). Crude oil production growth remained at a CAGR 0.5% for the same period,
whilst demand increased by 5.1% (Figure 3.3).
Energy imports: The energy demand outstripped domestic energy production resulting in heavy dependence on energy imports especially, coal, crude oil, and gas. The total energy imports increased from 34 Mtoe (11%) in 1990 to 236 Mtoe (35%) in 2009. Crude oil was the largest source of import increase representing 70% of the total increase. Crude oil imports increased from 21 Mtoe or 61% of total crude oil demand in 1990 to 185 Mtoe or 81% in 2009. Natural gas imports increased from zero in 1990 to 10 Mtoe or 21% of total natural gas
Figure 3.1: Total energy consumption in India, 2011
Figure 3.2: Sectoral consumption of TPED
Figure 3.3: Share of energy sources in domestic energy production (Mtoe) in 1990 and 2009
Figure 3.4: Energy imports and import dependence
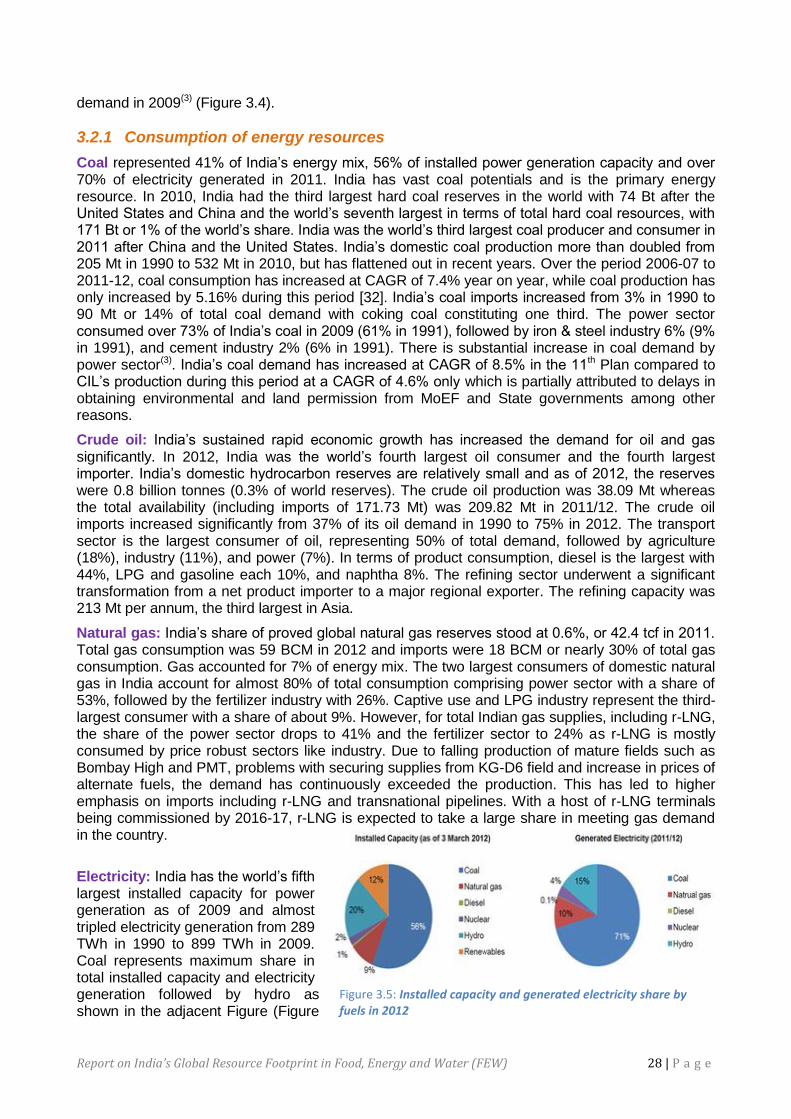
Report on India’s Global Resource Footprint in Food, Energy and Water (FEW) 28 | P a g e
demand in 2009(3) (Figure 3.4).
3.2.1 Consumption of energy resources
Coal represented 41% of India‘s energy mix, 56% of installed power generation capacity and over 70% of electricity generated in 2011. India has vast coal potentials and is the primary energy resource. In 2010, India had the third largest hard coal reserves in the world with 74 Bt after the United States and China and the world‘s seventh largest in terms of total hard coal resources, with 171 Bt or 1% of the world‘s share. India was the world‘s third largest coal producer and consumer in 2011 after China and the United States. India‘s domestic coal production more than doubled from 205 Mt in 1990 to 532 Mt in 2010, but has flattened out in recent years. Over the period 2006-07 to 2011-12, coal consumption has increased at CAGR of 7.4% year on year, while coal production has only increased by 5.16% during this period [32]. India‘s coal imports increased from 3% in 1990 to 90 Mt or 14% of total coal demand with coking coal constituting one third. The power sector consumed over 73% of India‘s coal in 2009 (61% in 1991), followed by iron & steel industry 6% (9% in 1991), and cement industry 2% (6% in 1991). There is substantial increase in coal demand by power sector(3). India‘s coal demand has increased at CAGR of 8.5% in the 11th Plan compared to CIL‘s production during this period at a CAGR of 4.6% only which is partially attributed to delays in obtaining environmental and land permission from MoEF and State governments among other reasons.
Crude oil: India‘s sustained rapid economic growth has increased the demand for oil and gas significantly. In 2012, India was the world‘s fourth largest oil consumer and the fourth largest importer. India‘s domestic hydrocarbon reserves are relatively small and as of 2012, the reserves were 0.8 billion tonnes (0.3% of world reserves). The crude oil production was 38.09 Mt whereas the total availability (including imports of 171.73 Mt) was 209.82 Mt in 2011/12. The crude oil imports increased significantly from 37% of its oil demand in 1990 to 75% in 2012. The transport sector is the largest consumer of oil, representing 50% of total demand, followed by agriculture (18%), industry (11%), and power (7%). In terms of product consumption, diesel is the largest with 44%, LPG and gasoline each 10%, and naphtha 8%. The refining sector underwent a significant transformation from a net product importer to a major regional exporter. The refining capacity was 213 Mt per annum, the third largest in Asia.
Natural gas: India‘s share of proved global natural gas reserves stood at 0.6%, or 42.4 tcf in 2011. Total gas consumption was 59 BCM in 2012 and imports were 18 BCM or nearly 30% of total gas consumption. Gas accounted for 7% of energy mix. The two largest consumers of domestic natural gas in India account for almost 80% of total consumption comprising power sector with a share of 53%, followed by the fertilizer industry with 26%. Captive use and LPG industry represent the third-largest consumer with a share of about 9%. However, for total Indian gas supplies, including r-LNG, the share of the power sector drops to 41% and the fertilizer sector to 24% as r-LNG is mostly consumed by price robust sectors like industry. Due to falling production of mature fields such as Bombay High and PMT, problems with securing supplies from KG-D6 field and increase in prices of alternate fuels, the demand has continuously exceeded the production. This has led to higher emphasis on imports including r-LNG and transnational pipelines. With a host of r-LNG terminals being commissioned by 2016-17, r-LNG is expected to take a large share in meeting gas demand in the country.
Electricity: India has the world‘s fifth largest installed capacity for power generation as of 2009 and almost tripled electricity generation from 289 TWh in 1990 to 899 TWh in 2009. Coal represents maximum share in total installed capacity and electricity generation followed by hydro as shown in the adjacent Figure (Figure
Figure 3.5: Installed capacity and generated electricity share by fuels in 2012
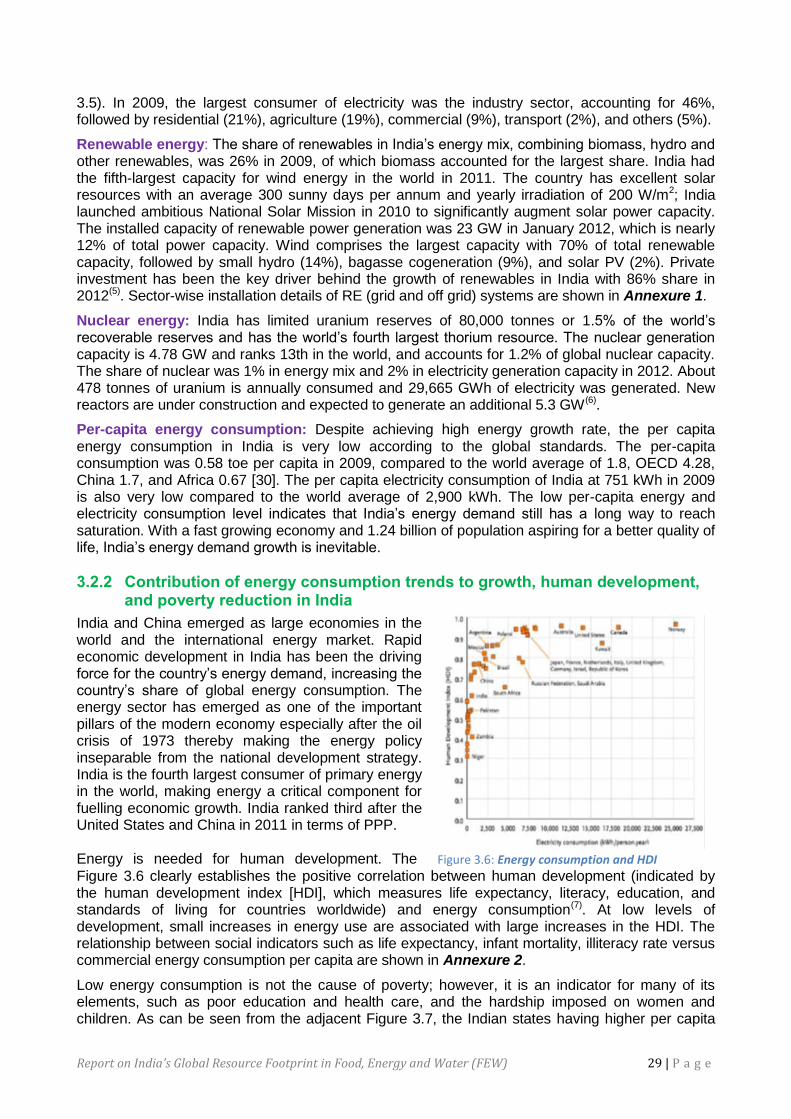
Report on India’s Global Resource Footprint in Food, Energy and Water (FEW) 29 | P a g e
3.5). In 2009, the largest consumer of electricity was the industry sector, accounting for 46%, followed by residential (21%), agriculture (19%), commercial (9%), transport (2%), and others (5%).
Renewable energy: The share of renewables in India‘s energy mix, combining biomass, hydro and other renewables, was 26% in 2009, of which biomass accounted for the largest share. India had the fifth-largest capacity for wind energy in the world in 2011. The country has excellent solar resources with an average 300 sunny days per annum and yearly irradiation of 200 W/m2; India launched ambitious National Solar Mission in 2010 to significantly augment solar power capacity. The installed capacity of renewable power generation was 23 GW in January 2012, which is nearly 12% of total power capacity. Wind comprises the largest capacity with 70% of total renewable capacity, followed by small hydro (14%), bagasse cogeneration (9%), and solar PV (2%). Private investment has been the key driver behind the growth of renewables in India with 86% share in 2012(5). Sector-wise installation details of RE (grid and off grid) systems are shown in Annexure 1.
Nuclear energy: India has limited uranium reserves of 80,000 tonnes or 1.5% of the world‘s recoverable reserves and has the world‘s fourth largest thorium resource. The nuclear generation capacity is 4.78 GW and ranks 13th in the world, and accounts for 1.2% of global nuclear capacity. The share of nuclear was 1% in energy mix and 2% in electricity generation capacity in 2012. About 478 tonnes of uranium is annually consumed and 29,665 GWh of electricity was generated. New reactors are under construction and expected to generate an additional 5.3 GW(6).
Per-capita energy consumption: Despite achieving high energy growth rate, the per capita energy consumption in India is very low according to the global standards. The per-capita consumption was 0.58 toe per capita in 2009, compared to the world average of 1.8, OECD 4.28, China 1.7, and Africa 0.67 [30]. The per capita electricity consumption of India at 751 kWh in 2009 is also very low compared to the world average of 2,900 kWh. The low per-capita energy and electricity consumption level indicates that India‘s energy demand still has a long way to reach saturation. With a fast growing economy and 1.24 billion of population aspiring for a better quality of life, India‘s energy demand growth is inevitable.
3.2.2 Contribution of energy consumption trends to growth, human development, and poverty reduction in India
India and China emerged as large economies in the world and the international energy market. Rapid economic development in India has been the driving force for the country‘s energy demand, increasing the country‘s share of global energy consumption. The energy sector has emerged as one of the important pillars of the modern economy especially after the oil crisis of 1973 thereby making the energy policy inseparable from the national development strategy. India is the fourth largest consumer of primary energy in the world, making energy a critical component for fuelling economic growth. India ranked third after the United States and China in 2011 in terms of PPP.
Energy is needed for human development. The
Figure 3.6 clearly establishes the positive correlation between human development (indicated by the human development index [HDI], which measures life expectancy, literacy, education, and standards of living for countries worldwide) and energy consumption(7). At low levels of development, small increases in energy use are associated with large increases in the HDI. The relationship between social indicators such as life expectancy, infant mortality, illiteracy rate versus commercial energy consumption per capita are shown in Annexure 2.
Low energy consumption is not the cause of poverty; however, it is an indicator for many of its elements, such as poor education and health care, and the hardship imposed on women and children. As can be seen from the adjacent Figure 3.7, the Indian states having higher per capita
Figure 3.6: Energy consumption and HDI
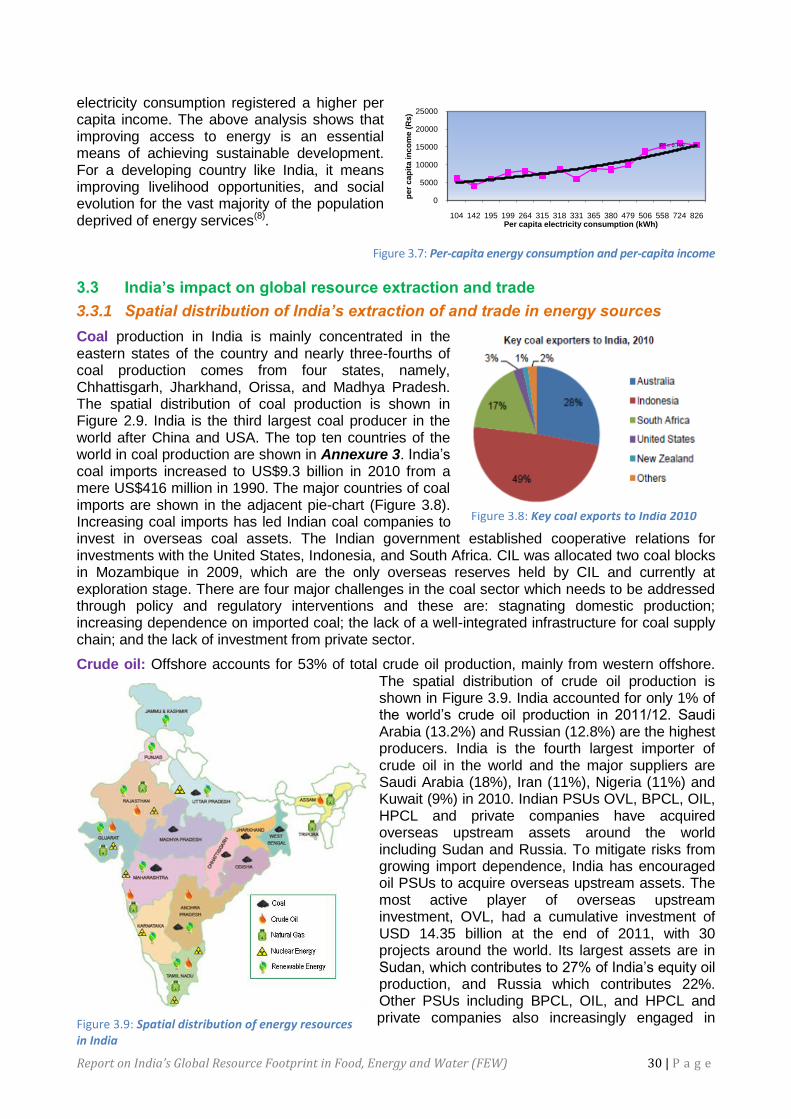
Report on India’s Global Resource Footprint in Food, Energy and Water (FEW) 30 | P a g e
electricity consumption registered a higher per capita income. The above analysis shows that improving access to energy is an essential means of achieving sustainable development. For a developing country like India, it means improving livelihood opportunities, and social evolution for the vast majority of the population deprived of energy services(8).
Figure 3.7: Per-capita energy consumption and per-capita income
3.3 India’s impact on global resource extraction and trade
3.3.1 Spatial distribution of India’s extraction of and trade in energy sources
Coal production in India is mainly concentrated in the eastern states of the country and nearly three-fourths of coal production comes from four states, namely, Chhattisgarh, Jharkhand, Orissa, and Madhya Pradesh. The spatial distribution of coal production is shown in Figure 2.9. India is the third largest coal producer in the world after China and USA. The top ten countries of the world in coal production are shown in Annexure 3. India‘s coal imports increased to US$9.3 billion in 2010 from a mere US$416 million in 1990. The major countries of coal imports are shown in the adjacent pie-chart (Figure 3.8). Increasing coal imports has led Indian coal companies to invest in overseas coal assets. The Indian government established cooperative relations for investments with the United States, Indonesia, and South Africa. CIL was allocated two coal blocks in Mozambique in 2009, which are the only overseas reserves held by CIL and currently at exploration stage. There are four major challenges in the coal sector which needs to be addressed through policy and regulatory interventions and these are: stagnating domestic production; increasing dependence on imported coal; the lack of a well-integrated infrastructure for coal supply chain; and the lack of investment from private sector.
Crude oil: Offshore accounts for 53% of total crude oil production, mainly from western offshore. The spatial distribution of crude oil production is shown in Figure 3.9. India accounted for only 1% of the world‘s crude oil production in 2011/12. Saudi Arabia (13.2%) and Russian (12.8%) are the highest producers. India is the fourth largest importer of crude oil in the world and the major suppliers are Saudi Arabia (18%), Iran (11%), Nigeria (11%) and Kuwait (9%) in 2010. Indian PSUs OVL, BPCL, OIL, HPCL and private companies have acquired overseas upstream assets around the world including Sudan and Russia. To mitigate risks from growing import dependence, India has encouraged oil PSUs to acquire overseas upstream assets. The most active player of overseas upstream investment, OVL, had a cumulative investment of USD 14.35 billion at the end of 2011, with 30 projects around the world. Its largest assets are in Sudan, which contributes to 27% of India‘s equity oil production, and Russia which contributes 22%. Other PSUs including BPCL, OIL, and HPCL and private companies also increasingly engaged in
Figure 3.8: Key coal exports to India 2010
Figure 3.9: Spatial distribution of energy resources in India
R² = 0.799
0
5000
10000
15000
20000
25000
104 142 195 199 264 315 318 331 365 380 479 506 558 724 826
pe
r c
ap
ita
in
co
me
(R
s)
Per capita electricity consumption (kWh)
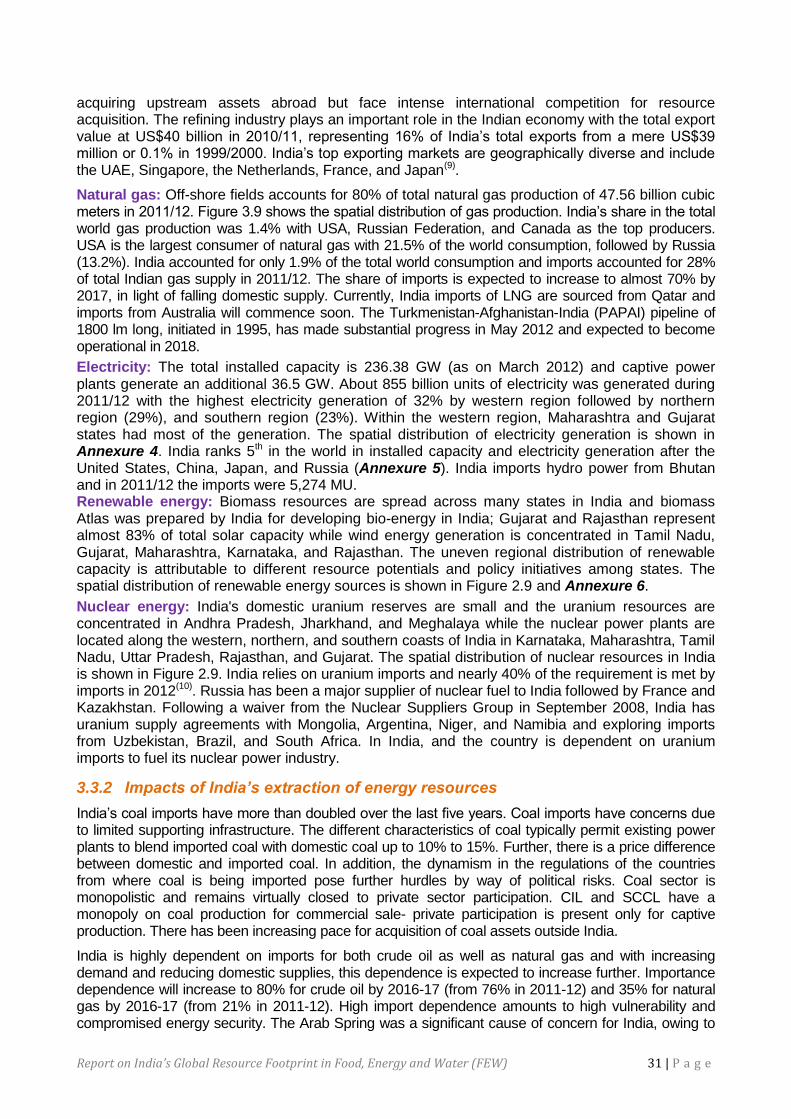
Report on India’s Global Resource Footprint in Food, Energy and Water (FEW) 31 | P a g e
acquiring upstream assets abroad but face intense international competition for resource acquisition. The refining industry plays an important role in the Indian economy with the total export value at US$40 billion in 2010/11, representing 16% of India‘s total exports from a mere US$39 million or 0.1% in 1999/2000. India‘s top exporting markets are geographically diverse and include the UAE, Singapore, the Netherlands, France, and Japan(9).
Natural gas: Off-shore fields accounts for 80% of total natural gas production of 47.56 billion cubic meters in 2011/12. Figure 3.9 shows the spatial distribution of gas production. India‘s share in the total world gas production was 1.4% with USA, Russian Federation, and Canada as the top producers. USA is the largest consumer of natural gas with 21.5% of the world consumption, followed by Russia (13.2%). India accounted for only 1.9% of the total world consumption and imports accounted for 28% of total Indian gas supply in 2011/12. The share of imports is expected to increase to almost 70% by 2017, in light of falling domestic supply. Currently, India imports of LNG are sourced from Qatar and imports from Australia will commence soon. The Turkmenistan-Afghanistan-India (PAPAI) pipeline of 1800 lm long, initiated in 1995, has made substantial progress in May 2012 and expected to become operational in 2018.
Electricity: The total installed capacity is 236.38 GW (as on March 2012) and captive power plants generate an additional 36.5 GW. About 855 billion units of electricity was generated during 2011/12 with the highest electricity generation of 32% by western region followed by northern region (29%), and southern region (23%). Within the western region, Maharashtra and Gujarat states had most of the generation. The spatial distribution of electricity generation is shown in Annexure 4. India ranks 5th in the world in installed capacity and electricity generation after the United States, China, Japan, and Russia (Annexure 5). India imports hydro power from Bhutan and in 2011/12 the imports were 5,274 MU. Renewable energy: Biomass resources are spread across many states in India and biomass Atlas was prepared by India for developing bio-energy in India; Gujarat and Rajasthan represent almost 83% of total solar capacity while wind energy generation is concentrated in Tamil Nadu, Gujarat, Maharashtra, Karnataka, and Rajasthan. The uneven regional distribution of renewable capacity is attributable to different resource potentials and policy initiatives among states. The spatial distribution of renewable energy sources is shown in Figure 2.9 and Annexure 6.
Nuclear energy: India's domestic uranium reserves are small and the uranium resources are concentrated in Andhra Pradesh, Jharkhand, and Meghalaya while the nuclear power plants are located along the western, northern, and southern coasts of India in Karnataka, Maharashtra, Tamil Nadu, Uttar Pradesh, Rajasthan, and Gujarat. The spatial distribution of nuclear resources in India is shown in Figure 2.9. India relies on uranium imports and nearly 40% of the requirement is met by imports in 2012(10). Russia has been a major supplier of nuclear fuel to India followed by France and Kazakhstan. Following a waiver from the Nuclear Suppliers Group in September 2008, India has uranium supply agreements with Mongolia, Argentina, Niger, and Namibia and exploring imports from Uzbekistan, Brazil, and South Africa. In India, and the country is dependent on uranium imports to fuel its nuclear power industry.
3.3.2 Impacts of India’s extraction of energy resources
India‘s coal imports have more than doubled over the last five years. Coal imports have concerns due to limited supporting infrastructure. The different characteristics of coal typically permit existing power plants to blend imported coal with domestic coal up to 10% to 15%. Further, there is a price difference between domestic and imported coal. In addition, the dynamism in the regulations of the countries from where coal is being imported pose further hurdles by way of political risks. Coal sector is monopolistic and remains virtually closed to private sector participation. CIL and SCCL have a monopoly on coal production for commercial sale- private participation is present only for captive production. There has been increasing pace for acquisition of coal assets outside India.
India is highly dependent on imports for both crude oil as well as natural gas and with increasing demand and reducing domestic supplies, this dependence is expected to increase further. Importance dependence will increase to 80% for crude oil by 2016-17 (from 76% in 2011-12) and 35% for natural gas by 2016-17 (from 21% in 2011-12). High import dependence amounts to high vulnerability and compromised energy security. The Arab Spring was a significant cause of concern for India, owing to
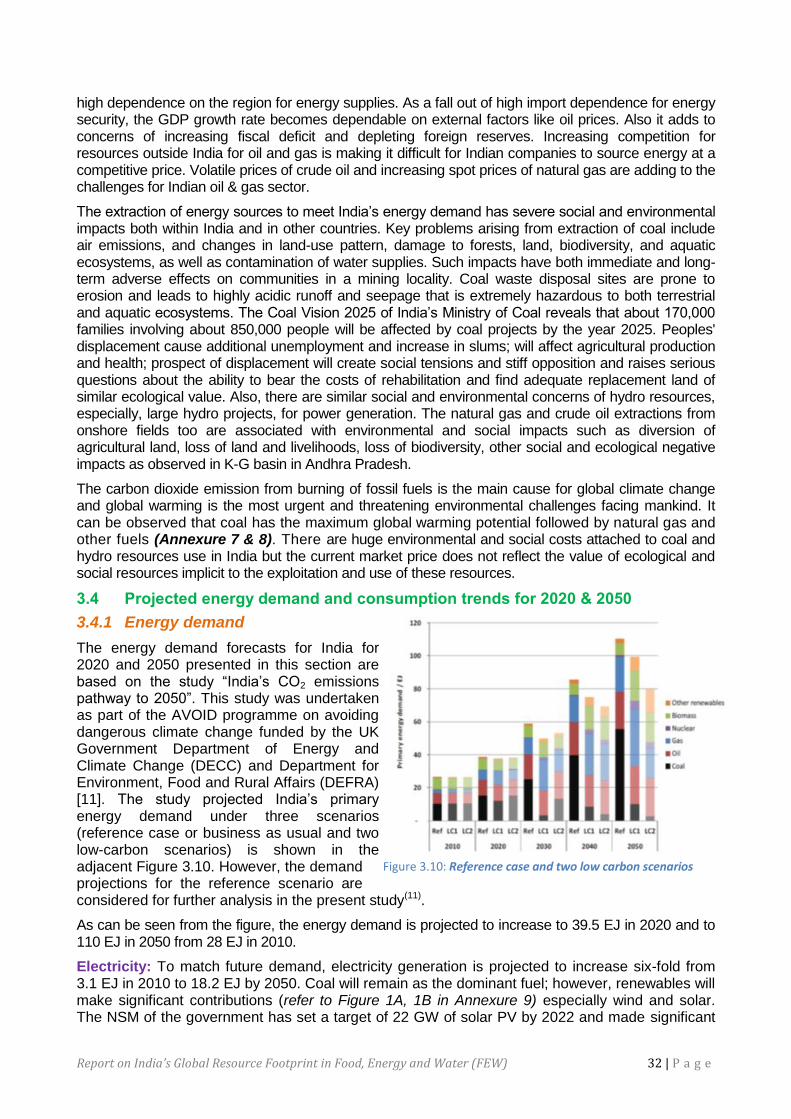
Report on India’s Global Resource Footprint in Food, Energy and Water (FEW) 32 | P a g e
high dependence on the region for energy supplies. As a fall out of high import dependence for energy security, the GDP growth rate becomes dependable on external factors like oil prices. Also it adds to concerns of increasing fiscal deficit and depleting foreign reserves. Increasing competition for resources outside India for oil and gas is making it difficult for Indian companies to source energy at a competitive price. Volatile prices of crude oil and increasing spot prices of natural gas are adding to the challenges for Indian oil & gas sector.
The extraction of energy sources to meet India‘s energy demand has severe social and environmental impacts both within India and in other countries. Key problems arising from extraction of coal include air emissions, and changes in land-use pattern, damage to forests, land, biodiversity, and aquatic ecosystems, as well as contamination of water supplies. Such impacts have both immediate and long-term adverse effects on communities in a mining locality. Coal waste disposal sites are prone to erosion and leads to highly acidic runoff and seepage that is extremely hazardous to both terrestrial and aquatic ecosystems. The Coal Vision 2025 of India‘s Ministry of Coal reveals that about 170,000 families involving about 850,000 people will be affected by coal projects by the year 2025. Peoples' displacement cause additional unemployment and increase in slums; will affect agricultural production and health; prospect of displacement will create social tensions and stiff opposition and raises serious questions about the ability to bear the costs of rehabilitation and find adequate replacement land of similar ecological value. Also, there are similar social and environmental concerns of hydro resources, especially, large hydro projects, for power generation. The natural gas and crude oil extractions from onshore fields too are associated with environmental and social impacts such as diversion of agricultural land, loss of land and livelihoods, loss of biodiversity, other social and ecological negative impacts as observed in K-G basin in Andhra Pradesh.
The carbon dioxide emission from burning of fossil fuels is the main cause for global climate change and global warming is the most urgent and threatening environmental challenges facing mankind. It can be observed that coal has the maximum global warming potential followed by natural gas and other fuels (Annexure 7 & 8). There are huge environmental and social costs attached to coal and hydro resources use in India but the current market price does not reflect the value of ecological and social resources implicit to the exploitation and use of these resources.
3.4 Projected energy demand and consumption trends for 2020 & 2050
3.4.1 Energy demand
The energy demand forecasts for India for 2020 and 2050 presented in this section are based on the study ―India‘s CO2 emissions pathway to 2050‖. This study was undertaken as part of the AVOID programme on avoiding dangerous climate change funded by the UK Government Department of Energy and Climate Change (DECC) and Department for Environment, Food and Rural Affairs (DEFRA) [11]. The study projected India‘s primary energy demand under three scenarios (reference case or business as usual and two low-carbon scenarios) is shown in the adjacent Figure 3.10. However, the demand projections for the reference scenario are considered for further analysis in the present study(11).
As can be seen from the figure, the energy demand is projected to increase to 39.5 EJ in 2020 and to 110 EJ in 2050 from 28 EJ in 2010.
Electricity: To match future demand, electricity generation is projected to increase six-fold from 3.1 EJ in 2010 to 18.2 EJ by 2050. Coal will remain as the dominant fuel; however, renewables will make significant contributions (refer to Figure 1A, 1B in Annexure 9) especially wind and solar. The NSM of the government has set a target of 22 GW of solar PV by 2022 and made significant
Figure 3.10: Reference case and two low carbon scenarios

Report on India’s Global Resource Footprint in Food, Energy and Water (FEW) 33 | P a g e
progress in capacity additions in Phase 1. Nuclear will play a significant role in future and the government aims 20 GW by 2020 and 25% of electricity by 2050 from nuclear resources. The per-capita electricity consumption is expected to be double by 2020 and reach 5000-6000 kWh by 2050 requiring 8000 TWh per annum(10).
Industry: Energy consumption in the industrial sector was 6.5 EJ in 2010, which is projected to increase more than five-fold to 2050 reaching 35 EJ. The demand projections of this study are higher than the projections made in IEA‘s Energy Technology Perspectives, which projects energy demand of about 27 EJ in 2050 (refer to Figure 2 in Annexure 9). Over the period to 2050, there is projected increase by 20-fold in industrial activity compared to 2005.
Transport: The total energy demand for transport sector was 2.6 EJ in 2010, which is projected to increase to 6.1 EJ by 2020 and to 22.5 EJ by 2050 (refer to Figure 3 & 4 of Annexure 9). The energy demand in road transport makes up about 90% of total transport demand in 2050. Petrol and diesel dominate the transport fuel mix, although for light goods vehicles natural gas becomes the most cost-effective fuel, dominating in 2050.
Buildings: The total residential energy demand was 7 EJ in 2009, which is projected to increase by more than 60% by 2035, and to more than double by 2050 to 15.5 EJ (refer to Figure 5 & 6 of Annexure 9). The energy demand for commercial buildings will increase from 0.6 EJ (2009) to 5 EJ.
The WEO 2011 projects that under the National Policies Scenario (NPS), the current energy mix would not experience a dramatic change by 2035, with coal remaining the dominant fuel at the same 42% share. The share of biomass would decrease to 15%, as an outcome of poverty reduction, urbanisation, and increasing demand for modern fuels. Other fuels maintain similar shares in 2035.
India will become the second largest coal consumer in the world by 2025, surpassing the United States with primary coal demand more than tripling from 280 Mtoe in 2009 to 618 Mtoe in 2035 according to WEO 2011 NPS. This enormous coal demand will come predominantly from the power sector, representing over 60% of coal demand growth between 2009 and 2035 under the NPS. India‘s dependence on imported coal will increase to 30% or 280 Mt of coal demand in 2020 and to 34% or 460 Mt by 2035. Increasing import dependence is attributed to rising coal demand and stagnating domestic production. More specifically, the expansion of super critical power plants requiring higher quality of coal will lead to greater imports. Industrial coal demand, especially for coking coal, will represent 38% of projected growth.
WEO 2011 projects that India would be the third largest crude oil consumer by 2035 after China and the United States with the oil demand reaching at 356 Mtoe. Its rapid demand growth of a CAGR of 3.4% from 2010 to 2035 would be one of the highest in the world, driven primarily by the transport sector. To meet fast growing demand, oil imports are expected to reach 92% of demand in 2035 under the WEO 2011 NPS. India‘s gas demand is expected to triple to 180 BCM (154 Mtoe) by 2035 at a CAGR of 4.5% and this growth will be primarily driven by the power sector. By 2025, the share of natural gas in India‘s energy mix is likely to reach 20%.
The per-capita energy consumption is expected to be more than doubled by 2031-32, to around 1.124 toe from 0.584 toe in 2009, which will still be lower than the 2009 world average of 1.797 toe.
3.4.2 Overview of energy scenario in LICs
LICs are low energy consumers. Their average per capita energy consumption in 2010 was 363 kgoe compared with a world average of 1,851 kgoe and 7164 kgoe in the USA [32]. Across all LICs, 77% of TPES in 2009 was from renewable energy sources (most of which is biomass e.g. firewood or charcoal) and 23% from fossil fuels. This is almost the reverse of the energy supply mix in OECD countries, where 81% is from fossil fuels and 8% from renewables (excluding nuclear); however, there is large variation observed among LICs; North Korea‘s 89% of energy supply is met from fossil fuels (mainly coal) and on the other side Burundi has only 2% contribution from fossil fuels; nearly 60% of LICs have less than 20% of energy supply from fossil fuels.
The large portion of renewables in TPES is dominated by biomass (75% of TPES), which is predominantly used for domestic cooking. In 2005, across 16 LICs for which data is available,
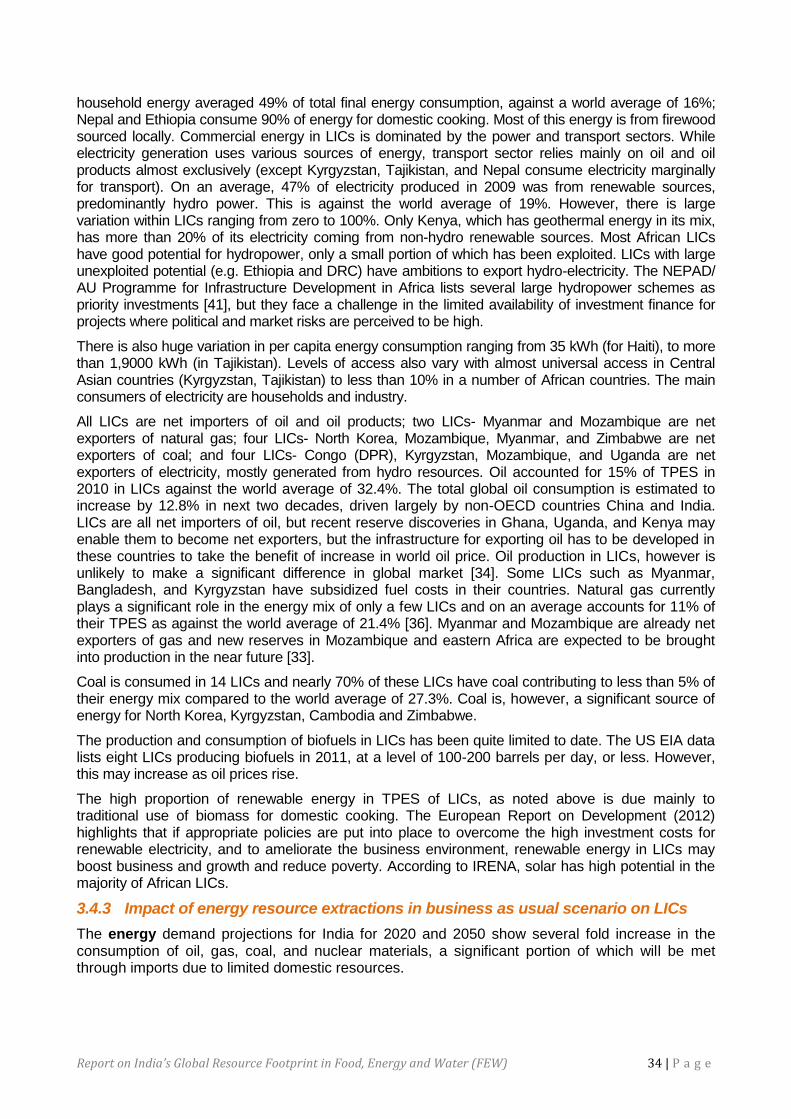
Report on India’s Global Resource Footprint in Food, Energy and Water (FEW) 34 | P a g e
household energy averaged 49% of total final energy consumption, against a world average of 16%; Nepal and Ethiopia consume 90% of energy for domestic cooking. Most of this energy is from firewood sourced locally. Commercial energy in LICs is dominated by the power and transport sectors. While electricity generation uses various sources of energy, transport sector relies mainly on oil and oil products almost exclusively (except Kyrgyzstan, Tajikistan, and Nepal consume electricity marginally for transport). On an average, 47% of electricity produced in 2009 was from renewable sources, predominantly hydro power. This is against the world average of 19%. However, there is large variation within LICs ranging from zero to 100%. Only Kenya, which has geothermal energy in its mix, has more than 20% of its electricity coming from non-hydro renewable sources. Most African LICs have good potential for hydropower, only a small portion of which has been exploited. LICs with large unexploited potential (e.g. Ethiopia and DRC) have ambitions to export hydro-electricity. The NEPAD/ AU Programme for Infrastructure Development in Africa lists several large hydropower schemes as priority investments [41], but they face a challenge in the limited availability of investment finance for projects where political and market risks are perceived to be high.
There is also huge variation in per capita energy consumption ranging from 35 kWh (for Haiti), to more than 1,9000 kWh (in Tajikistan). Levels of access also vary with almost universal access in Central Asian countries (Kyrgyzstan, Tajikistan) to less than 10% in a number of African countries. The main consumers of electricity are households and industry.
All LICs are net importers of oil and oil products; two LICs- Myanmar and Mozambique are net exporters of natural gas; four LICs- North Korea, Mozambique, Myanmar, and Zimbabwe are net exporters of coal; and four LICs- Congo (DPR), Kyrgyzstan, Mozambique, and Uganda are net exporters of electricity, mostly generated from hydro resources. Oil accounted for 15% of TPES in 2010 in LICs against the world average of 32.4%. The total global oil consumption is estimated to increase by 12.8% in next two decades, driven largely by non-OECD countries China and India. LICs are all net importers of oil, but recent reserve discoveries in Ghana, Uganda, and Kenya may enable them to become net exporters, but the infrastructure for exporting oil has to be developed in these countries to take the benefit of increase in world oil price. Oil production in LICs, however is unlikely to make a significant difference in global market [34]. Some LICs such as Myanmar, Bangladesh, and Kyrgyzstan have subsidized fuel costs in their countries. Natural gas currently plays a significant role in the energy mix of only a few LICs and on an average accounts for 11% of their TPES as against the world average of 21.4% [36]. Myanmar and Mozambique are already net exporters of gas and new reserves in Mozambique and eastern Africa are expected to be brought into production in the near future [33].
Coal is consumed in 14 LICs and nearly 70% of these LICs have coal contributing to less than 5% of their energy mix compared to the world average of 27.3%. Coal is, however, a significant source of energy for North Korea, Kyrgyzstan, Cambodia and Zimbabwe.
The production and consumption of biofuels in LICs has been quite limited to date. The US EIA data lists eight LICs producing biofuels in 2011, at a level of 100-200 barrels per day, or less. However, this may increase as oil prices rise.
The high proportion of renewable energy in TPES of LICs, as noted above is due mainly to traditional use of biomass for domestic cooking. The European Report on Development (2012) highlights that if appropriate policies are put into place to overcome the high investment costs for renewable electricity, and to ameliorate the business environment, renewable energy in LICs may boost business and growth and reduce poverty. According to IRENA, solar has high potential in the majority of African LICs.
3.4.3 Impact of energy resource extractions in business as usual scenario on LICs
The energy demand projections for India for 2020 and 2050 show several fold increase in the consumption of oil, gas, coal, and nuclear materials, a significant portion of which will be met through imports due to limited domestic resources.
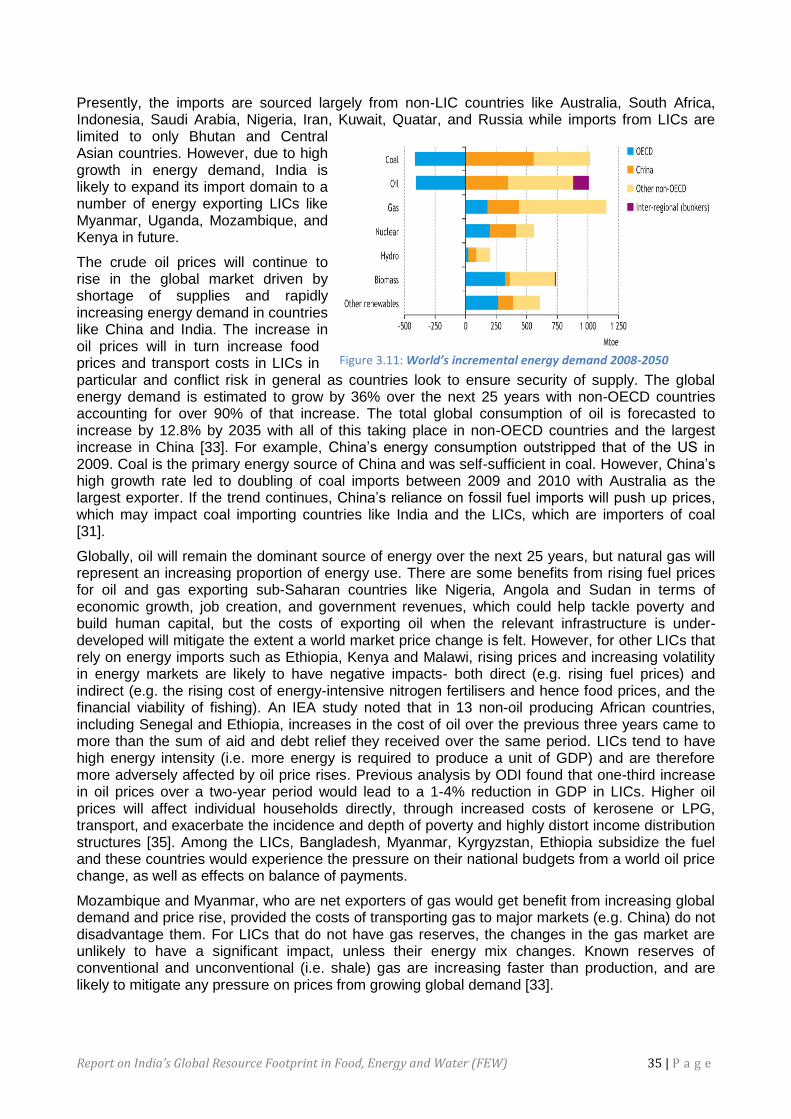
Report on India’s Global Resource Footprint in Food, Energy and Water (FEW) 35 | P a g e
Presently, the imports are sourced largely from non-LIC countries like Australia, South Africa, Indonesia, Saudi Arabia, Nigeria, Iran, Kuwait, Quatar, and Russia while imports from LICs are limited to only Bhutan and Central Asian countries. However, due to high growth in energy demand, India is likely to expand its import domain to a number of energy exporting LICs like Myanmar, Uganda, Mozambique, and Kenya in future.
The crude oil prices will continue to rise in the global market driven by shortage of supplies and rapidly increasing energy demand in countries like China and India. The increase in oil prices will in turn increase food prices and transport costs in LICs in particular and conflict risk in general as countries look to ensure security of supply. The global energy demand is estimated to grow by 36% over the next 25 years with non-OECD countries accounting for over 90% of that increase. The total global consumption of oil is forecasted to increase by 12.8% by 2035 with all of this taking place in non-OECD countries and the largest increase in China [33]. For example, China‘s energy consumption outstripped that of the US in 2009. Coal is the primary energy source of China and was self-sufficient in coal. However, China‘s high growth rate led to doubling of coal imports between 2009 and 2010 with Australia as the largest exporter. If the trend continues, China‘s reliance on fossil fuel imports will push up prices, which may impact coal importing countries like India and the LICs, which are importers of coal [31].
Globally, oil will remain the dominant source of energy over the next 25 years, but natural gas will represent an increasing proportion of energy use. There are some benefits from rising fuel prices for oil and gas exporting sub-Saharan countries like Nigeria, Angola and Sudan in terms of economic growth, job creation, and government revenues, which could help tackle poverty and build human capital, but the costs of exporting oil when the relevant infrastructure is under-developed will mitigate the extent a world market price change is felt. However, for other LICs that rely on energy imports such as Ethiopia, Kenya and Malawi, rising prices and increasing volatility in energy markets are likely to have negative impacts- both direct (e.g. rising fuel prices) and indirect (e.g. the rising cost of energy-intensive nitrogen fertilisers and hence food prices, and the financial viability of fishing). An IEA study noted that in 13 non-oil producing African countries, including Senegal and Ethiopia, increases in the cost of oil over the previous three years came to more than the sum of aid and debt relief they received over the same period. LICs tend to have high energy intensity (i.e. more energy is required to produce a unit of GDP) and are therefore more adversely affected by oil price rises. Previous analysis by ODI found that one-third increase in oil prices over a two-year period would lead to a 1-4% reduction in GDP in LICs. Higher oil prices will affect individual households directly, through increased costs of kerosene or LPG, transport, and exacerbate the incidence and depth of poverty and highly distort income distribution structures [35]. Among the LICs, Bangladesh, Myanmar, Kyrgyzstan, Ethiopia subsidize the fuel and these countries would experience the pressure on their national budgets from a world oil price change, as well as effects on balance of payments.
Mozambique and Myanmar, who are net exporters of gas would get benefit from increasing global demand and price rise, provided the costs of transporting gas to major markets (e.g. China) do not disadvantage them. For LICs that do not have gas reserves, the changes in the gas market are unlikely to have a significant impact, unless their energy mix changes. Known reserves of conventional and unconventional (i.e. shale) gas are increasing faster than production, and are likely to mitigate any pressure on prices from growing global demand [33].
Figure 3.11: World’s incremental energy demand 2008-2050
Report on India’s Global Resource Footprint in Food, Energy and Water (FEW) 36 | P a g e
LICs, which are net exporters of coal (North Korea, Cambodia, Zimbabwe, and Kyrgyzstan) would gain from the expected short-term rise in coal prices and continuing demand for power generation in emerging countries like India.
In the absence of incentives for low-carbon growth, the increasing energy prices may drive further extraction of fossil fuels such as coal, with significant environmental consequences. In India, for instance, most remaining coal is under forests, leading to a carbon ‗double whammy‘ if it is extracted. Over 20% of the global population, or 1.4 billion people, lack access to electricity. 40%, or 2.7 billion people rely on the traditional use of biomass for cooking. Experts predict this will persist and worsen in the longer term, especially for rural people in Sub-Saharan Africa (notably Nigeria & Ethiopia), India and Bangladesh. Future energy shortage, erratic supply, and volatile price will have a significant impact especially in more remote areas in LICs. Fuel shortage could lead to increasing isolation of remote rural areas, an increase in rural-urban divide [40]. Premature deaths arising from indoor air pollution are likely to exceed 1.5 million per year by 2030. As fossil fuel costs rise, reliance on biomass increases particularly in sub-Saharan Africa and India, driving land degradation and deforestation.
A significant portion of future energy demand of India will be met from RE sources such as bio-energy, solar, wind, and small hydro, which requires additional land. Though bio-energy requires land for growing energy plantations, the land used for agriculture purposes can be used for bioenergy purposes, as agriculture waste and forests waste can be utilised for power generation. However, India may have to depend on neighbouring countries for supplying biomass imports into India. The increased use of RETs has land use implications since onshore wind and solar have a higher direct land use requirement than thermal generators. Thus, local land use for power generation is likely to be dominated by RETs. Coal has high land use associated with mining and land requirements will dependent on the mining technique employed.
3.4.4 India’s best practices in energy sector
India has successfully implemented several successful measures and best practices that have been contributing to mitigating negative impacts of resource extraction by appropriate policy interventions, technology, innovation, and new business models, which are outlined below:
Policy The Electricity Act 2003 brought about a qualitative transformation of the electricity sector through
the creation of a liberal framework for development of the power sector including renewable energy development; the NAPCC facilitated promoting the understanding, adaptation and mitigation of climate change, energy efficiency, and resource conservation.
Renewable energy promotion: Creation of a separate Ministry (MNRE) for the development of renewable energy paved the way for the rapid development, promotion, and mainstreaming of renewable energy. The JNNSM is the most significant drivers of the solar energy sector development in India; The RPO mandate purchase or generate electricity requirement from RE sources; REC, a tradable and market-based instrument that enhanced compliance of states to RPO; The National Policy on Biofuels 2009; generation based incentives, allowance of FDI in RE sector, tax incentives and various fiscal incentives of MNRE since 1990s have paved the way for large-scale penetration of RETs (solar, wind, biomass, bagasse cogeneration, solar rooftop systems, and small hydro) in Indian market.
Rural electrification: RGGVY facilitated extending access to electricity for rural households; the guidelines formulated by MoP for decentralized distributed generation (DDG) in 2009 has given impetus to DDG for rural electrification.
Promoting energy efficiency and demand side management in core sectors: Energy conservation potential in India is estimated at 23% and various initiatives have been taken to explore this potential. The Energy Conservation Act 2001 is the landmark policy for the promotion of energy efficiency in the country. The NMEEE, one of the eight key missions under the NAPCC, targets energy saving of 23 Mtoe of fossil fuels by 2015. The key initiatives under the NMEEE namely PAT, MTEE, and EEF target to enhance energy efficiency in large and energy-intensive industries, home appliances, and financing DSM programs respectively. The other initiatives such as S&L program for high energy end-use equipment and appliances; the ECBC for new
Report on India’s Global Resource Footprint in Food, Energy and Water (FEW) 37 | P a g e
commercial buildings through innovative business models; the Agriculture DSM program through public-private partnership (PPP) mode; Municipal DSM program; and BEE SME Program for energy efficiency in small and medium enterprise clusters are the major policy initiatives undertaken to enhance energy efficiency of the nation and make energy sector economically as well as environmentally sustainable.
Institutional Strengthening of community based institutional structures such as village energy committees (VECs) have played significant role in sustaining access to energy activities undertaken in rural areas and this has been accomplished through capacity building, training, and sensitization (e.g. DFID project in Chhattisgarh and Orissa). Community based mechanisms for maintenance and after-sales services of RETs have contributed to success of clean energy access initiatives in Orissa and Chhattisgarh.
Financing Access to affordable financing and credit facilities is essential for penetration of RETs in rural
areas and providing access to clean energy. The government of India with the support of multilateral and bilateral agencies (WB, GEF, UNDP, DFID, IFC, SDC) made affordable finance available through Regional Rural Banks (RRB), district cooperative banks, Grameen banks, financial institutions, and micro finance institutions for RETs (solar lanterns, solar home systems, and solar agricultural pumps sets), which have transformed the rural markets.
Renewable energy options require high initial investments. The National Clean Energy Fund created by India has been supporting the development of RE by extending finance.
Accessing carbon markets through CDM for RE and EE projects have promoted technology transfer from industrialised nations and offset emissions through carbon credits.
Technological The international cooperation in technology transfer and emphasis on R&D has enhanced
India‘s capabilities in setting up state-of-the-art grid tied RE technologies such as wind turbines, SPV & solar thermal based power generation, solar rooftop systems, solar water heating, bagasse cogeneration, and biomass power (combustion & gasification). India has also been successful in the promotion of clean coal technologies (ultra- supercritical, CFB boilers).
Improved biomass technologies for applications in cottage/ rural industries such as food processing are successfully deployed in Andhra Pradesh, which hold enormous potential in terms of wood conservation, ambient air quality improvement, and most importantly, improved bottom line for small entrepreneurs(12).
Innovation & business models Community based innovative models addressing cooking energy needs in rural homes based on
biomass gasification/ biogas plants have been successfully demonstrated. The intervention is based on improved biomass technologies rather than a shift to modern cooking fuel like LPG.
RE based micro and small enterprises managed by rural entrepreneurs/ community groups led to sustainable development and contributed to income generation and poverty alleviation (example solar lantern facilitating income generation activities in Uttar Pradesh; and distilled water for batteries using solar thermal in Andhra Pradesh). Community cook stoves have been quite successful in Orissa in tribal children hostels and efforts are being made to up-scale the effort in other states.
Carbon finance and emissions trading promise longer-term incentives for developing renewable energy markets, which may be used to the advantage of poor in gaining energy security. Community-based approach through appropriate institutional arrangement could help in gaining access to carbon market revenues for such interventions.
India has several examples of successful innovative concession models for rural electrification using RE sources and these include DESI Power (biomass), Husk Power Systems (biomass), Tata BP Solar (for solar), SBA Hydro (small hydro)(13), and Winrock International India (biofuels). With thrust over un-conventional sources of energy globally, India is gearing to explore and develop domestic sources in terms of coal bed methane (CBM), shale gas, and tight gas. While shale gas policy is still under formulation, exploration activities have already commenced for CBM.
Report on India’s Global Resource Footprint in Food, Energy and Water (FEW) 38 | P a g e
3.4.5 India’s best practices that have replication potential for LICs
The large and energy intensive industries in LICs are major energy guzzlers and GHG emitters as fossil fuels (coal, oil, gas) constitute the major source of energy for the industrial sector. There is absence of policy, institutional, regulatory, technical, and financial mechanisms/ instruments in these countries for promoting energy/ resource efficiency in the industrial sector. In this regard, the PAT scheme of GOI holds significant replication potential in LICs for fostering resource use efficiency in large energy-intensive industrial sectors thereby reduce fossil fuel consumption, GHG emissions, and reliance on energy imports. The large-scale industrial sector in LICs, for example: cement (Kenya, Zimbabwe, Uganda, Nepal, Cambodia), pulp & paper (Kenya, Nepal), iron & steel (Tanzania, Zimbabwe), textiles (Bangladesh, Zimbabwe, Tanzania, Malawi), petrochemicals (Kenya, Nigeria), fertilizers (Zimbabwe, Tanzania), thermal power generation (Zimbabwe, Uganda, Nigeria, Kenya), and aluminium (Tajikistan) can significantly learn and benefit from India‘s PAT initiative through knowledge and information sharing, exchange of best practices, technical know-how, policy learnings, and institutional/ regulatory mechanisms. Besides promoting resource efficiency, the associated benefits of such an initiative are sustained industrial growth, employment opportunities, and income generation.
The small and medium industries (SME) sector plays a key role in the economic development and employment generation of a majority of LICs, after agriculture sector. LICs have conglomeration of SMEs and some examples are: Ethiopia (textiles, leather, food and beverages, chemicals, metal products, pharmaceuticals), Kenya (food and beverages, textiles, & fibres, chemicals, pharmaceuticals, rubber, plastics, engineering), Uganda (plastics, beverages, agro processing), Tanzania (agro processing, chemicals, leather, textiles, rubber, metal products, food & beverages), Niger (chemicals), Malawi (pharmaceuticals, textiles, agro processing, leather), Zimbabwe (chemicals, textiles, food & beverages), Bangladesh (textiles, pharmaceuticals, automobiles, agro and food processing), and Nepal (rice mills, jute, edible oil, bricks, ceramics). The SMEs are large consumers of fossil fuels and employ outdated and inefficient technologies and processes. There is tremendous scope for the LICs to learn from and replicate India‘s successful SME sector development initiatives and experiences (BEE SME-EE program, Credit Lines of major international development agencies- JICA, KfW, AfD for promoting resource efficiency, WB-GEF‘s ―Energy Efficiency at MSMEs‖ etc.) through knowledge sharing, innovative financing mechanisms, policy learnings, and capacity building to achieve energy / resource efficiency, cleaner production/ waste minimization, water conservation, renewable energy utilisation, and productivity enhancement. Replication of these Indian best practices in LICs can foster sustainable development and transformation of the SME sector thereby contributing to job creation, income generation, poverty alleviation, human development, and economic development.
Agriculture is the mainstay of many LICs (example Bangladesh, Uganda, Zimbabwe, Nepal, Nigeria, Malawi, Ethiopia, Cambodia, Benin, and Madagascar) and provides largest employment, supports millions of livelihoods, poverty alleviation, human resources development, food security, and contributes substantially to the economy. The sector is also a major consumer of energy for irrigation and the agriculture pump sets employed in LICs have very low efficiency. The agriculture sector also provides very critical water-energy-food nexus, therefore, strategically the most important sector of LICs for technology up-gradation to achieve energy efficiency, water conservation, farm productivity, renewable energy utilisation, bioenergy generation, and reduce pressure on groundwater reservoirs and GHG emissions. There is tremendous scope for learning and replication of India‘s innovative and successful Agricultural DSM (Ag DSM) programme in LICs to promote energy efficiency through innovative business models, access to finance, market transformation, and policies conducive to implement energy efficiency measures.
To sustain economic growth and rural development in LICs, there will be a commensurate increase in consumption of commercial energy, most of which is fossil fuels and electricity, therefore more dependence on imports and energy insecurity. To be able to provide access to electricity, energy efficiency and conservation is a key element. It is therefore necessary to have a national energy efficiency and conservation strategy for LICs for improving end-use efficiency that targets supply of energy efficient models of electric appliances and equipment
Report on India’s Global Resource Footprint in Food, Energy and Water (FEW) 39 | P a g e
such as electric motors, pumps, air conditioners, and refrigeration for industrial, commercial, and residential sectors. The Standards and Labelling (S&L), one of the flagship programmes of India, has been successful in providing the consumer an informed choice about the energy saving and thereby cost saving potential of the appliance and facilitated market transformation. By replicating this programme, LICs are expected to achieve huge energy savings, reduced dependence on energy imports, and reduction in GHG emissions. The Indian experience showed that such a program has sustainable social benefits such as jobs creation, income generation, and poverty alleviation.
The availability of energy is highly inequitable in LICs, which account for 12%(14) of world‘s population, but consume a mere 1% of energy. The access challenge is particularly significant in Sub-Saharan Africa as it is the only region where the rate of progress on energy access has fallen behind population growth both for electricity and primary non-solid fuels in the past two decade. Energy access is particularly low in Sub-Saharan Africa, with 13 countries having access below 25% and 19 countries having non-solid fuel usage under 10% and per capita electricity consumption is the lowest in the world. Limited access to affordable energy is an important contributor to poverty in LICs(15). Access to modern forms of energy is essential to overcome poverty, to promote economic growth and employment opportunities, and promote sustainable development. It is also essential input for achieving most MDGs. The first and foremost thing is to create policy environment that is conducive for access to modern energy services in LICs and India has been notably successful through RGGVY and ―Guidelines for village electrification through DDG projects‖, and these policy/ institutional best practices replicated in LICs. The off-grid DDG projects using RE sources such as biomass, small hydro, and solar through innovative business models (e.g. DESI Power, Husk Power Systems, SBA Hydro, Tata BP Solar, Winrock International India) have tremendous scale-up potential in LICs and this can be explored through cooperation in transfer of appropriate technologies and knowledge sharing. The other innovative rural electrification projects that have large scale up potential in LICs are community based cook stoves, integration of livelihood activities/ productive applications with rural electrification projects, strengthening of existing community based institutional structure for sustenance of activities, promoting renewable energy based micro/ small enterprises for income generation as demonstrated in DFID India project in Orissa and Chhattisgarh.
Report on India’s Global Resource Footprint in Food, Energy and Water (FEW) 40 | P a g e
4.0 Water
4.1 Changing context of supply security
India, with 18% of the world‘s population has only 4% of the global renewable water resources. While India has 4,000 billion cubic metres (BCUM) of water available annually, the utilisable water is estimated at 1,123 BCM according to one estimate and 654 BCM according to another. The country can be divided into 16 ecological regions, each with their precipitation patterns of rainfall and snow, leading to spatial differences in water availability.
Water is a critical natural resource that is increasingly getting scarce. It is necessary for survival and maintaining of ecosystems, and critical for GDP growth, agricultural production, energy generation, waste treatment, industrialisation, and moving up the socioeconomic ladder. It is also a human recognized human right. However, over the years, water resources have been rampantly abused, leading to its scarcity and deterioration in quality. The main drivers of the resource scarcity include:
► Population growth: Census 2011 recorded a population of 1.2 billion. Between 2001 and 2011 India added 181 million people to the world, slightly less than the entire population of Brazil. The Technical Group, National Commission on Population under the Chairmanship of Registrar General, has projected that India‘s population will reach 1.4 billion by 2026. In 2050 India‘s population is projected to be 1.69 billion — China‘s will be 1.31 billion. This will put additional demand on water resources. The projected domestic water demand for 2025 and 2050 are 73 BCM and 102 BCM respectively.
► Increasing urbanisation: The rapid exodus from rural areas to urban areas is increasing population and adding pressure on to available urban water resources. The urban population is expected to rise to 566 million by 2025 from the 2011 urban population of 377 million. Often urban water demands are met at the cost of rural and agricultural needs. Increasingly water for urban areas is being sourced from further away, with social, equity, and financial and environmental implications. Cities like Delhi, Mumbai, and Bangalore meet their water demand from surface water located at a distance. There have been instances of conflict due to allocation of water from dams to cities instead of irrigation. In Rajasthan, during August 2006, farmers protested the diversion of water in Bisalpur dam for meeting the drinking water needs of Jaipur and other towns.
► Increased demand for food: The increasing population will need food for survival, increasing pressure on water demand. As the aspirations of the people increase their food habits are changing, putting pressure on the water resources. Cultivation of water-intensive crops in water-stressed areas has compounded the problem. By 2030 agriculture will account for almost 910 BCM by 2025 by one estimate and 1,200 BCM or 80 per cent of total water demand by another.
► Economic growth: The GDP growth has been impressive. Between 2000-11, India attracted cumulative Foreign Direct Investment inflow of USD 237 billion. Increased industrialisation has also left its footprint on water resources, qualitatively and quantitatively. Mining, steel production and power generation for example, have huge water footprints. Promotion of water intensive industry in water scarce areas has compounded the problem. The water demand by industry was 23 BCM for 2010 and is expecd to increase to 23 and 63 BCM in 2025 and 2050 respectively. Another estimate pegs the demand for 2030 at 196 BCM.
► Socioeconomic growth and provision of basic services as per government norms: With growing needs, improved education levels and the provision of basic drinking water, sanitation and hygiene services, the annual per capita demand of water has increased. Per capita urban domestic water requirements are more than rural – 140 lpcd is the recommended provision for urban and 700 lpcd for rural.
► Technological advancements: Simple technological advancements for water extraction have led to rampant misuse. The use of motorised pumps has enabled easy extraction of groundwater. The subsidies on energy for agricultural purposes has further facilitated groundwater extraction.
► Political decisions: Provision of subsidised power for agriculture, leading to groundwater mining. The Green Revolution progressed simultaneously with groundwater irrigation development. groundwater irrigation. In 2001, around 40 million hectares of irrigated area was by groundwater. Data on groundwater extraction and presence of electric pumps indicates that groundwater stress
Report on India’s Global Resource Footprint in Food, Energy and Water (FEW) 41 | P a g e
has peaked in areas where electric tube wells dominated. The World Bank in 2001 estimated the volume of farm power subsidies in our country amounts to b US$6 billion a year - equivalent to about 25 per cent of India‘s fiscal deficit, twice the annual public spending on health or rural development, and two and a half times the yearly expenditure on irrigation.
► Mismanagement of water: The lack of appreciation of water, its importance, its limited nature and distancing of the people from its management has led to its abuse, overuse and desecration. In urban areas, rapid real estate development and concretisation have affected natural drainage systems. Lakes and ponds have dried up. Groundwater is being mined and rivers have turned into polluted drains and sometimes do not reach the sea. Anthropogenic changes in the catchment areas have affected groundwater recharge and flows in rivers.
► Non-compliance to pollution standards: An estimated 68.5 million cubic meters of untreated industrial effluents and sewage is being dumped everyday into water bodies despite the existence of pollution control boards. Poor governance has compounded the problem.
► Poor water use efficiency: India‘s water use efficiency for agriculture is a mere 38%, way behind 50-60% efficiency of Israel, China, and Taiwan.
► Climate change: The rapidly changing climate has affected the hydrological cycle, leading to erratic rainfall, drought, floods, cyclones, salinity intrusion and water quality issues. In a ‗water disaster-prone‘ country, this uncertainty and unpredictability is adding on to existing challenges in water management, both qualitatively and quantitatively.
4.2 Current consumption in India
The phrase ‗Water is life is‘ no cliché. Water is essential for socio-economic development, sustaining the ecology and for economic development. Equity is an issue when related to access to water, often used as a tool for exercising power and control. The UN recognises access to safe drinking water and sanitation as human rights: Lack of access to water and sanitation impinge on the rights of children and women as well.
Under the Millennium Development Goals (MDGs), countries have committed halving the people without access to drinking water and sanitation by half by 2015: India has achieved the sub-goal of drinking water but has a long way to go for sanitation. Access to adequate water and sanitation have an impact on MDG goals, as indicated in below.
MDG Effects of lack of water and sanitation
Eradicate extreme poverty and hunger (MDG 1)
(a) Paying more for water, straining financial resources (b) Waterborne disease adding to health expenditure (c) Absenteeism from work rusting in suboptimal performance and lower pay (d) More time spent in collecting water resulting in lost opportunity for earning. At least 17% women in the rural their increase walk more than half a km to get water for their household (Census 2011) (e) High open defecation (OD), leading to disease, poor performance, absenteeism and lower pay (OD is at nearly 70% for rural and 20% for urban Census 2011) (f) More land, groundwater pollution due to OD.
Achieve universal primary education (MDG 2)
(a) Increased school dropout and absenteeism: More than 25% of rural girls/women miss up 50 days of school work a year due to lack of access to proper sanitary protection. (AC Neilson & Plan survey, 2012). Waterborne disease also causes absenteeism.
Promote gender equality and empower women (MDG 3)
(a) Increased violence against women (VAW): At least 17% women in the rural areas walk more than half a km to get water for their families and for their cattle, and 55% of them are forced to bathe in the open because they do not have any private bathing facilities and are also forced to defecate in the open. In 2012, In Bihar 40 per cent of rape cases took place when women went out to defecate, according to police sources (b) More burden on women and their non-engagement in other productive activities.
Infant mortality Rate (IMR) (MDG 4)
(a) More underweight children: Unsafe water, lack of sanitation and insufficient hygiene are responsible for 50% of underweight children in the world. India has 59% kids stunted, 42% underweight in the country (b) Malnourished children are more vulnerable to other infectious diseases more are induced by unsafe water, inadequate sanitation and insufficient hygiene. (c) Increased diarrhea: Diarrhea is the second biggest killer of children in South Asia at 11 % after Pneumonia at 22%. In India alone 13% of Under-5 mortality deaths are due to diarrhea (d) More cases of anaemia, estimated to contribute to more than 115,000 lakh maternal deaths, and 591,000 lakh prenatal deaths globally per year. Asia and Africa account for more than 85% of the absolute anaemia burden in high-risk groups with nearly 40% of 5-yr-olds being anaemic in India.
Maternal Mortality Rate (MMR) (Goal 5)
(a) Lower immunity levels among women and children thus more infections: Inadequate water and sanitation facilities, poor dietary intake of iron, iron loss due to parasite load, poor environmental and personal sanitation contribute to high rates of transmission of helminth infections especially hookworm infections leading to iron deficiency anemia (IDA) among women (b) Unhealthy babies
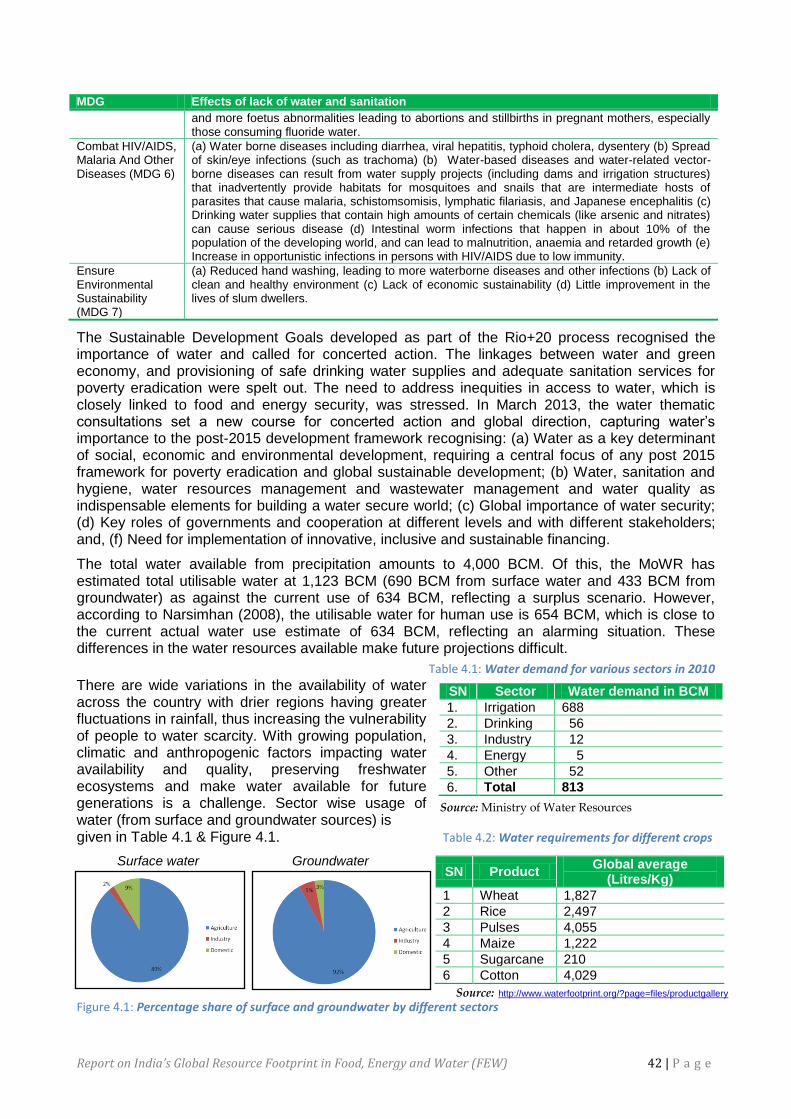
Report on India’s Global Resource Footprint in Food, Energy and Water (FEW) 42 | P a g e
MDG Effects of lack of water and sanitation
and more foetus abnormalities leading to abortions and stillbirths in pregnant mothers, especially those consuming fluoride water.
Combat HIV/AIDS, Malaria And Other Diseases (MDG 6)
(a) Water borne diseases including diarrhea, viral hepatitis, typhoid cholera, dysentery (b) Spread of skin/eye infections (such as trachoma) (b) Water-based diseases and water-related vector-borne diseases can result from water supply projects (including dams and irrigation structures) that inadvertently provide habitats for mosquitoes and snails that are intermediate hosts of parasites that cause malaria, schistomsomisis, lymphatic filariasis, and Japanese encephalitis (c) Drinking water supplies that contain high amounts of certain chemicals (like arsenic and nitrates) can cause serious disease (d) Intestinal worm infections that happen in about 10% of the population of the developing world, and can lead to malnutrition, anaemia and retarded growth (e) Increase in opportunistic infections in persons with HIV/AIDS due to low immunity.
Ensure Environmental Sustainability (MDG 7)
(a) Reduced hand washing, leading to more waterborne diseases and other infections (b) Lack of clean and healthy environment (c) Lack of economic sustainability (d) Little improvement in the lives of slum dwellers.
The Sustainable Development Goals developed as part of the Rio+20 process recognised the importance of water and called for concerted action. The linkages between water and green economy, and provisioning of safe drinking water supplies and adequate sanitation services for poverty eradication were spelt out. The need to address inequities in access to water, which is closely linked to food and energy security, was stressed. In March 2013, the water thematic consultations set a new course for concerted action and global direction, capturing water‘s importance to the post-2015 development framework recognising: (a) Water as a key determinant of social, economic and environmental development, requiring a central focus of any post 2015 framework for poverty eradication and global sustainable development; (b) Water, sanitation and hygiene, water resources management and wastewater management and water quality as indispensable elements for building a water secure world; (c) Global importance of water security; (d) Key roles of governments and cooperation at different levels and with different stakeholders; and, (f) Need for implementation of innovative, inclusive and sustainable financing.
The total water available from precipitation amounts to 4,000 BCM. Of this, the MoWR has estimated total utilisable water at 1,123 BCM (690 BCM from surface water and 433 BCM from groundwater) as against the current use of 634 BCM, reflecting a surplus scenario. However, according to Narsimhan (2008), the utilisable water for human use is 654 BCM, which is close to the current actual water use estimate of 634 BCM, reflecting an alarming situation. These differences in the water resources available make future projections difficult.
Table 4.1: Water demand for various sectors in 2010
There are wide variations in the availability of water across the country with drier regions having greater fluctuations in rainfall, thus increasing the vulnerability of people to water scarcity. With growing population, climatic and anthropogenic factors impacting water availability and quality, preserving freshwater ecosystems and make water available for future generations is a challenge. Sector wise usage of water (from surface and groundwater sources) is given in Table 4.1 & Figure 4.1. Table 4.2: Water requirements for different crops
Surface water Groundwater
Figure 4.1: Percentage share of surface and groundwater by different sectors
SN Sector Water demand in BCM
1. Irrigation 688
2. Drinking 56
3. Industry 12
4. Energy 5
5. Other 52
6. Total 813
SN Product Global average
(Litres/Kg)
1 Wheat 1,827
2 Rice 2,497
3 Pulses 4,055
4 Maize 1,222
5 Sugarcane 210
6 Cotton 4,029
Source: Ministry of Water Resources
Source: http://www.waterfootprint.org/?page=files/productgallery
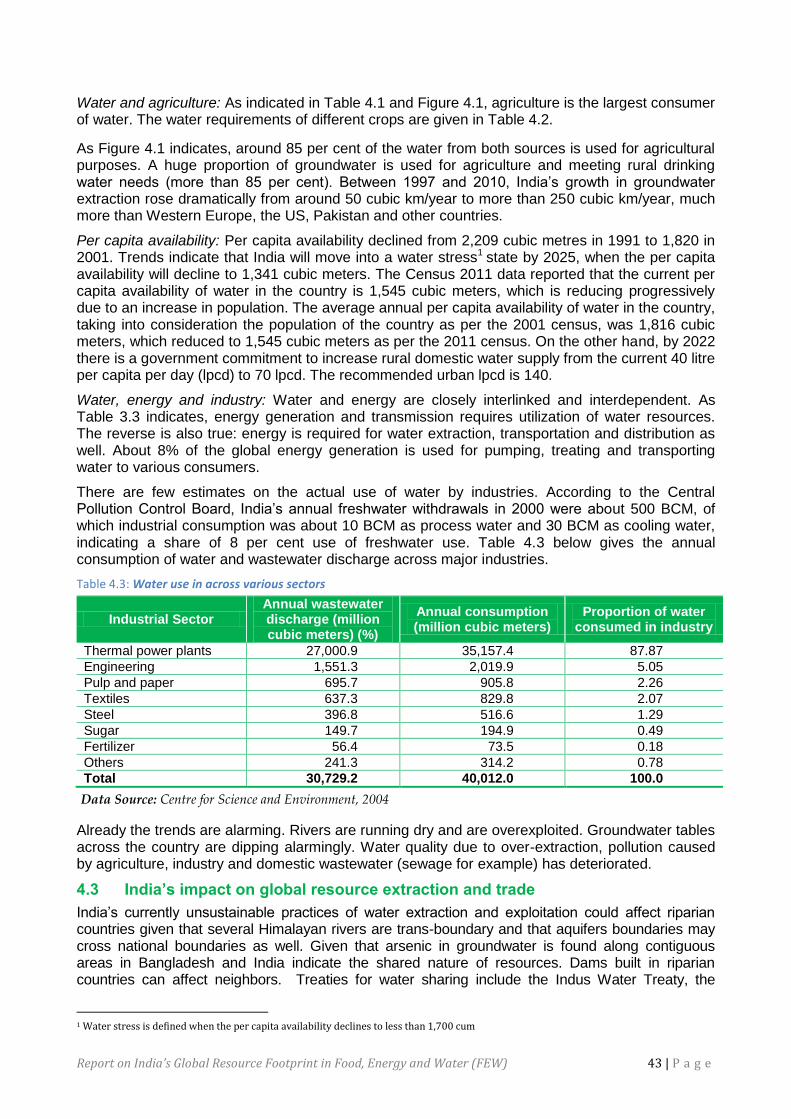
Report on India’s Global Resource Footprint in Food, Energy and Water (FEW) 43 | P a g e
Water and agriculture: As indicated in Table 4.1 and Figure 4.1, agriculture is the largest consumer of water. The water requirements of different crops are given in Table 4.2.
As Figure 4.1 indicates, around 85 per cent of the water from both sources is used for agricultural purposes. A huge proportion of groundwater is used for agriculture and meeting rural drinking water needs (more than 85 per cent). Between 1997 and 2010, India‘s growth in groundwater extraction rose dramatically from around 50 cubic km/year to more than 250 cubic km/year, much more than Western Europe, the US, Pakistan and other countries.
Per capita availability: Per capita availability declined from 2,209 cubic metres in 1991 to 1,820 in 2001. Trends indicate that India will move into a water stress1 state by 2025, when the per capita availability will decline to 1,341 cubic meters. The Census 2011 data reported that the current per capita availability of water in the country is 1,545 cubic meters, which is reducing progressively due to an increase in population. The average annual per capita availability of water in the country, taking into consideration the population of the country as per the 2001 census, was 1,816 cubic meters, which reduced to 1,545 cubic meters as per the 2011 census. On the other hand, by 2022 there is a government commitment to increase rural domestic water supply from the current 40 litre per capita per day (lpcd) to 70 lpcd. The recommended urban lpcd is 140.
Water, energy and industry: Water and energy are closely interlinked and interdependent. As Table 3.3 indicates, energy generation and transmission requires utilization of water resources. The reverse is also true: energy is required for water extraction, transportation and distribution as well. About 8% of the global energy generation is used for pumping, treating and transporting water to various consumers.
There are few estimates on the actual use of water by industries. According to the Central Pollution Control Board, India‘s annual freshwater withdrawals in 2000 were about 500 BCM, of which industrial consumption was about 10 BCM as process water and 30 BCM as cooling water, indicating a share of 8 per cent use of freshwater use. Table 4.3 below gives the annual consumption of water and wastewater discharge across major industries.
Table 4.3: Water use in across various sectors
Industrial Sector Annual wastewater discharge (million cubic meters) (%)
Annual consumption (million cubic meters)
Proportion of water consumed in industry
Thermal power plants 27,000.9 35,157.4 87.87
Engineering 1,551.3 2,019.9 5.05
Pulp and paper 695.7 905.8 2.26
Textiles 637.3 829.8 2.07
Steel 396.8 516.6 1.29
Sugar 149.7 194.9 0.49
Fertilizer 56.4 73.5 0.18
Others 241.3 314.2 0.78
Total 30,729.2 40,012.0 100.0
Already the trends are alarming. Rivers are running dry and are overexploited. Groundwater tables across the country are dipping alarmingly. Water quality due to over-extraction, pollution caused by agriculture, industry and domestic wastewater (sewage for example) has deteriorated.
4.3 India’s impact on global resource extraction and trade
India‘s currently unsustainable practices of water extraction and exploitation could affect riparian countries given that several Himalayan rivers are trans-boundary and that aquifers boundaries may cross national boundaries as well. Given that arsenic in groundwater is found along contiguous areas in Bangladesh and India indicate the shared nature of resources. Dams built in riparian countries can affect neighbors. Treaties for water sharing include the Indus Water Treaty, the
1 Water stress is defined when the per capita availability declines to less than 1,700 cum
Data Source: Centre for Science and Environment, 2004
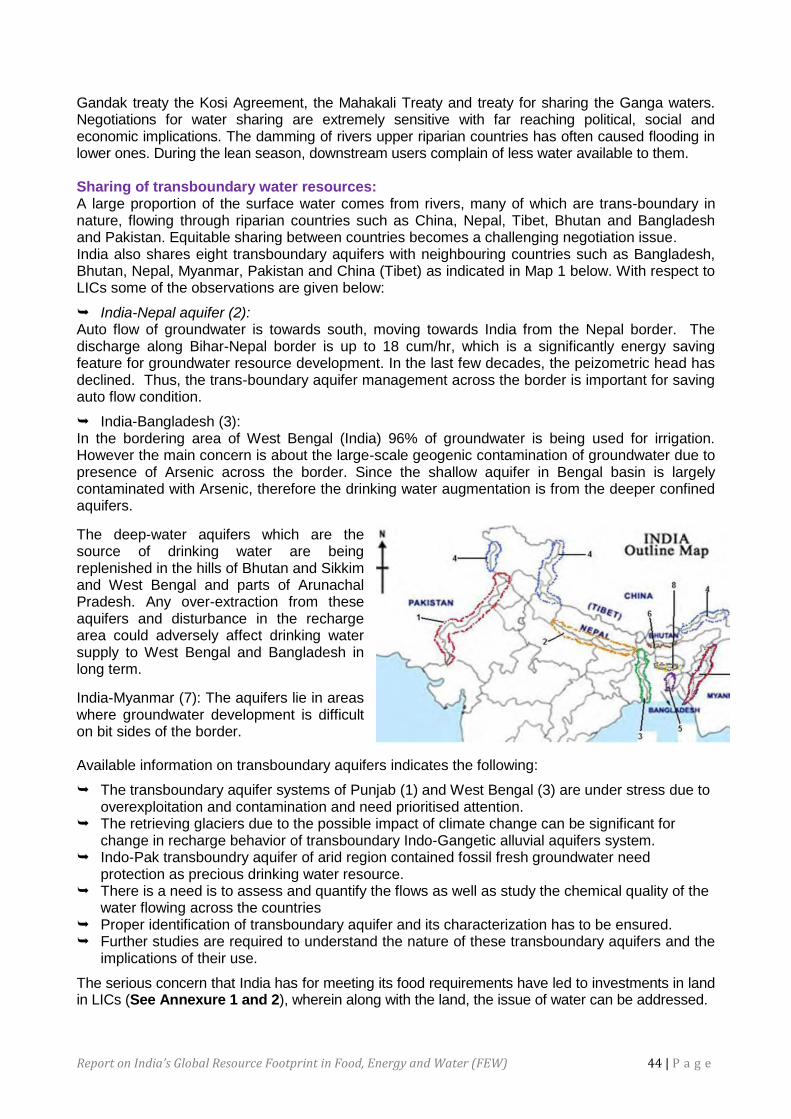
Report on India’s Global Resource Footprint in Food, Energy and Water (FEW) 44 | P a g e
Gandak treaty the Kosi Agreement, the Mahakali Treaty and treaty for sharing the Ganga waters. Negotiations for water sharing are extremely sensitive with far reaching political, social and economic implications. The damming of rivers upper riparian countries has often caused flooding in lower ones. During the lean season, downstream users complain of less water available to them. Sharing of transboundary water resources: A large proportion of the surface water comes from rivers, many of which are trans-boundary in nature, flowing through riparian countries such as China, Nepal, Tibet, Bhutan and Bangladesh and Pakistan. Equitable sharing between countries becomes a challenging negotiation issue. India also shares eight transboundary aquifers with neighbouring countries such as Bangladesh, Bhutan, Nepal, Myanmar, Pakistan and China (Tibet) as indicated in Map 1 below. With respect to LICs some of the observations are given below:
India-Nepal aquifer (2): Auto flow of groundwater is towards south, moving towards India from the Nepal border. The discharge along Bihar-Nepal border is up to 18 cum/hr, which is a significantly energy saving feature for groundwater resource development. In the last few decades, the peizometric head has declined. Thus, the trans-boundary aquifer management across the border is important for saving auto flow condition.
India-Bangladesh (3): In the bordering area of West Bengal (India) 96% of groundwater is being used for irrigation. However the main concern is about the large-scale geogenic contamination of groundwater due to presence of Arsenic across the border. Since the shallow aquifer in Bengal basin is largely contaminated with Arsenic, therefore the drinking water augmentation is from the deeper confined aquifers.
The deep-water aquifers which are the source of drinking water are being replenished in the hills of Bhutan and Sikkim and West Bengal and parts of Arunachal Pradesh. Any over-extraction from these aquifers and disturbance in the recharge area could adversely affect drinking water supply to West Bengal and Bangladesh in long term.
India-Myanmar (7): The aquifers lie in areas where groundwater development is difficult on bit sides of the border. Available information on transboundary aquifers indicates the following:
The transboundary aquifer systems of Punjab (1) and West Bengal (3) are under stress due to overexploitation and contamination and need prioritised attention.
The retrieving glaciers due to the possible impact of climate change can be significant for change in recharge behavior of transboundary Indo-Gangetic alluvial aquifers system.
Indo-Pak transboundry aquifer of arid region contained fossil fresh groundwater need protection as precious drinking water resource.
There is a need is to assess and quantify the flows as well as study the chemical quality of the water flowing across the countries
Proper identification of transboundary aquifer and its characterization has to be ensured. Further studies are required to understand the nature of these transboundary aquifers and the
implications of their use.
The serious concern that India has for meeting its food requirements have led to investments in land in LICs (See Annexure 1 and 2), wherein along with the land, the issue of water can be addressed.
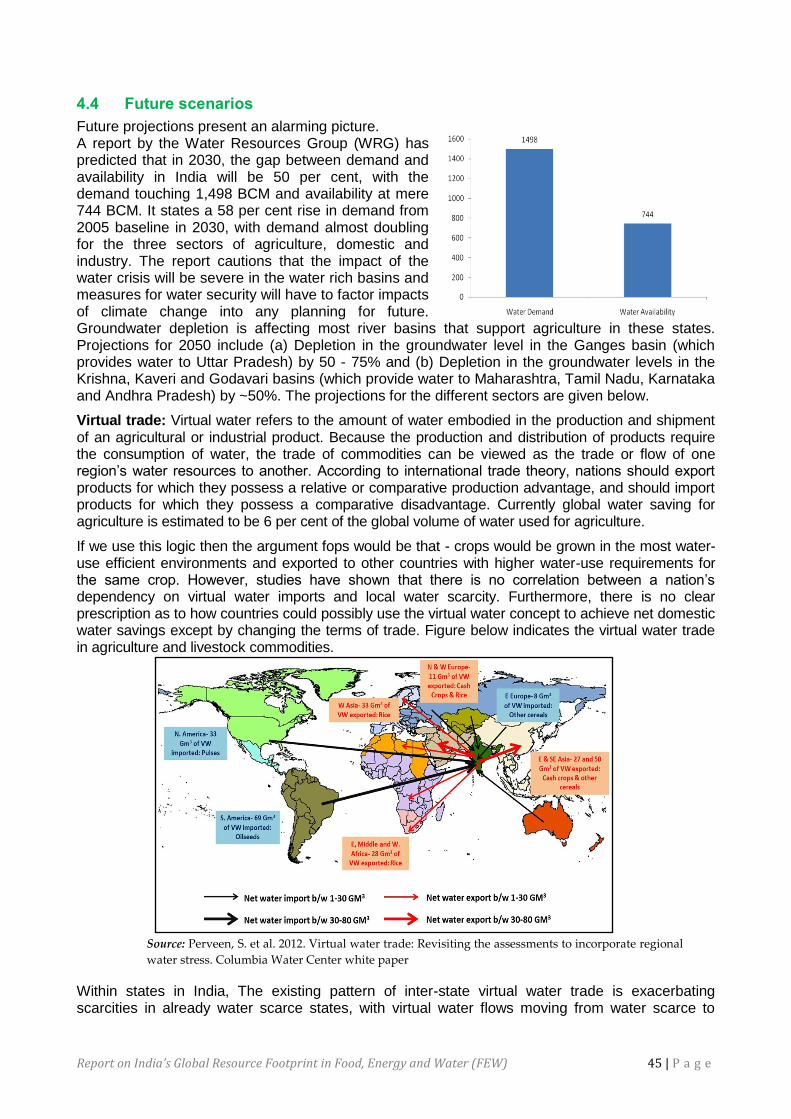
Report on India’s Global Resource Footprint in Food, Energy and Water (FEW) 45 | P a g e
4.4 Future scenarios
Future projections present an alarming picture. A report by the Water Resources Group (WRG) has predicted that in 2030, the gap between demand and availability in India will be 50 per cent, with the demand touching 1,498 BCM and availability at mere 744 BCM. It states a 58 per cent rise in demand from 2005 baseline in 2030, with demand almost doubling for the three sectors of agriculture, domestic and industry. The report cautions that the impact of the water crisis will be severe in the water rich basins and measures for water security will have to factor impacts of climate change into any planning for future. Groundwater depletion is affecting most river basins that support agriculture in these states. Projections for 2050 include (a) Depletion in the groundwater level in the Ganges basin (which provides water to Uttar Pradesh) by 50 - 75% and (b) Depletion in the groundwater levels in the Krishna, Kaveri and Godavari basins (which provide water to Maharashtra, Tamil Nadu, Karnataka and Andhra Pradesh) by ~50%. The projections for the different sectors are given below.
Virtual trade: Virtual water refers to the amount of water embodied in the production and shipment of an agricultural or industrial product. Because the production and distribution of products require the consumption of water, the trade of commodities can be viewed as the trade or flow of one region‘s water resources to another. According to international trade theory, nations should export products for which they possess a relative or comparative production advantage, and should import products for which they possess a comparative disadvantage. Currently global water saving for agriculture is estimated to be 6 per cent of the global volume of water used for agriculture.
If we use this logic then the argument fops would be that - crops would be grown in the most water-use efficient environments and exported to other countries with higher water-use requirements for the same crop. However, studies have shown that there is no correlation between a nation‘s dependency on virtual water imports and local water scarcity. Furthermore, there is no clear prescription as to how countries could possibly use the virtual water concept to achieve net domestic water savings except by changing the terms of trade. Figure below indicates the virtual water trade in agriculture and livestock commodities.
Within states in India, The existing pattern of inter-state virtual water trade is exacerbating scarcities in already water scarce states, with virtual water flows moving from water scarce to
Source: Perveen, S. et al. 2012. Virtual water trade: Revisiting the assessments to incorporate regional
water stress. Columbia Water Center white paper
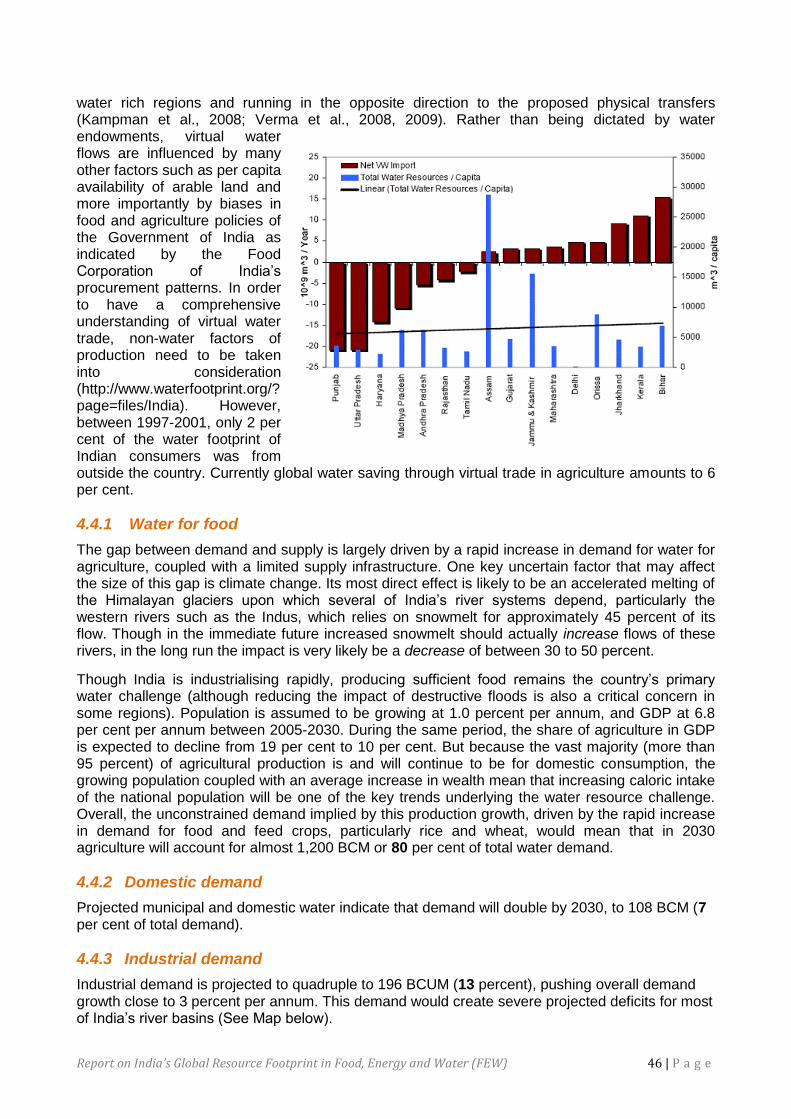
Report on India’s Global Resource Footprint in Food, Energy and Water (FEW) 46 | P a g e
water rich regions and running in the opposite direction to the proposed physical transfers (Kampman et al., 2008; Verma et al., 2008, 2009). Rather than being dictated by water endowments, virtual water flows are influenced by many other factors such as per capita availability of arable land and more importantly by biases in food and agriculture policies of the Government of India as indicated by the Food Corporation of India‘s procurement patterns. In order to have a comprehensive understanding of virtual water trade, non-water factors of production need to be taken into consideration (http://www.waterfootprint.org/?page=files/India). However, between 1997-2001, only 2 per cent of the water footprint of Indian consumers was from outside the country. Currently global water saving through virtual trade in agriculture amounts to 6 per cent.
4.4.1 Water for food
The gap between demand and supply is largely driven by a rapid increase in demand for water for agriculture, coupled with a limited supply infrastructure. One key uncertain factor that may affect the size of this gap is climate change. Its most direct effect is likely to be an accelerated melting of the Himalayan glaciers upon which several of India‘s river systems depend, particularly the western rivers such as the Indus, which relies on snowmelt for approximately 45 percent of its flow. Though in the immediate future increased snowmelt should actually increase flows of these rivers, in the long run the impact is very likely be a decrease of between 30 to 50 percent.
Though India is industrialising rapidly, producing sufficient food remains the country‘s primary water challenge (although reducing the impact of destructive floods is also a critical concern in some regions). Population is assumed to be growing at 1.0 percent per annum, and GDP at 6.8 per cent per annum between 2005-2030. During the same period, the share of agriculture in GDP is expected to decline from 19 per cent to 10 per cent. But because the vast majority (more than 95 percent) of agricultural production is and will continue to be for domestic consumption, the growing population coupled with an average increase in wealth mean that increasing caloric intake of the national population will be one of the key trends underlying the water resource challenge. Overall, the unconstrained demand implied by this production growth, driven by the rapid increase in demand for food and feed crops, particularly rice and wheat, would mean that in 2030 agriculture will account for almost 1,200 BCM or 80 per cent of total water demand.
4.4.2 Domestic demand
Projected municipal and domestic water indicate that demand will double by 2030, to 108 BCM (7 per cent of total demand).
4.4.3 Industrial demand
Industrial demand is projected to quadruple to 196 BCUM (13 percent), pushing overall demand growth close to 3 percent per annum. This demand would create severe projected deficits for most of India‘s river basins (See Map below).
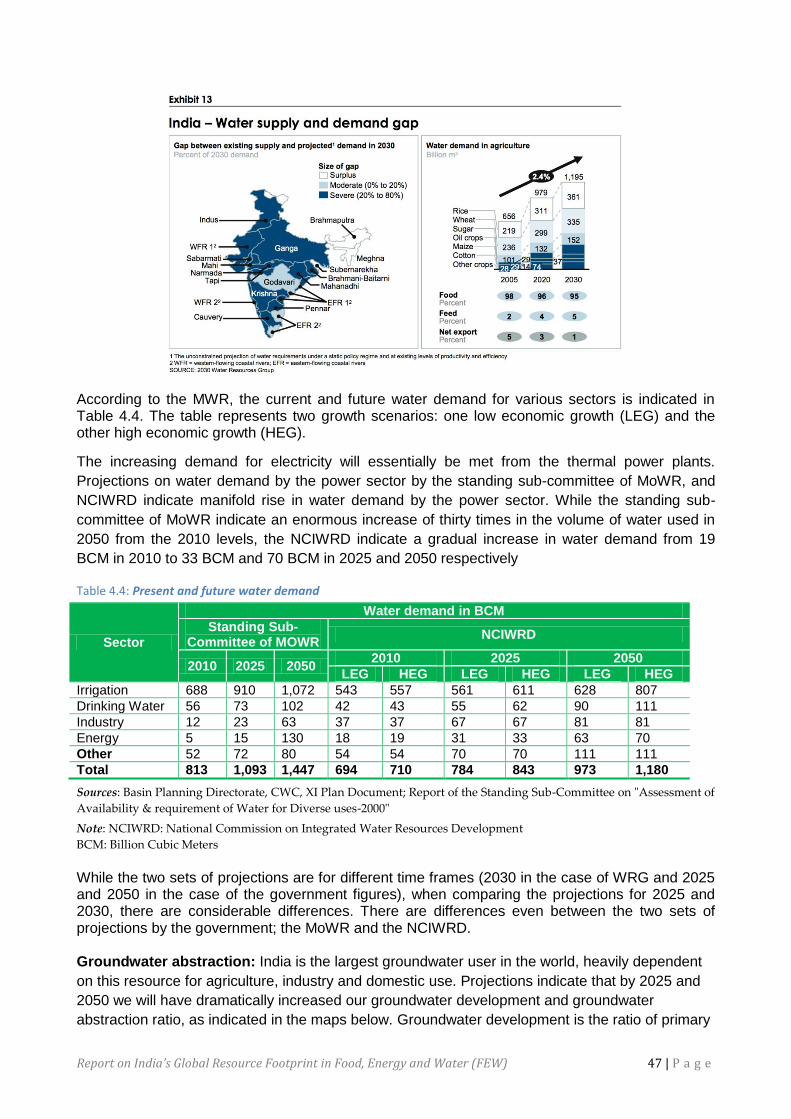
Report on India’s Global Resource Footprint in Food, Energy and Water (FEW) 47 | P a g e
According to the MWR, the current and future water demand for various sectors is indicated in Table 4.4. The table represents two growth scenarios: one low economic growth (LEG) and the other high economic growth (HEG).
The increasing demand for electricity will essentially be met from the thermal power plants.
Projections on water demand by the power sector by the standing sub-committee of MoWR, and
NCIWRD indicate manifold rise in water demand by the power sector. While the standing sub-
committee of MoWR indicate an enormous increase of thirty times in the volume of water used in
2050 from the 2010 levels, the NCIWRD indicate a gradual increase in water demand from 19
BCM in 2010 to 33 BCM and 70 BCM in 2025 and 2050 respectively
Table 4.4: Present and future water demand
Sector
Water demand in BCM
Standing Sub-Committee of MOWR
NCIWRD
2010 2025 2050 2010 2025 2050
LEG HEG LEG HEG LEG HEG
Irrigation 688 910 1,072 543 557 561 611 628 807
Drinking Water 56 73 102 42 43 55 62 90 111
Industry 12 23 63 37 37 67 67 81 81
Energy 5 15 130 18 19 31 33 63 70
Other 52 72 80 54 54 70 70 111 111
Total 813 1,093 1,447 694 710 784 843 973 1,180
Sources: Basin Planning Directorate, CWC, XI Plan Document; Report of the Standing Sub-Committee on "Assessment of
Availability & requirement of Water for Diverse uses-2000"
Note: NCIWRD: National Commission on Integrated Water Resources Development
BCM: Billion Cubic Meters
While the two sets of projections are for different time frames (2030 in the case of WRG and 2025 and 2050 in the case of the government figures), when comparing the projections for 2025 and 2030, there are considerable differences. There are differences even between the two sets of projections by the government; the MoWR and the NCIWRD. Groundwater abstraction: India is the largest groundwater user in the world, heavily dependent
on this resource for agriculture, industry and domestic use. Projections indicate that by 2025 and
2050 we will have dramatically increased our groundwater development and groundwater
abstraction ratio, as indicated in the maps below. Groundwater development is the ratio of primary
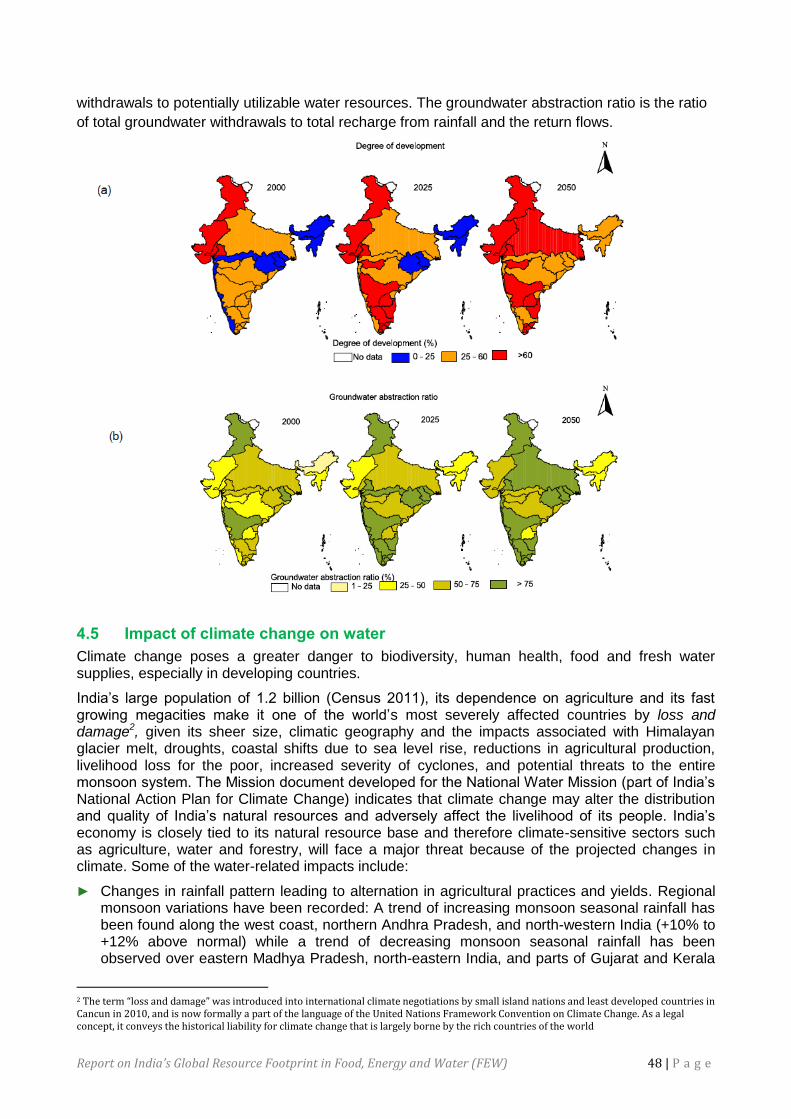
Report on India’s Global Resource Footprint in Food, Energy and Water (FEW) 48 | P a g e
withdrawals to potentially utilizable water resources. The groundwater abstraction ratio is the ratio
of total groundwater withdrawals to total recharge from rainfall and the return flows.
4.5 Impact of climate change on water
Climate change poses a greater danger to biodiversity, human health, food and fresh water supplies, especially in developing countries.
India‘s large population of 1.2 billion (Census 2011), its dependence on agriculture and its fast growing megacities make it one of the world‘s most severely affected countries by loss and damage2, given its sheer size, climatic geography and the impacts associated with Himalayan glacier melt, droughts, coastal shifts due to sea level rise, reductions in agricultural production, livelihood loss for the poor, increased severity of cyclones, and potential threats to the entire monsoon system. The Mission document developed for the National Water Mission (part of India‘s National Action Plan for Climate Change) indicates that climate change may alter the distribution and quality of India‘s natural resources and adversely affect the livelihood of its people. India‘s economy is closely tied to its natural resource base and therefore climate-sensitive sectors such as agriculture, water and forestry, will face a major threat because of the projected changes in climate. Some of the water-related impacts include:
► Changes in rainfall pattern leading to alternation in agricultural practices and yields. Regional monsoon variations have been recorded: A trend of increasing monsoon seasonal rainfall has been found along the west coast, northern Andhra Pradesh, and north-western India (+10% to +12% above normal) while a trend of decreasing monsoon seasonal rainfall has been observed over eastern Madhya Pradesh, north-eastern India, and parts of Gujarat and Kerala
2 The term “loss and damage” was introduced into international climate negotiations by small island nations and least developed countries in Cancun in 2010, and is now formally a part of the language of the United Nations Framework Convention on Climate Change. As a legal concept, it conveys the historical liability for climate change that is largely borne by the rich countries of the world
Report on India’s Global Resource Footprint in Food, Energy and Water (FEW) 49 | P a g e
(-6% to -8% below normal). Small changes in temperature and rainfall have significant effects on the quality of fruits, vegetables, tea, coffee, aromatic and medicinal plants, and basmati rice. Other impacts include lower yields from dairy cattle and decline in fish breeding, migration, and harvests. Global reports indicate a loss of 10-40% in crop production by 2100.
► Rise in sea level leading to salt water mixing with the groundwater, turning freshwater sources saline, reducing fresh water availability and agriculture .
► Accelerated Himalayan glaciers melting leading to increased river flows and runoff till 21oo. Due to these melting glaciers the increased water availability from the mountains may help to sustain the growing demand of food for the increasing population.
► Increase extreme events such as cyclones, drought and floods leading to recued agricultural production.
► Climate changes will affect nearly 70 per cent of the Indian population, which relies on agriculture. With agriculture being affected, rural urban migration is set to increase.
India is among the ‗extreme risk countries where economic impacts of climate change will be most keenly felt by 2025. Kolkata and Mumbai are among the cities where the economic exposure to the impacts of extreme climate related events will be highest over the next 30 years.
A large portion of the impact is thus going to be related to water: shortage and excess, quality, timely availability, its quality, water related disasters with their connected impact on socioeconomic development and health and its impact on food production. Coupled with increasing demand fed by population growth and developmental aspirations, industrialisation, human rights to dignified survival and human development, climate change may throw in a spanner into developmental plans.
4.6 Business opportunities in water sector
Kotak Institutional Equities has forecasted an estimated annual business potential of US$30 till 2015 (for water components and equipment). According to an Ernst and Young report, the Indian water sector can create an investment potential of US$130 billion by 2030. Business opportunities
revolve around fourkey themes - water demand management, water supply management, water
infrastructure upgradation, and water utilities management. However, these need to be reviewed, given that these have been compiled largely by business groups with little participation from the government or utility managers.
According to the Consolidated FDI policy announced by the Government of India, effective from April 2010, 100% FDI is allowed in the water sector: under the automatic route in the construction and maintenance of roads, rail-beds, bridges, tunnels, pipelines, ropeways, runways, waterways & water reservoirs, hydroelectric projects, power plants and industrial plants, construction and maintenance of rural drinking water supply projects, packaged water treatment plants, rain and rain water harvesting structures, waste water recycling and re-use techniques and facilities, rain-water re-charging and re-use techniques of ground water.
4.7 Way forward
While demands for water show an increasing trend, the supply is going to be erratic. This calls for a paradigm shift in understanding water, valuing its socioeconomic, food and industrial contributions and environment services and arriving at equitable and sustainable solutions on its conservation and management (see box: Initiatives proposed in the 12th Five Year Plan). The National Water Policy 2012 lays emphasis on treating water as
Initiatives proposed in the 12th Five Year Plan
The 12th Five Year Plan proposes fundamental change in the principles, approach and water management. The elements include (a) Large irrigation reform (b) Participatory aquifer management (c) Breaking the groundwater nexus (d) Watershed restoration and groundwater recharge (e) A new approach to rural drinking water and sanitation (f) Conjoint water and wastewater management in urban India (g) Industrial water management (h) Renewed focus on non-structural mechanisms for flood management (i) water database development and management (j) New institutional and legal framework. A new groundwater law and a national water framework law is proposed.
Report on India’s Global Resource Footprint in Food, Energy and Water (FEW) 50 | P a g e
an economic good, informs on principles of equity and justice and stresses on the need for conservation, bringing in efficiency and reuse. Some of the areas that can be addressed to minimize the water footprint at different levels to ensure local and at scale water security include:
1. Legal interventions a) Development of a water framework law under the 12th Five Year Plan b) Respecting the law of the land, for example the Water Pollution laws c) The Mahatma Gandhi National Rural Employment Guarantee Act, that guarantees a minimum
of 100 days wages to one member of the family. MGNREGA is recognised as an ecological Act that aims to create sustainable livelihoods through regeneration of the natural resource base of rural India, and providing resilience and adaptation to climate change and the vagaries of nature. Since provision of water for agriculture is vital for ensuring food and water security in rural India, MGNREGA is a very important programme as far as drought proofing is concerned. Research suggests that water-related assets created under MGNREGA have increased the number of days in a year water is available and also the quantity of water available for irrigation. A study in the Sidhi, Betul, Jhabua, Shivpuri and Rajgarh districts of Madhya Pradesh noted that 70 per cent of the irrigation structures under Kapildhara scheme ensured perennial water across agricultural seasons for beneficiaries. In the districts of Ujjain and Dhar, the irrigated land area increased by 26 per cent and 19 per cent respectively. In Chhindwara and Panna, the increase in irrigated area was even 35 and 30 per cent respectively, due to MGNREGA works. The list of expected environmental benefits and the water conservation implemented under MGNREGA are given in Annexures 3 and 4.
2. Policy interventions Some of the policy interventions includes the setting up of mandatory (a) Rainwater harvesting structures in cities and institutional buildings, (b) Recycling of water in institutional buildings and (c) The promotion of green building concepts and GRIHA ratings (d) Involving communities and other stakeholders for collective demand side management, through the development of village water security plans as per the National Rural Drinking Water Supply Guidelines of the MDWS.
3. Financial Allocations for rainwater harvesting systems through special funds and programmes such as those for watershed development, MGNREGA and desert area development and for promotion of MI.
4. Development of Standard Operation Procedures (SOP) for drinking water and sanitation The Ministry of Drinking Water and Sanitation developed an SOP manual for providing drinking water and sanitation during water-related disasters such as drought and floods, further details of which are given in Annexure 5.
5. Efficiency in use and technological options: In agriculture, water use efficiency is currently estimated to be only 38 to 40 percent for canal irrigation and about 60 percent for ground water irrigation schemes. Improving water use efficiency by 40 percent on rain fed and irrigated lands would be required to counter-balance the need for additional withdrawals for irrigation over the next 25 years to meet additional food demand. Strategies for increasing water use efficiency include the following: (i) Micro irrigation (MI): Area under MI is currently 3870000 hectares. Given the high costs involved, states such as AP and Karnataka have developed schemes for promotion of MI, along with the manufacturers, while several stats have developed subsidy schemes. The states adopting MI and the subsidy schemes are given in Annexures 6 and 7 respectively. (ii) SRI: This system of cultivation is being used in 246/564 districts. A study by ICARISAT across 25 locations reveals that productivity increased between 7-29 per cent and water demand dropped by 29 per cent. (iii) Increasing the efficiency of pumps to withdraw water: The USAID-supported VENEXA project in Karnataka. (iv) Estimating soil moisture for effective irrigation: The tensiometer (tool used to measure soil moisture) project in Punjab, supported by Colombia Water Centre. 6. Community efforts Conservation of the primary source of water, rain and using it directly or for recharge and revival of parched aquifers and surface water bodies and revival. The infiltration and subsurface storage of
Report on India’s Global Resource Footprint in Food, Energy and Water (FEW) 51 | P a g e
rain and river water can reduce water stress. Artificial groundwater recharge and the use of subsurface dams and artificial aquifers is specially advantageous in areas where layers of gravel and sand exist below the earth‘s surface. Some of the ecoregion-specific options of rainwater conservation are given in Annexure 8. Other examples include (i) The groundwater management by farmers under the Andhra Pradesh Farmers‘ Managed Groundwater System programme in drought-affected districts of the state (Annexure 9); (ii) Raj Samadhiyala, Gujarat (Annexure 10) (iii) Hirve Bazaar, Maharashtra (Annexure 11) (iv) Laporiya, Rajasthan (Annexure 12) (v) Bhungroo: the women led capturing of rainwater and its extraction post monsoon for agriculture and drinking water in Gujarat. Using the same concept for addressing water logging (vi) Rooftop rainwater harvesting in Mizoram (vii) Capturing spring water in hilly areas in Andhra Pradesh and Odisha (viii) Construction of subsurface dykes to capture water in water poor areas, Gujarat (ix) Protecting surface water bodies or ooranis in Tamil Nadu (x) Reduction in water usage for power generation by Tata Steel by improving technology (xi) Wastewater reuse for gardening purposes at household level.
7. Options for LICs: While India has not been a model on how to manage and share water, there are islands of success that can be evaluated, contextualized and adopted in LICs.
Stretching water availability includes demand management, efficient supply management, recharging, development of environmentally and socially acceptable storage spaces at micro and macro levels, efficient technologies, and recycling. Based on the existing ecology and geography in the country, most of the above the community efforts can be tested in the LICs. Coupled with an enabling legal and financial environments, efforts to conserve reduce, recycle and store water as indicated above will enable the ‗stretching‘ of the available water resources.
Report on India’s Global Resource Footprint in Food, Energy and Water (FEW) 52 | P a g e
References
I. FOOD
1. SOIA- State of Indian Agriculture. 2. The Indian feed industry-FAO report. 3. Nutrition Foundation of India ―food consumption Patterns in India‖ 4. Inequalities in India-survey of trends un.org 5. Nutrition foundation of India ―food consumption patterns in India‖ 6. The quarterly journal.‖ Accessing the middle class‖ McKinney research 7. The impact of globalization on food consumption in India-FAO report 8. Malnutrition in India-Wikipedia 9. Mid-Day Meal Scheme In India-Wikipedia 10. PDS Portal of India 11. Will India‘s National Food Security Bill –Help or Hurt-IFPRI 12. Under water..India‘s resource nexus-priorities for action wall street journal. 13. Monsoon 2013-Estimating The Impact On Agriculture 14. Agriculture And Mal Nutrition in India 15. http://books.google.co.in/books?id=QRIGTgd9r7cC&pg=PA15&lpg=PA15&dq=milk+r
equirements+by+2025+and+2050+in+india&source=bl&ots=7nd6edfS5_&sig=MkiApX6U1dwpPMi63MOWM-w43aM&hl=en&sa=X&ei=D_3XUuzsD8umrQevsIHwBA&ved=0CGoQ6AEwCA#v=onepage&q=milk%20requirements%20by%202025%20and%202050%20in%20india&f=false
16. www.researchersworld.com/vo14/vo14_issue_2/paper_12.pdf 17. India‘s Overall Agriculture Policy-GOI 18. African Agriculture In 50years 19. African Study Centre –University Of Pennyslavia 20. How to feed the world in 2050-fao high level meeting 2011.-FAO.OPRG
Web links
http://www.slideshare.net/IBEFIndia/agriculture-august-2013-26566398
http://www.slideshare.net/AgriGouravvani/food-security-in-india-myths-and-realitiesedited
http://www.slideshare.net/IBEFIndia/food-processeing-august-2013
http://www.slideshare.net/IBEFIndia/financial-services-august-2013
http://www.slideshare.net/PlanComIndia/strategies-for-agriculture-in-the-12th-plan-2012-2017.
http://www.slideshare.net/joysengupta22/sustainibilie-development-in-agriculture-sector-in-india
http://www.slideshare.net/Indian-CAG/stupendousfive
http://www.slideshare.net/vishishtchaudary/population-of-india2011
Report on India’s Global Resource Footprint in Food, Energy and Water (FEW) 53 | P a g e
II. ENERGY
1. IEC 2013 Securing tomorrow‘s energy today: Policy & Regulations, Long Term Energy Security; February 2013
2. Energy Statistics 2013, Central Statistical Office, National Statistical Organization, Ministry of Statistics and Programme Implementation (www.mospi.gov.in)
3. IEA: Understanding Energy Challenges in India 4. IEC 2013: Securing tomorrow‘s energy today: Policy & regulations, February 2013 5. MNRE /annual Report 2012 6. World Nuclear Association 2013 7. P. Garg, 2012, ―Energy Scenario and Vision 2020 in India‖. Journal of Sustainable
Energy & Environment 8. Grant making strategy for TPW: Energy Collaborative in India, 2009 9. IEA: Understanding Energy Challenges in India 10. World Nuclear Association 2013 11. India‘s CO2 emissions pathways to 2050, AVOID: Avoiding dangerous climate funded
by the UK Government Department of Energy and Climate Change (DECC) and Department for Environment, Food and Rural Affairs (DEFRA) (www.avoid.uk.net)
12. Grant making strategy for TPW: Energy Collaborative in India, 2009 13. Concession models for rural electrification in India, KfW India 14. Post-2015 Thematic Consultation on Energy: Energy Access, World Bank 15. Energy, Poverty, and Development: 16. World Development Indicators (WDI), 2012 17. IEA: Technology Development Prospects for the Indian Power Sector, OECD/IEA,
2011 18. World Energy Outlook (WEO) 2011 19. Energy Statistics 2013, Central Statistical Office, National Statistical Organization,
Ministry of Statistics and Programme Implementation (www.mospi.gov.in) 20. World Nuclear Association 2012 21. BP Statistical Review of World Energy June 2013 22. India‘s CO2 emissions pathways to 2050, AVOID: Avoiding dangerous climate 23. IEC 2013: Securing tomorrow‘s energy today: Policy & regulations, February 2013 24. Scoping Study on Access to Energy, The British High Commission, New Delhi 25. IEA, World Energy Outlook 2010 26. Effects of climate change on energy production and use in the United States, U.S.
Climate Change Science Program, Synthesis and Assessment Product 4.5, February 2008
27. The Potential Impact of Climate Change on the Energy Sector in the Caribbean Region; Contreras-Lisperguer, R. and de Cuba, K; Sustainable Energy and Climate Change Division, Department of Sustainable Development, Organization of American States, September 2008
28. 2011 Foresight report The Future of Food and Farming: Challenges and Choices for Global Sustainability
29. Crooks, E. and Wallis, W. (2007). ―Africa aid wiped out by rising cost of oil‖, Financial Times, 29 December 2007
30. Key World Energy Statistics, OECD/IEA, Paris 31. www.theoildrum.com 32. World Development Indicators, 2012 33. Holden, J. (2012) Global Energy Markets: What do African resource finds mean for
global energy supply in relation to demand in coming years? Economic and Private Sector Professional Knowledge and Applied Knowledge Services.
34. te Velde, D. (2011) ‗Oil prices, poor countries and policy responses‘, blog ODI, 16 March 2011
35. Oil and gas in Africa: A Joint study by the African Development Bank and African Union (2009)
Report on India’s Global Resource Footprint in Food, Energy and Water (FEW) 54 | P a g e
36. Key World Energy Statistics, 2012 IEA (http://www.iea.org/publication/freepublications/publications/kwes.pdf
37. U.S. Energy Information Administration, International Energy Statistics 38. te Velde. D (2011) ―Oil prices poor countries and policy responses‖ blog, ODI, 16
March 2011 (http://blogs.odi.org.uk/blogs/main/archive/2011/03/16/oil prices poor countries Africa shocks volnerabilities.aspx)
39. Bloomberg, February 10, 2014 40. The future climate for development- scenarios for low income countries in a climate
changing world 41. NEPAD/AU, (2012) Programme for Infrastructure Development in Africa:
Interconnecting, integrating, and transforming the continent, NEPAD/ AU/ AfDB (http://www.afdb.org/fileadmin/uploads/afdb/Documents/Project-andOperations)
III. WATER
1. Water sector in India: Emerging investment opportunities, Ernst and Young, 2011 2. Mid Term Appraisal of XI Five Year Plan, 2010, Planning Commission, Government
of India, 2010 3. Report on the Task Force on Micro Irrigation, 2004, Department of Agriculture and
Cooperation, Government of India 4. Working Group Report - Water Resources, Planning Commission, Government of
India , 2012 5. Kumar Rakesh, Singh R.D, Sharma K.D, Water resources of India; Current Science,
Vol. 89, No. 5, 2005 6. Charting Our Water Future, Water Resource Group, 2005 7. Phansalkar Sanjiv and Verma Shilp; India's Water Future 2050: Potential 7.
Deviations from Business as Usual, International Journal of Rural Management 3: 149, 2007
8. 2012, Managing Water Under Risk and Uncertainity, the UN World Water Development Report, 4 , 2012
9. Report of the Working Group on Rural Drinking water and Sanitation, Planning Commission, 2012
10. Agriculture and food systems for a sustainable future: An integrated approach, IIED Briefing, 2013
11. India's Initial National Communication, (NATCOM I) to UN Framework, 2004 12. Arpita Bhattacharyya and Michael Werz, Climate change, migration and conflict in
South Asia Rising Tensions and Policy Options across the Subcontinent, 2012 13. Immerzeil W.W., Pelliciotti, F and MFP Bierkis, Rising river flows throughout the 21st
century in two Himalayan glacierised watersheds 14. India‘s water economy report: Bracing for a turbulent future, the World Bank, 2006 15. Report of the post 2015 Water thematic Consultations, United nations Development
Group, 2013 16. Perveen, S. et al. 2012. Virtual water trade: Revisiting the
assessments to incorporate regional water stress. Columbia Water Center white paper
17. Mission Document, National Water Mission, (2009) Ministry of Water Resources. 18. Mukherji Aditi, Shah Tushaar and Giordano Mark (2012) Managing Energy-irrigation
Nexus in India: A Typology of State Interventions, Water Policy Research, IWMI Tata Water Policy Programme
19. Verma S., et el., 2009. Going against the flow: A critical analysis of inter-state virtual water trade in the context of India‘s Natiojal River Linking Progamme, Physics and Chemistry of the Earth, 34: 261-269
20. Bhujal News, Vol 25, No 1&2, Jan-June 2010
Report on India’s Global Resource Footprint in Food, Energy and Water (FEW) 55 | P a g e
Weblinks
http://www.eastasiaforum.org/2013/04/05/indias-population-in-2050-extreme-projections-demand-extreme-action/, accessed on Dec 29, 2013
http://www.unwater.org/wwd2014.html, accessed on Dec 27, 2013 http://www.ipcc.ch/publications_and_data/ar4/wg2/en/ch10s10-6-2.html, accessed on
Dec 10, 2013
http://www.thehindu.com/news/national/other-states/heavy-rain-damages-4-million-ha-crop-in-vidarbha/article3872068.ece, accessed on Jan 2 , 2014
http://agrariancrisis.in/2012/09/02/suicides-by-farmers-reply-to-rajyasabha-by-sharad-pawar/, accessed on Jan 2, 2014
http://news.bbc.co.uk/2/hi/south_asia/2956490.stm
http://www.waterfootprint.org/?page=files/productgallery, accessed on Dec 12, 2013 http://www.thehindu.com/news/national/other-states/heavy-rain-damages-4-million-ha-
crop-in-vidarbha/article3872068.ece; accessed on Jan 2 , 2014 http://articles.economictimes.indiatimes.com/2013-10-30/news/43528535_1_climate-
change-maplecroft-output) http://www.thehindu.com/opinion/columns/sainath/census-findings-point-to-decade-of-
rural-distress/article2484996.ece
http://articles.economictimes.indiatimes.com/2013-10-30/news/43528535_1_climate-
change-maplecroft-output, accessed on Jan 3, 2013
http://www.thehindu.com/opinion/columns/sainath/census-findings-point-to-decade-of-
rural-distress/article2484996.ece); accessed on Jan 3, 2013
www.Indiasanitatioportal.org
http://www.unwater.org/wwd2014.html
http://maplecroft.com/portfolio/new-analysis/2013/10/30/31-global-economic-output-
forecast-face-high-or-extreme-climate-change-risks-2025-maplecroft-risk-atlas/,
accessed on Jan 2, 2013
http://www.cedar consulting.com/pdf/Cedar_USIBC_%20Report.pdf, accessed on Dec
14, 2013
http://www.waterfootprint.org/?page=files/India, accessed on Jan 18, 2014
Water crisis deepens India's rural-urban rift, (2006) Alex Kuffner - w.sa-dhan.net/Adls/Microfinance/.../LME/WatercrisisdeepensIndia.doc - last accessed on Jan 20, 2013