indian fertilizer industry-phpapp01
TRANSCRIPT
FERTILISER INDUSTRY OF
INDIA - 2000-2008
outline
Introduction
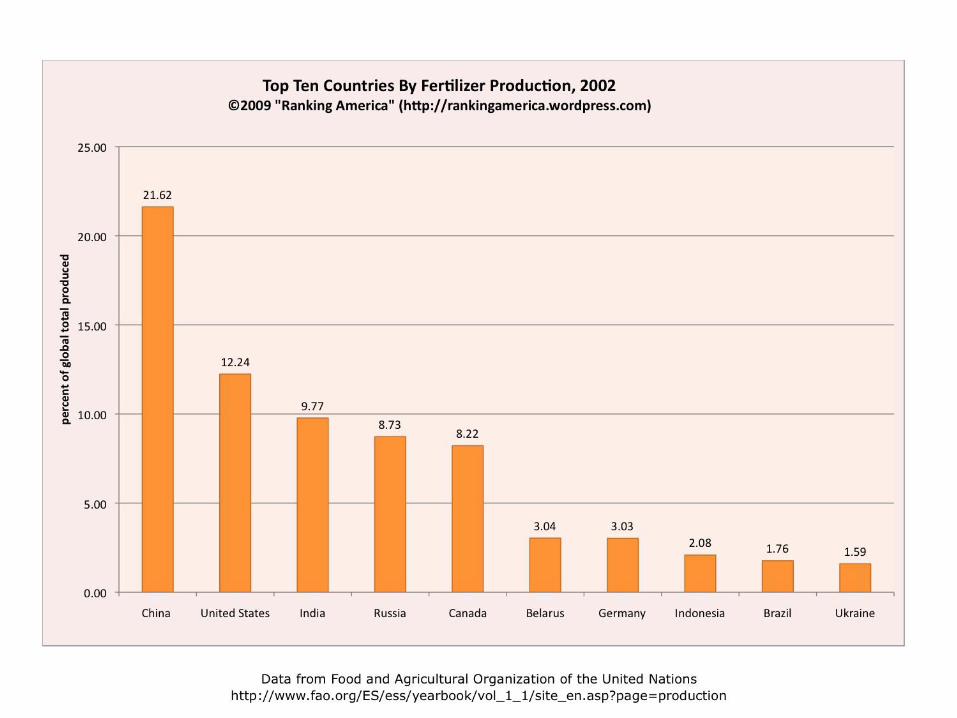
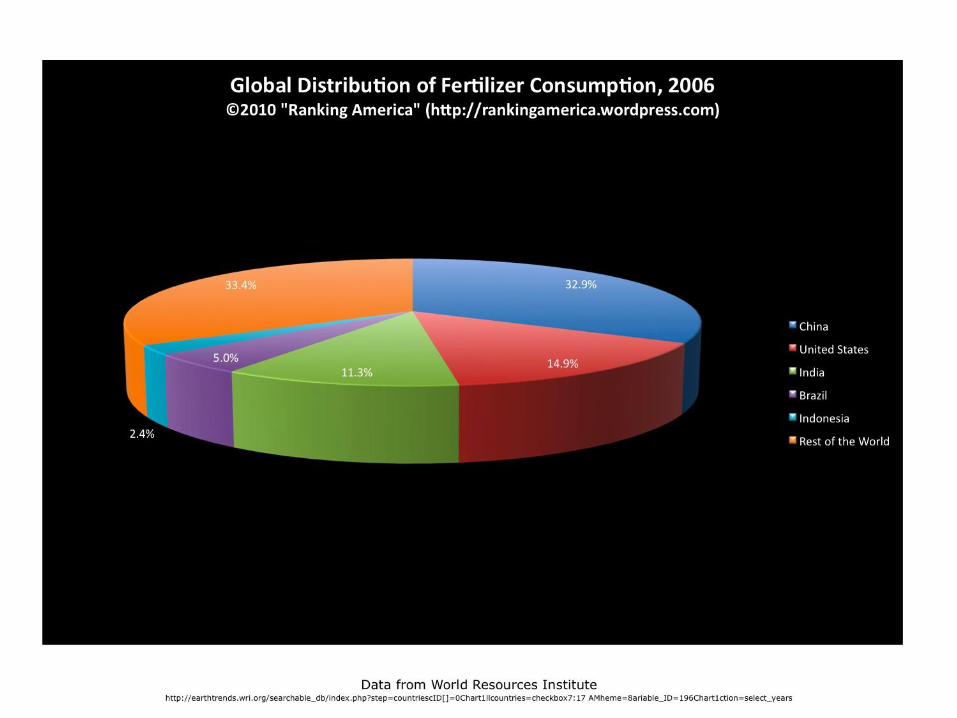
Global production and consumption of fertilizers
Indian fertilizer industry
Indian production ,consumption & import trend.
Major companies
Policies (subsidies & regulations)
Strategies for industry expansion
INTRODUCTION India is the third largest producer and consumer of
fertilizer in the world.
Indian fertilizer industry started in 1906 with SSP production facility at Ranipet near Chennai
Started operating in a big scale since 1940s, when the Fertilizer & Chemicals Travancore of India Ltd. and the Fertilizers Corporation of India were set up in Kerala and Bihar
The private sector produced 44.73 % of nitrogenous fertilizers and 62.08 % of phosphatic fertilizers in 2006-07.
Total production of fertilizers in india-206.5mt .
Contd….
The production of urea in India has reached near self-sufficiency. The requirement of the nitrogenous fertilizers is met through the indigenous industry
In the case of phosphate fertilizers, the raw materials and intermediates are imported in large scale.
The requirement of potash (K) is met entirely through imports. No fertilizer unit of India has any reserve of potash.
Global production &
consumption of fertilizers
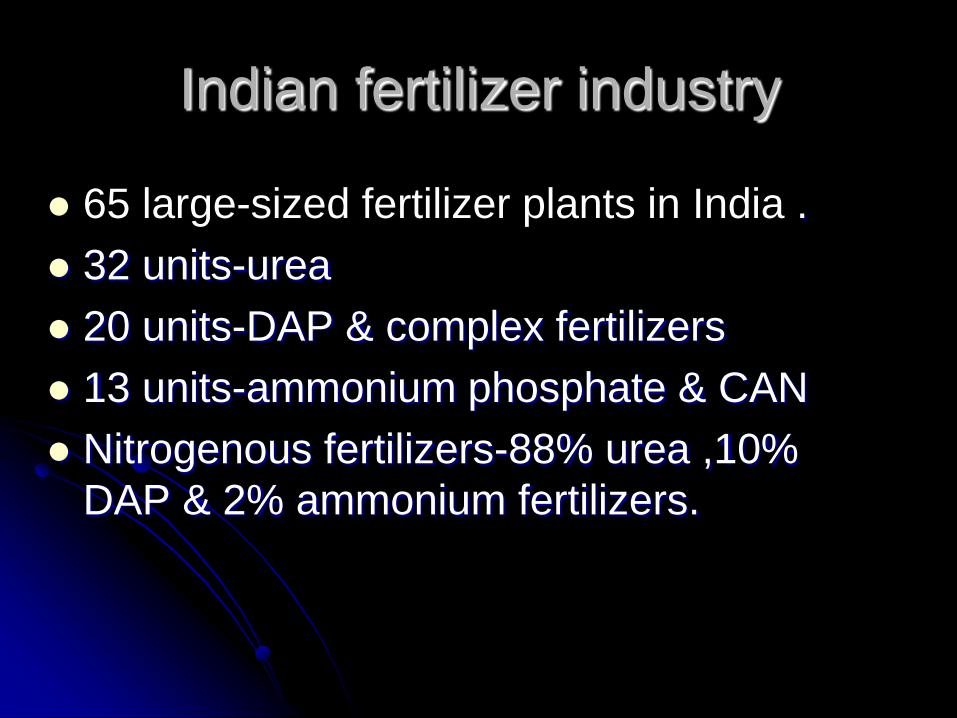
Indian fertilizer industry
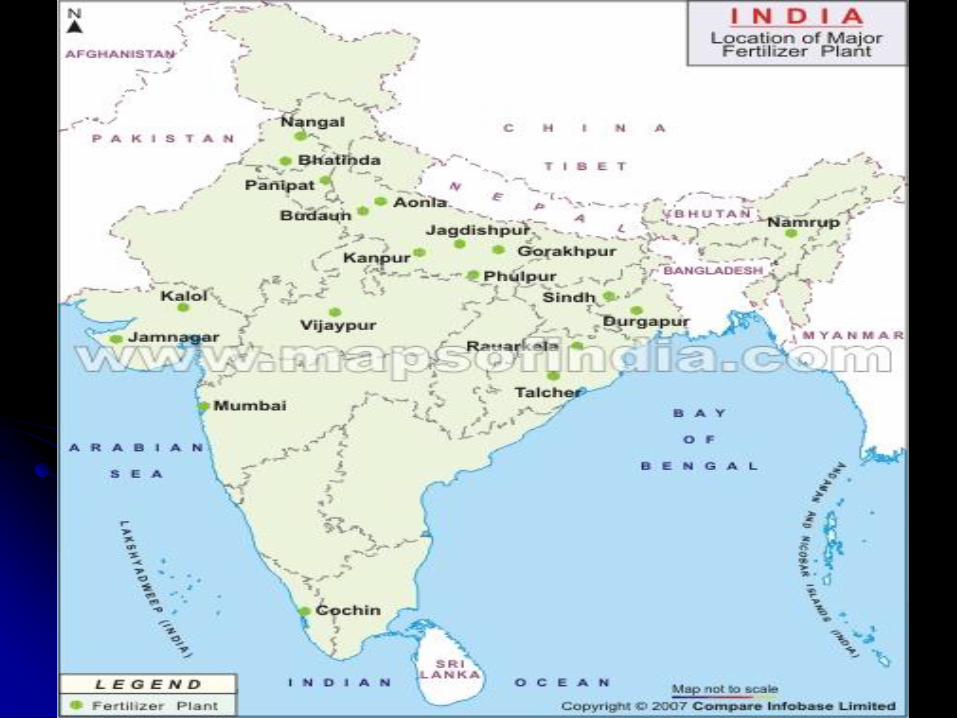
65 large-sized fertilizer plants in India .
32 units-urea
20 units-DAP & complex fertilizers
13 units-ammonium phosphate & CAN
Nitrogenous fertilizers-88% urea ,10%
DAP & 2% ammonium fertilizers.
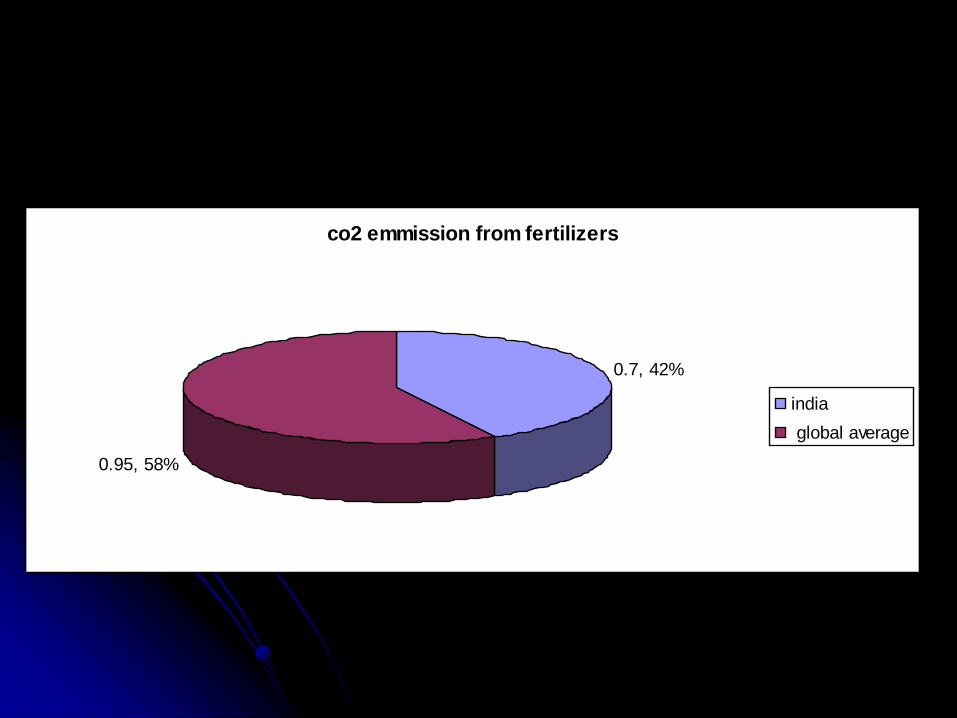
co2 emmission from fertilizers
0.7, 42%
0.95, 58%
india
global average
Indian production,
consumption & import
trend
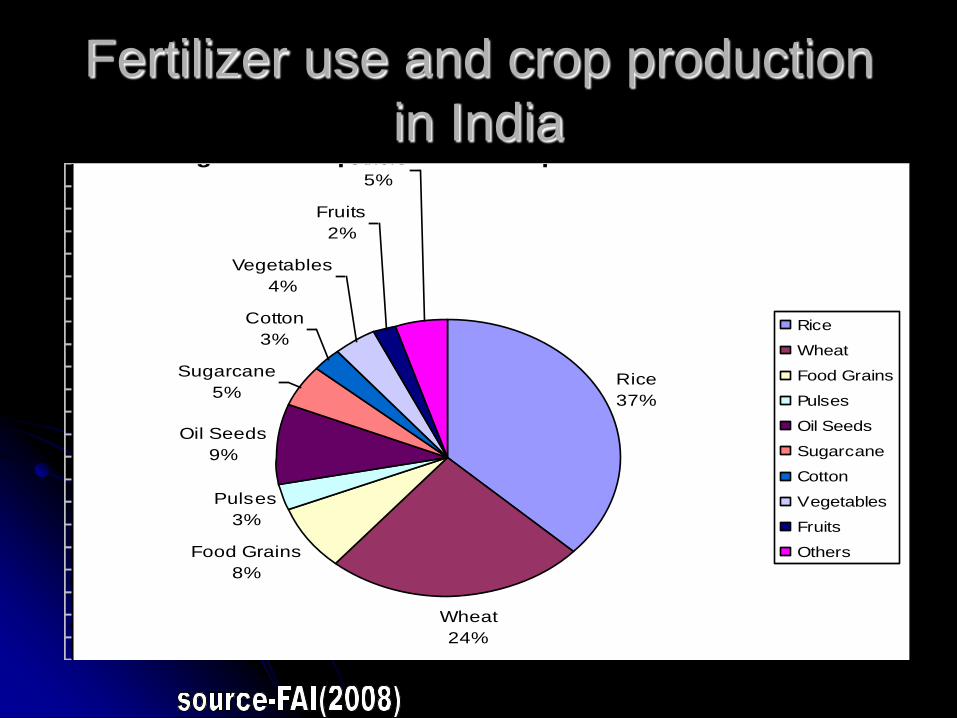
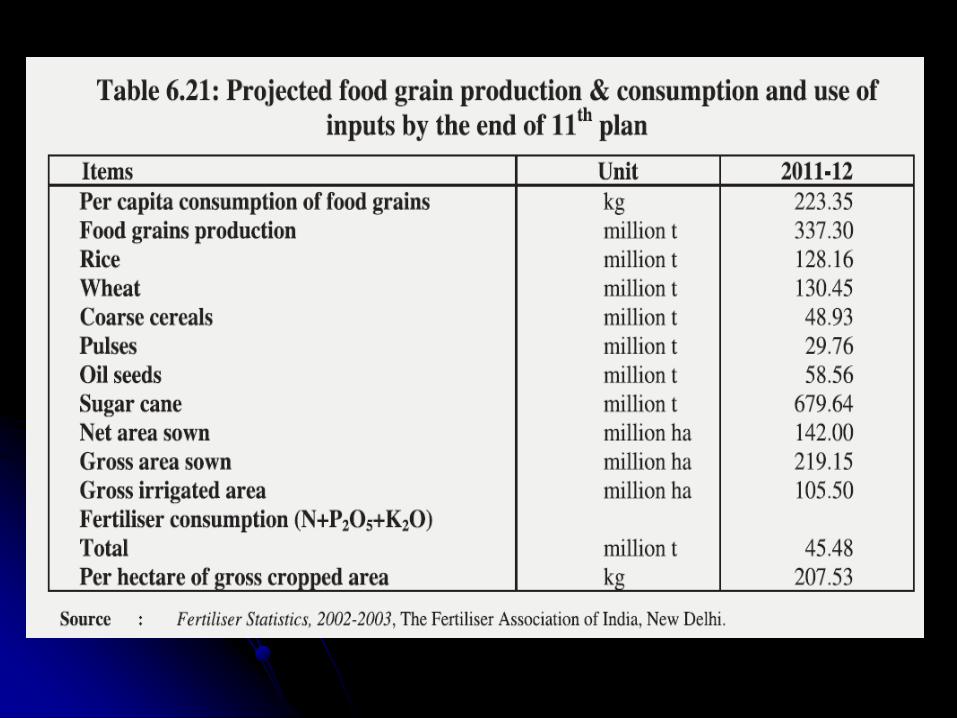
Fertilizer use and crop production
in India
24%
8%
3%
9%
5%
3%
4%
2.00%
5%
Rice 37%
Wheat 24%
Food Grains 8%
Pulses 3%
Oil Seeds 9%
Sugarcane 5%
Cotton 3%
Vegetables 4%
Figure 2: Crops wise consumption of Fertilizer in India
Rice
37%
Wheat
24%
Food Grains
8%
Pulses
3%
Oil Seeds
9%
Sugarcane
5%
Cotton
3%
Vegetables
4%
Fruits
2%
Others
5%
Rice
Wheat
Food Grains
Pulses
Oil Seeds
Sugarcane
Cotton
Vegetables
Fruits
Others
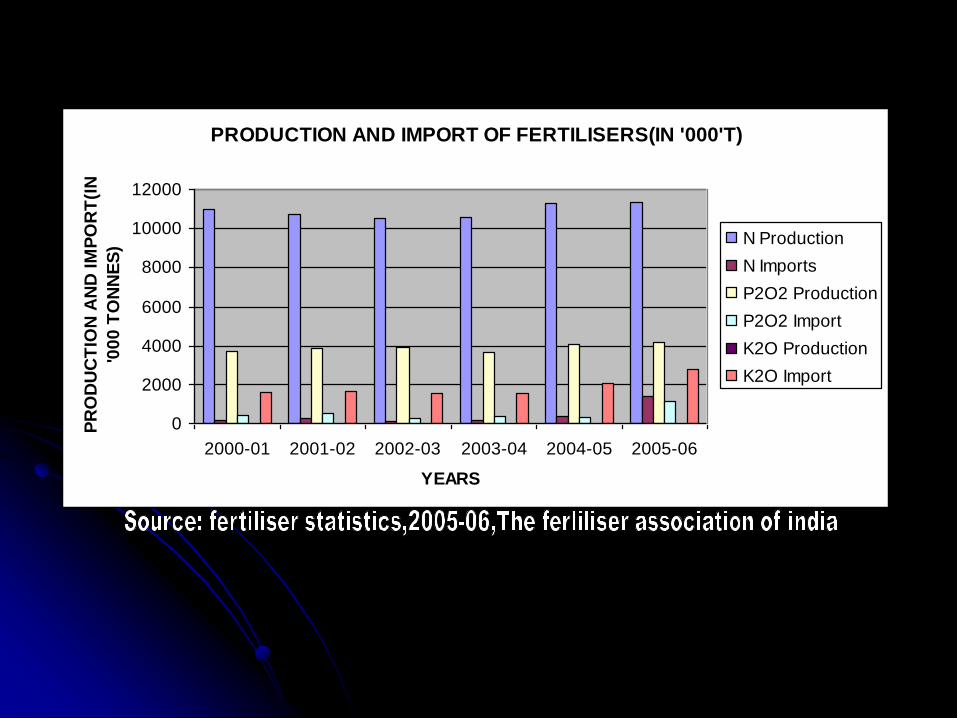
PRODUCTION AND IMPORT OF FERTILISERS(IN '000'T)
0
2000
4000
6000
8000
10000
12000
2000-01 2001-02 2002-03 2003-04 2004-05 2005-06
YEARS
PR
OD
UC
TIO
N A
ND
IM
PO
RT
(IN
'00
0 T
ON
NE
S) N Production
N Imports
P2O2 Production
P2O2 Import
K2O Production
K2O Import
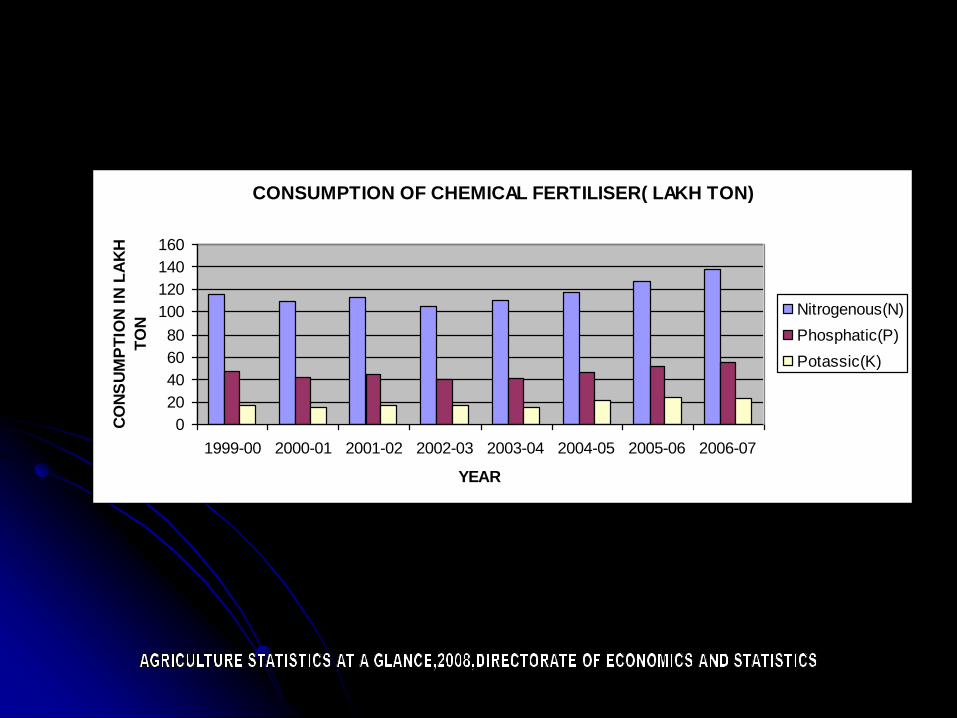
CONSUMPTION OF CHEMICAL FERTILISER( LAKH TON)
0
20
40
60
80
100
120
140
160
1999-00 2000-01 2001-02 2002-03 2003-04 2004-05 2005-06 2006-07
YEAR
CO
NS
UM
PT
ION
IN
LA
KH
TO
N
Nitrogenous(N)
Phosphatic(P)
Potassic(K)
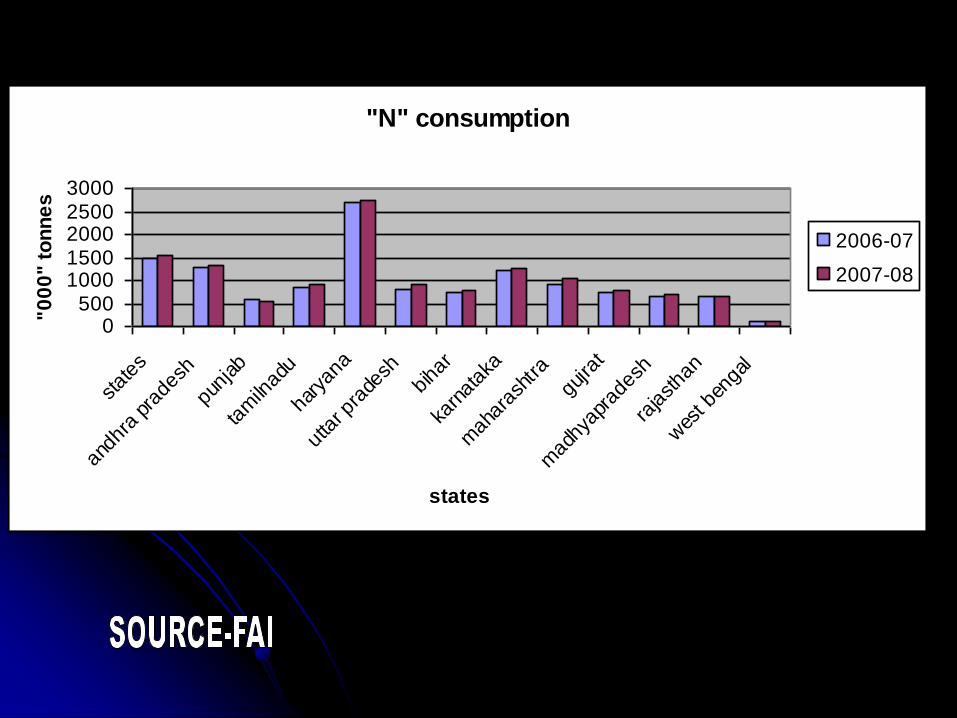
"N" consumption
0500
10001500200025003000
stat
es
andh
ra p
rade
sh
punj
ab
tam
ilnad
u
hary
ana
utta
r pra
desh
biha
r
karn
atak
a
mah
aras
htra
gujra
t
mad
hyap
rade
sh
rajastha
n
wes
t ben
gal
states
"0
00
" t
on
ne
s
2006-07
2007-08
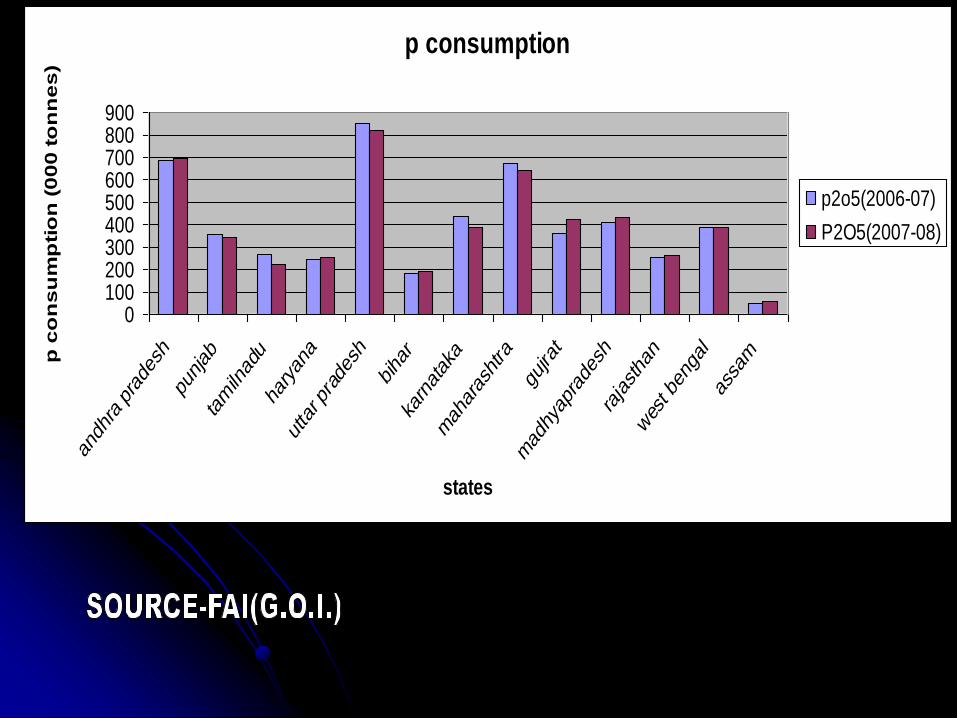
p consumption
0100200300400500600700800900
andh
ra prade
sh
punjab
tamiln
adu
haryan
a
uttar p
rade
sh
biha
r
karnatak
a
mah
aras
htra
gujra
t
mad
hyap
rade
sh
rajastha
n
wes
t ben
gal
assa
m
states
p c
on
su
mp
tio
n (
00
0 t
on
ne
s)
p2o5(2006-07)
P2O5(2007-08)
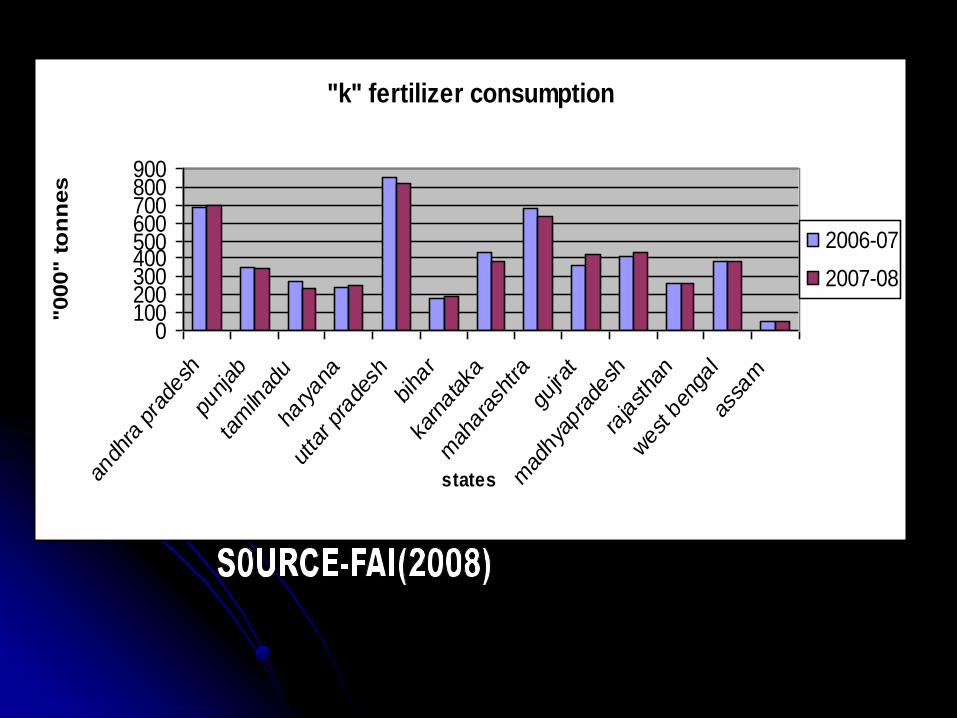
"k" fertilizer consumption
0100200300400500600700800900
andh
ra pra
desh
punjab
tam
ilnad
u
haryan
a
uttar p
rade
sh
biha
r
karn
atak
a
mah
aras
htra
gujra
t
mad
hyap
rade
sh
rajastha
n
wes
t ben
gal
assa
m
states
"000" t
on
nes
2006-07
2007-08
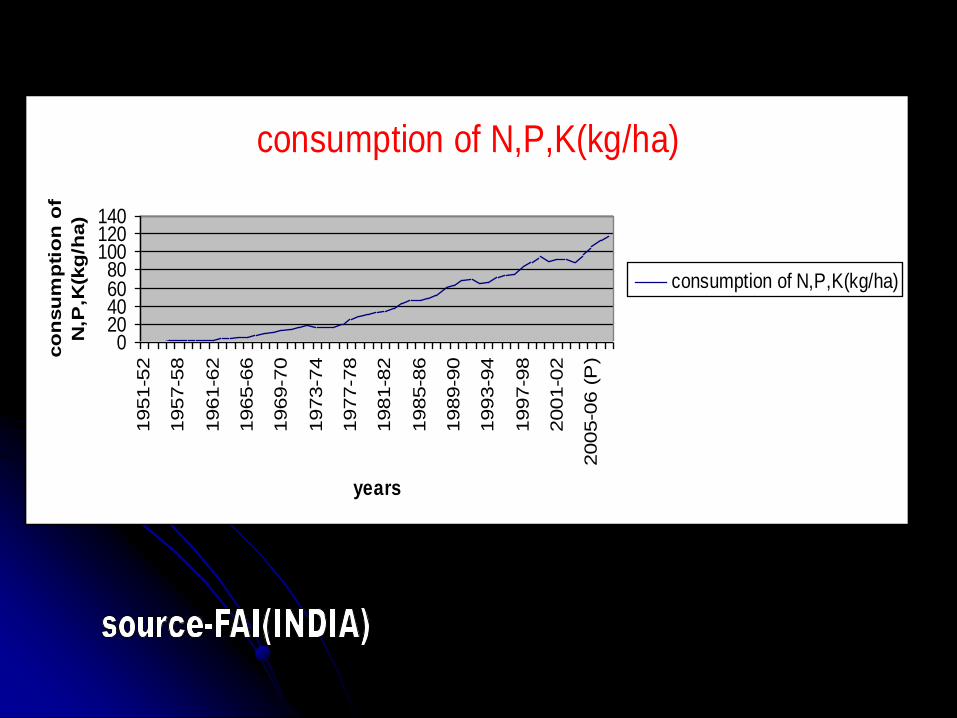
consumption of N,P,K(kg/ha)
020406080
100120140
1951-5
2
1957-5
8
1961-6
2
1965-6
6
1969-7
0
1973-7
4
1977-7
8
1981-8
2
1985-8
6
1989-9
0
1993-9
4
1997-9
8
2001-0
2
2005-0
6 (
P)
years
co
nsu
mp
tio
n o
f
N,P
,K(k
g/h
a)
consumption of N,P,K(kg/ha)
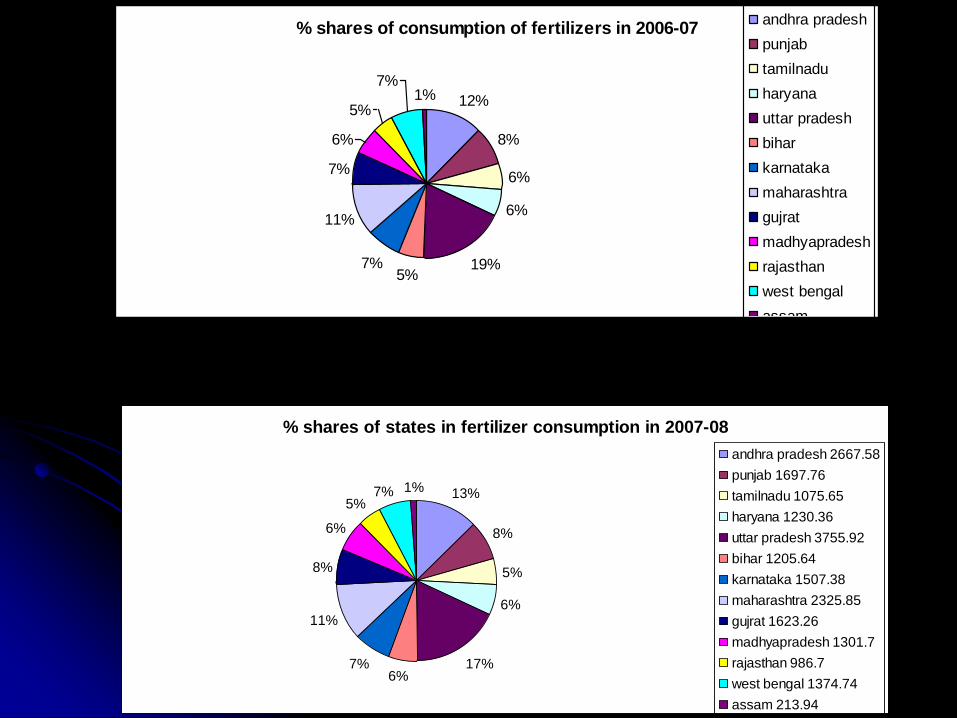
% shares of consumption of fertilizers in 2006-07
12%
8%
6%
6%
19%5%
7%
11%
7%
6%
5%
7%1%
andhra pradesh
punjab
tamilnadu
haryana
uttar pradesh
bihar
karnataka
maharashtra
gujrat
madhyapradesh
rajasthan
west bengal
assam
% shares of states in fertilizer consumption in 2007-08
13%
8%
5%
6%
17%6%
7%
11%
8%
6%
5%7% 1%
andhra pradesh 2667.58
punjab 1697.76
tamilnadu 1075.65
haryana 1230.36
uttar pradesh 3755.92
bihar 1205.64
karnataka 1507.38
maharashtra 2325.85
gujrat 1623.26
madhyapradesh 1301.7
rajasthan 986.7
west bengal 1374.74
assam 213.94
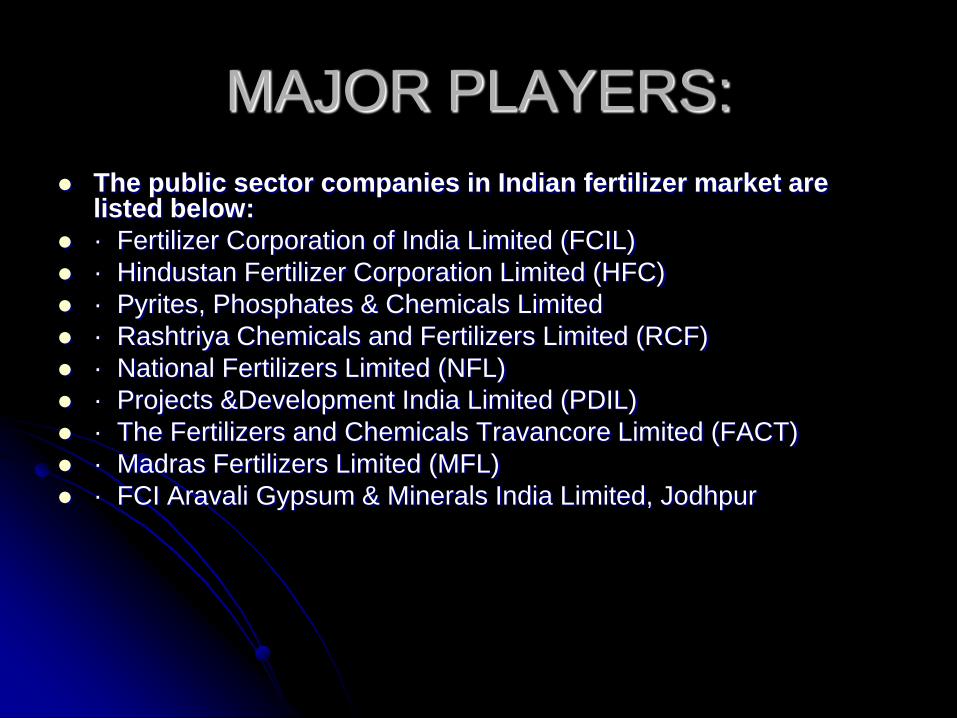
MAJOR PLAYERS:
The public sector companies in Indian fertilizer market are listed below:
· Fertilizer Corporation of India Limited (FCIL)
· Hindustan Fertilizer Corporation Limited (HFC)
· Pyrites, Phosphates & Chemicals Limited
· Rashtriya Chemicals and Fertilizers Limited (RCF)
· National Fertilizers Limited (NFL)
· Projects &Development India Limited (PDIL)
· The Fertilizers and Chemicals Travancore Limited (FACT)
· Madras Fertilizers Limited (MFL)
· FCI Aravali Gypsum & Minerals India Limited, Jodhpur
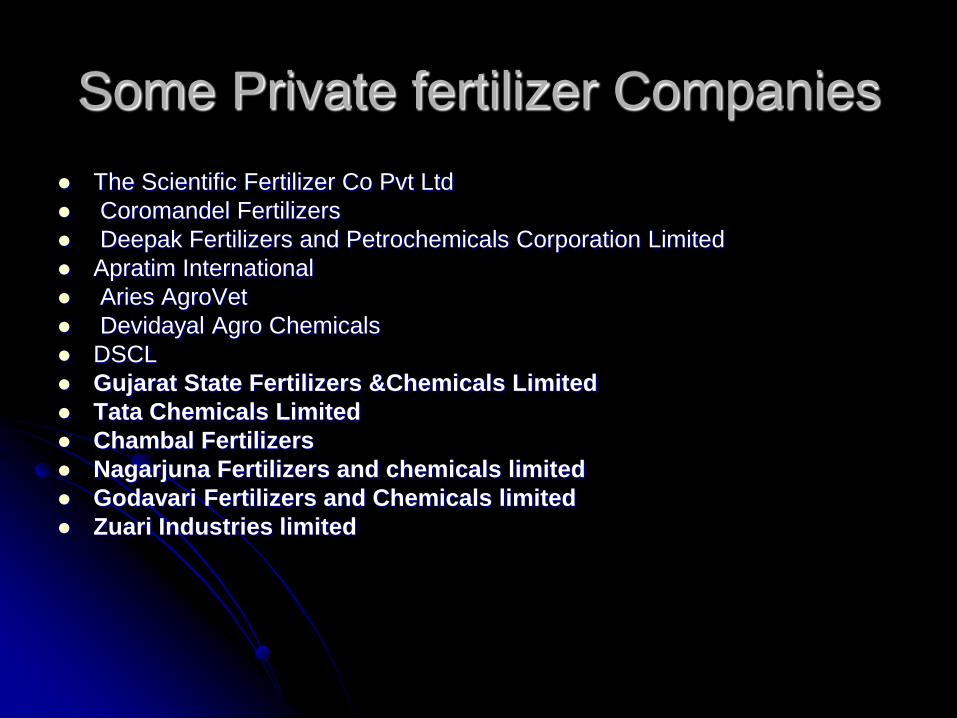
Some Private fertilizer Companies
The Scientific Fertilizer Co Pvt Ltd
Coromandel Fertilizers
Deepak Fertilizers and Petrochemicals Corporation Limited
Apratim International
Aries AgroVet
Devidayal Agro Chemicals
DSCL
Gujarat State Fertilizers &Chemicals Limited
Tata Chemicals Limited
Chambal Fertilizers
Nagarjuna Fertilizers and chemicals limited
Godavari Fertilizers and Chemicals limited
Zuari Industries limited
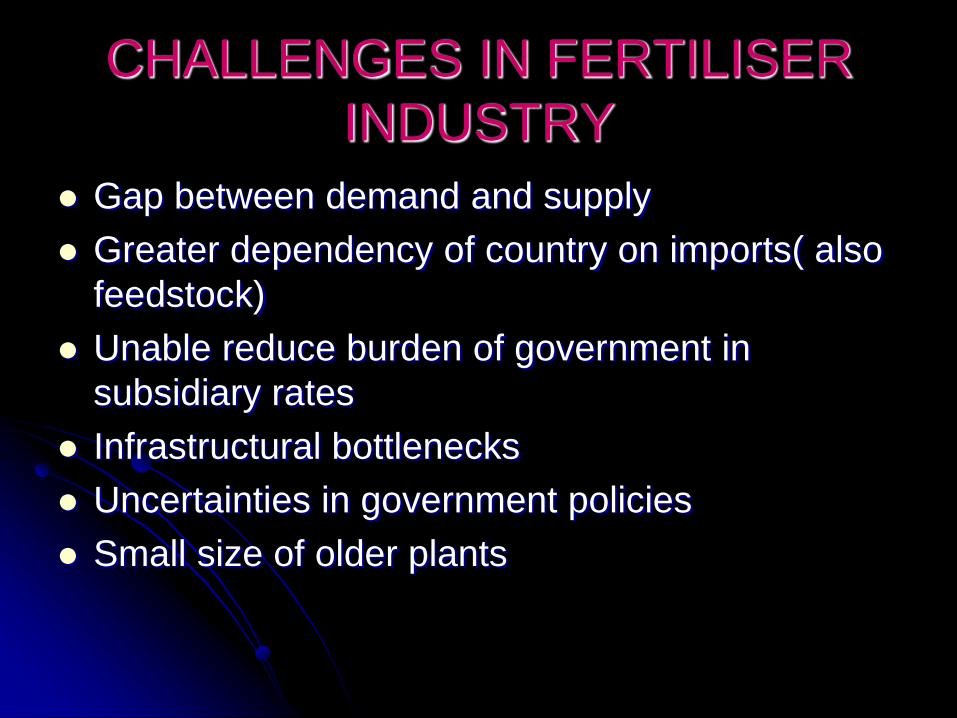
CHALLENGES IN FERTILISER
INDUSTRY
Gap between demand and supply
Greater dependency of country on imports( also
feedstock)
Unable reduce burden of government in
subsidiary rates
Infrastructural bottlenecks
Uncertainties in government policies
Small size of older plants
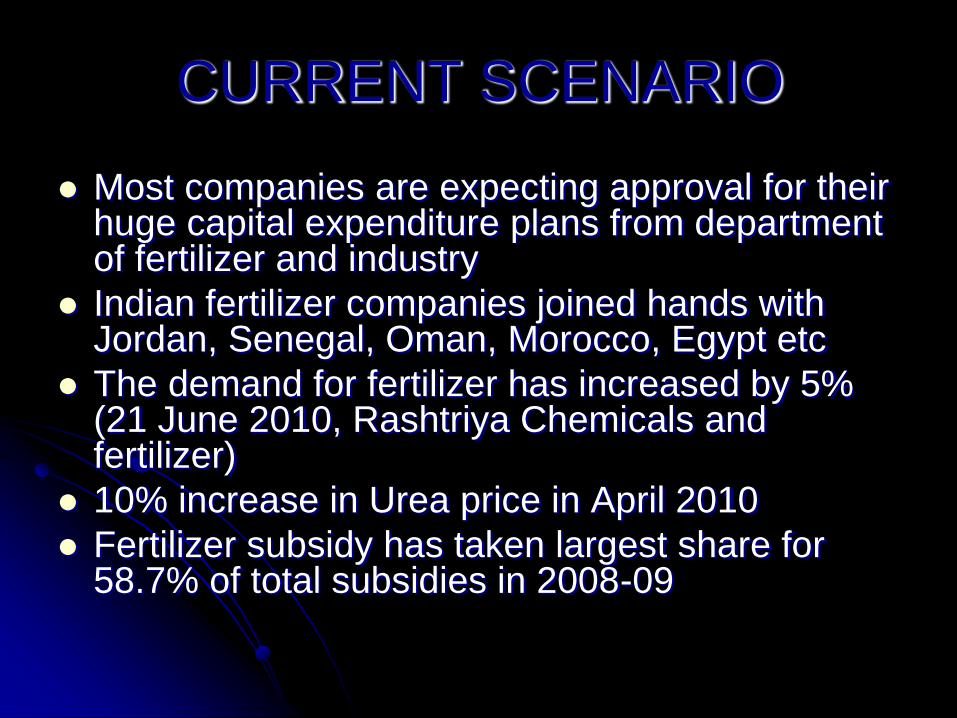
CURRENT SCENARIO
Most companies are expecting approval for their huge capital expenditure plans from department of fertilizer and industry
Indian fertilizer companies joined hands with Jordan, Senegal, Oman, Morocco, Egypt etc
The demand for fertilizer has increased by 5% (21 June 2010, Rashtriya Chemicals and fertilizer)
10% increase in Urea price in April 2010
Fertilizer subsidy has taken largest share for 58.7% of total subsidies in 2008-09
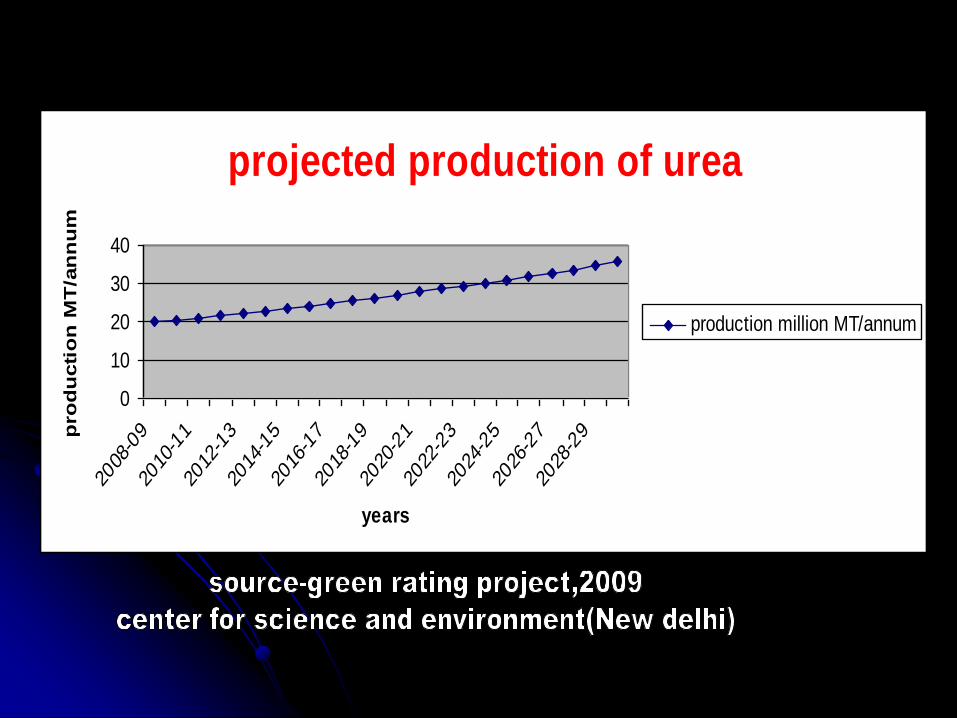
projected production of urea
0
10
20
30
40
2008
-09
2010
-11
2012
-13
2014
-15
2016
-17
2018
-19
2020
-21
2022
-23
2024
-25
2026
-27
2028
-29
years
pro
du
cti
on
MT
/an
nu
m
production million MT/annum
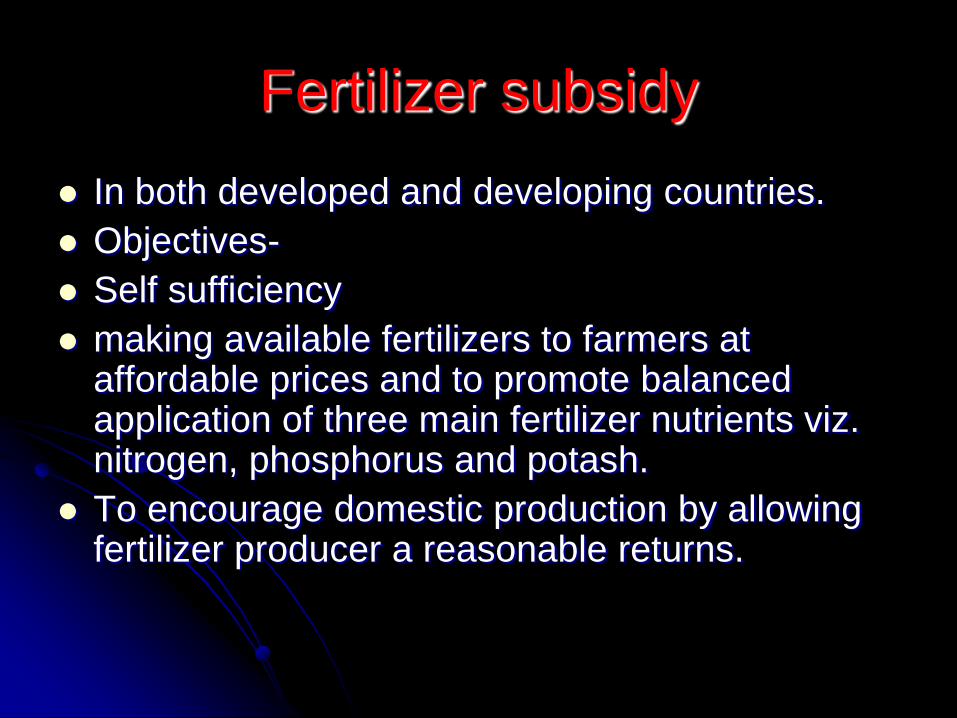
Fertilizer subsidy
In both developed and developing countries.
Objectives-
Self sufficiency
making available fertilizers to farmers at affordable prices and to promote balanced application of three main fertilizer nutrients viz. nitrogen, phosphorus and potash.
To encourage domestic production by allowing fertilizer producer a reasonable returns.
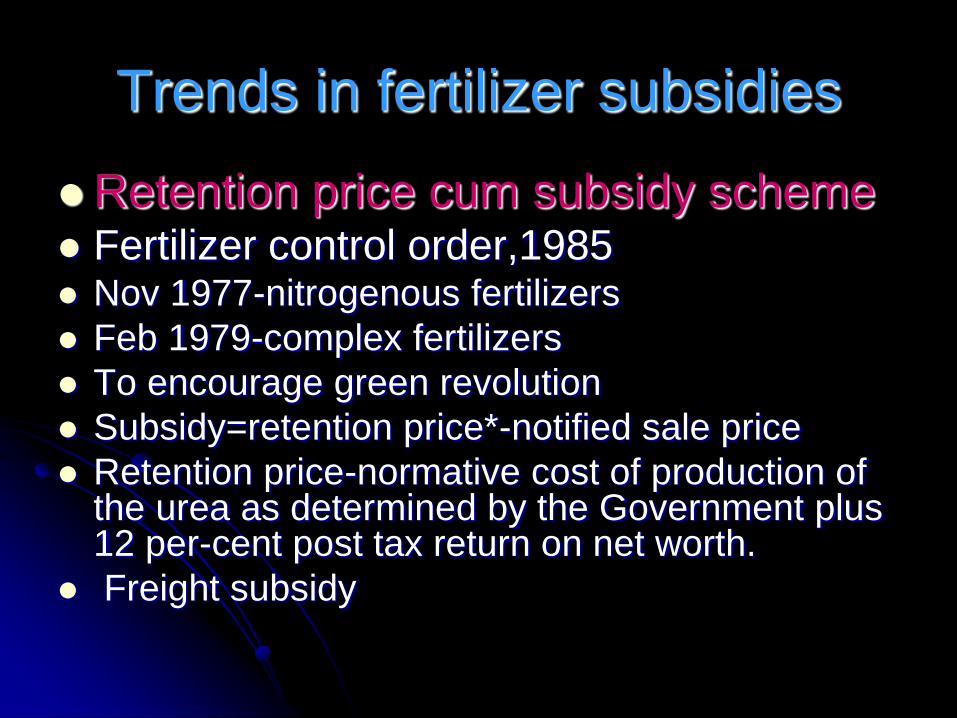
Trends in fertilizer subsidies
Retention price cum subsidy scheme Fertilizer control order,1985 Nov 1977-nitrogenous fertilizers
Feb 1979-complex fertilizers
To encourage green revolution
Subsidy=retention price*-notified sale price
Retention price-normative cost of production of the urea as determined by the Government plus 12 per-cent post tax return on net worth.
Freight subsidy
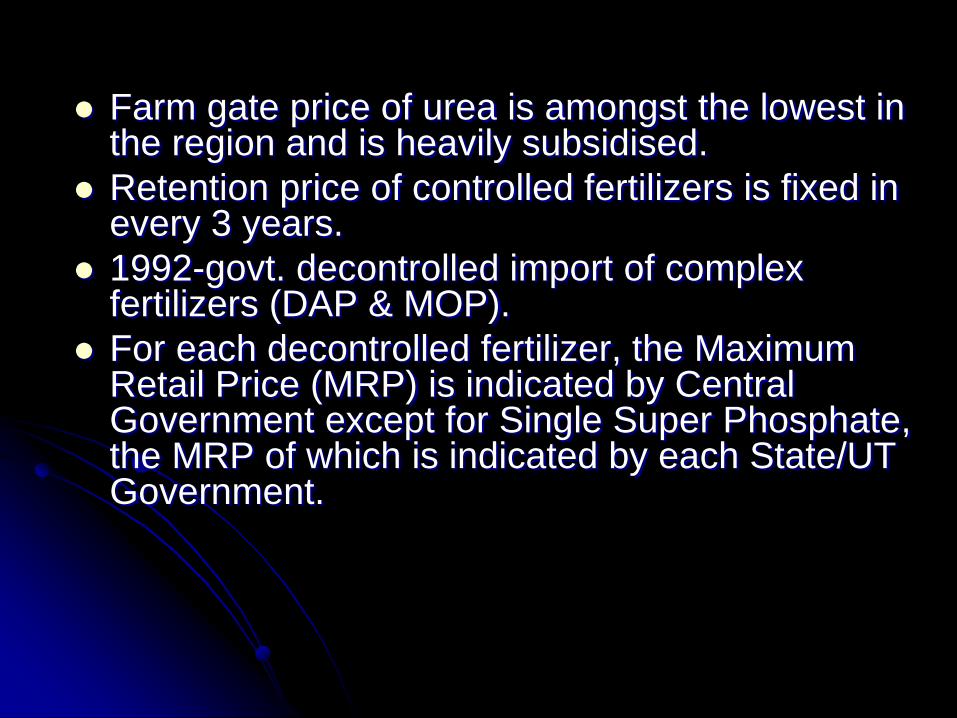
Farm gate price of urea is amongst the lowest in the region and is heavily subsidised.
Retention price of controlled fertilizers is fixed in every 3 years.
1992-govt. decontrolled import of complex fertilizers (DAP & MOP).
For each decontrolled fertilizer, the Maximum Retail Price (MRP) is indicated by Central Government except for Single Super Phosphate, the MRP of which is indicated by each State/UT Government.
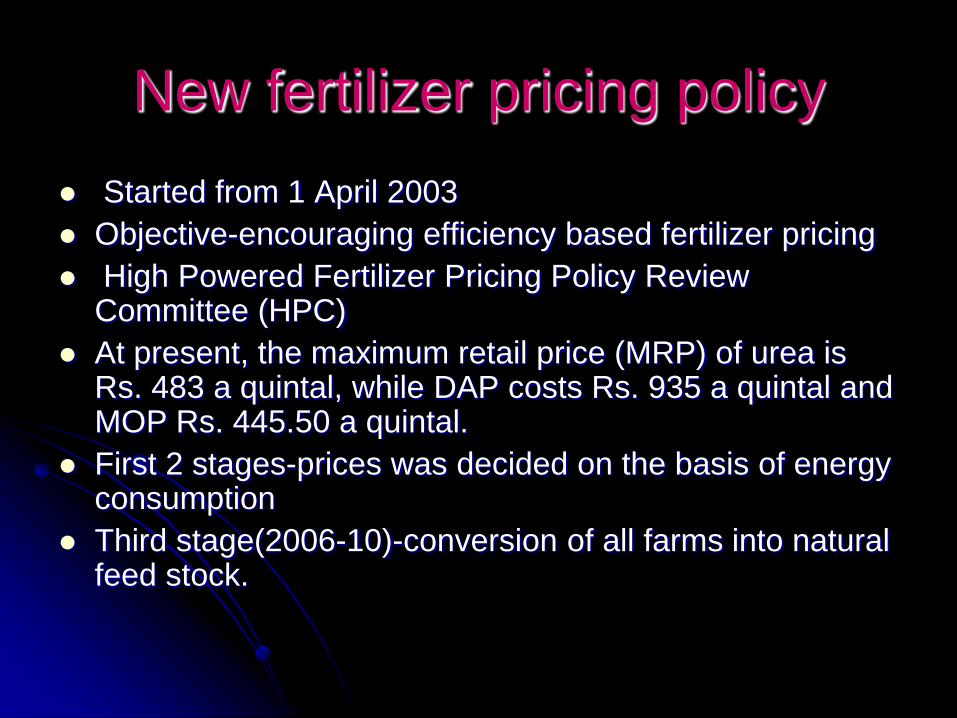
New fertilizer pricing policy
Started from 1 April 2003
Objective-encouraging efficiency based fertilizer pricing
High Powered Fertilizer Pricing Policy Review Committee (HPC)
At present, the maximum retail price (MRP) of urea is Rs. 483 a quintal, while DAP costs Rs. 935 a quintal and MOP Rs. 445.50 a quintal.
First 2 stages-prices was decided on the basis of energy consumption
Third stage(2006-10)-conversion of all farms into natural feed stock.
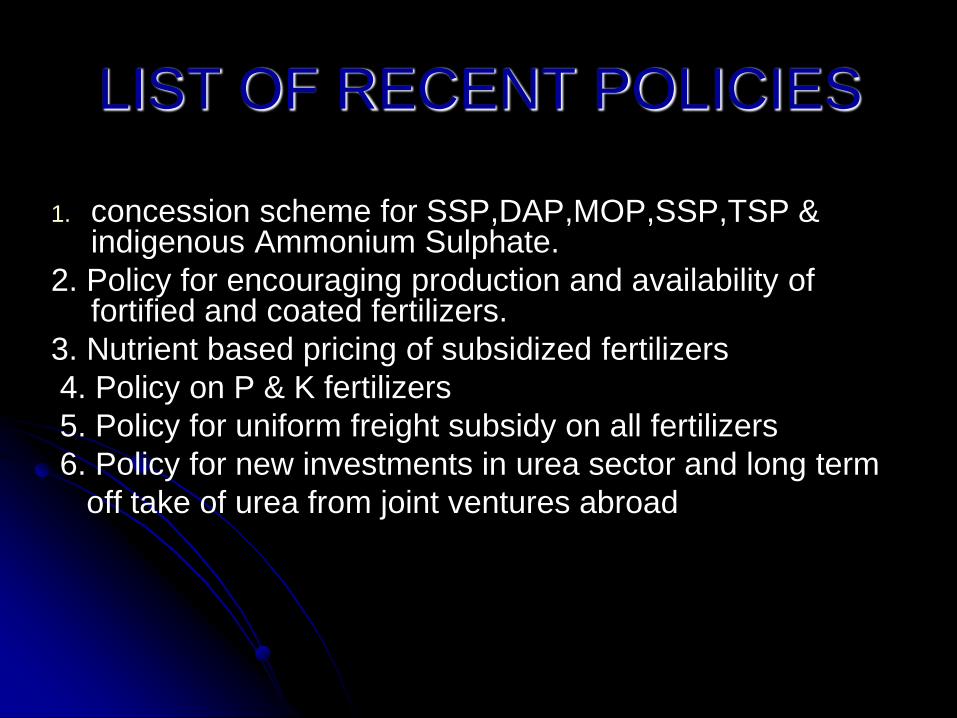
LIST OF RECENT POLICIES
1. concession scheme for SSP,DAP,MOP,SSP,TSP & indigenous Ammonium Sulphate.
2. Policy for encouraging production and availability of fortified and coated fertilizers.
3. Nutrient based pricing of subsidized fertilizers
4. Policy on P & K fertilizers
5. Policy for uniform freight subsidy on all fertilizers
6. Policy for new investments in urea sector and long term
off take of urea from joint ventures abroad
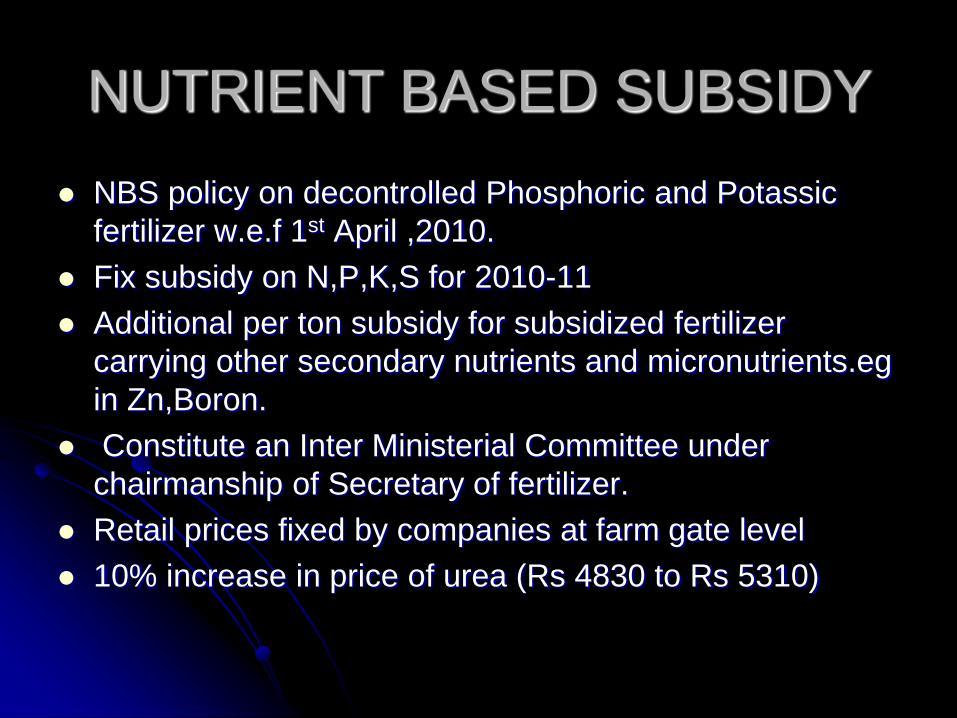
NUTRIENT BASED SUBSIDY
NBS policy on decontrolled Phosphoric and Potassic
fertilizer w.e.f 1st April ,2010.
Fix subsidy on N,P,K,S for 2010-11
Additional per ton subsidy for subsidized fertilizer
carrying other secondary nutrients and micronutrients.eg
in Zn,Boron.
Constitute an Inter Ministerial Committee under
chairmanship of Secretary of fertilizer.
Retail prices fixed by companies at farm gate level
10% increase in price of urea (Rs 4830 to Rs 5310)
source-government of India
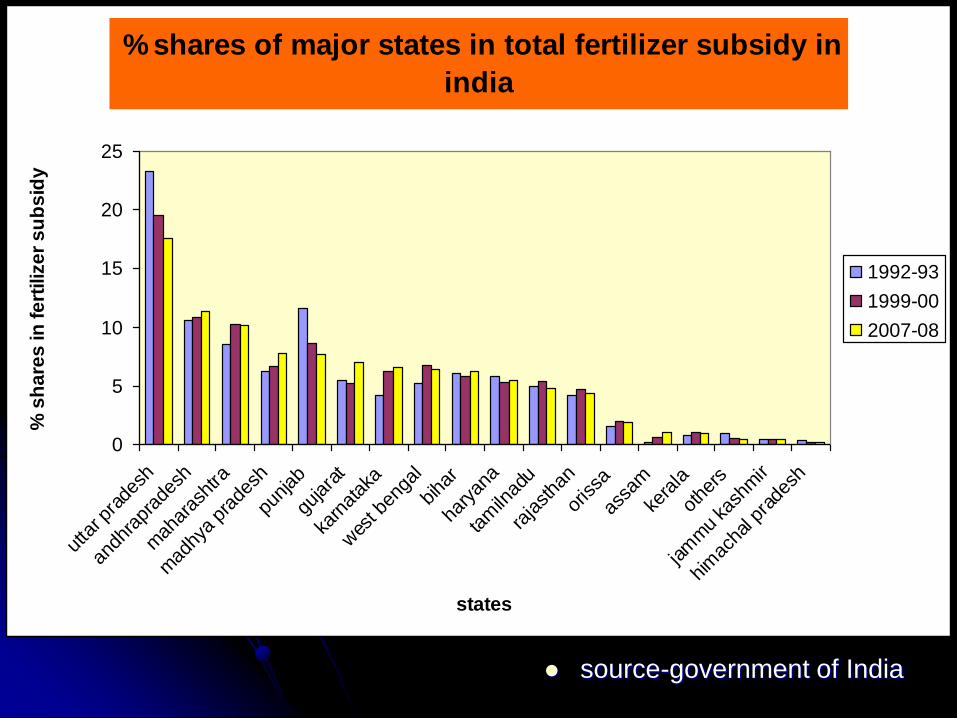
% shares of major states in total fertilizer subsidy in
india
0
5
10
15
20
25
utta
r pra
desh
andh
rapr
ades
h
mah
aras
htra
mad
hya
prad
esh
punjab
gujara
t
karn
atak
a
wes
t ben
gal
biha
r
hary
ana
tam
ilnad
u
raja
stha
n
orissa
assa
m
kera
la
othe
rs
jam
mu
kash
mir
him
acha
l pra
desh
states
% s
ha
res
in
fe
rtiliz
er
su
bs
idy
1992-93
1999-00
2007-08
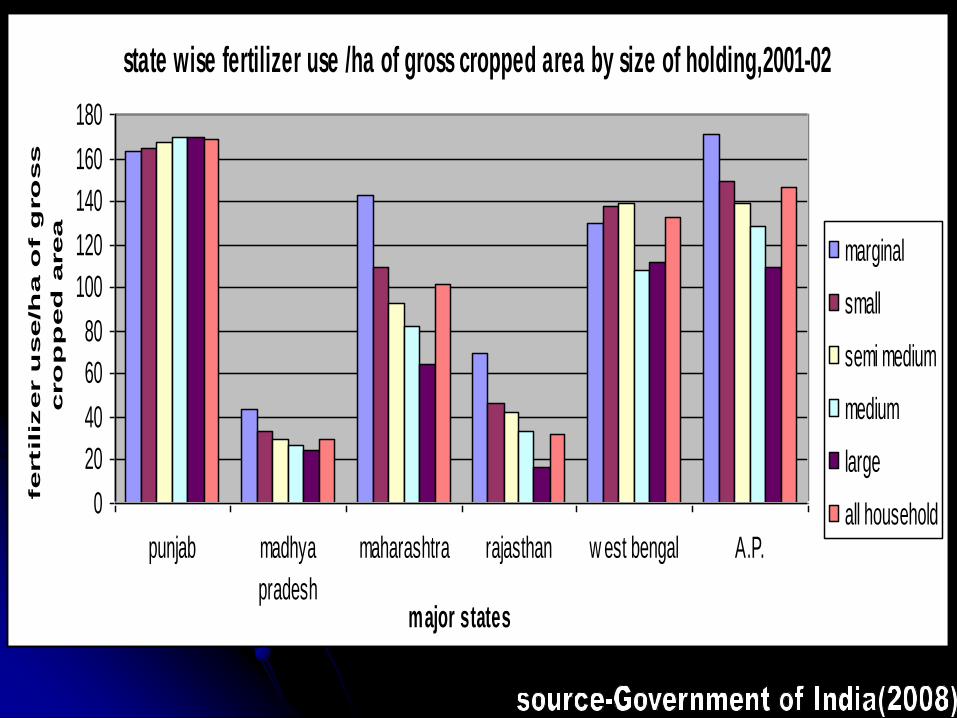
state wise fertilizer use /ha of gross cropped area by size of holding,2001-02
0
20
40
60
80
100
120
140
160
180
punjab madhya
pradesh
maharashtra rajasthan w est bengal A.P.
major states
fertilizer u
se/h
a o
f g
ro
ss
cro
pp
ed
area
marginal
small
semi medium
medium
large
all household
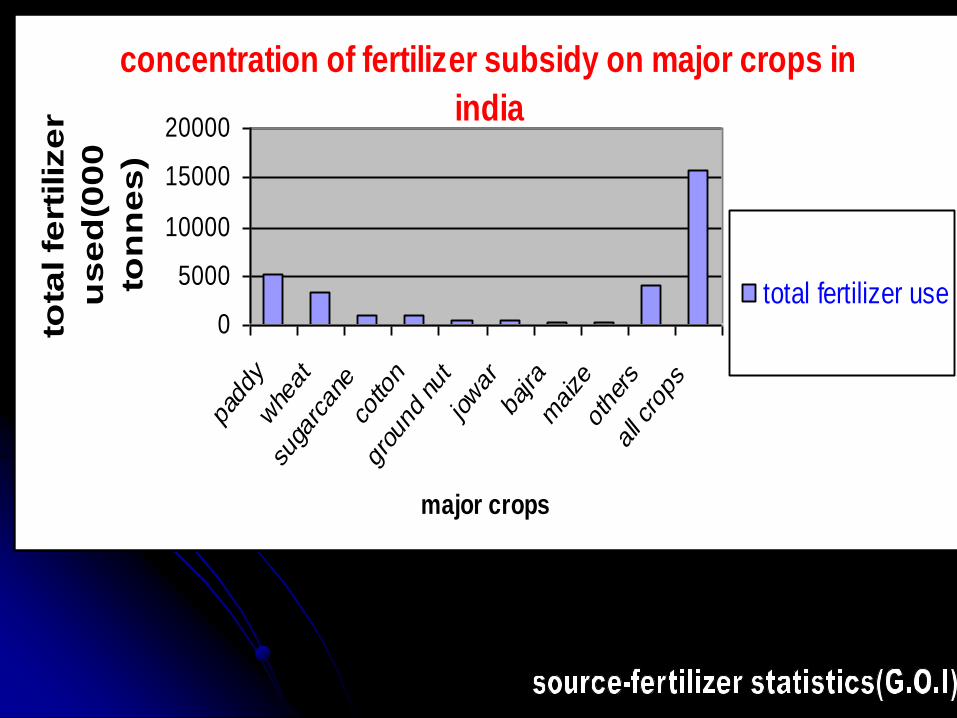
concentration of fertilizer subsidy on major crops in
india
0
5000
10000
15000
20000
padd
y
whe
at
suga
rcan
e
cotto
n
grou
nd nut
jowar
bajra
maize
othe
rs
all c
rops
major crops
tota
l fe
rtiliz
er
us
ed
(00
0
ton
ne
s)
total fertilizer use
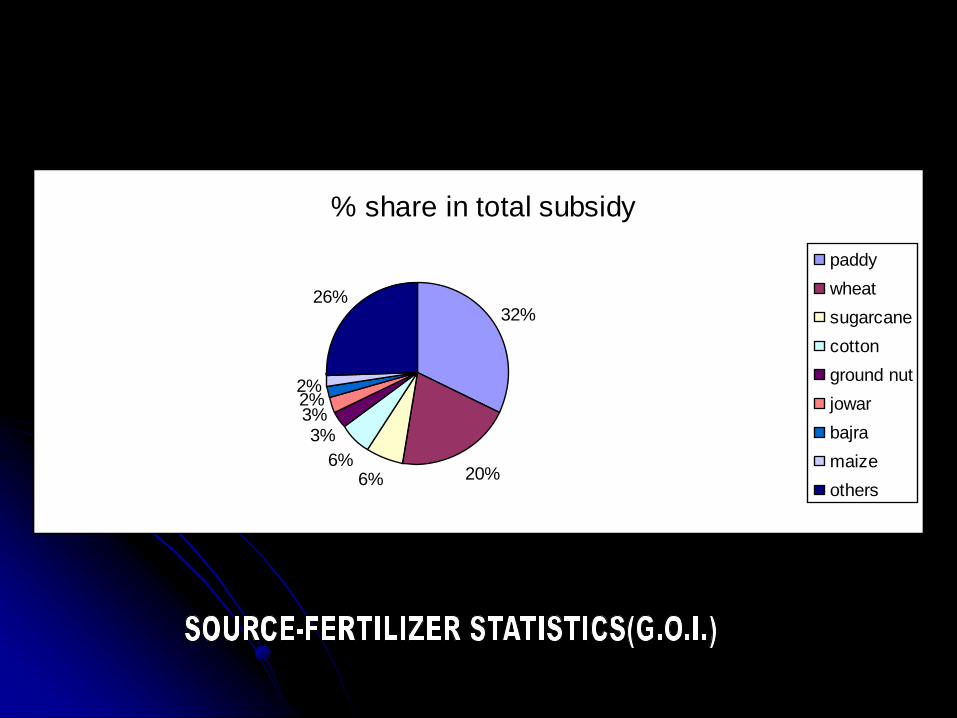
% share in total subsidy
32%
20%6%6%
3%3%2%2%
26%
paddy
wheat
sugarcane
cotton
ground nut
jowar
bajra
maize
others
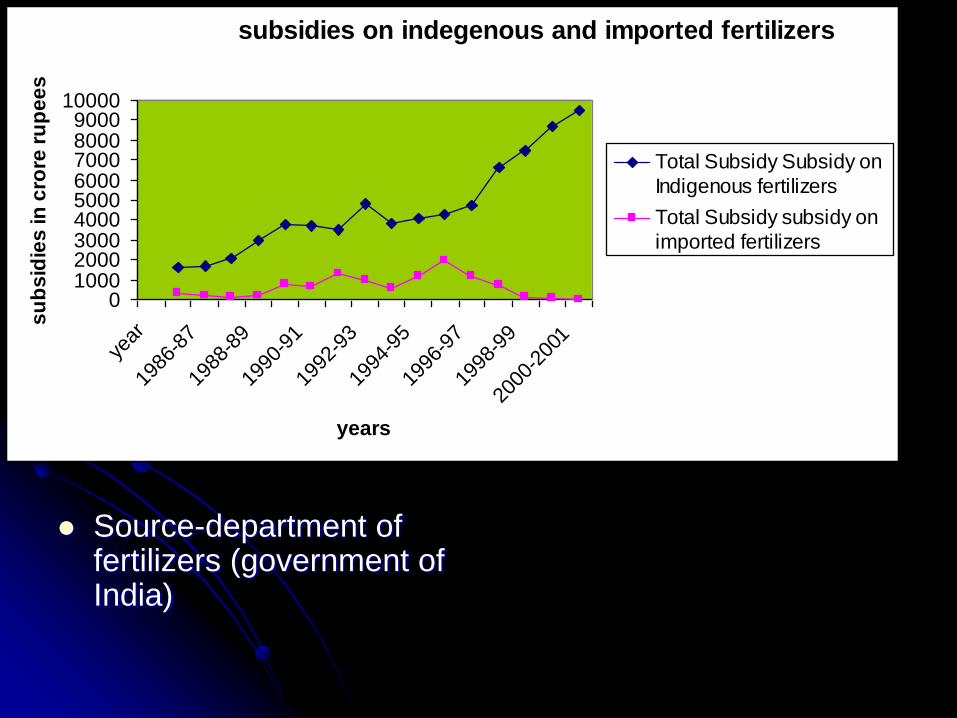
Source-department of fertilizers (government of India)
subsidies on indegenous and imported fertilizers
0100020003000400050006000700080009000
10000
year
1986
-87
1988
-89
1990
-91
1992
-93
1994
-95
1996
-97
1998
-99
2000
-200
1
years
su
bs
idie
s in
cro
re r
up
ee
s
Total Subsidy Subsidy on
Indigenous fertilizers
Total Subsidy subsidy on
imported fertilizers
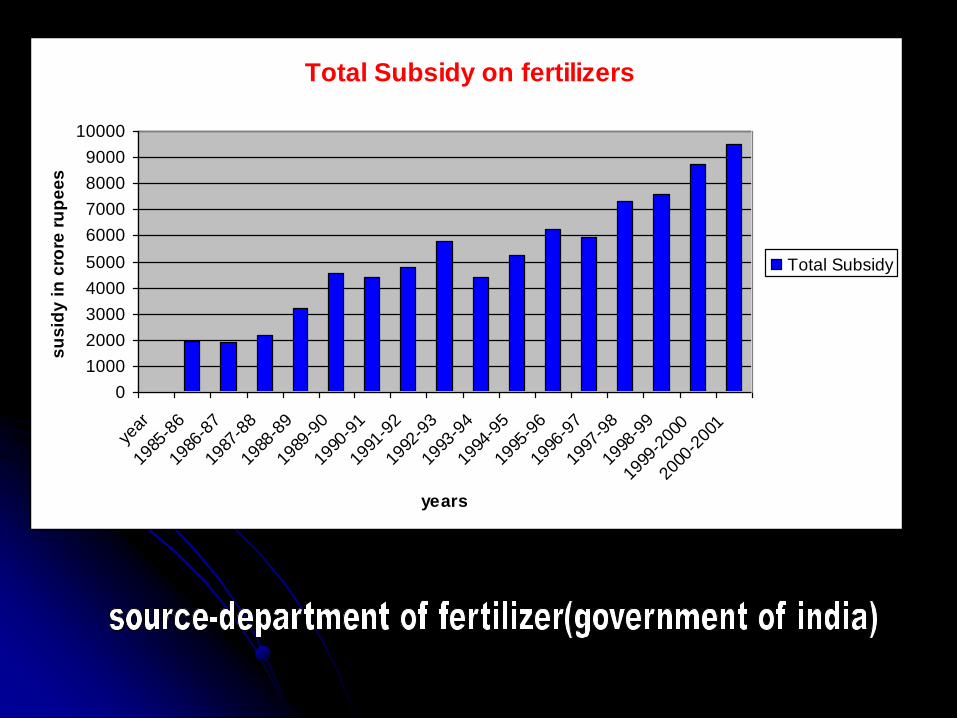
Total Subsidy on fertilizers
0
1000
2000
3000
4000
5000
6000
7000
8000
9000
10000
year
1985
-86
1986
-87
1987
-88
1988
-89
1989
-90
1990
-91
1991
-92
1992
-93
1993
-94
1994
-95
1995
-96
1996
-97
1997
-98
1998
-99
1999
-200
0
2000
-200
1
years
su
sid
y i
n c
rore
ru
pe
es
Total Subsidy
Fertilizer regulations:
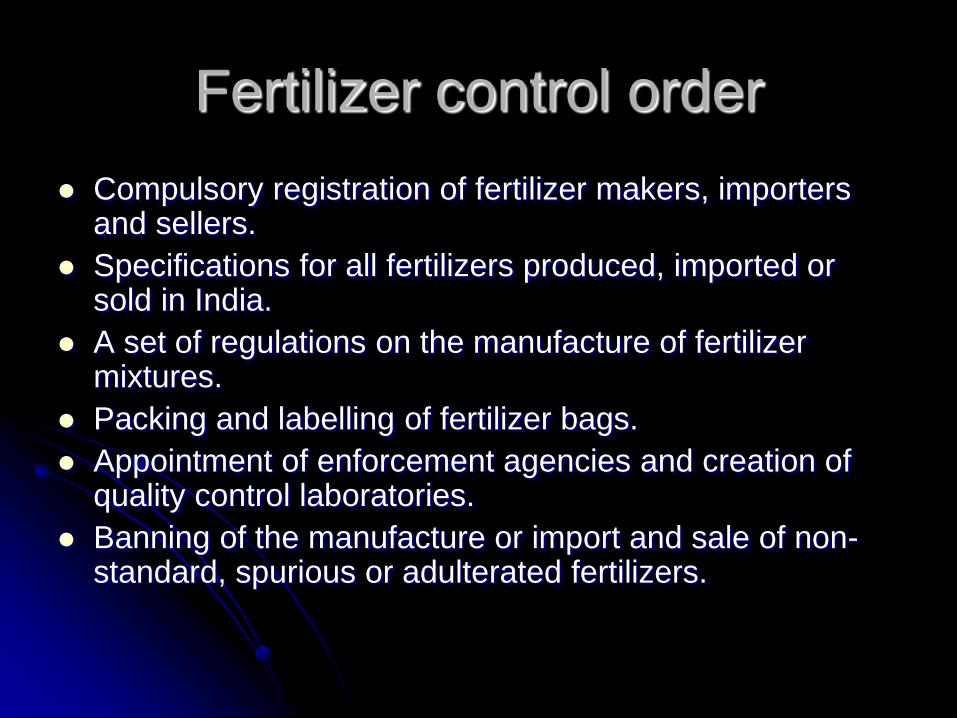
Fertilizer control order
Compulsory registration of fertilizer makers, importers and sellers.
Specifications for all fertilizers produced, imported or sold in India.
A set of regulations on the manufacture of fertilizer mixtures.
Packing and labelling of fertilizer bags.
Appointment of enforcement agencies and creation of quality control laboratories.
Banning of the manufacture or import and sale of non-standard, spurious or adulterated fertilizers.
Central fertilizer quality control and
training institute Undertaking inspection and analysis of imported
and indigenous fertilizers
Standardization and development of method of analysis
Training of fertilizer enforcement officers and analysts.
Acting as a referee laboratory
Providing technical guidance to the Central and State governments on Fertilizer Quality Control Laboratories.
Fertilizer movement control order(1973)
STRATEGIES FOR INDUSTRY
EXPANSION
Modernization and revamping of existing
fertilizer units.
Reviving some of the closed fertilizer units
Alternative sources for urea production
Establishment of joint ventures where
cheaper raw materials can be procured
Joint ventures for phosphoric acid
procurement

THANK YOU