indiabulls group presentation_111113
DESCRIPTION
A description on Indiaa BullsTRANSCRIPT
Indiabulls Group
1
Indiabulls Group
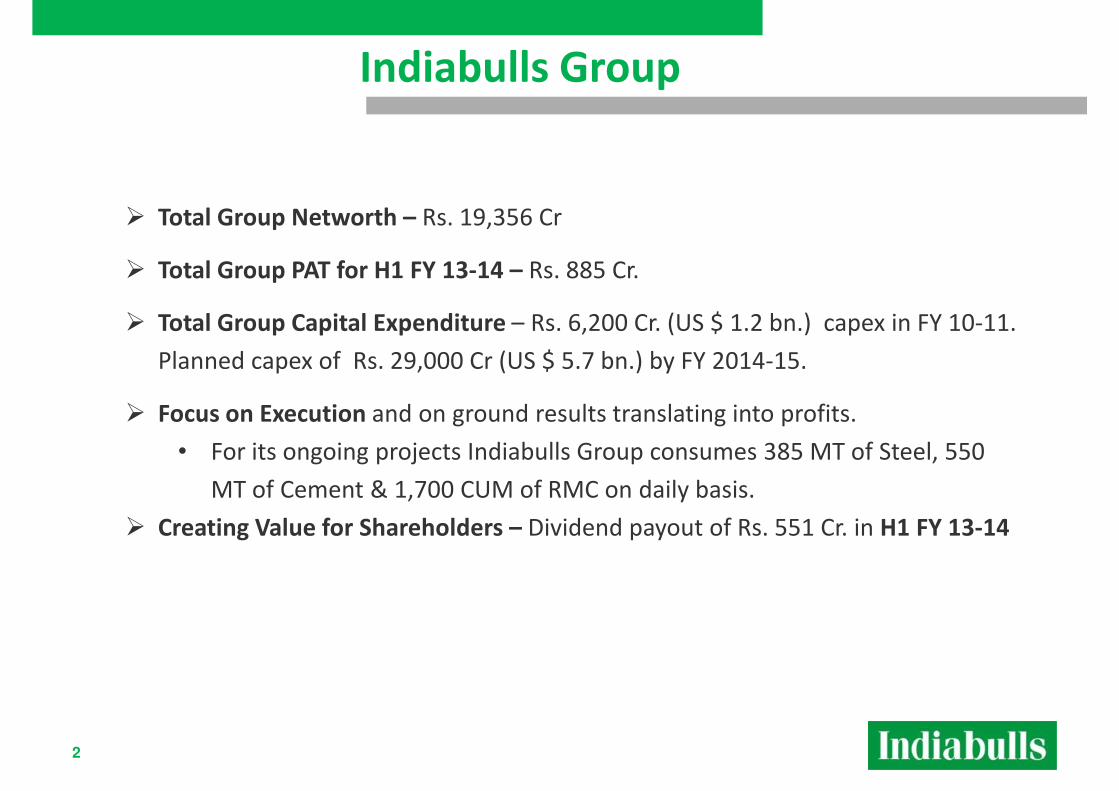
� Total Group Networth – Rs. 19,356 Cr
� Total Group PAT for H1 FY 13-14 – Rs. 885 Cr.� Total Group PAT for H1 FY 13-14 – Rs. 885 Cr.
� Total Group Capital Expenditure – Rs. 6,200 Cr. (US $ 1.2 bn.) capex in FY 10-11.
Planned capex of Rs. 29,000 Cr (US $ 5.7 bn.) by FY 2014-15.
� Focus on Execution and on ground results translating into profits.
• For its ongoing projects Indiabulls Group consumes 385 MT of Steel, 550
MT of Cement & 1,700 CUM of RMC on daily basis.
� Creating Value for Shareholders – Dividend payout of Rs. 551 Cr. in H1 FY 13-14
2
� Creating Value for Shareholders – Dividend payout of Rs. 551 Cr. in H1 FY 13-14
Indiabulls Power announced demerger
from Real Estate
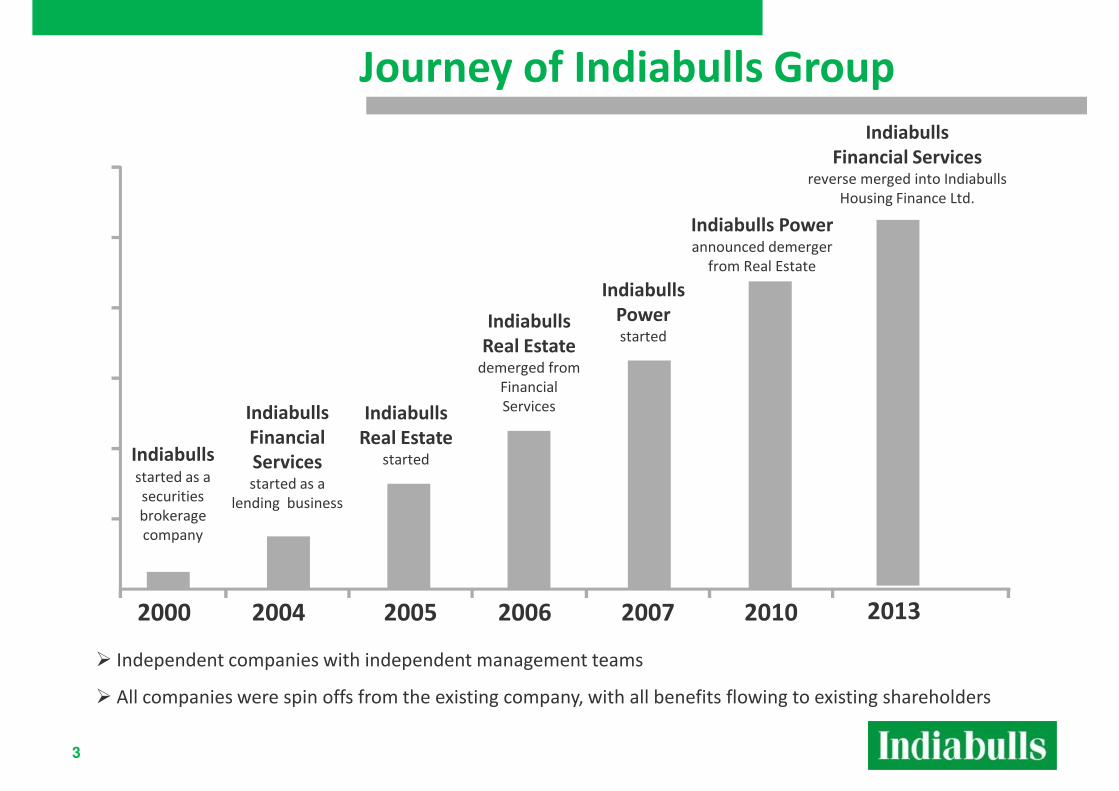
Journey of Indiabulls Group
Indiabulls
Financial Services reverse merged into Indiabulls
Housing Finance Ltd.
Indiabullsstarted as a
securities
brokerage
company
Indiabulls
Financial
Services started as a
lending business
Indiabulls
Real Estate demerged from
Financial
Services
Indiabulls
Power started
from Real Estate
Indiabulls
Real Estate started
3
company
� Independent companies with independent management teams
� All companies were spin offs from the existing company, with all benefits flowing to existing shareholders
2000 2004 2005 2006 2007 2010 2013
Indiabulls Group
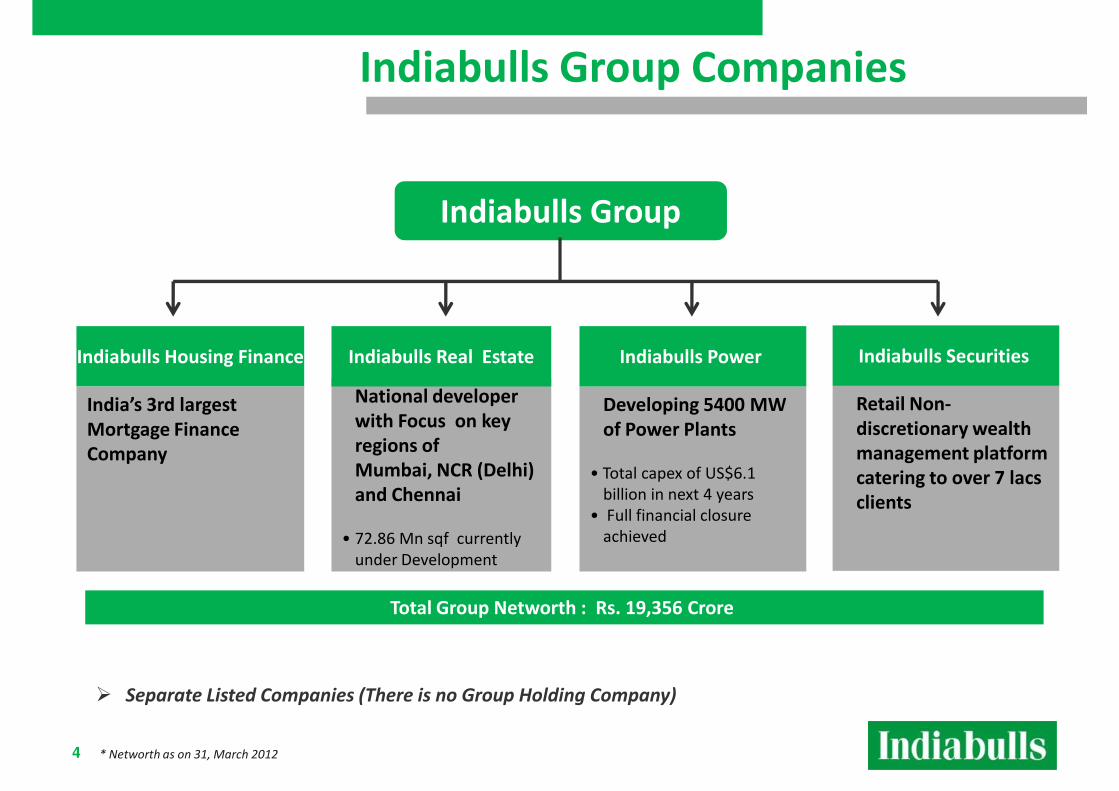
Indiabulls Group Companies
Developing 5400 MW
of Power Plants
• Total capex of US$6.1
billion in next 4 years
• Full financial closure
achieved
National developer
with Focus on key
regions of
Mumbai, NCR (Delhi)
and Chennai
• 72.86 Mn sqf currently
Indiabulls Housing Finance
India’s 3rd largest
Mortgage Finance
Company
Indiabulls Real Estate Indiabulls Power
Retail Non-
discretionary wealth
management platform
catering to over 7 lacs
clients
Indiabulls Securities
4
achieved• 72.86 Mn sqf currently
under Development
� Separate Listed Companies (There is no Group Holding Company)
Total Group Networth : Rs. 19,356 Crore
* Networth as on 31, March 2012
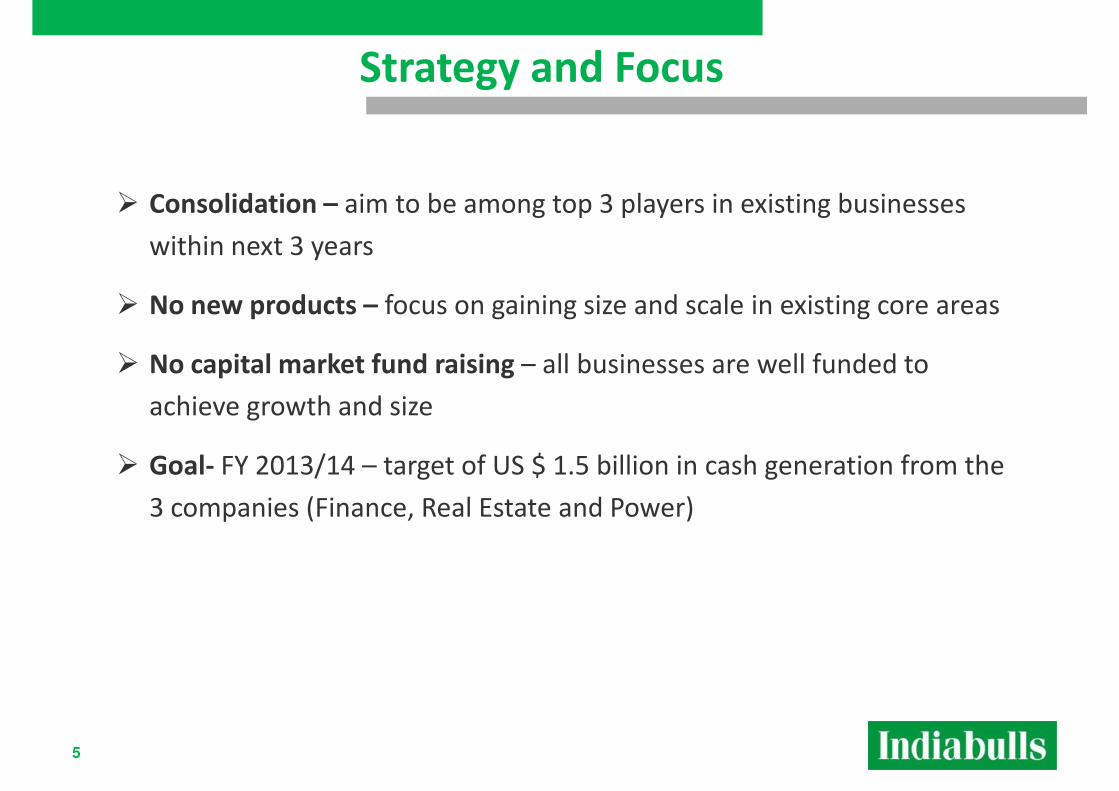
� Consolidation – aim to be among top 3 players in existing businesses
within next 3 years
Strategy and Focus
� No new products – focus on gaining size and scale in existing core areas
� No capital market fund raising – all businesses are well funded to
achieve growth and size
� Goal- FY 2013/14 – target of US $ 1.5 billion in cash generation from the
3 companies (Finance, Real Estate and Power)
5
Indiabulls Housing Finance Ltd (IHFL)
6
21%6%
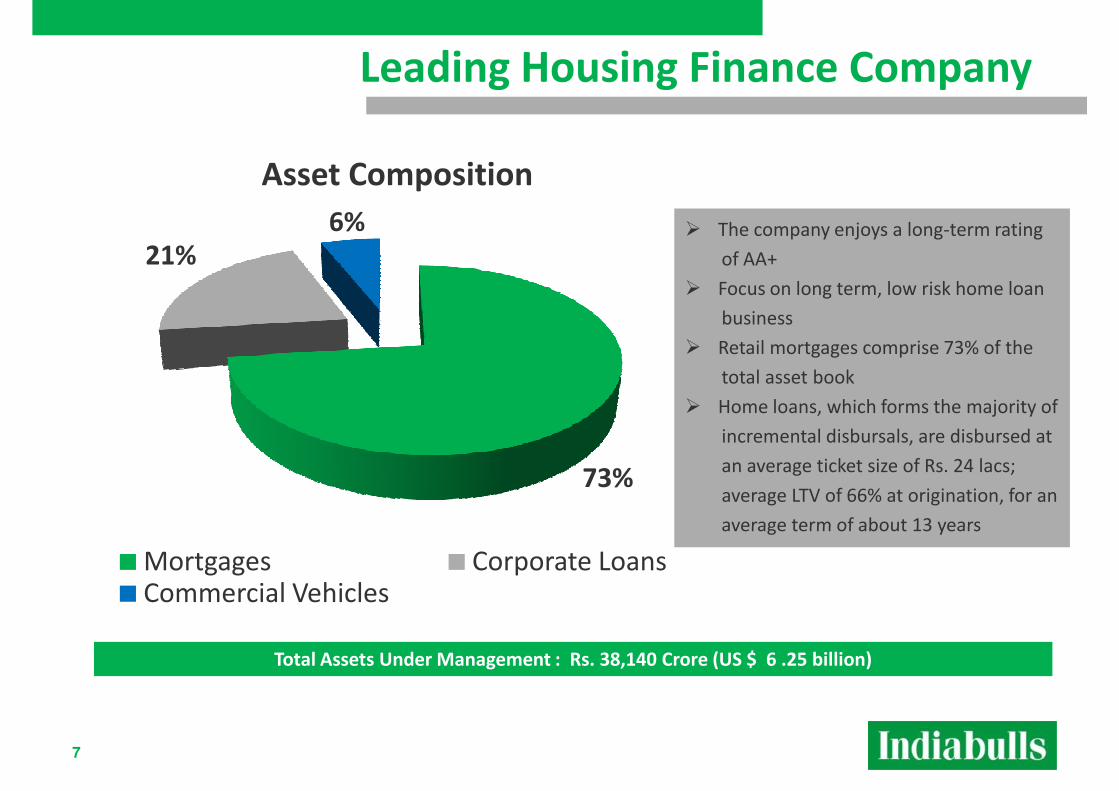
Asset Composition
� The company enjoys a long-term rating
of AA+
Leading Housing Finance Company
73%
21% of AA+
� Focus on long term, low risk home loan
business
� Retail mortgages comprise 73% of the
total asset book
� Home loans, which forms the majority of
incremental disbursals, are disbursed at
an average ticket size of Rs. 24 lacs;
average LTV of 66% at origination, for an
average term of about 13 years
7
Mortgages Corporate LoansCommercial Vehicles
average term of about 13 years
Total Assets Under Management : Rs. 38,140 Crore (US $ 6 .25 billion)
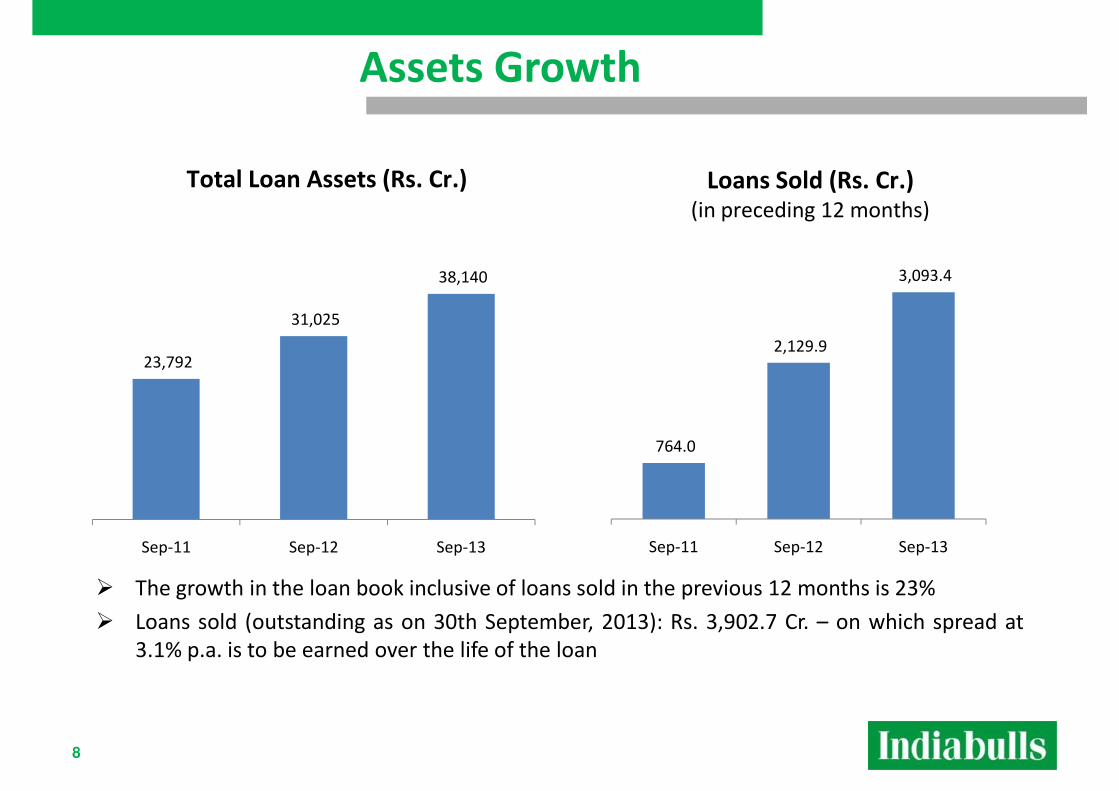
Assets Growth
Loans Sold (Rs. Cr.)(in preceding 12 months)
Total Loan Assets (Rs. Cr.)
23,792
31,025
38,140
764.0
2,129.9
3,093.4
8
� The growth in the loan book inclusive of loans sold in the previous 12 months is 23%
� Loans sold (outstanding as on 30th September, 2013): Rs. 3,902.7 Cr. – on which spread at
3.1% p.a. is to be earned over the life of the loan
Sep-11 Sep-12 Sep-13 Sep-11 Sep-12 Sep-13
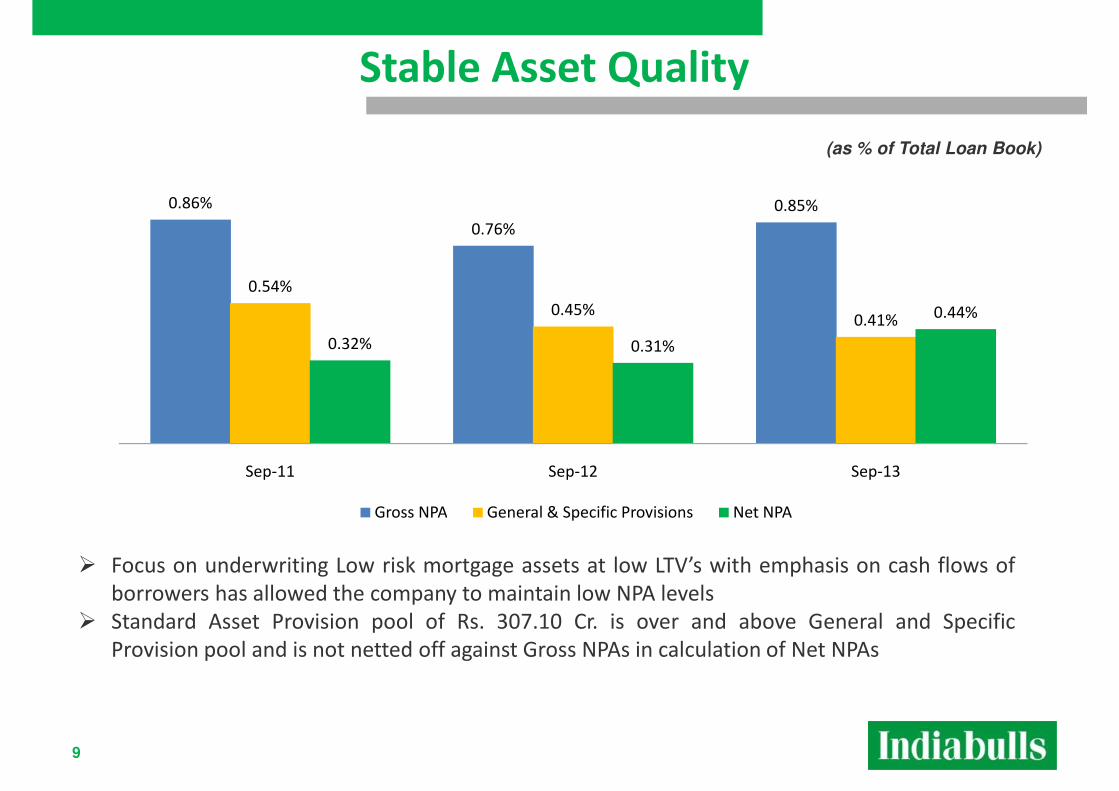
Stable Asset Quality
(as % of Total Loan Book)
0.86%
0.76%
0.85%
0.54%
0.45%0.41%
0.32% 0.31%
0.44%
Sep-11 Sep-12 Sep-13
Gross NPA General & Specific Provisions Net NPA
9
� Focus on underwriting Low risk mortgage assets at low LTV’s with emphasis on cash flows of
borrowers has allowed the company to maintain low NPA levels
� Standard Asset Provision pool of Rs. 307.10 Cr. is over and above General and Specific
Provision pool and is not netted off against Gross NPAs in calculation of Net NPAs
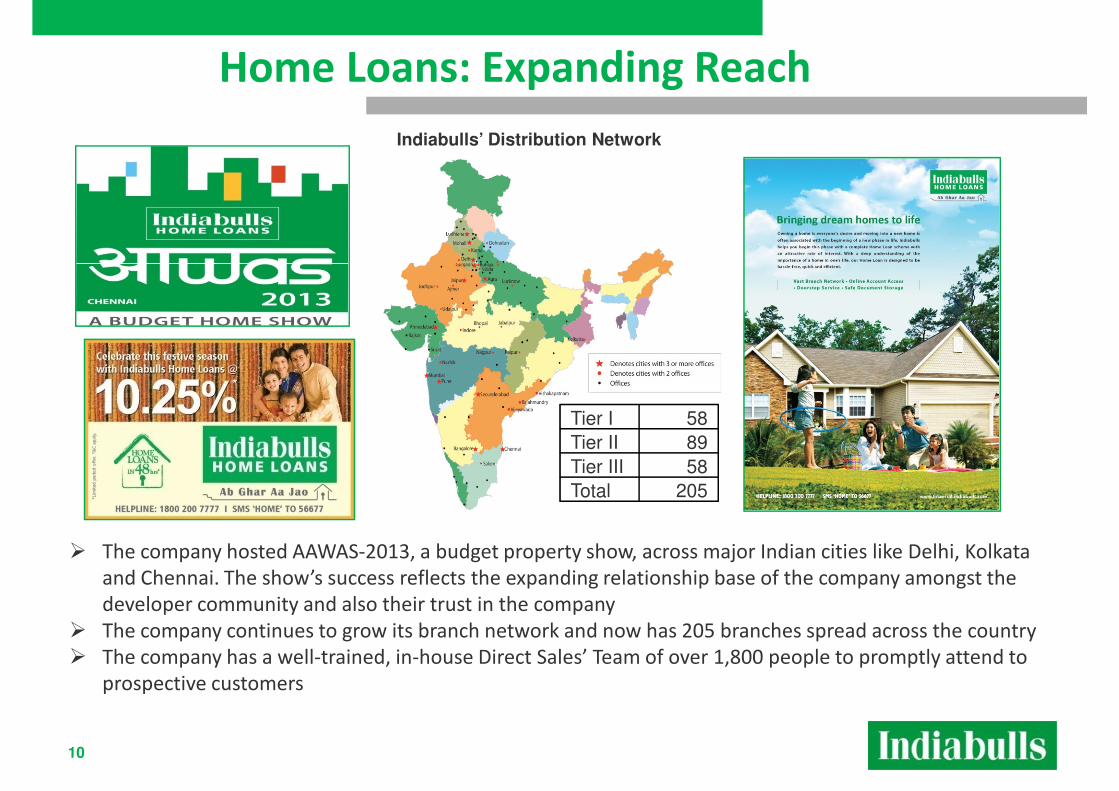
Home Loans: Expanding Reach
Indiabulls’ Distribution Network
Tier I 58
Tier II 89
Tier III 58
Total 205
10
� The company hosted AAWAS-2013, a budget property show, across major Indian cities like Delhi, Kolkata
and Chennai. The show’s success reflects the expanding relationship base of the company amongst the
developer community and also their trust in the company
� The company continues to grow its branch network and now has 205 branches spread across the country
� The company has a well-trained, in-house Direct Sales’ Team of over 1,800 people to promptly attend to
prospective customers
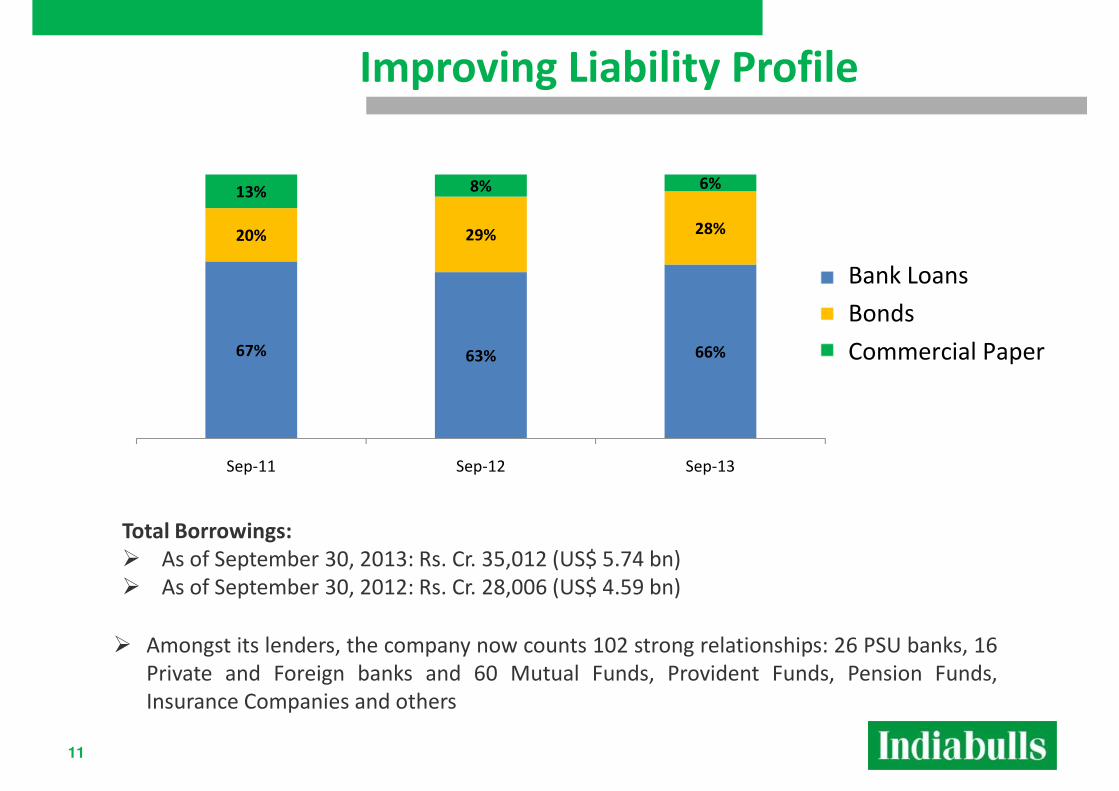
Improving Liability Profile
Bank Loans
20% 29% 28%
13% 8% 6%
Bank Loans
Bonds
Commercial Paper67% 63% 66%
Sep-11 Sep-12 Sep-13
Total Borrowings:
11
� Amongst its lenders, the company now counts 102 strong relationships: 26 PSU banks, 16
Private and Foreign banks and 60 Mutual Funds, Provident Funds, Pension Funds,
Insurance Companies and others
Total Borrowings:
� As of September 30, 2013: Rs. Cr. 35,012 (US$ 5.74 bn)
� As of September 30, 2012: Rs. Cr. 28,006 (US$ 4.59 bn)
Indiabulls Real Estate (IBREL)
12
� Delivery and Execution Track Record
Delivered a record 3.3 million SF developed space valued at $1.75 billion
(within 4 years of inception). Fastest and largest delivery in value terms by any
Quality and on-time Delivery
(within 4 years of inception). Fastest and largest delivery in value terms by any
Indian real estate developer in the same time period.
� Focus on Super Metros
95%+ portfolio is in Mumbai, Delhi (NCR) and Chennai markets.
� Focus on clear title projects
$ 900 million in lands bought through government auctions.
� Focus on Execution
With 72.86 million sqft area under development; capex of $ 2.6 billion over next
13
With 72.86 million sqft area under development; capex of $ 2.6 billion over next
2 years (with all financing in place)
� Focus on Results
Cumulative $ 5 billion in projected Gross Sales by 2014-15.
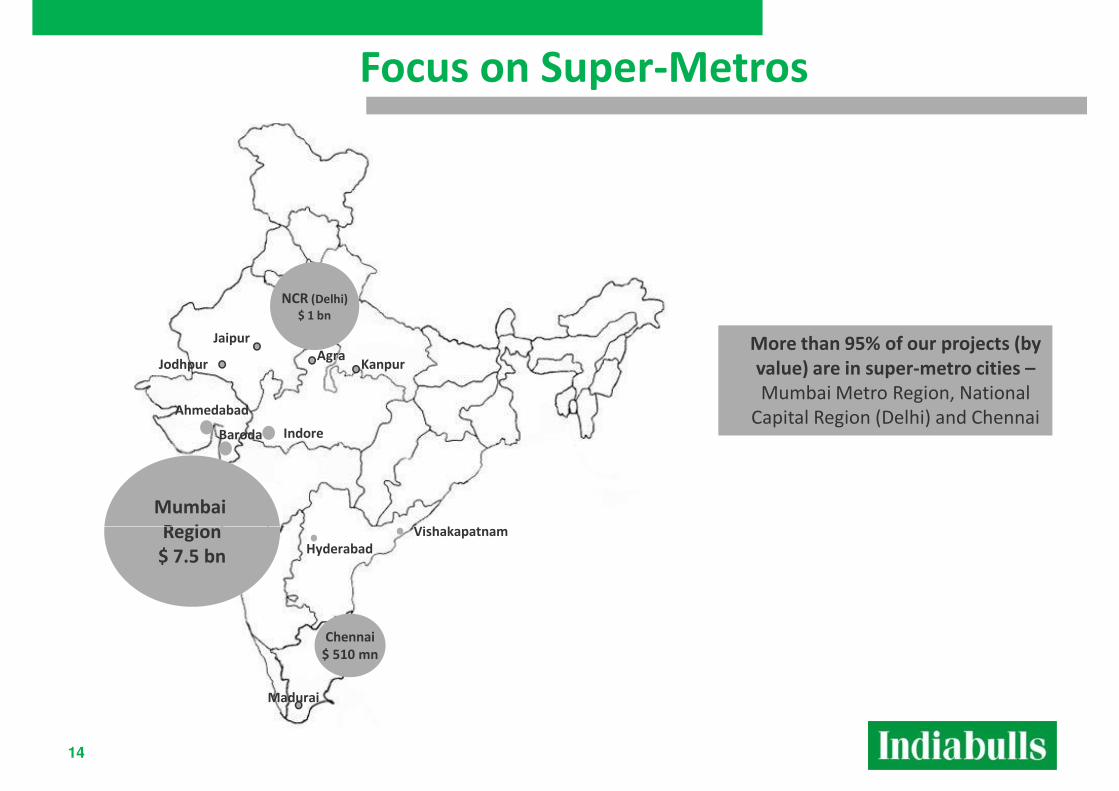
Focus on Super-Metros
More than 95% of our projects (by
value) are in super-metro cities –
Mumbai Metro Region, National
Capital Region (Delhi) and Chennai
Mumbai
Region
NCR (Delhi)
$ 1 bn
Ahmedabad
Baroda Indore
Vishakapatnam
Jodhpur
Jaipur
AgraKanpur
14
Region
$ 7.5 bn
Chennai
$ 510 mn
Hyderabad
Madurai
Vishakapatnam
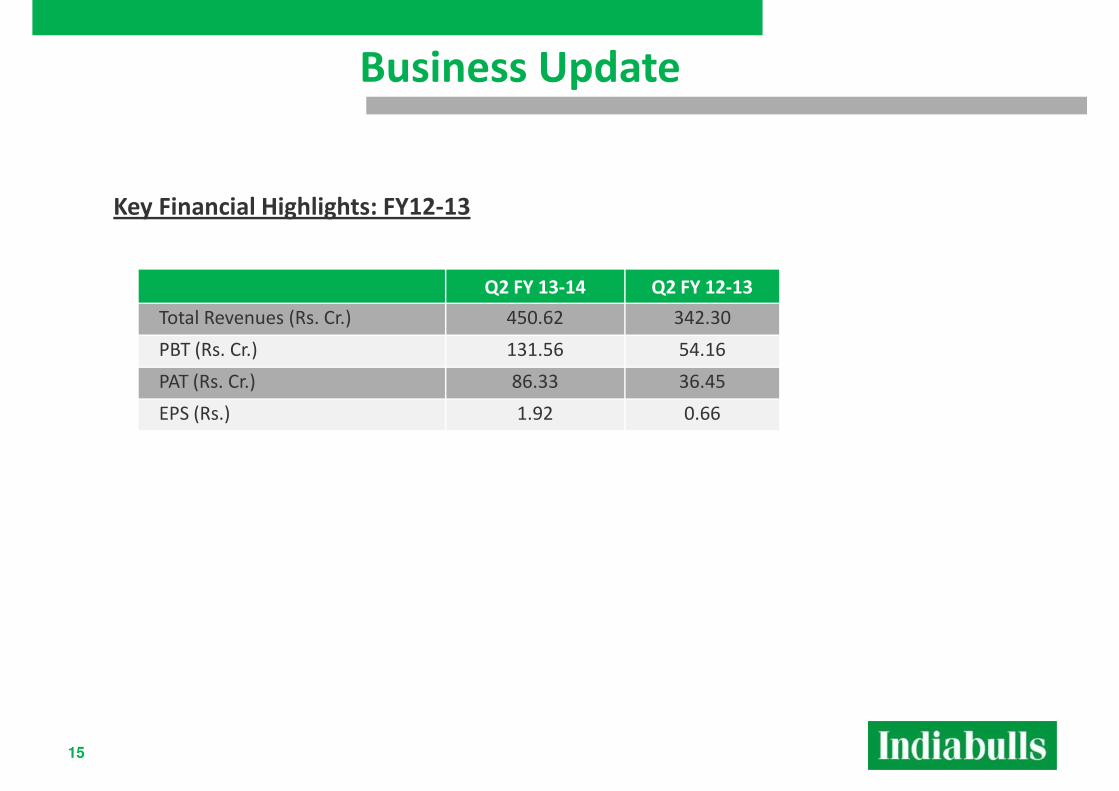
Key Financial Highlights: FY12-13
Business Update
Q2 FY 13-14 Q2 FY 12-13
Total Revenues (Rs. Cr.) 450.62 342.30
PBT (Rs. Cr.) 131.56 54.16
PAT (Rs. Cr.) 86.33 36.45
EPS (Rs.) 1.92 0.66
15
� Total Sales of Rs. 2,236 Cr for an area of 2.25 msft in H1 FY-14 vs. Rs. 1,214 Cr for
an area of 1.19 msft in H1 FY-13.
Business Update
� Total leased area as on 30th Sep-13 stands at 2.8 msft. with annual rentals of Rs.
542 Cr per annum.
� IBREL purchased the entire stake of FIM Ltd. and its affiliates for Rs. 1,172.16 Cr
funded through internal resources without taking any incremental debt. Giving it
100% ownership in 7 projects comprising area of 297.76 acres in NCR and Chennai.
� IBREL retains its A+ rating for long term debt and A1+ (highest possible) for short
16
� IBREL retains its A+ rating for long term debt and A1+ (highest possible) for short
term debt.
* All sales and marketing costs are expensed upfront and not amortized

Total Land Bank
Area(In Acres) Residential Commercial Total
Opening Balance (As on 1st
Apr 2012) 960.36 43.18 1003.54
Addition in Q4 FY ’13 6.20 0 6.20
• Acquired 6.20 acres land in H1 FY-14 primarily in
NCR .
• Strategic land acquisition over the years have CHENNAI
Region Wise Land Bank Summary
* 2,588 Acres of Nashik SEZ not included in the above
Addition in Q4 FY ’13 6.20 0 6.20
Less: Moved to AUD 0 0 0
Closing Balance 966.56 43.18 1009.74
17 17
• Strategic land acquisition over the years have
helped IBREL to aggregate a land bank of 3,598
acres across India.
All land mentioned in the table is fully paid for and in our possession.
NCR
60%
GREATER
MUMBAI &
MMR
22%
CHENNAI
18%
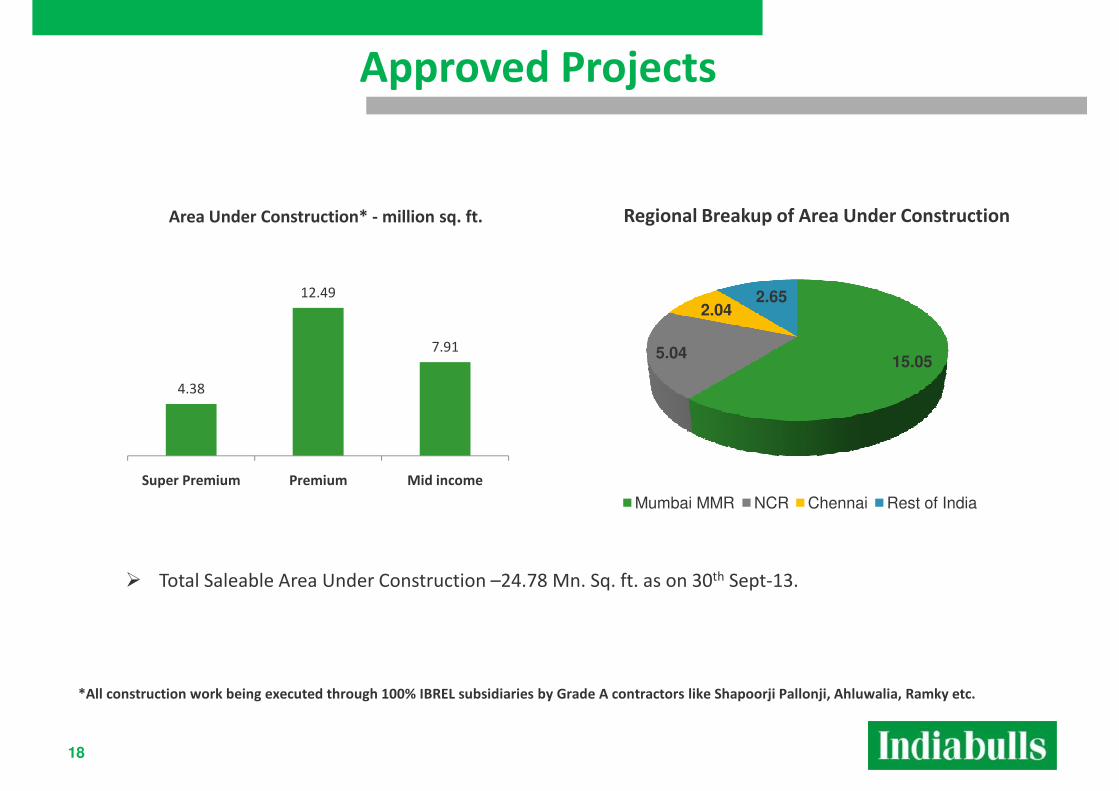
Area Under Construction* - million sq. ft. Regional Breakup of Area Under Construction
Approved Projects
4.38
12.49
7.91
Super Premium Premium Mid income
15.055.04
2.042.65
Mumbai MMR NCR Chennai Rest of India
18
� Total Saleable Area Under Construction –24.78 Mn. Sq. ft. as on 30th Sept-13.
*All construction work being executed through 100% IBREL subsidiaries by Grade A contractors like Shapoorji Pallonji, Ahluwalia, Ramky etc.
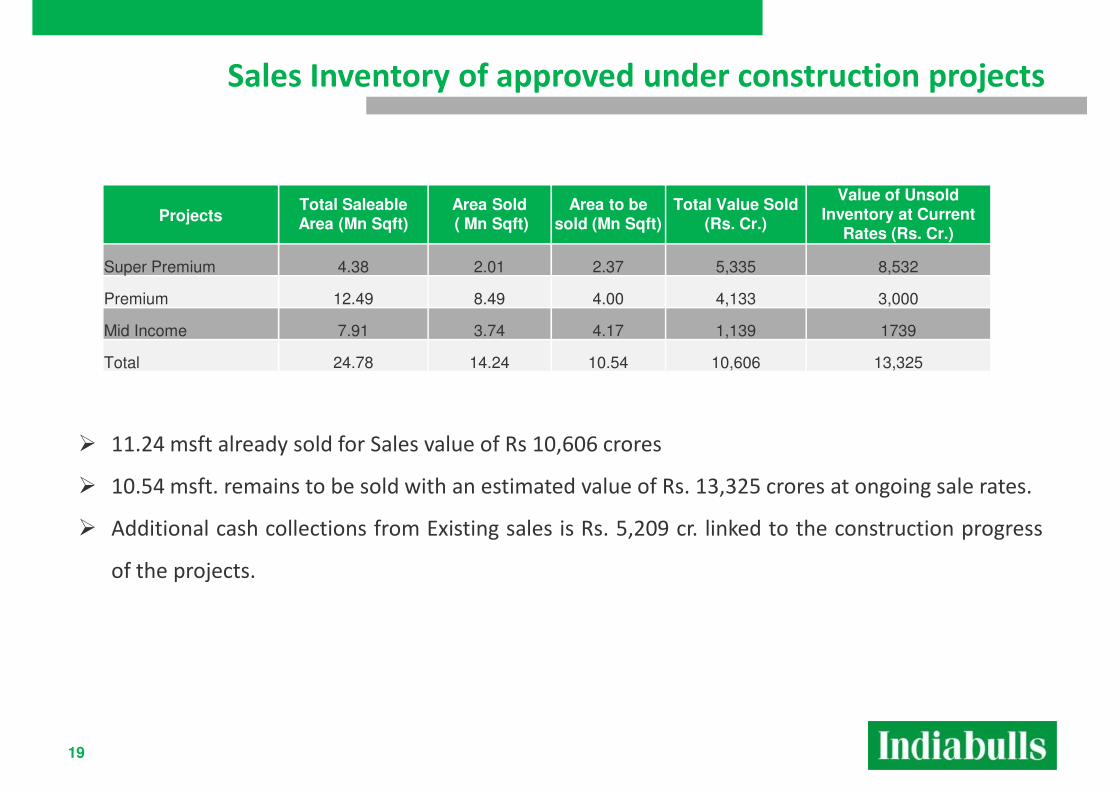
Sales Inventory of approved under construction projects
Projects Total Saleable Area (Mn Sqft)
Area Sold( Mn Sqft)
Area to be sold (Mn Sqft)
Total Value Sold (Rs. Cr.)
Value of Unsold Inventory at Current
Rates (Rs. Cr.)
Super Premium 4.38 2.01 2.37 5,335 8,532
� 11.24 msft already sold for Sales value of Rs 10,606 crores
� 10.54 msft. remains to be sold with an estimated value of Rs. 13,325 crores at ongoing sale rates.
� Additional cash collections from Existing sales is Rs. 5,209 cr. linked to the construction progress
Super Premium 4.38 2.01 2.37 5,335 8,532
Premium 12.49 8.49 4.00 4,133 3,000
Mid Income 7.91 3.74 4.17 1,139 1739
Total 24.78 14.24 10.54 10,606 13,325
19
� Additional cash collections from Existing sales is Rs. 5,209 cr. linked to the construction progress
of the projects.
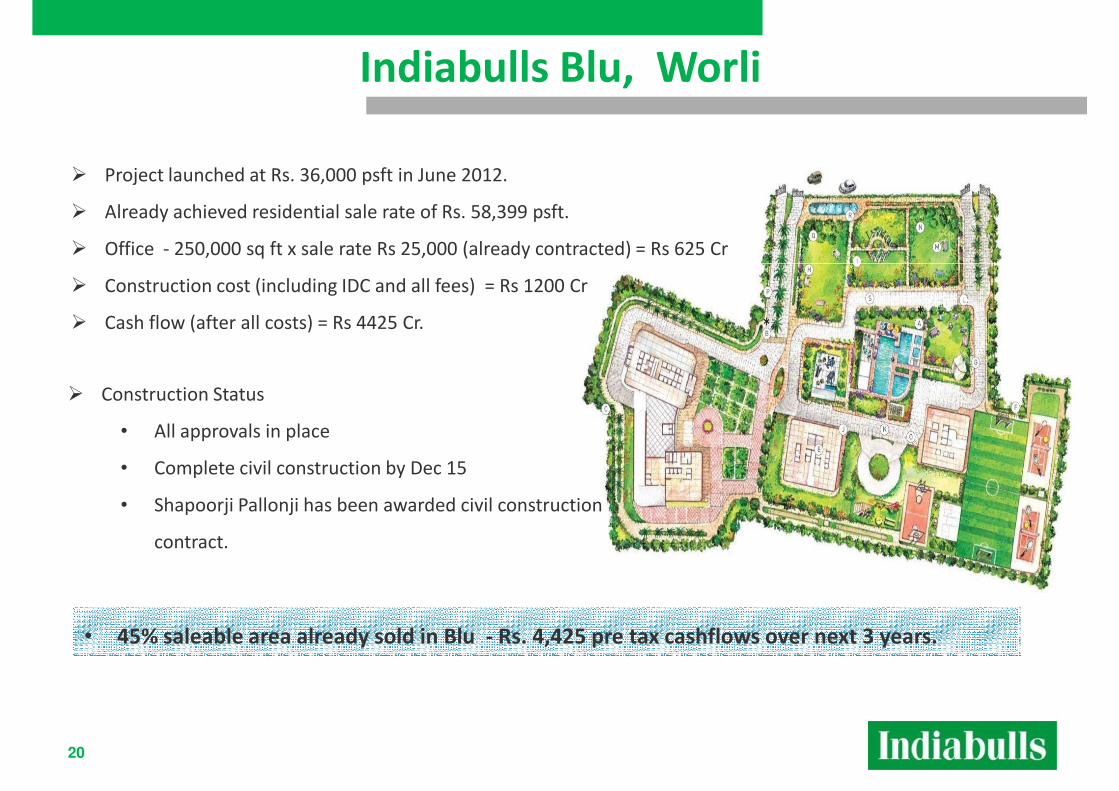
� Project launched at Rs. 36,000 psft in June 2012.
� Already achieved residential sale rate of Rs. 58,399 psft.
� Office - 250,000 sq ft x sale rate Rs 25,000 (already contracted) = Rs 625 Cr
Indiabulls Blu, Worli
� Construction cost (including IDC and all fees) = Rs 1200 Cr
� Cash flow (after all costs) = Rs 4425 Cr.
� Construction Status
• All approvals in place
• Complete civil construction by Dec 15
• Shapoorji Pallonji has been awarded civil construction
20
contract.
• 45% saleable area already sold in Blu - Rs. 4,425 pre tax cashflows over next 3 years.
Projects Pipeline
1. BLU, Worli, Mumbai – 7-Star luxury residential complex spread over 10 acres in South Mumbai with
breathtaking sea views
2. IB Golf City, Savroli, MMR – Premium residential township with 18-hole golf course spread over 350
acres of greens
Projects Launched in FY 13
acres of greens
1. IB City, Sonepat, Haryana – 150 Acres of integrated township with plotted development, commercial
and group housing
2. IB Enigma II, Sec 104, Gurgaon – Super premium residential complex with Villa’s and high rise towers
spread over 34 acres
3. IB Imperial, Sec 106, Gurgaon – 54 Acres of Integrated township with high end residential
apartments, villa’s, luxury retail and commercial
4. IB Commercial Centre, Sec 109, Gurgaon – Over 5 acres of commercial development on the Dwarka
Launch Pipeline FY 14
21
4. IB Commercial Centre, Sec 109, Gurgaon – Over 5 acres of commercial development on the Dwarka
Expressway
5. IB Greens, Chennai – Premium residential township with high rise towers near the IT corridor spread
over 32 acres
6. IB Mint, Sec 104, Gurgaon – Iconic Commercial tower on the Dwarka Expressway
7. IB Greens, Indore - 15 Acres of Integrated township with high end residential apartments, retail and
commercial in the heart of the city
8. IB Mega Mall, Agra & Kanpur – Destination mall/multiplex in the heart of the city
Indiabulls Power (IBPOW)
22
� Plan -
Developing 5,400 MW across India.
Financial closure achieved for entire 5,400 MW.
� Execution -
Indiabulls Power (IBPOW) Focus on Delivery and Execution
� Execution -
US $6.1 billion capex over next 4 years for 5,400 MW. Phase I (2,700 MW) – construction
in full swing (~5,000 workers on site)
� For both Phases (entire 5,400 MW) -
Land, Water and Coal clearances in place
� No External Risk/No Quality Risk
As work given to reputed contractors/suppliers. Indiabulls Power is largest private sector
client of BHEL
23
As work given to reputed contractors/suppliers. Indiabulls Power is largest private sector
client of BHEL
� Results
Annual run-rate 20 billion units of electricity generation to be achieved by March 13 and 40
billion units of annual run-rate to be achieved by March 14
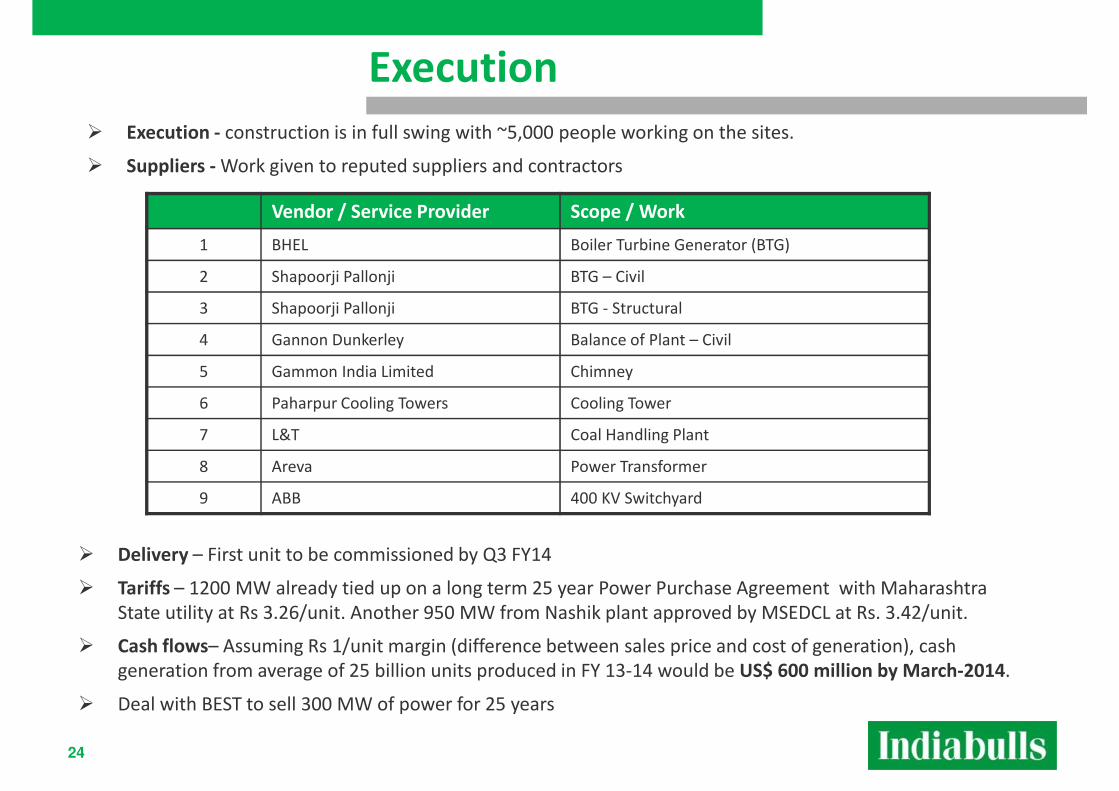
� Execution - construction is in full swing with ~5,000 people working on the sites.
� Suppliers - Work given to reputed suppliers and contractors
Vendor / Service Provider Scope / Work
1 BHEL Boiler Turbine Generator (BTG)
Execution
2 Shapoorji Pallonji BTG – Civil
3 Shapoorji Pallonji BTG - Structural
4 Gannon Dunkerley Balance of Plant – Civil
5 Gammon India Limited Chimney
6 Paharpur Cooling Towers Cooling Tower
7 L&T Coal Handling Plant
8 Areva Power Transformer
9 ABB 400 KV Switchyard
24
� Delivery – First unit to be commissioned by Q3 FY14
� Tariffs – 1200 MW already tied up on a long term 25 year Power Purchase Agreement with Maharashtra
State utility at Rs 3.26/unit. Another 950 MW from Nashik plant approved by MSEDCL at Rs. 3.42/unit.
� Cash flows– Assuming Rs 1/unit margin (difference between sales price and cost of generation), cash
generation from average of 25 billion units produced in FY 13-14 would be US$ 600 million by March-2014.
� Deal with BEST to sell 300 MW of power for 25 years
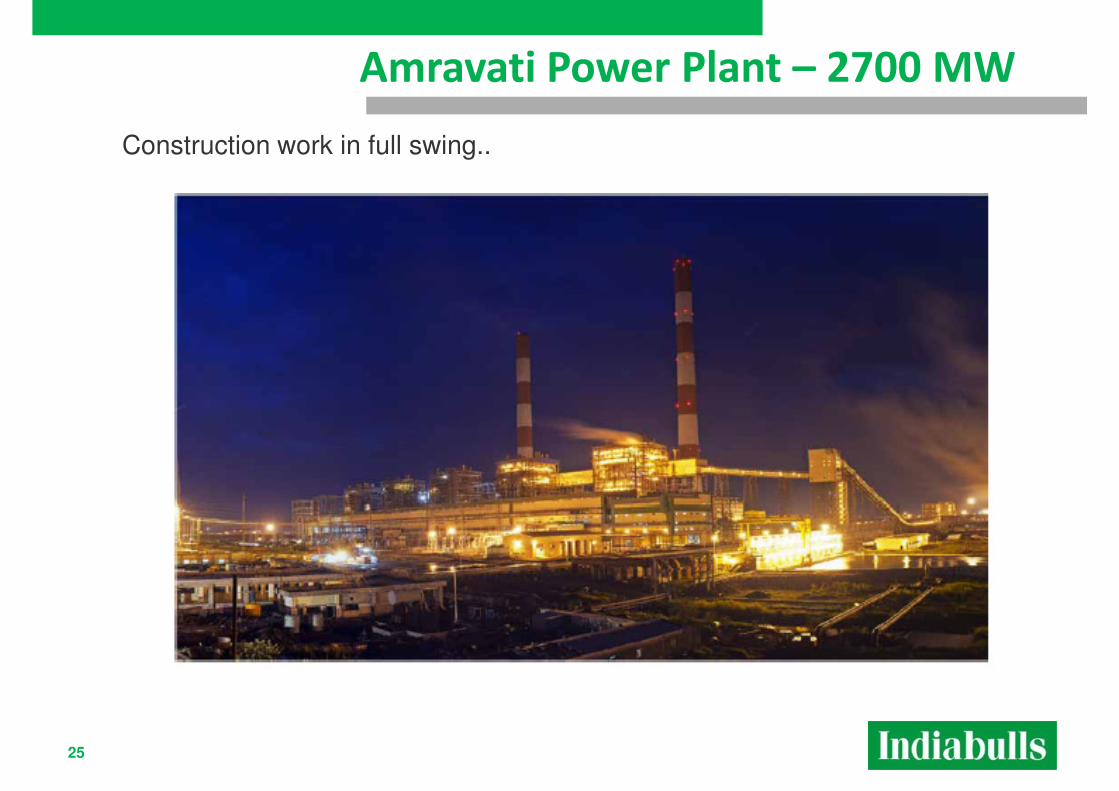
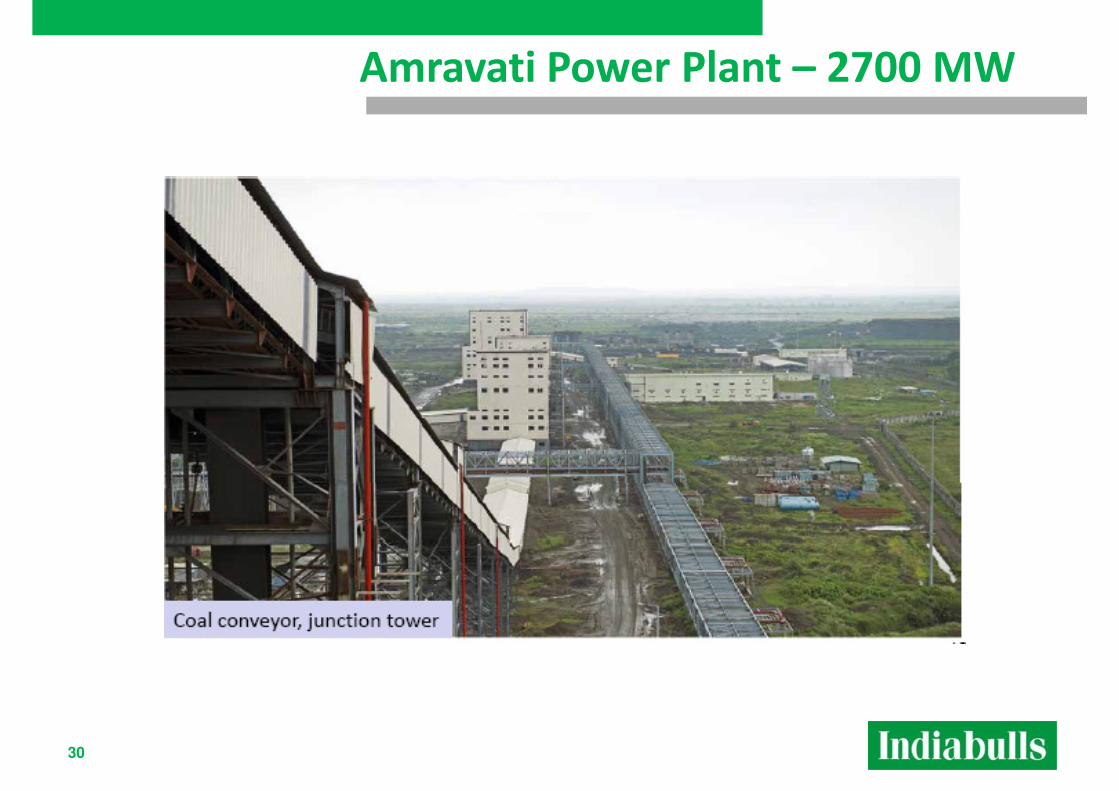
Amravati Power Plant – 2700 MW
Construction work in full swing..
25
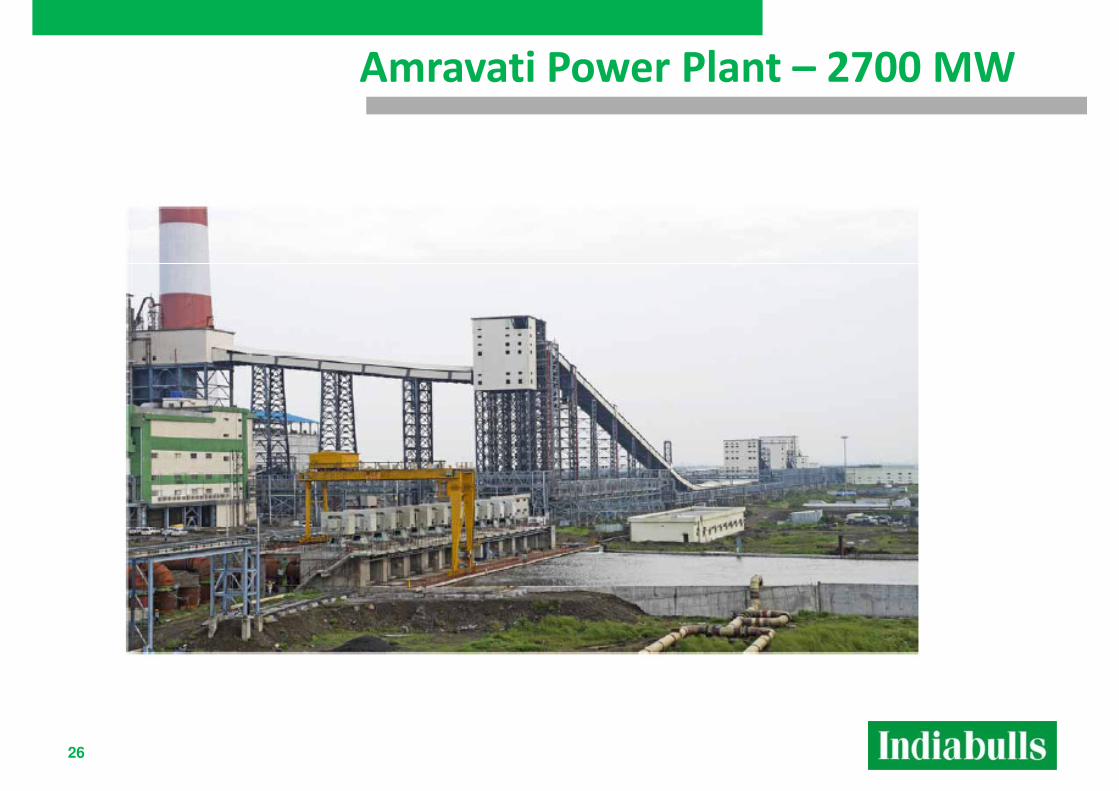
Amravati Power Plant – 2700 MW
26
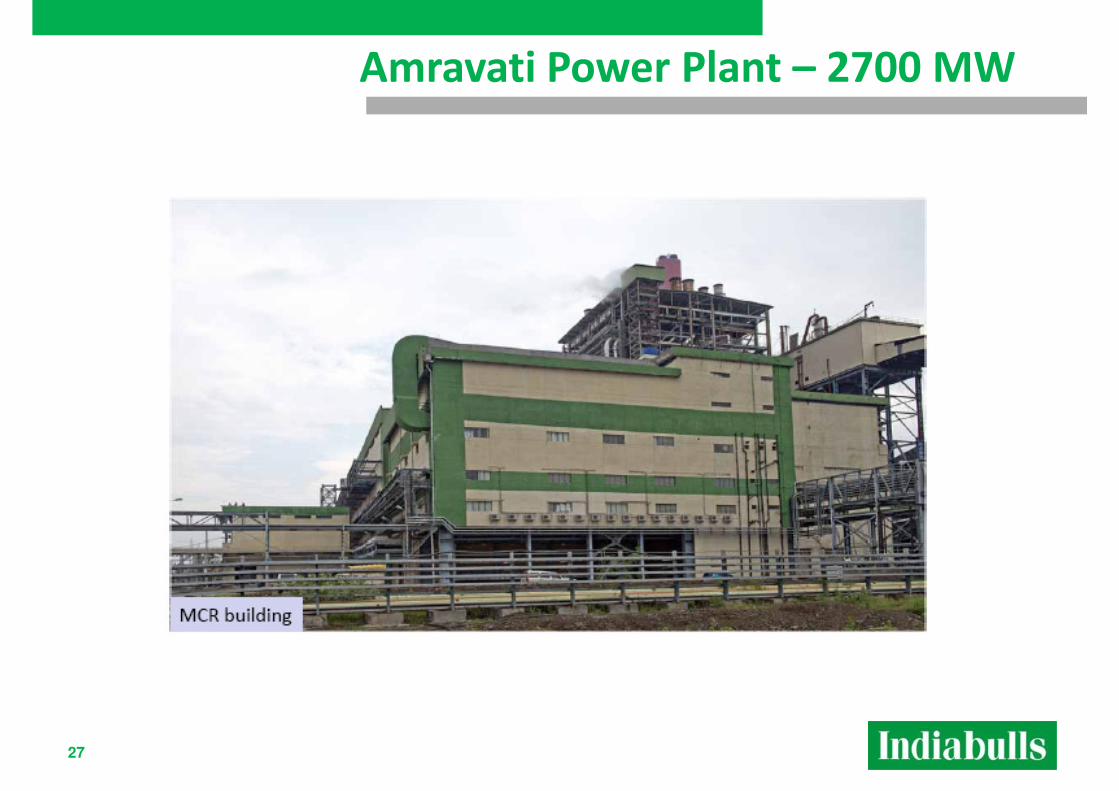
Amravati Power Plant – 2700 MW
27
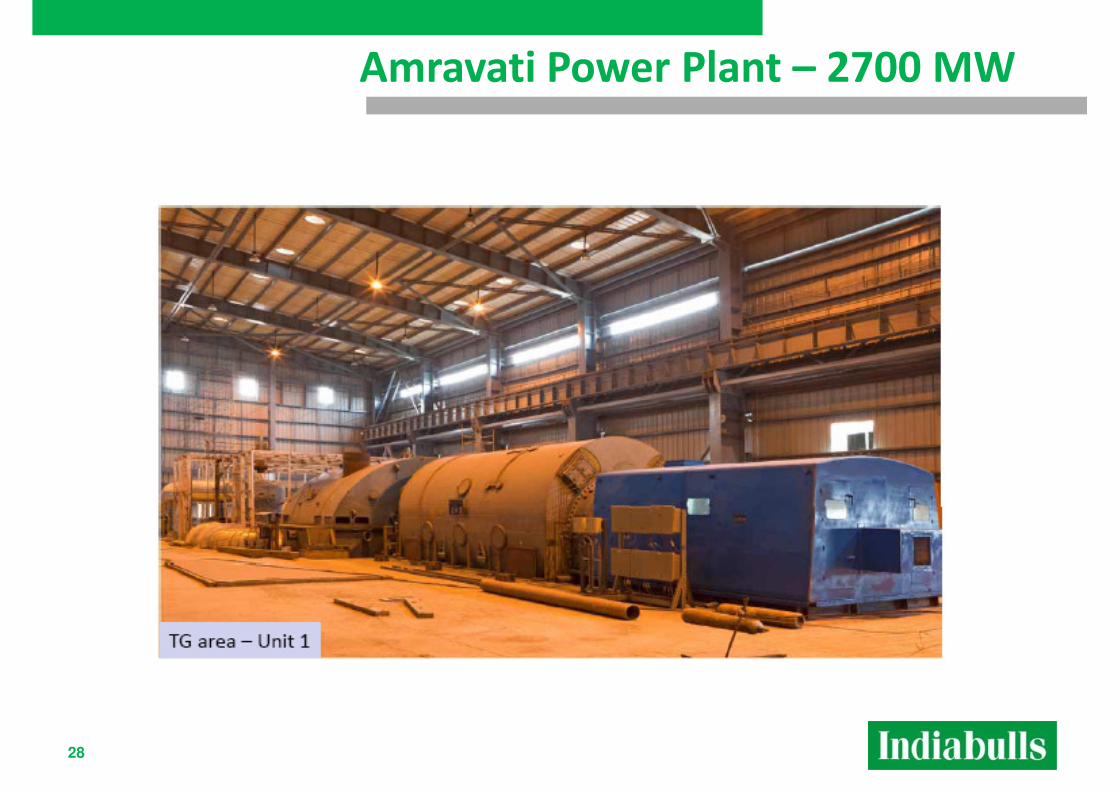
Amravati Power Plant – 2700 MW
28
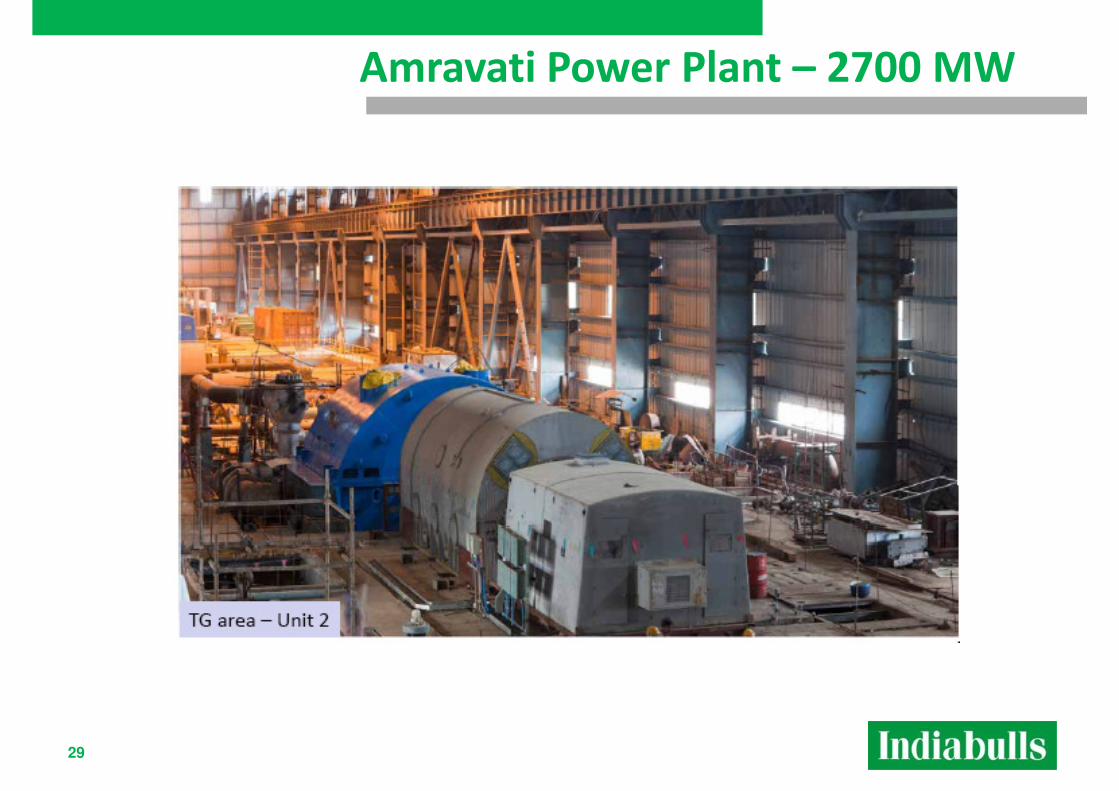
Amravati Power Plant – 2700 MW
29
Amravati Power Plant – 2700 MW
30
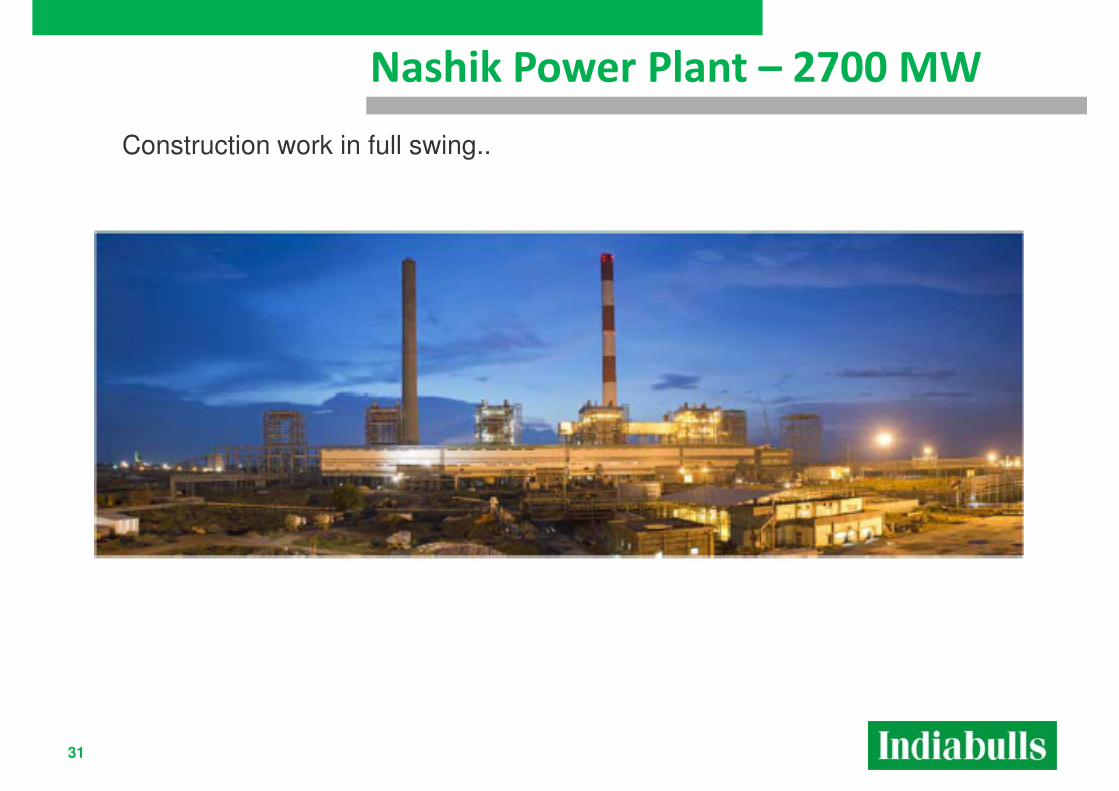
Nashik Power Plant – 2700 MW
Construction work in full swing..
31
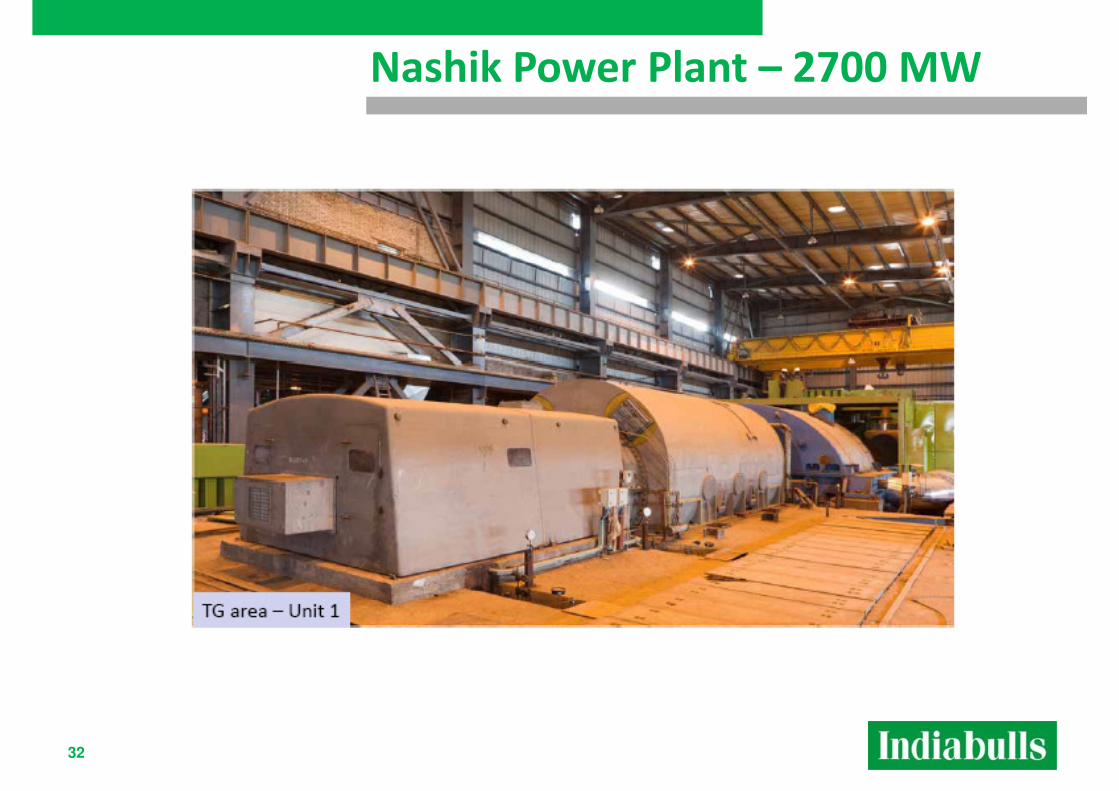
Nashik Power Plant – 2700 MW
32
Nashik Power Plant – 2700 MW
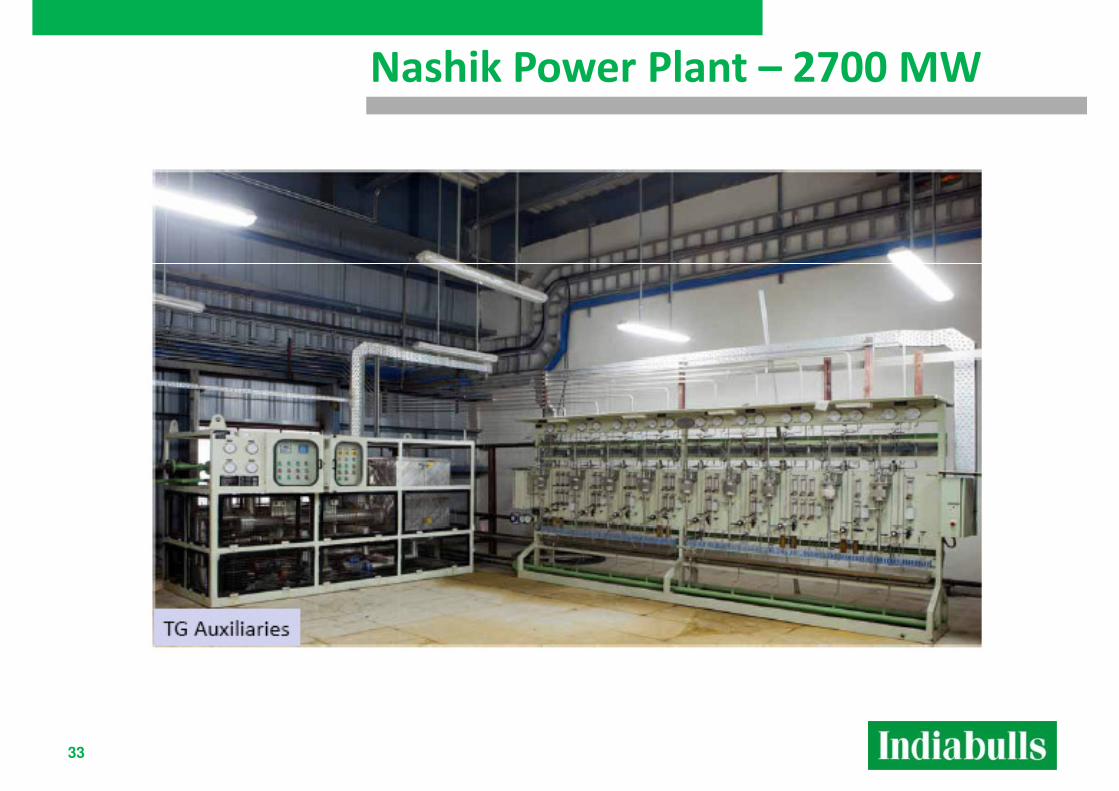
33
Nashik Power Plant – 2700 MW
34
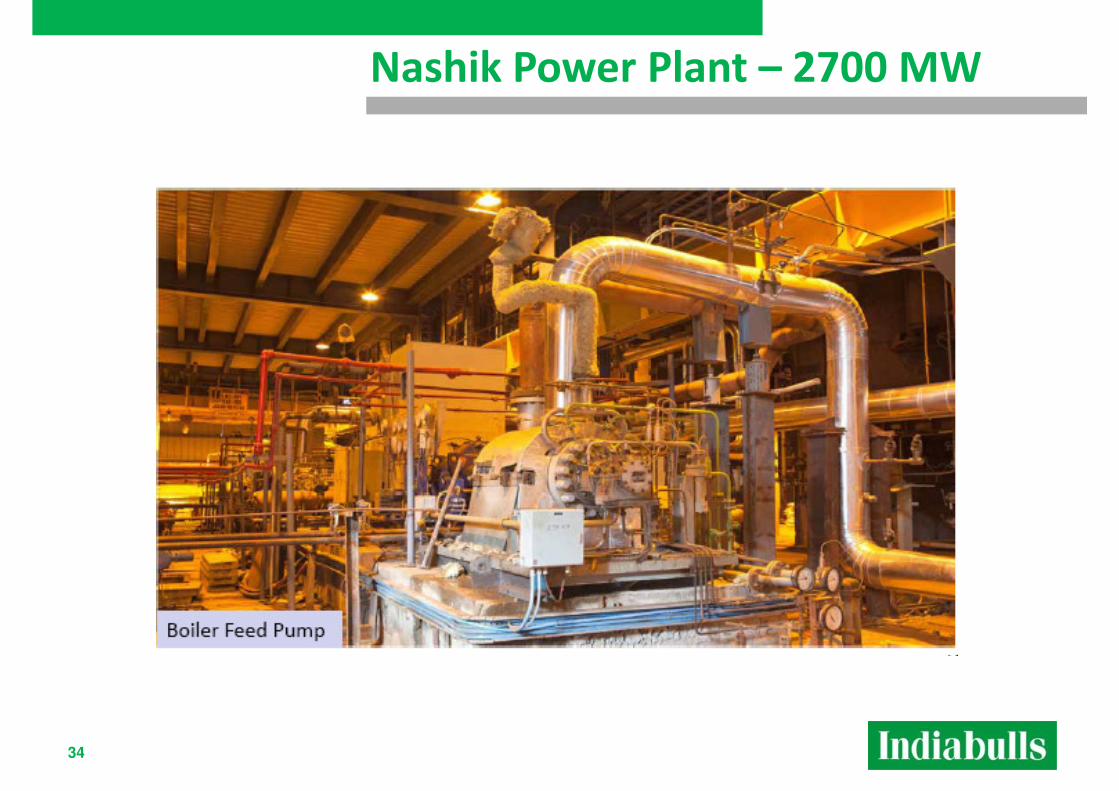
Nashik Power Plant – 2700 MW
35
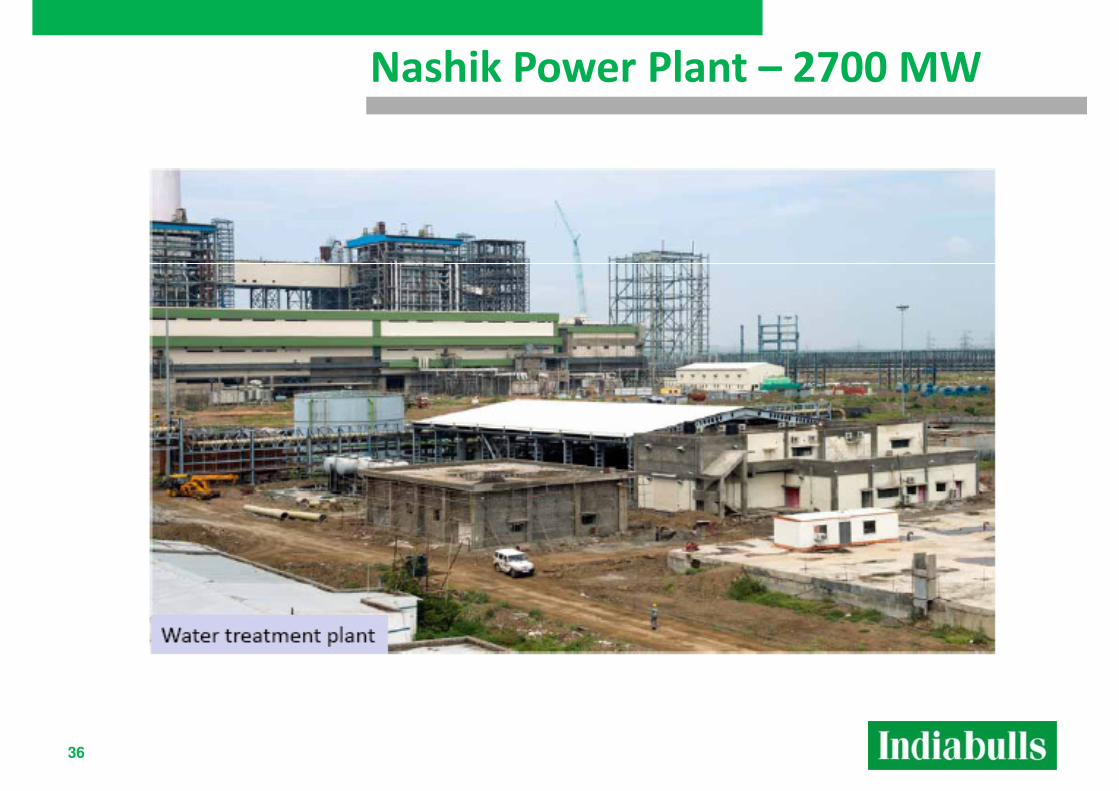
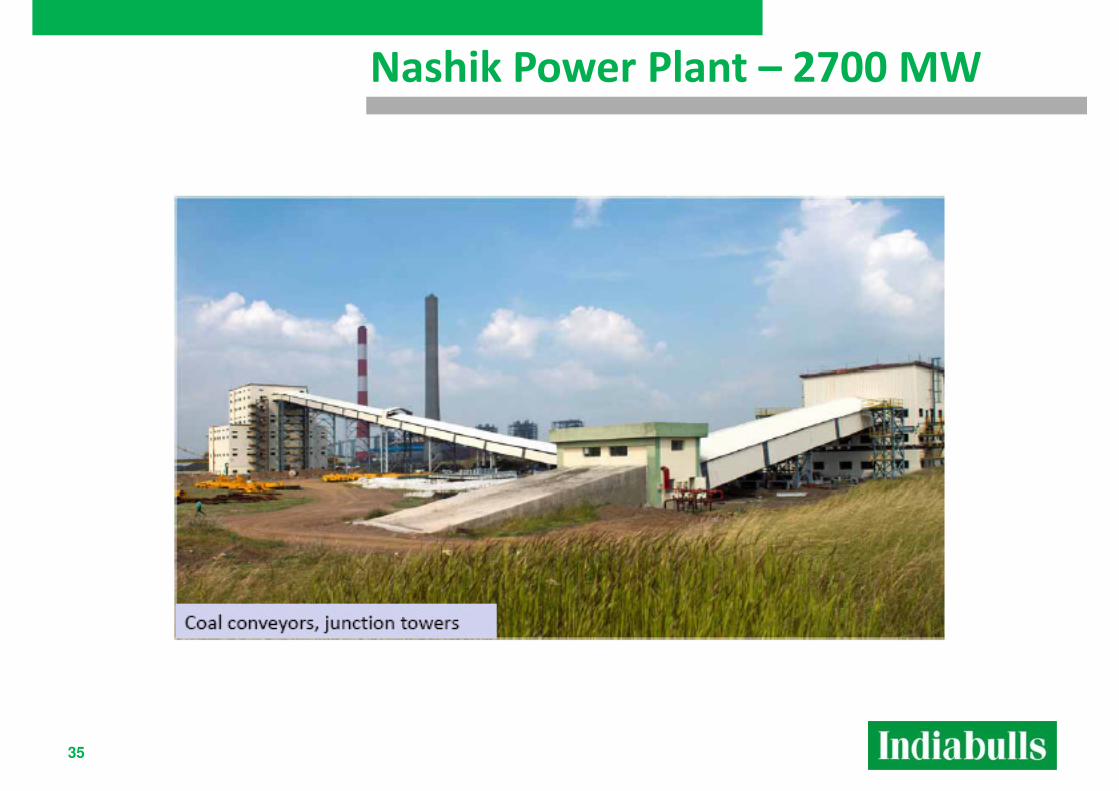
Nashik Power Plant – 2700 MW
36
Thank You
37