india probiotic market forecast and opportunities, 2019
DESCRIPTION
Increasing health consciousness among consumers and rising trend for fortified food is driving sales of Probiotic products in IndiaTRANSCRIPT
India Probiotic Market Forecast & Opportunities , 2019
M a r k e t . I n t e l l i g e n c e . E x p e r t s
I n d u s t r y B r i e f
© TechSci Research
2
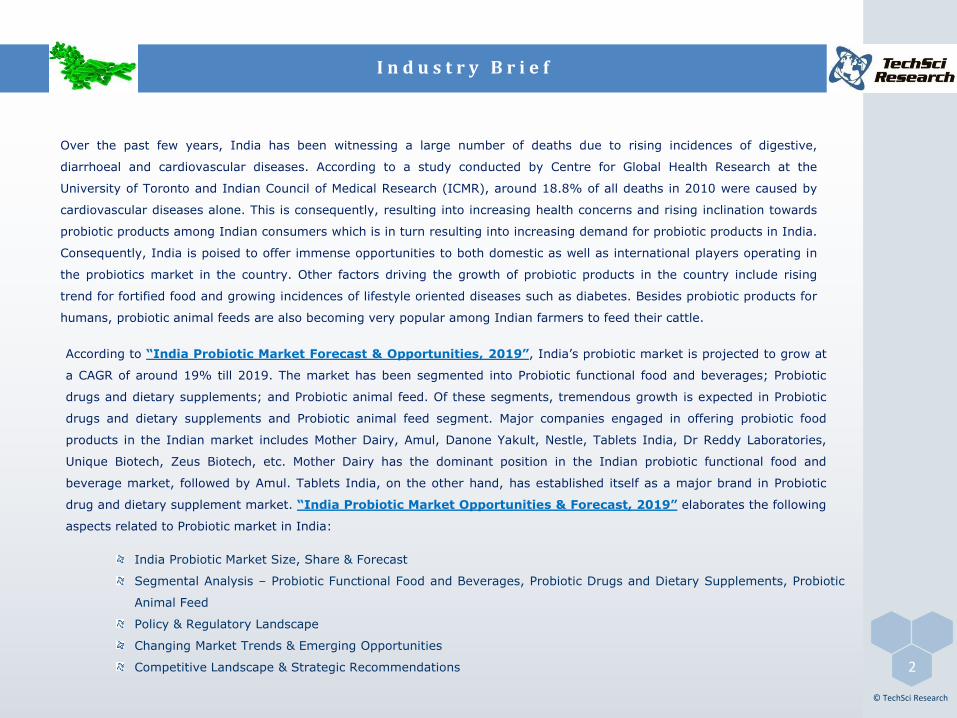
Over the past few years, India has been witnessing a large number of deaths due to rising incidences of digestive,
diarrhoeal and cardiovascular diseases. According to a study conducted by Centre for Global Health Research at the
University of Toronto and Indian Council of Medical Research (ICMR), around 18.8% of all deaths in 2010 were caused by
cardiovascular diseases alone. This is consequently, resulting into increasing health concerns and rising inclination towards
probiotic products among Indian consumers which is in turn resulting into increasing demand for probiotic products in India.
Consequently, India is poised to offer immense opportunities to both domestic as well as international players operating in
the probiotics market in the country. Other factors driving the growth of probiotic products in the country include rising
trend for fortified food and growing incidences of lifestyle oriented diseases such as diabetes. Besides probiotic products for
humans, probiotic animal feeds are also becoming very popular among Indian farmers to feed their cattle.
According to “India Probiotic Market Forecast & Opportunities, 2019”, India’s probiotic market is projected to grow at
a CAGR of around 19% till 2019. The market has been segmented into Probiotic functional food and beverages; Probiotic
drugs and dietary supplements; and Probiotic animal feed. Of these segments, tremendous growth is expected in Probiotic
drugs and dietary supplements and Probiotic animal feed segment. Major companies engaged in offering probiotic food
products in the Indian market includes Mother Dairy, Amul, Danone Yakult, Nestle, Tablets India, Dr Reddy Laboratories,
Unique Biotech, Zeus Biotech, etc. Mother Dairy has the dominant position in the Indian probiotic functional food and
beverage market, followed by Amul. Tablets India, on the other hand, has established itself as a major brand in Probiotic
drug and dietary supplement market. “India Probiotic Market Opportunities & Forecast, 2019” elaborates the following
aspects related to Probiotic market in India:
India Probiotic Market Size, Share & Forecast
Segmental Analysis – Probiotic Functional Food and Beverages, Probiotic Drugs and Dietary Supplements, Probiotic
Animal Feed
Policy & Regulatory Landscape
Changing Market Trends & Emerging Opportunities
Competitive Landscape & Strategic Recommendations
T a b l e o f C o n t e n t s
© TechSci Research
3
1. Research Methodology
2. Analyst View
3. Global Probiotic Market Overview
4. India Nutraceuticals Market Overview
5. India Probiotic Market Outlook
5.1. Market Size & Forecast
5.1.1. By Value
5.2. Market Share & Forecast
5.2.1. By Type
5.2.2. By Company
5.2.3. By Region
5.2.4. By Age
5.2.5. By Point of Sale
6. India Probiotic Functional Food & Beverage Market Outlook
6.1. Market Size & Forecast
6.1.1. By Value
6.1.2. By Volume
6.2. Market Share & Forecast
6.2.1. By Region
6.2.2. By Company
6.3. Price Point Analysis
6.4. Competition Outlook
7. India Probiotic Drugs & Dietary Supplements Market Outlook
T a b l e o f C o n t e n t s C o n t d .
© TechSci Research
4
7.1. Market Size & Forecast
7.1.1. By Value
7.1.2. By Volume
7.2 Market Share & Forecast
7.2.1. By Region
7.2.2. By Company
7.3. Price Point Analysis
7.4. Competition Outlook
8. India Probiotic Animal Feed Market Outlook
8.1 Market Size & Forecast
8.1.1. By Value
8.1.2. By Volume
8.2 Market Share & Forecast
8.2.1. By Region
8.3. Price Point Analysis
8.4. Competition Outlook
9. Trade Dynamics
10. Supply Chain Analysis
11. Market Dynamics
11.1. Drivers
11.2. Challenges
12. Market Trends
12.1. Fortified Foods
T a b l e o f C o n t e n t s C o n t d .
© TechSci Research
5
12.2. Encapsulation
12.3. Marketing Initiatives
12.4. Entry of Foreign Players
12.5. Increasing Poultry Business
12.6. Probiotic Cultures
13. Policy & Regulatory Landscape
14. India Economic Profile
15. Comparative Landscape
16. Company Profiles
16.1. Mother Dairy
16.2. Amul India
16.3. Yakult Danone India (P) Ltd.
16.4. Nestle India Ltd.
16.5. USV India
16.6. Tablets India Ltd.
16.7. Polchem Hygiene Laboratories (P) Ltd.
16.8. Karnataka Milk Federation
16.9. Unique Biotech Ltd.
16.10. Dr. Reddy’s Laboratories Ltd.
17. Strategic Recommendations
18. Annexure
18.1. Sample Questionnaire
19. About Us & Disclaimer
L i s t o f F i g u r e s
© TechSci Research
6
• Figure 1: Global Probiotics Market Size, By Value, 2009-2019F (USD Billion)
• Figure 2: lndia Nutraceuticals Market Size, By Value, 2009-2019F (USD Billion)
• Figure 3: India Probiotics Market Size, By Value, 2009-2019F (USD Million)
• Figure 4: People Suffering from Lifestyle Oriented Diseases in India, By Gender, 2012
• Figure 5: Diabetic Population in Major Countries, 2013 (Million)
• Figure 6: India Probiotic Market Share, By Food Type, By Value, 2013
• Figure 7: India Probiotic Market Share, By Food Type, By Value, 2019F
• Figure 8: India Probiotics Market Share, By Company, By Value, 2013
• Figure 9: India Probiotics Market Share, By Company, By Value, 2019F
• Figure 10: India Probiotic Market Share, By Region, By Volume, 2013 & 2019F
• Figure 11: India Probiotic Market Share, By Age Group, By Volume, 2013
• Figure 12: India Probiotic Market Share, By Age Group, By Volume, 2019F
• Figure 13: India Probiotic Market Share, By Point of Sale, By Volume, 2013
• Figure 14: India Probiotic Market Share, By Point of Sale, By Volume, 2019F
• Figure 15: Number of Supermarkets in India, 2005 & 2011
• Figure 16: Internet Users in India, 2010-2014 (Million)
• Figure 17: India Retail e-commerce Sales, By Value, 2012 -2015F (USD Billion)
• Figure 18: India Probiotic Functional Food & Beverage Market Size, By Value, 2009-2019F (USD Million)
• Figure 19: India Probiotic Functional Food & Beverage Market Size, By Volume, 2009-2019F (Metric Tons)
• Figure 20: India Probiotic Functional Food & Beverage Market Share, By Region, By Volume, 2013 & 2019F
• Figure 21: India Probiotic Functional Food & Beverage Market Share, By Company, By Value, 2013
• Figure 22: India Probiotic Functional Food & Beverage Market Share, By Company, By Value, 2019F
L i s t o f F i g u r e s
© TechSci Research
7
• Figure 23: India Probiotic Drugs and Dietary Supplement Market Size, By Value, 2009-2019F (USD Million)
• Figure 24: India Probiotic Drugs and Dietary Supplement OTC Sales, 2009-2011 (USD Million)
• Figure 25: India Probiotic Drugs and Dietary Supplement OTC Sales, By Type 2009-2011 (USD Million)
• Figure 26: India Probiotic Drug and Dietary Supplement Market Size, By Volume, 2009-2019F (Million Tablets)
• Figure 27: India Probiotic Drug & Dietary Supplement Market Share, By Region, By Volume, 2013 & 2019F
• Figure 28: India Probiotic Drugs & Dietary Supplement Market Share, By Type, By Value, 2013
• Figure 29: India Probiotic Drugs & Dietary Supplement Market Share, By Type, By Value, 2019F
• Figure 30: India Probiotic Animal Feed Market Size, By Value, 2009-2019F (USD Million)
• Figure 31: India Probiotic Animal Feed Market Size, By Volume, 2009-2019F (Million Tons)
• Figure 32: India Probiotic Animal Feed Market Share, By Region, By Volume, 2013 & 2019F
• Figure 33: India Probiotic Import Value, 2009 – 2013 (USD Million)
• Figure 34: India Probiotic Import Volume, 2009 – 2013 (Tons)
• Figure 35: India Probiotic Products Import Share, By Country, By Value, 2013-14
• Figure 36: India Probiotic Products Import Share, By Country, By Volume, 2013-14
• Figure 37: India Probiotic Export Market Size, By Value, 2009 – 2013 (USD Million)
• Figure 38: India Probiotic Export Market Size, By Volume, 2009 – 2013 (Tons)
• Figure 39: India Probiotic Products Export Share, By Country, By Value, 2013-14
• Figure 40: India Probiotic Products Export Share, By Country, By Volume, 2013-14
• Figure 41: India Probiotic Market Supply Chain
• Figure 42: India Disposable Income, 2010 – 2014 (USD Million)
• Figure 43: India Diabetic Patient Population, 2013 & 2030F (Million)
• Figure 44: India Retail Sales, 2008 – 2016F (USD Billion)
L i s t o f F i g u r e s
© TechSci Research
8
• Figure 45: India Meat Production, By Meat Type, 2009 & 2010 (Thousand Metric Tons)
• Figure 46: India Meat Consumption, By Meat Type, 2009 & 2010 (Thousand Metric Tons)
• Figure 47: Amul Probiotic Share in Total Ice Cream Sales, 2013
• Figure 48: Amul Probiotic Share in Total Yogurt Sales, 2013
L i s t o f T a b l e s
© TechSci Research
9
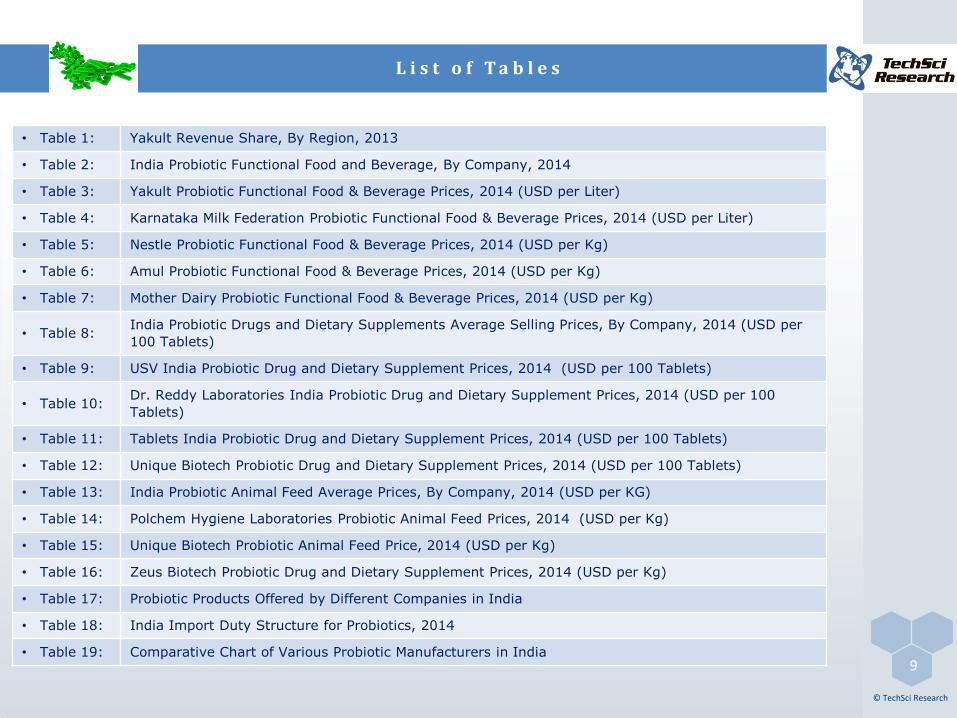
• Table 1: Yakult Revenue Share, By Region, 2013
• Table 2: India Probiotic Functional Food and Beverage, By Company, 2014
• Table 3: Yakult Probiotic Functional Food & Beverage Prices, 2014 (USD per Liter)
• Table 4: Karnataka Milk Federation Probiotic Functional Food & Beverage Prices, 2014 (USD per Liter)
• Table 5: Nestle Probiotic Functional Food & Beverage Prices, 2014 (USD per Kg)
• Table 6: Amul Probiotic Functional Food & Beverage Prices, 2014 (USD per Kg)
• Table 7: Mother Dairy Probiotic Functional Food & Beverage Prices, 2014 (USD per Kg)
• Table 8:India Probiotic Drugs and Dietary Supplements Average Selling Prices, By Company, 2014 (USD per
100 Tablets)
• Table 9: USV India Probiotic Drug and Dietary Supplement Prices, 2014 (USD per 100 Tablets)
• Table 10:Dr. Reddy Laboratories India Probiotic Drug and Dietary Supplement Prices, 2014 (USD per 100
Tablets)
• Table 11: Tablets India Probiotic Drug and Dietary Supplement Prices, 2014 (USD per 100 Tablets)
• Table 12: Unique Biotech Probiotic Drug and Dietary Supplement Prices, 2014 (USD per 100 Tablets)
• Table 13: India Probiotic Animal Feed Average Prices, By Company, 2014 (USD per KG)
• Table 14: Polchem Hygiene Laboratories Probiotic Animal Feed Prices, 2014 (USD per Kg)
• Table 15: Unique Biotech Probiotic Animal Feed Price, 2014 (USD per Kg)
• Table 16: Zeus Biotech Probiotic Drug and Dietary Supplement Prices, 2014 (USD per Kg)
• Table 17: Probiotic Products Offered by Different Companies in India
• Table 18: India Import Duty Structure for Probiotics, 2014
• Table 19: Comparative Chart of Various Probiotic Manufacturers in India
R e s e a r c h M e t h o d o l o g y C o n t d .
10
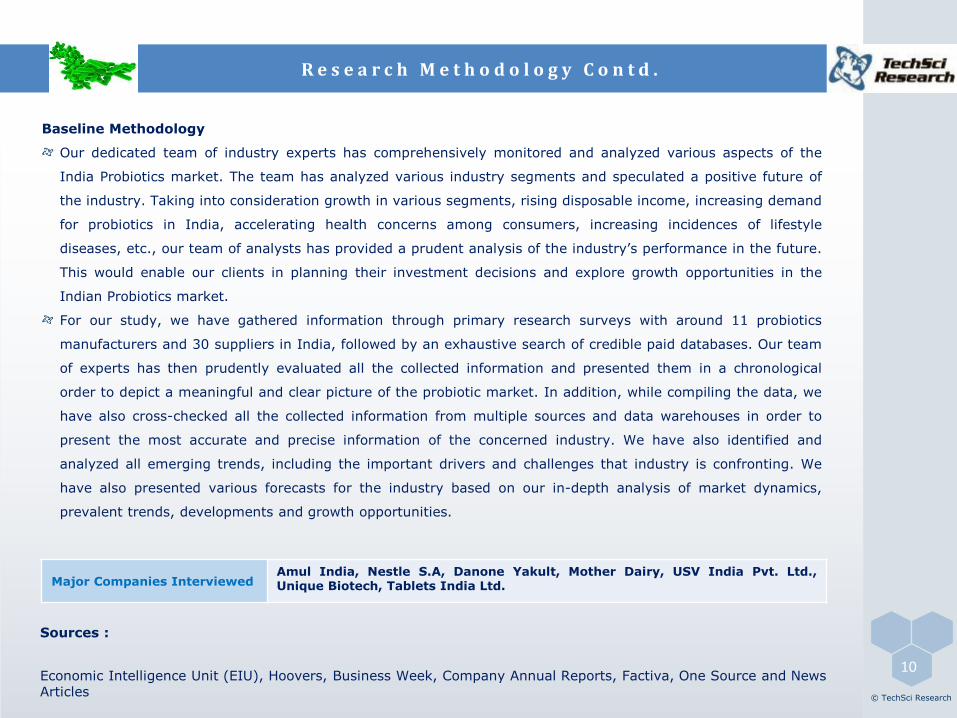
Baseline Methodology
Our dedicated team of industry experts has comprehensively monitored and analyzed various aspects of the
India Probiotics market. The team has analyzed various industry segments and speculated a positive future of
the industry. Taking into consideration growth in various segments, rising disposable income, increasing demand
for probiotics in India, accelerating health concerns among consumers, increasing incidences of lifestyle
diseases, etc., our team of analysts has provided a prudent analysis of the industry’s performance in the future.
This would enable our clients in planning their investment decisions and explore growth opportunities in the
Indian Probiotics market.
For our study, we have gathered information through primary research surveys with around 11 probiotics
manufacturers and 30 suppliers in India, followed by an exhaustive search of credible paid databases. Our team
of experts has then prudently evaluated all the collected information and presented them in a chronological
order to depict a meaningful and clear picture of the probiotic market. In addition, while compiling the data, we
have also cross-checked all the collected information from multiple sources and data warehouses in order to
present the most accurate and precise information of the concerned industry. We have also identified and
analyzed all emerging trends, including the important drivers and challenges that industry is confronting. We
have also presented various forecasts for the industry based on our in-depth analysis of market dynamics,
prevalent trends, developments and growth opportunities.
Major Companies InterviewedAmul India, Nestle S.A, Danone Yakult, Mother Dairy, USV India Pvt. Ltd.,Unique Biotech, Tablets India Ltd.
Sources :
Economic Intelligence Unit (EIU), Hoovers, Business Week, Company Annual Reports, Factiva, One Source and News Articles
© TechSci Research
S a m p l e D a t a - S n a p s h o t
11
© TechSci Research
X%
1020
3040
5060
7080
90100
110
CAGR: X%
CAGR: X%
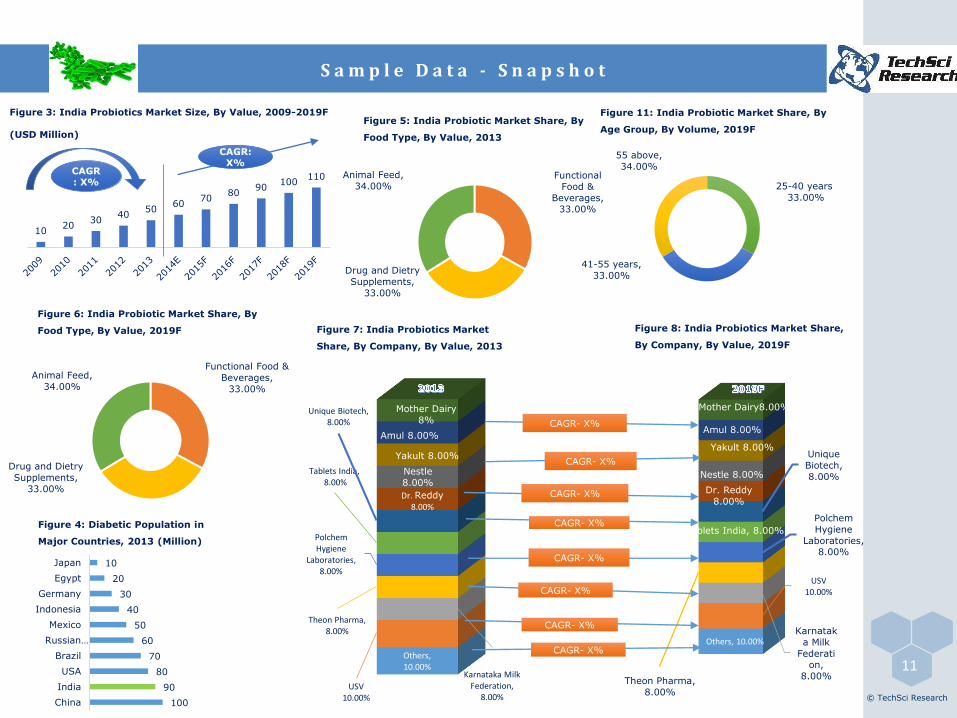
Figure 3: India Probiotics Market Size, By Value, 2009-2019F
(USD Million)
Functional
Food &
Beverages, 33.00%
Drug and Dietry
Supplements,
33.00%
Animal Feed,
34.00%
Figure 5: India Probiotic Market Share, By
Food Type, By Value, 2013
100
90
80
70
60
50
40
30
20
10
China
India
USA
Brazil
Russian…
Mexico
Indonesia
Germany
Egypt
Japan
Figure 4: Diabetic Population in
Major Countries, 2013 (Million)
Functional Food &
Beverages,
33.00%
Drug and Dietry
Supplements,
33.00%
Animal Feed,
34.00%
Figure 6: India Probiotic Market Share, By
Food Type, By Value, 2019F
Others, 10.00%
USV 10.00%
Karnataka Milk Federation,
8.00%
Theon Pharma, 8.00%
Polchem Hygiene
Laboratories, 8.00%
Tablets India,8.00%
Unique Biotech, 8.00%
Dr. Reddy
8.00%
Nestle
8.00%
Yakult 8.00%
Amul 8.00%
Mother Dairy
8%
Others, 10.00%
USV 10.00%
Karnatak
a Milk
Federation,
8.00%Theon Pharma,
8.00%
Polchem
Hygiene
Laboratories, 8.00%
Tablets India, 8.00%
Unique
Biotech,
8.00%
Dr. Reddy
8.00%
Nestle 8.00%
Yakult 8.00%
Amul 8.00%
Mother Dairy8.00%
CAGR- X%
CAGR- X%
CAGR- X%
CAGR- X%
CAGR- X%
CAGR- X%
CAGR- X%
CAGR- X%
Figure 7: India Probiotics Market
Share, By Company, By Value, 2013
Figure 8: India Probiotics Market Share,
By Company, By Value, 2019F
25-40 years
33.00%
41-55 years,
33.00%
55 above,
34.00%
Figure 11: India Probiotic Market Share, By
Age Group, By Volume, 2019F
R e p o r t O r d e r i n g
12
© TechSci Research
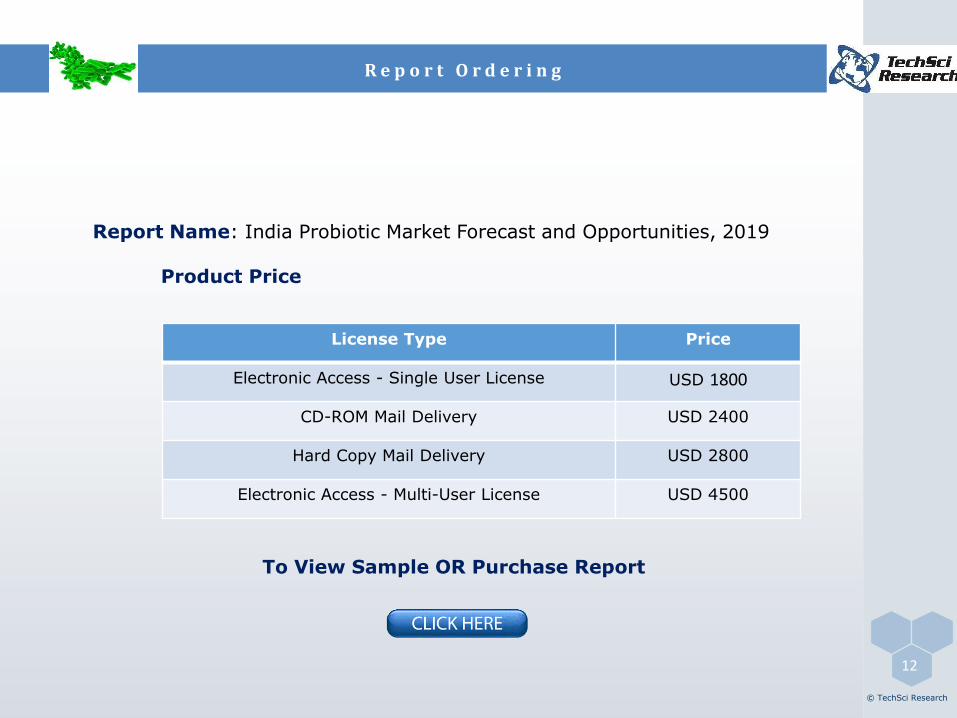
Report Name: India Probiotic Market Forecast and Opportunities, 2019
Product Price
To View Sample OR Purchase Report
License Type Price
Electronic Access - Single User License USD 1800
CD-ROM Mail Delivery USD 2400
Hard Copy Mail Delivery USD 2800
Electronic Access - Multi-User License USD 4500
A b o u t U s & D i s c l a i m e r
13
TechSci Research – North America
2950, Boundary Road, Burnaby,
British Columbia, Canada
Tel: +1- 646- 360-1656
Email: [email protected]
www.techsciresearch.com
About Us :
TechSci Research is a global market research and consulting company with offices in Canada, the UK and India. TechSci Research
provides market research reports in a number of areas to organizations. The company uses innovative business models that focus on
improving productivity, while ensuring creation of high-quality reports. The proprietary forecasting models use various analyses of both
industry-specific and macroeconomic variables on a state-by-state basis to produce a unique ‘bottom-up’ model of a country, regional
and global industry prospects. Combined with the detailed analysis of company activity and industry trends, the result is a uniquely rich
evaluation of the opportunities available in the market.
Reports on Consumer Goods
India Organic Food Market Forecast & Opportunities, 2019
Australia Pet Food Market Forecast & Opportunities, 2019
UAE Chocolate Market Forecast & Opportunities, 2019
Partial List of Clients
Disclaimer :
The contents of this report are based on information generally available to the public from sources believed to be reliable. No representation is made thatit is timely, accurate or complete. TechSci Research has taken due care and caution in compilation of data as this has been obtained from various sourcesincluding which it considers reliable and first hand. However, TechSci Research does not guarantee the accuracy, adequacy or completeness of anyinformation and it is not responsible for any errors or omissions or for the results obtained from the use of such information and especially states that ithas no financial liability whatsoever to the subscribers / users of this report. The information herein, together with all estimates and forecasts, can changewithout notice. All the figures provided in this document are indicative of relative market size and are strictly for client’s internal consumption. Usage ofthe same for purpose other than internal will require prior approval of TechSci Research.
TechSci Research – Europe
54, Oldbrook, Bretton,
Peterborough,
United Kingdom
Email: [email protected]
www.techsciresearch.com
TechSci Research – Asia-Pacific
A – 51, Sector -57, Noida, National
Capital Region, U.P. - India
Tel: +91-120-4243434
Email: [email protected]
www.techsciresearch.com© TechSci Research