india people meter update - vii - december 2009
TRANSCRIPT
8/6/2019 India People Meter Update - VII - December 2009
http://slidepdf.com/reader/full/india-people-meter-update-vii-december-2009 1/7
India Peoplemeter Update – VII v1.0
December 2009 Page 1 of 7
India Peoplemeter Update – VII
Universe Update 2010
Includes new digital 2010 estimates
(Urban and Rural)
8/6/2019 India People Meter Update - VII - December 2009
http://slidepdf.com/reader/full/india-people-meter-update-vii-december-2009 2/7
India Peoplemeter Update – VII v1.0
December 2009 Page 2 of 7
I. The year that was
TAM undertook several initiatives in 2009 aimed at aiding better planning and
implementation. Some of the initiatives were:
a) Introduction of a ‘semi-urban’ market - Maharashtra Less-than-Class1
b) Introduction Bihar and Assam
c) Local market reporting: Extending the list of metros individually reported to
Pune and Ahmedabad in addition to the top 6 metros
d) Splitting markets into finer units like MP and Chattisgarh & Punjab
separately from the PHCHP market-group
e) Updated universe estimates. In particular, updated digital estimates.
We are thankful to the industry for giving us their feedback that helped us
launch these initiatives.
II. Universe estimatesUniverse estimates form the base of all viewership estimates that an audience
measurement company produces. Therefore, producing high quality universe
estimates are central to producing gold-standard viewership estimates. All TAM
software display universe estimates and sample sizes when you run an analysis
on them.
As in the past, TAM continues its efforts in producing updated universe
estimates. This year’s estimation exercise was undertaken across both, Urban and
Rural India involving more than 100,000 face-to-face interviews through astatistically designed stratified random sample survey. Both our parent
companies, IMRB and Nielsen, were involved in this estimation exercise.
Digital Establishment Surveys - (DES)
Special mention may be made of the DES. We commenced our DES in 2007,
when digital was at the threshold of its explosive growth. The DES, now in its
fourth round of release has tracked the growth of digital broadcast ever since its
inception. It is undertaken across Urban and Rural India and captures a wealth
of data on digital subscribers such as platform ownership and source of
awareness of digital.
…P.T.O
8/6/2019 India People Meter Update - VII - December 2009
http://slidepdf.com/reader/full/india-people-meter-update-vii-december-2009 3/7
India Peoplemeter Update – VII v1.0
December 2009 Page 3 of 7
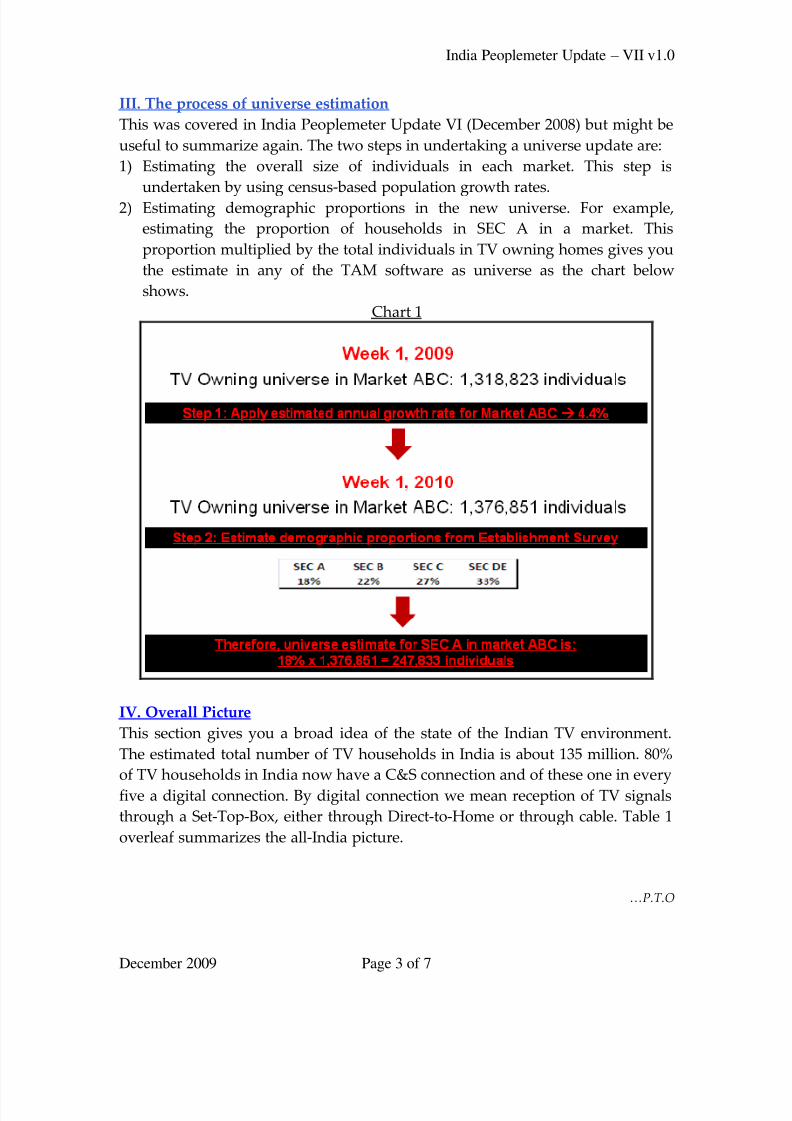
III. The process of universe estimation
This was covered in India Peoplemeter Update VI (December 2008) but might be
useful to summarize again. The two steps in undertaking a universe update are:
1) Estimating the overall size of individuals in each market. This step is
undertaken by using census-based population growth rates.
2) Estimating demographic proportions in the new universe. For example,
estimating the proportion of households in SEC A in a market. This
proportion multiplied by the total individuals in TV owning homes gives you
the estimate in any of the TAM software as universe as the chart below
shows.
Chart 1
IV. Overall Picture
This section gives you a broad idea of the state of the Indian TV environment.
The estimated total number of TV households in India is about 135 million. 80%
of TV households in India now have a C&S connection and of these one in every
five a digital connection. By digital connection we mean reception of TV signals
through a Set-Top-Box, either through Direct-to-Home or through cable. Table 1
overleaf summarizes the all-India picture.
…P.T.O
8/6/2019 India People Meter Update - VII - December 2009
http://slidepdf.com/reader/full/india-people-meter-update-vii-december-2009 4/7
India Peoplemeter Update – VII v1.0
December 2009 Page 4 of 7
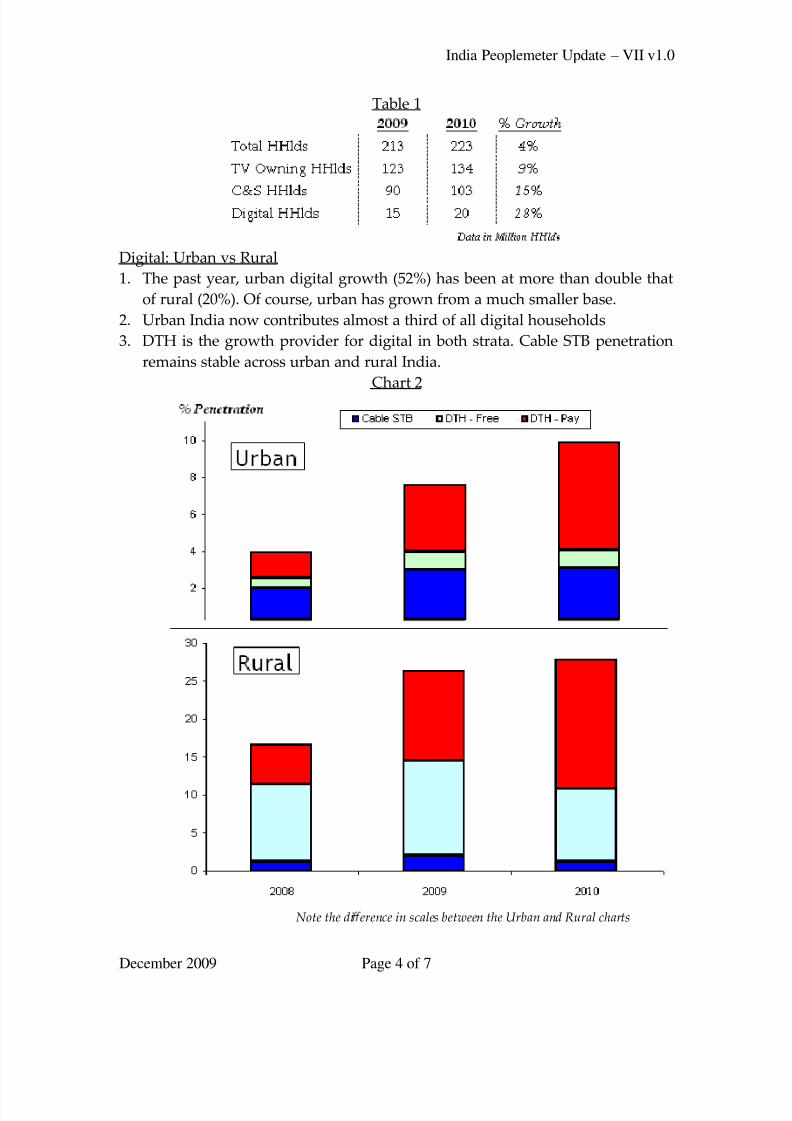
Table 1
Digital: Urban vs Rural
1. The past year, urban digital growth (52%) has been at more than double that
of rural (20%). Of course, urban has grown from a much smaller base.
2. Urban India now contributes almost a third of all digital households
3. DTH is the growth provider for digital in both strata. Cable STB penetration
remains stable across urban and rural India.
Chart 2
Note the di erence in scales between the Urban and Rural charts
8/6/2019 India People Meter Update - VII - December 2009
http://slidepdf.com/reader/full/india-people-meter-update-vii-december-2009 5/7
India Peoplemeter Update – VII v1.0
December 2009 Page 5 of 7
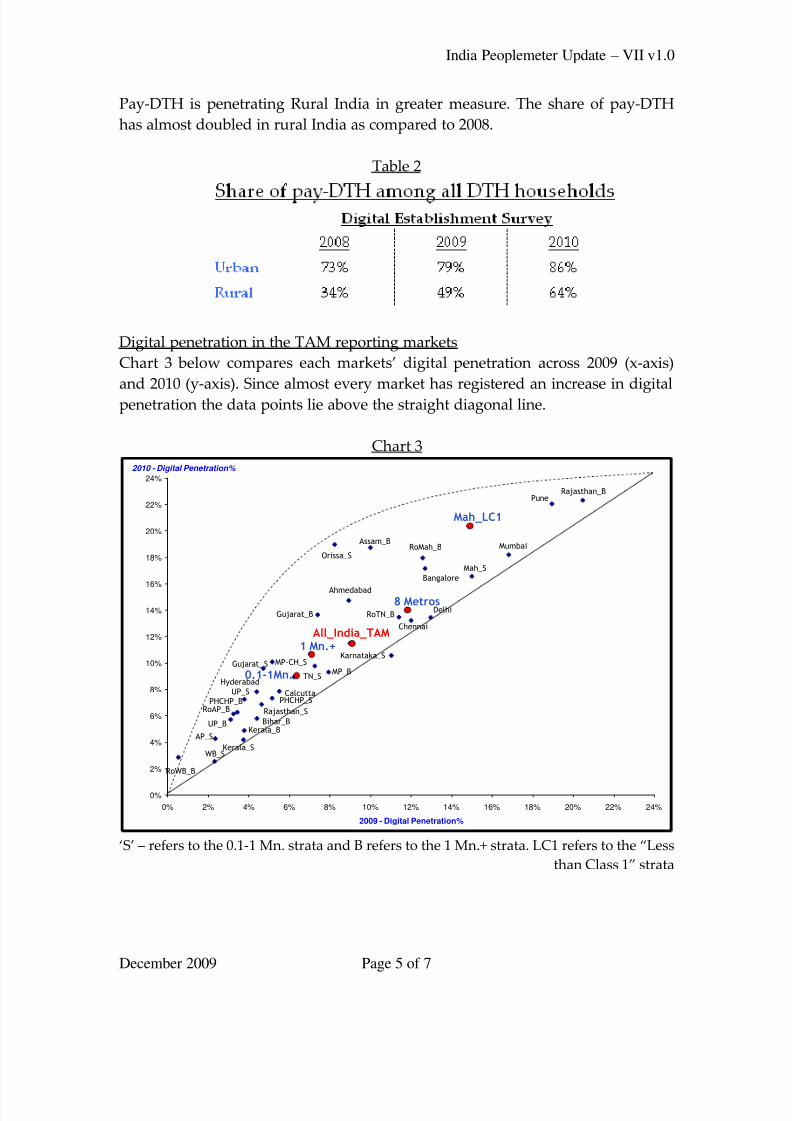
Pay-DTH is penetrating Rural India in greater measure. The share of pay-DTH
has almost doubled in rural India as compared to 2008.
Table 2
Digital penetration in the TAM reporting markets
Chart 3 below compares each markets’ digital penetration across 2009 (x-axis)
and 2010 (y-axis). Since almost every market has registered an increase in digitalpenetration the data points lie above the straight diagonal line.
Chart 3
0.1-1Mn.
1 Mn.+
8 Metros
Rajasthan_BPune
Mumbai
Mah_S
Mah_LC1
Delhi
Bangalore
RoMah_B
Chennai
RoTN_B
Karnataka_S
Assam_B
All_India_TAM
Ahmedabad
Orissa_S
MP_B
Gujarat_B
TN_S
Calcutta
Gujarat_S
PHCHP_S
MP-CH_S
Rajasthan_S
Bihar_B
Hyderabad
UP_S
Kerala_B
Kerala_S
PHCHP_BRoAP_B
UP_B
AP_S
WB_S
RoWB_B
0%
2%
4%
6%
8%
10%
12%
14%
16%
18%
20%
22%
24%
0% 2% 4% 6% 8% 10% 12% 14% 16% 18% 20% 22% 24%
2009 - Digital Penetration%
2010 - Digital Penetration%
‘S’ – refers to the 0.1-1 Mn. strata and B refers to the 1 Mn.+ strata. LC1 refers to the ‚Less
than Class 1‛ strata
8/6/2019 India People Meter Update - VII - December 2009
http://slidepdf.com/reader/full/india-people-meter-update-vii-december-2009 6/7
India Peoplemeter Update – VII v1.0
December 2009 Page 6 of 7
Interestingly, the data show a bow shaped structure. The early adopter markets
that already had a relatively large digital penetration last year (Pune, Rajasthan 1
Mn.+) seem to have achieved stable penetration. On the other hand, those
markets at the other extreme which had a relatively low digital penetration still
continue to be at the bottom. It is the middle markets that have seen tremendous
growth.
Also, within urban markets, the larger strata have a higher penetration. This is to
do with factors like increasing consumer demand for select content.
There are other interesting findings that the DES gives us. For a more detailed
look, please follow the link below and download the presentation. The
presentation also explains the implications of the universe update from a
software and analysis perspective.
http://www.tamindia.com/tamindia/NL_Tam/Overview-universe_update-2010.pdf
Some of you may also want to know how TAM captures digital broadcast
signals. You can get an understanding of this from this link:mms://lms.tamindia.com/tvm508
V. Summary
C&S households have crossed 100 million. Undoubtedly, the growth of digital
platforms have contributed to the growth in C&S, especially in places like rural
where infrastructure has been an obstacle to cable growth. As specialized
viewing options are available to the consumer, urban markets are also poised toshow large growth rates.
The Digital Establishment Surveys enable us to look at this phenomenon across
four rounds (years) of data helping the industry - whether advertiser, platform
operator, broadcaster or agency in maximising their RoI. As always, we at TAM
will ensure that you are kept updated with the latest facts and insights.
For any assistance that you may require, please do not hesitate to contact your
friendly neighbourhood TAM representative. You can also call us on:+91 22 66531200 (Mumbai)
+91 11 46021500 (Delhi)
Please continue to give us your feedback – we value it!
8/6/2019 India People Meter Update - VII - December 2009
http://slidepdf.com/reader/full/india-people-meter-update-vii-december-2009 7/7
India Peoplemeter Update – VII v1.0
December 2009 Page 7 of 7
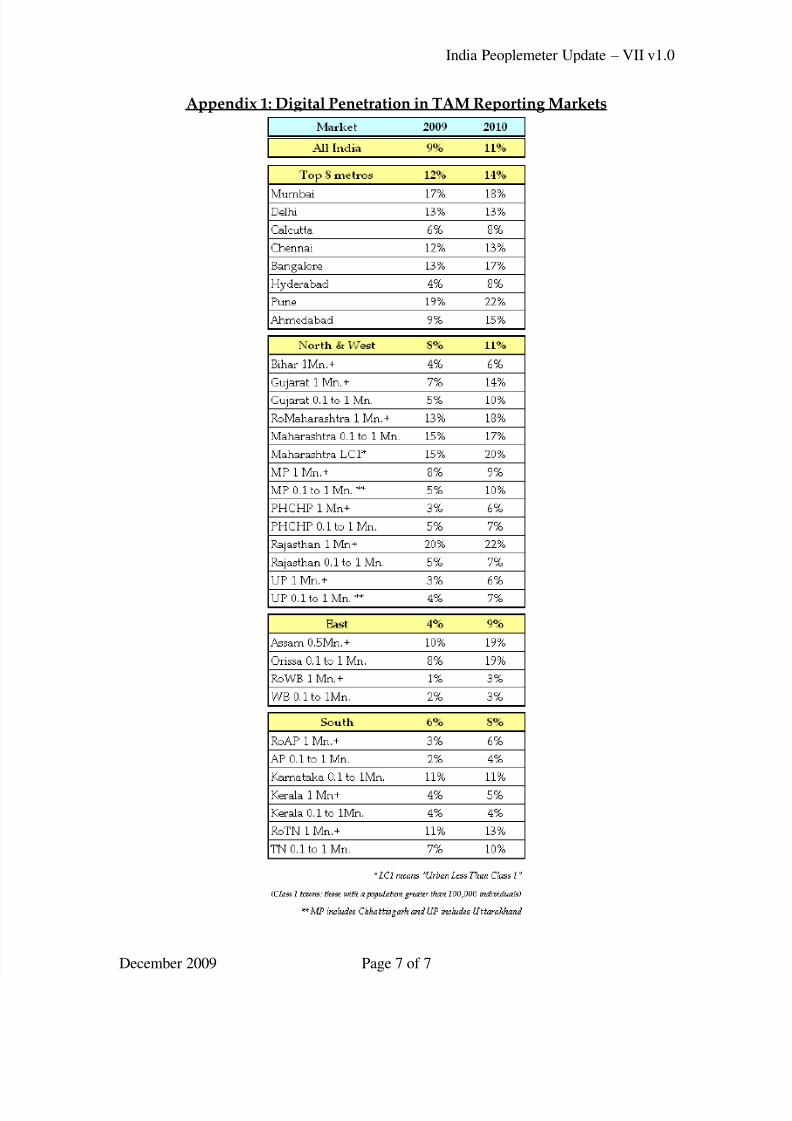
Appendix 1: Digital Penetration in TAM Reporting Markets