india office property market overview 3q 2012
DESCRIPTION
Colliers International has released a market report “India Office Property Market Overview, October 2012”. The report gives an overall macroeconomic overview followed by latest real estate updates and trends in each city through supply and demand, rental and vacancy as well as market prognosis for 2012 onwards. Highlights include, cautious occupier demand and ample supply kept rental values stable across major office markets. Fewer transactions were recorded in markets like Chennai, Bangalore, Pune and Kolkata however; Mumbai and NCR witnessed increased activity in terms of leasing quarter on quarter. Looking ahead, rental values are predicted to remain stable in the near future.TRANSCRIPT

Office PrOPerty Market Overview iNDia
QUarterLy UPDate | OctOBer | 2012
Accelerating success.
www.colliers.com
MACRO ECONOMIC OVERVIEW
India’s GDP growth has slowed to a 3 year •low recorded at 5.3% in the April-June quarter of the current fiscal. The wholesale price index reached 7.81 per cent in September, and 7.55 per cent in August 2012 this year much above the RBI’s comfort level.
As the inflation remained higher, the central •bank did not provide any repo rate cut this quarter. However, in September 2012, the RBI did reduced the (CRR) Cash Reserve Ratio by 25 basis points to induce immediate liquidity in the market in its mid year policy review. Earlier, in July 2012, the RBI also reduced its SLR (Statutory Liquidity Requirement) by 1%.
Foreign direct investment (FDI) in India was •around $1.76 billion in July 2012. Sectors which received large FDI inflows were services, pharmaceuticals, construction and power.
In 3Q 2012, the Indian Rupee remained under •pressure and closed at 54.31 to 1.00 USD on 15th Sep 2012. The INR further weekend against Euro and close at INR 71.30 to 1.00 Euro.
The new Finance Minister P Chidambaram •has taken a slew of reform measures such as diesel price hike, cap on the number of subsidised cooking gas cylinders per family, liberalising foreign holding norms in aviation, multi-brand retail, non-news broadcasting and power exchanges sectors, and divesting its stake in five companies. However, most of these reform measures faced strong opposition and implementation of these measures is still uncertain.
ECONOMIC BAROMETER
RETuRN ON AlTERNATIVE INVEsTMENTs
RESEARCH & FoRECAST REPoRTsYDNEY CENTRAl BusINEss DIsTRICT
INDIA oFFICE MARkETREsEARCh & fORECAsT REpORT
sep-11 sep-12
REPo RATE 8.50% 8.00%
REVERSE REPo RATE
7.00% 7.00%
CRR 6.00% 4.50%
INFLATIoN 9.78% 7.81%
PRIME LENDING RATE
10.00% - 10.75% 10.00% - 10.50%
DEPoSIT RATE (<1 YEAR)
7.75% - 9.50% 8.00% - 9.25%
FoREIGN Ex-CHANGE
INR - USD47.55 54.31
INR- EURo 65.60 71.30
sep-11 sep-12 YoY %
Change
GoLD 27,750 31,925 15.05%
SILVER 63,359 63,188 -0.27%
EQUITY (BSE
SENSEx) 16,876 18,542 9.87%
REALTY INDEx 1,799 1,734 -3.61%
Source: Colliers International India Research
ECONOMIC INDICATORs
4.0%
5.0%
6.0%
7.0%
8.0%
9.0%
10.0%
INR
Cror
e
2005
- 0
6
2006
- 0
7
2007
- 0
8
2008
- 0
9
2009
- 1
0
2010
- 1
1
2011
-12
April
-Ju
n 12
Jan
- M
ar 0
9
Apr
- Ju
n 09
Jul -
Sep
09
oct
- D
ec 0
9
Jan
- M
ar 1
0
Apr
- Ju
n 10
Jul -
Sep
10
oct
- D
ec 1
0
Jan
- M
ar 1
2
Apr
- Ju
n 12
oct
- D
ec 1
1
Jul -
Sep
11
Apr
- Ju
n 11
Jan
- M
ar 1
1
Gross Domestic product at factor Cost
fDI in Real Estate
0
2,000
4,000
6,000
8,000
10,000
12,000
14,000
16,000
0.0%
1.0%
2.0%
3.0%
USD Euro
3Q 2012 | OFFICE
80
85
90
100
95
120
115
110
105
22-A
ug-1
2
2-Ju
l-12
4-Se
p-12
17-S
ep-1
2
14-J
ul-1
2
27-J
ul-1
2
9-Au
g-12
BsE sensex & Realty Index
Exchange Rates
BSE Sensex Realty Index* Rebase to 100
* Rebase to 100
80
85
90
100
95
110
105
115
120
22-A
ug-1
2
1-Ju
l-12
4-Se
p-12
14-J
ul-1
2
27-J
ul-1
2
9-Au
g-12
17-S
ep-1
2
Note : As on 15th of September, 2011 and September, 2012
COllIERs INTERNATIONAl | p. 3
CITY OffICE BAROMETER
2Q 2012 3Q 2012
VACANCY
ABsORpTION
CONsTRuCTION
RENTAl VAluE
iNDia | 3Q 2012 | OFFICE
MUMBAI
Source: Colliers International India Research
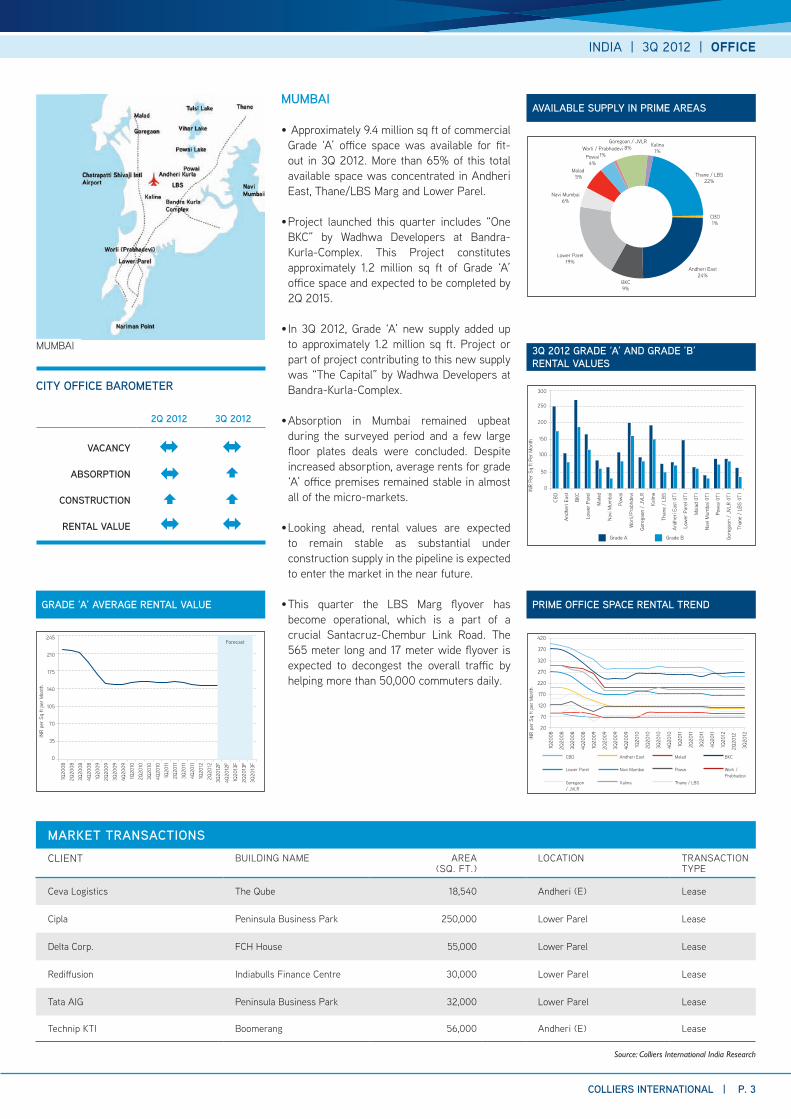
MuMBAI
Approximately 9.4 million sq ft of commercial •Grade ‘A’ office space was available for fit-out in 3Q 2012. More than 65% of this total available space was concentrated in Andheri East, Thane/LBS Marg and Lower Parel.
Project launched this quarter includes “one •BkC” by Wadhwa Developers at Bandra-kurla-Complex. This Project constitutes approximately 1.2 million sq ft of Grade ‘A’ office space and expected to be completed by 2Q 2015.
In 3Q 2012, Grade ‘A’ new supply added up •to approximately 1.2 million sq ft. Project or part of project contributing to this new supply was “The Capital” by Wadhwa Developers at Bandra-kurla-Complex.
Absorption in Mumbai remained upbeat •during the surveyed period and a few large floor plates deals were concluded. Despite increased absorption, average rents for grade ‘A’ office premises remained stable in almost all of the micro-markets.
Looking ahead, rental values are expected •to remain stable as substantial under construction supply in the pipeline is expected to enter the market in the near future.
This quarter the LBS Marg flyover has •become operational, which is a part of a crucial Santacruz-Chembur Link Road. The 565 meter long and 17 meter wide flyover is expected to decongest the overall traffic by helping more than 50,000 commuters daily.
MARKET TRANsACTIONsCLIENT BUILDING NAME AREA
(SQ. FT.)LoCATIoN TRANSACTIoN
TYPE
Ceva Logistics The Qube 18,540 Andheri (E) Lease
Cipla Peninsula Business Park 250,000 Lower Parel Lease
Delta Corp. FCH House 55,000 Lower Parel Lease
Rediffusion Indiabulls Finance Centre 30,000 Lower Parel Lease
Tata AIG Peninsula Business Park 32,000 Lower Parel Lease
Technip kTI Boomerang 56,000 Andheri (E) Lease
3Q 2012 GRADE ‘A’ AND GRADE ’B’ RENTAl VAluEs
pRIME OffICE spACE RENTAl TREND
CBD
Andh
eri E
ast
BkC
Low
er P
arel
Mal
ad
Navi
Mum
bai
Pow
ai
Wor
li/Pr
abhd
evi
Gore
gaon
/ J
VLR
kalin
a
Than
e /
LBS
Andh
eri E
ast (
IT)
Low
er P
arel
(IT)
Mal
ad (I
T)
Navi
Mum
bai (
IT)
Pow
ai (I
T)
Gore
gaon
/ J
VLR
(IT)
Than
e /
LBS
(IT)IN
R Pe
r Sq
ft P
er M
onth
0
50
100
150
200
250
300
2Q20
08
1Q20
08INR
per
Sq ft
per
Mon
th
3Q20
08
4Q20
08
1Q20
09
2Q20
09
3Q20
09
4Q20
09
1Q20
10
2Q20
10
4Q20
10
3Q20
12
2Q20
12
1Q20
12
4Q20
11
3Q20
11
2Q20
11
1Q20
11
3Q20
10
70
20
120
170
220
270
320
370
420
CBD
Lower Parel Navi Mumbai
kalinaGoregaon/ JVLR
Andheri East Malad
Powai
BkC
Worli /Prabhadevi
Thane / LBS
Grade A Grade B
AVAIlABlE supplY IN pRIME AREAs
Andheri East 24%
CBD 1%
Thane / LBS 22%
Worli / Prabhadevi 1%
Goregoan / JVLR 8%
Powai 4%
Malad 5%
Navi Mumbai 6%
Lower Parel 19%
BkC 9%
kalina 1%
INR
per
Sq ft
per
Mon
th
2Q20
08
3Q20
08
4Q20
08
1Q20
09
2Q20
09
3Q20
09
4Q20
10
1Q20
11
2Q20
11
3Q20
11
4Q20
11
2Q20
12
4Q20
12F
3Q20
13F
2Q20
13F
1Q20
13F
3Q20
12F
1Q20
12
4Q20
09
1Q20
08
1Q20
10
2Q20
10
3Q20
10
GRADE ‘A’ AVERAGE RENTAl VAluE
0
35
70
140
105
210
245
175
Forecast
Grade A Grade B
Nehru Place Saket
Netaji Subhash
Jasola Cannaughtplace
p. 4 | COllIERs INTERNATIONAl
3Q 2012 GRADE ‘A’ AND GRADE ’B’ RENTAl VAluEs
pRIME OffICE spACE RENTAl TREND
Source: Colliers International India Research
DElhI
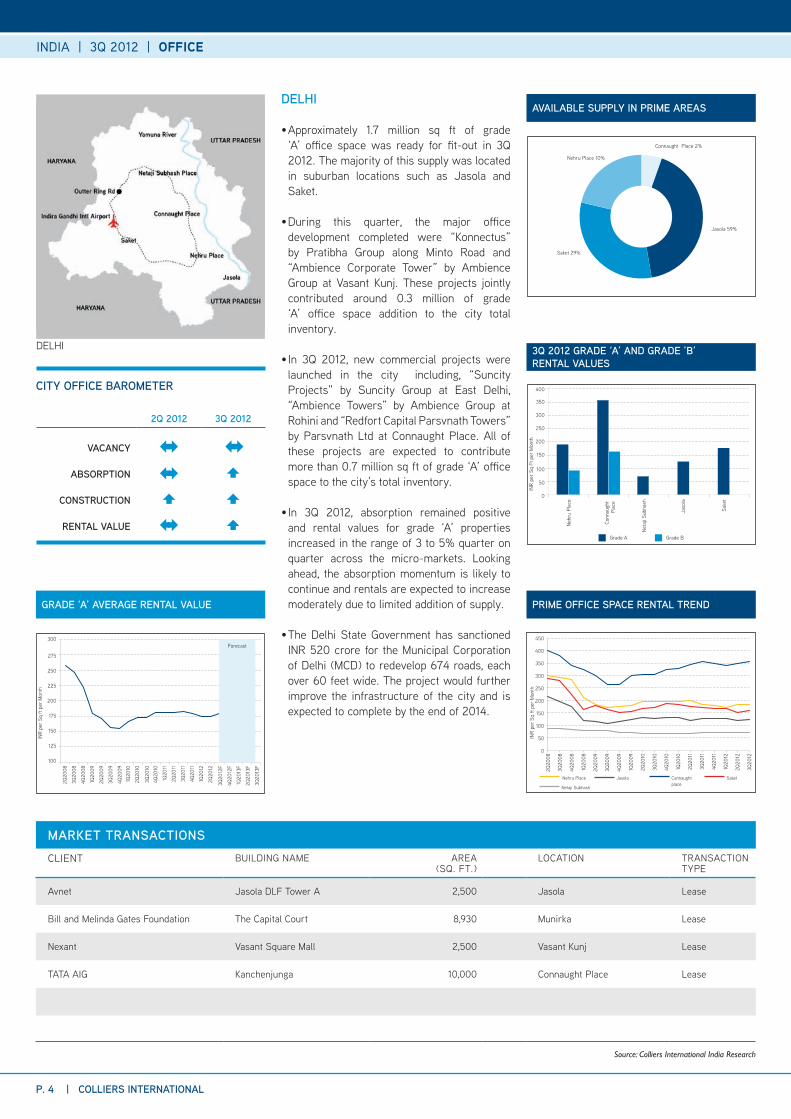
Approximately 1.7 million sq ft of grade •‘A’ office space was ready for fit-out in 3Q 2012. The majority of this supply was located in suburban locations such as Jasola and Saket.
During this quarter, the major office •development completed were “konnectus” by Pratibha Group along Minto Road and “Ambience Corporate Tower” by Ambience Group at Vasant kunj. These projects jointly contributed around 0.3 million of grade ‘A’ office space addition to the city total inventory.
In 3Q 2012, new commercial projects were •launched in the city including, “Suncity Projects” by Suncity Group at East Delhi, “Ambience Towers” by Ambience Group at Rohini and “Redfort Capital Parsvnath Towers” by Parsvnath Ltd at Connaught Place. All of these projects are expected to contribute more than 0.7 million sq ft of grade ‘A’ office space to the city’s total inventory.
In 3Q 2012, absorption remained positive •and rental values for grade ‘A’ properties increased in the range of 3 to 5% quarter on quarter across the micro-markets. Looking ahead, the absorption momentum is likely to continue and rentals are expected to increase moderately due to limited addition of supply.
The Delhi State Government has sanctioned •INR 520 crore for the Municipal Corporation of Delhi (MCD) to redevelop 674 roads, each over 60 feet wide. The project would further improve the infrastructure of the city and is expected to complete by the end of 2014.
AVAIlABlE supplY IN pRIME AREAs
Connaught Place 2%
Nehru Place 10%
Saket 29%
Jasola 59%
CITY OffICE BAROMETER
2Q 2012 3Q 2012
VACANCY
ABsORpTION
CONsTRuCTION
RENTAl VAluE
iNDia | 3Q 2012 | OFFICE
GRADE ‘A’ AVERAGE RENTAl VAluE
2Q20
08
3Q20
08
0
50
100
150
200
250
300
350
400
Conn
augh
t Pl
ace
Nehr
u Pl
ace
Jaso
la
INR
per
Sq F
t per
Mon
th
Sake
t
Neta
ji Su
bhas
h
0
50
100
150
200
250
300
350
400
450
1Q20
10
INR
per
Sq ft
per
Mon
th
100
125
150
175
200
225
250
275
300
INR
per
Sq ft
per
Mon
th
DELHI
2Q20
08
3Q20
08
4Q20
08
1Q20
09
2Q20
09
3Q20
09
4Q20
10
1Q20
11
2Q20
11
3Q20
11
4Q20
11
3Q20
12F
4Q20
12F
3Q20
13F
2Q20
13F
1Q20
13F
2Q20
12
1Q20
12
4Q20
091Q
2010
2Q20
10
3Q20
10 1Q20
08
4Q20
08
2Q20
09
3Q20
09
2Q20
10
1Q20
09
4Q20
09
3Q20
10
4Q20
11
1Q20
12
3Q20
12
2Q20
12
3Q20
11
2Q20
11
4Q20
10
Forecast
MARKET TRANsACTIONsCLIENT BUILDING NAME AREA
(SQ. FT.)LoCATIoN TRANSACTIoN
TYPE
Avnet Jasola DLF Tower A 2,500 Jasola Lease
Bill and Melinda Gates Foundation The Capital Court 8,930 Munirka Lease
Nexant Vasant Square Mall 2,500 Vasant kunj Lease
TATA AIG kanchenjunga 10,000 Connaught Place Lease
3Q 2012 GRADE ‘A’ AND GRADE ’B’ RENTAl VAluEs
MG
Road
Golf
Cour
se R
oad
/Ext
/So
hna
Road
NH8/
Udy
og V
ihar
Man
esar
Inst
itutio
nal S
ecto
rs /
Sush
ant L
ok
Golf
Cour
se
Road
/Ext
/So
hna
Road
DLF
Cybe
r Ci
ty(IT
)
NH8/
Udy
og V
ihar
(IT)
Man
esar
(IT)
0
20
40
60
80
100
120
140
Grade A Grade B
MG RoadGolf Course Road/Ext /Sohna Road
NH8/Udyog Vihar (IT)Institutional Sectors /Sushant Lok
NH8/Udyog Vihar
DLF Cyber City (IT)Golf Course Road/Ext /Sohna Road (IT)Manesar
Manesar (IT)
4Q20
11
1Q20
12
COllIERs INTERNATIONAl | p. 5
Source: Colliers International India Research
GuRGAON
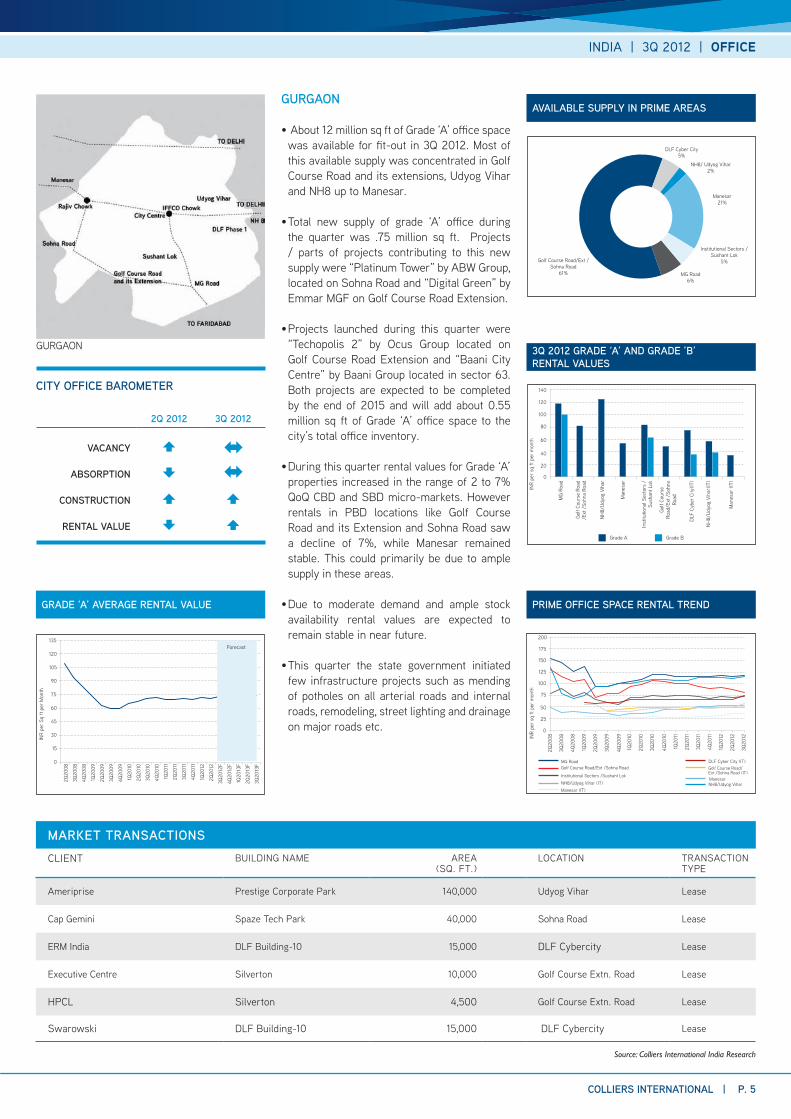
About 12 million sq ft of Grade ‘A’ office space •was available for fit-out in 3Q 2012. Most of this available supply was concentrated in Golf Course Road and its extensions, Udyog Vihar and NH8 up to Manesar.
Total new supply of grade ‘A’ office during •the quarter was .75 million sq ft. Projects / parts of projects contributing to this new supply were “Platinum Tower” by ABW Group, located on Sohna Road and “Digital Green” by Emmar MGF on Golf Course Road Extension.
Projects launched during this quarter were •“Techopolis 2” by ocus Group located on Golf Course Road Extension and “Baani City Centre” by Baani Group located in sector 63. Both projects are expected to be completed by the end of 2015 and will add about 0.55 million sq ft of Grade ‘A’ office space to the city’s total office inventory.
During this quarter rental values for Grade ‘A’ •properties increased in the range of 2 to 7% QoQ CBD and SBD micro-markets. However rentals in PBD locations like Golf Course Road and its Extension and Sohna Road saw a decline of 7%, while Manesar remained stable. This could primarily be due to ample supply in these areas.
Due to moderate demand and ample stock •availability rental values are expected to remain stable in near future.
This quarter the state government initiated •few infrastructure projects such as mending of potholes on all arterial roads and internal roads, remodeling, street lighting and drainage on major roads etc.
AVAIlABlE supplY IN pRIME AREAs
Institutional Sectors /Sushant Lok
5%
DLF Cyber City 5%
MG Road 6%
Manesar 21%
Golf Course Road/Ext /Sohna Road
61%
NH8/ Udyog Vihar 2%
CITY OffICE BAROMETER
2Q 2012 3Q 2012
VACANCY
ABsORpTION
CONsTRuCTION
RENTAl VAluE
iNDia | 3Q 2012 | OFFICE
GRADE ‘A’ AVERAGE RENTAl VAluE pRIME OffICE spACE RENTAl TREND
INR
per
sq ft
per
mon
thIN
R pe
r sq
ft p
er m
onth
200
0
25
50
75
100
125
150
175
2Q20
08
3Q20
08
4Q20
08
1Q20
09
2Q20
09
3Q20
09
4Q20
09
1Q20
10
2Q20
10
3Q20
10
4Q20
10
1Q20
11
2Q20
11
3Q20
11
4Q20
11
1Q20
12
2Q20
12
3Q20
12F
4Q20
12F
3Q20
13F
2Q20
13F
1Q20
13F0
15
30
45
90
105
60
75
120
135
GURGAoN
4Q20
08
1Q20
09
2Q20
09
3Q20
09
4Q20
09
1Q20
10
2Q20
10
4Q20
10
1Q20
11
2Q20
11
3Q20
11
3Q20
12
2Q20
12
3Q20
10
2Q20
08
3Q20
08
Forecast
INR
per
Sq ft
per
Mon
th
MARKET TRANsACTIONsCLIENT BUILDING NAME AREA
(SQ. FT.)LoCATIoN TRANSACTIoN
TYPE
Ameriprise Prestige Corporate Park 140,000 Udyog Vihar Lease
Cap Gemini Spaze Tech Park 40,000 Sohna Road Lease
ERM India DLF Building-10 15,000 DLF Cybercity Lease
Executive Centre Silverton 10,000 Golf Course Extn. Road Lease
HPCL Silverton 4,500 Golf Course Extn. Road Lease
Swarowski DLF Building-10 15,000 DLF Cybercity Lease
Grade A Grade B
p. 6 | COllIERs INTERNATIONAl
3Q 2012 GRADE ‘A’ AND GRADE ’B’ RENTAl VAluEs
pRIME OffICE spACE RENTAl TREND
AVAIlABlE supplY IN pRIME AREAs
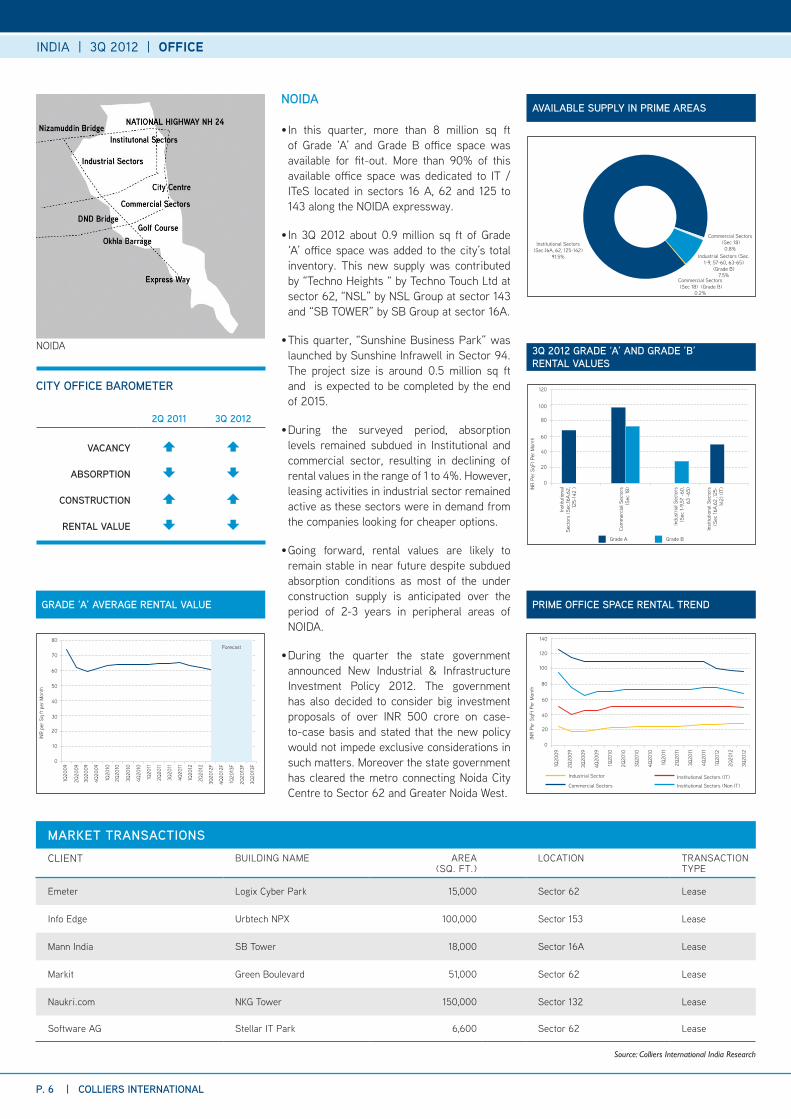
Commercial Sectors (Sec 18) (Grade B)
0.2%
Institutional Sectors (Sec.16A, 62, 125-142)
91.5% Industrial Sectors (Sec. 1-9, 57-60, 63-65)
(Grade B) 7.5%
CITY OffICE BAROMETER
2Q 2011 3Q 2012
VACANCY
ABsORpTION
CONsTRuCTION
RENTAl VAluE
1Q20
09
INR
Per
SqFt
Per
Mon
th
0
20
40
60
80
100
120
140
0
20
40
60
80
120
100
2Q20
09
3Q20
09
4Q20
09
1Q20
10
Inst
itutio
nal S
ecto
rs(S
ec 1
6A,6
2 ,12
5-14
2) (I
T)
Indu
stria
l Sec
tors
(S
ec 1-
9,57
-60
,63
-65
)
Com
mer
cial
Sec
tors
(Sec
18)IN
R Pe
r Sq
Ft P
er M
onth
Inst
itutio
nal
Sect
ors
(Sec
.16A,
62,
125-
142
)
2Q20
10
1Q20
11
2Q20
11
3Q20
11
4Q20
11
3Q20
12
2Q20
12
1Q20
12
4Q20
10
3Q20
10
Institutional Sectors (IT)
Institutional Sectors (Non IT)Commercial Sectors
Industrial Sector
GRADE ‘A’ AVERAGE RENTAl VAluE
1Q20
09
2Q20
09
3Q20
09
4Q20
09
1Q20
10
2Q20
10
1Q20
11
2Q20
11
3Q20
11
4Q20
11
3Q20
12F
4Q20
12F
1Q20
12
2Q20
12
4Q20
10
3Q20
10
INR
per
Sq ft
per
Mon
th
0
10
20
40
30
50
80
60
70
NoIDA
Source: Colliers International India Research
3Q20
13F
2Q20
13F
1Q20
13F
Forecast
iNDia | 3Q 2012 | OFFICE
MARKET TRANsACTIONsCLIENT BUILDING NAME AREA
(SQ. FT.)LoCATIoN TRANSACTIoN
TYPE
Emeter Logix Cyber Park 15,000 Sector 62 Lease
Info Edge Urbtech NPx 100,000 Sector 153 Lease
Mann India SB Tower 18,000 Sector 16A Lease
Markit Green Boulevard 51,000 Sector 62 Lease
Naukri.com NkG Tower 150,000 Sector 132 Lease
Software AG Stellar IT Park 6,600 Sector 62 Lease
NOIDA
In this quarter, more than 8 million sq ft •of Grade ‘A’ and Grade B office space was available for fit-out. More than 90% of this available office space was dedicated to IT / ITeS located in sectors 16 A, 62 and 125 to 143 along the NoIDA expressway.
In 3Q 2012 about 0.9 million sq ft of Grade •‘A’ office space was added to the city’s total inventory. This new supply was contributed by “Techno Heights “ by Techno Touch Ltd at sector 62, “NSL” by NSL Group at sector 143 and “SB ToWER” by SB Group at sector 16A.
This quarter, “Sunshine Business Park” was •launched by Sunshine Infrawell in Sector 94. The project size is around 0.5 million sq ft and is expected to be completed by the end of 2015.
During the surveyed period, absorption •levels remained subdued in Institutional and commercial sector, resulting in declining of rental values in the range of 1 to 4%. However, leasing activities in industrial sector remained active as these sectors were in demand from the companies looking for cheaper options.
Going forward, rental values are likely to •remain stable in near future despite subdued absorption conditions as most of the under construction supply is anticipated over the period of 2-3 years in peripheral areas of NoIDA.
During the quarter the state government •announced New Industrial & Infrastructure Investment Policy 2012. The government has also decided to consider big investment proposals of over INR 500 crore on case-to-case basis and stated that the new policy would not impede exclusive considerations in such matters. Moreover the state government has cleared the metro connecting Noida City Centre to Sector 62 and Greater Noida West.
Commercial Sectors (Sec 18)
0.8%
3Q 2012 GRADE ‘A’ IT AND NON IT RENTAl VAluEs
CBD
INR
per
sq ft
per
mon
th
Guin
dy (
SBD)
Amba
ttur
oM
R (IT
Cor
ridor
)
GST
road
0
10
20
30
40
50
60
70
80
NoN IT IT
COllIERs INTERNATIONAl | p. 7
ChENNAI
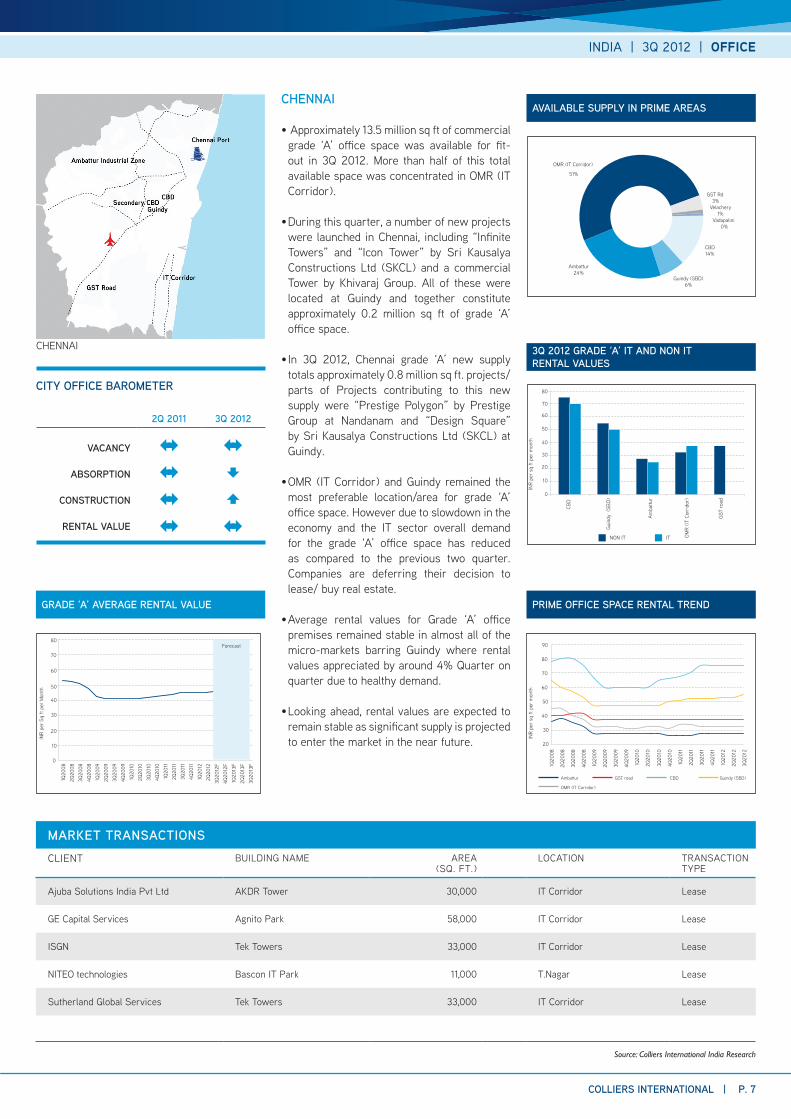
Approximately 13.5 million sq ft of commercial •grade ‘A’ office space was available for fit-out in 3Q 2012. More than half of this total available space was concentrated in oMR (IT Corridor).
During this quarter, a number of new projects •were launched in Chennai, including “Infinite Towers” and “Icon Tower” by Sri kausalya Constructions Ltd (SkCL) and a commercial Tower by khivaraj Group. All of these were located at Guindy and together constitute approximately 0.2 million sq ft of grade ‘A’ office space.
In 3Q 2012, Chennai grade ‘A’ new supply •totals approximately 0.8 million sq ft. projects/ parts of Projects contributing to this new supply were “Prestige Polygon” by Prestige Group at Nandanam and “Design Square” by Sri kausalya Constructions Ltd (SkCL) at Guindy.
oMR (IT Corridor) and Guindy remained the •most preferable location/area for grade ‘A’ office space. However due to slowdown in the economy and the IT sector overall demand for the grade ‘A’ office space has reduced as compared to the previous two quarter. Companies are deferring their decision to lease/ buy real estate.
Average rental values for Grade ‘A’ office •premises remained stable in almost all of the micro-markets barring Guindy where rental values appreciated by around 4% Quarter on quarter due to healthy demand.
Looking ahead, rental values are expected to •remain stable as significant supply is projected to enter the market in the near future.
AVAIlABlE supplY IN pRIME AREAs
CBD 14%
Guindy (SBD) 6%
Velachery 1%
Vadapalini 0%
GST Rd 3%
oMR (IT Corridor)
51%
Ambattur 24%
CITY OffICE BAROMETER
2Q 2011 3Q 2012
VACANCY
ABsORpTION
CONsTRuCTION
RENTAl VAluE
iNDia | 3Q 2012 | OFFICE
pRIME OffICE spACE RENTAl TREND
4Q20
08
1Q20
09
2Q20
09
3Q20
09
4Q20
09
1Q20
10
2Q20
10
3Q20
12
2Q20
12
1Q20
12
4Q20
11
3Q20
11
2Q20
11
1Q20
11
4Q20
10
3Q20
10
2Q20
08
1Q20
08
INR
per
sq ft
per
mon
th
90
20
30
40
50
60
70
80
3Q20
08
Ambattur GST road
oMR (IT Corridor)
Guindy (SBD)CBD
GRADE ‘A’ AVERAGE RENTAl VAluE
2Q20
08
1Q20
08
3Q20
08
4Q20
08
1Q20
09
2Q20
09
3Q20
09
4Q20
09
1Q20
10
2Q20
10
1Q20
11
2Q20
11
3Q20
11
4Q20
11
3Q20
13F
2Q20
13F
1Q20
13F
4Q20
12F
3Q20
12F
2Q20
12
1Q20
12
4Q20
10
3Q20
10
INR
per
Sq ft
per
Mon
th
0
10
20
30
40
60
70
80
50
CHENNAI
Source: Colliers International India Research
Forecast
MARKET TRANsACTIONsCLIENT BUILDING NAME AREA
(SQ. FT.)LoCATIoN TRANSACTIoN
TYPE
Ajuba Solutions India Pvt Ltd AkDR Tower 30,000 IT Corridor Lease
GE Capital Services Agnito Park 58,000 IT Corridor Lease
ISGN Tek Towers 33,000 IT Corridor Lease
NITEo technologies Bascon IT Park 11,000 T.Nagar Lease
Sutherland Global Services Tek Towers 33,000 IT Corridor Lease
p. 8 | COllIERs INTERNATIONAl
2Q 2012 3Q 2012
VACANCY
ABsORpTION
CONsTRuCTION
RENTAl VAluE
3Q 2012 GRADE ‘A’ AND GRADE ’B’ RENTAl VAluEs
pRIME OffICE spACE RENTAl TREND
BENGAluRu (BANGAlORE)
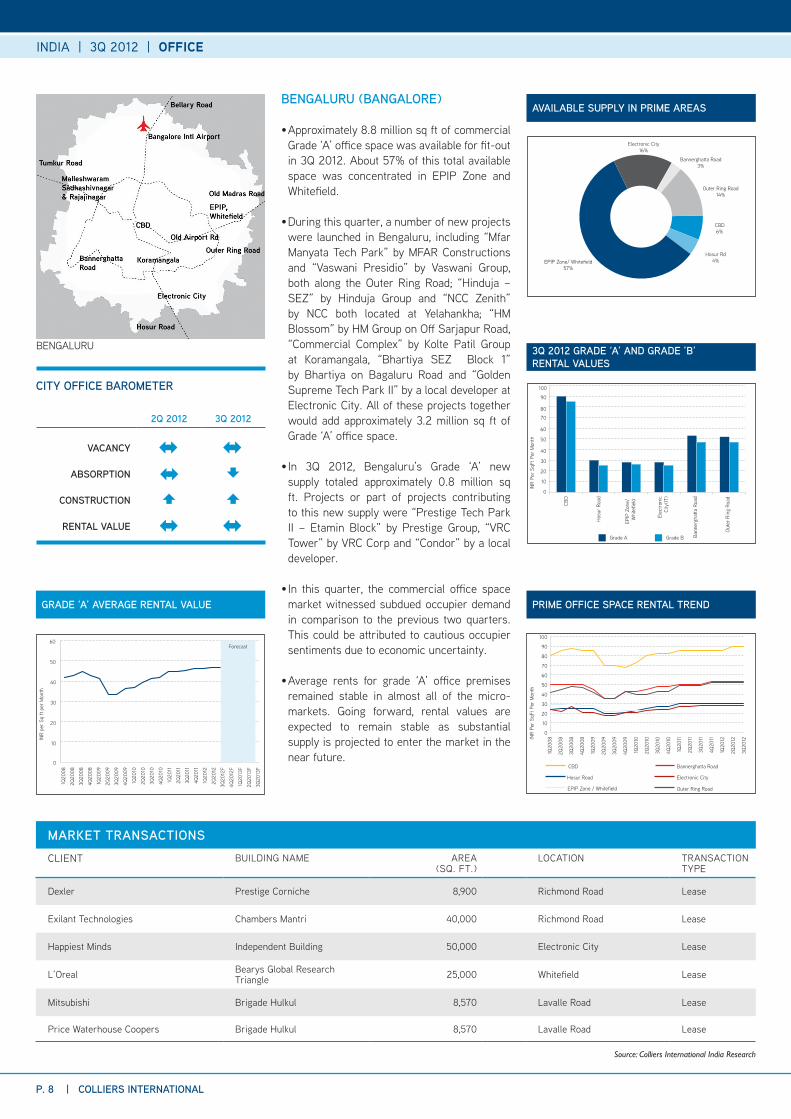
Approximately 8.8 million sq ft of commercial •Grade ‘A’ office space was available for fit-out in 3Q 2012. About 57% of this total available space was concentrated in EPIP Zone and Whitefield.
During this quarter, a number of new projects •were launched in Bengaluru, including “Mfar Manyata Tech Park” by MFAR Constructions and “Vaswani Presidio” by Vaswani Group, both along the outer Ring Road; “Hinduja – SEZ” by Hinduja Group and “NCC Zenith” by NCC both located at Yelahankha; “HM Blossom” by HM Group on off Sarjapur Road, “Commercial Complex” by kolte Patil Group at koramangala, “Bhartiya SEZ Block 1” by Bhartiya on Bagaluru Road and “Golden Supreme Tech Park II” by a local developer at Electronic City. All of these projects together would add approximately 3.2 million sq ft of Grade ‘A’ office space.
In 3Q 2012, Bengaluru’s Grade ‘A’ new •supply totaled approximately 0.8 million sq ft. Projects or part of projects contributing to this new supply were “Prestige Tech Park II – Etamin Block” by Prestige Group, “VRC Tower” by VRC Corp and “Condor” by a local developer.
In this quarter, the commercial office space •market witnessed subdued occupier demand in comparison to the previous two quarters. This could be attributed to cautious occupier sentiments due to economic uncertainty.
Average rents for grade ‘A’ office premises •remained stable in almost all of the micro-markets. Going forward, rental values are expected to remain stable as substantial supply is projected to enter the market in the near future.
AVAIlABlE supplY IN pRIME AREAs
CBD 6%
outer Ring Road 14%
Bannerghatta Road 3%
Electronic City 16%
EPIP Zone/ Whitefield 57%
Hosur Rd 4%
CITY OffICE BAROMETER
iNDia | 3Q 2012 | OFFICE
1Q20
08
2Q20
08INR
Per
SqFt
Per
Mon
th
0
10
20
30
40
50
60
70
80
90
100
3Q20
08
4Q20
08
1Q20
09
3Q20
09
1Q20
10
2Q20
09
4Q20
09
2Q20
10
3Q20
10
1Q20
11
2Q20
11
3Q20
12
2Q20
12
1Q20
12
4Q20
11
3Q20
11
4Q20
10
0
10
20
30
40
50
60
70
80
90
100
out
er R
ing
Road
Grade A Grade B
Elec
troni
c Ci
ty(IT
)
Bann
ergh
atta
Roa
d
EPIP
Zon
e/
Whi
tefie
ld
Hos
ur R
oad
INR
Per
SqFt
Per
Mon
th
CBD
CBD
Electronic City
outer Ring RoadEPIP Zone / Whitefield
Hosur Road
Bannerghatta Road
GRADE ‘A’ AVERAGE RENTAl VAluE
INR
per
Sq ft
per
Mon
th
0
10
20
30
50
60
40
BENGALURU
2Q20
08
1Q20
08
3Q20
08
4Q20
08
1Q20
09
2Q20
09
3Q20
09
4Q20
09
1Q20
10
2Q20
10
1Q20
11
2Q20
11
3Q20
11
4Q20
11
3Q20
12F
3Q20
13F
2Q20
13F
1Q20
13F
4Q20
12F
2Q20
12
1Q20
12
4Q20
10
3Q20
10
Source: Colliers International India Research
Forecast
MARKET TRANsACTIONsCLIENT BUILDING NAME AREA
(SQ. FT.)LoCATIoN TRANSACTIoN
TYPE
Dexler Prestige Corniche 8,900 Richmond Road Lease
Exilant Technologies Chambers Mantri 40,000 Richmond Road Lease
Happiest Minds Independent Building 50,000 Electronic City Lease
L’oreal Bearys Global Research Triangle 25,000 Whitefield Lease
Mitsubishi Brigade Hulkul 8,570 Lavalle Road Lease
Price Waterhouse Coopers Brigade Hulkul 8,570 Lavalle Road Lease
3Q 2012 GRADE ‘A’ AND GRADE ’B’ RENTAl VAluEs
pRIME OffICE spACE RENTAl TREND
CBD
(Par
k St
, Cam
ac
St,A
JC B
ose
Rd)INR
per
sq ft
per
mon
th
Sect
or-5
(IT
)
Sect
or-5
PBD
(New
To
wn,
Raj
arha
t
Bally
gung
e -C
ircul
ar R
D
PBD
New
Tow
n,
Raja
rhat
(IT)
East
kol
kata
0
20
40
60
80
100
120
140
Grade A Grade B
1Q20
12
COllIERs INTERNATIONAl | p. 9
KOlKATA
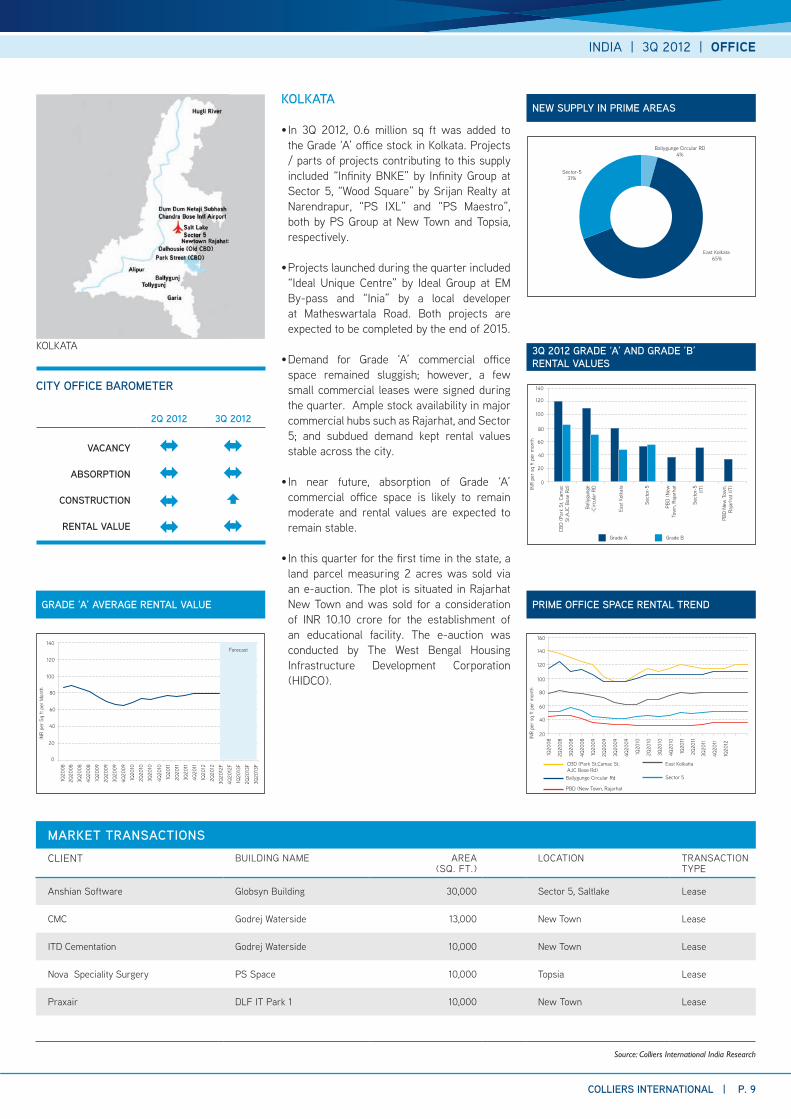
In 3Q 2012, 0.6 million sq ft was added to •the Grade ‘A’ office stock in kolkata. Projects / parts of projects contributing to this supply included “Infinity BNkE” by Infinity Group at Sector 5, “Wood Square” by Srijan Realty at Narendrapur, “PS IxL” and “PS Maestro”, both by PS Group at New Town and Topsia, respectively.
Projects launched during the quarter included •“Ideal Unique Centre” by Ideal Group at EM By-pass and “Inia” by a local developer at Matheswartala Road. Both projects are expected to be completed by the end of 2015.
Demand for Grade ‘A’ commercial office •space remained sluggish; however, a few small commercial leases were signed during the quarter. Ample stock availability in major commercial hubs such as Rajarhat, and Sector 5; and subdued demand kept rental values stable across the city.
In near future, absorption of Grade ‘A’ •commercial office space is likely to remain moderate and rental values are expected to remain stable.
In this quarter for the first time in the state, a •land parcel measuring 2 acres was sold via an e-auction. The plot is situated in Rajarhat New Town and was sold for a consideration of INR 10.10 crore for the establishment of an educational facility. The e-auction was conducted by The West Bengal Housing Infrastructure Development Corporation (HIDCo).
NEW supplY IN pRIME AREAs
East kolkata 65%
Ballygunge Circular RD 4%
Sector-531%
CITY OffICE BAROMETER
2Q 2012 3Q 2012
VACANCY
ABsORpTION
CONsTRuCTION
RENTAl VAluE
iNDia | 3Q 2012 | OFFICE
1Q20
08
1Q20
09
2Q20
08
2Q20
09
3Q20
08
3Q20
09
4Q20
08
4Q20
09
1Q20
10
2Q20
10
4Q20
10
3Q20
11
4Q20
11
2Q20
11
1Q20
11
3Q20
10
INR
per
sq ft
per
mon
th
20
40
60
80
100
120
140
160
Sector 5
East kolkatta
Ballygunge Circular Rd
PBD (New Town, Rajarhat
CBD (Park St,Camac St,AJC Bose Rd)
GRADE ‘A’ AVERAGE RENTAl VAluE
INR
per
Sq ft
per
Mon
th
40
120
140
100
60
80
0
20
koLkATA
1Q20
082Q
2008
3Q20
08
4Q20
08
1Q20
09
2Q20
09
3Q20
09
4Q20
09
2Q20
10
1Q20
10
1Q20
11
2Q20
11
3Q20
11
4Q20
11
1Q20
12
2Q20
12
3Q20
12F
4Q20
12F
3Q20
13F
2Q20
13F
1Q20
13F
4Q20
10
3Q20
10
Source: Colliers International India Research
MARKET TRANsACTIONsCLIENT BUILDING NAME AREA
(SQ. FT.)LoCATIoN TRANSACTIoN
TYPE
Anshian Software Globsyn Building 30,000 Sector 5, Saltlake Lease
CMC Godrej Waterside 13,000 New Town Lease
ITD Cementation Godrej Waterside 10,000 New Town Lease
Nova Speciality Surgery PS Space 10,000 Topsia Lease
Praxair DLF IT Park 1 10,000 New Town Lease
Forecast
p. 10 | COllIERs INTERNATIONAl
3Q 2012 GRADE ‘A’ IT AND NON IT RENTAl VAluEs
puNE
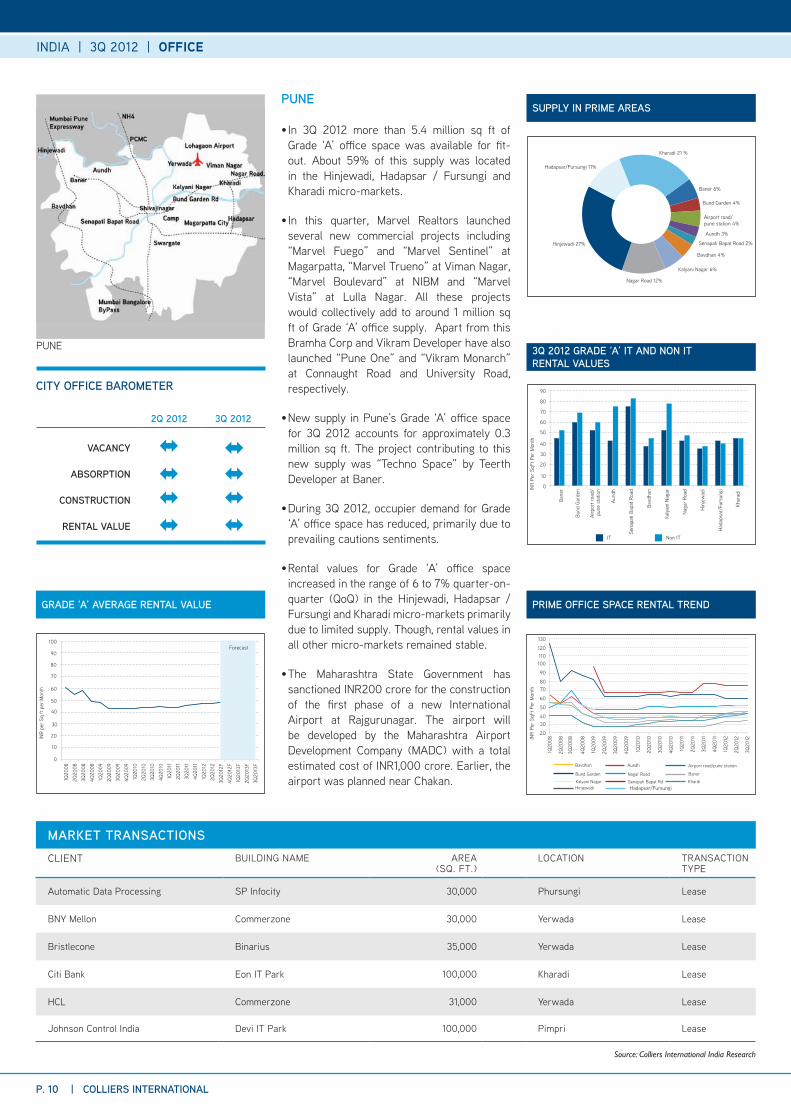
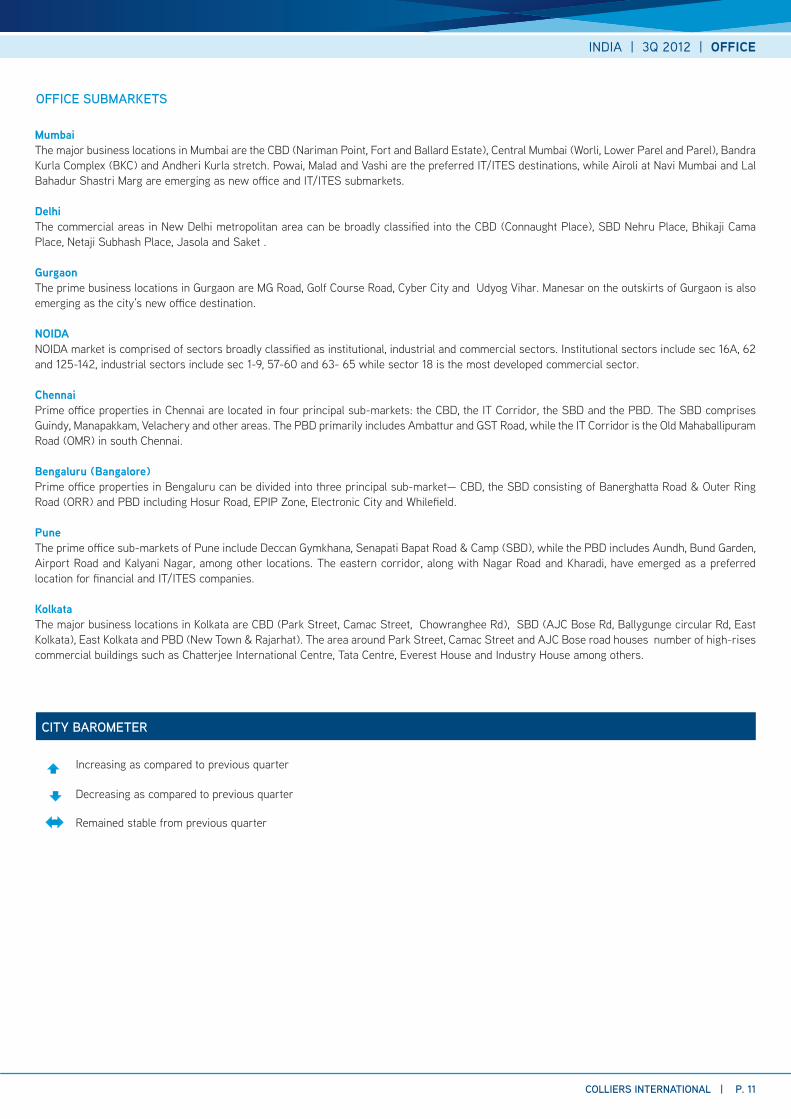
In 3Q 2012 more than 5.4 million sq ft of •Grade ‘A’ office space was available for fit-out. About 59% of this supply was located in the Hinjewadi, Hadapsar / Fursungi and kharadi micro-markets.
In this quarter, Marvel Realtors launched •several new commercial projects including “Marvel Fuego” and “Marvel Sentinel” at Magarpatta, “Marvel Trueno” at Viman Nagar, “Marvel Boulevard” at NIBM and “Marvel Vista” at Lulla Nagar. All these projects would collectively add to around 1 million sq ft of Grade ‘A’ office supply. Apart from this Bramha Corp and Vikram Developer have also launched “Pune one” and “Vikram Monarch” at Connaught Road and University Road, respectively.
New supply in Pune’s Grade ‘A’ office space •for 3Q 2012 accounts for approximately 0.3 million sq ft. The project contributing to this new supply was “Techno Space” by Teerth Developer at Baner.
During 3Q 2012, occupier demand for Grade •‘A’ office space has reduced, primarily due to prevailing cautions sentiments.
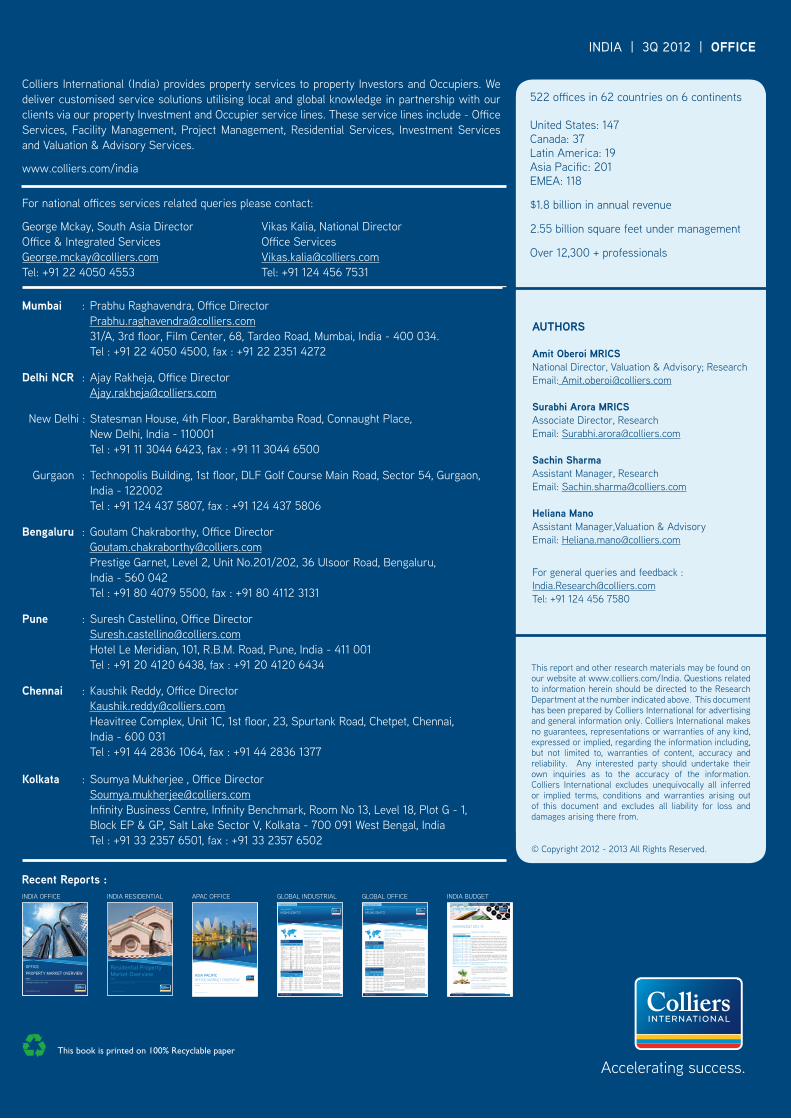
Rental values for Grade ‘A’ office space •increased in the range of 6 to 7% quarter-on-quarter (QoQ) in the Hinjewadi, Hadapsar / Fursungi and kharadi micro-markets primarily due to limited supply. Though, rental values in all other micro-markets remained stable.
The Maharashtra State Government has •sanctioned INR200 crore for the construction of the first phase of a new International Airport at Rajgurunagar. The airport will be developed by the Maharashtra Airport Development Company (MADC) with a total estimated cost of INR1,000 crore. Earlier, the airport was planned near Chakan.
supplY IN pRIME AREAs
kalyani Nagar 6%
Nagar Road 12%
Aundh 3%
Bund Garden 4%
Airport road/pune station 4%
Bavdhan 4%
Baner 6%
kharadi 21 %
Hinjewadi 27%
Hadapsar/Fursungi 11%
Senapati Bapat Road 2%
CITY OffICE BAROMETER
2Q 2012 3Q 2012
VACANCY
ABsORpTION
CONsTRuCTION
RENTAl VAluE
iNDia | 3Q 2012 | OFFICE
1Q20
08
2Q20
08INR
Per
SqFt
Per
Mon
th
20
3040
50
60
7080
90
100110120
130
3Q20
08
4Q20
08
1Q20
09
3Q20
09
1Q20
10
2Q20
09
4Q20
09
2Q20
10
4Q20
10
2Q20
11
3Q20
12
2Q20
12
1Q20
12
4Q20
11
3Q20
11
1Q20
11
3Q20
10
pRIME OffICE spACE RENTAl TREND
0
10
20
30
40
50
60
70
90
80
khar
adi
kaly
ani N
agar
Naga
r Ro
ad
Bavd
han
Had
apsa
r/Fu
rsun
gi
Hin
jew
adi
Sena
pati
Bapa
t Roa
d
Aund
h
Airp
ort r
oad/
pune
sta
tion
Bund
Gar
denIN
R Pe
r Sq
Ft P
er M
onth
Bane
r
Bavdhan Airport road/pune station
Baner
khardiNagar Road
Hinjewadi Hadapsar/Fursungikalyani Nagar
Bund Garden
Aundh
Senapati Bapat Rd
GRADE ‘A’ AVERAGE RENTAl VAluE
INR
per
Sq ft
per
Mon
th
0
10
30
20
40
100
70
80
90
60
50
PUNE
2Q20
08
1Q20
08
3Q20
08
4Q20
08
1Q20
09
2Q20
09
3Q20
09
4Q20
09
1Q20
10
2Q20
10
1Q20
11
2Q20
11
3Q20
11
4Q20
11
1Q20
12
3Q20
12F
2Q20
12
4Q20
12F
3Q20
13F
2Q20
13F
1Q20
13F
4Q20
10
3Q20
10
IT Non IT
Source: Colliers International India Research
Forecast
MARKET TRANsACTIONsCLIENT BUILDING NAME AREA
(SQ. FT.)LoCATIoN TRANSACTIoN
TYPE
Automatic Data Processing SP Infocity 30,000 Phursungi Lease
BNY Mellon Commerzone 30,000 Yerwada Lease
Bristlecone Binarius 35,000 Yerwada Lease
Citi Bank Eon IT Park 100,000 kharadi Lease
HCL Commerzone 31,000 Yerwada Lease
Johnson Control India Devi IT Park 100,000 Pimpri Lease
MumbaiThe major business locations in Mumbai are the CBD (Nariman Point, Fort and Ballard Estate), Central Mumbai (Worli, Lower Parel and Parel), Bandra kurla Complex (BkC) and Andheri kurla stretch. Powai, Malad and Vashi are the preferred IT/ITES destinations, while Airoli at Navi Mumbai and Lal Bahadur Shastri Marg are emerging as new office and IT/ITES submarkets.
DelhiThe commercial areas in New Delhi metropolitan area can be broadly classified into the CBD (Connaught Place), SBD Nehru Place, Bhikaji Cama Place, Netaji Subhash Place, Jasola and Saket .
GurgaonThe prime business locations in Gurgaon are MG Road, Golf Course Road, Cyber City and Udyog Vihar. Manesar on the outskirts of Gurgaon is also emerging as the city’s new office destination.
NOIDANoIDA market is comprised of sectors broadly classified as institutional, industrial and commercial sectors. Institutional sectors include sec 16A, 62 and 125-142, industrial sectors include sec 1-9, 57-60 and 63- 65 while sector 18 is the most developed commercial sector.
ChennaiPrime office properties in Chennai are located in four principal sub-markets: the CBD, the IT Corridor, the SBD and the PBD. The SBD comprises Guindy, Manapakkam, Velachery and other areas. The PBD primarily includes Ambattur and GST Road, while the IT Corridor is the old Mahaballipuram Road (oMR) in south Chennai.
Bengaluru (Bangalore)Prime office properties in Bengaluru can be divided into three principal sub-market— CBD, the SBD consisting of Banerghatta Road & outer Ring Road (oRR) and PBD including Hosur Road, EPIP Zone, Electronic City and Whilefield.
PuneThe prime office sub-markets of Pune include Deccan Gymkhana, Senapati Bapat Road & Camp (SBD), while the PBD includes Aundh, Bund Garden, Airport Road and kalyani Nagar, among other locations. The eastern corridor, along with Nagar Road and kharadi, have emerged as a preferred location for financial and IT/ITES companies.
KolkataThe major business locations in kolkata are CBD (Park Street, Camac Street, Chowranghee Rd), SBD (AJC Bose Rd, Ballygunge circular Rd, East kolkata), East kolkata and PBD (New Town & Rajarhat). The area around Park Street, Camac Street and AJC Bose road houses number of high-rises commercial buildings such as Chatterjee International Centre, Tata Centre, Everest House and Industry House among others.
OffICE suBMARKETs
COllIERs INTERNATIONAl | p. 11
iNDia | 3Q 2012 | OFFICE
CITY BAROMETER
Increasing as compared to previous quarter
Decreasing as compared to previous quarter
Remained stable from previous quarter
Accelerating success.
Colliers International (India) provides property services to property Investors and occupiers. We deliver customised service solutions utilising local and global knowledge in partnership with our clients via our property Investment and occupier service lines. These service lines include - office Services, Facility Management, Project Management, Residential Services, Investment Services and Valuation & Advisory Services.
www.colliers.com/india
For national offices services related queries please contact:
George Mckay, South Asia Director Vikas kalia, National Directoroffice & Integrated Services office [email protected] [email protected]: +91 22 4050 4553 Tel: +91 124 456 7531
INDIA oFFICE INDIA RESIDENTIAL APAC oFFICE GLoBAL INDUSTRIAL GLoBAL oFFICE INDIA BUDGET
Mumbai : Prabhu Raghavendra, office Director [email protected] 31/A, 3rd floor, Film Center, 68, Tardeo Road, Mumbai, India - 400 034. Tel : +91 22 4050 4500, fax : +91 22 2351 4272
Delhi NCR : Ajay Rakheja, office Director [email protected]
New Delhi : Statesman House, 4th Floor, Barakhamba Road, Connaught Place, New Delhi, India - 110001 Tel : +91 11 3044 6423, fax : +91 11 3044 6500
Gurgaon : Technopolis Building, 1st floor, DLF Golf Course Main Road, Sector 54, Gurgaon, India - 122002 Tel : +91 124 437 5807, fax : +91 124 437 5806
Bengaluru : Goutam Chakraborthy, office Director [email protected] Prestige Garnet, Level 2, Unit No.201/202, 36 Ulsoor Road, Bengaluru, India - 560 042 Tel : +91 80 4079 5500, fax : +91 80 4112 3131
Pune : Suresh Castellino, office Director [email protected] Hotel Le Meridian, 101, R.B.M. Road, Pune, India - 411 001 Tel : +91 20 4120 6438, fax : +91 20 4120 6434
Chennai : kaushik Reddy, office Director [email protected] Heavitree Complex, Unit 1C, 1st floor, 23, Spurtank Road, Chetpet, Chennai, India - 600 031 Tel : +91 44 2836 1064, fax : +91 44 2836 1377
Kolkata : Soumya Mukherjee , office Director [email protected] Infinity Business Centre, Infinity Benchmark, Room No 13, Level 18, Plot G - 1, Block EP & GP, Salt Lake Sector V, kolkata - 700 091 West Bengal, India Tel : +91 33 2357 6501, fax : +91 33 2357 6502
Recent Reports :
This book is printed on 100% Recyclable paper
iNDia | 3Q 2012 | OFFICE
Accelerating success.
AUTHORS
Amit Oberoi MRICSNational Director, Valuation & Advisory; ResearchEmail: [email protected]
Surabhi Arora MRICSAssociate Director, ResearchEmail: [email protected]
Sachin SharmaAssistant Manager, ResearchEmail: [email protected]
Heliana ManoAssistant Manager,Valuation & Advisory Email: [email protected]
For general queries and feedback :[email protected] Tel: +91 124 456 7580
This report and other research materials may be found on our website at www.colliers.com/India. Questions related to information herein should be directed to the Research Department at the number indicated above. This document has been prepared by Colliers International for advertising and general information only. Colliers International makes no guarantees, representations or warranties of any kind, expressed or implied, regarding the information including, but not limited to, warranties of content, accuracy and reliability. Any interested party should undertake their own inquiries as to the accuracy of the information. Colliers International excludes unequivocally all inferred or implied terms, conditions and warranties arising out of this document and excludes all liability for loss and damages arising there from.
© Copyright 2012 - 2013 All Rights Reserved.
522 offices in 62 countries on 6 continents
United States: 147 Canada: 37 Latin America: 19 Asia Pacific: 201EMEA: 118
$1.8 billion in annual revenue 2.55 billion square feet under management
over 12,300 + professionals
Accelerating success.
Residential Property Market OverviewINDIA
QUARTERLY UPDATE | AUGUST | 2012
ASIA PACIFICOFFICE MARKET OVERVIEW2Q 2012
Accelerating success.
HIGHLIGHTSGLOBAL INDUSTRIAL
WWW.COLLIERS.COM
SECOND HALF 2011 | INDUSTRIAL
JAMES COOK Director of Research | USA
Global Industrial Trend ForecastGrowing global trade will steady demand for quality warehouse space in many regions.Industrial vacancy rates will further drop in most markets. Some markets, U.S. and Australia among them, will experience a lack of new supply in the face of growing demand.Prime warehouse rents will climb in most Asia Pacific markets, remain stable in EMEA and LATAM, and continue to strengthen in North American markets.
Citing deteriorating financial conditions and dimming growth prospect, the International Monetary Fund’s (IMF) revised its September 2011 World Economic Outlook growth projections downward in January 2012. However, the IMF still forecasts that global trade volume will rise by 3.8 percent in 2012 and 5.4 percent in 2013; as global trade rises, so too will demand for warehouse space.
While warehouse rents have stabilized in most EMEA and Latin American markets, prime warehouse rents quoted in local currencies increased in the majority of Asia Pacific and North American markets in 2011 over the previous year. We expect this trend to continue, with prime warehouse rents climbing in most Asia Pacific and North American markets in the next year.
Latin American Rents Poised to Stabilize In Latin America, prime warehouse rental rates took a fall. In 71.4 percent of the markets we track, year-end rents decreased in 2011 from a year earlier. However, we expect warehouse rents in Latin America to stabilize in the coming year.
São Paulo saw a 12.4 percent drop in warehouse rents in local currency, due to increased supply. However, with absorption set to outpace supply,
we expect overall warehouse rents in the São Paulo region to rise by as much as four percent in the coming year.
Mexico City saw a three percent decrease in its industrial vacancy rate in the second half of 2011, down to 4.8 percent. Mexico was more negatively affected by the recession than most countries in North America, and its economic future is largely tied to that of its key trading partner, the United States. But with U.S. growth on the upswing, Mexico too is poised to grow at a modest rate and we expect that vacancies could make further drops in the country.
Steady Demand in North America Since peaking in 2010, growth in the manufacturing and distribution industry has kept the U.S. vacancy rate dropping in a mostly regular fashion. Vacancy dropped to 9.72 percent in Q4 2011. With construction proceeding at low levels, we expect vacancies to continue to drop at a measured rate into 2013.
Toronto, Canada’s biggest industrial market, saw 13.7 million square feet of industrial space absorbed in 2011, and the city’s prime warehouse rents grew by 7.1 percent in the second half of 2011.
Dropping Vacancies in Most Asian MarketsAsia Pacific saw dropping vacancies in nearly every market. Prime warehouse rents grew in more than half of the markets, and observers in more than half of those markets expect that warehouse rents will continue to climb over the next six months.
Australian industrial has been especially strong in most major markets. Retail purchases, made more attractive by the relatively strong Australian dollar, have pushed up demand for large warehouse space in several port markets. While there is growing demand for large modern warehouse
Global Warehouse Demand Shows Consistent Growth
GLOBAL INDUSTRIAL CAPITALIZATION RATES (Prime Yield/Percent)
MARKET (Select Markets) REGION
DEC 2011
DEC 2010
Hong Kong Asia Pacific �.�� �.�� Singapore Asia Pacific �.�� �.�� London (Heathrow) EMEA �.�� �.�� Tokyo Asia Pacific �.�� �.�� Los Angeles – Inland Empire, CA NA �.�� �.��
Chicago, IL NA �.�� �.�� Paris EMEA �.�� �.�� Munich EMEA �.�� �.�� Vancouver, BC NA �.�� �.�� Marseilles EMEA �.�� �.�� New Jersey – Northern NA �.�� �.�� Dallas-Ft. Worth, TX NA �.�� �.�� Shanghai Asia Pacific �.�� �.�� Seoul Asia Pacific �.�� �.�� Madrid EMEA �.�� �.�� Sydney Asia Pacific �.�� �.�� Mexico City LATAM �.�� �.�� Prague EMEA �.�� �.�� Athens EMEA �.�� �.�� Bucharest EMEA ��.�� ��.��
GLOBAL TOP TEN INDUSTRIAL WAREHOUSE RENTS
MARKET REGION
RENT (USD/
PSF/Year)6-MONTH CHANGE*
Tokyo Asia Pacific ��.�� -�.�%London (Heathrow) EMEA ��.�� �.�%Hong Kong Asia Pacific ��.�� �.�%Singapore Asia Pacific ��.�� �.�%Zurich EMEA ��.�� �.�%Oslo EMEA ��.�� �.�%Moscow EMEA ��.�� �.�%Geneva EMEA ��.�� -�.�%São Paulo LATAM ��.�� -��.�%Helsinki EMEA ��.�� �.�%Marseilles EMEA ��.�� �.�%Paris EMEA ��.�� �.�%
*Local currency
Continued on page 8
HIGHLIGHTSGLOBAL OFFICE
WWW.COLLIERS.COM
SECOND HALF 2011 | OFFICE
JAMES COOK Director of Research | USA
Global Office Trend ForecastGlobal office vacancies will continue their decline, due to steady demand and low levels of new construction in North America and Europe. The “flight to quality” trend will continue in many major markets, with occupiers trading up to higher-quality space or a better location as their leases expire.The European sovereign debt crisis will likely push the Eurozone into a mild recession in early 2012. This contraction will be felt most profoundly in a handful of commercial property markets within the most troubled nations.
Economic prospects in the Eurozone have slightly reduced overall positive global expectations for market performance in 2012. We expect continuing modest demand for office space, with most cities seeing a drop in vacancy rates. But global averages do not speak to the nuances of individual markets, and—while we expect positive absorption due to business growth and expansion in the United States, China and Australia—some Eurozone countries may see negative absorption and increased vacancy as the region enters a mild recession.
Global Office Demand Growth Slow and Steady
GLOBAL CAPITALIZATION RATES /PRIME YIELDS: 10 LOWEST CITIES
MARKET (Ranked byDec 2011)
DEC 2011
JUNE 2011
DEC 2010
Taipei �.�� �.�� �.�� Hong Kong �.�� �.�� �.�� Vienna �.�� �.�� �.�� London – West End �.�� �.�� �.�� Zurich �.�� �.�� �.�� Singapore �.�� �.�� �.�� Geneva �.�� �.�� �.�� Beijing �.�� �.�� �.��Paris �.�� �.�� �.��Munich �.�� �.�� �.��Tokyo �.�� �.�� �.��
GLOBAL OFFICE OCCUPANCY COSTS:TOP 10 CITIES
MARKET (Ranked byDec 2011)
DEC 2011
JUNE 2011
DEC 2010
Hong Kong ���.�� ���.�� ���.�� London – West End ���.�� ���.�� ���.�� Paris ��.�� ���.�� ��.�� Rio de Janeiro ��.�� ��.�� ��.�� Moscow ��.�� ��.�� ��.�� London – City ��.�� ��.�� ��.�� Perth ��.�� ��.�� ��.�� Singapore ��.�� ��.�� ��.�� Geneva ��.�� ��.�� ��.�� São Paulo ��.�� ��.�� ��.��
CBD CAP RATE (%)
Latin America Boasts the Tightest Office MarketsSome of the world’s lowest office vacancy rates are found in Latin American cities. Santiago, Chile; Rio de Janeiro, Brazil; São Paulo, Brazil; and Lima, Peru all have vacancy rates below three percent, resulting in a market that strongly favors landlords, prompts new construction and might squeeze some tenants that desire to expand. For the most part, we expect the strength of these markets to persist. While decreases in European demand for its commodities will likely hurt Latin America, this will be tempered by continued demand from China. In São Paolo, heightened demand has spurred the highest rates of new development in the region, which will eventually put downward pressure on asking rents.
Select Asia Pacific Markets See Big Vacancy DropsThe global trend in dropping vacancy rates should be evi-dent in Asia and continue through 2012. Markets that saw a drop in vacancy in the second half of 2011 outnumbered by a two-to-one margin those where vacancy increased.
Of the world’s most populous markets, those with the most significant declines in six-month vacancy rates were nearly all in the Asia Pacific region. Chengdu, propelled by its strong manufacturing sector, saw its vacancy rate drop by 7.8 percent in the period, and Shanghai saw a 3.2 percent drop in vacancy.
Two other large Asian markets saw vacancy rates drop by 1.5 percent or more: Jakarta, which has also seen sustained growth in CBD rental rates and renewed global investor interest; and Singapore, where occupancies are expected to stabilize.
Marquee Markets See Rent DeclineWhile Hong Kong, London’s West End and Paris command the top three highest asking rents for Class A office space,
each has shown apparent decline in rents between June and December of 2011, when quoted in U.S. dollars. Substantial declines, in fact: led by a $10.87 USD drop in Parisian Class A rents.
But how significant are these figures? The change in London and Paris rents is due to the strengthening dollar relative to the euro and pound sterling. In local currency, prime rents in these markets are holding ground. Although smaller, the decline in Hong Kong of $7.56 USD ($5.10 HKD) per square foot may be a more important indicator of things to come, as demand from the banking and financial sector continue to weaken.
EMEA and Asia Pacific Lead Global ConstructionA significant percentage of the office space under construction is in Europe, the Middle East and Africa (EMEA), and much of that is occurring in Moscow and Dubai. While both of these markets should expect strong economic growth in 2012, the fact that Dubai—with a vacancy rate of 50 percent—is constructing at such a pace leads us to expect that supply will continue to outpace demand in that market.
The other two top markets for office construction are in the Asia Pacific region. Guangzhou—China’s leading commercial port city—and Tokyo have 19.6 and 15.6 million square feet under construction respectively. Asian economic growth rates will remain strong in the coming months, with China and India leading the pack. Rents are on the rise in most cities in the region. However, dropping rents in Seoul and Hong Kong are a potential indicator of global economic uncertainty. In Tokyo, where new supply has been increasing for the past three years, we expect construction to peak and begin to decline in the coming year.
CLASS A / NET RENT (USD/SQ FT)
www.colliers.com/india
Budget Highlights | Real Estate
Finance Minister Pranab Mukherjee started his budget speech 2012-13 in the backdrop of challenging macroeconomic scenario. The finance minister projects the economy to grow by 7.6% in the next fiscal up from 6.9% in 2011-12. He mentioned that due to adverse global economic sentiments there has been a slowdown in the Indian Economy but the fact is India still remains among the front runners in the economic growth in any cross country comparison. The budget aims at faster, sustainable and more inclusive growth across sectors emphasizing on five focus areas including revival of domestic consumption, rapid revival of high growth in private investment, removal of supply bottlenecks, addressing malnutrition in 200 high burden districts and expedite improvement in delivery system, governance and transparency.
From a real estate perspective, the budget remained silent on most of the major issues including status of STPIs (Software Technology Parks of India), Real Estate Regulatory Bill, Land Bill etc. however, it mentioned that efforts are on to arrive at a political consensus on the issue of allowing 51% Foreign Direct Investment (FDI) in multi-brand retail.
THE KEY HIGHLIGHTS OF THE BUDGET WHICH MAY IMPACT REAL ESTATE SECTOR ARE AS FOLLOWS:
- External Commercial Borrowings (ECB) for low cost affordable housing projects. Impact: Real estate companies developing large affordable housing projects with large fund requirements will benefit the most from the easing of external commercial borrowing (ECB) norms as interest rate charged is lower in case of external borrowings in comparison to rates charged by domestic institutions.
- Increase in provision under Rural Housing Fund to INR 4,000 crore from the existing INR 3,000 crore.Impact: It will provide housing finance to targeted groups in rural areas at competitive rates.
- Extension of the existing scheme of interest subvention of 1% on housing loans up to INR 15 lakh where the cost of the house does not exceed INR 25 lakh for another year. Impact: This will boost the affordable housing segment by providing cheaper loan to the end users.
MARKET REACTION TO BUDGET
Q1 2012 | RESEARCH
Source: www.bseindia.com | Mar 16, 2012
Company Change (%)BSE SENSEX -1.19Realty Index -1.26Anant Raj Inds -6.04D B Realty -2.02DLF 0.15Godrej Properties -2.82HDIL -5.21Hubtown Ltd. -4.13Indiabulls Real Estate -1.95Mahindra Lifespaces -0.72Orbit Corp. -3.37Parsvnath Developers -4.04Peninsula Land -3.18Phoenix Mills -2.65Sobha Developers 3.04Sunteck Realty -1.13Unitech -1.68
UNION BUDGET 2012 -13
A SNEAK PREVIEW
P. 1 | COLLIERS INTERNATIONAL
OFFICE PROPERTY MARKET OVERVIEW INDIA
QUARTERLY UPDATE | JULY | 2012
Accelerating success.