independent validation and verification for the pennsylvania digital government summit
Post on 22-Dec-2015
214 views
TRANSCRIPT

Independent Validation and Verification
for the
Pennsylvania Digital Government Summit
2
Agenda
• Speaker Introduction
• IV&V Session Goals
• Material Review
• References

3
Introductions
Will Hurley– Service Director IT Quality Management– Domain Expert Quality Management– CISCO PIX Firewall for SOHO Cable modem– Fidelity FMR SEPG– Joint Service Common Operating Environment – USAF Electronic Systems Center Data Administrator– CMM Assessment Lead Theater Battle Management
Contingency Planning Source Selection
Early adopter• Blended assessments• Practical Software Measurement• Aspects for testing• Java, open source, XML

4
Session Goals
• Definitions and perspective
• Key concepts
• Case studies
• Application and techniques
• Final thoughts

5
Definitions
Independent Verification & Validation
A systems engineering process employing rigorous methodologies for evaluating the correctness and quality of the product throughout the life cycle.

6
Definitions
Independent– Technically: IV&V prioritizes its own
efforts within specialty– Managerially: Independent reporting
route to program management, sponsor or acquiring agency
– Financially: Budget is allocated and controlled at high level such that IV&V effectiveness is not compromised
7
Definitions
Verification: The process of determining that an implementation and its associated data accurately represent the conceptual description and specifications.
Validation: The process of determining the degree to which an implementation and its associated data accurately represent of the real world from the perspective of the intended uses of the system.
Accreditation: The official certification that a model, simulation, or federation of models and simulations and its associated data is acceptable for use for a specific purpose.
8
Definitions
English please!– Verification – Did I build the thing right?– Validation – Did I build the right thing?– Accreditation ‑ Should it be used?
Also, there is an underlying implicit principle, and its key question:– Credibility – Should it be trusted?
9
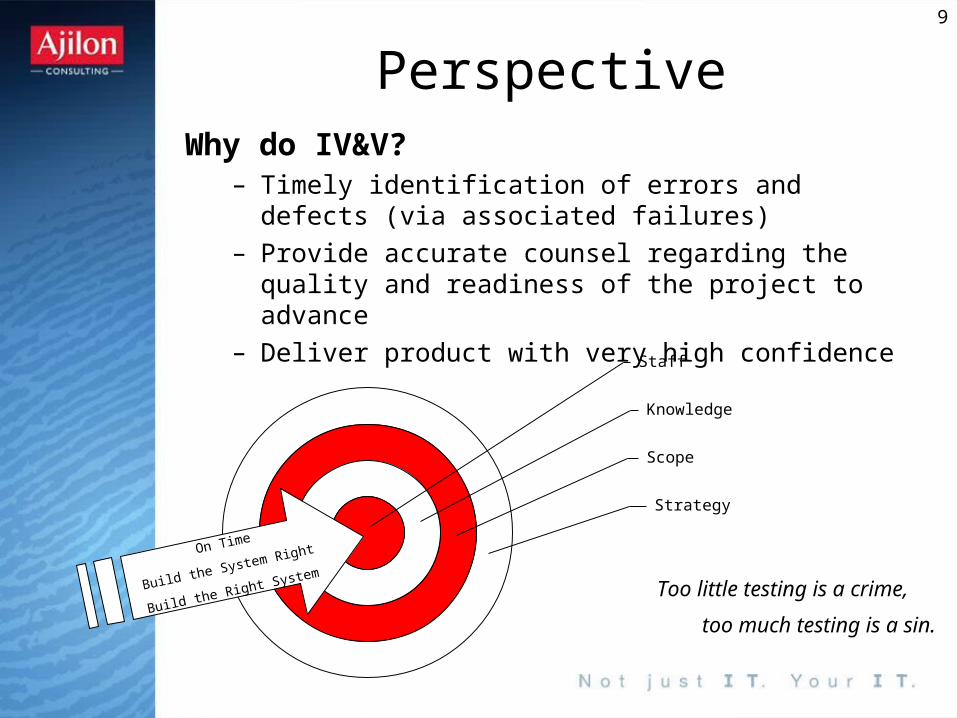
PerspectiveWhy do IV&V?
– Timely identification of errors and defects (via associated failures)
– Provide accurate counsel regarding the quality and readiness of the project to advance
– Deliver product with very high confidence
On Time
Build the System Right
Build the Right System
Strategy
Scope
Knowledge
Staff
Too little testing is a crime,
too much testing is a sin.

10
Perspective
• IV&V activities derive their importance from the intended use of the project to which it will be applied.
Key thought: Probability of an undesired event and its consequence drive IV&V
GRAVE SUBSTANTIAL MARGINAL INSIGNIFICANT

11
Key Concepts
IV&V ≠ Software Quality Assurance
1
23 N N+1
Ris
k
Features (Any Project Phase)
IV&V candidates
SQA Baseline

12
Key Concepts
• IV&V employs rigorous methodologies– Frameworks
• CMMI, CoBIT, RUP
– Measurement• Design of Experiments• ISO/IEC 15939 • Confidence Intervals
– Models, simulations, surveys
13
IV&V
Key Concepts
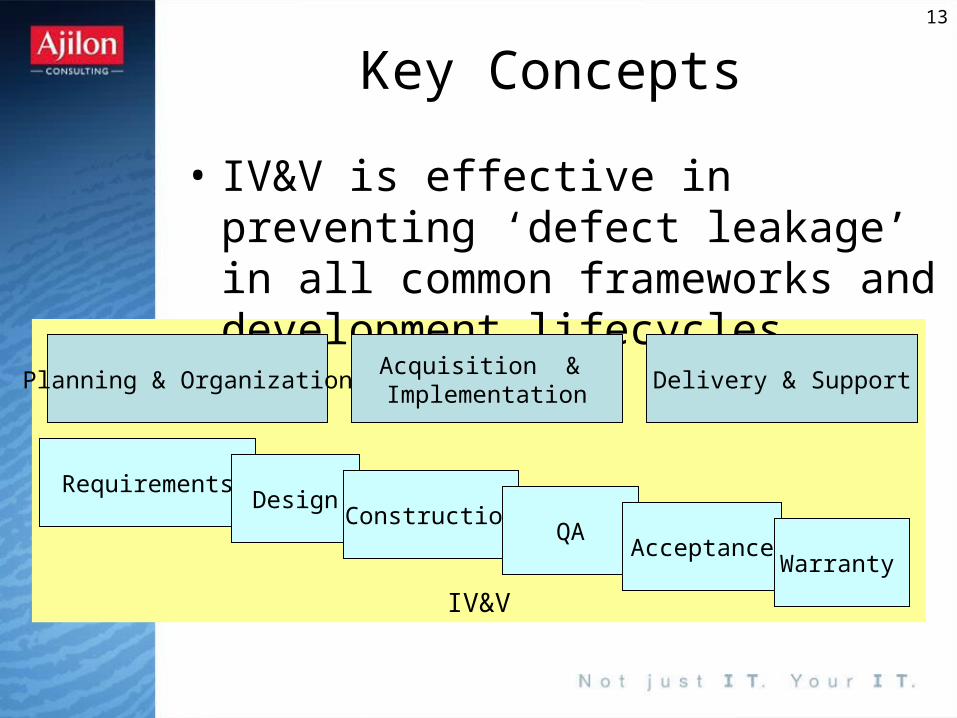
• IV&V is effective in preventing ‘defect leakage’ in all common frameworks and development lifecycles
Planning & OrganizationAcquisition & Implementation
Delivery & Support
RequirementsDesign
ConstructionQA
AcceptanceWarranty

14
Key Concepts
Importance of IV&V– Reduce system lifecycle risk– Increase customer satisfaction/retention– Increase the long-term success of a project
and the long-term health of an organization– Reduce Total Cost of Ownership (TCO)– Improve vendor selection/relation– Repeatability– Predictability– Manageability– Usability– Etc.

15
Case Studies
Good projects gone bad or
Snatching defeat from the jaws of victory.
Plus;
IV&V success stories
You make the call…
16
BT Case Study
• Seeking to reduce costs and deploy a standard helpdesk system for both internal and external users, BT evaluated a number of commercial solutions before selecting Remedy®.
• More than half of the proposed users were equipped with 21” screens and drivers that did not support the Remedy deployment.

17
XRT Case Study• XRT, the Cross Retail Workstation, will provide
Financial phone representatives a complete view of client positions and statutory guidance. Using this information representatives will cross sell products and deliver accurate actionable recommendations. Although technologically new in all respects (OOA, OOD, distributed transactions, GUI) the decision was made to bypass performance testing during the first release.
• Institutional customers, managed 1000’s of positions and regularly called representatives using XRT. XRT screens could take more than 30 minutes to populate the callers positions.
18
Hubble Case Study
• When the Hubble Space Telescope was being constructed, a decision was made to save costs by not assembling it on the ground to check all the alignments before sending it into space.
• After launch “…NASA announced that the telescope suffered from spherical aberration … the problem concerned two excellent yet mismatched mirrors …”
19
Digital Archive Case Study
• Digital assess under management were doubling every three months. Projections show managed storage exceeding 200 terabytes (1,000,000,000,000 bytes –
10004 or 1012 = 1 terabyte) However customer commitments were consistently missed and defect queues were growing at 2:1.
• Defect histograms were mapped to ClearCase file changes. A high correlation between 40% of defects observed and 5 files was established. The five files in question, and their functionality, are currently part of a re-architecture effort to establish a single archive asset format. A major client was lost to a competitor due to feature delay.

20
World Wide Rollout Case Study• The Project Manager for the world wide rollout
of Oracle Financials, at large financial firm, has lost confidence in his System Test team. The team was unable to express how the second three week cycle of system testing had gone nor could the team express how future cycles of testing could ensure a smooth delivery.
• Recovery includes developing standard methods to track and assess progress and predictive modeling to establish the reliability of the system.

21
Predictive Modeling
• Improves counsel regarding quality and readiness– More than a gut feel– Deliver critical systems with very high
confidence• Part science; part art
– Lots of curves (equations)– Experience helps– Context of project required
• Process centric– Good data; good models– Everything looks like a nail when you only
have a hammer

22
Modeling ProcessStep 1. Log past failures.Step 2. Organize failure data to support modeling
and context.Step 3. Copy or enter data using SMERFS3Step 4. Execute models and plot the failures.Step 5. Determine curve(s) that best fit project
context.Step 6. Copy curve data to MS Excel and project
using polynomial trend line. Step 7. Measure accuracy of curve models.Step 8. Predict the future using the model.Step 9. Repeat as necessary.

23
Results
Critical System Failure Predictions
y = -3E-05x4 + 0.0019x3 - 0.0488x2 + 0.5064x - 0.2344
y = -0.0003x3 + 0.0218x2 - 0.6117x + 6.9529
0
1
2
3
4
5
6
7
1 3 5 7 9 11 13 15 17 19 21 23 25
Interval (7 days)
Cri
tica
l Fai
lure
s
Yamada Curve
Schneidewind'sTreatment 2 Curve
Poly. (Yamada Curve)
Poly. (Schneidewind'sTreatment 2 Curve)
24
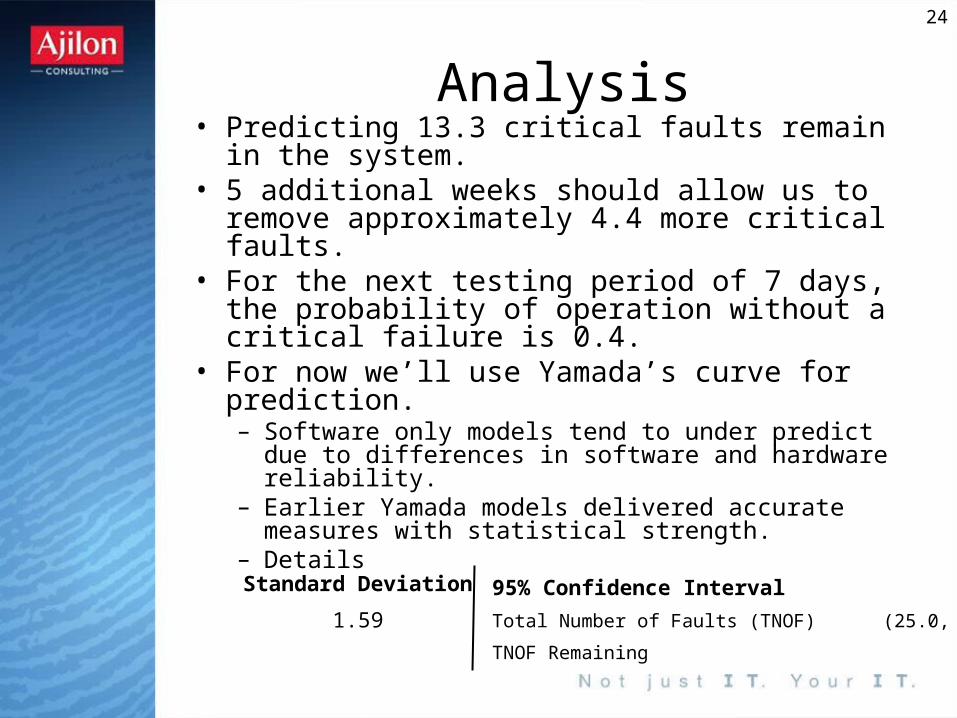
Analysis• Predicting 13.3 critical faults remain in the
system.• 5 additional weeks should allow us to remove
approximately 4.4 more critical faults.• For the next testing period of 7 days, the
probability of operation without a critical failure is 0.4.
• For now we’ll use Yamada’s curve for prediction.– Software only models tend to under predict due to
differences in software and hardware reliability.– Earlier Yamada models delivered accurate measures
with statistical strength. – Details
Standard Deviation
1.59
95% Confidence Interval
Total Number of Faults (TNOF) (25.0, 64.5)
TNOF Remaining (0.0, 39.5)

25
Application
• How do we start?– Start with a know high priority problem– Develop relationships with one or more
IV&V contractors– Build-out a Probability Risk Factors
table and apply• Repeat the process for each domain or
phase
26
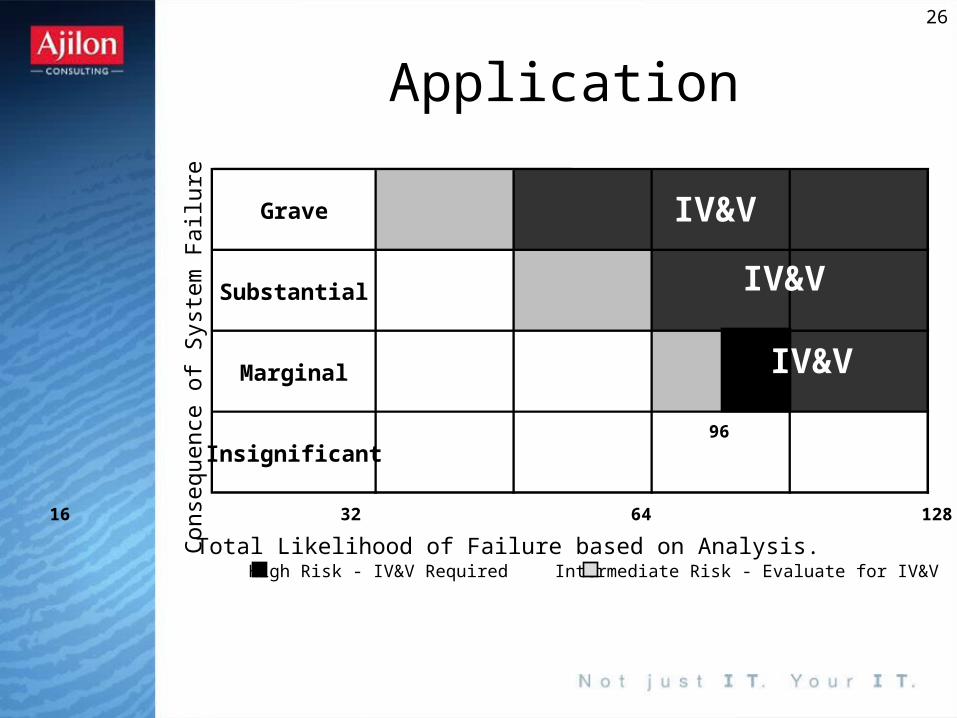
Application
Grave
Substantial
Marginal
Insignificant
16 32 64 128 250
96
IV&V
IV&V
IV&V
Con
sequ
ence
of
Sys
tem
Fai
lure
Total Likelihood of Failure based on Analysis.High Risk - IV&V Required Intermediate Risk - Evaluate for IV&V
27
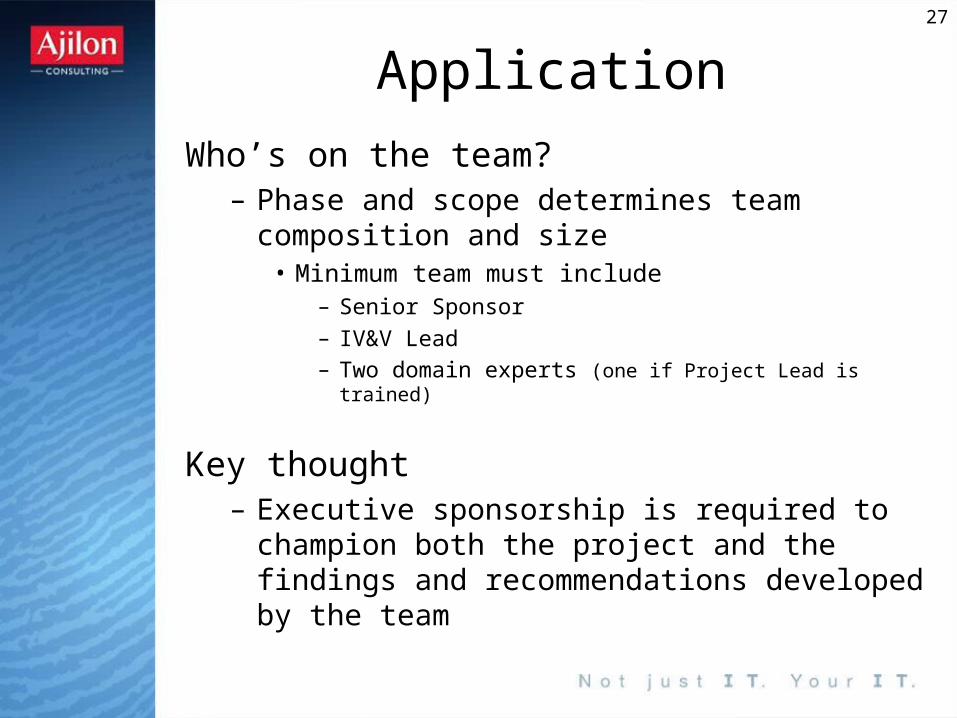
Application
Who’s on the team?– Phase and scope determines team
composition and size• Minimum team must include
– Senior Sponsor
– IV&V Lead– Two domain experts (one if Project Lead is trained)
Key thought– Executive sponsorship is required to champion
both the project and the findings and recommendations developed by the team

28
Application
What dose it cost?– Plan on 5 to 7 person months per 1K
Function Points• Don’t use FPs Java users can multiply FPs
by 68.
Key thought– Block IV&V activities throughout the
lifecycle to achieve highest ROI
29
Final Thoughts
• IV&V is a powerful and proven approach to reduce delivery risks
• Executive\Senior management support is essential
• Proper planning prevents poor performance
30
Final Thoughts
• Quality of results increase with organizational process maturity
• IV&V offers stakeholders impartial evaluations and recommendations as to how to best proceed in difficult situations
• Schedule Slips• Cost Increases• Project Termination

31
Final Thoughts
• “The leading driver for cost savings was internal process improvement, not the vendor resource costs.”*
Source: Ventoro Offshore Outsourcing Research Report, Oct 11, 2004
32
References
• Dr. Linda H. Rosenberg, Software Quality Assurance, NASA V&V presentation 10/2002
• Rogers, McCaugherty and Martin, Case Study of IV&V Return on Investment (ROI), NDIA presentation, 11/2000
• Hurley, Predictive Failure Arrival Modeling to Support System Readiness, Ajilon Presentation 2005
• Ventoro Offshore Outsourcing Research Report, Oct 11, 2004

33
Thank you for attending.
Will Hurley
Service Director
IT Quality Management
800.654.2748