independent measurement of matric and osmotic potential of soil water1
TRANSCRIPT

Independent Measurement of Matric and Osmotic Potential of Soil Water1
J. D. OSTER, S. L. RAWLINS, AND R. D. INGVALSON2
ABSTRACT
A technique is described that uses the operating principles ofthe thermocouple psychrometer and the porous plate apparatusto measure the matric and osmotic potentials of soil waterwithout extraction of a significant amount of soil solution. Thetechnique was tested on a Na-saturated Gila soil to whichNaCl solutions with osmotic potentials of —1, —2, and —6bars were added. The standard error of measurement of thesoil water potential components was ±0.04 bar. The measuredosmotic potentials of the soil were lower than those of theadded solutions, which can be explained by salt exclusion al-though mineral dissolution could contribute to these results.The technique also permitted measurement of the partial molarvolume of soil water with an accuracy of about ±1%. Withinthis precision, the partial molar volume of soil water in thisstudy was shown to be the same as that of pure water.
Additional Key Words for Indexing: salt exclusion, thermo-couple psychrometry, water density.
* s DEFINED by Aslyng (1963), total soil water potential/\. is the sum of the matric, osmotic, pressure, and gravi-tational potentials. These components are often used asthough they were independent variables, even though thereis reason to doubt that matric and osmotic potentials are,in general, independent (Bolt and Frissel, 1960). To deter-mine the extent of interaction, the components must bemeasured independently. In the past, independent measure-ment of the matric and osmotic potentials to evaluate theirinteractions and temperature dependence has requiredextraction of a sample of the soil solution to determine itsosmotic potential (Richards and Ogata, 1961). Duringextraction, the osmotic potential of the extract may changedue to salt sieving (Kemper, 1960). In this paper we pre-sent a technique that permits the independent measurementof the matric and osmotic components of soil water poten-tial without requiring the removal of a significant quantityof soil solution.
METHODS AND MATERIALSThe technique uses a soil thermocouple psychrometer similar
to that described by Rawlins and Dalton (1967), except thatthe porous ceramic bulb has a bubbling pressure of 15 bars andits interior is vented to the atmosphere. The psychrometer ismounted through the wall of a pressure chamber, which ispacked with soil. After the ceramic bulb attains equilibrium withthe soil, the psychrometer measures the soil water potential. Be-cause the inside of the ceramic bulb is always at atmosphericpressure, and because changes in elevation are not involved,the water potential measured by the psychrometer is the sum ofthe osmotic and matric potentials.
1 Contribution from the US Salinity Laboratory, SWC, ARS,USDA, P.O. Box 672, Riverside, Calif. 92502. This work wassupported in part by the Atmospheric Sciences Laboratory, Re-search Division, US Army Electronics Command, Fort Hua-chuca, Ariz. 85613. Received May 20, 1968. Approved Aug.14, 1968.
2 Research Soil Scientists and Chemist, respectively.
Osmotic and matric potentials are separated by the followingprocedure. By increasing the air pressure inside the soil cham-ber, the water potential of the soil is increased (with referenceto the atmospheric pressure inside the ceramic bulb) by a fixedamount. If, as will be discussed below, the soil water potentialis not pressure dependent (Richards, Low, and Decker, 1964),the water potential measured by the psychrometer will increaseby an amount equal to the increase in pressure potential in thesoil. When the pressure potential is numerically equal to thematric potential of the soil, a solution in equilibrium with thesoil solution at zero matric potential will exist on the inside sur-face of the ceramic bulb. At this pressure, the psychrometermeasures the osmotic potential of this solution. Further in-creases in pressure will cause solution to flow into the ceramicbulb, but the osmotic potential of this solution should remainconstant if the amount of solution moved is small. A plot ofwater potential versus applied pressure should have an abruptchange in slope at the pressure at which the matric potentialis exactly balanced. The matric potential of the soil water isequal to the negative of this pressure.
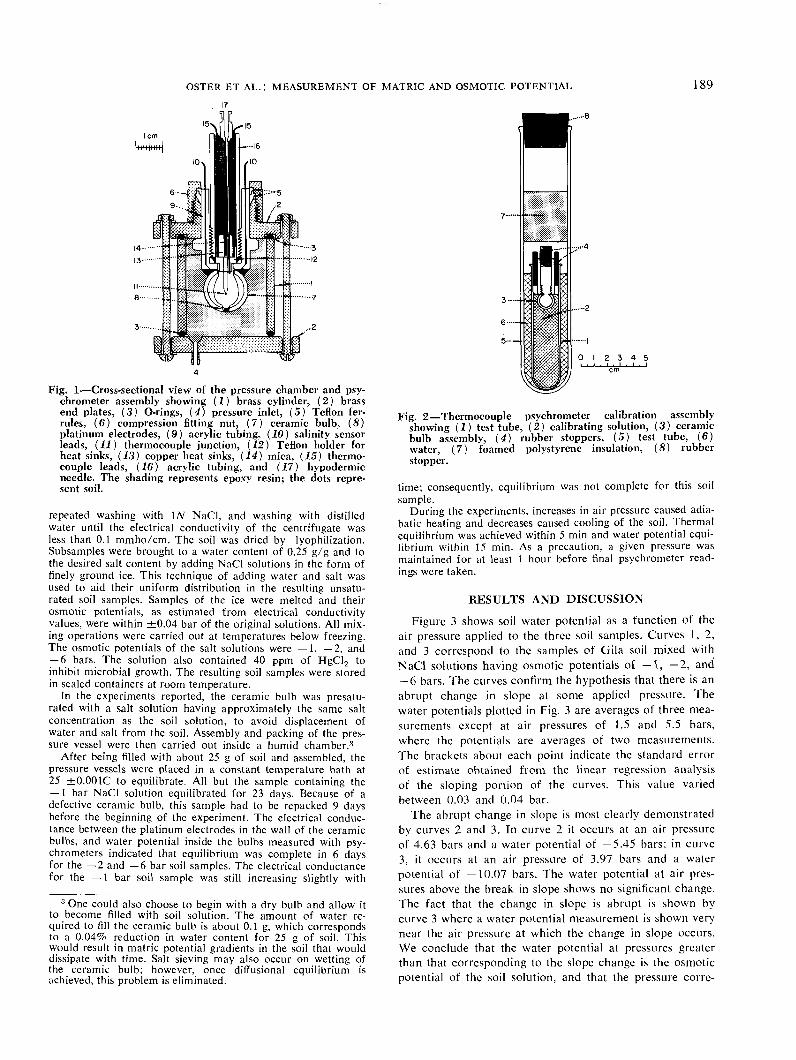
A cross-sectional view of the pressure chamber and psychrom-eter assembly is shown in Fig. 1. Initially, psychrometers werepermanently attached to ceramic bulbs in the manner describedby Rawlins and Dalton (1967). However, to make it possibleto remove thermocouples for calibration or replacement with-out disturbing the soil, the design was changed to that shown inthis figure. In this model, the psychrometer consists of a remov-able thermocouple assembly [11-17], and a ceramic bulb assem-bly [7-10]. (Numbers in brackets correspond to the numberedparts in the two figures.) A hypodermic needle [17] serves asan air vent for the ceramic bulb [7]. The two platinum elec-trodes [8] shown in the wall of the ceramic bulb permit measure-ment of the electrical conductance in the ceramic and conse-quently provide a simple method to verify that diffusionalequilibrium exists between the solution in the ceramic bulband soil. The compression fitting ferrules [5] and nut [6] posi-tion the ceramic bulb assembly in the brass end-plate [2] andalso provide an airtight seal. The brass end-plate [2], cylinder[1], and O-rings [3] are held together with four brass bolts. Theair pressure inside the vessel is regulated through the inlet [4].
Figure 2 shows the assembly that was used to calibrate thepsychrometer. The inner test tube [1] was filled with a standardKC1 solution [2], whose osmotic potential was calculated fromits concentration using data given by Lewis and Randall (1961).This test tube was plugged with a ceramic bulb assembly [3]and rubber stoppers [4]. This subassembly was placed into thelarger test tube [5], which was filled with water [6] to the levelshown in Fig. 2, and plugged with insulation [7] and a rubberstopper [8]. This arrangement facilitated the placement of theassembly into a constant temperature bath, provided for goodthermal contact with the bath fluid, and precluded the possibil-ity of the bath fluid getting into the ceramic bulb assembly. Aseparate assembly was used for each calibrating solution. Thissolution was replaced periodically. The calibration of a psy-chrometer consisted of inserting the thermocouple assembly intothe ceramic bulb assembly and placing the entire assembly intoa constant temperature bath. After equilibrium was established,three measurements were made of the thermocouple emf.
The thermocouple junction was made using the welding tech-nique of Campbell et al. (1968). The relationship betweenelectrical output of the thermocouple psychrometer and theosmotic potential was linear between — 1 and —20 bars, with anaverage sensitivity of 0.431 ,uv/bar at 25C and an average cor-relation coefficient of 0.9996.
The soil used was a Gila clay having a final exchangeable-sodium-percentage of 72. Preparation of this soil includedremoving calcium carbonate with IN ammonium acetate (pH 5),
188
OSTER ET AL.: MEASUREMENT OF MATRIC AND OSMOTIC POTENTIAL 189
Fig. 1—Cross-sectional view of the pressure chamber and psy-chrometer assembly showing (1) brass cylinder, (2) brassend plates, (3) O-rings, (4) pressure inlet, (5) Teflon fer-rules, (6) compression fitting nut, (7) ceramic bulb, (S)platinum electrodes, (9) acrylic tubing, (10) salinity sensorleads, (11) thermocouple junction, (12) Teflon holder forheat sinks, (13) copper heat sinks, (14) mica, (IS) thermo-couple leads, (16) acrylic tubing, and (17) hypodermicneedle. The shading represents epoxy resin; the dots repre-sent soil.
repeated washing with IN NaCl, and washing with distilledwater until the electrical conductivity of the centrifugate wasless than 0.1 mmho/cm. The soil was dried by lyophilization.Subsamples were brought to a water content of 0.25 g/g and tothe desired salt content by adding NaCl solutions in the form offinely ground ice. This technique of adding water and salt wasused to aid their uniform distribution in the resulting unsatu-rated soil samples. Samples of the ice were melted and theirosmotic potentials, as estimated from electrical conductivityvalues, were within ±0.04 bar of the original solutions. All mix-ing operations were carried out at temperatures below freezing.The osmotic potentials of the salt solutions were —1, —2, and— 6 bars. The solution also contained 40 ppm of HgCl2 toinhibit microbial growth. The resulting soil samples were storedin sealed containers at room temperature.
In the experiments reported, the ceramic bulb was presatu-rated with a salt solution having approximately the same saltconcentration as the soil solution, to avoid displacement ofwater and salt from the soil. Assembly and packing of the pres-sure vessel were then carried out inside a humid chamber.3
After being filled with about 25 g of soil and assembled, thepressure vessels were placed in a constant temperature bath at25 ±0.001C to equilibrate. All but the sample containing the— 1 bar NaCl solution equilibrated for 23 days. Because of adefective ceramic bulb, this sample had to be repacked 9 daysbefore the beginning of the experiment. The electrical conduc-tance between the platinum electrodes in the wall of the ceramicbulbs, and water potential inside the bulbs measured with psy-chrometers indicated that equilibrium was complete in 6 daysfor the —2 and —6 bar soil samples. The electrical conductancefor the — 1 bar soil sample was still increasing slightly with
3 One could also choose to begin with a dry bulb and allow itto become filled with soil solution. The amount of water re-quired to fill the ceramic bulb is about 0.1 g, which correspondsto a 0.04% reduction in water content for 25 g of soil. Thiswould result in matric potential gradients in the soil that woulddissipate with time. Salt sieving may also occur on wetting ofthe ceramic bulb; however, once diffusional equilibrium isachieved, this problem is eliminated.
Fig. 2—Thermocouple psychrometer calibration assemblyshowing (1) test tube, (2) calibrating solution, (3) ceramicbulb assembly, (4) rubber stoppers, (5) test tube, (6)water, (7) foamed polystyrene insulation, (8) rubberstopper.
time; consequently, equilibrium was not complete for this soilsample.
During the experiments, increases in air pressure caused adia-batic heating and decreases caused cooling of the soil. Thermalequilibrium was achieved within 5 min and water potential equi-librium within 15 min. As a precaution, a given pressure wasmaintained for at least 1 hour before final psychrometer read-ings were taken.
RESULTS AND DISCUSSION
Figure 3 shows soil water potential as a function of theair pressure applied to the three soil samples. Curves 1, 2,and 3 correspond to the samples of Gila soil mixed withNaCl solutions having osmotic potentials of — 1, — 2, and— 6 bars. The curves confirm the hypothesis that there is anabrupt change in slope at some applied pressure. Thewater potentials plotted in Fig. 3 are averages of three mea-surements except at air pressures of 1.5 and 5.5 bars,where the potentials are averages of two measurements.The brackets about each point indicate the standard errorof estimate obtained from the linear regression analysisof the sloping portion of the curves. This value variedbetween 0.03 and 0.04 bar.
The abrupt change in slope is most clearly demonstratedby curves 2 and 3. In curve 2 it occurs at an air pressureof 4.63 bars and a water potential of —5.45 bars; in curve3, it occurs at an air pressure of 3.97 bars and a waterpotential of —10.07 bars. The water potential at air pres-sures above the break in slope shows no significant change.The fact that the change in slope is abrupt is shown bycurve 3 where a water potential measurement is shown verynear the air pressure at which the change in slope occurs.We conclude that the water potential at pressures greaterthan that corresponding to the slope change is the osmoticpotential of the soil solution, and that the pressure corre-

190 SOIL SCI. SOC. AMER. PROC., VOL. 33, 1969
spending to the point of slope change is the negative ofthe matric potential of the soil solution.
The slopes of the initial portions of the curves are, in twoof the three cases, not significantly different from unity atthe 95% confidence level. The significant difference froma slope of unity for curve 1 may be a result of lack ofequilibrium arising from the fact that this soil was repacked9 days prior to the experiment. A further discussion of thesignificance of the slope of the curves will be given below.
To this point we have assumed that the application ofpressure does not involve transfer of a sufficient quantityof soil water into the ceramic bulb to change either thematric or osmotic potential. The water content of the insidesurface of the ceramic bulb increases as the soil waterpotential is increased by the application of pressure. Fromthe water retentivity data for ceramic plates (Richards andOgata, 1956), we estimate that less than 2 mg of soil wateris required to saturate the inside surface of the ceramicbulb. This amount of water represents a reduction in watercontent of 80 /xg/g in a 25-g sample of soil. The reductionin matric potential resulting from this change in water con-tent is dependent on the slope of the water retentivity curvefor the particular soil in question. For sandy soils near —15bars matric potential, a change in water content of 80,ug/g could result in a reduction in matric potential as
-2
-4
-6
Air Pressure - bars2 4
-10
-12
-14
Curve ISlope = 0.984 ±0.009
r=0.9999
Curve 2•-Slope = 0.995 ± 0.012
r=0.9998
Curve 3•Slope = 0.994 ± 0.026
r = 0.9996
Fig. 3—Soil water potential as a function of the air pressureapplied to the soil. The extent of the vertical line centeredon each point is equal to two times the standard error ofestimate.
great as 0.2 bar. The reduction for a clay soil would be onthe order of 0.02 bar at —15 bars matric potential. Athigher matric potentials, the slope of the water retentivitycurve decreases, and as a consequence, the error caused by.a change in water content of 80 jug/g would be even less.In most cases, therefore, errors as a result of this changein water content would not be measurable if sufficient timeis allowed for uniform redistribution of the water to takeplace. For the limiting case of —15 bars matric potential,the maximum time for redistribution is estimated to be4 hours, based on the pressure outflow equation of Gard-ner (1956).
Since the ceramic bulb holds about 0.1 g of water atsaturation, it also follows that a change in water contentof 2 mg cannot result in a significant change in osmoticpotential. This would be true even if all the salt in this vol-ume of water were excluded in the process of transfer andno salt were redistributed by diffusion between the time thepressure was applied and readings were taken.
Measured Osmotic Potentials
The measured osmotic potentials shown in Fig. 3 forcurves 1, 2, and 3 are —2.19, —5.45, and —10.07. Theseare more negative by 1.19, 3.45, and 4.07 bars than the— 1, —2, and —6 bar solutions that were initially added.Two explanations for these differences are possible: disso-lution of soil minerals (Rhoades, 1968) between thetime the soil was prepared and the conclusion of the experi-ment, or negative adsorption of anions causing salt exclu-sion and consequent decrease in the osmotic potential. Itis unlikely that the first explanation fully explains the morenegative values, since the dissolution of soil minerals wouldhave to add approximately 30 meq/liter to the concentra-tion of the — 1 bar solution initially added and approxi-mately four times that amount to the —6 bar solution.Rhoades reports a maximum increase in soil solution con-centration resulting from dissolution of soil minerals ofabout 5 meq/liter. (A value of about 20 meq/liter has beenobtained for one soil by Rhoades in more recent, unpub-lished work.) Consequently, dissolution could only par-tially account for the more negative osmotic potentials.
The low values of the osmotic potentials could also bea result of negative adsorption of anions or salt exclusion(Bolt and Warkentin, 1958; DeHaan and Bolt, 1963).Negative adsorption of anions results from a deficit inanion concentration close to the surface of soil particlescaused by the negatively charged particle surfaces. Thisdecrease in anion concentration results in salt exclusionnear particle surfaces with a resulting increase in the con-centration of the soil solution further from these surfaces.The concentration of the solution in the ceramic bulb,which is in equilibrium with the soil solution, would alsobe increased. From this increase in salt concentration, onecan compute an apparent volume of water which excludessalt. Calculations based on double layer theory predict thatthis exclusion volume is inversely dependent upon thesquare root of the salt concentration, and that it is alsoa function of the kind of exchangeable cation and saltcomposition.

OSTER ET AL.: MEASUREMENT OF MATRIC AND OSMOTIC POTENTIAL 191
Assuming no dissolution takes place, the fraction ofwater excluding salt can be calculated by subtracting from1 the ratio of the osmotic potential of the added salt solu-tion to that of the measured soil water osmotic potential.The resulting fractions are 0.54, 0.63, and 0.40 in orderof decreasing osmotic potential. Assuming an accuracy inmeasuring the osmotic potential of 0.1 bar, the error as-sociated with the above fractions decreases from 0.06 to0.01 as the osmotic potential becomes more negative.Using values of 0.63 and 0.40, a surface area of 272 m2/g(Bower and Hatcher, 1966) and a water content of 0.25g/g, the calculated thickness of the water excluding saltis 1.9 and 1.2 monolayers or 5.7 and 3.6A for the NaGila soil with osmotic potential of —5.45 and —10.07bars. Bower and Goertzen (1955) report for a Na-Chinosoil at water contents varying from 0.7 to 0.9 g/g that 5.3and 2.5A of water exclude salt at salt concentrations cor-responding to —5.4 and —49.8 bars. Our values for theNa-Gila fall within the same range. A comparison of ex-clusion thickness for the two soils seems reasonable sincethe Chino and Gila soils are similar, with surface areas of246 and 272 mVg, cation exchange capacities of 0.43 and0.41 meq/g, organic matter content of 1.91 and 1.96%and with the clay fraction dominated by montmorillonitein both cases. Consequently, salt exclusion can account forthe difference between the measured osmotic potentials ofthe soil solutions and those of the added salt solutions. Saltexclusion and dissolution are likely both occurring at thesame time with the relative importance of salt exclusionincreasing with decreasing osmotic potentials.
Because of the large fraction of water excluding saltin an unsaturated soil, this phenomenon will be importantif one needs to predict the osmotic potential as a functionof water content from measurements made on extractedsoil solutions. Further, if matric potential and osmoticpotential are interdependent, salt exclusion will also affectprediction of matric potential from water content data.The procedure described to measure the components ofthe water potential will serve to determine the magnitudeof these interactions in unsaturated soils.
Pressure Dependence of Water Potential
The slopes of the lines in Fig. 3 would be different fromunity if a difference existed between the partial jpolar vol-umes of the water in the calibrating solutions, V, and thesoil solutions, V. The soil water potential values in Fig.3 were calculated from the linear relationship betweenpsychrometer output and water potential of the calibratingsolutions. The water potential of these solutions is givenby the equation
^-RT/V In p/Po [H
where ^ is the water potential, R is the molar gas constant,T is the absolute temperature, p is the vapor pressure ofwater in the solution, and pn is the vapor pressure of purewater. At water potentials above —15 bars, the value ofV for the calibrating solutions is the same as that of purewater (Richards et al., 1964). Use of the calibration curve
for a sample other than the calibrating solutions assumesthe partial molar volume of water in both systems to bethe same. At a given temperature, the thermocouple out-put of a psychrometer is determined by the relative humid-tiy. But the water potential one calculates on the basis ofthis thermocouple output is dependent on the value of V.The same is true for a change in water potential \j/2 — \f/1,computed from the relation
^,2 — lf,1 = Ai/< = RT/V In p2/p1 [2]
where subscripts 1 and 2 refer to different values of thevariables. Thus, both the values on the ordinate and theslopes of the lines in Fig. 3 would be affected by variationsin V. Multiplication of equation [2] by V results in anexpression for the change in partial molar free energy ofwater in the calibrating solution. This, for a given changein thermocouple output and hence for a given ratio ofPZ/P!, also equals V' Ap (Bolt and Frissel, 1960, Eq. 6.2),where A P is a change in pressure on the soil in our sys-tem at pressures below the point of slope change in Fig. 3.As a result, a plot of ^ computed from the calibrationcurve versus the pressure applied will have a slope V'/V.From the slope of the line in Fig. 3, one can calculate F'with an accuracy of ± 1 %. Also, if V is not equal to V,then the sum of the matric and osmotic potentials at thepressure corresponding to the point of slope change willnot be equal to the total water potential measured at zeropressure. The total water potential would, in this case,depend on pressure as discussed by Richards et al. (1964).The slopes reported in Fig. 3 for curves 2 and 3 are unityand are additional evidence that the partial molar volumeof soil water is the same as that of pure water as foundby Richards et al. (1964). The deviation of the slopefrom unity for curve 1 probably results from a systematicerror, as discussed previously, though the possibility ofthere having been a slightly lower value (~1.5%) for Vthan that of pure water in this case cannot be completelydismissed.

192 SOIL SCI. SOC. AMER. PROC., VOL. 33, 1969