increasing costs in electric markets · increasing costs in electric markets ... estimate. to take...
TRANSCRIPT

1
Increasing Costs Increasing Costs in Electric Marketsin Electric Markets
Item No.: AItem No.: A--33June 19, 2008 June 19, 2008
Mr. Chairman and Commissioners, good morning. I am here to present the Office of Enforcement’s assessment of likely electricity costs in coming years. This presentation will be posted on the Commission’s Web site today.
2
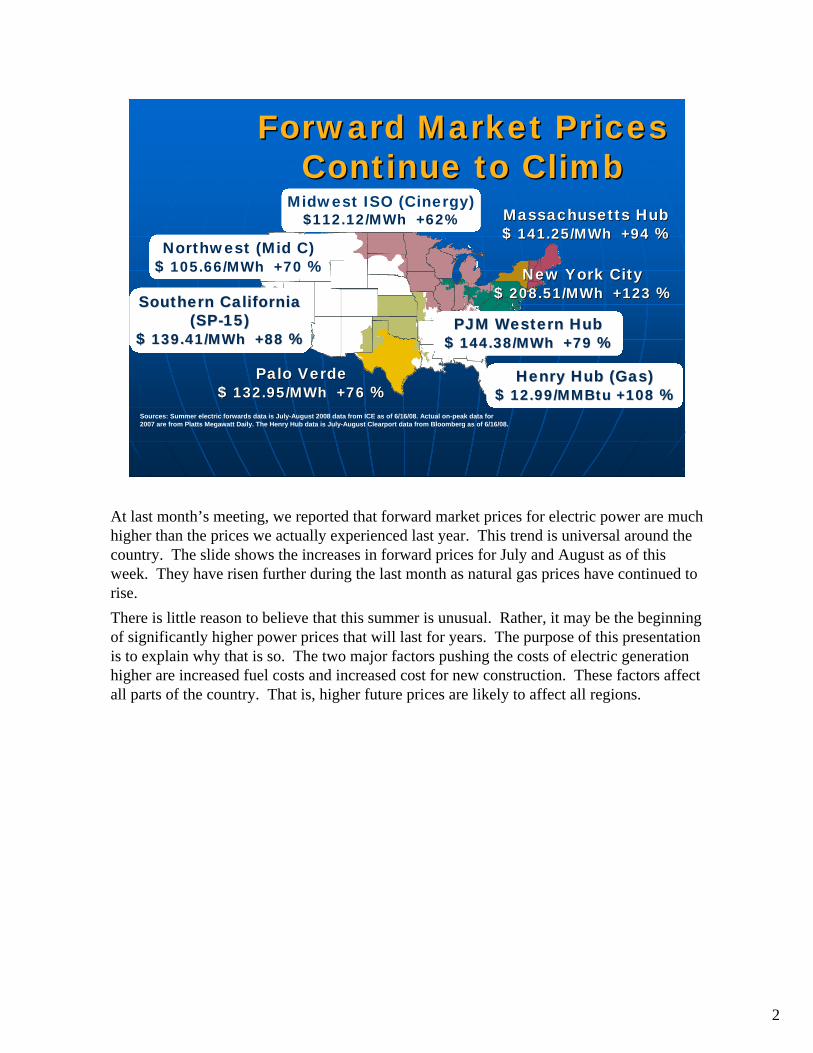
Forward Market Prices Forward Market Prices Continue to ClimbContinue to Climb
Sources: Summer electric forwards data is July-August 2008 data from ICE as of 6/16/08. Actual on-peak data for 2007 are from Platts Megawatt Daily. The Henry Hub data is July-August Clearport data from Bloomberg as of 6/16/08.
Southern California Southern California (SP(SP--15)15)
$ $ 139.41/MWh +88139.41/MWh +88 %%
Northwest (Mid C)$ 105.66/MWh +70 %
PJM Western HubPJM Western Hub$ $ 144.38/MWh +79144.38/MWh +79 %%
New York CityNew York City$ $ 208.51/MWh +123208.51/MWh +123 %%
Massachusetts HubMassachusetts Hub$ $ 141.25/MWh +94141.25/MWh +94 %%
Midwest ISO (Cinergy)$112.12/MWh +62%
Palo VerdePalo Verde$ $ 132.95/MWh +76132.95/MWh +76 %%
Henry Hub (Gas)Henry Hub (Gas)$ $ 12.99/MMBtu +10812.99/MMBtu +108 %%
At last month’s meeting, we reported that forward market prices for electric power are much higher than the prices we actually experienced last year. This trend is universal around the country. The slide shows the increases in forward prices for July and August as of this week. They have risen further during the last month as natural gas prices have continued to rise. There is little reason to believe that this summer is unusual. Rather, it may be the beginning of significantly higher power prices that will last for years. The purpose of this presentation is to explain why that is so. The two major factors pushing the costs of electric generation higher are increased fuel costs and increased cost for new construction. These factors affect all parts of the country. That is, higher future prices are likely to affect all regions.

3
Forward Gas Prices Forward Gas Prices Remain StrongRemain Strong
Source: Forward gas prices are Nymex. Annual average spot gas prices are Platts.
The primary reason for the electric power price increases this year is high fuel prices. All current market indications suggest that they will remain high. Let’s look at natural gas, which often determines prices because it is so frequently on the margin. The slide shows futures prices for the next few years. The futures prices are somewhat lower for 2009 than for 2008. Even so, they are a good deal higher for all years than the prices people actually paid last year, and they are much higher than the prices many of us remember from earlier in the decade. The implication is that markets anticipate continuing high prices, even though they know that the United States has seen a significant increase in domestic natural gas production over the last year and a half. The anticipation of further high prices makes more sense when one considers the likely increase in gas demand for generation and the global nature of competition for LNG.
4
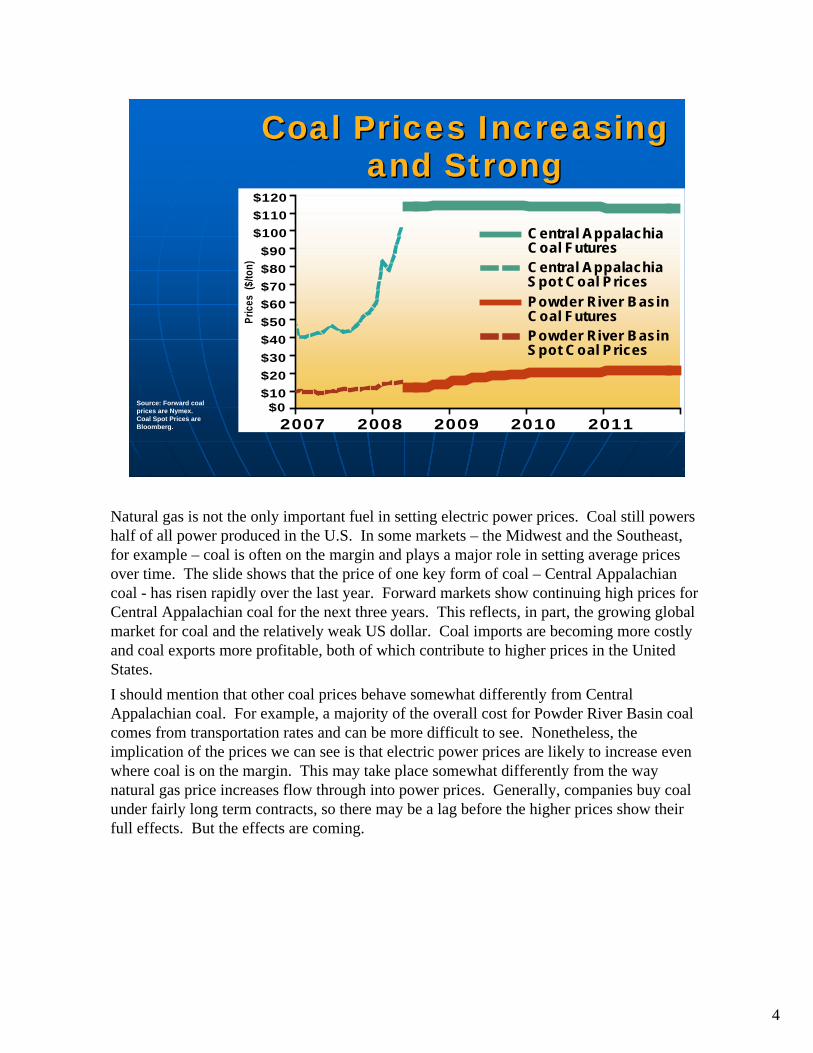
Coal Prices Increasing Coal Prices Increasing and Strongand Strong
Source: Forward coal prices are Nymex. Coal Spot Prices are Bloomberg.
$0$10$20$30$40$50$60$70$80$90
$100$110$120
2007 2008 2009 2010 2011
Pric
es($
/ton)
Central AppalachiaCoal FuturesCentral AppalachiaSpot Coal PricesPowder River BasinCoal FuturesPowder River BasinSpot Coal Prices
Natural gas is not the only important fuel in setting electric power prices. Coal still powers half of all power produced in the U.S. In some markets – the Midwest and the Southeast, for example – coal is often on the margin and plays a major role in setting average prices over time. The slide shows that the price of one key form of coal – Central Appalachian coal - has risen rapidly over the last year. Forward markets show continuing high prices for Central Appalachian coal for the next three years. This reflects, in part, the growing global market for coal and the relatively weak US dollar. Coal imports are becoming more costly and coal exports more profitable, both of which contribute to higher prices in the United States. I should mention that other coal prices behave somewhat differently from Central Appalachian coal. For example, a majority of the overall cost for Powder River Basin coal comes from transportation rates and can be more difficult to see. Nonetheless, the implication of the prices we can see is that electric power prices are likely to increase even where coal is on the margin. This may take place somewhat differently from the way natural gas price increases flow through into power prices. Generally, companies buy coal under fairly long term contracts, so there may be a lag before the higher prices show their full effects. But the effects are coming.

5
Net Natural Gas Net Natural Gas Generation by RegionGeneration by Region
((TWhTWh))
Source: Derived from Energy Velocity (differences due to rounding).
NortheastNortheast 66.366.3 103.9103.9 37.637.6RFCRFC 41.041.0 64.564.5 23.523.5SERCSERC 86.986.9 150.5150.5 63.663.6FRCCFRCC 42.042.0 96.796.7 54.754.7ERCOTERCOT 155.9155.9 163.3163.3 7.47.4MidwestMidwest 44.244.2 62.862.8 18.518.5WECCWECC--Rockies and SWRockies and SW 28.128.1 77.677.6 49.549.5WECCWECC--CA and NWCA and NW 115.4115.4 129.7129.7 14.414.4
RegionRegion 20002000 20072007 DifferenceDifference
While both natural gas and coal prices have increased rapidly, natural gas is increasingly important in every region of the country. The slide shows that even in regions where coal has historically dominated – most noticeably in SERC– natural gas usage has grown substantially since 2000, up 63.6 TWh in 2007, more than in any other region. Noticeable increases also occurred in FRCC, which has flexibility to burn either gas or oil at many facilities, and also in the Rockies and Southwest where demand continues to grow considerably.

6
NERC Net Load NERC Net Load Projections through 2016Projections through 2016
Source: Derived from NERC 2007 Long Term Reliability Assessment, Oct. 2007 and NERC data request, June 2008.
NortheastNortheast 9.79.7 1717RFCRFC 23.223.2 1313SERCSERC 28.228.2 1414FRCCFRCC 7.17.1 1515ERCOTERCOT 14.714.7 2424MidwestMidwest 17.217.2 2121WECCWECC--Rockies and SWRockies and SW 7.67.6 2525WECCWECC--CA and NWCA and NW 10.910.9 1010TotalTotal 108.8108.8 1414
RegionRegion Total Total Percent Percent Difference Difference ChangeChange
(GW)(GW)
The second major factor that will put upward pressure on electric power prices is the increasing cost of new construction. This effect is particularly important because the country is entering a period when we will need to make substantial new investments, especially in generation.Natural gas fueled most of the last great wave of generation investment, which occurred between 1995 and 2004. In recent years, demand in most regions has gradually caught up with the capacity built around 2000. Looking forward, demand will continue to grow, and the need for new capacity will become ever more acute and ever more widespread. The slide shows NERC’s expectation of peak net load growth in different regions for the next 10 years. We at the Commission are not in the business of forecasting, so I would just say this: There are legitimate reasons to be unsure about exactly how much new generation the country will need in the coming years. For one thing, higher prices will themselves discourage some power demand. Nonetheless, a significant level of demand increase seems virtually inevitable. So will be the need to build more capacity.
7
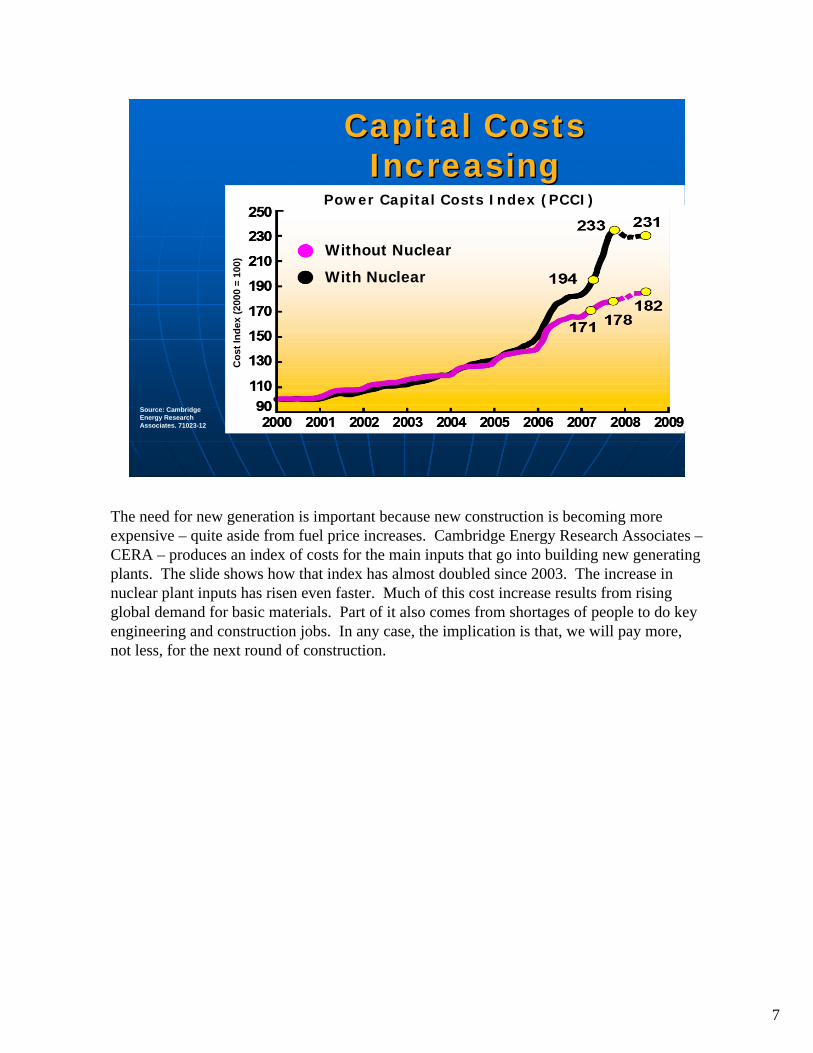
Capital Costs Capital Costs IncreasingIncreasing
Source: Cambridge Energy Research Associates. 71023-12
Cos
t Ind
ex (2
000
= 10
0)Without Nuclear
With Nuclear
Power Capital Costs Index (PCCI)
The need for new generation is important because new construction is becoming more expensive – quite aside from fuel price increases. Cambridge Energy Research Associates –CERA – produces an index of costs for the main inputs that go into building new generating plants. The slide shows how that index has almost doubled since 2003. The increase in nuclear plant inputs has risen even faster. Much of this cost increase results from rising global demand for basic materials. Part of it also comes from shortages of people to do key engineering and construction jobs. In any case, the implication is that, we will pay more, not less, for the next round of construction.
8
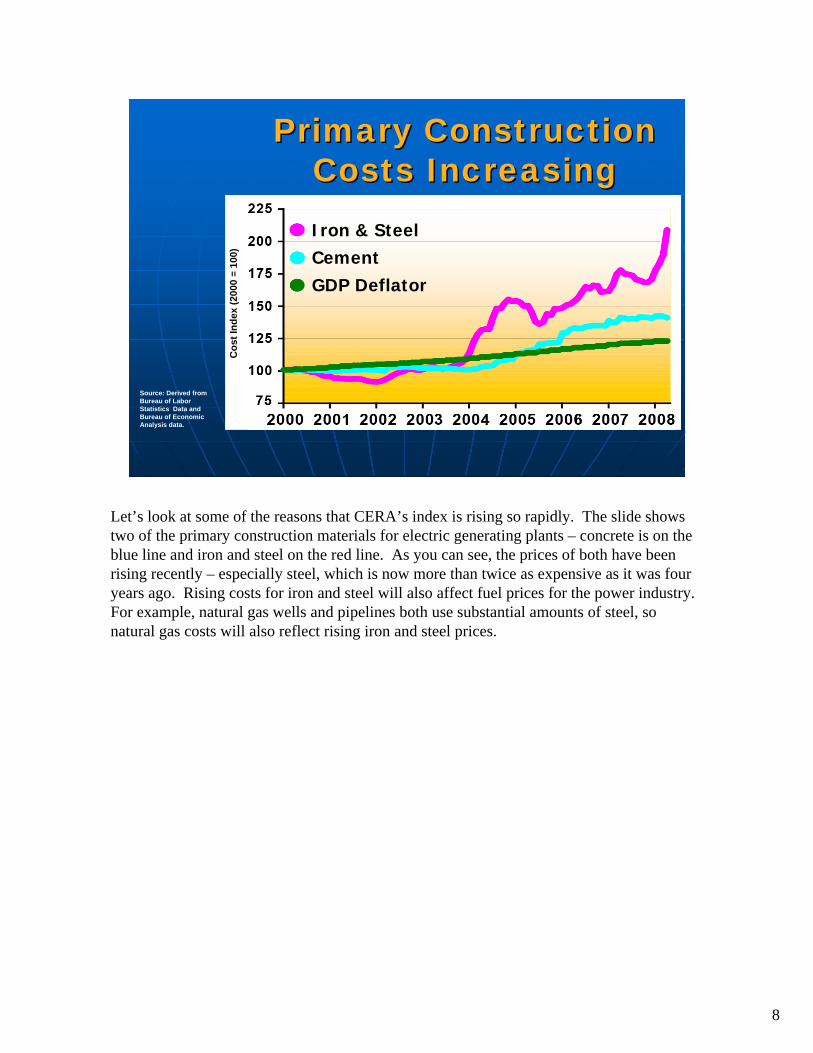
Primary Construction Primary Construction Costs IncreasingCosts Increasing
Source: Derived from Bureau of Labor Statistics Data and Bureau of Economic Analysis data.
Cos
t Ind
ex (2
000
= 10
0)Iron & SteelCementGDP Deflator
Let’s look at some of the reasons that CERA’s index is rising so rapidly. The slide shows two of the primary construction materials for electric generating plants – concrete is on the blue line and iron and steel on the red line. As you can see, the prices of both have been rising recently – especially steel, which is now more than twice as expensive as it was four years ago. Rising costs for iron and steel will also affect fuel prices for the power industry. For example, natural gas wells and pipelines both use substantial amounts of steel, so natural gas costs will also reflect rising iron and steel prices.

9
Secondary Construction Secondary Construction Costs IncreasingCosts Increasing
Source: Derived from Bureau of Labor Statistics Data and Bureau of Economic Analysis data.
Cos
t Ind
ex (2
000
= 10
0)CopperNickelZincAluminumGDP Deflator
Of course, new generating plants require many other basic commodities. The slide shows the pricing for four key metals that go into generators. As you can see, all of these metals are increasing in price. The one that stands out is copper, up more than five times over the past four years. Indeed, copper is now so valuable there are reports of copper thieves cutting live cables to steal the metal.
10
Labor Costs Labor Costs IncreasingIncreasing
Cos
t Ind
ex (2
000
= 10
0)Utility Labor
Construction Labor
GDP Deflator
Source: Derived from Bureau of Labor Statistics Data and Bureau of Economic Analysis data.
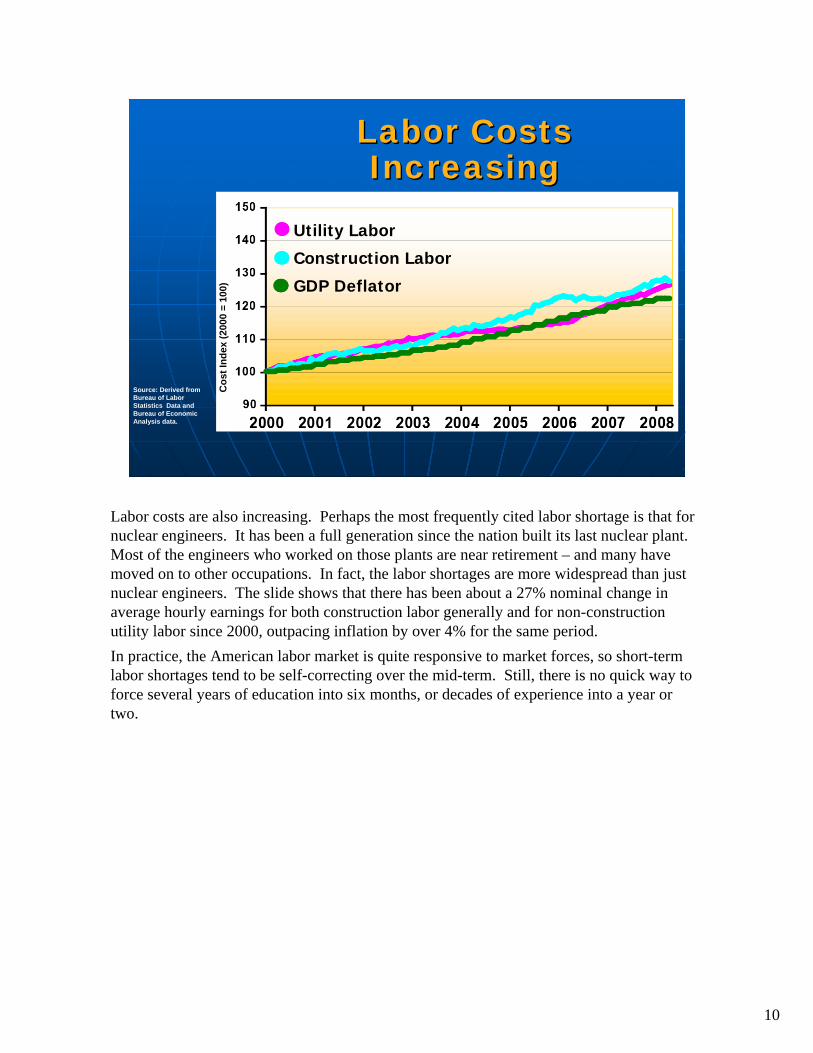
Labor costs are also increasing. Perhaps the most frequently cited labor shortage is that for nuclear engineers. It has been a full generation since the nation built its last nuclear plant. Most of the engineers who worked on those plants are near retirement – and many have moved on to other occupations. In fact, the labor shortages are more widespread than just nuclear engineers. The slide shows that there has been about a 27% nominal change in average hourly earnings for both construction labor generally and for non-construction utility labor since 2000, outpacing inflation by over 4% for the same period.In practice, the American labor market is quite responsive to market forces, so short-term labor shortages tend to be self-correcting over the mid-term. Still, there is no quick way to force several years of education into six months, or decades of experience into a year or two.
11
$0 1,000 2,000 3,000 4,000 5,000 6,000 7,000 8,000
Estimated Cost of Estimated Cost of New GenerationNew Generation
NuclearNuclearConventional CoalConventional Coal
IGCC CoalIGCC CoalCombined CycleCombined Cycle
Combustion TurbineCombustion TurbineWindWind
GeothermalGeothermalConcentrated SolarConcentrated Solar
Source: Compiled by FERC Staff from various sources. Cost estimates exclude carbon capture and sequestration costs.
$/kW$/kW
2003-042008
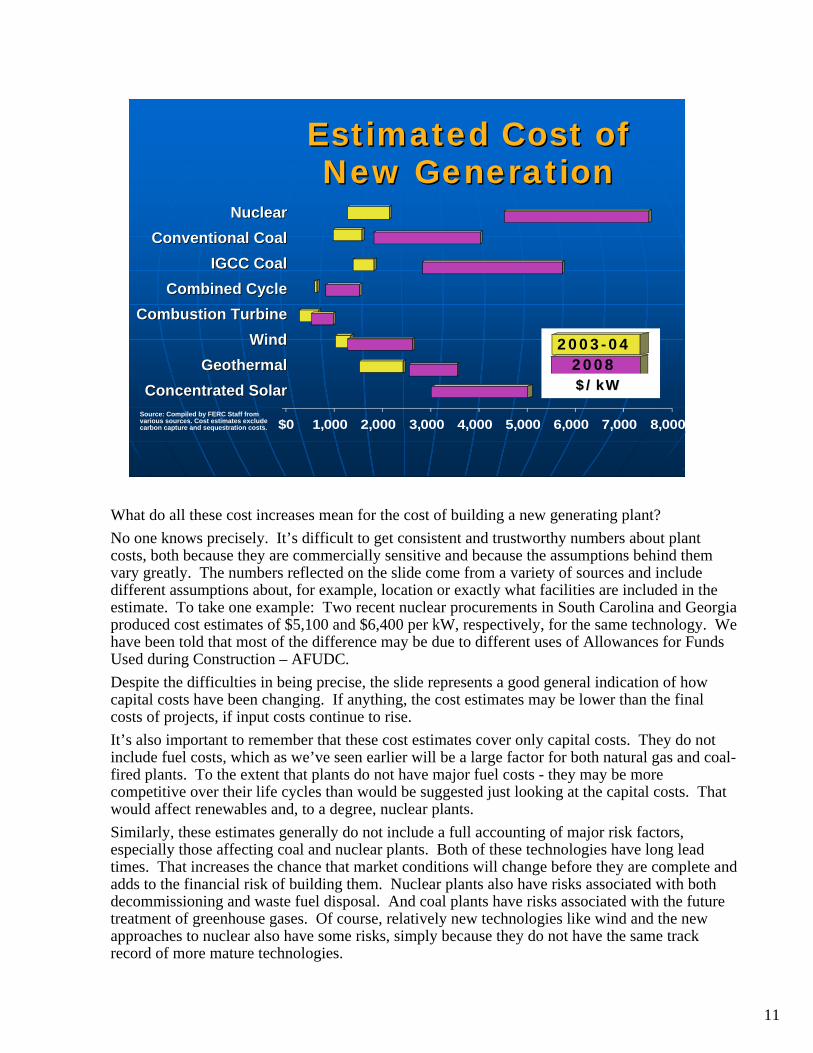
What do all these cost increases mean for the cost of building a new generating plant? No one knows precisely. It’s difficult to get consistent and trustworthy numbers about plant costs, both because they are commercially sensitive and because the assumptions behind them vary greatly. The numbers reflected on the slide come from a variety of sources and include different assumptions about, for example, location or exactly what facilities are included in the estimate. To take one example: Two recent nuclear procurements in South Carolina and Georgia produced cost estimates of $5,100 and $6,400 per kW, respectively, for the same technology. We have been told that most of the difference may be due to different uses of Allowances for Funds Used during Construction – AFUDC.Despite the difficulties in being precise, the slide represents a good general indication of how capital costs have been changing. If anything, the cost estimates may be lower than the final costs of projects, if input costs continue to rise.It’s also important to remember that these cost estimates cover only capital costs. They do not include fuel costs, which as we’ve seen earlier will be a large factor for both natural gas and coal-fired plants. To the extent that plants do not have major fuel costs - they may be more competitive over their life cycles than would be suggested just looking at the capital costs. That would affect renewables and, to a degree, nuclear plants.Similarly, these estimates generally do not include a full accounting of major risk factors, especially those affecting coal and nuclear plants. Both of these technologies have long lead times. That increases the chance that market conditions will change before they are complete and adds to the financial risk of building them. Nuclear plants also have risks associated with both decommissioning and waste fuel disposal. And coal plants have risks associated with the future treatment of greenhouse gases. Of course, relatively new technologies like wind and the new approaches to nuclear also have some risks, simply because they do not have the same track record of more mature technologies.

12
Climate Change Debate Climate Change Debate Affects the MarketAffects the Market
Uncertainty about future carbon Uncertainty about future carbon regime is a key factorregime is a key factorAffects coal most of allAffects coal most of all•• Greater carbon emissionsGreater carbon emissions•• Many plant cancellationsMany plant cancellations
At the least, coal builds will be At the least, coal builds will be delayeddelayed
Climate change has become an increasingly urgent national issue. The debate over how to address carbon dioxide emissions is lively and has already affected how companies think about investments. Until recently, rising natural gas prices made coal plants attractive. However, the national uncertainty about carbon policy has made investing in coal plants more risky. Without carbon capture or sequestration, coal unit emit about four times as much carbon as natural gas combined cycle units per MWh. Since January 2007, 50 coal plants have been canceled or postponed. Only 26 remain under construction. Whatever the eventual result of the climate change debate, costs of producing power from both coal and natural gas are likely to increase. Moreover, as long as future climate change policy is unclear, market participants will have a considerable disincentive to invest in coal plants. Even when the issues are resolved, it remains an open question how competitive coal-fired generation will be, and it would take another four to eight years to build new coal-fired capacity.

13
Natural Gas is Critical Natural Gas is Critical in the Midin the Mid--termterm
Coal and Nuclear Coal and Nuclear –– Long lead times Long lead times
RenewablesRenewables –– Important but do not Important but do not fill capacity needs (yet)fill capacity needs (yet)
Demand Response and Energy Demand Response and Energy Efficiency Efficiency –– Key ingredientsKey ingredients
Natural Gas Natural Gas –– The necessary The necessary technology for the immediate futuretechnology for the immediate future
Over the long run, the nation can meet its increasing need for generation in several ways. But for the next few years, the options are more limited, and natural gas will be crucial.The lead times for both nuclear and coal units mean that they will not supply a significant amount of new capacity for nearly a decade. Most people expect renewables to supply an increasing proportion of the nation’s power. For the next few years, wind will almost certainly account for a large share of generation investment and will account for a growing share of overall generation. Wind power has no fuel costs, and so will generally operate when available. However, wind is a variable, weather-dependent resource. As a result, it will not make up as strong a share of the Nation’s capacity needs over the next few years. Other renewables are becoming more competitive. Geothermal power is already an important resource in the west, and concentrated solar is becoming economically attractive in desert areas like the Southwest. But these sources are likely to remain relatively small in the national picture over the next few years. Both demand response and energy efficiency will be important – I’ll talk more about them on the next slide – but they are unlikely to eliminate the need for new capacity.Overall, the most likely outcome is that natural gas will continue to be the leading fuel for new capacity over the next half decade. For example, the consulting firm, Wood Mackenzie estimates that in a carbon constrained environment, gas consumption for power will increase by 69 % by 2017. That’s in addition to the 55% increase we’ve seen since 2000.

14
Potential Responses Potential Responses to High Pricesto High Prices
Economic Demand ResponseEconomic Demand Response
Energy Efficiency/ConservationEnergy Efficiency/Conservation
Technological InnovationTechnological Innovation
Over the years, we have learned repeatedly that people respond to prices. In the case of electric power, this is likely to take several forms.First, there is likely to be more demand response. In the simplest terms, high prices at peak will lead some customers – both businesses and others – to prefer to save their money rather than use power. In fact, the first round of demand response may be both the cheapest and fastest way to improve capacity margins on many systems. The best cost estimates for the first rounds of demand response suggest that it should be available for about $165/kW, far less than any generation side options. The results of ISO-NE’s first Forward Capacity Market auction last year corroborates the economic importance of demand response - 7.4 % of the accepted bids were for demand response. However, there are impediments that limit the full use of demand response. For example, most customers do not have the option to respond directly to real-time prices. As a result, they are unlikely to reduce peak consumption as much as they might prefer to if they could take advantage of the price.Second, customers are likely to be more energy efficient. While few customers see real-time prices, most get an average price over a month. As a result, high prices give them considerable incentive to reduce their overall consumption of power – though no more at peak than at other times. That is, energy efficiency is essentially a substitute for baseloadcapacity, while demand response is a substitute for peaking capacity. Energy efficiency is also likely to be economically important. Cost estimates show that the first round of energy efficiency may be available for about 3 cents/kWh. At
Continued on next page

15
Continued from previous page
current prices, supplying that same kWh from a combined cycle gas plant would cost 9 cents just for the fuel. Adding to the likelihood of greater energy efficiency is that many states have adopted fairly strong energy efficiency standards.
Third, innovators see higher prices as an opportunity. By the nature of things, it’s hard to predict what innovations will succeed. The electric industry has a number of technologies that might take off – including concentrating solar power, hydrokinetic power, and vehicle to grid technologies. In addition, distributed generation is becoming more important, and may continue to do so for both cost and emissions reasons In other newly competitive industries, such as telecoms and natural gas, innovations have produced large changes, sometimes quickly. Given continuing high electric prices, the electric power industry may see similar results.
16
Increasing Costs Increasing Costs in Electric Marketsin Electric Markets
Item No.: AItem No.: A--33June 19, 2008 June 19, 2008
That concludes our presentation. We welcome comments and questions.