increased dust deposition in the pacific southern ocean during glacial periods
TRANSCRIPT
DOI: 10.1126/science.1245424, 403 (2014);343 Science
et al.F. LamyGlacial PeriodsIncreased Dust Deposition in the Pacific Southern Ocean During
This copy is for your personal, non-commercial use only.
clicking here.colleagues, clients, or customers by , you can order high-quality copies for yourIf you wish to distribute this article to others
here.following the guidelines
can be obtained byPermission to republish or repurpose articles or portions of articles
): January 27, 2014 www.sciencemag.org (this information is current as of
The following resources related to this article are available online at
http://www.sciencemag.org/content/343/6169/403.full.htmlversion of this article at:
including high-resolution figures, can be found in the onlineUpdated information and services,
http://www.sciencemag.org/content/suppl/2014/01/23/343.6169.403.DC1.html can be found at: Supporting Online Material
http://www.sciencemag.org/content/343/6169/403.full.html#ref-list-1, 4 of which can be accessed free:cites 56 articlesThis article
http://www.sciencemag.org/cgi/collection/atmosAtmospheric Science
subject collections:This article appears in the following
registered trademark of AAAS. is aScience2014 by the American Association for the Advancement of Science; all rights reserved. The title
CopyrightAmerican Association for the Advancement of Science, 1200 New York Avenue NW, Washington, DC 20005. (print ISSN 0036-8075; online ISSN 1095-9203) is published weekly, except the last week in December, by theScience
on
Janu
ary
27, 2
014
ww
w.s
cien
cem
ag.o
rgD
ownl
oade
d fr
om
on
Janu
ary
27, 2
014
ww
w.s
cien
cem
ag.o
rgD
ownl
oade
d fr
om
on
Janu
ary
27, 2
014
ww
w.s
cien
cem
ag.o
rgD
ownl
oade
d fr
om
on
Janu
ary
27, 2
014
ww
w.s
cien
cem
ag.o
rgD
ownl
oade
d fr
om
on
Janu
ary
27, 2
014
ww
w.s
cien
cem
ag.o
rgD
ownl
oade
d fr
om
on
Janu
ary
27, 2
014
ww
w.s
cien
cem
ag.o
rgD
ownl
oade
d fr
om
correlates with the deepest part of the sedimen-tary basin.
The predicted ground motion is qualitativelysimilar for the VEA and CyberShake simulations(figs. S4 and S5); however, there are substantialquantitative differences in the level and distribu-tion of the shaking (Fig. 4). SAVELA resultsshow stronger shaking than CyberShake at mostsites. This is especially true for receivers in thebasin. We note that both methods are subject tosubstantial uncertainties. The accuracy of theCyberShake simulations depends strongly on theaccuracy of the assumed crustal velocity modeland its derived Green’s functions. The accuracyof the virtual earthquake results depends stronglyboth on the accuracy of the ambient-field Green’sfunctions and on the accuracy of the amplitudecalibration. The Green’s functions we used forthis study (fig. S1) would be more accurate if wehad data from a longer deployment. To estimatethe variability in PGV due to the amplitude cal-ibration described above, we measure the max-imum difference in predicted PGV when usingthe calibration from either the Hector Road orChino Hills earthquake to the mean of the cali-bration used in this study. The variability that re-sults is bounded at 10 cm/s for our simulations.For both the virtual earthquake and CyberShakesimulations, the variation of the PGV is narrowfor stations with low PGV values (bedrock sites)and wide for stations with high PGV values (basinsites). The coefficient of variation is approximate-ly constant for SAVELA (fig. S7), which indicatesthat variability increases proportionallywith groundmotion amplitude.
Nonlinear effects in shallow materials are im-portant in strong ground motion. Ground motionsimulations that have incorporated nonlinear soileffects (29) have found a large decrease in thepredicted strong groundmotion. This could be animportant effect for the scenarios we considerbecause unconsolidated sediments are likely to befound in sedimentary basins and would be ex-pected to behave nonlinearly during strong shaking.We calibrated the amplitudes of the Green’s func-tions, such that the peak amplitudes predictedby our approach matched those of moderate-sized earthquakes. Our approach, as well as theCyberShake simulations, is based on an assump-tion of linearity. To the extent that nonlinear ef-fects are important, our predicted ground motionamplitudes are likely to overestimate true ampli-tudes in future large earthquakes.
We confirm the presence and the influence ofa waveguide to the west of San Gorgonio Passthat funnels seismic waves from San Andreasfault events into the Los Angeles Basin. Thisamplification is present for all tested scenarios.We also confirm that directivity couples withshallow crustal structure to increase basin am-plification (6). We find a constant coefficient ofvariation, which means that shaking variabilityis proportional to shaking intensity. We also finda wider range of predicted peak amplitudes thanis found in simulations, which would increase
uncertainty in ground motion predictions andthereby impact seismic hazard assessments. Wenote, however, that there are substantial uncer-tainties in our estimated Green’s functions andtheir amplitude calibration. Moreover, station cov-erage in the basin is sparse, and we have onlysampled a small portion of the variability expectedfor a complex wavefield in the basin. Our resultssupport more ambitious, targeted experimentsto improve the accuracy of long-period strongground motion prediction for future earthquakesin regions subject to high seismic risk.
References and Notes1. P.-Y. Bard, M. Campillo, F. J. Chávez-Garcia,
F. J. Sánchez-Sesma, Earthq. Spectra 4, 609–633(1988).
2. K. B. Olsen, R. J. Archuleta, J. R. Matarese, Science 270,1628–1632 (1995).
3. K. Olsen et al., Geophys. Res. Lett. 33, L07305(2006).
4. K. B. Olsen et al., Geophys. Res. Lett. 36, L04303(2009).
5. K. B. Olsen, Bull. Seismol. Soc. Am. 90 (6B), S77–S94(2000).
6. R. Graves et al., Pure Appl. Geophys. 168, 367–381(2011).
7. S. M. Day, D. Roten, K. B. Olsen, Geophys. J. Int. 189,1103–1124 (2012).
8. K. Aki, Bull. Earthq. Res. I. Tokyo 35, 415 (1957).9. J. Claerbout, Geophysics 33, 264–269 (1968).10. O. I. Lobkis, R. L. Weaver, J. Acoust. Soc. Am. 110, 3011
(2001).11. R. L. Weaver, O. I. Lobkis, Geophysics 71, S15
(2006).12. F. J. Sánchez-Sesma, M. Campillo, Bull. Seismol. Soc. Am.
96, 1182–1191 (2006).13. M. Campillo, A. Paul, Science 299, 547–549 (2003).14. N. M. Shapiro, M. Campillo, Geophys. Res. Lett. 31,
L07614 (2004).15. K. G. Sabra, P. Gerstoft, P. Roux, W. A. Kuperman,
M. C. Fehler, Geophys. Res. Lett. 32, L03310(2005).
16. N. M. Shapiro, M. Campillo, L. Stehly, M. H. Ritzwoller,Science 307, 1615–1618 (2005).
17. K. Nishida, H. Kawakatsu, K. Obara, J. Geophys. Res. 113(B10), B10302 (2008).
18. G. A. Prieto, J. F. Lawrence, G. C. Beroza, J. Geophys. Res.114 (B7), B07303 (2009).
19. G. A. Prieto, M. Denolle, J. F. Lawrence, G. C. Beroza,C. R. Geosci. 343, 600–614 (2011).
20. G. A. Prieto, G. C. Beroza, Geophys. Res. Lett. 35, L14304(2008).
21. M. A. Denolle, E. M. Dunham, G. A. Prieto, G. C. Beroza,J. Geophys. Res. 118, 2102 (2013).
22. R. Burridge, L. Knopoff, Bull. Seismol. Soc. Am. 54,1875–1888 (1964).
23. H. Magistrale, S. Day, R. W. Clayton, R. Graves,Bull. Seismol. Soc. Am. 90 (6B), S65–S76 (2000).
24. M. D. Kohler, H. Magistrale, R. W. Clayton, Bull. Seismol.Soc. Am. 93, 757–774 (2003).
25. M. A. Denolle, E. M. Dunham, G. C. Beroza, Bull. Seismol.Soc. Am. 102, 1214–1223 (2012).
26. L. Stehly, M. Campillo, N. Shapiro, J. Geophys. Res. 111(B10), B10306 (2006).
27. M. Guatteri, P. M. Mai, G. C. Beroza, Bull. Seismol.Soc. Am. 94, 2051–2063 (2004).
28. K. W. Campbell, Y. Bozorgnia, Bull. Seismol. Soc. Am. 93,314–331 (2003).
29. D. Roten, K. B. Olsen, J. C. Pechmann, Bull. Seismol.Soc. Am. 102, 2008–2030 (2012).
Acknowledgments: We thank K. Olsen and anonymousreviewers for their comments and contributions to improvethe manuscript. This work was supported by NSF grantEAR-0943885 and by the Southern California EarthquakeCenter (SCEC). SCEC is funded by NSF cooperative agreementEAR-0529922 and U.S. Geological Survey cooperativeagreement 07HQAG0008. The SCEC contribution numberfor this paper is 1812. Data are available in the supplementarymaterials.
Supplementary Materialswww.sciencemag.org/content/343/6169/399/suppl/DC1Materials and MethodsFigs. S1 to S7References (30–33)
9 September 2013; accepted 19 December 201310.1126/science.1245678
Increased Dust Deposition in thePacific Southern Ocean DuringGlacial PeriodsF. Lamy,1,2* R. Gersonde,1,2 G. Winckler,3,4 O. Esper,1 A. Jaeschke,1,2 G. Kuhn,1 J. Ullermann,1
A. Martinez-Garcia,5 F. Lambert,6 R. Kilian7
Dust deposition in the Southern Ocean constitutes a critical modulator of past global climatevariability, but how it has varied temporally and geographically is underdetermined. Here, wepresent data sets of glacial-interglacial dust-supply cycles from the largest Southern Ocean sector,the polar South Pacific, indicating three times higher dust deposition during glacial periodsthan during interglacials for the past million years. Although the most likely dust source for theSouth Pacific is Australia and New Zealand, the glacial-interglacial pattern and timing of lithogenicsediment deposition is similar to dust records from Antarctica and the South Atlantic dominatedby Patagonian sources. These similarities imply large-scale common climate forcings, such aslatitudinal shifts of the southern westerlies and regionally enhanced glaciogenic dust mobilizationin New Zealand and Patagonia.
Mineral aerosols (dust) play a crucial rolein determining the pattern and mag-nitude of climate variability. Dust im-
purities trapped in Antarctic ice point to ~25 timeshigher glacial dust fluxes compared with inter-glacials (1). It has been suggested that an increase
www.sciencemag.org SCIENCE VOL 343 24 JANUARY 2014 403
REPORTS
in the atmospheric supply of iron (Fe) by dustduring glacial periods may have stimulated ma-rine productivity in the Southern Ocean (SO),contributing to the reduction of atmospheric CO2
concentrations observed during ice ages (2).Dust-induced Fe fertilization represents one keymechanism that potentially affects past ocean-atmosphere CO2 exchange (3–5), although themagnitude with respect to other SO processessuch as sea-ice extent, overturning strength, andwater column stratification is still under debate(5, 6). Antarctic ice cores allow only an indirectqualitative inference of dust deposition over theocean and cannot be used to quantitatively es-timate dust deposition in the different SO sec-tors. Marine sediments, however, provide a directestimate of SO dust deposition and marine ex-port production. To date, marine studies are pri-marily confined to the Atlantic SO sector locateddownstream of Patagonia, a strong dust sourceduring glacial periods. In that region, substan-tially enhanced glacial dust fluxes and sub-antarctic productivity have been interpreted tocontrol, at most, one-third to one-half of the ob-served glacial-interglacial atmospheric CO2 dif-ference (4, 7), consistent with similar resultsbased on the phasing of dust and CO2 fluc-tuations in the Epica Dome C (EDC) ice core(8). However, this finding is based on the as-sumption that dust deposition and Fe fertiliza-tion take place equally in the entire SubantarcticZone. Biogeochemical models with geograph-ically variable dust fields for the SO suggest asomewhat lower CO2 reduction (9).
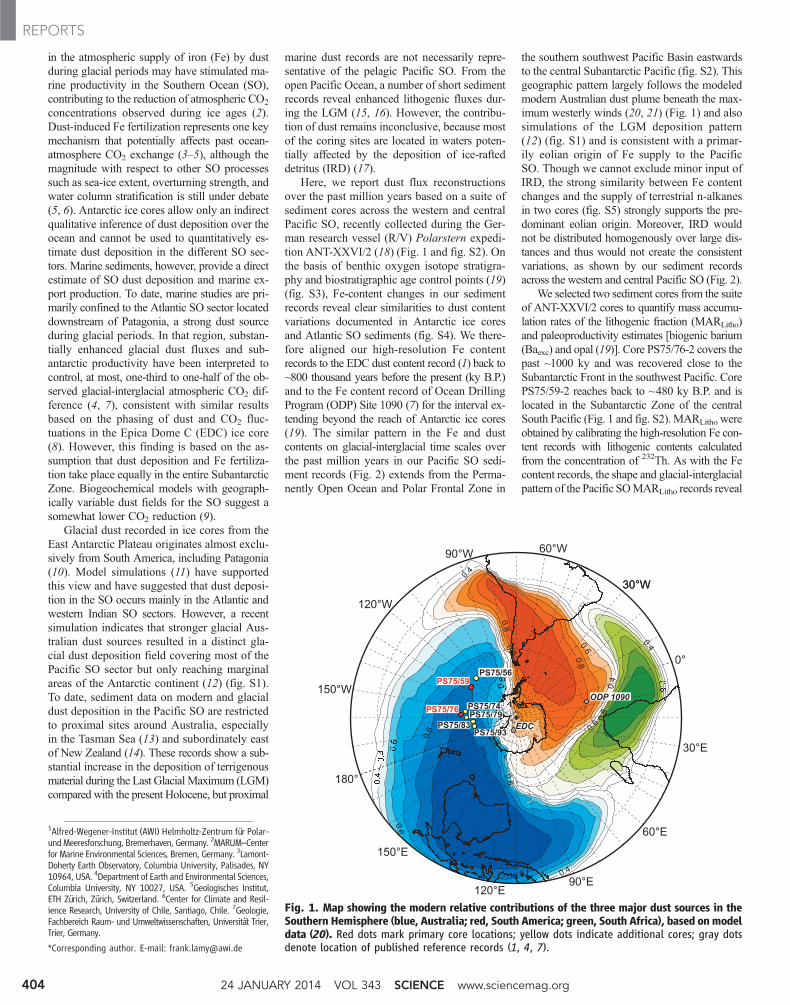
Glacial dust recorded in ice cores from theEast Antarctic Plateau originates almost exclu-sively from South America, including Patagonia(10). Model simulations (11) have supportedthis view and have suggested that dust deposi-tion in the SO occurs mainly in the Atlantic andwestern Indian SO sectors. However, a recentsimulation indicates that stronger glacial Aus-tralian dust sources resulted in a distinct gla-cial dust deposition field covering most of thePacific SO sector but only reaching marginalareas of the Antarctic continent (12) (fig. S1).To date, sediment data on modern and glacialdust deposition in the Pacific SO are restrictedto proximal sites around Australia, especiallyin the Tasman Sea (13) and subordinately eastof New Zealand (14). These records show a sub-stantial increase in the deposition of terrigenousmaterial during the Last Glacial Maximum (LGM)compared with the present Holocene, but proximal
marine dust records are not necessarily repre-sentative of the pelagic Pacific SO. From theopen Pacific Ocean, a number of short sedimentrecords reveal enhanced lithogenic fluxes dur-ing the LGM (15, 16). However, the contribu-tion of dust remains inconclusive, because mostof the coring sites are located in waters poten-tially affected by the deposition of ice-rafteddetritus (IRD) (17).
Here, we report dust flux reconstructionsover the past million years based on a suite ofsediment cores across the western and centralPacific SO, recently collected during the Ger-man research vessel (R/V) Polarstern expedi-tion ANT-XXVI/2 (18) (Fig. 1 and fig. S2). Onthe basis of benthic oxygen isotope stratigra-phy and biostratigraphic age control points (19)(fig. S3), Fe-content changes in our sedimentrecords reveal clear similarities to dust contentvariations documented in Antarctic ice coresand Atlantic SO sediments (fig. S4). We there-fore aligned our high-resolution Fe contentrecords to the EDC dust content record (1) back to~800 thousand years before the present (ky B.P.)and to the Fe content record of Ocean DrillingProgram (ODP) Site 1090 (7) for the interval ex-tending beyond the reach of Antarctic ice cores(19). The similar pattern in the Fe and dustcontents on glacial-interglacial time scales overthe past million years in our Pacific SO sedi-ment records (Fig. 2) extends from the Perma-nently Open Ocean and Polar Frontal Zone in
the southern southwest Pacific Basin eastwardsto the central Subantarctic Pacific (fig. S2). Thisgeographic pattern largely follows the modeledmodern Australian dust plume beneath the max-imum westerly winds (20, 21) (Fig. 1) and alsosimulations of the LGM deposition pattern(12) (fig. S1) and is consistent with a primar-ily eolian origin of Fe supply to the PacificSO. Though we cannot exclude minor input ofIRD, the strong similarity between Fe contentchanges and the supply of terrestrial n-alkanesin two cores (fig. S5) strongly supports the pre-dominant eolian origin. Moreover, IRD wouldnot be distributed homogenously over large dis-tances and thus would not create the consistentvariations, as shown by our sediment recordsacross the western and central Pacific SO (Fig. 2).
We selected two sediment cores from the suiteof ANT-XXVI/2 cores to quantify mass accumu-lation rates of the lithogenic fraction (MARLitho)and paleoproductivity estimates [biogenic barium(Baexc) and opal (19)]. Core PS75/76-2 covers thepast ~1000 ky and was recovered close to theSubantarctic Front in the southwest Pacific. CorePS75/59-2 reaches back to ~480 ky B.P. and islocated in the Subantarctic Zone of the centralSouth Pacific (Fig. 1 and fig. S2). MARLitho wereobtained by calibrating the high-resolution Fe con-tent records with lithogenic contents calculatedfrom the concentration of 232Th. As with the Fecontent records, the shape and glacial-interglacialpattern of the Pacific SOMARLitho records reveal
1Alfred-Wegener-Institut (AWI) Helmholtz-Zentrum für Polar-undMeeresforschung, Bremerhaven, Germany. 2MARUM–Centerfor Marine Environmental Sciences, Bremen, Germany. 3Lamont-Doherty Earth Observatory, Columbia University, Palisades, NY10964, USA. 4Department of Earth and Environmental Sciences,Columbia University, NY 10027, USA. 5Geologisches Institut,ETH Zürich, Zürich, Switzerland. 6Center for Climate and Resil-ience Research, University of Chile, Santiago, Chile. 7Geologie,Fachbereich Raum- und Umweltwissenschaften, Universität Trier,Trier, Germany.
*Corresponding author. E-mail: [email protected]
Fig. 1. Map showing the modern relative contributions of the three major dust sources in theSouthern Hemisphere (blue, Australia; red, South America; green, South Africa), based onmodeldata (20). Red dots mark primary core locations; yellow dots indicate additional cores; gray dotsdenote location of published reference records (1, 4, 7).
24 JANUARY 2014 VOL 343 SCIENCE www.sciencemag.org404
REPORTS
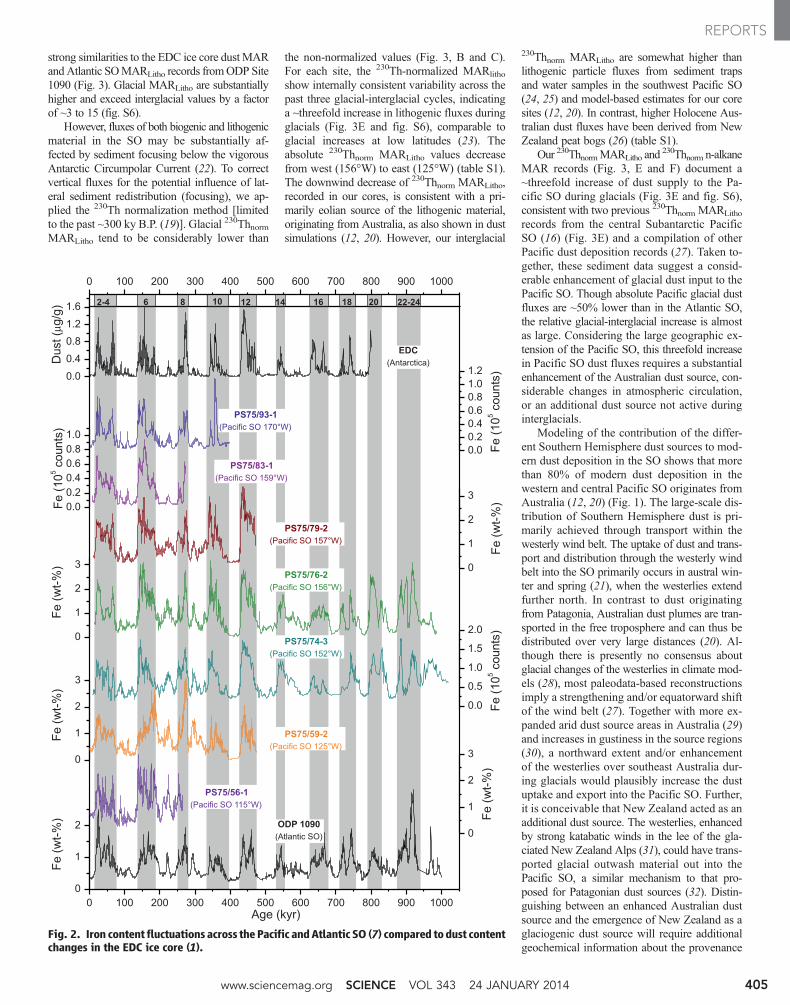
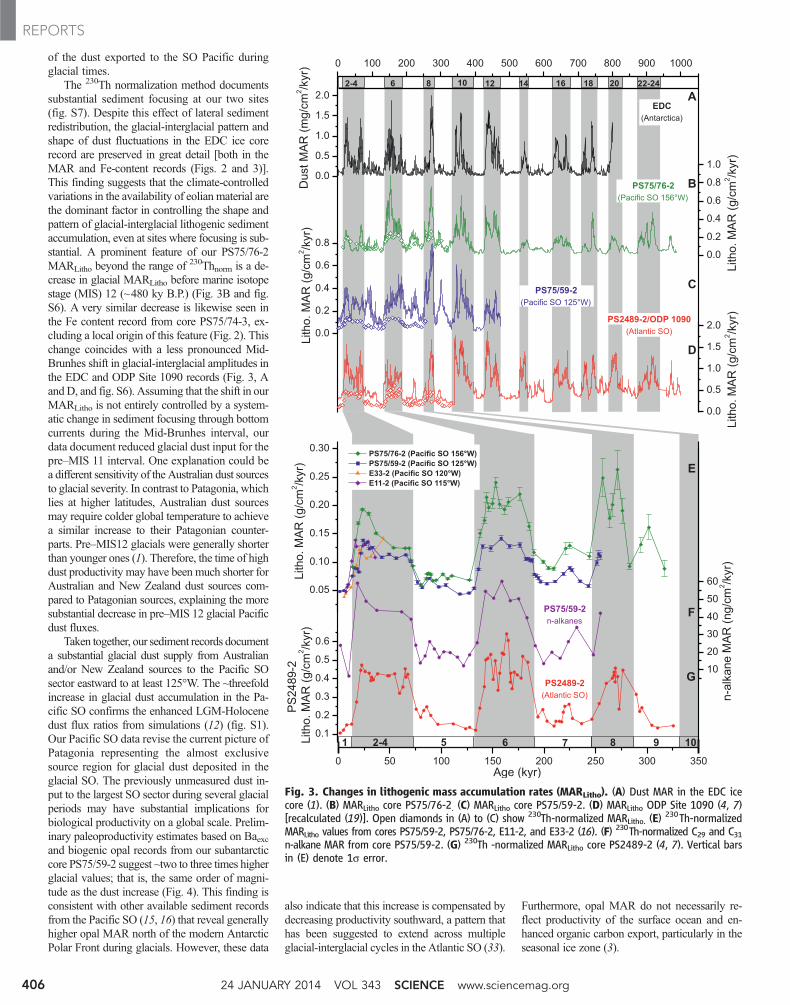
strong similarities to the EDC ice core dust MARandAtlantic SOMARLitho records fromODP Site1090 (Fig. 3). Glacial MARLitho are substantiallyhigher and exceed interglacial values by a factorof ~3 to 15 (fig. S6).
However, fluxes of both biogenic and lithogenicmaterial in the SO may be substantially af-fected by sediment focusing below the vigorousAntarctic Circumpolar Current (22). To correctvertical fluxes for the potential influence of lat-eral sediment redistribution (focusing), we ap-plied the 230Th normalization method [limitedto the past ~300 ky B.P. (19)]. Glacial 230ThnormMARLitho tend to be considerably lower than
the non-normalized values (Fig. 3, B and C).For each site, the 230Th-normalized MARlitho
show internally consistent variability across thepast three glacial-interglacial cycles, indicatinga ~threefold increase in lithogenic fluxes duringglacials (Fig. 3E and fig. S6), comparable toglacial increases at low latitudes (23). Theabsolute 230Thnorm MARLitho values decreasefrom west (156°W) to east (125°W) (table S1).The downwind decrease of 230Thnorm MARLitho,recorded in our cores, is consistent with a pri-marily eolian source of the lithogenic material,originating from Australia, as also shown in dustsimulations (12, 20). However, our interglacial
230Thnorm MARLitho are somewhat higher thanlithogenic particle fluxes from sediment trapsand water samples in the southwest Pacific SO(24, 25) and model-based estimates for our coresites (12, 20). In contrast, higher Holocene Aus-tralian dust fluxes have been derived from NewZealand peat bogs (26) (table S1).
Our 230ThnormMARLitho and230Thnorm n-alkane
MAR records (Fig. 3, E and F) document a~threefold increase of dust supply to the Pa-cific SO during glacials (Fig. 3E and fig. S6),consistent with two previous 230Thnorm MARLitho
records from the central Subantarctic PacificSO (16) (Fig. 3E) and a compilation of otherPacific dust deposition records (27). Taken to-gether, these sediment data suggest a consid-erable enhancement of glacial dust input to thePacific SO. Though absolute Pacific glacial dustfluxes are ~50% lower than in the Atlantic SO,the relative glacial-interglacial increase is almostas large. Considering the large geographic ex-tension of the Pacific SO, this threefold increasein Pacific SO dust fluxes requires a substantialenhancement of the Australian dust source, con-siderable changes in atmospheric circulation,or an additional dust source not active duringinterglacials.
Modeling of the contribution of the differ-ent Southern Hemisphere dust sources to mod-ern dust deposition in the SO shows that morethan 80% of modern dust deposition in thewestern and central Pacific SO originates fromAustralia (12, 20) (Fig. 1). The large-scale dis-tribution of Southern Hemisphere dust is pri-marily achieved through transport within thewesterly wind belt. The uptake of dust and trans-port and distribution through the westerly windbelt into the SO primarily occurs in austral win-ter and spring (21), when the westerlies extendfurther north. In contrast to dust originatingfrom Patagonia, Australian dust plumes are tran-sported in the free troposphere and can thus bedistributed over very large distances (20). Al-though there is presently no consensus aboutglacial changes of the westerlies in climate mod-els (28), most paleodata-based reconstructionsimply a strengthening and/or equatorward shiftof the wind belt (27). Together with more ex-panded arid dust source areas in Australia (29)and increases in gustiness in the source regions(30), a northward extent and/or enhancementof the westerlies over southeast Australia dur-ing glacials would plausibly increase the dustuptake and export into the Pacific SO. Further,it is conceivable that New Zealand acted as anadditional dust source. The westerlies, enhancedby strong katabatic winds in the lee of the gla-ciated New Zealand Alps (31), could have trans-ported glacial outwash material out into thePacific SO, a similar mechanism to that pro-posed for Patagonian dust sources (32). Distin-guishing between an enhanced Australian dustsource and the emergence of New Zealand as aglaciogenic dust source will require additionalgeochemical information about the provenance
Fig. 2. Iron content fluctuations across thePacific andAtlantic SO (7) compared todust contentchanges in the EDC ice core (1).
www.sciencemag.org SCIENCE VOL 343 24 JANUARY 2014 405
REPORTS
of the dust exported to the SO Pacific duringglacial times.
The 230Th normalization method documentssubstantial sediment focusing at our two sites(fig. S7). Despite this effect of lateral sedimentredistribution, the glacial-interglacial pattern andshape of dust fluctuations in the EDC ice corerecord are preserved in great detail [both in theMAR and Fe-content records (Figs. 2 and 3)].This finding suggests that the climate-controlledvariations in the availability of eolian material arethe dominant factor in controlling the shape andpattern of glacial-interglacial lithogenic sedimentaccumulation, even at sites where focusing is sub-stantial. A prominent feature of our PS75/76-2MARLitho beyond the range of 230Thnorm is a de-crease in glacial MARLitho before marine isotopestage (MIS) 12 (~480 ky B.P.) (Fig. 3B and fig.S6). A very similar decrease is likewise seen inthe Fe content record from core PS75/74-3, ex-cluding a local origin of this feature (Fig. 2). Thischange coincides with a less pronounced Mid-Brunhes shift in glacial-interglacial amplitudes inthe EDC and ODP Site 1090 records (Fig. 3, AandD, and fig. S6). Assuming that the shift in ourMARLitho is not entirely controlled by a system-atic change in sediment focusing through bottomcurrents during the Mid-Brunhes interval, ourdata document reduced glacial dust input for thepre–MIS 11 interval. One explanation could bea different sensitivity of the Australian dust sourcesto glacial severity. In contrast to Patagonia, whichlies at higher latitudes, Australian dust sourcesmay require colder global temperature to achievea similar increase to their Patagonian counter-parts. Pre–MIS12 glacials were generally shorterthan younger ones (1). Therefore, the time of highdust productivity may have been much shorter forAustralian and New Zealand dust sources com-pared to Patagonian sources, explaining the moresubstantial decrease in pre–MIS 12 glacial Pacificdust fluxes.
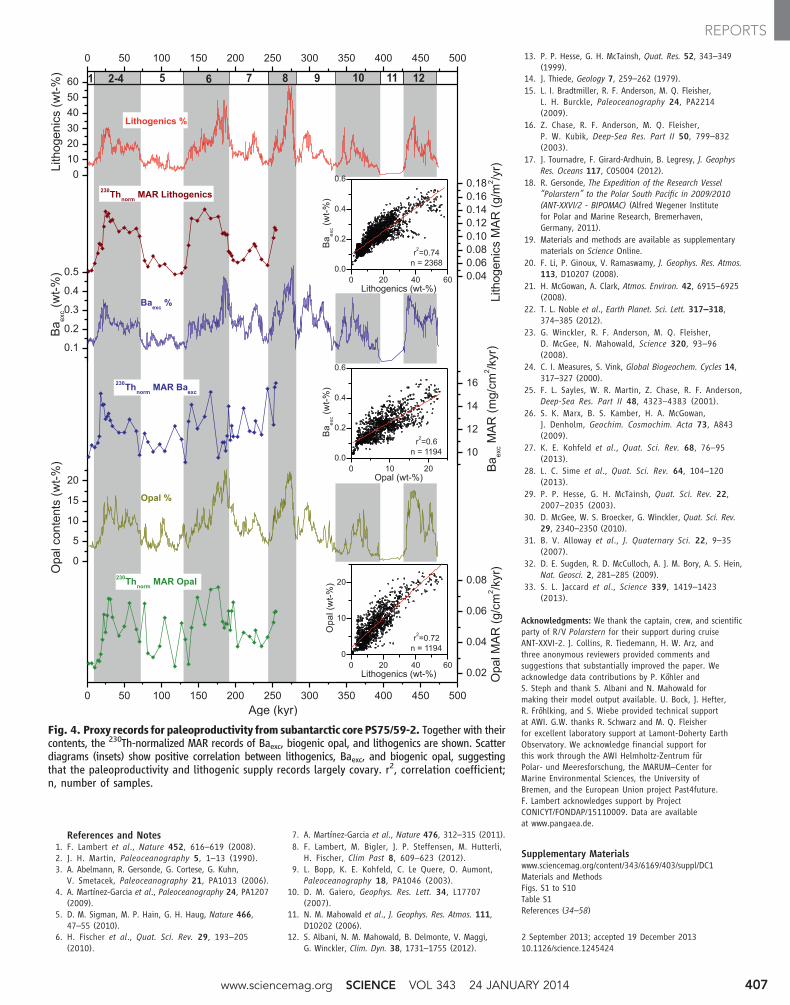
Taken together, our sediment records documenta substantial glacial dust supply from Australianand/or New Zealand sources to the Pacific SOsector eastward to at least 125°W. The ~threefoldincrease in glacial dust accumulation in the Pa-cific SO confirms the enhanced LGM-Holocenedust flux ratios from simulations (12) (fig. S1).Our Pacific SO data revise the current picture ofPatagonia representing the almost exclusivesource region for glacial dust deposited in theglacial SO. The previously unmeasured dust in-put to the largest SO sector during several glacialperiods may have substantial implications forbiological productivity on a global scale. Prelim-inary paleoproductivity estimates based on Baexcand biogenic opal records from our subantarcticcore PS75/59-2 suggest ~two to three times higherglacial values; that is, the same order of magni-tude as the dust increase (Fig. 4). This finding isconsistent with other available sediment recordsfrom the Pacific SO (15, 16) that reveal generallyhigher opal MAR north of the modern AntarcticPolar Front during glacials. However, these data
also indicate that this increase is compensated bydecreasing productivity southward, a pattern thathas been suggested to extend across multipleglacial-interglacial cycles in the Atlantic SO (33).
Furthermore, opal MAR do not necessarily re-flect productivity of the surface ocean and en-hanced organic carbon export, particularly in theseasonal ice zone (3).
Fig. 3. Changes in lithogenic mass accumulation rates (MARLitho). (A) Dust MAR in the EDC icecore (1). (B) MARLitho core PS75/76-2. (C) MARLitho core PS75/59-2. (D) MARLitho ODP Site 1090 (4, 7)[recalculated (19)]. Open diamonds in (A) to (C) show 230Th-normalized MARLitho. (E)
230Th-normalizedMARLitho values from cores PS75/59-2, PS75/76-2, E11-2, and E33-2 (16). (F) 230Th-normalized C29 and C31n-alkane MAR from core PS75/59-2. (G) 230Th -normalized MARLitho core PS2489-2 (4, 7). Vertical barsin (E) denote 1s error.
24 JANUARY 2014 VOL 343 SCIENCE www.sciencemag.org406
REPORTS
References and Notes1. F. Lambert et al., Nature 452, 616–619 (2008).2. J. H. Martin, Paleoceanography 5, 1–13 (1990).3. A. Abelmann, R. Gersonde, G. Cortese, G. Kuhn,
V. Smetacek, Paleoceanography 21, PA1013 (2006).4. A. Martínez-Garcia et al., Paleoceanography 24, PA1207
(2009).5. D. M. Sigman, M. P. Hain, G. H. Haug, Nature 466,
47–55 (2010).6. H. Fischer et al., Quat. Sci. Rev. 29, 193–205
(2010).
7. A. Martínez-Garcia et al., Nature 476, 312–315 (2011).8. F. Lambert, M. Bigler, J. P. Steffensen, M. Hutterli,
H. Fischer, Clim Past 8, 609–623 (2012).9. L. Bopp, K. E. Kohfeld, C. Le Quere, O. Aumont,
Paleoceanography 18, PA1046 (2003).10. D. M. Gaiero, Geophys. Res. Lett. 34, L17707
(2007).11. N. M. Mahowald et al., J. Geophys. Res. Atmos. 111,
D10202 (2006).12. S. Albani, N. M. Mahowald, B. Delmonte, V. Maggi,
G. Winckler, Clim. Dyn. 38, 1731–1755 (2012).
13. P. P. Hesse, G. H. McTainsh, Quat. Res. 52, 343–349(1999).
14. J. Thiede, Geology 7, 259–262 (1979).15. L. I. Bradtmiller, R. F. Anderson, M. Q. Fleisher,
L. H. Burckle, Paleoceanography 24, PA2214(2009).
16. Z. Chase, R. F. Anderson, M. Q. Fleisher,P. W. Kubik, Deep-Sea Res. Part II 50, 799–832(2003).
17. J. Tournadre, F. Girard-Ardhuin, B. Legresy, J. GeophysRes. Oceans 117, C05004 (2012).
18. R. Gersonde, The Expedition of the Research Vessel“Polarstern” to the Polar South Pacific in 2009/2010(ANT-XXVI/2 - BIPOMAC) (Alfred Wegener Institutefor Polar and Marine Research, Bremerhaven,Germany, 2011).
19. Materials and methods are available as supplementarymaterials on Science Online.
20. F. Li, P. Ginoux, V. Ramaswamy, J. Geophys. Res. Atmos.113, D10207 (2008).
21. H. McGowan, A. Clark, Atmos. Environ. 42, 6915–6925(2008).
22. T. L. Noble et al., Earth Planet. Sci. Lett. 317–318,374–385 (2012).
23. G. Winckler, R. F. Anderson, M. Q. Fleisher,D. McGee, N. Mahowald, Science 320, 93–96(2008).
24. C. I. Measures, S. Vink, Global Biogeochem. Cycles 14,317–327 (2000).
25. F. L. Sayles, W. R. Martin, Z. Chase, R. F. Anderson,Deep-Sea Res. Part II 48, 4323–4383 (2001).
26. S. K. Marx, B. S. Kamber, H. A. McGowan,J. Denholm, Geochim. Cosmochim. Acta 73, A843(2009).
27. K. E. Kohfeld et al., Quat. Sci. Rev. 68, 76–95(2013).
28. L. C. Sime et al., Quat. Sci. Rev. 64, 104–120(2013).
29. P. P. Hesse, G. H. McTainsh, Quat. Sci. Rev. 22,2007–2035 (2003).
30. D. McGee, W. S. Broecker, G. Winckler, Quat. Sci. Rev.29, 2340–2350 (2010).
31. B. V. Alloway et al., J. Quaternary Sci. 22, 9–35(2007).
32. D. E. Sugden, R. D. McCulloch, A. J. M. Bory, A. S. Hein,Nat. Geosci. 2, 281–285 (2009).
33. S. L. Jaccard et al., Science 339, 1419–1423(2013).
Acknowledgments: We thank the captain, crew, and scientificparty of R/V Polarstern for their support during cruiseANT-XXVI-2. J. Collins, R. Tiedemann, H. W. Arz, andthree anonymous reviewers provided comments andsuggestions that substantially improved the paper. Weacknowledge data contributions by P. Köhler andS. Steph and thank S. Albani and N. Mahowald formaking their model output available. U. Bock, J. Hefter,R. Fröhlking, and S. Wiebe provided technical supportat AWI. G.W. thanks R. Schwarz and M. Q. Fleisherfor excellent laboratory support at Lamont-Doherty EarthObservatory. We acknowledge financial support forthis work through the AWI Helmholtz-Zentrum fürPolar- und Meeresforschung, the MARUM–Center forMarine Environmental Sciences, the University ofBremen, and the European Union project Past4future.F. Lambert acknowledges support by ProjectCONICYT/FONDAP/15110009. Data are availableat www.pangaea.de.
Supplementary Materialswww.sciencemag.org/content/343/6169/403/suppl/DC1Materials and MethodsFigs. S1 to S10Table S1References (34–58)
2 September 2013; accepted 19 December 201310.1126/science.1245424
Fig. 4. Proxy records for paleoproductivity from subantarctic core PS75/59-2. Together with theircontents, the 230Th-normalized MAR records of Baexc, biogenic opal, and lithogenics are shown. Scatterdiagrams (insets) show positive correlation between lithogenics, Baexc, and biogenic opal, suggestingthat the paleoproductivity and lithogenic supply records largely covary. r2, correlation coefficient;n, number of samples.
www.sciencemag.org SCIENCE VOL 343 24 JANUARY 2014 407
REPORTS