income 1917
TRANSCRIPT
TREASURY DEPARTMENT
UNITED STATES INTERNAL REVENUE
Statistics of Income
COMPILED FROM THE RETURNS FOR 1917U N D E R T H E D I R E C T I O N O F T H E
COMMISSIONER OF INTERNAL REVENUE
WASHINGTONGOVERNMENT PRINTING OFFICE
1919
Digitized for FRASER http://fraser.stlouisfed.org/ Federal Reserve Bank of St. Louis
C O X T E N T S .
ANALYTICAL TEXT AND STATISTICAL TABLES.Page.
OFFICIAL TRANSMITTAL. 5PERSONAL INCOME-TAX RETURNS 5
Text tab les -Simple and cumulative distribution of personal returns, calendar year
1917, by income classes. 5Number of personal returns tiled, calendar years 1917 and 1916, by
income classes 7Net income reported by personal returns, calendar years 1917 and 1916,
by income classes 7Income tax yield of personal returns, calendar years 1917 and 1916, by
income classes 7Number of personal returns, calendar years 1917 and 1916, by States
and Territories , 8Net income reported by personal returns, calendar years 1917 and 1916,
by States and Territories 9Number of personal returns and net income reported, income classes
$1,000 to $2,000, calendar year 1917, by States and Territories 10Tax yield of personal returns, calendar years 1917 and 1916, by States
and Territories 11Classification of personal returns, by sex and family relationship 12
Text table—Distribution of incomes from personal returns reportingnet incomes of $2,000 and over, calendar year 1917, by sex and familyrelationship 12
Exemption from normal tax (personal returns) 12Text table—Income exempted from normal tax, income subject to
normal tax, and corresponding percentages, personal returns report-ing net incomes of $2,000 and over, calendar year 1917 12
Service, business, and property as sources of income (personal returns). . . 12Text table—Personal incomes, calendar years 1917 and 1916, by sources. 13
Income from personal service, business, and property, by income classes(personal returns) 14
Text tab les-Income from personal service and business compared with income
from property, by income classes, net incomes of $2,000 andover, calendar year 1917 14
Distribution of personal income by sources and by income classes,calendar year 1917, showing the amounts returned expressedin percentages 15
Returns by principal sources of income (personal returns) 15Text table—Incomes from principal sources, net incomes of $2,000 and
over, calendar year 1917 15Income from business (personal returns) 16
Text table—Personal incomes from business, calendar year 1917, byindustries 16
PARTNERSHIP WAR EXCESS-PROFITS TAX 16CORPORATE INCOME-TAX RETURNS 16
Gross income, net income, and taxes (corporate returns) 17Text table—Comparing corporate income and taxes, calendar ye<rs
1917 and 1916 "..... 17Distribution of corporate income by industrial groups 18
Text table—Distribution of corporate income by industrial groups,divided into those reporting net income and those reporting no netincome, calendar year 1917. L8
Sources of income and nature of deduct ions. 19Text tables-
Distribution of corporate income, by sources of income and natureof deductions, calendar year 1917. 19
Sources of corporate incomes and nature of deductions, by indus-trial groups. shoAving amounts returned expressed in percentages,calendar year 1917 20
3
Digitized for FRASER http://fraser.stlouisfed.org/ Federal Reserve Bank of St. Louis
4 CONTEXTS.
PageRETURNS OF UNDISTRIBUTED NET INCOME 20INCOME RETURNS, BY STATES 21
Combined personal and corporate income 21Text table—Returns, by States and Territories 21
FOREIGN INCOME REPORTED ON PERSONAL RETURNS 22FOREIGN INVESTMENTS IN THE UNITED STATES 22PROGRESS OF INCOME TAXATION 22STATISTICAL TABLES:
Personal income tables—Distribution of incomes by States
1. For the United States 24Distribution of incomes by classes
2. For the United States 262a. By States and Territories 72-1733. Simple and cumulative distribution for the United States 28
Sex and family relationship—Distribution by States-4. For the United States. \ 30
Sex and family relationship—Distribution by income classes5. For the United States \ 34
Distribution of income by sources and by States—6. For the United States '. 36
Distribution of income by sources and by income classes-7. For the United States.... * 40
Distribution of income by principal sources and by States-8. For the United States. 42
Distribution of income by principal sources and b> income classes—9. For the United States 44
Number of personal returns by income classes and by States andTerritories, calendar years 1917 and 1916—
10. For the United States 45Partnership returns—
11. Distribution of returns by States for the United States 52Corporate income tables—-
Distribution of income by States—12. For the United States 53
Distribution of income by industrial groups and by States for theUnited States—*
13. Agriculture and related industries 5514. Mining and quarrying 5715. Manufacturing 5916. Construction 6117. Transportation and other public utilities 6318. Trade 6519. Personal sendee 6720. Finance. 69
Income from foreign investments in the United States—21. "Returns filed by nonresident aliens and by foreign corporations 71
Digitized for FRASER http://fraser.stlouisfed.org/ Federal Reserve Bank of St. Louis
o
14 1,000
2.000
2.500
3,000
4.000
5.000
6.000
7,000
a.ooo
9,000
10.000
11,000
12,000
13,000
14,000
1 15,000
20,000
Z5.000
30,000
40.000
50.000
60,000
70,000
80,000
9«tG0
100,000
150.000
200.000
250,000
300,000
. 400,000
500.000
750.000
1,000,000
1,500,000
2,000,000
3,0 OOt 000
4.000,000
5,000.000
TO 4 2,000 1
(:HAW 5R0WINC BY INCOME Cl.AS* IS. THE NUMBER OF PERSONAL RETURNS FILED FOR
TH0UJAND5
o
i2.50 0 JIJIIIIIIIIIIIIIj^3,000 j^m^^^^gm^^m^y^^^^^^^^^g^^mm^^^mm^4,000 ^mLmiiJIm^m^
5,000 im^um^^^i^^^^^^^^iyiiiiiu^^^^^"6,000
7,000 1warn8.000 i lHH^H9.000
•> 10,000 m-" n-000 HW1 1- 12,000 H F" i3.ooo p r
14,000 III,.' 15,000 H 1 1.. 20000 H H H I
" 25>oo° H P i» 30,000- W j» 40,000 • • 1» 50.000 p |» 60.000 r» 70.000 1 1
.. 80,000
" 90.000
» 100.000
* 150.000
» 200.000
« 250.000
» 500,000
- 400.000
» 500,000
~ 750.000
» 1,000.000
» 1500.000
- 2,000.000
" 3,000.000
~ 4 ,000.000
- 5.000,000
AND OVER..
r
!
•
«r
THt CALENDAR
S i - i * 5 &
BB• H K
TAB1E 5H0WINC TOTAL NUMBER OF
CALEKMR. YEAR EK»EI DECEMBER
INCOME CLASSt 1,000
2 0002.5003,0004,000
4,000
8,000
10,000
12,000
14,00015.00020,00025,00030.00O40,00050,00040,00070,00080,00090,000
100,000I50.0OO200.000250.000300,000400,000500,000750,000
I.OOO.OOO1,500,0002,000,0003 OOO 0004,000,000
TOTAL HVMI
TO * 2 . 0 0 0n » « « t%
3,0004,0005.00 0£ MMM
7,000
9.000
11,000
13.000
15,00 020.00025,00030,00 040,00 050,00060,00070,00080,00090,000100,000150,000200,000250,000300,000400,000JOO.OOO750,000
« 1,000,0001,500,0002,000.0003,000,000
» . * OOO AOO5,000,000
t£AR ENDED DECEMBER 3j, mi
II 1 1 1 1 1 II 1PERSONAL RETURNS FILED FOR THE
3 1 , 1 9 1 7 , WTMIVTED BY INCOME CLASIC5.
NUMBER OF RETURN*,640,756460,4 6 6356,221.374,956185,805
. 64,010
12.326
, . . . 29.696 |I6.AO610,57 112,7337,0874,54 1
2,? 2 2.
I.IAS
3 . 3 0 |
_ 703_ 342
360_ 179
22.54057JJ24cA
R OF KftSONAL RETVRii'.f FILEP J , 4 7 2 , 6 9 0
JOIKT RETVRNJ OF MUMUM AM WIVES WITIi Oft WITHOUTK F E W t r f CHILKEN, AtSO HU59AW5 WHOSE WirB,TM0U6H
WIVES MAKIN
smelt WOMI
)W6LE MEN
( JEFALATE RETURNS FROM
M,HIAt! OF tkuatti
AIL MHft.
ilHtLt WOMtM, ALLOfMEt
HK0KI CLASS * 1.000 TO * 2 . 0 0 0 HOT•Y SEX AH»
•v
THOUSANDS
FAMILT RElATIOMHir6KAMI TOTAL
HOSIAHM 20,530
1 9 9 , 2 6 3
_ . . ._ 63,580
O1STRI»UTCD
J,640,7.56f 4*72 890
? * - ; - « 5 5 - ^ •
i
FijT
ao
• II
s S
1
1
i
1[[
• 1 1 1 ? ' II_
/ i s i 1 1 1 1 s*(T» faee page 5.)
Digitized for FRASER http://fraser.stlouisfed.org/ Federal Reserve Bank of St. Louis

STATISTICS OF INCOME, CALENDAR YEAR 1917.
TKEASUKY I.)EPAKTME:ST.OFFICE OF COMMISSIONER OF INTERNAL REVENUE,
Washington, />. tf., October' 2, 1919.Hon. CARTER GLASS,
Secretary of the Treasury,S I R : I have the honor to transmit the following report relating to
the statistics of income compiled from the returns of net income(personal, corporate, and partnership) for the calendar year endedDecember 31, 1917.
PERSONAL INCOME-TAX RETURNS.
Intensive study was made only with respect to those reportingincome of $2,000 or more. This limitation has saved the Bureau thelabor and cost of a critical analysis of 1,640,758 returns, the data fromwhich would have been of no practical benefit for the purposes of thestatistics.
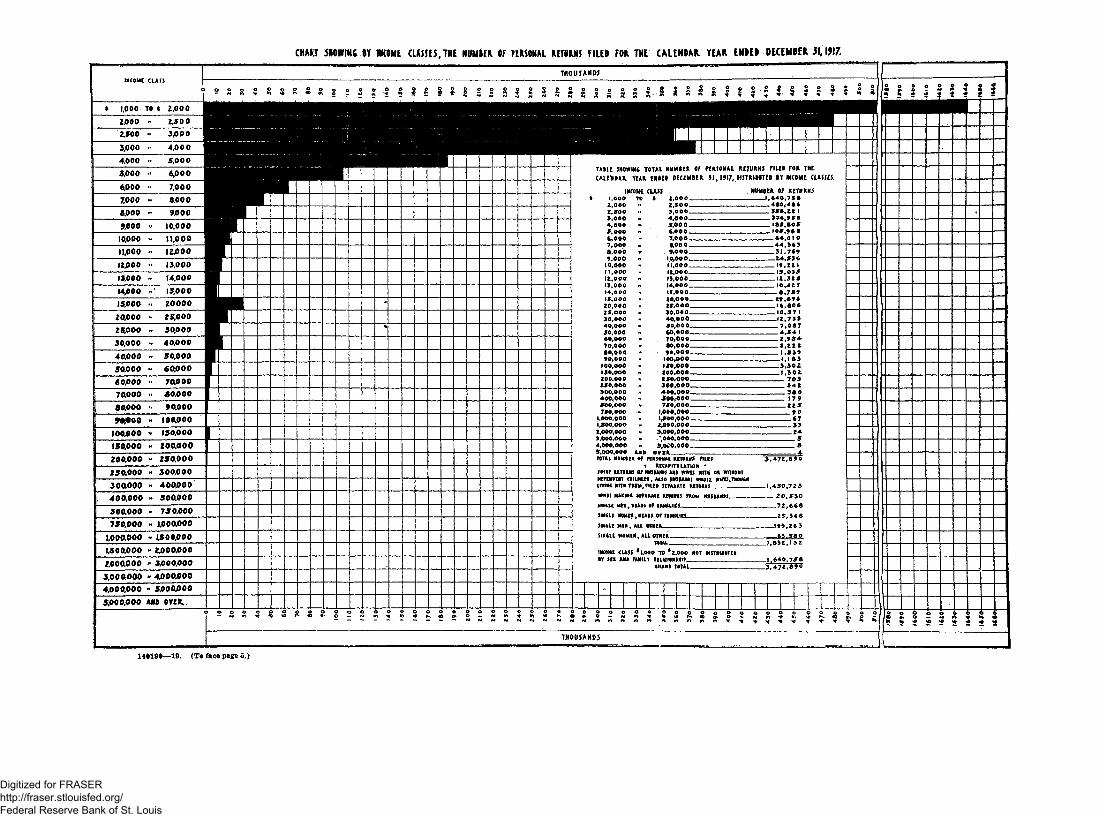
The total number of personal returns filed for the calendar yearended December 31, 1917, was 3,472,890, reporting net incomeamounting to $13,652,383,207. These exceeded those for 1916 by3,035,854 returns and $7,353,805,587 in net income reported.
Returns reporting net income of $2,000 and over numbered1,832,132, with total net income of $11,191,246,207. The income-tax(normal tax, surtax, and war-excess profits tax) of these returnsamounted to $675,249,450. The average tax per individual was$368.56 and the average tax rate 6.03 per cent of the aggregate netincome.
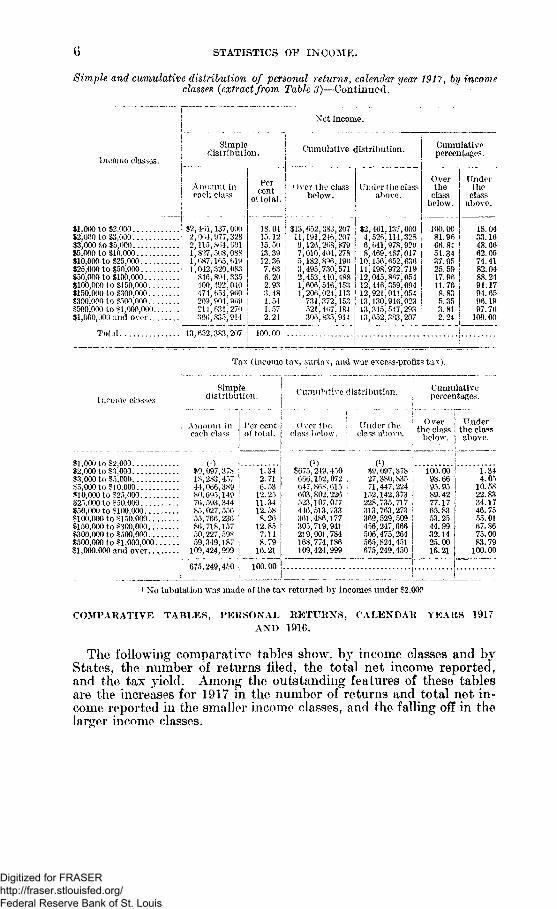
The following table visualizes the distribution of the personalreturns by income classes, showing the number of returns filed, theamount oi net income, and the tax yield: also cumulative totals andrelative percentages:
Simple and cumulative distribution of personal returns, calendar year 1917, by incomeclasses (extract from Table 3).
Returns.
Income: classes.Simple
distribution.
Numberin eachclass.
Cumulativedistribution.
Cumulativepercentages.
$1,000 t o $2,000 1 1,040,758$2,000 t o $3,000 1 838,707$3,000 t o $5,000 1 560,763$5,000 to $10.000 270,666$10,000 t o $25,000 112,502$25,000 t o $50,000 j 30,391$50,000 t o $100,000 S 12,439$100,000 t o $150,000 ! 3,302$150,000 t o $300,000 ! 2.347$300,000 to $500,000 ! '559$500,000 t o $1,000,000 i 315$1,000,000 and over 141
Per cent j1 of to ta l , i
j 47.25 i24.16 !
j 16.15 j7.79 j
' 3.22 !! .87 1j - 3 5 iI . 1 0! .07 ;j . 0 2 ;! .013 ii .007 !
Overthe class
below.
3,472,8901,832,132
993,425432,662161,99649,49419,1036,6643,3621,015
156141
Under i Over j Underthe class j the class | the class
above.above.
640,479!040;310,423;
453,466:469;471,472,472;472.
below.
100.0052.7528.5912.444.651.43
.56
.21
.11
.04
.02
.007
47.2571.4187.5695.3598.5799.4499.7999.8999.9699.9899.993
100.00
Total. 3,472.890 j 100.00
Digitized for FRASER http://fraser.stlouisfed.org/ Federal Reserve Bank of St. Louis
STATISTICS OF INCOME.
Simple and cumulative distribution of personal returns, calendar year 1917, by incomeclasses (extract from Table 3)—Continued.
Income classes.
$1,000 to $2,000$2,000 to $3,000$3,000 to $5,000$5,000 to $10,000$10,000 to $25,000$25,000 to $50,000....$50,000 to $100,000...8100,000 to $150,000..$150,000 to $300.000..$300,000 to $500,000.$500,000 to .$1,000,000.$1,000,000 and over..
Net income.
Simpledistribution. Cumulative distribution.
Amount ineach class.
$2,4*>12, 0642; 115;1,827,1,087,1,042,816,400,474209214;300,
137,000977,328804,G01508,088105,619320' 083894,335492,040651,900904,969031,270835,914
Percent
of total.
18.0415.1215.5013.3912.367.636.202.933.481.541.572.24
Over the classbelow.
$13,652,11,191'9,126,7,010,5,182,3,495.2,453,1,606,1,200,731,521,300,
383,207240,207268,879404.278846', 190730,571410,488516,153024,113372,153407.184835)914
Under the classabove.
$2,461,4,520,6,641,8,46910,15611,198;12,045,12,446,12,92i;13,130,13,345,13,052,
137,000114,328978,929487,017652,636972,719867,054359,094011,054916,023547,293383,207
Cumulativepercentages.
Overthe
classbelow.
100.0081.9666.8451.3437.9525.5917.9611.768.835.353.812.24
Underthe
classabove.
Total i 13,652,383.207 \ 100.00 !
18.0433.1648.6662.0574.4182.0488.2491.1794.6596.1997.76
100.00
Tax (income tax, surtax, and war excess-profits tax).
Income classes.Simple
distribution.
Amount ineach class
$1,000 to $2,000 ; (i)§2,000 to $3.000 1 $9,097,378$3,000 to $5,000 IS, 2S3,457$5,000 to 810,000 : 44,066,389$10,000 to $25,000 s 80,695,149S25.000 to $50,000 ! 76,593,344$50,000 to $100,000 : 85,027,556$100,000 to SI50,000 ! 55, 766,236$150,000 to $300,000 1 86, 718,157$300,000 to $500,000 \ 50,227,598$500,000 to $1,000,000 1 59.349,187$1,000,000 and over,.., i 109,424,999
! 675,249,450
Per centof total.
1.342.716. 5312.2511.3412.588.2612.857.148.7916.21
100.00
Cumulative distribution.
Over tireclass below.
0)8675,249,450666,152,072647,868,615603,802,226523,107,077446,513,733301,486,177305,719,941219,001,784168,774,186109,424,999
Under theclass above.
C1)$9.097,37827) 380.83571,447;224
152,142,373228,735,717313,763,273369,529,509456,247,666506,475,264565,824,451675,249,450
Cumulativepercentages.
Over j Underthe class i the class
below. ! above.
100.0098.6695.9589.4277.1765.8353.2544.9932.1425.0016.21
1.344.05
10.5822.8334.1746. 7555.0167.8675.0083.79
100.00
1 No tabulation was made of the tax returned by incomes under $2,000
COMPARATIVE TABLES, PERSONAL RETURNS, CALENDAR YEARS 1917AND 1916.
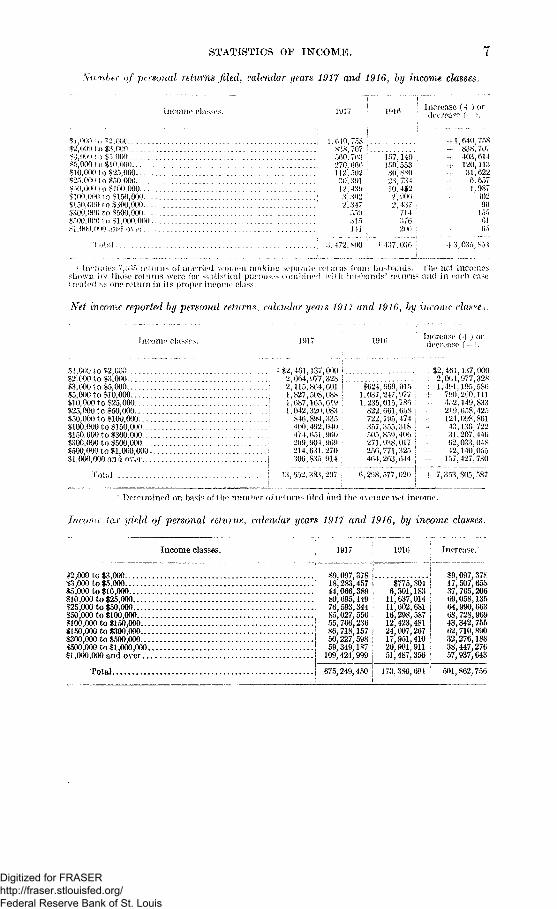
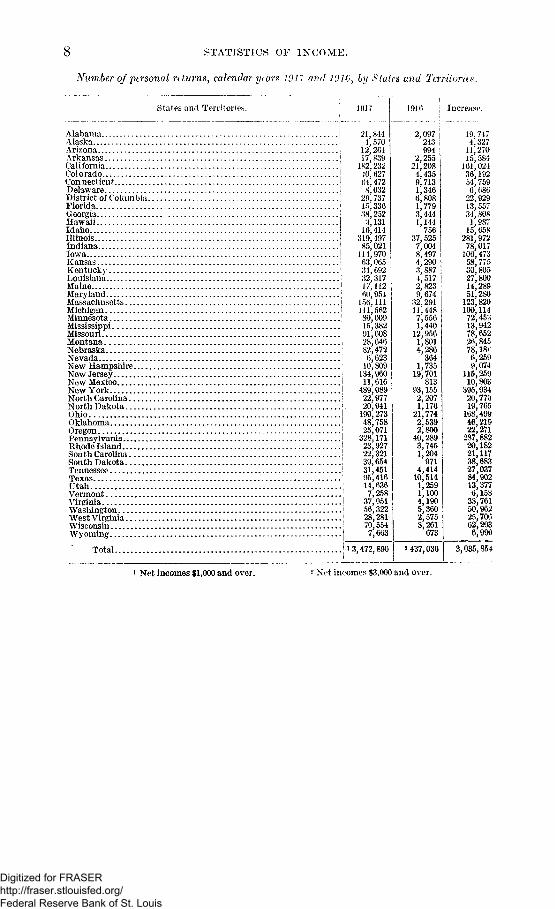
The following comparative tables show, by income classes and byStates, the number of returns filed, the total net income reported,and the tax yield. Among the outstanding features of these tablesare the increases for 1917 in the number of returns and total net in-come reported in the smaller income classes, and the falling off in thelarger income classes.
Digitized for FRASER http://fraser.stlouisfed.org/ Federal Reserve Bank of St. Louis
STATISTICS OF INCOME. 7
.Sti.rn.ber of personal returns filed, calendar years 1917 and 1916, by income classes.
_ ^ ...___„ . . . . . . . . .
Increase (-i ) orInvomo 1917 1016
•"S^OO'l
510 IK)Oo S2"),000(i *">o Wo"<> s i ( K ) 0 0 0
> *r»o,ow>
I 610v,'s"if>0
270112
I,12
>
, 572
7 >v
70776 3(>M>
>O2•!91
H*»•{02> J7
>")9>1 "i1 li
VIO
157,
r>o^02\,10j2
1 w
119353^M)7 ' 'J52()()(,
1 a7Hi76
2(>t>
0 ,6
1 6-10.758Sd8' 707103,614120,11331,622ft'. 6571'. 987
40290
1556105
r 3 03"). 851
. , ' . " l u t j i j i o i u n i i n »i > o u t a i i i i k i i ' i r> I i t u l u m s f ' o i u h u > b u i i K l j u I U ' i n r o m o s
Net reported by pa\sonal rtturnv (ahndtu yans UJli and Htlhs by weonu ch
Iri( t a >( ( I ) or
o,m oIO.KK)SIOOOfHo'25,000^2i,(K)0*n?;50;000>"tO,OOJ)'oSlOOOOOSIOO(0«JO t c M50,000Sl 'AOO^^OOOOO
1 000,000
o ^100,000oM,(X.OOOO
\
T.2, 161,137,0002 064 977,32s2 115,861,601l,827,50s,08S1 687.165,6l<>1.012, 520.085
M6.891, 33")MM) 102.010\"i 1 6')1 960209,901,%lJ214,6 51,270506,8 5") 911
13 6.;2 3,207
!>( fo?mnv fl on I
%21 669 0151,037,217,9771,235.015,7 v ,
822 061 6..s722 7M5 171
271.9^8,017256 771,325101.203,014
') 2 8 577.620
*2, ll>l,H7,0002, Oh 1,977,328
' 1, l«»l 195,5864 7<'0,2'i0.111J 4. ,2 149,833
2'9 h58,425121 098,861
1 * 156,72251 207,44662.03 3,04812,110,055
1 ".7.427,730
7. 573 805,587
of *hc mn>>i>oi of H 1 tun^ file <i -uul ' he o m>i nicoitu
Income tax. yield of personal returns, calendar years 1917 and 1916, by income classes.
Income classes. 1916 Increase.'
12,000 to$3,000....$3,000 to $5,000....-15,000 10 810,000...$10,000 to $25,000..$25,000 to $50,000..
$100,000 to $150,000...$150,000 to$300,000...$300,000 to $500,000...$500,000 to $1,000,000.$1,000,000 and over . . .
$9,097,18,283,44,066,80,695,76,593,85,027,55,766,86,718,50,227,59,349,109,424,
378457389149 |344 !556 !236 !157 1598 !187 i999 i
$775,8046,301,18311,637,01411,602,68116,298,58712,423,48124,007,26717,951,41020,901,91151,487,356
Total. . . | 675,249,450 173,386,694
17,37,69,64,68,43,62,3238,57,
097,37S507,653765,206058,135990,663728,969342,755710,890276,188447,276937,643
501,862,756
Digitized for FRASER http://fraser.stlouisfed.org/ Federal Reserve Bank of St. Louis
8 STATISTICS OF INCOME.
Number of personal nturns, calendar years 1917 and 1910, by States and Territories.
States and Territories.
Alabama.AlaskaArizona..ArkansasCaliforniaColoradoConnecticutDelawareDistrict of Columbia.FloridaGeorgiaHawaiiIdahoIllinoisIndianaIowaKansasKentuckyLouisianaMaine..MarylandMassachusetts.MichiganMinnesotaMississippiMissouriMontanaNebraskaNevada..New Hampshire.New JerseyNew MexicoNew YorkNorth Carolina..North Dakota . . .Ohio.OklahomaOregonPennsylvania...Rhode Island.. .South Carolina.South Dakota. .TennesseeTexasUtahVermontVirginiaWashingtonWest Virginia..WisconsinWyoming
1917
21,8444,570
12,26417,839
182,232JO, 627(54,4728,032
29,73715,33638,2523,131
16,414319,49785,021114,97063,06534,69232,31717,11260,954156,111111,56280,00915,38291.60828,64682,4726,62310,809134,96011,616489,08922,97720,941190,27348,75825,071
328,17123,92722,32139,65431,45195,41614,6367,258
37,95156,32228,28170,5547,663
1916 | Increase.
Total 13,472,890
2,097243 I994
2,25521,2084.4359,7131,3466,8081,7793,4441,144
75637,5257,0048,4974,2903,8874,5172,8239,67432,29111,4487,5561,44012,9561,8014,286364
1,73519,701
81393,1552,2071,17621,7742,5392,80040,2893,7451,204971
4,41410,5141,2591,1004,1905,3602,5758,261673
2 437,036
19,7474,327li;27015,584161,02436,19254,7596,68622,92913,55734,8081,98715,658281,97278,017106,47358,77530,80527,80014,28951,280123,820100,11472,45313.94278,65226,84578,18f6,2599,074
115,25910,803395,93420,77019,765168,49946,21922,271287,88220,18221,11738,68327,03784,90213,3776,15833,76150,96225,70662,2936,990
3,035,854
Net incomes $1,000 and over. 2 Net incomes $3,000 and over.
Digitized for FRASER http://fraser.stlouisfed.org/ Federal Reserve Bank of St. Louis
STATISTICS OF INCOME. 9
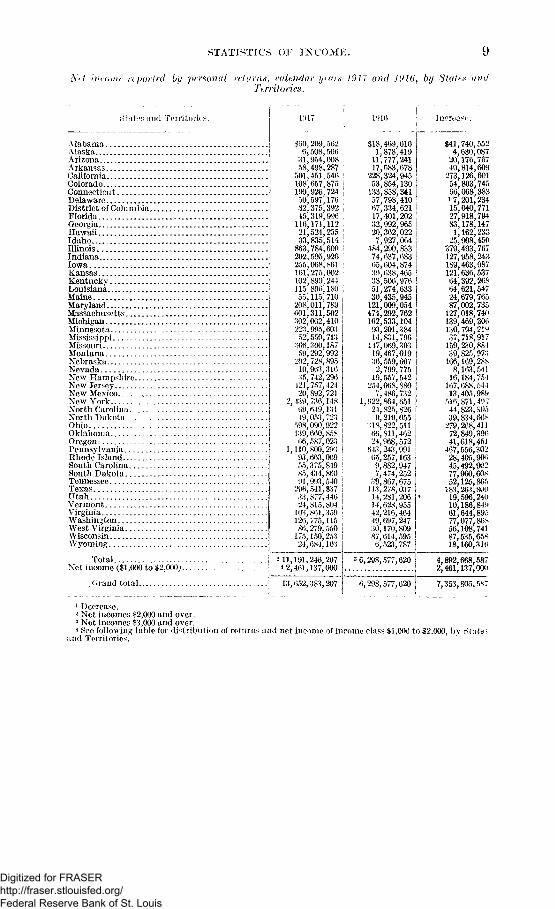
N<t invoiiu- reported by personal ret term, calendar y<ars 1917 and 1916, by States andTerritories.
ts and Territories I ne resist1..
Alabama .$60,209,562 ;Alaska 6> 508,506 |Arizona 31,954,008 1Arkansas 58,498,287 ICalifornia 501,451,546Colorado 108,657,875Connecticut 199,926,724Delaware 50,597,170 jDistrict of Columbia 82,375,392 jFlorida 45,319,9% [Georgia ' 116,171,112 IHawaii 21,524,255 iIdaho 33,835,514 |Illinois 863,784,600 !Indiana 202,595,926 [Iowa | %% 068,861 !
161,275,002 f102,899,24-1 I115,896;180 (55,115,710 I
208,011,789 |(501,311,502 !
302,002,41022.3,995,60:552,550,713
.300, 300,18759,292,992
202,728,89510,963,31635,742,296
421,757,42420,892,721
2,439,736,14809,649,13149,053,723
598,090,922139,660,85866,587,023
1,110,800,29393,663,06955,375,84985,434, ,86091,993,540
296,541,837 |33.877,446 |24^815,804
103,861,359 |126,775,115 [S6,279,550 j
175,150,253 |24,684,103
Total. i 211,191,246,207Net income ($1,000 to 12,000; ] * 2,461,137,000
. Grand total I 13,652, -3S3,207
KansavSKentuckyLouisianaMaineMarylandMassachusettsMichiganMinnesotaMississippiMissouriMontanaNebraskaNevadaNew Hampshire..New JerseyNew MexicoNew YorkNorth Carolina...North DakotaOhio.OklahomaOregonPennsylvaniaRhode" IslandSouth CarolinaSouth DakotaTennesseeTexasUtahVermontVirginiaWashingtonWest VirginiaWisconsinWyoming
$18,469,0101,878,41911,777,24117,683,678
228,324,945 J53,854,130 i133,858,341 I57,798,410 !07,334,621 117,401,202 !32,992,965 !20,362,022 j7,927,064 j
484,290,83374,637,683 {65,604,874 I39,038,465 j38,506,976 i51,274,633 |30,435,945 j121,009,054 !474,292,762 I162,533,104 !93,201,384 j14,831,796 I147,069,30319,467,01936,559,6072,799,775 j19,557,542 |
254,068,8807,486,732
1,922,864,65124,825,8269,219,055
318,822,51166,811,46224,968,572
043,243,991ivi, 257,1639,882,9477,474,252
39,867,675113,278,03714,281,20614,628,95542,216,46449,697,24730,170,80987,614,5956,523,787
$41,740,5524,630,08720,176,76740,814,609273,126,60154,803,74566,068,38317,201,23415,040,77127,918,79483,178,1471,162,23325,908,450
379,493,767127,958,243189,463,987121,636,5376-4,392,26864,621,54724,679,76587,002,735127,018,740139,469,306130,794,21lJ37,718,917
159,230,88439,825,973
166,169,2888,163,541
16,184,754107,688,54413,405,989
516^871,49744,823,80539,834,60S279,268,41172,849,39641,618,451407,556,30228,405,90045,492,90277,960,60s52,125,865183,263,801)19,596,24010,186,84961,644,89577,077,86*56,108,74187,535,65818,160,310
Decrease.Net incomes $2,000 and over.Net incomes $3,000 and over.See following table for distribution of returns and net income of income class SI,000 to $2,000, by S
d Territories.
Digitized for FRASER http://fraser.stlouisfed.org/ Federal Reserve Bank of St. Louis
10 STATISTICS OV INCOME.
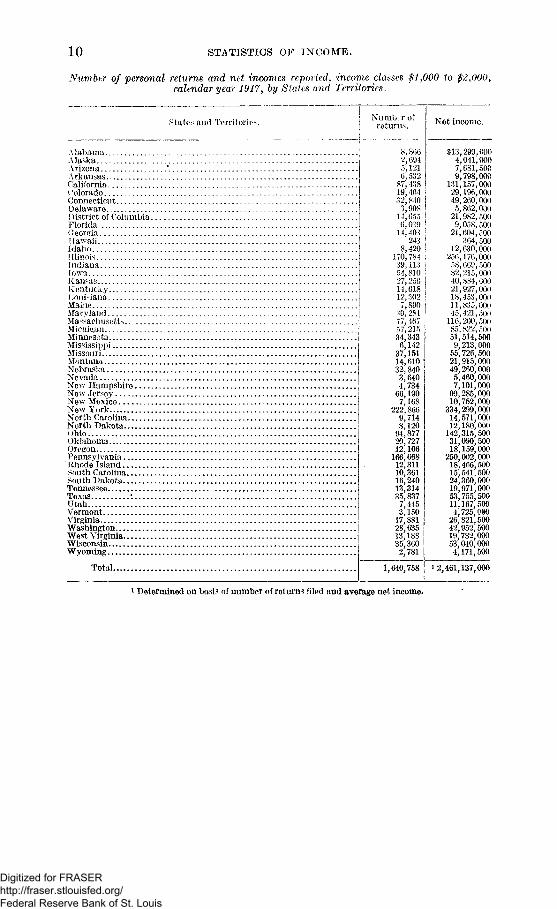
Numb i<tr of personal returns and net incomes reported, income classes $1,000 to $2,000,calendar year 1917, by States and Territories.
States and Territories.
A labaniaAlaskaArizonaArkansasCaliforniaColoradoConnecticutDelawareDistrict of ColumbiaFloridaOeorgiaHawaiiIdahoIllinoisTndiauafowaKansasKentuckyLouisianaMaine...MarylandMassachusettsMichiganMinnesotaMississippiMissouriMontanaNebraskaNevadaNew HampshireNew JerseyNew MexicoNew York.North CarolinaNorth DakotaOhioOklahomaOregonPennsylvaniaRhode' IslandSouth CarolinaSouth DakotaTennesseeTexas :UtahVermontVirginiaWashingtonWest VirginiaWisconsinWyoming
Total
Numb r ofreturns.
8,8662,6945,1216,532
87,43819,46432,8403,908
14,655(5,039
14,403243
8,420170,78439, U354,81027,25614,618 |12,302 I7,890 j
30,281 '77,467 f57,215 |34,343
6,142 I37,151 i14,610 132,8403,6404,734
66,1907,168
222,8669,7148,120
94,87720,72712,106
166,66812311
Net income.
$13,299,0004,041,0007,681,5009,798,000
131,157,00029,196,00049,260,0005,862,000
21,982,5009,058,500
21,604,500364,500
12,630,000256,176,00058,669,50082,215,00040,884,00021,927,00018,453,00011,835,00045,421,500
116,200,50085,822,50051,514,5009,213,000
55,726,50021,915,00049,260,0005,460,0007,101,000
99,285,00010,752,000
334,299,00014,571,00012,180,000
142,315,50031,090,50018,159,000
250,002,0001846650012,311
10,36116,24013,31435,8377,4453,15017,88128,63513,18835,3602,781
1,640,758
18,466,50015,541,50024,360,00019,971,00053,755,50011,167,5004,725,0©026,821,50042,952,50019,782,00053,040,0004,171,500
12,461,137,000
1 Determined on basis of number of returns filed and average net income.
Digitized for FRASER http://fraser.stlouisfed.org/ Federal Reserve Bank of St. Louis

STATISTICS OF INCOME. 1 1
Tar yield of personal returns, calendar years 1917 and 1916, by States and Territories,
States and Territories. 1917
Alaska.Arizona..Arkansas
t {cnt
Alabama \ $1,936,A l a s k a 1 0 6 ,
068,1,783,
10 489,4,992,
10,270,9,311,4,301,1,525,3,107,l 172.
756',47,412,5,591,4,903,3,158,2,798,4,815,2,389,
12078
DMri*'t of Columbia..F3 >rida
ffav-'iiii.Idoli -I Hinoi*In.lianaI ownK tin-asKentuckyL'Hii>«it:nnMaiiu-M aryiand I 12) 078)Ma*s:ichusetf •* | 43,711,MicMpan '• 14,592,
Mi-^o'iri.
Xfuv H aXow TfT
\<n\ York
Norih«>h\o
2, l«»j, Mm10.512. \W
f . <>»>(>, 1 2 2L»0.->, 9 0 8
i . ??) :?lhL>"i, I) > I, 701
X, 1 ,\% 7S177, M) t. S35
jO71iYnn^ h -dhl,\lhn ip Island>o:ith f arolina. 1,713,335Soulh I>ako'a I,oio, 552Tennessee 2,662,3ss
vennoii (..!.!.!."!!!.!.!.!.!.!.!.!.!. 1.!!!.!. 1....".!.!.!.! 1' \W, w>^N'irciiiia -», 752,251Washington 4,091,267West Virginia 3,172,721Wisconsin 1,360, W2Wyoming MO, 061 ,
1916
$175,98917,022
191,519157,513
3,595,636 !1,055,7582,824,840 !3,695,605 i1,068,644 |
322,636 1378,062 t366,802 (
140,49610,947,250 i1,165,961 1
518,845 i555,943 |384,497 i778,693 •371,367 i
2,405,523 ;10,892,685 !3,340,682 |1.553,282'195,054
2,373.327304^418 ,347,778 (
is;505 i258,173 I
5,545,23183, 935
77,970,521560,97066,344
7,722^ 3064.347,797'337,051
17,612,7391,915,104
77,19848,563
413^ 0782,643.697
167)688365,004593,304776,470416,386
1,253,25767,510
Total * 675,249,450 173,386,694
Increase.
$1,760,22289,076
777,0451,625,997
15,894,1523,936,4977,445,7755,616,1673,232,8921,202,4952,729,692
805,623615,792
36,465,2504,425,6024,384,3524,602,7172,413,9814,036,3422,018,3749,673,419
32,819,29811,252,2776.462,89-'1)900,7528,139,1101,099,4954,612,344187,403
1,212,14319,509,530
558,931171,608,9012,090,534790,130
23,267,3481,129,4992,841,73060,192,0966,768,9701,636,137961,989
2,249,31010,448,9701,123,25s1,063,0643,158,9473)317,7972,756,33S4,112,935743,154
501,862,756
1 Net incomes $2,000 and over. - Net incomes $3,000 and over.
Digitized for FRASER http://fraser.stlouisfed.org/ Federal Reserve Bank of St. Louis
12 STATISTICS OF INCOME.
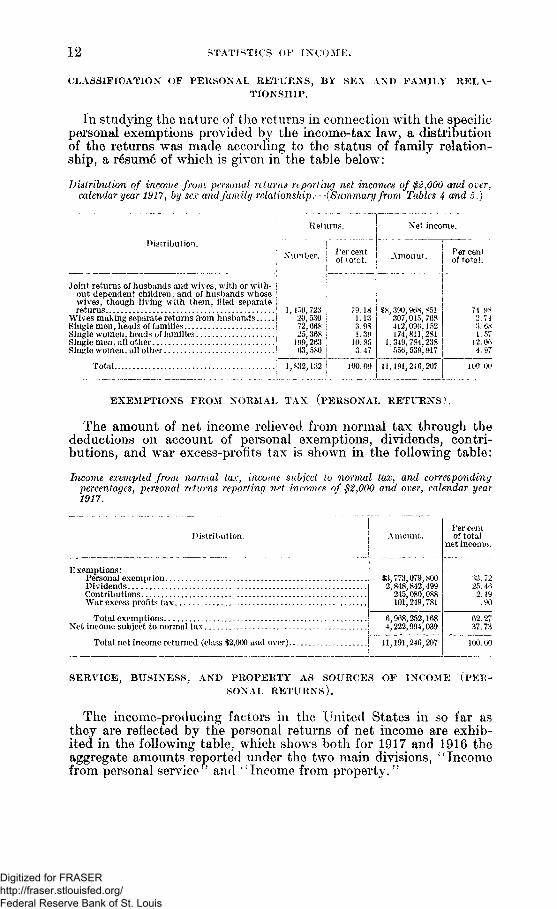
CLASSIFICATION OF PERSONAL RETURNS, BY SEX AND FAMILY RELA-TIONSHIP.
In studying the nature of the returns in connection with the specificpersonal exemptions provided by the income-tax law, a distributionof the returns was made according to the status of family relation-ship, a r6sum6 of which is given in the table below:
Distribution of income from personal returns reporting net incomes of $2,000 and over,calendar year 1917, by sex and family relationship.—(Summary from Tables 4 and 5.)
Distribution.
Total.
Returns.
Number. Per centof total.
Net income,.
Per centof total.
Joint returns of husbands and wives, with or with- iout dependent children, and of husbands whose !wives, though living with them, Died separate ireturns \
Wives making separate returns from husbands ISingle men, heads of families \Single women, heads of families |Single men, all other !Single women, all other !
150,72320,530 i72,668 ;25,368 |109.263 !63,580 |
882,132 |
79.181.133.981.3910.853.47
100.00
*8,
1>
u,
390,968, 851307,045,768412,096,152174,811,281349,784,238556,539,917
191,246,207
74. 982.743. m1.5712.064.97
100.00
EXEMPTIONS FROM NORMAL TAX (PERSONAL RETURNS).
The amount of net income relieved from normal tax through thedeductions on account of personal exemptions, dividends, contri-butions, and war excess-profits tax is shown in the following table:
Income exempted from normal tax, income subject to normal tax, arid correspondingpercentages, personal returns reporting net incomes of $2,000 and over, calendar year1917.
Distribution.
Exemptions:Personal exemptionDividendsContributionsWar excess profits tax.
Total exemptionsNet income subject to normal tax.
$3,773,079,8002,848,842,499245,080,088101,249,781
6,968,252,1684,222,994,039
Total net income returned (class $2,000 and over) 11,191,246,207
Per centof total
net income.
33.7225.462.19.90
62.2737.73
100.00
SERVICE, BUSINESS, AND PROPERTY AS SOURCES OF INCOME (PER-
SONAL R E T U R N S ) .
The income-producing factors in the United States in so far asthey are reflected by the personal returns of net income are exhib-ited in the following table, which shows both for 1917 and 1916 theaggregate amounts reported under the two main divisions, "Incomefrom personal service' and "Income from property/7
Digitized for FRASER http://fraser.stlouisfed.org/ Federal Reserve Bank of St. Louis
STATISTICS OF INCOME. 1 3
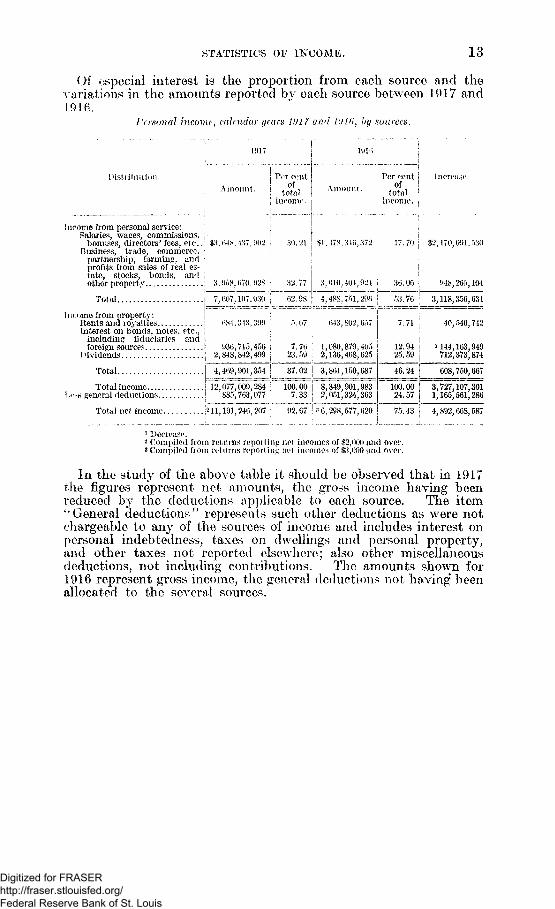
Of especial interest is the proportion from each source and thevariations in the amounts reported by each source between 1917 and1916.
Personal income, calendar years 1917 and lVlf>, by sources.
Distribution.Amount.
Per centI ofj totalI income.
Per cent iof !
total |income, j
Incmw.
I ncome from personal service: !Salaries, wages, commissions, , i
bonuses, directors' fees, mo..1 $H.ws, 437,902 jBusiness, trade, commerce, •
partnership, farming, andprofits from sales of real es-tate, stocks, bonds, and ;other property 3.958,070,02$
30.21 $1, 178.3-M, 372 17. 70 j §2,170,091,530
32.77
Total ! 7,607,107,930 i 62.98
«4.343,399 5.07
3,010,401,924 36.06
Income from property:Rents and royaltiesInterest on bonds, notes, etc.,
including fiduciaries andforeign sources
Dividends
Total.
Total incomess general deductions..
4,488,751,296
643,802,057
53.76
7.71
948,265,104
3,118,356,634
40,540,742
2,
4,
12,
936,715,456 i848,842,499 !
469,
077,885,
901,354 j
009,284 |763,077 i
23.'
37.
100.7.
76 !59
02 1
00 |33;
1,080,879,4052,136,468,625
3,
2
861,
349,051,
150,
901,324,
687
983363
1225
9459
46.24
10024
0057
U44,712,
608,
3,727,1,165,
163,949373,874
750,667
107,301561,286
Total net income ;211,191,246,207 \ 92.67 ! 3 6.298,577,620 ! 75.43 j 4,892,668,587
1 Decrease.2 Compiled from returns reporting net incomes of $2,000 and over,s Compiled from returns reporting net incomes of $3,000 and over.
In the study of the above table it should be observed that in 1917the figures represent net amounts, the gross income having beenreduced by the deductions applicable to each source. The item^General deductions" represents such other deductions as were notchargeable to any of the sources of income and includes interest onpersonal indebtedness, taxes on dwellings and personal property,and other taxes not reported elsewhere; also other miscellaneousdeductions, not including contributions. The amounts shown for1916 represent gross income, the general deductions not having beenallocated to the several sources.
Digitized for FRASER http://fraser.stlouisfed.org/ Federal Reserve Bank of St. Louis
14 STATISTICS OF IK COME.
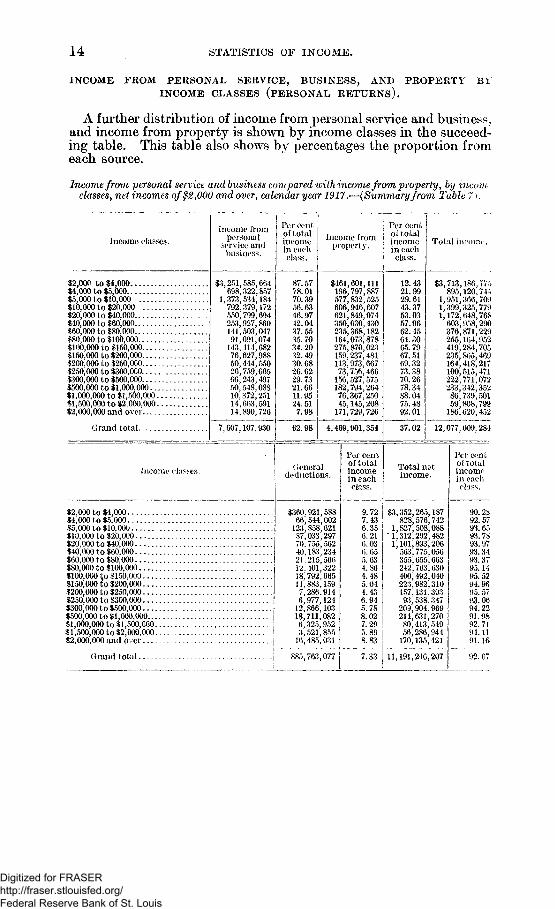
INCOME FROM PERSONAL SERVICE, BUSINESS, AND PROPERTY BYINCOME CLASSES (PERSONAL RETURNS).
A further distribution of income from personal service and business,and income from property is shown by income classes in the succeed-ing table. This table also shows by percentages the proportion fromeach source.
Income from personal service and business com pared with income from property, by incomclasses, net incomes of $2,000 and over, calendar year 1917.-—(Summary from Table 7).
Income classes.
$2,000 to $4,000$4,000 to $5,000$5,000 to $10,000$10,000 to $20,000$20,000 to $40,000$40,000 to $60,000$60,000 to $80,000$80,000 to $100,000$100,000 to $150,000$150,000 to $200,000$200,000 to $250,000$250,000 to $300,000$300,000 to $500,000$500,000 to $1,000,000...$1,000,000 to $1,500,000.$1,500,000 to $2,000,000.$2,000,000 and over
Grand total..
income lrompersonal
service andbusiness.
251,585,664698,322,857373,534,184792,379,172550,799,694253,927,860141,503,04791,091,074
143,414,68276,627,98850,444,55026,759;00566,243,49750,548,08810,372,25114,663,59114,890,726
7,607,107,930
Per centof totalincomein eachclass.
87.5778.0170.3956.6346.9742.0437.5535.7034.2032.4930.6826.6229.7321.6611.9524.517.98
Income fromproperty.
62.98
$461,601,111196,797,887577,832,525606,946,607621,849,074350,030,430235.368,182164,073,878275,870,023159,237,481113,973,66773,756,466156,527,575182,794; 26476,367,25045,145,208171,729,726
4,469,901,354
Per centof totalincomein eachclass.
12.4321.9929.6143.3753.0357.9662.4564.3065.7967.5169.3273.3870.2678.3488.0475.4892.01
37.02
Total income.
$3,713,895,
1,951,1,399,1,172,603,376,255,419,235,164,100222,233,86,59,186
186,775120,744366,709325,779648,768958,290871,229164,952284,705865,469418,217515,471771,072342,352739,501808,799620,452
12,077,009,284
Income classes. Generaldeductions.
$2,000 to $4,000$4,000 to $5,000$5,000 to $10,000$10,000 to $20,000$20,000 to $40,000$40,000 to $60,000......$60,000 to $80,000$80,000 to $100,000$100,000 to $150.000$150,000 to $200,000....$200,000 to $250,000$250,000 to $300,000....$300,000 to $500.000....$500,000 to $1,000,000....$1,000,000 to $1,500,000..$ 1,500,0001 o $2,000,000.$2,000,000 and over
: : : i
Grand total.
$360,921,58866)544,002123,858,62187,033,29770,755,56240,183,23421,215,56612.101,32218,792,66511,883,1597,286.9146,977; 12412,866,10318,711,0826,325,9523,521,85516,485,031
885,763,077
Per centof totalincomein eachclass.
Total notincome.
9.727.436.356.216.036.655.63 I4.86 !4.485.044.436.945. 788.027.295.898.83
7.33
$3,352,828:
1,827!"1,312^l,10i;563,355;242;400,223,157,93,
209,214,80,56,170,
265,187576,742508,088292,482893,206775,056655,663763,630492,040982,310131,303538,347904,969631,270413,549286,944135,421
11,191,246,207
Per centof totalincomein eachclass.
90.2892.5793.6593.7893.9793.3493.3795.1495.5294.9695.57lJ3.0694.2291.9892.7194.1191.16
92.67
Digitized for FRASER http://fraser.stlouisfed.org/ Federal Reserve Bank of St. Louis
STATISTICS OF INCOME. 15
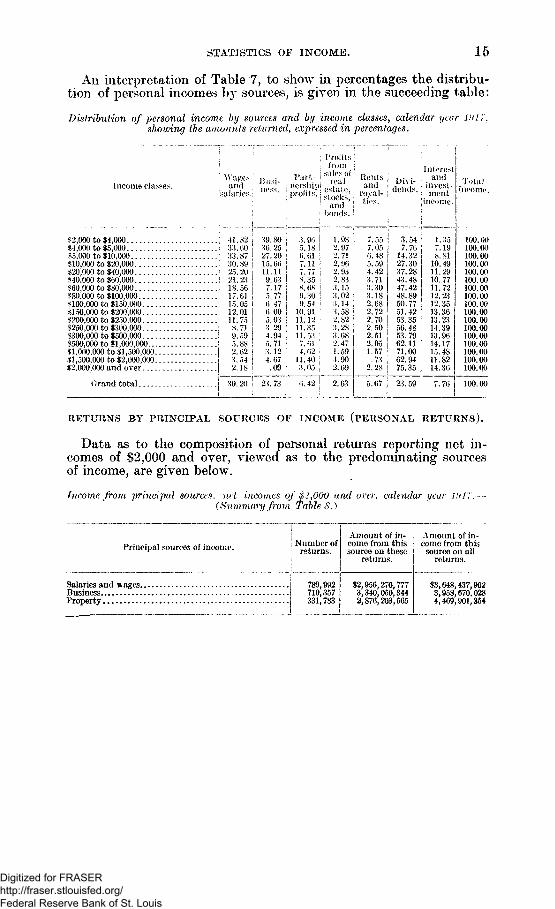
An interpretation of Table 7, to show in percentages the distribu-tion of personal incomes hj sources, is given in the succeeding table:
Distribution of personal income by sources and by income classes, calendar year iut7,showing the amounts returned, expressed in percentages.
Income classes.
$2,000 to $4,000$4,000 to $5,00035,000 to $10,000$10,000 to $20,000$20,000 to 340,000.$40,000 to $60,(300$60,000 to $80,000$80,000 to $100,000«100,000 to $150,000$150,000 to $200,000$200;000 to $250,000.$250,000 to $300,000$300,000 to $500,000$500,000 to $1,000,000$1,000,000 to $1,500,00031,500,000 to $2,000,000$2,000,000 a n d over
ft rand total.
Profitsfrom
sales ofreal
estate,stocks,
andbonds.
1.982.972.712.962.932.833.153.023.143.582.823.2S3.682.471.594.902.69
2.63
Rentsand
royal-ties.
7.557.056.485.594.423.713.303.182.682.722.702.502.512.051.57
.732.28
5.67
Divi-dends.
_. .
3.547.76
14.3227.3037.2843.4847.4248.8950.7751.4253.3556.4853.7962.1171.0062.9475.35
23.59
Interestand
invest-ment
income.
1.357.198.81
10.4911.2910.7711.7212.2312.3513.3613.2314.3913.9614.1715.4811.8214.36
7.76
Totalincome
100.00100.00100.00100.00100.00100.00100.00100.00100.00100.00100.00100.00100.00100.00100.00100.00100.00
100.00
RETURNS BY PRINCIPAL SOURCES OF INCOME (PERSONAL RETURNS).
Data as to the composition of personal returns reporting net in-comes of $2,000 and over, viewed as to the predominating sourcesof income, are given below.
Income from principal sources, net incomes of $2,000 and over, calendar year ID 17.---(Summary from Table 8.)
Principal sources of income. j Number ofreturns.
Salaries and wages 789,992Business 710,357Property | 331,783
Amount of in-come from thissource on these
returns.
§2,956,270,7773,340,050,3442,876,203,565
Amount of in-come from this
source on allreturns.
•S3,648,437,9023,958,670,0284,469,901,354
Digitized for FRASER http://fraser.stlouisfed.org/ Federal Reserve Bank of St. Louis
16 STATISTICS OF INCOME.
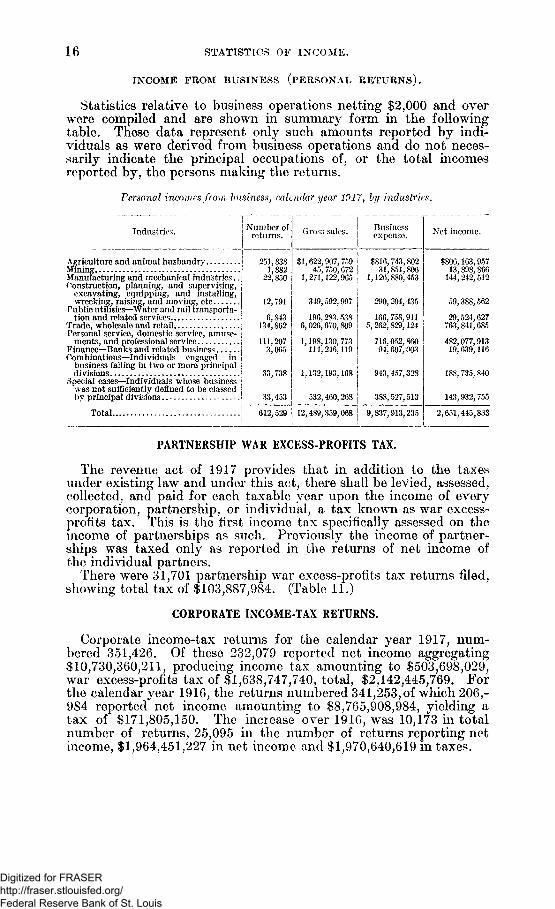
INCOME FROM BUSINESS (PERSONAL RETURNS).
Statistics relative to business operations netting $2,000 and overwere compiled and are shown in summary form in the followingtable. These data represent only such amounts reported by indi-viduals as were derived from business operations and do not neces-sarily indicate the principal occupations of, or the total incomesreported by, the persons making the returns.
Personal incomes from- business, calendar year 19.17, by industries.
Industries.
Agriculture and animal husbandryMiningManufacturing and mechanical industries..Construction, planning, and supervising,
excavating, equipping, and installing,wrecking, raising, and moving, etc
Public utilities—Water and rail transporta-tion and related services
Trade, wholesale and retailPersonal service, domestic service, amuse-
ments, and professional serviceFinance—Banks and related businessCombinations—Individuals engaged in
business falling in two or more principaldivisions
Special cases—Individuals whose businesswas not sufficiently defined to be classedbv principal divisions
Total
Number ofreturns.
251,8381,882
22,850
12, 791
6,843134,862
111,2073,065
33,738
33,453
612,529
(Iross sales.
$1,622,907,75945,750,072
1,271,122,965
349,592,997
196,283.5386,026,670;809
1,198,130,773114,246,119
1,132,193,168
532,460,268
12,489,359,068
Businessexpense.
§816,743,80231,851,806
1,126,880,453
290,204,435
166,758,9115, 262,829,124
716,052,86094,607,003
943,457,328
388,527,513
9,837,913,235
Net income.
$806,163,95713,898,866
144,242,512
59,388,562
29,524,627763,841,685
482,077,91319,639,116
188, 735,840
143,932,755
2,651,445,833
PARTNERSHIP WAR EXCESS-PROFITS TAX.
The revenue act of 1917 provides that in addition to the taxesunder existing law and under this act, there shall be levied, assessed,collected, and paid for each taxable year upon the income of everycorporation, partnership, or individual, a tax known as WSLT excess-profits tax. This is the first income tax specifically assessed on theincome of partnerships as such. Previously the income of partner-ships was taxed only as reported in the returns of net income ofthe individual partners.
There were 31,701 partnership war excess-profits tax returns filed,showing total tax of $103,887,984. (Table 11.)
CORPORATE INCOME-TAX RETURNS.
Corporate income-tax returns for the calendar year 1917, num-bered 351,426. Of these 232,079 reported net income aggregating$10,730,360,211, producing income tax amounting to $503,698,029,war excess-profits tax of $1,638,747,740, total, $2,142,445,769. Forthe calendar year 1916, the returns numbered 341,253,of which 206,-984 reported net income amounting to $8,765,908,984, yielding atax of $171,805,150. The inciease over 1916, was 10,173 in totalnumber of returns, 25,095 in the number of returns reporting netincome, $1,964,451,227 in net income and $1,970,640,619 in taxes.
Digitized for FRASER http://fraser.stlouisfed.org/ Federal Reserve Bank of St. Louis
STATISTICS OF INCOME. 17
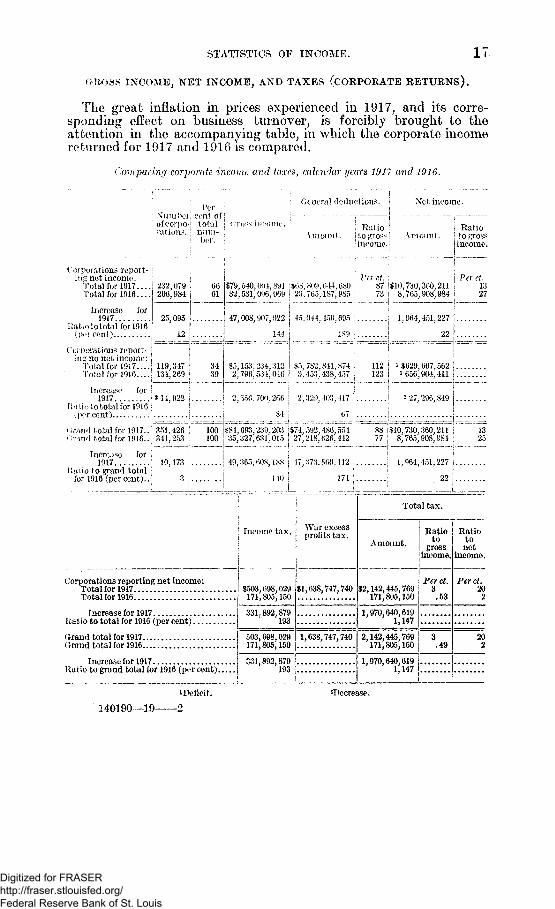
CROSS INCOME^ NET INCOME, AND TAXES (CORPORATE RETURNS).
The great inflation in prices experienced in 1917, and its corre-sponding effect on business turnover, is forcibly brought to theattention in the accompanying table, in which the corporate incomereturned for 1917 and 1916 is compared.
Comparing corporate income and taxes, calendar years 1911 and 1916.
1 l - ii . | ; General deductions. I; Per : j
; Number! cent of j j— — - ~ r -J-; ofcorpo-j total | (truss income. ! ' Ratio '
Net income.
rations. ! mini- )bcr. Amount. j to gross! Amount.
1 income.!
Corporations report- • •ing net income:
total for 1917.... 232,079 iTotal for 1916....
Increase for1917
Ratiotototal for 1916 |(percent) j
66206,984 61
Per ct.1327
25,095 ;
• Virct. j•179,540,001,891 i.$6S,809,644.6SO ; 87 ($10,730,360,21132,531,096,969 i 23,765,187:985 ' 73 ! 8,765,908,984
i ' ' • i 1 i _j '
47,00S,w07.022 ; 45 .0 \ \ , 156,695 ; 1 1,964,451,227 I
Ratioto grossincome.
I l l I S O '• 22
Corporations report- I jinsr no net income: (
Total for 1917.... 119,."17Total for 1916....| 134;269
Increase for !1917 214,922
Ratio to total for 1916;(percent) j . . . . . . .
?"> 153 231,312 ' M.782 SU.K71 112 1 $629,607,5622 796 5H.010 ' J. t~>3 13S, H7 1 2 3 ' i 656,904,411
2 r/- 700 2)^ ' 2 J2> M)J 117 ' . 2 27,296,849
(irand total for 1917. .i 351,426(hand total for 1916..; 341,253
100 '*S4.093,2i'). 203 '$74,592, ISb,531100 35,327,631,01) 27,218,026 412
Increase for j1917 j
Ratio to grand total ifor 1916 (percent)...
10,173 j
^10,730,360,211 I 138,765,908,884 i 25
49,365,608,18s i 47,373,860,112 i 1,964,451.227 1! | ' i
140 i 174 !,- 22!
Income tax. War excessprofits tax.
Corporations reporting net income:Total for 1917 ..! $503,698,029~ ** — 171,805,150Total for 1916
331,892,879193
Increase for 1917Ratio to total for 1916 (per cent)
Grand total for 1917 j 503,698,029Grand total for 1916 171,805,150
$1,638,747,740
Increase for 1917 j 331,892,879Ratio to grand total for 1916 (per cent) I 193
1,638,747,740
Total tax.
Amount.Ratio Ratio
togross
income.
I Per ct.$2,142,445,769 3
171,805,150 .53
1,970,640,6191,147
2,142,445,769! 3171,805,150 i .49
tonet
Per ct.202
202
1,970,640,619 I1,147 !
i Deficit. decrease.
140190—19-
Digitized for FRASER http://fraser.stlouisfed.org/ Federal Reserve Bank of St. Louis
18 STATISTICS OF INCOME.
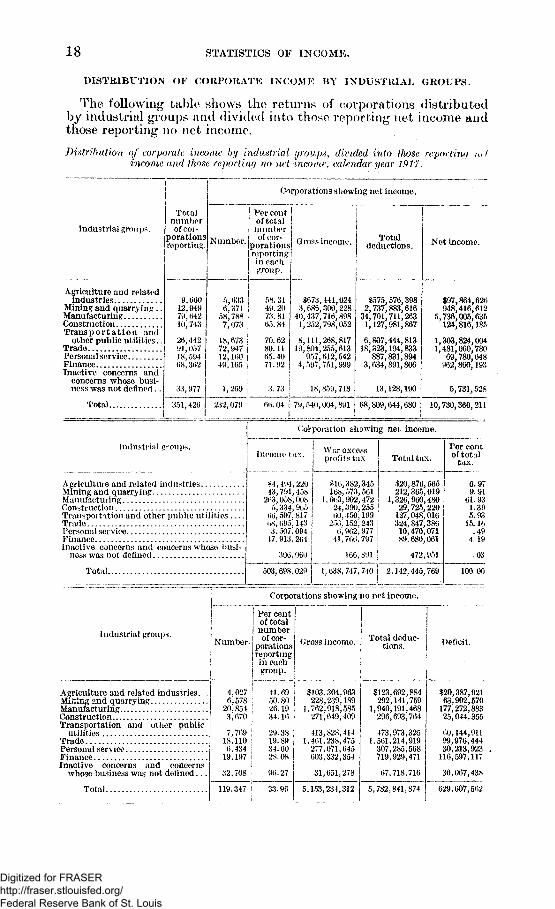
DISTRIBUTION OF CORPORATE INCOME BY INDUSTRIAL GROUPS.
The following table shows the returns of corporations distributedby industrial groups and divided into those reporting net income andthose reporting no net income.
Distribution of corporate, income by industrial groups, divided into those reporting //,< /income and those reporting no net income, calendar year 1917.
Industrial groups.
Agriculture and relatedindustries
Mining and quarrying ..ManufacturingConstructionTransportation and
other public utilities.TradePersonal serviceFinanceInactive concerns and
concerns whoso, busi-ness was not defined..
Totalnumberof cor-
porationsreporting.
9,66012,94979,64210,743
26, 44291,05718,59468,362
33,977
Corporations showing net income.
Number.
Per centof totalnumberoi" cor-
porations' reporting
in eachgroup.
Total | 351,426
5,6336,371
58,7887,073
18,673 i72,947 j12,160 !49,165 j
1,269 I
58.3149.2073. 8165. 84
70. 6280.1165.4071.92
3. 73 i
Gross income.
S673,441,0243,686,300,228
40,437,716,8981,252,798,052
8,111,268,81719,804,255,613
957,612,5424,597,751,999
18,859,718
232,079 > 66.04 | 79,540,004,891
Totaldeductions.
$575,576,3982,737,883,616
34,701,711,2631,127,981,867
6,807,444,81318,323,194,833
887,831,8943,634,891,806
13,128,190
Net income.
$97,864,626948,416,612
5,736,005,635124,816,185
1,303,824,0041,481,060,780
69,780.648962,860,193
5,731,528
68,809,644,680 10,730,360,211
Corporation showing net income.
Industrial groups. i! Income tax.
Agriculture and related industriesMining and quarryingManufacturingConstructionTransportation and other public utilitiesTradePersonal serviceFinanceInactive concorns and concerns whose busi-
ness was not defined
Total..
War excessprofits tax- Total tax.
$4,494,22013,791,458
263,058,008 ,5,334,9(i5
tHi, 597,817 !(>S, 695,143 [3,507,094 '
17,913,264
306,060
503,698,029
516,382,345168,573,561
1,003,902,47224,390,25500,450,199 |
250,152,243 j<»',962,977 |
41,766.797 j
166,891 |
$20,876,565212,365,019
1,326,960,48029,725,220
127,048,016324,847,38610,470,07189,680,061
472,951
1,038,747,740 2,142,445,769
Per centof total
tax.
0.979.91
61.931.395.93
15.16.49
4.19
.03
100.00
Corporations showing no net income.
Ludustrial groups.! Number.
Agriculture and related industries...Muling end quarryingManufacturingConstructionTransportation and other public
utilitiesTradePersonal serviceFinanceInactive concerns and concerns
whose business was not defined...
Total
4,6,20,3,
is!
19.
027578854670
769110434197
32,708
Per centof totalnumberof cor-
porationsreporting
! in eachj group.
41.6950.8026.1934.16
29.3819.8934.6028.08 j
96.27
Gross income.Total deduc-
tions.
119.347 33.96
$103,228,
1,762271,
413,1,461,277,603,
31,
5,153,
304,239,918,649,
828,238,071,332,
651,
231,
963189585409
414475645354
278
312
1
1
5
S123,292,,940,296,
473,,561,307,719,
67,
,782,
692,141,191,693,
973,214,285,929,
884759468764
325919568471
718,716
841,8 7 4 1
Deficit.
$20,387,92163,902,570177,272,88325,044,355
60,144,91199,976,44430,213,923116,597,117
36,067,438
629,607,562
Digitized for FRASER http://fraser.stlouisfed.org/ Federal Reserve Bank of St. Louis
STATISTICS OF INCOME. 19
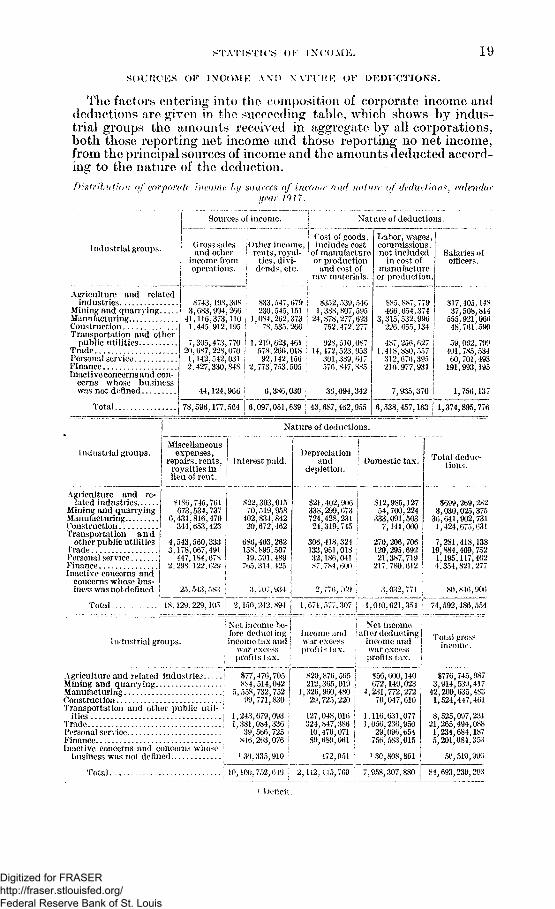
SOURCES OF INCOME AND XATUKK OF DEDUCTIONS.
The factors entering into the composition of corporate income anddeductions are given in the succeeding table, which shows by indus-trial groups the amounts received ill aggregate by all corporations,both those reporting net income and those reporting no net income,from the principal sources of income and the amounts deducted accord-ing to the nature of the deduction.Distribution of corpotntr income ft/ suwrc< nj iti
if car 19 rand wihu'v of deduct ion ft calendar
Industrial groups.
Agriculture and relatedindustries
Mining and quarryingManufacturingConstructionTransportation and other
public utilities.TradePersonal serviceFinanceInactive concerns and con-
cerns whose businesswas not defined
Sources of income Nature of deductions.
Gross salesand other
income fromoperations.
jOther income,i rents, royal-; ties, divi-I dends, etc.
$743,198,308 I $33,547,0793,683,994,266 j 230,545,151
41,116,373,110 1,084,262,3731,445,912.195 ! 78,535,266
7,305,473.77020.687,228,0701,142,542,0312.427,330.848
44,124,966 I
1,219,623,461 \578,266,018 \92,142,156
2,773,753,505 :
6,386,030 I
COM of goods,j includes cost| of manufacture; or production| and cost of\ raw materials.
$352,539,5461,388,807,595
24,878,277,623752,472,277
928,510,08714,472,523,953
301,389,647576.847,885
36,094,342
Labor, wages,commissions,not included
in cost ofmanufactureor production.
$85,887,779466,654,374
3,315,532,996226,655,134
487,256,6271,418,880^557
312,676,395216.977,931
7,935,370 j
Salaries ofofficers.
§17,405.14837,508,814
555,921,06648,761,590
59,062,799401,785,53460,701,493
191,993,195
1,756,137
Total 78,598,177,564 6,097,081,639 I 43,687,462,955 6,538,457,163 | 1,374,895,776
Nature of deductions.
Industrial groups.
Agriculture and re-lated industries
Mining and quarryingManufacturingConstructionTransportation a n d
other public utilitiesTradePersonal serviceFinanceInactive concerns and
concerns whose bus-iness was not defined
Miscellaneous ;expenses, |
repairs, rents, Iroyalties in Jlieu of rent. '
Interest paid.
$186,673,
0,431,344,
4,543,3,178,
447,2,298,
761737470423 j
333 |491 !678 !629 S
$22,303,01570,519,958
402,834,84220,672,462
686,403,262158,895,507
HK 591,489765,314,425 !
Depreciationand
depletion.Domestic tax.
S21.338i724,
24,
306,133,32,
I
3,707,934
,402,906 !,299,673 I,428,231 |319,745 '
418,324961,018 l186.041 I784,600
76,769
$12,985,12754,700,224
333,091,5037,141,000
270,206,706120,295,69221,387,719217.7S0.612
3,032.771
Total deduc-tions .
$699,269,2823,030,025,375
36,641,902,7311,424,675,631
7,281,418,13819,884,409,7521,195,117,4624.354,821,277
80,846,906
Total. 18.129,229,105 ' 2,150,242,^94 \ 1,671,577,307 1,010,621,354 74,592,486,554
Industrial groups.
Agriculture and related industriesMining and quarryingManufacturingConstructionTransportation and other public util-
itiesTradePersonal serviceFinanceInactive concerns and concerns whose
business was not defined
Net income be-i fore deducting ;1 income tax and j
war excess j: profits tax. i
' $77,476,705 I! 884,514,042 !| 5,558,732,752 Ii ' 99,771,830 !
1,243,679,093 !1,381,084,336 j
39,566,725 i846,263,076 j
130.335,910 !
Xct incomeIncome and i after deducting jwar excess i income and Iprofits tax. i war excess I
I profits tax. j
$20,876,565 j212,365,019 j
1,326,960,480 !29,725,220 j
127,048,016 !324,847,386 !10,470,071 !89,680,061 !
472,951 \
356,600,140672,149,023
4,231,772,27270,047,610
1,116,631,0771,056,236,950
29,096,654756,583,015
J30,808,861
Total ; 10,100, 752,649 j 2,142,445,769 ; 7,958,307,880
1 Deficit.
Total grossincome.
$776,745,9873,914,539,417
42,200,635,4831,524,447,461
8,525,097,23121,265,494,0881,234,684,1875,201,084,353
50,510,990
84,693,239,203
Digitized for FRASER http://fraser.stlouisfed.org/ Federal Reserve Bank of St. Louis
20 STATISTICS OF INCOME.
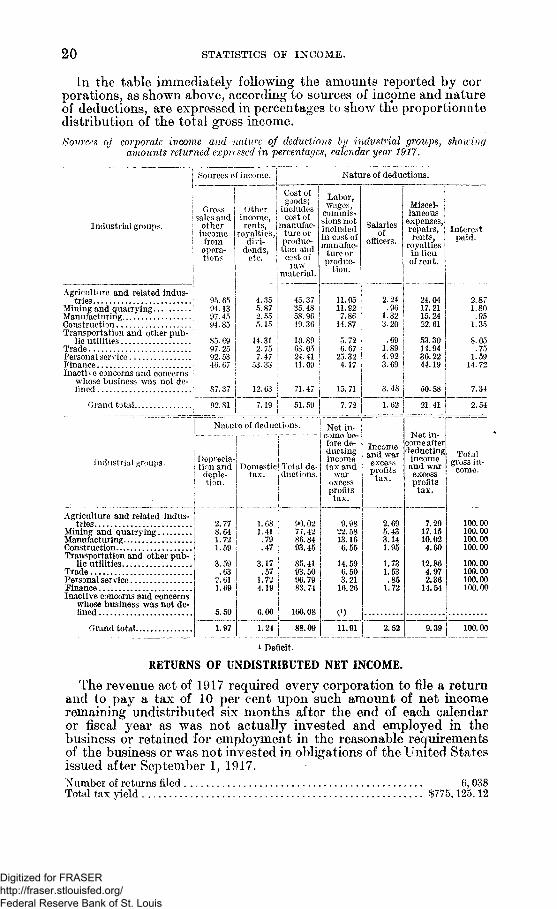
In the table immediately following the amounts reported by cor-porations, as shown above, according to sources of income and natureof deductions, are expressed in percentages to show th'e proportionatedistribution of the total gross income.Sources of corpo?*ate income and nature of deductions by industrial groups, showing
amounts returned expressed in percentages, calendar year 1917.
Industrial groups. \
Agriculture and related indus-tries
Mining and quarryingManufacturingConstructionTransportation and other pub-
lic u t i l i t ies . . . . . .T r a d e . .Personal serviceFinanceInactive concerns and concerns
whose business was not de-fined
Grand total
Industrial groups.
Agriculture and related indus-tries
Mining and quarryingManufacturing ..ConstructionTransportation and other pub-
lic utilitiesTradePersonal serviceFinance . .Inactive concerns and concerns
whose business was not de-fined
Grand total
Sources of income.
Grosssales and
otherincome
fromopera-tions
95.6594.1397.4594.85
So. C997.2592.5346.67
87.37
92.81
Otherincome,rents,
royalties,divi-
dends,etc.
4.355.872.555.15
14.312.757.47
53.33
12.63
7.19
Cost ofgoods;
includescost of
manufac-ture orproduc-tion andcost of
rawmaterial.
45.3735.4858.9649.36
10.8968.0524.4111.09
71.47
51.59
Nature of deductions.
Deprecia-tion and
deple-tion.
2.778.641.721.59
3.59.63
2.611.69
5.50
1.97
Domestictax.
1.681.41
.79
.47
3.17.57
1.724.19
6.00
1.24
—
Total de-ductions.
90.0277.4286.8493.45
85.4193. 5096.7983.74
j 160.08
88.09
Nature of deductions.
Labor,wages,
commis-sions notincludedin cost ofmanufac-
ture orproduc-
tion.
11.0511.927.86
14.87
5. 726.67
25.324.17
15. 71
, 7 2
Net in-come be-fore de-ductingincometax and
warexcessprofits
tax.
9.9822.5813.166.55
14.596.503.21
16.26
( l)
11.91
Salariesof
officers.
2.24.96
1.323.20
.691.894.923.69
3.48
1.62
Incomeand warexcessprofits
•
2.695.433.141.95
1.731.53
.851.72
2.52
Miscel-laneous
expenses,repairs,rents,
royaltiesin lieuof rent.
24.0417.2115.2422.61
53.3014.9436.2244.19
50.58
21.41
Net in-come afterdeducting
incomeand warexcessprofitstax.
7.2917.1510.024.60
12.864.972.36
14.54
9.39
Interestpaid.
2.871.80
.951.35
8.05.75
1.5914. 72
7.34
2.54
Totalgross in-
o.
100. OC100.00100.00100.00
100. OO100.00100.00100.00
100.00
i Deficit,
RETURNS OF UNDISTRIBUTED NET INCOME.
The revenue act of 1917 required every corporation to file a returnand to pay a tax of 10 per cent upon such amount of net incomeremaining undistributed six months after the end of each calendaror fiscal year as was not actually invested and employed in thebusiness or retained for employment in the reasonable requirementsof the business or was not invested in obligations of the United Statesissued after September 1, 1917.Number of returns filed 6,038Total tax yield $775,125.12
Digitized for FRASER http://fraser.stlouisfed.org/ Federal Reserve Bank of St. Louis
STATISTICS OF INCOME. 21
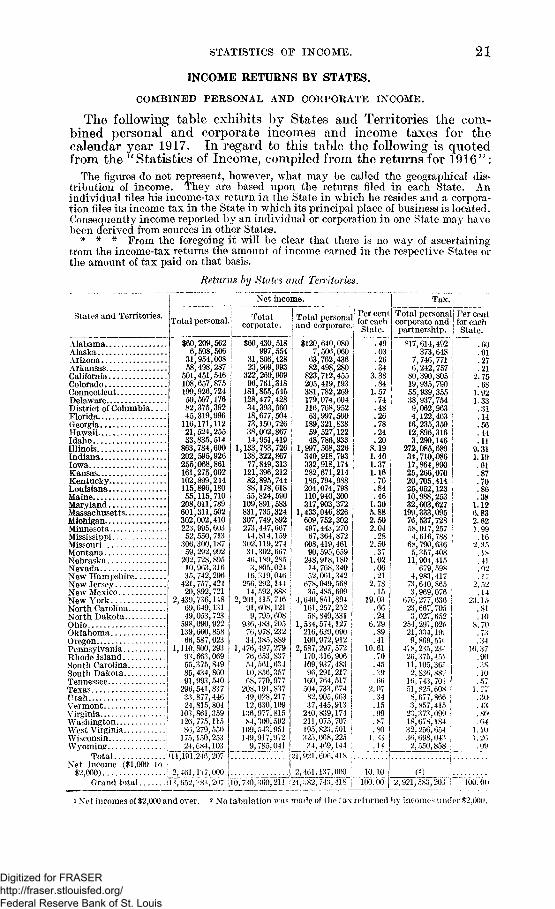
INCOME RETURNS BY STATES.
COMBINED PERSONAL AND CORPORATE INCOME.
The following table exhibits by States and Territories the com-bined personal and corporate incomes and income taxes for thecalendar year 1917. In regard to this table the following is quotedfrom the " Statistics of Income, compiled from the returns for 1916 ":
The figures do not represent, however, what may be called the geographical dis-tribution of income. They are based upon the returns filed in each State. Anindividual fdes his income-tax return in the State in which he resides and a corpora-tion files its income tax in the State in which its principal place of business is located.Consequently income reported by an individual or corporation in one State may havebeen derived from sources in other States.
* * * From the foregoing it will be clear that there is no way of ascertainingtrom the income-tax returns the amount of income earned in the respective States orthe amount of tax paid on that basis.
Returns by States and Territories.
States and Territories. Total personal.!
AlabamaAlaskaArizonaArkansasCaliforniaColoradoConnecticutDelawareDistrict of ColumbiaFloridaGeorgiaHawaiiIdahoIllinoisIndianaIowaKansasKentuckyLouisianaMaineMarylandMassachusettsMichiganMinnesotaMississippiMissouriMontanaNebraskaNevadaNew HampshireNew JerseyNew Mexico \New York |North Carolina iNorth Dakota jOhio !OklahomaOregonPennsylvaniaRhode IslandSouth CarolinaSouth DakotaTennesseeTexasUtahVermontVirginiaWashingtonWest VirginiaWisconsinWyoming
TotalNet income ($1,000 to
«2,000)Grand total
Net income.
Totalcorporate.
I Total personali and corporate.
$60,209,5626,508,506
31,954,00858,498,287
501,451,546108,657,875199,926,724,50,597,17682,375,39245,319,996
116,171,11221,524,25533,835,514
863,784,600202,595,926255,068,861161,275,002102,899,244115,896,18055,115,710
208,011,789601,311,502302,002,410223,995,60352,550,713
306,300,18759,292,992
202,728,89510,963,31635, 742,296
421,757,42420,892,721
,439,736,14869,649,13149,053,723
598,090,922139,660,85866,587,023
,110,800,29393,663,06955,375,84985,434,86091,993,540
296,541,83733,877,44624 815,804
103,861,359126,775,11586,279,550
175,150,25324,_684_L103
7l9i~246,207"
,461,137,000^52^8^207
•160,430,518997,554
31,808,42823,999,993
322,260,90996,761,318
181,855,545128,477,42834,393,56018,677,50473,150,72638,002,86714,951,419
1,133,783,726138,322,86777,849,313
121,396,21282,895,74488,178,618.55,824,590
109,891,583831,735,324307,749,892273,447,66714,814,159 j
302,119,27431,302,667 I46,189,285 j3,805,024 ;
16,319,046 !256,292,144 i14,592,888 I
2,201,115,74691,608,121 ;9,795,608 !
936,483,205 I7(5,978,23234,385,889
1,476,497,27976,653,83754,561,63410,856,35768,770,977
208,191,83749,028,21712,630,109
136,977,81584,300,592
109,543,951149,917,972
9,785,041
Per centfor eachState.
$120,640,0807,506,06063,762,43682,498,280823,712,455205,419,193381,782,269179,074,604116,768,95263,997,500189,321,83859,527,12248,786,933
1,997,568,326340,918,793332,918,174282,671,214185,794,988204,074,798110,940,300317,903,372
1,433,046,826609,752,302497,44-3,27067,364,872608,419,46190,595,659248,918,18014,768,34052,061,342678,049,56835,485,609
4,640,851,894161,257,25258,849,331
1,534,574,127216,639,090100,972,912
2,587,297,572170,316,906109,937,48396,291,217160,764,517504,733,67482,905,66337,445,913240,839,174211,075,707195,823,501325,068,22534,469,144
.49
.03
.26
.343.38.841.57.74.48.26.78.24.208.191.401.371.16.76.84.461.305.882.502.04.28
2.50.371.02.06.21
2.78.15
19.03.66.24
6.29.89.41
10.61.70.45.89.66
2.07.34. 15.99.87.801.33.14
Tax.
Total personal! Per centcorporate and for eachpartnership. | State.
,107W,li(i0,2il j'24,^82,"74*3,418 j10.10
100.00
$17,614,492373,648
7,746,7716,242,75780,390,80519,935,79055,939,35538,937,7549,062,9634,122,46316,235,35912,896,3163,290,146
272.085,68934,710,08617,864,89025,266,07020,705,41425,052,12310,988,25332,603,627199,333,09576,537,72858,017,2574,616,78S68,790,6365,357,40811,904,415
679,5984,983,41773,640,8653,969,076
676,277,63623,667,7053,027,652
254,297,02521,334,1919,869,57(
478,235,23-26,375,45i11,105,36."2,836,88216,743,70351,825,6088,677,8663,857,415
23,373,09918,678,18432,256,6543«,698,0432,of)0,85S
.60
.01
.27
.212.75.68
1.921.33.31.14.56.44.11
9.311.19.61.87.70.86.38
1.126.832.621.99.16
2.35!is.41.02.17
23.15.81.10
8.70.73.34
16.37.90.:m.10. 57
1.77. 30A'.i.Si*.64
1.10] . 21)
.09
i Net incomes of 82,000 and over. 2 x 0 tabulation was made of the tax returned by incomes under S2.00O,
Digitized for FRASER http://fraser.stlouisfed.org/ Federal Reserve Bank of St. Louis
22 STATISTICS OF INCOME.
FOREIGN INCOME REPORTED ON PERSONAL RETURNS.
Foreign incomes of $50 and over (interest on bonds of foreigncountries, dividends and interest on stocks and bonds of foreigncorporations, salaries from foreign corporations, and income frombusiness in foreign countries) reported in personal returns showingnet incomes of $2,000 and over.Number of returns reporting income from foreign sources 33, 470Total amount..- $45, 349. 580
FOREIGN INVESTMENTS IN THE UNITED STATES.
The income reported by nonresident aliens and corporations con-trolled by nonresident aliens is shown in Table 21. The number ofpersonal returns was 3,602, reporting net income of $75,926,572,and total tax (normal, surtax, and war excess-profits tax) amount-ing to $7,116,824. The total number of foreign corporations makingreturns was 838, of which number 706 showed a net income aggre-gating $62,692,382, and total tax amounting to $5,692,224.
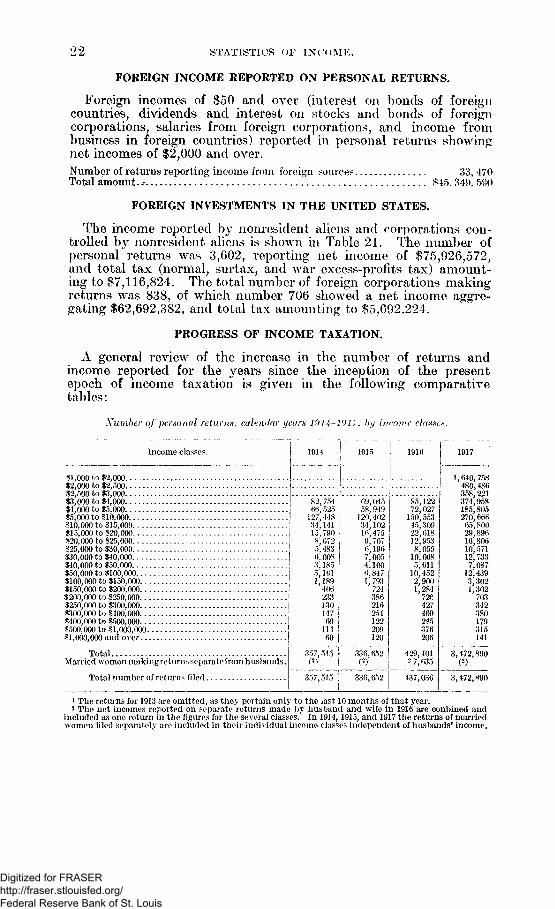
PROGRESS OF INCOME TAXATION.
A general review of the increase in the number of returns andincome reported for the years since the inception of the presentepoch of income taxation is given in the following comparativetables:
Xumber of personal returns, cultndur years 1914-1917. by income classes.
Income classes.
$1,000 to $2,000$2,000 to $2,500$2,500 to 13,000$3,000 to $4,000$4,000 to 15,000$5,000 to $10,000$10,000 to $15,000$15,000 to $20,000$20,000 to $25,000$25,000 to $30,000$30,000 to $40,000$40,000 to $50,000$50,000 to $100,000$100,000 to $150,000...$150,000 to $200,000...-$200,000 to $250,000...$250,000 to $300,000.. .$300,000 to $400,000. - .$400,000 U $500,000.. .3500,000 to $1,000,000.$1,000,000 and ove r . . .
1914 1915
TotalMarried women making returns separate from husbands.
Total number of returns filed
82,75466,525127,44,834,14115,7908,6725,4836.008
'X, 1855,1611,189'4062331301476911460
357,515
357,515
69,04558,949
120,40234,10216,4759,7076,1967,0054,1006,8471,793
724386216254122209120
336,652(2)
1916 1917
85,12272,027
150,55345,30922,61812,9538,055
10,0685,611
10,4522,9001,284
726427469245376206
429,4012 7,635
336,652 437,036
1,640,758480,486358,221374,958185,805270,66665,80029,89616,80610,57112, 7337,087
12,4393,3021,302
703342380179315141
3,472,890(2)
3,472,890
1 The returns for 1913 are omitted, as they pertain only to the iast 10 months of that year.2 The net incomes reported on separate returns made by husband and wife in 1916 are conbined and
included as one return in the figures for the several classes. In 1914, 1915, and 1917 the returns of marriedwomen filed separately are included in their individual income classes independent of Imsbands' income.
Digitized for FRASER http://fraser.stlouisfed.org/ Federal Reserve Bank of St. Louis
STATISTICS OF INCOME. 28
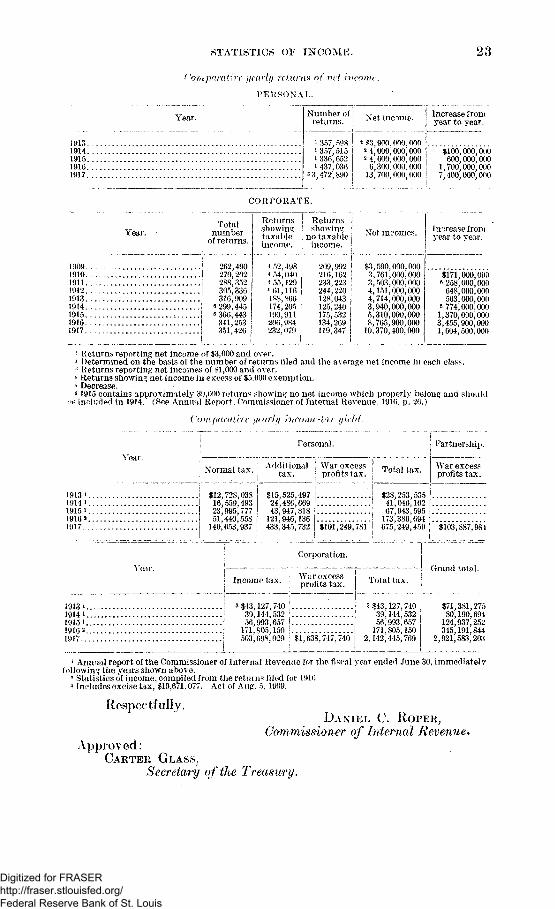
Comparative yearly return* of net income.
PERSONAL.
Year.
1913. .1914. .1915..1916..1917.
N r Z i m s ° f | Net income. I Increase fromvear to vear.
1 357,598» 357,515* 336.652U37; 036
13,472,890
*$3,900,000,000* 4,000,000; 000* 4,600,000,000
6,300,000,00013,700; 000,000
$100,000,000600,000,000
1,700,000,0007,400,000,000
CORPORATE.
Year.! Total\ numberof returns.
l
1909.1910. I1911 I1912 . . . . i1913. . i1914. i 6 299,'4451915 6 366,4431916 I 341,2531917 I 351,426
262,490270,202288,352305,336316,909
Returnsshowingtaxableincome.
Returns jshowing !
no taxable j
« 52,498 ;* 54,040 I«55,129 I< 61,116 i188,866 i174,205 ;
190,911 :206,984 1232,079 !
209,992216,162233,223244,220128,043125,240175,532134,269119,347
Net incomes.
$3,590,000,0003,761,000,0003,503,000,0004,151,000,0004,714,000.0003,940,000,0005,310,000,0008,765,900,000
10,370,400,000
'rease fromyear to year.
6
5131
5171258648563774
000,000000,000000,000000,000000,000
370,000,000455604
900,000500,000
! Returns reporting net income of 13,000 and over.2 Determined on the basis of the number of returns filed and the average net income in each class.3 Returns reporting net incomes of $1,000 and over.4 Returns showing net income in excess of $5,000 exemption.* Decrease.«1915 contains approximately 30,000 returns showing no net income which properly belong and should
l»tf included in 1914. (See Annual Report, Commissioner of Internal Revenue, 1916, p. 20.)
Coin fjaraltve yearly encoene-'uix yuld.
Personal. ! Partnership.
Vear.! Normal tax. Additional j War excess
tax. profits tax. j Total tax.
1913 i I $12,728,0381914 i j 16,559,4931915 i ! 23,995,7771 9 1 6 3 . . . . . . .1 9 1 7 . . . . . .
51,440,558140,653,937 433,345,732
$15,525,497 I.... I $28,253,53524,486,669 1 41,046,16243,947,818 |. j 67,943,595121,946,136 I 173,386,694
$101,249,781 I 675,249,450
War excessprofits tax.
$103,887,984
Vear.
1913*191411 9 1 5 ' . . . . . . .191621917
Income tax. i
Corporation.
War excessprofits tax.
!
Total tax.
3143,127,740 : i39,144,532 j !56,993,657 ! >
171,805,150 i
3 $43,127,74039,144,53256,993,657
171,805,150503',698)029 i $1,638,747,740 2,142,445,769
Grand tota l .
$71,381,27580,190,694
124,937,252345,191,844
2,921,583,203
* Annual report of the Commissioner of Internal Revenue for the fiscal year ended June 30, immediatelyfollowing the years shown above.
s Statistics of income, compiled from the returns filed for 191»>.« Includes excise tax, $10,671,077. Act of Aug. 5, 1909.
Respectfully,DANIEL O. ROPER,
Commissioner of Internal Revenue.Approved :
CAETER GLASS,Secretary of the Treasury.
Digitized for FRASER http://fraser.stlouisfed.org/ Federal Reserve Bank of St. Louis
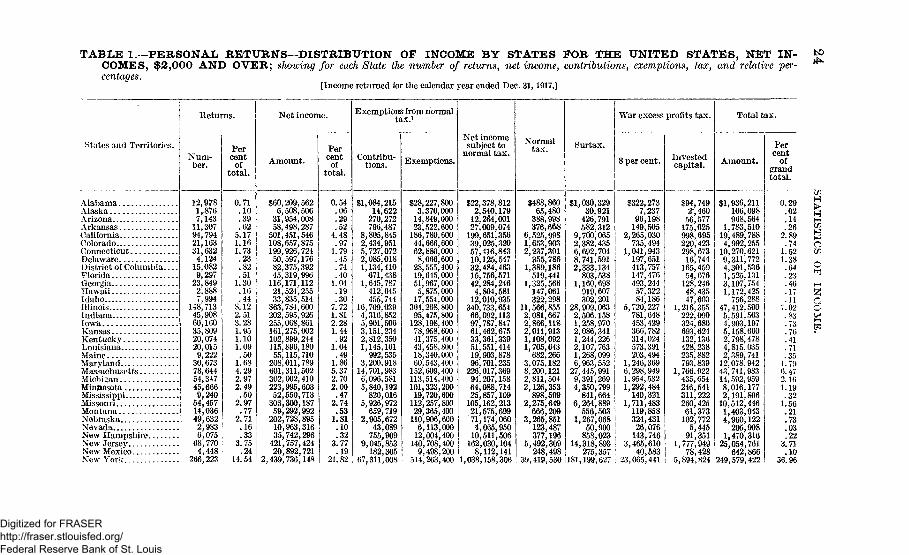
TABLE 1. -PERSONAL RETURNS—DISTRIBUTION OF INCOME BY STATES FOR THE UNITED STATES, NET IN-COMES, $2,000 AND OVER; showing for each State the number of returns, net income, contributions, exemptions, tax, and relative per-centages.
[Income returned for the calendar year ended Dec. 31,1917.]
to
Returns.
States and Territories.Num-ber.
Alabama IAlaska !ArizonaArkansas <CaliforniaColoradoConnecticutDelawareDistrict of ColumbiaFloridaGeorgiaHawaiiIdahoIllinoisIndianaIowaKansasKentuckyLouisianaMaineMarylandMassachusettsMichiganMinnesotaMississippiMissouriMontanaNebraskaNevadaNew HampshireNew JerseyNew MexicoNew York
12,9781,8767,143
11,30794,79421,16331,6324,124
15,0829,297
23,8492,8887,994
148,71345,90860,16035,80920,07420,0159,222
30,67378,64454,34745,6669,240
54,45714,03649,6322,9836,075
68,7704,448
266,223
Percentof
total.
0.71.10.39.62
5.171.161.73.23.82.51
1.30.16.44
8.122.513.281.951.101.09.50
1.684.292.972.49
.502.97.77
2.71.16.33
3.75.24
14.54
Net income.
Amount.
$60,20a^5626,508,506
31,954,00858,498,287
501,451,546108,657,875199,926,72450,597,17682,375,39245,319,996
116,171.11221,524;25533,835,514
863,784,600202,595,926255,068,861161,275,002102,899,244115,896,18055,115,710
208,011,789601,311,502302,002,410223,995,60352,550,713
306,300,18759,292,992
202,728,89510,963,31635,742,296
421,757,42420,892,721
2,439,736,148
Percentof
total.
0.54.06.29.52
4.48.97
1.79.45.74.40
1,04.19.30
7.721.812.281.44
.921.04
.491.865.372.702.00
.472.74
.531.81
.10
.323.77
.1921.82
Exemptions from normaltax.i
Contribu-tions.
$1,084,21514,622
270,272796,487
8,805,8452,434,9515,727,0722,085,0181,134,410
671,4381,645,787
412,645455,744
16,709,0394,316,8525,901,5063,151,2342,812,3501,145,161
992,5353,200,918
14,701,9836,096,5815,840,192
820,0165,926,972
659,7192,905,672
43,089755,909
9,045,853182,305
67,311,008
Exemptions.
$28,227,8003,370,000
14,849,00023,522,600
186,780,60044,666,60062,880,0008,066,600
28,555,40019,645,00051,967,0005,875,000
17,554,000304,268,80095,475,800
128,198,40078,958,60041,375,40043,458,80018,340,00060,543,400
152,609,400113,514,400101,323,20019,720,600
112,257,80029,365,400
110,906,6006,113,000
12,004,400140,708,400
9,498,200514,263,400
Net incomesubject to
normal tax.
$22,378,8122,540,179
12,264,00127,009,074
199,651,35639,025,32057,416,84310,125,54732,484,46315,756,57142,284,2464,804,581
12,010,935340,733,65466,092,11397,787,84761,462,67533,361,33951,551,41419,903,87896,701,235
226,017,36994,207,15864,088,71425,857,109
105,162,21321,575,69971,174,0604,065,950
10,511,506162,030,104
8,112,1411,038,158,306
Normaltax.
$488,86065,480
388,998376,66-8
6,525,9981,653,9032,237,301
355,7861,389,186
519,4411,325,566
147,061322,298
11,566,8552,081,6672,866,1182,011,9131,108,0921,705,643
682,2663,075,1828,200,1212,811,5042,126,353
898,5992,275,649
666,2093,265,851
123,487377,196
5.492,309"248,498
39,419,530
Surtax.
$1,030,32930,921
426,791582,312
9,700,0652,382,4356,692,7048,741,5912,333,134
803,5381,160,698
919,607302,201
28,909,0632,506.1581,258,9702,086,3411,244,2262,107,7631,268,0996,963,552
27,445,9919,391,2694,350,799
841,6646,264,889
556,5031,267,068
50,900858,023
14,318,893275,357
181,199,627
War excess profits tax.
8 per cent.
$322,2737,237
96,198149,505
2,265,030735,494
1,041,943197,651413,757147,476493,24457,32284,186
5,720,227781,648453,429366,782314,024573,391203,494
1,246,3696,298,9491,954,5321,292,484
140,3211,711,483
119,858324,43126,076
143,7463,465,610
40,58323,065,441
Investedcapital.
$94,7492', 460
56,577175,025998,6^95220,423298,67316,744
165,45954,676
128,24648,43547,603
1,216,355222,090324,680693,624132,136428,238235,882793,839
1,766,922435,654246,541311,222260,42561,373
102,7725,445
91,3511,777,949
78,4285,894,824
Total tax.
Amount.
$1,936,211106,098968,564
1,783,51019,489,7884,992,255
10,270,6219,311,7724,301,5361,525,1313,107,7541,172,425
756,28847,412,5005,591,5634,903,1975,158,6602,798,4784,815,0352,389,741
12,078,94243,711,98314,592,9598,016,1772,191,806
10,512,4461,403,9434,960,122
205,9081,470,316
25,054,761642,866
249,579,422
Percent
ofgrandtotal.
0.29.02.14.26
2.89.74
1.521.38
.64
.23
.46
.17-11
7.02.83.76.76.41.71.35
1. 796.472.161.19
.321.56.21.73.03.22
3.71.10
36.96
wH>
QZli
C
o
Digitized for FRASER http://fraser.stlouisfed.org/ Federal Reserve Bank of St. Louis
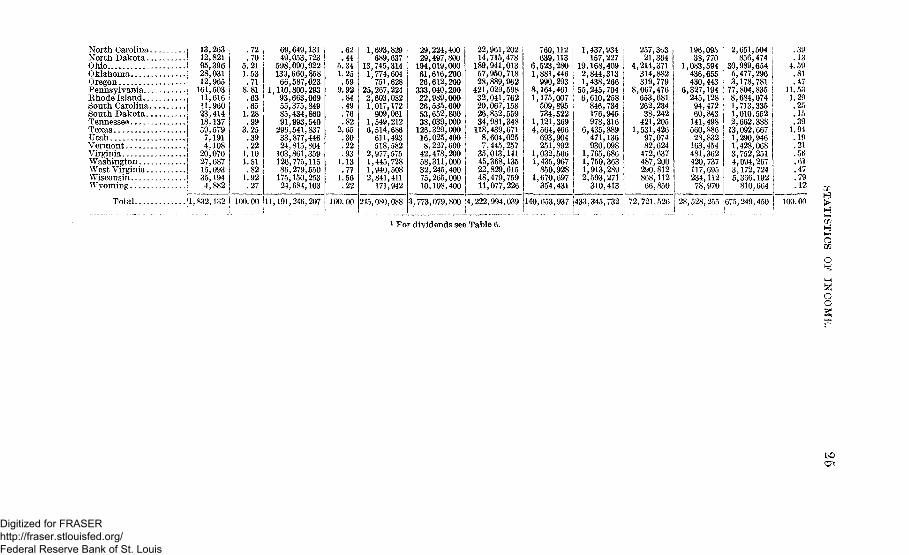
North Carolina.North DakotaOhioOklahomaOregonPennsylvaniaRhode IslandSouth CarolinaSouth DakotaTennesseeTexasUtahVermontVirginiaWashingtonWest VirginiaWisconsinWyoming
Total.
13,26312,82195,39628,03112,965
161,50311,61611,96023,41418,13759,5797,1914,108
20,07027,68715,09335,1944,882 j
. -1.K32,132 !
. 72
.705.211.53.71
8.81.63.651.28.99
3.25.39.221.101.51
1
.82 !1.92.27
100.00 11
69,649,13149,053,723
598,090,922139,660,85866,587,023
,110,800,29393,663,06955,375,84985,434,86091,993,540
298,541,83733,877,44624,815,804103,861,359126,775,11586,279,550175,150,25324,684,103
,191,246,207
1,693,829689,637
13,745,3141,774,604
751,62825,267,2242,603,0821,017,172
909,0611,549,2126,514,686
611,493518,582
2,977,5751,445,7281,940,5082,841,411
171,942
29,224,40029,497,800
194,019,00061,616,20026,612,200
333,040,20022,989,00026,535,60053,652,80038,039,000
126,329,00016,025,4008,227,600
42,478,20058,311,00032,245,40075,265,00010,108,400
22,961,20214,715,478
189,941,01357,950,71828,889,962
421,029,59832,041,76220,067,15826,852,55934,981,348
118,439,6718,604,0257,445,257
35,013,14145,368,13522,829,61548,479,75911,077,226
760.112639.113
6,523,2801,881,446
990,2938,164,4611,175,007
509,895734,522
1,121,3694,564,466
693,904251,892
1,032,5661,435,967
850,9281,670,697
354,431
100.00 245,080,088 3,773,079,800 14,222,994,039 140,653,937 433,345,732 | 72,721,526
1,437,934157,227
19,168,4092,844,3131,438,266
55,245,7046,610,258
846,734176,945978,316
6,435,889471,136930,098
1,765,6861,750,3631,913,2892.593,271
310,413
257,36321,364
4,214,371314,882319,779
8,067,476653,681262,23438,242
421,2051,531,426
97,07482,624
472,637487,200290,812868,11266,850
196,09538,770
1,083,594436,655430,443
6,327,194245,12894,47260,843
141,498560,88628,832
163,454481,362420,737117,695234,11278,970
2,651,504856,474
30,989,6545,477,2963,178,78177,804,8358,684,0741,713,3351,010,5522,662,38813,092,6671,290,9461,428,0683,752,2514,094,2673,172,7245,366,192810,664
.39
.134.59.81. 47
11.531.29.25.15.391.94.19.21.56.61.47.79.12
28,528,255 1675,249,450
1 For dividends see Table 6.
100.00
oo
o
Digitized for FRASER http://fraser.stlouisfed.org/ Federal Reserve Bank of St. Louis
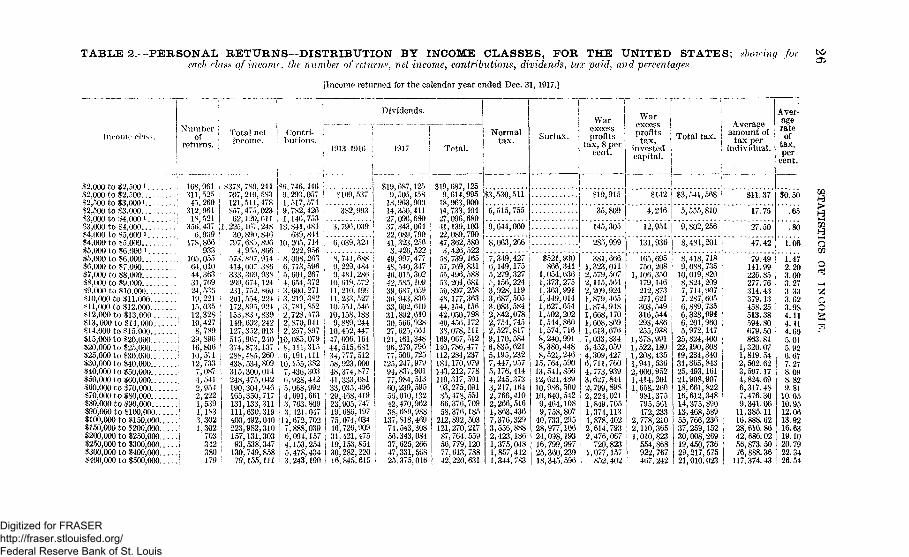
TABLE 2. PERSONAL RETURNS-DISTRIBUTION BY INCOME CLASSES, FOR THE UNITED STATES; showing foreach class of income, the number of returns, vet income, contributions, dividends, tax paid, and percentages.
[Income returned i'or the calendar year ended Dec. 31,1917.]
Income class.
S2.000 to $2,500 !
$2,000 to $2.-500$2,500 to S3,0001$2,500 to $3.000$3,000 to 84,000 l
$3,000 to $4,00054,000 to $5,000 J
$4,000 to .55,000§5,000 to $6,000 i$5,000 to $6,000$6,000 to 87,00017,000 to $8,00088,000 to $9,000$9,000 to $10,000... -$10,000 to $11.000....S 11,000 to 312,000....$12,000 to $13,000 . . .$13,000 to 814,000...$14,000 to $15,000....$15,000 to $20,000 . .$20,000 to $25,000....125,000 to $30,000 .$30,000 to $40,000. . .$40,000 to 350,000. . .$50,000 to 160,000 . .$60,000 to $70,000. . .$70,000 to $80,000 . .$80,000 to $90,000.. .$90,000 to $100,000...•$100,000 to $150,000$150,000 to $200,000..$200,000 to $250,000..$250,000 to $300,000..$300,000 to $400,000..$400,000 to $500,000..
Number \of |
returns, j
168,961311.52545,260 I
312,961 IIS,521 !
356,437 •.6,939 !
17S,866 |933 j
105,055 '64,010 ;44,363 :
31,769 i24,536 ;
19,221 !15,035 !12,32810,4278,789
29,89616,806 !10,571 j12,733 j7,087 I4,541 !2,9542,2221,5391,1833,3021,302
703342380179
Total netincome.
-378,780,244707,210,583121,511,478857,475,02362,120'. fill
,225,lf>7',24S30.890,846
797', 685,8964,955,866
573,807,914414,007.386333,309,938269,674.124231, 752', 860201,554, 224172,895,924153,83), 839140,692,242127.352,013515,967,240374,873,137288,485,260438,534,809315.300,014248,475,042190,304,946165,350,717131,133,311111,630,319400,492,040223,982,310157,131,30393,538,347130,749,85879,155, 111
Contri-butions.
$6,746.4469,293,0571,517,5749,782,4261,146,753
18.841,481' 639,841
10.205,714222,956
8,008,2636,773,596
i 5,601,267• 4,654,372i 3,(500,271j 3,219,382; 3,781,852i 2,728,473j 2,870,941! 2,257,897'10,085,079I 8,444,315| 6,191,111jlO,155,382
7,436,3036,928,4125,068,9924,691,661
i 3, 763,809! 3,421.047il4,672,7021 7,888,039
6,094,1574,153,2545,478,4343,243,190
1913 1916
S109,537
"""382,993 j
3,796,039 |
"6," 039," 324 "|
9^229', 484 j9,481,286 |10,619.572 i11', 210.199 'li;233,52710,551,54610,158,1889,889,24410,452,44747,606,16444,515,68134,777,51258,923,00048,374,87741,333,08133,035,49629,468,41923,905,74719,686,19775,074,03446,726,90931,421,47519,153,85430,282,22016,845,615
Dividends.
1917
819,687,1259,505,458
18,963,90014,350,41127,096,680 ,37.343,064 !22'089; 790 l
41,323,2563,426,522
49,997,4774S, 540,34746,015,30242, Mo, 10939,687,05936,943,83633,602,61031,892,61030,566,92827.625,664
121,461,34896,270,79677,506,725
125,247,97994,837,90177,984,51360,239,59556,010,13242,470,96238,689,988
137,818,46974,543,30856,343,08437, 625,26647,331,56825,375,016
Total.
Normaltax.
$19,687,1259,614,995
18,963,90014,733,40427,096,68041,139,103
|$3,530,511
5,515,755
3,426,52258,739,16557,769,83155,496,58853.204,68150,897,25848,177,36344.154,15642,050,79840,456,17238,078,111
169,067,512140,786,477112,284,237184,170,979143,212,778119,317,59493,275,09185,478,55166,376,70958,376,185
212,892,503121,270,21787,764. 55956,779,12077,613,78842,220,631
Warexcessprofits
tax, 8 percent.
9,644,000
' 8," 063," 2661
7,349,4276,149,1755,279,327.-; 156,2243,928,1193,687,505
j 3.083,584I 2,842,078| 2,754,745
2,527,8179,170,5846,835,6215,195,2327,447,9575,176,4144,245,3733y217,1642,766,4102,266,5161,863,4367,376,3293,556,8882,423,1861,375,0481,857,4121,344,783
$521,930866,341
1.054,636I', 373,2751.363,991i; 449,0141,627,6541,502,2021,544,8601,574, 716S,240,9918,380,4488,521,246
15,764,59013,541,85612,621,48910,986,50010,640,5429,464,1089,758,807
40,733,29528,977,10624,098,19316,799,99725,360,23918,345,596
Warexcessprofits
tax,investedcapital.
Total tax.i AverageI amount ofI tax peri individual.
810,915 8142
35,809 I 4,246
381.6661,323,0112,579,5072,115,5642,209,9241, 879,4651,874,9481,668,1701,608,8691,613,6767,033,8345,452,0594,309,4276,711,7604,773,9393,627,8442,799,8982,224,0211,849,7051,374,1134,878,4022,614,7932,476,067
I 720,823i 1,077,157j 852,402
S3,541,568 I SI 1.37
5,555,810 j 17.75
145,305 j 12,951 9,802,256 , 27.50
"285*999" ""l3i.'936* *"8*48i,*26i1 47.*42
165,695750,208
1,106,350179,146212,873271,621303,549316,544293,486255,938
1,378,9911,522,1801,208,4351,941,5362,000,9521,414,2011,658,260
981,375, 795,561
472,233I 2,778,210j 2,110,365I 1,010,823
554,868922,767467,242
8,418,718 !9,088,735 !
10,019,820 !8,824,209 j7,714,907 !7,287,605 !6,889; 735 j6,328,994 j6,201,960 !5,972,147 j
25,824,400 i22,190,308 j19,234,34031,865,84325,493,16121,908,90718,661,82216,612,34814,375,89013,468,58955,766,23637,259,15230,008,26919,450,73629,217,57521,010,023
79.49141.99226.85277.76314.43379.13458.25513.38594.80679.50863.81
1,320.071,819. 542,502. 623,597.174,824.696,317.487,476.309,341.06
11,385.1116,888.6228,616. 8642,686.0256,873.5076,888.36
117,374.43
Aver-agerateof
tax,per
cent.
$0.50
.65
.80
'i*06
1.472.203.003.273.333.023.984.114.414.695.015.926.677.278.098.829.81
10.0510.9512.0613.9216.6319.1020.79
i 22.34! 26.54
I1O
w
Digitized for FRASER http://fraser.stlouisfed.org/ Federal Reserve Bank of St. Louis
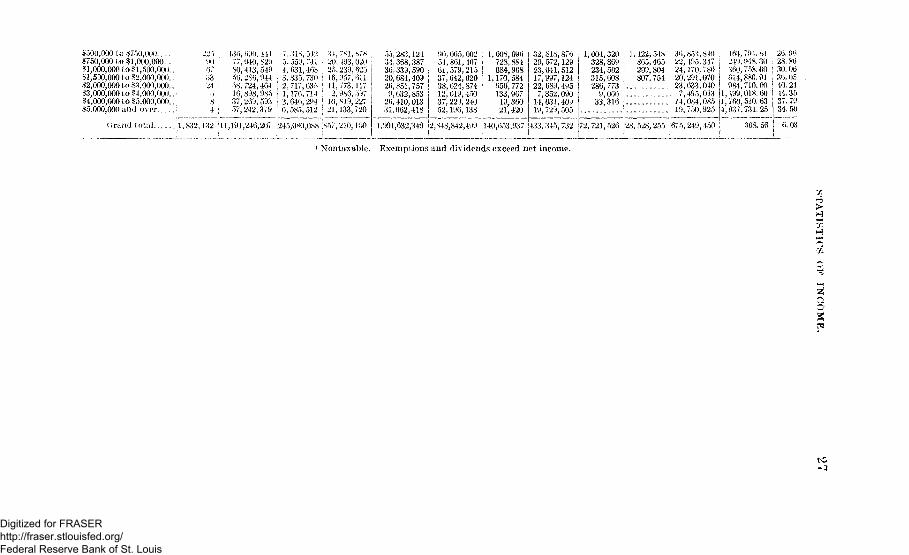
$500,000 to •'5750,000. - - -£750,000 to $1,000,000....$1,000,000 to $1,500,000..§1,530,000 to $2,000,000...?2,000,000 to 83,000,000..$3,000,000 to 14,000,000.. ^$4,000,000 to $5,000,000.. |$5,000,000 and over ;
Grand total jl,832,132 |l 1,191,246,207 1245,080,0*8 |857,2l0,150
25M)67332458i
136,77,80,
so;58,16,37,57,
690,940,413,
141829549
286,944 i724,898,269,242,
464 ;985 i593 j379 !
5,4,3,2,1,3.6,
:;ts,559,631,835.717,176,646,585,
542741 i468 1730 j635 |714 :294 l
512 !
34.202516,11,2
10,'21,
i 81
493239957773986
8 / 8020625611117597
S19,227133,720
•>5 2&312434! 368' 38736,33920,68426,851,9,632,
26; 410,31,062,
590409757853013418
90,065, 00254,861,40761,579,21537,642,02038,624,87412,619,45037.229, 24052,196,138
1,608,096728,884684,968
1,170,584658,772133,96719,36021,420
32,818,S7620, 572,12923,041,51217,997,12422,689,4957,352,09014,031,40919,729,505
1,991,632,349 ]2,848,842,499 140,653,937 433,345,732
1,004,320 j328,869 j234,502 !315,608 i286,773 |9,066 !
33,316 I
422,548865,465209,804807,754
8o t, 810195,347170, 786291,070633; 040495,093084,085750,925
1,1,4,
163249360614984499760937
'2,721,526 28,528,255 675, 249,450
791. 84948.3075$. 00880.91710.00018. 60510. 63731. 25
368. 56
26. Oii28. 8630.0636.0540. 2444.3537.7934. 50
6. 03
1 Nontaxable. Exemptions and dividends exceed net income.
x>>
Digitized for FRASER http://fraser.stlouisfed.org/ Federal Reserve Bank of St. Louis
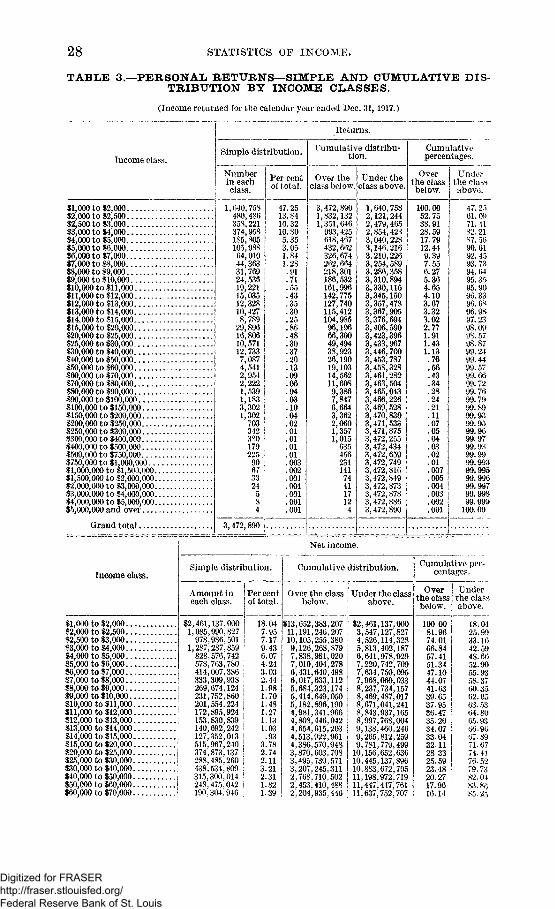
28 STATISTICS OF INCOME.
TABLE 3.—PERSONAL RETURNS—SIMPLE AND CUMULATIVE DISTRIBUTION BY INCOME CLASSES.
(Income returned for the calendar year ended Dec. 31, 1917.)
Income class.
Returns.
Simple distribution.
Numberin eachclass.
$1,000 to $2,000$2,000 to $2,500$2,500 to $3,000$3,000 to $4,000$4,000 to $5,000$5,000 to $6,000$6,000 to $7,000$7,000 to $8,000$8,000 to $9,000$9,000 to $10,000$10,000 to $11,000$11,000 to $12,000$12,000 to $13,000$13,000 to $14,000$14,000 to $15,000$15,000 to 120,000$20,000 to $25,000$25,000 to $30,000$30,000 to $40,000$40,000 to $50,000$50,000 to $60,000$60,000 to $70,000$70,000 to $80,000$80,000 to $90,000$90,000 to $100,000$100,000 to $150,000$150,000 to $200,000$200,000 to $250,000$250,000 to $300,000$300,000 to $400,000$400,000 to $500 000$500,000 to $750,000$750,000 to $1,000,000...$1,000,000 to $1,500,000..$1,500,000 to $2,000,000..$2,000,000 to $3,000,000..$3,000,000 to $4,000,000..$4,000,000 to $5,000,000..$5,000,000 and over
Grand total 3,472,890
1,640,758480,486358,221374,958185,805105,98864,01044,36331,76924,53619,22115,03512,32810,4278,789
29,89616,80610,57112,7337,0874,5412,9542,2221,5391,1833,3021,302
70334238017922590673324
5 I8 |4 I
Per centof total.
47.2513.8410.3210.805.353.051.841.23.91.71.55.43.35.30.25.86.48.30.37.20.13.09.06.04.03.10.04.02.01.01.01.01.003.002.001.001.001.001.001
Cumulative distribu-tion.
Over theclass below.
Under theclass above.
3,472,8901,832,1321,351,646
993,425618,467432,662326,674262,664218,301186,532161,996142,775127,740115,412104,98596,19666,30049,49438,92326,19019,10314,56211,6089,3867,8476,6643,3622,0601,3571,015
635456231141744117124
1,640,7582,121,2442,479,4652,854,4233,040,2283,146,2163.210,2263,254,5893.286,3583,310,8943,330,1153,345,1503,357,4783,367,9053,376,6943,406,5903,423,3963,433,9673,446,7003,453,7873,458,3283,461,2823,463,5043,465,0433,466,2263,469,5283,470,8303,471,5333,471,8753,472,2553,472,4343,472,6593,472,7493,472,8163,472,8493,472,8733,472,8783,472,8863,472,890
Cumulativepercentages.
Overthe classbelow.
100.0052.7538.9128.5917.7912.449.397.556.275.364.654.103.673.323.022.771.911.431.13.76.56.43.34.28.24.21.11.07.05.04.03.02.01.007.005.004.003.002.001
Underthe classabove.
47.2561.0971. 4182.21S7.5G90.6192.4593.7394. 6495.3595.9096.3396. 6S96.9^97.2398.0998.5798.8799.2499.4499.5799.6699.7299.7699.7999.8999.9399.9599.9699.9799.9H99.9999.99399.99599.99699.99799.99899.999
100.00
Income class.
$1,000 to $2,000...$2,000 to $2,500...$2,500 to $3,000...$3,000 to $4,000...$4,000 to $5,000...$5,000 to $6,000...$6,000 to $7,000...$7,000 to $8,000...$8,000 to $9,000...$9,000 to $10,000..$10,000 to $11,000.$11,000 to $12,000.$12,000 to $13,000.$13,000 to $14,000.$14,000 to $15,000.$15,000 to $20,000.$20,000 to $25,000.$25,000 to $30,000.$30,000 to $40,000.$40,000 to $50,000.$50,000 to $60,000.$60,000 to $70,000.
Net income.
Simple distribution.
Amount in 1 Per centeach class, j of total.
$2,461,137,0001,085,990,827
978,986,501 i1,287,287,859 !
828,576,742 '578,763,780 !414,007.386 i333,309,938269,674,124231,752,860201,554,224172,895,924153,830,839140,692,242127,352,013515,967,240374,873,137288,485,260438,534,809315,300,014248,475,042190.304.946
Cumulative distribution.
Over the class j Under the classbelow. ! above.
113,65211,19110,1059,1267,8387,0100,4316,017,5,6845,4145,1824,9814,8084,654,4,513,4,386,3,870,3,495,3,207,2,768,2,453,2,204,
,383,207246,207255,380268,879981,020404,278640,498633,112323,174649,050896,190341,966446,042615,203922,961570,948603,708730,571245,311710,502410,488935.446
$2,461,137,0003,547,127,8274,526,114,3285,813,402,1876,641,978,9297,220,742,7097,634,750,0957,968,060,0338,237,734,1578,469,487,0178,671,041,2418,843,937,1658,997,768,0049,138,460,2469,265,812,2599,781,779,499
10,156,652,63610,445,137,89610,883,672,70511,198,972,71911,447,447,76111,637,752,707
Cumulative per-centages.
Overthe classbelow.
100.0081.9674.0166.8457.4151.3447.1044.0741.6339.6537.9536.4735.2034.0733.0432.1128.3325.5923.4820.2717.9616.14
Underthe classabove.
18.0425.9933.1642.5948.6052.9055.9358.3700.3502.0563.5304.8005.9306.9007.8971.0774.4176.5279.7382.04-83.8p>85.25
Digitized for FRASER http://fraser.stlouisfed.org/ Federal Reserve Bank of St. Louis
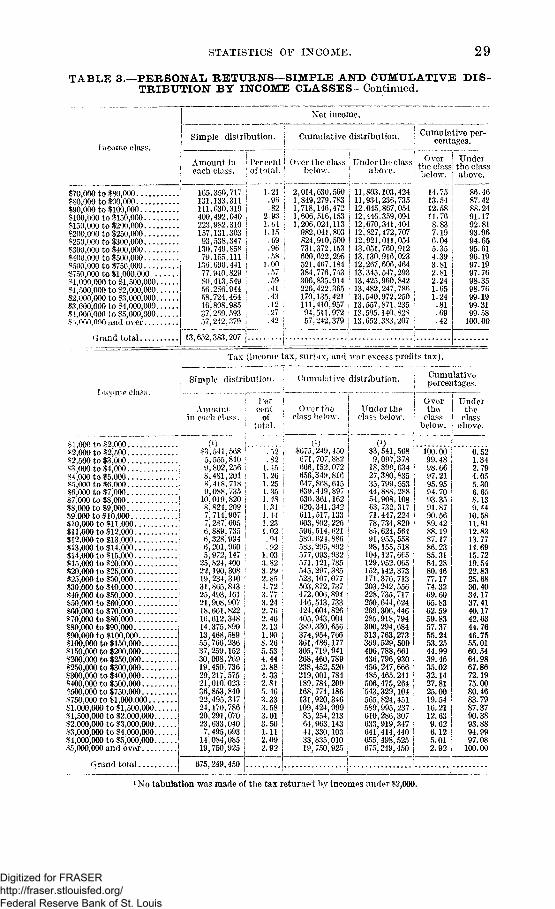
STATISTICS OF INCOME. 29
TABLE 3.™PE&SONAL RETURNS—SIMPLE AND CUMULATIVE DIS-TRIBUTION BY INCOME CLASSES—Continued.
[neome class.
Net income.
Simple distribution, j Cumulative distribution. C u™u t*je|p e r~
i . IAmount in | Percent I Over the class \ Under the class Ieach class. | of total.! below. • above. I
170,000 to $80,000.$80,000 to $90,000$90,000 to $100,0008100,000 to $150,0008150,000 to $200,000$200,000 to $250,000$250,000 to $300,000S300,000 to $400,000$400,000 to 1500,0008500,000 to $750,000§750,000 to $1,000,000SI,000.000 to $1,500,000$1,500,000 to $2,000,000$2,000,000 to $3,000,000$3,000,000 to $4,000,000$4,000,000 to $5,000,0008.V.OOO.O00 and over |
165.13li111,400,223;157.
93!130:
79!136,
77,805658,io:37,
350,717133,311630,319492,040982.310131,303538,347749,858155,111690,441940,829413,549286,944724,464898,985269,593242,379
1.21 1.96 |.82 !
2.93 i1.64 I1.15 '•
.69 !
.96 I
.58 ;1.00 !
.57 !
.59 i• 41 1.43 !.12 I
2,0141,8491,718,1,606'1,206.
982:824731600521384306,226,170!I l l ,
94,57.
,630,500,279,783146,472
,516,153024,113041,803
,910,500372,153,622,295467,184776,743835,914422.365135,421410,957511,972242,379
11,803,103,11,934,23612,045,867,12,446,359:12,670,34112,827,47212,921,011;13,051,760.13,130,916;12,267,606,13,345,547,13,425,""13,482,247,13,540,972,13,557,871,13,595,140,13,652.383,
424 I735 !054 I094 !404 l
707054 •912 ;023 i464 '•293 i842 !786 i250 ;235 :
828207
14.7513-5412.5811.768-837.196.045.354.393.812.81 !2.24 I1.65 I1.24.81.69.42
< J rand total 13,652,383,207 j
86.4687.4288.2491.1792.8193.9694.6595.6196.1997.1997.7698.3598.7699.1999.3199.58
100.00
Tax (income tax, surtax, and war excess profits tax).
Simple distribution. (•uimilutive distribution.e, class.
61,000 to $2,00012,000 to $2,500•12,500 to $3,00083,000 to $4,000S4,000 to $5,000$5,000 to $6,000•16,000 to $7,000$7,000 to $8,000$8,000 to $9,00039,000 to $10,000$10,000 to $11,000$11,000 to $12,000$12,000 to $13,000$13,000 to $14,000114,000 to $15,000$15,000 to $20,000820,000 to 125,000325,000 to 830,000830,000 to $40,000$40,000 to $50,000§50,000 to $60,000$60,000 to $70,000$70,000 to $80,000880,000 to $90,000$90,000 to $100.000$100,000 to $150,000$150,000 to $200,000$200,000 to $250,0008250,000 to $300,000§300,000 to $400,0008400,000 to 8500,000$500,000 to $750,0008750,000 to $1,000,000$1,000,000 to $1,500,000$1,500,000 to $2,000,000$2,000,000 to $3,000,000§3,000,000 to $4,000,000$4,000,000 to $5,000,00085,000,000 and over
Cumulativepercentages.
Amountin each class.
Percent
oftotal.
Over theclass below.
0) |.$3,541,568 !
5,555^810 !9,802,256 I8,481,201 jS,418;718 j9,088,735
10,019,820 (8,824,209 I7,714,907 !7,287,605 i6,889,735 !6,328,994 |6,201,960 !5,972,147 I
25,824,400 j22,190,308 i19,234,340 !31,865,843 !25,493,161 j21,908,907 i18,661,822 j16,612,34814,375,890 I13;468,589 I55,766,236 j37,259,15230,008,269 j19,450,736 I29,217,575 i21,010.023 j36,853,840 j22,495,347 j24,170,786 i20,291,070 i23,633,040 |7,495,093 I
14,084,085 i19,750.925 j
.52 j
.82 s1.45 i1.26 !1.25 !1.35 I1.48 i1.31 !1.14 I1.23 i1.02 ;.94 :
.92 i1.03 I3.82 13.292.85 I4.72 •3.77 i3.24 I2.76 j2. 46 !2.13 I1.99 I8.26 !5.53 j4.44 i2.88 i4.33 i2. SI I5.46 i3.33 I3.58 i3 . 0 1 ;3.50 !1.11 I2.092.92
Grand total. 675,249,450
0)$075,249,
671,707,666,152,656,349,647,868,639,449,630,361;620,341,611,517,603,802,596,514,589,624,583,295,577,093,571,121;545,297,523,10"503,872,472,006,446,513.424,604,405.943,389,330,374,954,361,486,305,719,268,460,238,452,219,001,189,784,168,774,131,920,109,424,85,254,64,963,41,330,33,835,19, 750,
450882072S16615897 i162 I342133 !226 !621886892 '932 I785 !385 I077'37 !
894 !733 ;826004656766177941789 !520 i784 I209 !186 I346 !999 ;213 I143 I103 i010 ;925 !
Under theclass below.
$3,541,5689,097,378
18,899,63427,380,83535,799,55344,888,28854,908,10863;732,31771,447,22478,734,8298T>, 624,56491,955,55898,155,518
104,127,665129,952,065152,142,373171,376,713 ,203,242,556228,735,717250,644,624269,306,446 i285,918,794 |300,294,684313,763,273369,529,509406,788,661436,796,930456,247,666485,465.241506,475,264543,329,104 |565,824,451 i589,995,237 j610,286,307 I(533,919,347 j641,414,440 !655,498,525 I675,249,450 i
Overthe
classbelow.
100.0099.4898.6697.2195.9594.7093.3591.8790.5689.4288.1987.1786.2385.3184.2880.4677.1774.3269.6065.8362.5959.8357.3755.2453.2544.9939.4635.0232.1427.8125.00 I19.54 !16.21 j12.639.626.12 !5.012.92
Underthe
classabove.
0.521.342.794.055.306.658.139.44
10.5811.8112.8313.7714.6915.7219.5422.8325.6830.4034.1737.4140.1742.6344.7646.7555.0160.5464.9867.8672.1975.0080.4683.7987.3790.3893.8894.9997.08
100.00
1 No tabulation was made of the tax returned by incomes tinder $2,000.
Digitized for FRASER http://fraser.stlouisfed.org/ Federal Reserve Bank of St. Louis

TABLE 4. -PERSONAL RETURNS— SEX AND FAMILY RELATIONSHIP-DISTRIBUTION BY STATES FOR THEUNITED STATES—NET INCOMES $2,000 AND OVER.
[Income returned for the calendar year ended Dec. 31, 1917.]
Co
States and Territories.
Alabama..AlaskaArizona...Arkansas..California.Colorado.ConnecticutDelawareDistrict of Columbia.FloridaGeorgiaHawaiiIdahoIllinoisIndianaIowaKansasKentuckyLouisianaMaineMarylandMassachusettsMichiganMinnesotaMississippiMissouriMontanaNebraskaNevadaNew HampshireNew JerseyNew Mexico
Joint returns of husbandsand wives, with or with-out dependent children,including husbandswhose wives though liv-ing witb them, filed sep-arate returns.
Numberreturns.
10,7831,1415,6259,293
72,53617,45223,7583,153
10,8237,618
19,6512,1476,695
119,39338,97550,52230,06115,84515,8627,116
22,26857,94245,27638,7147,355
44,19511,27342,1872,2814,630
54,7443,590
Netincome.
Number jreturns. I
349,530,1674,158,834
25,310,677 i48,294,652 |
372,113,051 !88,061,513 !
137,943,013 !39,790,130 |53,654,182 i36,618,975 |95,587,692 |14,327,331 i28,216,662 I
666,375,814 !169,197,943 |215,030,691 i135,048,739 I80,804,415 '89,629,71340,520,401
140,547,563417,912,763245,166,477183,639,83842,484,372
238,308,30547,821,047
171,745,1388,591,430
25,993,338321,445,967
17,110,328
47961
349353
3,735720
1,275162690383S7492
2155,6901,5281,9531,165 .
86S I871349 '
1,4473,1481,9751,713
3722,113
4971,541
133 I224 i
2,868 1171
men—Allothe;
Netincome.
Number ireturns. {
Netincome.
Number jreturns. !
82,569,701233,711
1,697,6611,787,218
18,913,6923,500.8550,301,411
977,3333,097,2382,113,3914,010,749 j
356,243864,225 ;
29,468,426 !
6,991,779 •;8,505,119 ;
4,953,880 14,177,174 !5,033,152 |1,812,217 ;8,512,242 i
20,667,409 j10,100,088 !7,303,820 ''1,893,413 i
11,236,718 j1,869,658 !6,576,440 !
466,0441,165,401 '
15,934,386 \696,423
1351143
1292,063
265505
S333S1373534276
1,901426014369301364106547
1,1815405031245601035173476
1,01150
8664,429 !31,551 i
219,572 j637,142 I
10,848,059 !
1,423,1033,658,1101,114,5922,047,642
675,6061,711,174
389,251347,289
12,901,2541,789,8942,691,7081,884,9801,751,2582,431,2291,155,0653,940,5649,259,2723,095,4202,151,251
653,0793,815,487
482,8962,012,350
119,331489,530
6,597,817266,975
1,265 j651
1,031 I1,262
11,306 ;2,110 !3,491
4461,941
8642,299
414921
15,8733,7035,5273,4572,1992,290
9614,6398,9334,7973,6841,0655,6491,9594,594
497642
6,461569
Netincome.
So,769,8481,923,5974,189,9976f229,88o
00,778,13010,881,97724,488,6263,335,522
11,136,2394,223,933
10,195,8803,762,7803,964,300
103,169,24517,225,34120,909,08615,282,77510,643,68413,736,8576,174,288
40,432,87377,590,77827,658,09820,988,4465,246,996
31,409,7777,996,453
18,481.4401,630,8673,869,053
42,291,1902,452,694
O
Digitized for FRASER http://fraser.stlouisfed.org/ Federal Reserve Bank of St. Louis
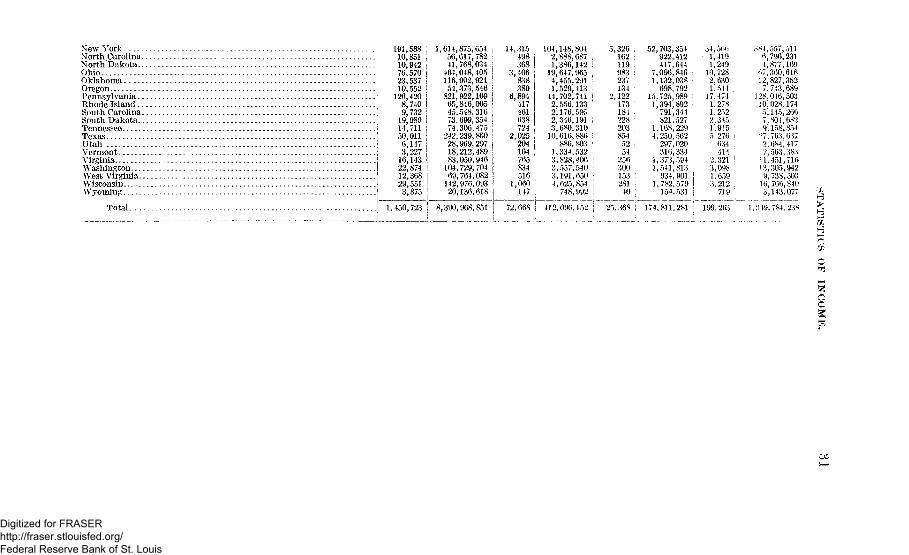
New YorkNorth CarolinaNorth DakotaOhioOklahomaOregonPennsylvaniaRhode IslandSouth CarolinaSouth DakotaTennesseeTexasUtahVermont ,VirginiaWashingtonWest VirginiaWisconsin...Wyoming
191,588 i10,851 I10,942 176,570 j23,537 !10,552 i
126,420 I8,740 I9,732 ;
19,980 !14,711 j50,011 '6,147 !3,227
16,143 !22,874 i12,36829,551 !3,875
Total ! 1,450,723 8,390,968,851
1,614,875,65456,617,78241,768,034
464,048,405116,902,92154,373,546821,922,10965,846,00545,548,31673,699,35474,306,475
242,239,86028,969,29718,212,48983,050.946104, 729,70469,764,082142,976,09320,136,618
14,
3,
(3
2,
1,
72,
315498368406838380894417461638724025204164765834516060147
668
104,148,8042,888,687 •1,386,142 !
19,647,9654,455,291 i1,529,413 ,44,702,741 i2,556,1332,176,5952,346,191 i3,680,31010,616,886 i
886,803 :1,334,5323,828,406 I3,557,540 i3,191,650 i4,625,854 !
748,992 |
412,096,152
5,326162119983237134
2,122173184 .2282038545254 :
256 i300153 !281 j40 ;
25,368 I
52,703,354922,412417,644
7,096,8461,132,038
698,79215,725,9891,394,892
791,344821,527
1,168,2294,250,562
297,020316,334
1,373,5941,541,813
934,9011,782,579
154,531
174,811,281
34,5»M>1,4191,249
10.72S2,6301,54417,4741,27*1.2522.3151.9I55. 2766:11111
2.321'J.U9S1,6593.25 2719
199.263
3M,557,6,796,4,877,
07,360,12,827,7,743,
128,046,10,028,5,145,7.804,9', 158,27,7632.6S4,2,56311,45113', 3059,73816,7663,143
1.349,784
51123116961635268950317426668285463741738S716942503840077
23S
c
Digitized for FRASER http://fraser.stlouisfed.org/ Federal Reserve Bank of St. Louis

TABLE 4. -PERSONAL RETURNS—SEX AND FAMILY RELATIONSHIP DISTRIBUTION BY STATES FOR THEUNITED STATES—NET INCOMES $2,000 AND OVER—Continued.
[Income returned for the calendar year ended Dec. 31,1917.)
Goto
States and Territories.
Alabama..AlaskaArizona....Arkansas..California..Colorado..ConnecticutDelawareDistrict of Columbia..FloridaGeorgiaHawaiiIdahoIllinoisIndianaIowaKansasKentuckyLouisianaMaine.MarylandMassachusetts..MichiganMinnesotaMississippiMissouriMontanaNebraskaNevada.New Hampshire..New JerseyNew MexicoNew YorkNorth Carolina...North Dakota.. . .Ohio
Single women—Allother.
Wives making separate>returns from husbands.;
Numberof
returns.
24G9
71225
4,187459
2,05420399922652113273
4,5701,0341 ,12S I
651 i667511550
1,3945,4431,385
788229
1,46117166434
3952,831
5114,366
259117
2,830
Net income.• Numberi of |! returns. !
Net income.; Total num-|! ber of re- j• turns. ;
$1,283,127 I21,746 I
299,592 i1,201,400
28,003,8872,609,990
19,724,632 ,3,225,7298,565,103 |1,122,563 !2,770,557 i1,802,767 1
343,27334,410,5625,460,0845,008,6693,222,6303,833,2093,994,9623,905,391
10,634,77447,977,05610,582,1595,481,1551,534,021
13,688,937897,033
2,965,076139,285
3,221,04923,002,585
283,406170,325,303
1,387,247445,363
22,969,012
703
2445
907 '157549 ;
29169 :
15161 '14
1,286 i242 I416 !106 |194117140 I378 I
1,997374 '26495
47933
1294
10885517
6,0627426
879
$392,290139,067 ]
236,509347,990 !
10,794,721 j2,180,437 :7,810,932 i2,153,870 !3,874,988 I
565,528 !1,895,060 |
885,877 !99,756
17,459,2991,930,885 I2,923,588
931,998 i1,689,504 !1,070,2671,548,3483,943,773 j
27,904,224 !5,400,168 |4,431,093
738,8327,810,963
225,905948,45116,359 !
1,003,925 I12,485,479 I
82,895 I113,125,522 I
1,036,772 I159,371 !
16,968,078
12,9781,8767,143
11,307 !94,794 I21,163 i31,6324,124 j
15,082 I9,297 i
23,849 S2,888 i7,994
148,71345,90860,16035,80920,07420,0159,222
30,67378,64454,34745,6669,240
54,45714,03649,6322,9836,075
68,7704,448
266,22313,26312,82195,396
Grand total.
Total netincome.
! Number of; dependent' children.
Exemptionfor depend-
ent children.
$60,209,562 i6,508,506 I
31,954,008 i58,498,287 :
501,451,546108,657,875 '•199,926,724 i50,597,176 !82,375,392 '45,319,996
116,171,112 i21,524,255 I33,835,514
863,784,600202,595,926255,068,861161,275,002102,899,244115,896,18055,115,710
208,011,789601,311,502302,002,410223,995,60352,550,713
306,300,18759,292,992
202,728,89510,963,31635,742,296
421,757,42420,892,721
2,439,736,14869,649,13149,053,723
598,090,922
19,6141,4208,565 !
12,428 s
73,098 i26,13831,295 i3,1089,567 i
11,39536,9553,835
12,940149,28944,40476,82758,30322,40732,3198,435
29,93268,45758,75274,95613,62357,05917,44785,7933,4305,537
70,8526,281
214,36722,62226,36992,715 I
83,922,800284,000
1,713,0002,485,600
14,619,6005,223,6006,259,000
621,6001,913,4002,279,0007,391,000
767,0002,588,000
29,857,8008,880,800
15,365,40011,660,6004,481,4006,463,8001,687,0005,986,400
13,691,40011,750,40014,991,2002,724,600
11,411,8003,489,400
17,158,600686,000
1,107,40014,170,4001,256,200
42,873,4004,524,4005,273,800
18,543,000
WH>
1
C
Digitized for FRASER http://fraser.stlouisfed.org/ Federal Reserve Bank of St. Louis
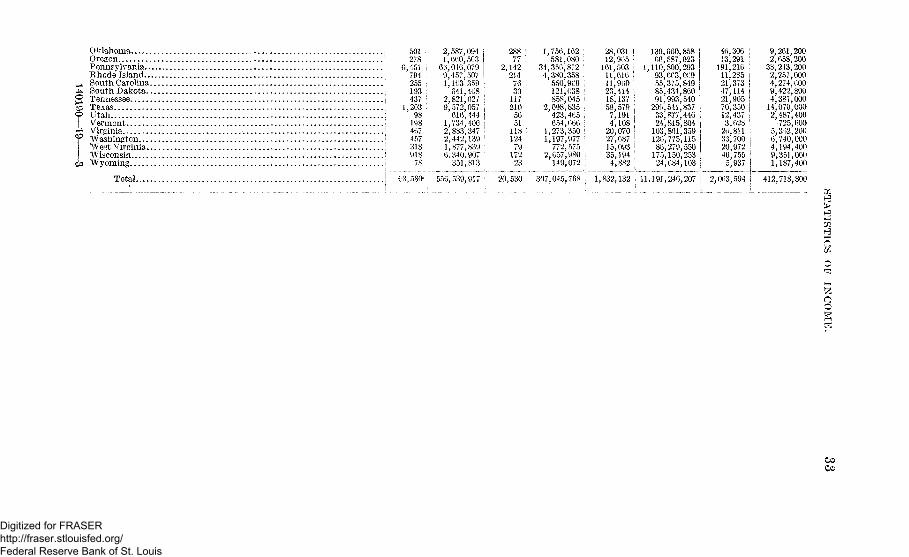
Oklahoma i 501 | 2,587,094Oregon ; 278 ! 1, tSliO, 503Pennsylvania I 6,451 j 66,046,079Rhode Island > 794 \ 9,457,507South Carolina 255 ; 1,103 359South Dakota : 193 : 641,468Tennessee : 437 : 2,821,627Texas 1,203 ; 9,572,057Utah i 98 i 616,444Vermont . . . . . ! 198 1,734,400Virginia : 467 . 2,883,347Washington I 457 2,442,139"West Virginia ; 318 1,877,839Wisconsin.. I 918 6,340,907Wyoming ! 78 ' 351,813
Total | 63,580- 556,539,917
288 :77 |
2,1422J4 I76 ;30 ;1172105651 :118 :1247917223
1,
34,4,
2,
11
2
756,581,350,.3*0,550,121.858,,098,423,654,,273,,197,772,,657,149,
162 :080 ;872 •358 !9G9 1638 i045 i835 i465 :666 \350 !,977 !575 ;,980 i,072 i
28,031 !12,905 '161,503 ;11,616 !11,96023,41418,13759,5797,1914,10820,07027,68715,09335,1944,882
139,660,85866,587,023
1,110,800,29393,6C3,06955,375,84985,434,86091,993,540
296,541,837 I33,877,44624,815,804
103,861,359126,775,11586,279,550 |
175,150,253 I24,684,103 i
20,530 307,045,768 j 1,832,132 | 11,191,246,207 j 2,063,594 j
46,13,
191,U21,•47,21,70,12,3,26,33,20465,
306291216285373114905350437628811700972755937
2,063,594
9,261,2002,658,200
38,243,2002,257,0004,274,6009,422,8004,381,00014,070,0002,487,400725,600
5,3)2,2006,740,0004,194,4009,351,0001,187,400
412,718,800
COCO
Digitized for FRASER http://fraser.stlouisfed.org/ Federal Reserve Bank of St. Louis
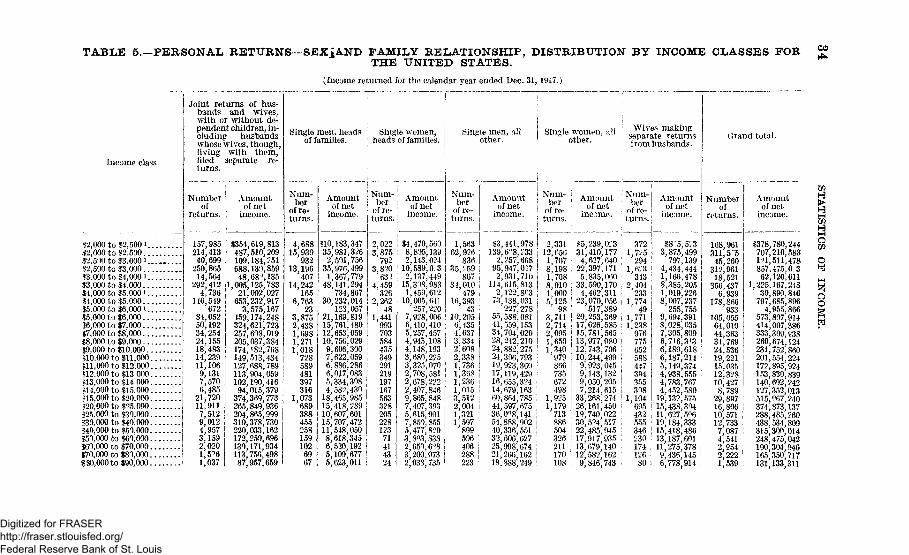
TABLE 5.—PERSONAL RETURNS- -SEXJAND FAMILY RELATIONSHIP, DISTRIBUTION BY INCOME CLASSES FORTHE UNITED STATES.
(income returned for the calendar year ended Dec. 31, 1917.)
CO
Income class.
$2,000 to $2,5001.$2,000 to $2.590..$2,500 to $3,0001.82,500 to $3,000..13,000 to $4,000i.$3,000 to $4.000..$4,000 to $5 0001.$4,000 to $5.000..$5,000 to $6,000i.$5,000 to $6.000..16,000 to $7,000..$7,000 to $8,000..$8,000 to $9,000..$9,000 to $10,000.$10,000 to $11,000111,000 to $12,000$12,000 to $13,000113,000 to $14 000$14,000 to $15,000$15,000 to $20,000$20,000 to $95,000$25,000 to $30,000$30,000 to $40,000140,000 to $50,000150,000 to $60,000$60,000 to $70,000.$70,000 to $80,000.$80,000 to $90,000.
Joint returns of hus-bands and wives,with or without de-pendent children, in-cluding husbandswhose wives, though,living with them,filed separate re-turns.
Numberof
returns.
157,985214,41340,699
250,86514,564
292,4124,736
146,549672
84,05250,19234,25424,15518,48314,23911,1069,1317,5706,485
21,72011,9117,5129,0124,9573,1592,0201,5961,037
Amountof net
income.
Single men, headsof families.
Num-ber
of re-turns.
Single women,heads of families.
Single men, allother.
Single women, allother.
Wives makingseparate returnsfrom husbands.
$354,619,813487,510,209109,184,551688,130,85948,68°, 135
(1,005,125'78321,092,027
i 653,232,917! 3,575,167
459,174,248324,621,723257,608,019 .205,037,384 f
174,182,768149,513,434127,688,789113,904,059102,190,41694,015,379
374,369,773265,849,936204,865,999310,378,730220,033,162172,250,696130,171,934113,756,49887,957,659
4,68815,930
93213,196
40714,242
1656,763
233,8752,4381,6981,2711,018
728589481397316
1,0736893884552581591026967
$10,183,34735,981,3262,501,75635,976,4991,367,779
48,141,294734,867
30,232,014123,057
21,169,81915,761,480 !12,653,059 I10,756,029 ;9,606,300 I7,622,059 !6,886,286 !6,017,083 !5,334,3084,583,43018,465,98515,418,28910,607,60115,707,47211,548,0508,618,345 i6,520,192 |5,109,677 i5,623,011 !
2,0223,875792
3,8?0632
4,459326
2,26248
1,44199370358443534929121919716756332820522812371414324
$4,470,5608,805,1392,143,024
10,589,0.32,137,449
15,308,9831,459,612
10,005,641257,220
7,928,0066,410,4105,257,4574,945,1084,148,1933;680,2253,325,0702,708,5812,678,2222,407,8469,865,8487,407,3935,615,9017,850,8555,477,8203,8°3,8382,659,6^83 200,0732,038,735
1,563i 62,926 iI 836 II 35,^59 i
867 I34,010 I
479 i16,393
43 i10,205 !6,435 j4,637 I3,3342,6082,338 j1,736 i1,3681,2361,0153,512 !2,004 '1,3211,597
899596406288223
$3,441,978139,6°8,S33 !
2,257,668 i95,947,027 I2,931,710 i
U4,615;813 I2,122,8^3 j
73,138,031 I227,278 !
55,588,081 I41,559,15334,704,029 I28,242,210 !24,882,275 I24,306,793 j19,923,36017,119,429 !16,655,324 i14,679,163 I60,864,785 !44,597,675 |36,09g 141 !54,888,902 !40,336,551 I32,606,627 :
25,998,674 \21,266,162 !18,888 249 l
2,33112, P561,7078,1981,7088,9101,0005,125
983,7112,7142,0951,6501 340
979866735672498
1,9251,179
713886504326211170108
! J5,239,053 !I 31,410,177I 4,627,640 !; 22,397,171 ': 5,835,060 :! 33,590,170i 4,462,311i 23,070,056 i! 517,389 :j 20,253,369 ji 17,626,585 j
15,781,565 .;' 13,977,080 ii 12,743,706 I! 10,244,499 !! 9,923,045 !
9,143,132 !9,050,205 !7,214,615 I
33,268,274 !26,161,450 i19,740,022 !30,594,517 i22,485,945 I17,917,935 !13,679,140 j12,582 162 !9,846 743 i
3721,725
2941,6C3
3432,404
2331,774
491,7711,238
976775652588447304355308
1,10469543255534623017412680
$ 5 , 33,875,499
797,1394,434,4441,166,4788,385,2051,019,2268,007,237
255,7559,694,3918,028,0357,305,8096,716,3136,189,6186,187,2145,149,3744,938,5554,783,7674,452,580
19,139,57515,438,30411,627,5%19,184,33315,418,48613,187,60111,275,3789,436,1456,778,914
Grand total.
Numberof
returns.
Amountof net
income.
- I -168,961311,5 545,260
312,96118,521
356,4376,939
178,866933
105,05564,01044,36331,76924,53619,22115,03512,32810,4278,789
29,897 ;16,80610,571 I12,733 |7,087 |4,541 i2,954 j2,222 I1,539 i
$378,780,244707,210,583191,511,478857,475,0 362,120,611
1,225,167,24830,890,846
797,685,8964,955,866
573,807,914414,007,386333,309,938269,674,124231,752,86020i; 554,224172,895,924153,830,839140,692,242127,352,013515,967,240374,873,137288,485,?60438,534,809315,300,014248,475,042190,304,946165,350,717131 133,311
I8
Digitized for FRASER http://fraser.stlouisfed.org/ Federal Reserve Bank of St. Louis
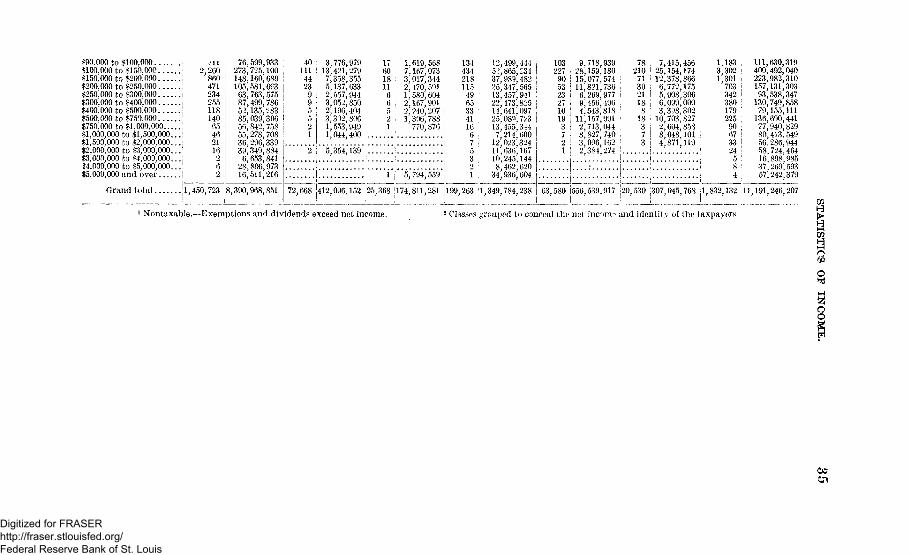
$90,000 to S100,000 ML1100,000 to $150,000 i 2,260$150,000 to $200,000 1 860$200,000 to $250,000 : 471$250,000 to $300,000 j 234$300,000 to $400,000 , 255$400,000 to $500,000 ! 118$500,000 to $750,000 \ 140$750,000 to $1,000,000 i 65$1,000,000 to $1,500,000... I 46$1,500,000 to $2,000,000...! 21$2,000,000 to $3,000,000.. J 16$3,000,000 to $4,000,000... i 2J4,000,000 to $5,000,000...! 6$5,000,000 and over j 2
Grand total jl, 450,723
76,599,933273,725,100148,160,689105,581,693
63,763,57587.499,78652,135,28385,039,30656,842,75855,278,70836,296,33939,349,8846,653,841
28,806,97316,511,216
8,390,968,851
40 ;111 i44 i239 !9 !5 !5 i2
1 I
3,776,97913,421,2797,358,3555,137,6332,557,9443,052,8502,196,4043,312,8061,553,9491,044,400
2 1 5,354,139
17 1,619,56860 | 7,167,073 :18 i 3,017,344 i11
6 I6 i
!
2,470,5011,580,604 j2,167,901 I2,240,207 I1,306,788 i
770,876 j
1 5,794,559 \
134434218 '115 !
49 !65 I33 :41 !16 ,6 !7 !
1
12,499,444 ;52,865,234 I37,989,482 |25,347,565 I13,457,941 !22,473,825 I14,641,097 !25,089,723 I13,455,344 j7,214,600 i
12,023,324 i11,636,167 I10,245,1448,462,620
34,936,604
103227905323271019372I
-
9,718,93928,159,18015,077,57411,821,7366,269,9779,456,4964,543,81811,157,9912,713,0448,827,7403,096,1622,384,274
-
7821071302118818373
i 7,415,456! 25,154,174! 12,378,866i 6,772,1751 5,908,306! 6,099,0001 3,398,302• 10,703,827; 2,604,858
8,048,101i 4,871,119!1
• i -
1,1833;302 ;1,301 i
703 I342 !380 :17922590 i67 !33 i24 i5
111,630,319400,492,040223,982,310157,131,30393,538,347
130,749,85879,155, 111
136,690,44177,940,82980,413,54956,286,94458,724,46416,898,98537,269,59357,242,379
72,668 412,096,152 25,368 1174,811,281 199,263 11,349,784,238 63,580 (556,539,917 |20,530 |307,045,768 1,832,132 |11,191,246,207
1 Nontaxable.—Exemptions and dividends exceed net income. 2 Classes grouped to conceal the net incom? and identity of the taxpayers.
COC71
Digitized for FRASER http://fraser.stlouisfed.org/ Federal Reserve Bank of St. Louis
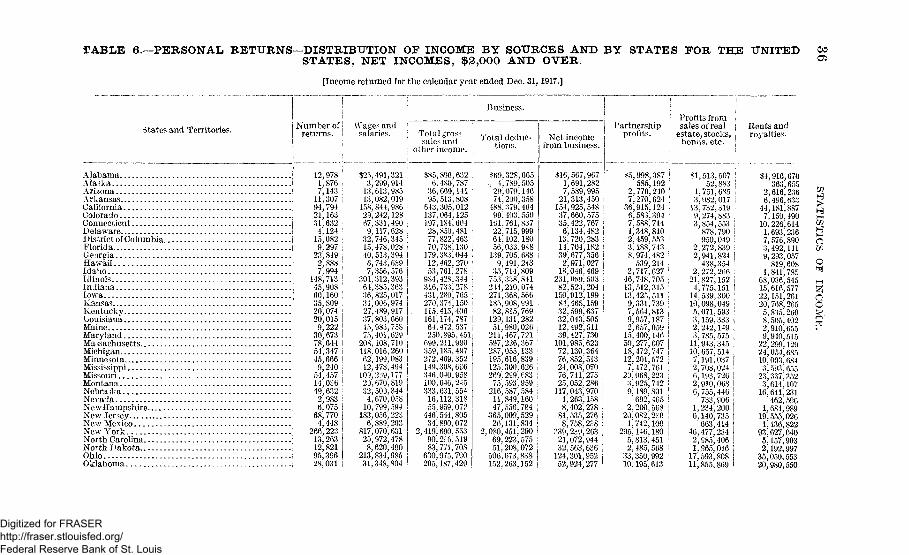
TABLE 6.—PERSONAL RETURNS—DISTRIBUTION OF INCOME BY SOURCES AND BY STATES FOR THE UNITEDSTATES, NET INCOMES, $2,000 AND OVER.
CO
[Income returned for the calendar year ended Dec. 31,1917.]
States and Territories.
Business.
AlabamaA la^kaArizonaArkansasCaliforniaColoradoConnecticutDelawareDistrict of ColumbiaFlorid aGeorgiaHawaiiIdahoIllinoisIndianaIowaKansasKentuckyLouisianaMaineMarylandMa .sachusetts.MichiganMinnesotaMississippiMissouriMontanaNebra skaNevadaNewHampshireNew JerseyNew MexicoNew YorkNorth CarolinaNorth DakotaOhioOklahoma
Number of jreturns, j
12,978 :1,876 i7,143
11,307 I94,79421,16331,6324,124
15,0829,297 I
23,849 ;2,888 '7,994 !
148,713 !45,90S !60,160 :35,809 ;20,074 j20,015 I9,222 ;
30,673 I78,644 j54,347 i45,666 J9,240 i
54,457 !14,086 !49,632 !2,983 i6,075 i
68' 7704,448
266,22313,26312,82195;38628,031
Wages andsalaries. Total gross
sales andother income.
$25,491,321 ;3,299,91413,613,98513,082,019158,844,98629,242,12867,331,490 :9,117,628 .
32,746,345 i15,478,028 i40,513,394 I6,743,689 I7,356,576 j
301,312,393 j64;385,36336,825,01731,006.974 '27,489,91737,803,66015,983,75875,401,629208.108.710118^016^26062,199)08312,478,494103,239,17720,670,81932,503,3444,670,05810,799,594
183,056,2236,889,203
817,070,63120,972,4788,620,490
213,834,98531,348,804
$85,896,632 i6,480,787
36,669,141 '95,513,808
643,305,012137,064,125197,184)60428,850,481 :77,822,46370,738,130 ;
179,383,044 \12,462,270 !53,761,278 ,
984,428,344 ::
316,733,278 :
431,280,705 ;270,374,150 i115,415,406 .'161,174,787 j64,472,537 i250,895,451;
699,211,990359'. 185,497272) 469,352149|308,6S6346,040,958100,646; 245333,631,554
16,112,31855,959,072
446,544,80534,890,072
2,419,690,55390)2r6,5l983,771,708
630,975,790205,187,429 I
Total deduc-tions.
$69,328,665-, 4,789,50529,079,14674,200,358488,379,46499,403.550161,761)83722,715,99964,102,18056,033,948139,705,688 !9,491.243
35,714; 809753,338,8412 54,210,074271,368,566 !
185,908,99182,815,769 |129,131,282 I51)980,026 i211,467,721597,226,367 :287,055,133 !195,616,839 ;125,300,626 I269:299.683 i75,593,959 ;216,587,584 ;11,849,160 i47,556,794 |
365,009,529 j26,131,834 -
2,080,451,290 i69,223,575 !51,208,072 i
506,673,838152,263,152 \
Net incomefrom business. |
Partnershipprofits.
$16,5671,691,7,589,
21,313,154,925,37,660,35,422,6,134,
13,720,14', 704,39,677,2,971,
18,046,231,089)82,523,
159,912,84,465,32,599,32,043,12, 492.39,427,
101,985,72,13076,852!24,008)76,741,25,052,
117,043,4,263,8,402,
81,535,8,758.
339,269,21,072,32,563,
124,301,52,924,
,967282 I995 I450 j548 j575767 1482 !283 \182 i356 I027 ;469 I503 ;204 I199 !159 I637 !505 :511730 •623364 ;
513 :070275 !286 i970158 !278 ,276 i228 j263944 !626 !952 i277 !
#5,998,387 !
585,1922,776,240 ;
7,270,624 i36,915,124 :6,583,3947,588;714 :1,348,810 j
2,459,553 !3,188,743 j8,974,482 I
539,2142,717,627 '
46,748,705 i13,512,315 I13,425,511 !9,331,739 i7,564,813 i9,957,187 I2,657,059 I
15,400,146 !50,277,607 I18,472,747 !12,201,572 •7,472,761 ;
20,068,223 i3,925,742 i9,189,801 !
'692,465 I2,200,568 I
20,082,220 '1,742,100 j
205,146,180 I5,813,451 ;
2,485,568 j33,350,992 |10,195,613 !
Profits fromsales of real
estate, stocks,bonds, etc.
SI,513,50752,883
1,751,6853,082,017
13,732,3199,274,8833,854,553
' 878,790950,049
2,272,8392,941,824
438,3542,272.266
21)827)1524,775,151
14,539,30010,098,0495,071,5933,159,3332,242,1493,785,575
11,943,34510,657,5147,191,0372,708,0246,193)7262,910,0686,755,446
733,9061,234,2006,140,735
663,41446,477,2342,985,4061,965,016
17,593,80811,855,869
Rents androyalties.
S4,916,670363,655
2,616,2366,496,633
44,181,8877,150,490
10,226,6141,693,2367,576,8903,492,1419,293,057
819,6081,841,785
68,036,54515,616,57722,151,26120,768,2655,835,2608,505,4022,910,6559,940,515
22,299,12924,054,68510,003,6843,593,655
23,337,3523,614,107
16,641,231462,596
1,684,98919,555,0261,136,822
93,627,0405,157,9032,192,997
35,050.55320,980,550
>
gXII
ac
Digitized for FRASER http://fraser.stlouisfed.org/ Federal Reserve Bank of St. Louis

OregonPennsylvania..Rhode Island..Sonth Carolina.Sonth Dakota..TennesseeTexasUtahVermontVirginiaWashingtonWest Virginia..WisconsinWyoming
Total.
12,965 '161,503 •11,616 ;
11,960 |23,414 i18,137 i59,579 ,
7.191 i4^108 i
20,070 I27; 687 I15,093 '35^194
4,882 i
21,737,793387,290,906
29,205,01915,813,6439,123,970
34,849,51072', 355,50913', 655,262
G, 394,86341,972,46447,737,15429,955,79158,120,1856,680,266
1,832,132 3,648,437,902
135,429,1,387,032,
85;943,85,101,146,265,104,060,433,020,30,283,42,590,139,979,162,537,72,537245,80i;36,518,
109,710,1.149,701
71,840;60,435,92,420,80,571,323,423,20,776,36,108,112,422,116,461,60,981,190,520,28,169,
874797 ;367 :642 i270 i049 I277 I492 ;617 i286 !491 |389246819
25,718,701237,330,32514,102,96024,666,30953,845,41823,489,825109,596,7249,506,9596,481,57027,557,08946,075,87711,556,24255,281,6398,349,154
13,570,931,459 | 10,705,518,713 2,865,412,746
5,180,16978,785,1983,921,4004,449,5423,911,32910,019,345'29,287,3771,444,4471,601,6246,254,2316,795,9864,741,4577,431,6132,401,748
775,086,665
1,610,70323,390,8001,528,8251,209,7793,737,4502,943,11315,733,2721,169,435352,319
2,713,6203,522,8216,721,1844,729,3192,284,958
318,170,617
4,185,22150', 484,4674,254,7446,067,5125. 225,7296,779,63635,164,6441,726,513'884,4917,455,0388,706,7196,023,1337,252,0092,307,842
684,343,399
>
Ow
a6g
Co
Digitized for FRASER http://fraser.stlouisfed.org/ Federal Reserve Bank of St. Louis
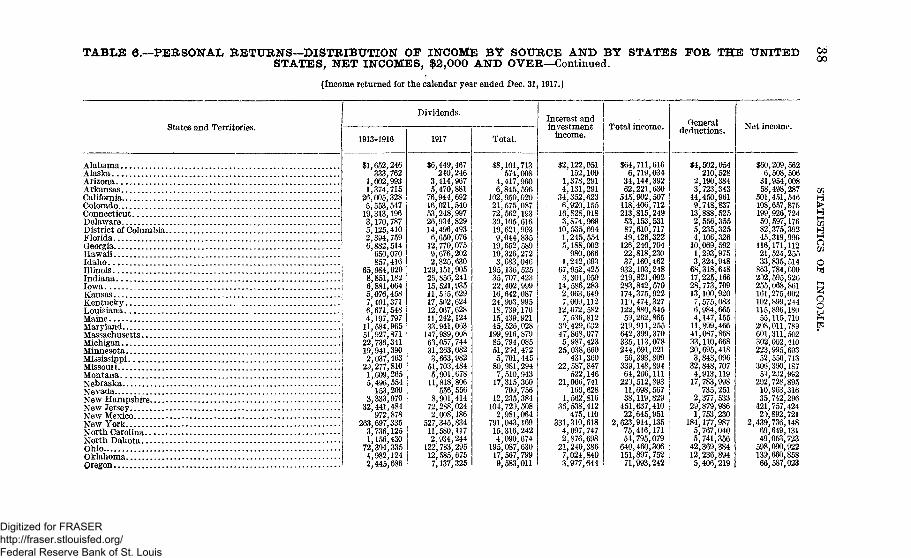
TABLE 6.—PERSONAL RETURNS—DISTRIBUTION OF INCOME BY SOURCE AND BY STATES FOR THE UNITEDSTATES, NET INCOMES, $2,000 AND OVER—Contimied.
[Income returned for the calendar year ended Dec. 31,1917.]
00
States and Territories.
Alabama.Alaska.ArizonaArkansasCaliforniaColoradoConnecticutDelawareDistrict of Columbia..FloridaGeorgiaHawaii ,IdahoIllinoisIndianaIowaKansasKentuckyLouisianaMaineMarylandMassachusettsMichiganMinnesotaMississippiMissouiiMontanaNebraskaNevada..
Dividends.
New Hampshire.New JerseyNew MexicoNew York ,North Carolina..,North Dakota. . . .OhioOklahomaOregon
1913-1916
$1,652,246333,762
1,002,9931,374,715
26,005,3285,553,547
19,313,1963,170,7875,125,4102,394,7596,882,514
650,070 ;857,416 !
65,984,6208,851,1826,881,0645,076,4587,401,3716,671,5484,197,797 ,
11,584,96551,927,87122,736,34119,941,3902,037,463
29,277,810 !1 609,265 |5,496,554 |
153,200 i3,333,970 !
32,441,484 j972,878 !
263,697,335 i3,736,1251,156,430
72,304,3354,982,124 I2,445,686
1917
$6,449,467240,246
3,414,9675,470,88176,944,69216,021,54053,248,99726,934,82914,496,4936,650,07612,770,0759,676,2022,825,630
129,151,90523,856,24115,521,93511,535,62917,502,62412,067,62811,242,12433,941,063
147,989,00863,057,74431,263,0823,663,982
51,703,4845,901,678
11,818,806556,556
8,901,41472,288,0242,008,186
527,345,83411,580,1172,934,244
122,783,29512,585,6757,137,325
Total.
Interest andinvestment I
income. ITotal income.
$8,101,713574,008 !
4,417,9606,845,596 I
302,950,020 j21,575,08772,562,19330,105,61619,621,9039,044,83519,652,58910,326,2723,683,046
195,136,52535,707,42322,402,99916,642,08724,903,99518,739,17615,439,92145,526,028199,916,87985,794,08551,204,4725,701,44580,981,2947,510,94317,315,360
700,75612,235,384104, 72c), 5082,981,064
791,043,16915,316,2424,090,674
195,087,63017,567,7999,583,011
$2,122,051152,100
1,378,2914,131,29134,352,6236,920,15516,828,9183,874,96910,535,6941,245,5545,188,002980,066
1,242,69367,952,4253,301,05914,586,2832,063,6497,009,11212,672,5827,536,812
30,429,63247,868,0775,987,42325,038,660
431,36022,587,847
522,14621,066,741
166,6281,562,816
35,538,412475,110
331,310,6184,097,7472,876,69821,240,3867,024,8403,977,644
$64,711,6166,719,034
34,144,39262,221,630
545,902,507118,406,712213,815,24953,153,53187,610,71749,426,322126,240,70422,818,23037,160,462932,103,248219,821,092283,842,570174,375,922110,474,327122,880,84559,262,865219,911,255642,399,370335,113,078244,691,02156,393,809339,148,89464,206,111220,512,89311,698,56738,119,829451,637,41022,645,951
2,623,914,13575,416,17154,795,079640,460,306151,897,75271,993,242
Generaldeductions.
$4,502,054210,528
2,190,3843,723,343
44,450,9619,748,837
13,888,5252,556,3555,235,3254,106,326
10,069,5921,293,9753,324,948
68,318,64817,225,16628,773,70913,100,9207,575,0836,984,6654,147,155
11,899,46641,087,86833,110,66820,695,4183,843,096
32,848,7074,913,119
17,783,998735,251
2,377,53329,879,9861,753,230
184,177,9875,767,0405,741,356
42,369,38412,236,8945,406,219
Net income.
$60,209,5626,508,506
31,954,00858,498,287
501,451,546108,657,875199,926,72450,597,17682,375,39245,319,996
116,171,11221,524,25533,835,514
863,784,600202,595,926255,068,861161,275,002102,S99,244115,896,18055,115,710
208,011,789601,311,502302,002,410223,995,60352,550,713
306,300,18750,232,992
202,728,89510,963,31635,742,296
421,757,42420,892,721
2,439,736,14869,649,13149,053,723
598,090,922139,660,85866,587,023
oo
Digitized for FRASER http://fraser.stlouisfed.org/ Federal Reserve Bank of St. Louis
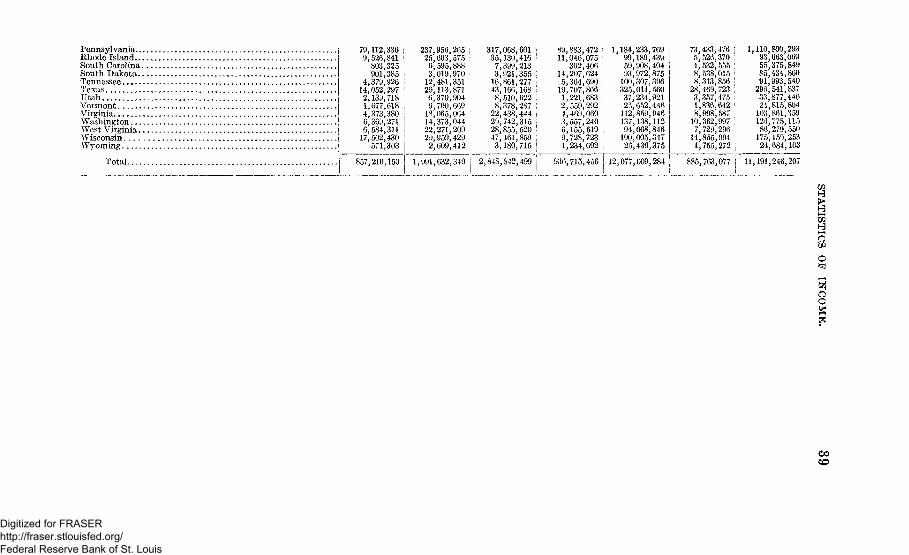
Pennsylvania...Rhode Island-..South Carolina.South Dakota..TennesseeTexasUtahVermontVirginiaWashingtonWest Virginia..WisconsinWyoming
Total
79,112,336 |9,526,841 I
803,325 !901,385 I
4,379,926 i14,052,297 '2,139,7181,677,6184,373,3806,369,2716,584,311
17,502,430571,303
237,956,265 j25,603,575 I6,595,8883,019,970 i
12,481,35129,113,871 i6,370,904 j6,700,669 i
18,065,064 J14,373,044 ;22,271,209 !
29,959,429 !
2,609,412 !
317,068,601 )35,130,416 !
7,399,2133,921,355 i
16,861,277 i43,166,168 !8,510,622 i8,378,287 \
22,438,444 i20,742,315 >28,855,520 !47,461,8593,180,715 !
89,883,472 !11,046,075 !
302,406 !14,207,624 !5,364,690 j
1.9,707,866 j1,221,683 j2,559,292 I4,469,060 |3,557,240 !6,155,519 !9,728,723 !1,234,692 |
1,184,99,5993,
ioo3253723'
112137,94
190,28,
233,769 i189,439 !908,404 '972,875307,396011,560234,921652,446859,946138,112008,846005,347439,375
857,210,150 1,991,632,349 j 2,848,842,499 j 936,715,456 12,077,009,284
73,433,476 i5,526,370 !4,532,5558,538,015 i8,313,856 !28,469,723 |3,357,4751,836,642 '.8,998,587 !10,362,997 i7,729,296 I14,855,094 i1,755,272 j
1,110,93,55,85,91,296.33,24,103!128;86,175,24:
800,293663,069375,849434,860993,540541,837877,446815,804861,359775,115279,550
,150,253,684,103
885,763,077 j 11,191,246,207
I5
CSS3
COCO
Digitized for FRASER http://fraser.stlouisfed.org/ Federal Reserve Bank of St. Louis
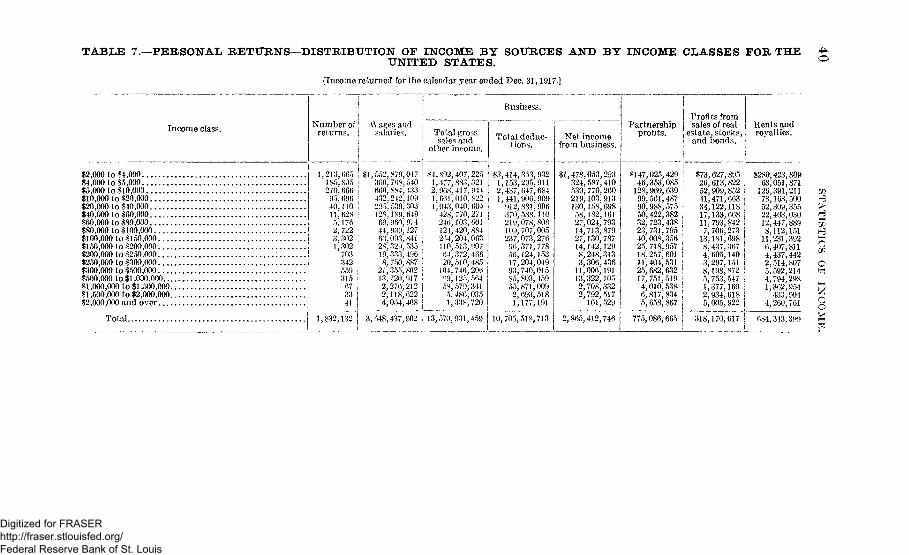
TABLE 7.—PERSONAL RETURNS -DISTRIBUTION OF INCOME BY SOURCES AND BY INCOME CLASSES FOR THEUNITED STATES.
[Income returned for the calendar year ended Dec. 31,1917.]
Income class.
$2,000 to $4,000$4,000 to 85,000$5,000 to $10,000$10,000 to $20,000 I$20,000 to $40,000 1$40,000 to $60,000 !$60,000 to $80,000 I$80,000 to $100,000 i$100,000 to $150,000 i$150,000 to 8200,000 !$200,000 to $250,000 ; |$250,000 to $300,000 1$300,000 to $500,000 i$500,000 to $1,000,000 j$1,000,000 to $1,500,000 j$1,500,000 to $2,000,000$2,000,000 and over
Total j 1,832,132!
Business.
Number of!returns. |
Wages andsalaries.
1,213,665 J185,805 i270,666 I95,696 ;40,110 !11,628 '5,1762,722 I3,302 '1,302
703 !342 !559 ;315 i673341
$1,552,870,047300, 768, 540660,884,433432,242,109295,530,303128,189,649
69, 960, 97444, 939,12763,093,84128,329,53519,333; 4968, 750,887
21,355,80213,720,9172,276,2122,118,6224,064,408
3,348,437,902
Total grosssales and
other income.
$4,892,1,477,2,968,1,661,1,013,
428,246,124,264,110,64,20,
104,99,
407,225883,321417,944010, 822040, (504770,271103, 601420,884204,063513, 907372,466510,485746,206125,564579,341486,035338,720
Total deduc-tions.
13,570,931,459
83,414,1,153,2,437,1,441,
912,370,219,109,237,
96,56,17,93,85,
353,932295,911647,684906,909881,906588,110078,808707,005073,276371,778124,153204,049740,015803, 159871,009693,518177,191
10,705,518,713
Net incomefrom business.
$1,478,053,293324,587,410530,770,260219,103,913130,158,69858,182,16127,024,79314,713,87927,130,78714,142,1298,248,3133,306,436
11,006,19113,322,1052,708,3322,792,517
161,529
Partnershipprofits.
Profits fromsales of real
estate, stocks,and bonds.
Rents androyalties.
$147,025,429 j46,353,085 j
128,969,639 '99,561,487 i90,988,575 ;
50,422,382 I32]723,438 i23,731,795 !40,008,356 '25,718,957 I18,257,601 i11,404,531 i25,682,632 |17,751,519 14,010,538 !6,817,834 I5,658,867 j
$73,627,26, 613,52,909,41,471,34,122,17,133,11, 793,7,706,
13,181,8,437,4,605,3,297,8,198,5,753,1,377,2,934,5,005',
895822852663118 i668 I842 !273 I698 !367 !
140 I151 I872 I547 i169 I618922
$280,423,80963,051,871
126,391,21178,168,50052,309,35522,403,03012,447,8898,112,151
11,231,3926,407,8114,437,4422,514,8075,592,2144 794,2981,362,954
433,9044,260,761
HH
o
-T I2,865,412,746 775,086,665 318,170,617 684,343,391) g
Digitized for FRASER http://fraser.stlouisfed.org/ Federal Reserve Bank of St. Louis
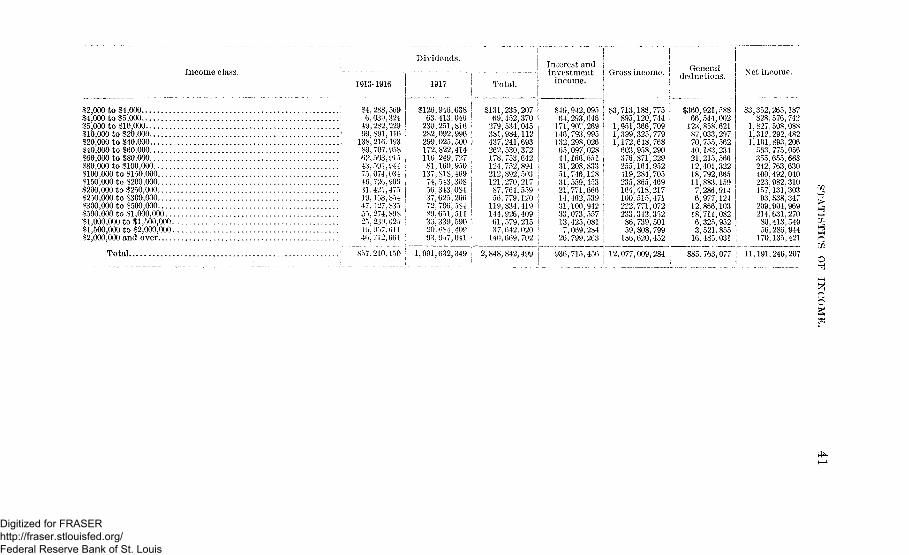
Income class.
$2,000 to $4,000$4,000 to $5,000$5,000 to $10,000$10,000 to $20,000$20,000 to $40,000$40,000 to $60,000$60,000 to $80,000$80,000 to $100,000$100,000 to $150,000$150,000 to $200,000$200,000 to $250,000$250,000 to $300,000$300,000 to $500,000$500,000 to $1,000,000$1,000,000 to $1,500,000.$1,500,000 to $2,000,000$2,000,000 and over
Total
1913-1916
$4,288,5696,039,
49', 282,99,891,
138,216,89,707.62,503.43,591,75,074,46,726.31,421.19,153',47,127,5), 274,25,239,16, 957,40, 712,
857.. 210.,
324229116193958915944034909475854S35898625611661
150
Dividends.
1917
$126,946,63863,413,046
230,251,816282,092,996299,025,500172.822,414116,249,72781,160,950
137,818,46974.543,30856', 343,08437,625,26672. 706', 58489,651,51133,339,59020,684,40993.; 957,041
1,991,632,349
-----
Total.
$131,235,20769,452,370
279,534,045381,984,112437,241,693262,530,372178,753,642124, 752,894212,892,503121,270,21787,764^ 55956,779,120
119,834,419144.926,40961^579,21537.642.020
140,669,702
2,848,842,499
Interest andinvestment
income.
$49,942,09564,293,646
171,907,269146,793,995132,298,02665,097,02844,166,65131,208,83351,746,12831,559,45321", 771,66614,462,53931,100,94233,073,55713,425,0817,069,284
26, 799,263
936,715,456
Gross income.
S3,
1,1,1,
12,
713,185,775895,120,744951,366,709399,325, 779172,648,768603,958,290376,871,229255,164,952419,284', 705235,865,469164,418,217100,515,471222,771,072233,342,35286,739,50159,808,799
186,620,452
077,009,284
Generaldeductions.
$360,921,58866,544,002
123,858,62187,033', 29770, 755', 56240,183,23421,215,56612,401,32218,792,66511,883,159
7,286', 9146,977,124
12,866,10318,711,0826,325,9523,521,855
16,485; 031
885,763,077
Net income.
$3,352,265,187828,576, 742
1,827,508,0881,312,292,4821,101,893.206
563,775', 056355,655,663242, 763,630400,492,040223,982,310157,13i; 303 ^93,538,347 L-
209,904,969 5214,631,270 P
80,413,549 ^56,286,944 £
170,135,421 c
11,191,246,207 o
?
Digitized for FRASER http://fraser.stlouisfed.org/ Federal Reserve Bank of St. Louis
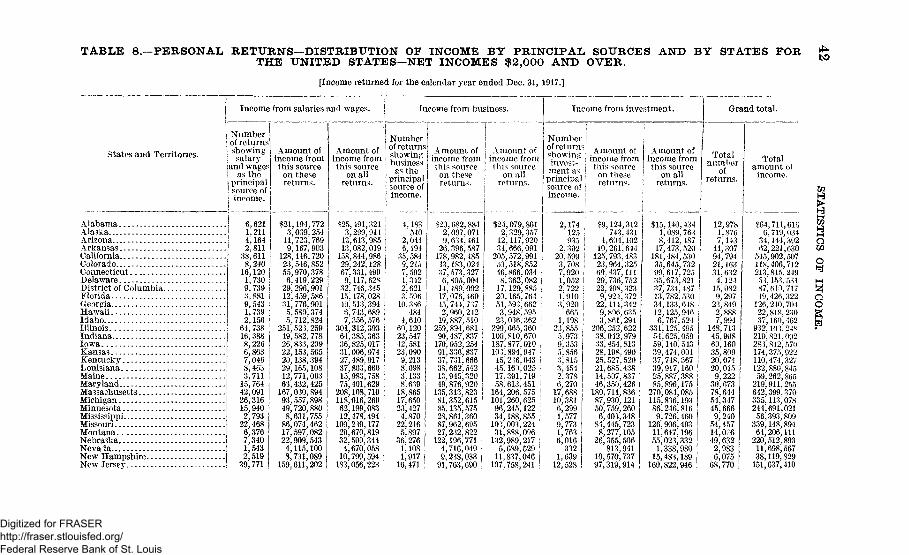
TABLE 8.—PERSONAL RETTTRNS—DISTRIBUTION OF INCOME BY PRINCIPAL SOURCES AND BY STATES FORTHE UNITED STATES—NET INCOMES $2,000 AND OVER.
[Income returned for the calendar year ended Dec. 31, 1917.]
Income from salaries and wages.
States and Territories.
Number\ of returnsI showing! salaryland wage;i as thei principal! source of)urce
income.
AlabamaAla skaArizonaArkansasCaliforniaColoradoConnecticutDelawareDistrict of ColumbiaFloridaGeorgiaHawaiiIdahoIllinoisIndianaIowaKansasKentuckyLouisianaMaineMarylandMassachusettsMichiganMinnesotaMississippiMissouriMontanaNebraskaNeva1aNew HampshireNew Jersey
6,6211,2114.1642,811
38,6118,240
16,1201,7309,739 j3,881 i9,543 :1,739 |2,156 I
64,73816,3888,2266,8637,0468,4633,711
15,76442,09126,31615,9402,793
22,4686,3767,3401,5432,519
39,771
Income from business.
Amount ofincome fromthis source
on thesereturns.
$21,194,7723,039,254
11,723,7699,167, 903
128,146,72023,546,85255,970,3786.419,229
29,296,901 I12,459,58631, 776,9015,580,3745,712,824
251', 523,25949,582, 77826,833,20922,153,56520,138,39429,165,10812,771,06363,432,425
167,030,89493,557,89849,720,8808,631,755
86,074,46217,597,08222,909,5434,115,1008,731,089
159,611,202
Amount ofincome fromthis source
on allreturns.
$25,491,3213,299,91413,613,98513,082,019158,844,98629,242,12867,331,4909,117,628
32, 746,34515,478,02840,513,3946,743,6897,356,576
301,312,39364,385,36336,825,01731,006,97427,489,91737,803,66015,983,75875,401,629208,108,710118,016,26062,199,08312,478,494
109,239,17720,670,81932,500,3444,670,05810,799,594
183,056,223
Numberi of returnsI showing
business! as thei principali source ofI income.
4,183540
2,0446,194
35,5849,2157,5921,3422,6213.506
10,386484
4,64060,12023,54742,58123,0909,2138,0983,1338; 639
18,86517,65023,4274,870
22,2165,897
36,2761,1081,917
16,471
Amount ofincome fromthis sourceon thesereturns.
$20,682,8842,097,0719,634,46126,396,587178,982,48543,183,02437,573.3276,805,00414,489,00217,076,46045, 744,7372,960,24219,887,510
259,894,68190,487,837
170,952,25491,336,83737,731,66638,662,54213,945,32049,876,920
135,313,82381,352,61585,135,57528,861,36087,962,69527,232,822
122,196,7714,716,0499,238,033
91,763,690
Income from investment.
1 Amount of' income from
this sourceon all !
returns.
Number !of returns;showing |invest- ;ment as I
principal ;
source of jincome. I
$24212312055346S172051323
299,100
,079,329,117666^572518866362
,861357920091991852034082
129,885165 764593,662948,036665;810.
187,877;103,894,45,236',45,1758!
164,101,
160,391,613,206,260,
96,245',34,
103,31,
132,5,\\
107',
188,003,
595362360670010 •947 I043 !025 I719 •451 i575625 J122 l
855 !224 ;
888,096 !989,689,837,758,
217 1529 !046241
2
220371213
1235,9,53,3,26,'17,10,6,1,9,1,6;
1,12,
,174' 125935,302,599708920052722910920665198855973353856815454378270688381299577773763016332639528 .
Amount ofincome fromthis source
on thesereturns.
$9,124,312743,431
4,604,10210,261,644
125,793,48323,964; 32569,437,11129.736,75222,' 408,3239,924,372
22,414,3429,806,6353,861,294
206,252,62238,042,97933, 454,81328,198,49025,527,52021,685,43814,507,83746,350,426
180,711,83687,930,12150,759,2606,403,348
84,445,7238,277,105
26,355,506813,941
10,570,73797,319,914
Amount ofincome fromthis source
on allreturns.
$15,140,4341,089,7638,412,487
17,473,520181,484,53035,645,73299,617, 72535,673,82137, 734,48713,782,53034,133,64812,125,9466,767,524
331,125,495 I54,625,05959,140,543 I39,474,001 !37,748,367 i39,917,16025,887,388 j85,896,175 I
270,084,085115,836,19386,246,8169,726,460
126,906,49311,647,19655,023,3321,338,980
15,483,189160,822,946
Grand total,
Totalnumber
ofreturns.
12,9781,8767,143
11,30794,79421,16331,6324,124
15, 0829,297
23,8492,8887,994
148,71345,90860,16035,80920,07420,0159,222
30,67378,64454,34745,6669,240
54,45714,03649,6322,9836,075
68,770
Totalamount of
income.
$64,711,6166.719,034
34,144,39262,221,630
545,902,507118,406,712213,815,24953,153,53187,610,71749,426,322
126,240, 70422,818,23037,160,462
932,103.24*219,821,092283,842,570174,375,922110.474,327122; 880,84559,262,865
219,911,255642,399,370335,113,078244,691,02156,393,809
339,148,89464,206,111
220,512,89311,698,56738,119,829
451,637,410
Digitized for FRASER http://fraser.stlouisfed.org/ Federal Reserve Bank of St. Louis
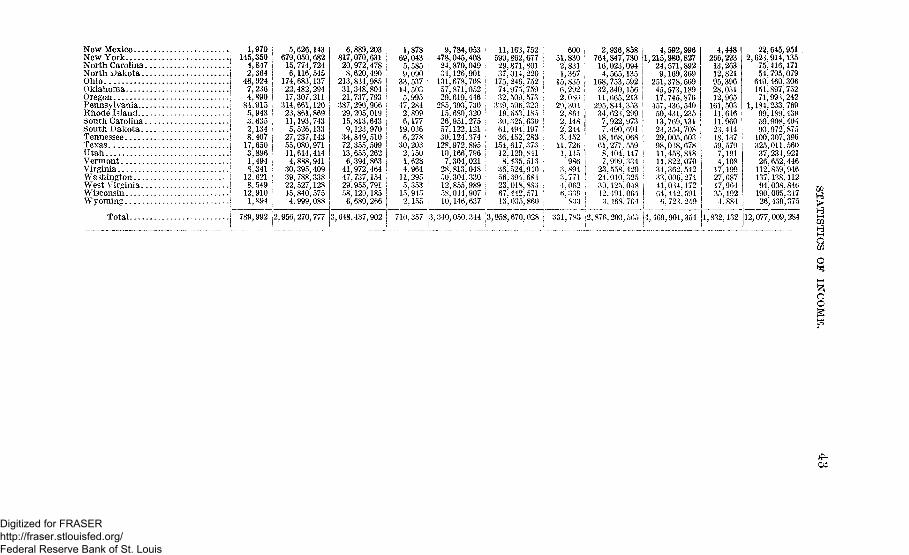
New MexicoNew YorkNorth Carolina.North JJakota..OhioOklahomaOregonPennsylvania...Rhode Island...South Carolina.South Dakota. .TennesseeTexasUtahVermontVirginiaWa JhingtqnWest Virginia..WisconsinWyoming
1,970 i145,350 !
4,847 '2,364
46,0247,2364,89084,9155,9433,6352,1348,40717,6503,896 !1,494 i8,341 i12,621 I8,54912,9101,894
5,626,143679,050,68215,774,7246,116,545
174,683,13722,482,29417,307,211
314,661,12023,861,86911,193,7435,526,13327,237,14355,080,97111,614,4144,888,94130,395,40939,788,33822,527,12845,840,5754,999,088
Total ; 789,992 -2,956,270,777 3,648,437,902
817,070,20,972.8,620,
213,834,31,348,21,737,
387,290,29,205!15,813:9,123'
34,849!72,355;13,655;6,394;
41,97247,737;29,955;58; 120;6', 68O;
203631 I478 I490 '985 I804 1793 i906 i019 i643 I970 i510 i509 I262863 I464 !154 i791 1185 !266 I
1,87869,043 15,585 !9,090 ]33,537 !14,503 i5,995 I47,284 12,8096,17719,0366,278 :
30,203 ,2,1501,6284,96411,295 ,5,353 !15,9452,155 i
9,784,053 !478,045,40824,870,04934,126,901131,678,708 157; 871,052 !29,619,446 :285,393,730 i15.680,320 j26,951,275 i57,122,121 i30,124.374 !128,972,895 i10,166,796 ;7,304; 021
28,813,048 i50,304,33012,855,989 i58,044,907 i10,146,637 i
11,163,752 :590,862,677 j29,871,801 !37,014,220 ;175,246,752 |74,975,759 j32,509.573 S
339,506,323 i19,553,185 i80,325,630 !61,494,197 !36,452,283 ;154,617,373 •12,120,841 '•8,435,513
36,524,940 \56,394.68423,018^883 ;67,442,571 ]13,035,860
60051.8302,8311,367
15,8356,2922,08029', 3042,8642,1482', 2443,45211,7261,145986
3,8943,7714,0626.339' S33
2,936,858764,847,73016,023,0944,565,135
168,753,59232,340,156\\, 665,213
295,844,35334.623,2997,922', 9737.490,69118,168,06861,277,5598, 404', 1477,999,334
23', 558', 42024.010,32530.125,04842, 491', 0643,468.764
710,357 ;3,340,050,344 3,958,670,028 |
4,592,996,215,980,82724,571,8929,160,369
251,378,56945,573,18917,745,876457,436,54050; 431,23513,769,13123,354,70829,005,60398,038,67811,458,81811,822,07034,362,54233,006^27441', 034,17264', 442', 5916! 723,249
331,783 j2,87R, 203.. 565 |4,469,901,354
4,266,13,12,95,28,12,
161,11,11,23,18,59,7,4,17,27,17354'
448223263821396031965503616 I960 !414 i137 !579 i191 i108 i199 |687 i964192 !884 '_!_
22,645,!, 623,914,
75,416,54,795,640,460,151,897,71,993,
., 184,233,99,189,59,908,93,972,100,307,325,011.37,23*126,652.112,859;137,138.94,008;190,005;26,439
951135171079306752242769439404875396560921446946112846,347,375
l31,832,132 J12,077,009,284 g
8
o
Cc
Digitized for FRASER http://fraser.stlouisfed.org/ Federal Reserve Bank of St. Louis
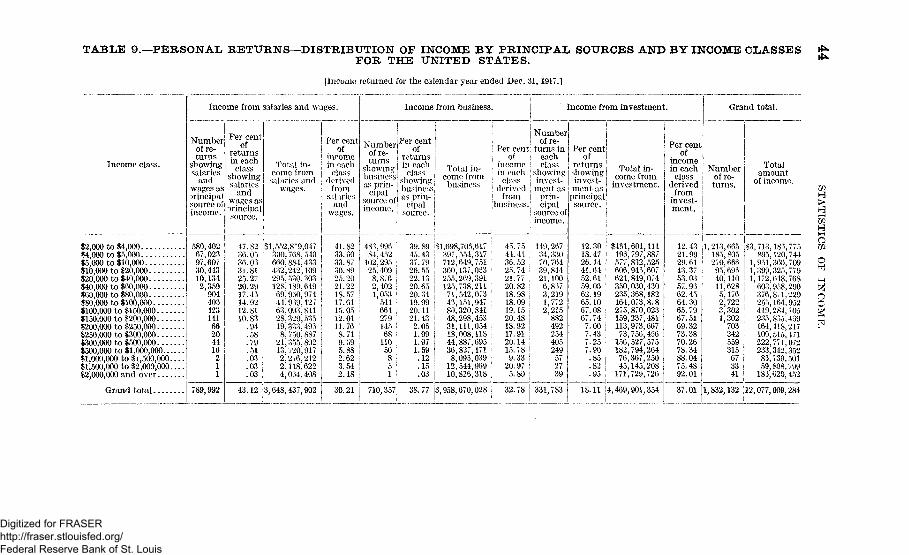
TABLE 9.—PERSONAL RETURNS—DISTRIBUTION OF INCOME BY PRINCIPAL SOURCES AND BY INCOME CLASSESFOR THE UNITED STATES.
jIncome returned for the calendar year ended Dec. 31,1917.]
Income class.
$2,000 to $4,000•14,000 to $5,000$5,000 to $10,000$10,000 to 120,000$20,000 to $40,000$40,000 to $60,000$60,000 to $80,000$80,000 to $100,000$100,000 to $150,000$150,000 to $200,000$200,000 to $250,000.. . .$250,000 to $300,000$300,000 to $500,000..-.$500,000 to $1.000,000...$1,000,000 to $1,500,000.$1,500,000 to $2,000,000.$2,000,000 and o v e r . . . .
Income from salaries and wages.
Number P e rn f
c e n t
of re- <*
principal! *«idsource of § | a
Grand total. 9,992
580,67,97,30,10,2,
40202360744313435990440342314166204416211
47.8236.0536.053i.8125.2720.2917.4514.9212.8110.83.94.58.79.51.03.03.03
Total in-come from
salaries andwages.
! Per centI ofI income• in eachi classj derivedi fromj salaries; andj wages.
$l,552,8~9,047300,768,540660,884,433432,242,109295,530,303128,189,64969,950,97444,939,12763,093,84128,329,53519,333,4938,750,887
21,355,80213,720,9172,276,2122,118,6224,054,408
43.12
41.8233.6033.8730.8925.2021.2218.5717.6115.0512.0111.768.719.595.882.623.542.18
Income from business. Income from investment. Grand total.
Number
cipalsource ofincome.
483,996 i84,452 I
102,295 i25,409 !
8,8:6 I2,402 J1,053 !
544 !664 ;279145 i68 I
11050 j8 :
Per centof
returns I
lsiness,as prm- !
cipal jsource. ]
Total in-come frombusiness
39.8945.4337.7926.5522.1320.6520.3419.9920.1121.132.061.991.971.59.12.15.03
| NumberI i of re-I Per cent: turns in
of; income; in each| classI derived! from'business.
eachPer cent!
of Ireturns ,
showing! showing Iinvest- | invest- jment as i ment as (
Total in-come from
investment.prin-cipal
source ofincomi
l$l,698,708,617 ;
i 397,554,317 :
j 712,649,751I 360,137,053 'j 255,269,391 ;
125,738,211! 71,542,0^3 !
i 48,151,947 :! 80,320,841i 48,298,453| 31,111,054 !! 18,008,118
44,887,69536,827,171 '8,095,039
12,544,969 (
10,826,318 ,
45.7544.41 |36.52 ;25.74 i21.77 ;20.82 !18.98 I18.0919.1520.48 |18.9217.91 !20.14 !15.78 I9.33 !
20.97 i5.80 !
149,26734,33070,76439,84421,1006,8373,2191,7722,215
88249225440524957
39
3,648,437,902 30.21 710,357j 38.77 |3,958,670,028 j 32.78 331,783
principal'source. !
12.3018.47 !26.14 I41.64 i52.6159.086 .19
.10'.08
74004325908582
$461,601,111196,797,887577,832,525606,945,607621,849,074350,030,430235,368,182164,073,8,8275,870,023159,237,481113,973,66773,756,456156,527,575182,794,26476,367,25045,145,208171,729,726
!Per cent
of jincome jin each j
class |derived |
from !invest- jment. !
Numberof re-turns.
Totalamount
of income.
j _
18.11 14,469,901,354|
12.4321.9929.6143.3753.0357.9662.4564.3065.7967.5169.3273.3870.2678.3488.0475.4892.01
37.01
1,213,665185,805270,66595,69540.11011,6285,1762,7223,3021,302
703342559315673341
I$3,713.895!
1,951;1,399,1,172,
603!376,255,419,235,164,100,222,233;
83,59,
183,
183,775120,744365,709325,779618,768958,2908-1,229164,952284,705835,439418,217515,471771,072342,352739,501808,799620,452
>
O
1,832,132 |12,077,009,284
Digitized for FRASER http://fraser.stlouisfed.org/ Federal Reserve Bank of St. Louis
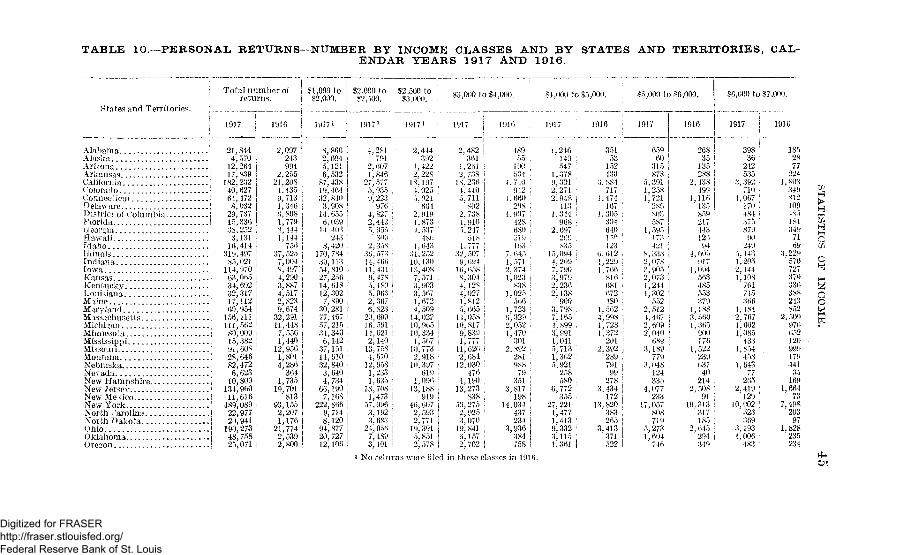
TABLE 10. PERSONAL, RETURNS- NUMBER BY INCOME CLASSES AND BY STATES AND TERRITORIES, CAL-ENDAR YEARS 1917 AND 1916.
Total number ofreturns.
States and Territories.
AlabamaAlaska !
ArizonaArkansas 'California jColorado |Connecticut , IDelaware IDistrict of Columbia iFlorida.... IU eor^ia , . , . . ,HawaiiIdaho iIllinois ;Indiana !Iowa , _, iKansas jKentucky |Louisiana ;Maine !
Maryland ';M assachusetts ;Michigan iMinnesota jMississippi ;Missouri |Montana ;Nebraska ;Nevada jNew Hampshire jNew Jersey !New Me \ ico jNew York. |North *. 'arolina |North Dakota |Ohio |Oklahoma |Oregon ;
81 ,000 to$2,000.
1917 19171
2,097243994
2,25521" 2084', 4359,7131,3466,8081,7793,444 !1,144 I
756 |37,525 j7,004 i8,497!4,290 j3,887 i4,517 !2, 8239,674
32,291 ,11,448 I7,556 i1)440 !
12,956 !1,801 !4,286 |
364 I1,73519,701 !
813 !93,1552,2071,176
21,7742,5392 800
92,000 to§2,500.
$2,500 to$3,000. $3,000 to 84,000. $4,000 to 85,000. £5,000 to $6,000.
I9175 1916 1916 1917
8,8662,6945,121 i6,532 |87,438 j19,464 i32,8403, 90814,6556,039 114'. 403 I
243 ;8,420 i
170,784 I33,113 i54,810 i27,256 ;14,618 112,302 I7,890 j
30,281 I77,467 l
57)215 ;34,3436,142
37,151 .,14,61032,840 '•3,6404,734 i66,190 i7,168 !
222,866 |9,714 |8,120 !94,87720, 72712,106
1.2^1791
2. 6071, X46
~:>! 9359,223
9764,s27
2,444'392 :
1,4222,228
IS; 1974.025 :5.921' 664
2 9191.873x'. 537 :
2 , Hits36'. 57'!1 \. Hit'.1!.1319) 17S5.180 I5,063 '2, 3676.823
2 )', 69916.591 ,14.0212,140
13,75^ 'I, 570
12.95S1)2331.635
is', 70S ,1,473
.17, 9963,1S?23,6S3
24'. 0507,ISO '3)401 :
1, 6433L25210,13013,4087, 5713) 9033, 5671,6724, 509
14,02?10, 96510,334
1,56710,7732,918
10,397619
1,09613,188
91946,607
2,5932,771
19,3915, 8512) 578
2.482' 361
1,2612, 738
18,2364*. 4405,711
' 8022.738l) 9105; 247
0151,777
>>2', 5079) 694
16,658S.3044 1284^0271,8125, 665
14,05810,8179,8391,777
11,6262,684
12,030476
L, 19013,273
838">0,2752, 9253, 070
19,8416,1572,702
44
1.
I ?
-
v)h
I
1,
2,1,
2,
3,
14,
3,
48955
1905347409426602089074286802Vii163645571374023838025566723329052470301892281988
79351817198034437234936384758
1.246149547 !
1,3789.3012)2712,948 f
413 i1,344 i
968 i2,697
15,094 i41209 !7,7903,9792,2362,138 :
9003,798 :7,165 :4,899 ,3,991 '1,0415,713 :1,3625,921
' 258580
6,772355
27,2211,4771,4139,332 •3,115 j1,361 I
35153152430
3.884717
1.474167
1.3053046401 ~n
1236.6121,2291,766' 816681672480
1, 5624, 9981,7281,372201
2, 392"28979199
2783,434
17213.820' 383265
3.413'371522
1916
65960
315873
5,3911,2581,721' 286
.803587
1,595173421
8, 3382,0783, 9052, 0731,2441.302' 552
2, 5124,4672.6092\ 040
' 6893,189
7793 048
124335
4,077233
17,057808719
5,2731,604
746
26835
135288
2,438499
1,116' 135
85921744312594
4, 605' 917
1.094' 563485553370
1,1883,5601,365
900176
1,52223963740
2142, 508
9110.313
317185
2,645294349
16,000 to 17,000.
1917
398 :36
242 :535 i
3,392 i710 I
1,067 |170 i484 !375 ',879 j
90 !249
5,143l)2052,1441,108
761745366
1,4842,7671,6021,085
4331.854' 458
1,643
2652,419'129
3 0,902523369
3,1931,006
483
1852877224
1,80334981210948518134971
3,
2,
1,
1,
oy229570727379336388243S52509976652120 -99917914134
16966473
498203
97S28235
Ui
O^T.(_)
J2OO
IE.
1 No returns were filed m these classes in 1916.
Digitized for FRASER http://fraser.stlouisfed.org/ Federal Reserve Bank of St. Louis
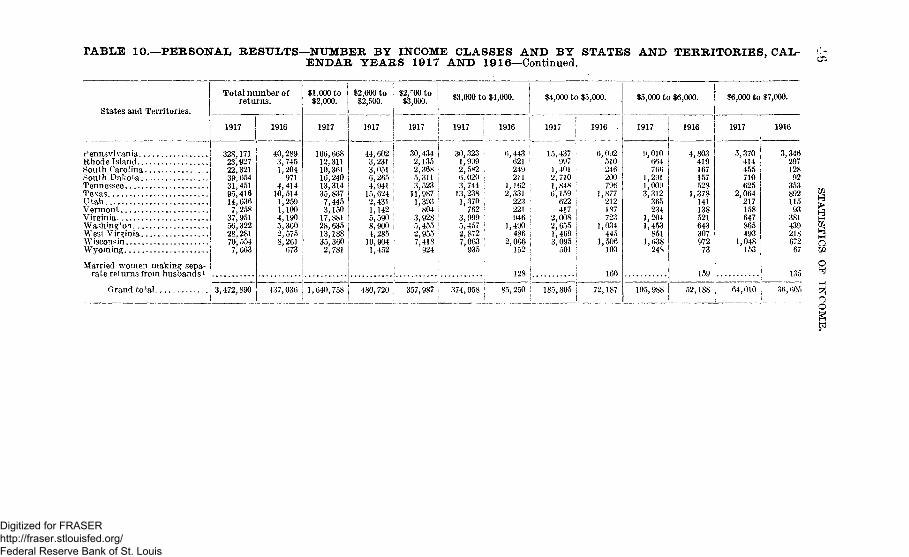
TABLE 10.—PERSONAL RESULTS—NUMBER BY INCOME CLASSES AND BY STATES AND TERRITORIES, CAL-ENDAR YEARS 1917 AND 1916—Continued.
Total number ofreturns.
States and Territories.
1917
PennsylvaniaRhode IslandSouth CarolinaSouth DakotaTennessee ITe^asUtahVermont jVirginia IWashington jWest Virginia iWisconsin iWyoming j
Married women making: sepa- jrate returns from husbands* <.
328,17123,92722,32139, 65431,45195,41614,6367,258
37,95156,32228,28170,5547,663
Crand total j 3,472,890
1916
40,2893,7451,204
9714,414
10,5141,2591,1004,1905,3602,5758,261
673
$1,000 to$2,000.
1917
166,66812,31110,36116,24013,31435,837
7,4453,150
17,88128,63513,18835,3602,781
437,036 1,640,758
$2,000 to$2,500.
82, "00 to$3,000.
1917 1917
44,6023,231 ;3,051 i6,2654,941 j
15,624 !2,431 !1,142 I5,590 I8,900 j4,285 :10,904 !1,452 i
$3,000 to $4,000. I $4,000 to $5,000.
1917
30,4342,1352,3685,3113,523
11,9871,393
8043,9285,4552,9557,418
924
i
480,720 ! 357,987
30,323 '1,999 '2,5K2 ,6,0203,744
13,238 !1,370 ,
762 i3,999 !5,457 '<2,872 :
7,063935
1916
6,443 !621 I249 '211 ;
1,162 !2,331 !
223 !221 !946 j
1,490 !486 I
2,066 |152 i
128 i.
1917
15,437 :997 ;
1,401 I2,710 ,1,848 j6,159 I
622 i417
2,0082,6551,4693,095
501
1916
$5,000 to $6,000.
374,958 ] 85,250 ! 185,805 ! 72,187
$6,000 to $7,000.
1916
4,803419167157528
1,37814113852164330797273
159
52,188
1917
5,370414455710625
2,064217158647865493
1,048153
64,010
1916
3,346297128923538921159338143921867267
135
36, tJOo
h4
o
ao
Digitized for FRASER http://fraser.stlouisfed.org/ Federal Reserve Bank of St. Louis

States and Territories.$7,000 to $8,000.
1917 1916
Alabama 270Alaska 17Ariz na 155Arkansas 361California I 2,351Colorado j 528Connecticut 709Delaware ! 100district of Columbia i 329
Florida ' 230Georgia ' 617Hawaii ! 88Idaho I 164Dlinois 3,570Indiana j 871Iowa i 1,241Kansas ; 730Kentucky ! 489Louisiana I 517
Maine | 271Maryland , i 909Massachusetts ; 2,028Michigan j 1,148Minnesota i 810Mississippi I 300Missouri • 1,268Montana I 278Nebraska ! 974Nevada * j 44New Hampshire ! 169New Jersey I 1,675New Mexico \ 110NewYork ! 7,770N >rth Carolina I 345North Dakota | 213Ohio I 2,310Oklahoma j 667Oregon \ 327Pennsylvania j 4,066Rhodelsiand J 295South Carolina 296South Dakota j 341
1251459
1491,250
241613
77325106230
6667
2,3004105043042362611P3632
1,892718448
7071813124022
1151,221
585.483
14381
1,311189174
2,552228
6054
$8,000 to $9,000. $9,000 to $10,000. I $10,000 to $15,000. : $15,000 to $20,000. $20,000 to $25,000.
1917
2032398
2591,641
364613
85247175404
63113
2,305596841450374394204758
1,602"806532208941187662
27119
1,27556
5,739253130
1,570434236
3,056214204229
1916 1917 I 1916 1917 i 1916 I 1917
1 In 1916 the net incomes are combined with husbandseparately are included in their individual income classes
1071050
11595419041367 |
237 j79 !
193 !53 I46 I
1 722 !341 I350196;180 I212 !112486 |
1,415 !541 i343 i
75 |575 !120 !203 !
16 i66 i
909 i32 ;
4,199 !102 I
56 i995 |140 !126 i
1,956 !168 I
60 I50 1
's returnsindepend
169 I7 !75 !197 I
1,235 j234 |461 |72 j
202 j114 ;311 j3664 i
1,764 !377 i
354 !262 !332 I155592
1,343642371162720149
759
3983
778151373
55141
571253323
1,313'288273145142161102336
1,159424272
59428
409 154 I27 ; 14 ;87 I 68 i
966 I 658 !56 i 26 j
4,731 ' 3,392198 1 94 !100 : 42 !
1,286 i 798 !321 i 104 |212 | 81
2,285 | 1,550 i190 | 135 !162 j 41 I149 ! 43 I
and in each case t reated as oneent of h u s b a n d ' s incomes.
41526
200472
3,298615
1,287200469329796 !113 !212 !
4.963 !i ; o i 6 J1.172 I
'821 ;
679 I787 |406 i
1,5303,8661,762 |l',059 i
388 i1,951 I
339 |855 |52 I
257 |2,645 I
135 I13.285 I
'439 |203 i
3,675761 I430 i
6,468 I570 !341 !239 |
235 i24 (
no !214 I
2,067 ;541
1,114 '139 i591 l
194345106 ;
76 :3,679
'688 !
670408410 i475 ''296 !
1,023 !3,439 ,1,297 :
743 j176 I
1,295 !204 :
384 i23 i
167 ;1,985 j
55 !9,810 ;
227 !107 i
2,366 !285 i245 i
4,551 ;454 .;
126 i
1916 i 1917 i 1916
1573
83165 I
1,445277619
86250111324
6256
2,340439411351265417163655
1,850794 '451210925127
1063598996326558280 ;
277 |66;
163 |66 ,!38 !
1,816 !333 |269 !160 i197 j246 j125511 !
1,680660 I372 ;104 ;625 !
$25,000 to $30,000. £30,000 to $40,000.
1917 1916
18 j108 I
1,172 :
52 i6,686 •
16871 i
1,717'324
1733,049 i
274 i131 !74 i
659 ;26
4,037101
28969174124
1,735131
7328
re tu rn in its proper income class.
154 i13 !93 !
988 i37 i
5,418 I1 1 3 ;
53 I1,179 i
155 '106 I
2,337 i230 I66 I32 l
80 i2 !
40 i87 j
803 i140 I325 i57 i
118 i63 I162 !40 I38 I
1.209 I'227 i197 !1S9 I175 !191 !96 !
396 i1,103 I
446 I283 ;119 i454 i59 !164 j
Aft I
51 i2 I
27 :50 |
531 |137 !299 !
53 j16050 ;95 !34 I19
1,018 |160125
9411713493
3481,001
377214
55354
6493
742
51218
3,2543520
6987149
1,384139 !
19 |1 3 I
1917 the
413 i
29 i70 i
438 i84 t
224 ;3489 !35 i94 |36 |12
785 !144 i129 !9292
13057
231 \683 j268 !16965
2944495 '
29.438 ;
13 >2,691
5615
601114
49 ;1,091
96 i4618 ;
1917
412
2022
33665
210348525 I40 j35 !
605 I108
7744457746
19366620611631
22436434
28311
62,178
4110
4635035
827861111 1
1916
5732550534100257468834100352998916810611111615166285906353202573404388943496212398816735120574271294117
195322338510327836105196041117601081015861995321781533215327283377054237614
2,80038144905632
1,104132914
returns of married women filed
Digitized for FRASER http://fraser.stlouisfed.org/ Federal Reserve Bank of St. Louis

TABLE 10.—PERSONAL RETURNS—NUMBER BY INCOME CLASSES AND BY STATES AND TERRITORIES, CAL-ENDAR YEARS 1917 AND 1916—Continued. 00
$7,000 to $8,000.States and Territories. |
j 1917 ! 1916
$8,000 to $9,000. | $9,000 to $10,000. i $10,000 to $15,000.
Tennessee i 463 \Texas j 1,478 jUtahVermontVirginiaWashingtonWest VirginiaWisconsin 'Wyoming '<
Married women making ,separate returns from ;husband 1 i
141 i91 S
485 ;578 !361 i705 I110
264732
7176
259273174481
44
136
3161,020
105
329394261493
84
180 j507 l
56 ;50
180 :237 :114347
28
228748
268 I303212 !433 j
71 j
Grand t o t a l . 44,363 I 26,580 31,769 ( 20,086 , 24,536
$15,000 to $20,000. $20,000 to $25,000. $25,000 to $30,000. $30,000 to $40,000.
1916 1917 I 1916 ; 1917 1916 1917
175 j462 171 ;42191203 ,158354 !36 i
156367422917016914725541
121254422110210288189IS
87 !240 |272895 j9278 !
173 |29 i
559 i
591432424607043
12310
543
16,804 i 13,512 ! 10,573 | 8,598
j $40,000 to $50,000. ! $50,000 to $60,000. j 8(10,000 to $70,000. ! $70,000 to $80,000. J S80,000 to $90,000. j 1?io'n 000°
States and Territories. i
' 1917 i 1916 1917 1916
AlabamaAlaskaArizonaArkansasCaliforniaColoradoConnecticutDelawareDistrict of Columbia.FloridaGeorgiaHawaiiIdahoIllinoisIndianaIowa
35 16
19 j1 8 I
3 1 1 ;50 !
154 123 !5 2 i15 !53 ;20 |
4 i518 !
98 |60 !
212 i49 '
140 i28 !5 9 :12 126 j22 1
6 I470 i
48 !34 j
66
17935
10720241229136
3395536
I1917 j 1916 i 1917 i 1916 ! 1917 1916 1917 I 1916 ; 1917 ' 1916 ;- I
3194
13234942031419181
2383526
9246
119187481891062
2092818
4 !2 I
84 i19 ;65 ;16 !23 !5 '.9 i
12 i3 !
201 !35 !:12 1
6 j86 |10 !39 I1 2 i
%
2 j1363320 I
2 i
3 ;2 '
5 1 I22
il17 i
3 i1 0 I
12316
5014 |23 !
3 |
2 I9 :
101
1041510
11
499
234
154672
1241111
2 0 |
11 j1 |6 !4 j
"162"!11 I
24
912666262769145
2453012
88 !2 2 '•
62 I15 !37 \2 i
A\2 i
231 !25 j10 i
1916
95261
2330
11697
11118934
1592921787552
14516
825 H
12,733 10,893
$150,000 to$200,000.
1916
1413710261013213275121
2
307301117
412187162
Digitized for FRASER http://fraser.stlouisfed.org/ Federal Reserve Bank of St. Louis
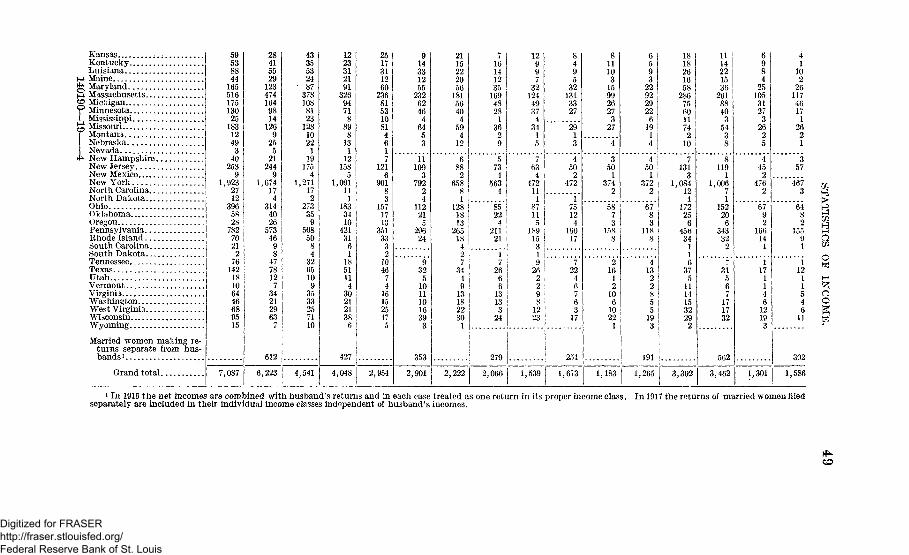
KansasKentucky.Luisiana
M Maine..^ MarvlandM Massachusetts...s© MicniganY Minnesota. . . .1 Mississippi^ Missouri...| Montana
Nebraska.. ..! Nevada*>• New Hampshire..
New JerseyNew Mexico ...New YorkNorth Carolina .North DakotaOhioOklahomaOregonPennsylvania ..Rhode IslandSouth CarolinaSouth DakotaTennesseeTexasUtahVermont . .VirginiaWashingtonWest Virginia.WisconsinWyomingMarried women making re-
turns separate from hus-bands1
Grand total
59538844
16551617513025
18312493
40253
91,923
2712
3965828
7827021
276
14218106446689515
7,087
28415529
1234741649814
1269
255
21244
91,674
17
3144026
57346
98
477812
734212963
7
612
6,223
43355324
' 873781088123
1281022
119
1754
1,271172
273
150850
843265109
3533257110
4,541
1223312191
32694718
898x?
12158
51,091
111
1833410
42131
61
1851114
30212138
6
427
4,048
2517311260
23681531081461
1216
9018
1571713
35133
32
1046
74
161525475
2,954
914331255
2326246
46453
11109
3792
24
112
2529624
932
510111016393
353
2,901
2115222056
1815640
459
412
688
2658
81
1281813
26518
427
3449
13182230
2,222
16141235
1694828
13629
573
5634
8522
4211
21
i7
2666
13133
24
.
2792,066
12
53^l$i3l3?5
634
47211
18711
18915319
262298
1223
8495
321313327
2913
450
2472
175124
16017
722
46
63
17
|
!! 251
1,539 1,673
g11103
15992627
327
4
350
I374
2
5873
1588
216
12
106
1022
1
1,183
A593
22922922
61914
450
1372
6783
1188
413
22805
193
191
1,265
1818261658
286756011742
10
7131
1,08412
117225
645634
116
375
1114153229
2
3,302
i i14221536
2618840
35438
8119
11,006
71
15220
6343
322
3156
171732
562
3,462
6984
251053127
32625
4452
4762
67Q
2166
141
117
1146
12193
1,301
41
102
2611746171
2621
357
4673
6482
15591
L ?54Q
11
302
1,586
a
oo
* 111 1916 the net incomes are combined with husband's returns and in each case treated as one return in its proper income class,separately are included in their individual income classes independent of husband's incomes.
In 1917 the returns of married women filed
CO
Digitized for FRASER http://fraser.stlouisfed.org/ Federal Reserve Bank of St. Louis
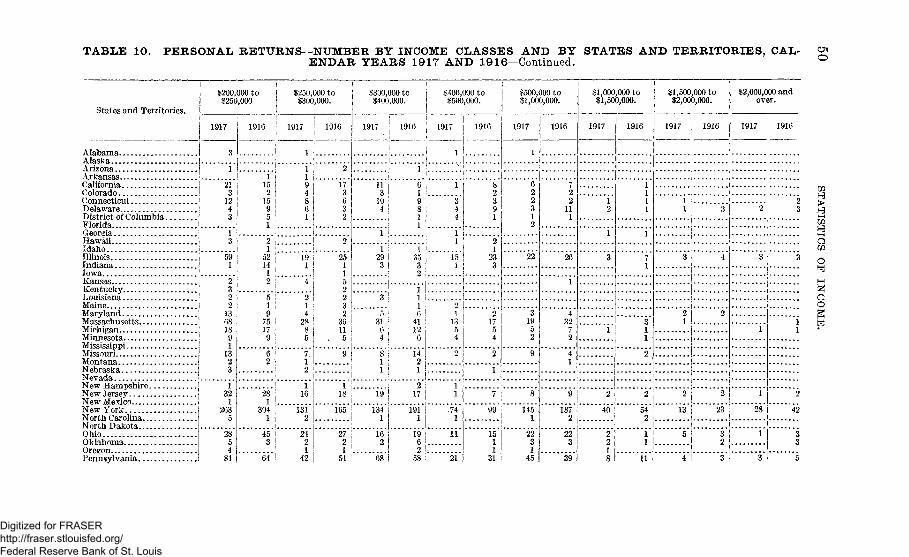
TABLE 10. PERSONAL RETURNS—NUMBER BY INCOME CLASSES AND BY STATES AND TERRITORIES, CAL-ENDAR YEARS 1917 AND 1916—Continued.
en
o
States and Territories.
Alabama .Alaska . . .ArizonaArkansas . .CaliforniaColoradoConnecticut.DelawareDistrict of ColumbiaFloridaGeorgiaHawaiiIdahoIllinoisIndianaIowaKansasKentuckyLouisianaMaineMarylandMassachusetts . .MichiganMinnesota ..MississippiMissouriMontanaNebraska
New HampshireNew Jersey . .New MexicoNew YorkNorth Carolina.North DakotaOhioOklahomaOregonPennsylvania
$200,000 t o$250,000
1917
3
•j
213
1243
3
591
2322
13681891
1323
1263
5
2854
84
1916
1152
15951
2
5214
1
519
7517
62
28
3041
453
64
i$250,000 to
$300,000.
1917
1
1194
6
19
4
214
28$
7
2
16
1312
242
42
1916
2
173632
2
25
15
232
3811
. 5
9
1
165
2721
54
!$300,000 to
$400,000.
1917
113
104
1
1293
3
531
(34
811
19
1341
162
68
1916
1
(319811
135
2
i11(3
41126
1421
217
1911
1962
58
$400,000 to$500,000.
1917 1916
1
1 *
o239
1 L-1 ' 2
! 715 93
1 ' 3
21
13
4
2
11
-74
11
21
o1754
2
1
7
99
1511
31
1$500,000 to$1,000,000.
1917
1
622312
22
31952
9
oo
146
1145
1916
~r
22
111
26
1
432
72
41
9
1872
223
39
$1,000,000 to$1,500,000.
1917
12
1
3
1
2
40
2218
1916
1111
1
1
311
2
2
542
)
ii
$1,500,000 to$2,000,000.
1917 1916
ii
11 3
3
2•i
13
5
4
4
2
2
23
32
3
$2,000,000 a n dover.
1917
: : : : : : : : :
2
3
i
l
28
1
3
1916
23
3
11
2
42
33
5
Ho0
oog
Digitized for FRASER http://fraser.stlouisfed.org/ Federal Reserve Bank of St. Louis
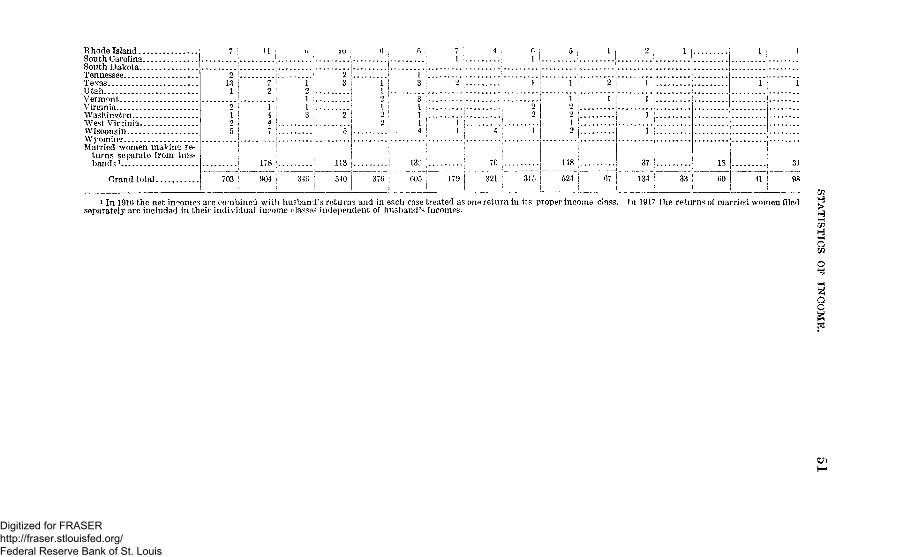
Rhode IslandSouth CarolinaSouth DakotaTennesseeTexasUtahVermontVirginiaWTashin°rtonWest Virginia-Wisconsin
Married women maMng re-turns separate from hus-bands l
0rand total ,
2131
2125
703
n
72
144
178
904
\>
12 !..1 ;I L-3 |
346 ii
LV
2
2
5
113
540
ft
1
I29-'
376
fi i
t i . .Q ;
3 •I ! . .] i
1 -4 !
133 L.
005 1!
1 ;
;2 ' .
I! i
I
179 |1
4 ;
i . .
!
4 i
76 ;..
321 1
fi1
1
22
I
315
O i
!
i j
. . . . . . . . . i . . .i !2 1 . .211':;2 L .
!i i
| ; " * '
1 524
1
2
1
67
2
1I ,;
i i
j !
1 I - -
37 L .
134 !!
1
33
j
ij
18
60 41
|
1
31
98
1 In 1916 the net incomes are conbinel with husband's returns and in each ease treated as one return in its proper income class. Tn 1917 the returns of married women filedseparately are includad in their individual income classes independent of husband's incomes.
H
8o
j
I
Digitized for FRASER http://fraser.stlouisfed.org/ Federal Reserve Bank of St. Louis

52 STATISTICS OF INCOME.
TABLE 11 .—PARTNERSHIP RETURNS—DISTRIBUTION OF RETURNS,BY STATES, FOR THE UNITED STATES; showing the number of ieturns ineach State and the amount of tax.
[Returns filed for the calendar year 1917.]
States and Territories.
AlabamaAlaskaArizonaArkansas . . . . .California *Col orad o . . . .ConnecticutDel aware . .District of ColumbiaFlorida .GeorgiaHawaii . . *.IdahoIllinoisIndiana . . .IowaKansasKentuckyLouisianaMaine . .Maryland . . . .MassachusettsMichiganMinnesotaMississippi .. .MissouriMontanaNebraskaNevadaNew HairiDshireNew Jersey .New Mexico .New YorkNorth Carolina .North DakotaOhioOklah omaOregonPennsylvania - -Rhode IslandSouth CarolinaSouth DakotaTennesseeTexasUtahVermont - . .VirginiaWashingtonWest VirginiaWisconsin .Wyoming
Total
Number of returns.
Total.
1902177
243720150
1,00572
238222298
1425
1,590640831267274644167552
1,94371544616363142
18317
109648
517,772
23529
1,515318242
5,116372303
533236702272
24933438246234
31,701
Taxable.
1888
7724271814616738
11389
2491424
1,589301302262197406
81299
1,444324203167308
40143
1753
31451
3,56016828
820310104
1,80764
15551
3236662134
231150176200
33
17,475
War excessprofits tax.
$503,93417,690
179,344496,948
2,516,749287.438926,041471,367644,270196,263814,638342,890
36,4065,654,370
939,354444,365495,535516,213
2,679,449515,986
1.824,892IS', 396,407
976,2611,102,810
497,525826,179
62,149215,737
42,223331,789
1,305,415121,518
32,227,563663,10326,492
5,189,6681,330,178
359,01912,534,720
454,667322,90S
45,3611,239,3442,728,550
37,289228,765672,468440,595452,225433,401
64,513
103,887,984
Digitized for FRASER http://fraser.stlouisfed.org/ Federal Reserve Bank of St. Louis
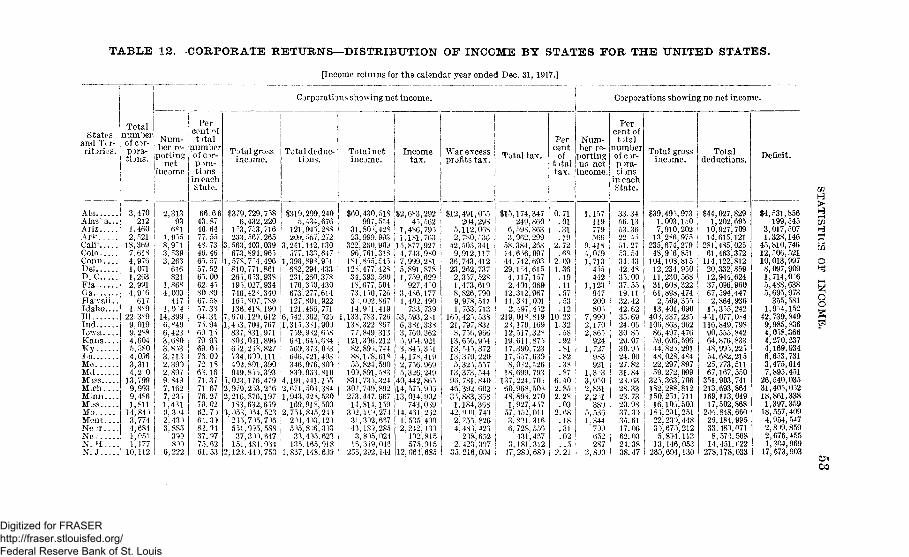
TABLE 12.—CORPORATE RETURNS—DISTRIBUTION OF INCOME BY STATES FOR THE UNITED STATES.
[Income returns for the calendar year ended Dec. 31, 1917.]
Corparations showing net income. Corporations showing no net income.
Percent oft>tal
number'of cor-p>ra-tims
in eachState.
66.6643.8746.6477. 5548.7346.4665. 5757.526"). 0062. 4180.8967. 5857.3364.3175.9469 1579.9369.0)76.0372.1863.1671.3771.6776.2779.0262.7)61.3182. '1437. 9775. 62
£3796
1"3233
3,563673
1,578810265,195,74616)138,
7,676I,4i3,
837,8036)2734402949
5,0232,9792,216
1S33. -)53
2]5;551
37151
61. 53
Total gross | Total deduc-incjme. tijns.
2,123.
729,758432,220753,716567,265
,403,039894,9657 "4,496771,8616 "13,938027,934
,423,340807, 789418,190120,612704, 767831,971
,011,896238,827631,111801,3908)5,393
,176,479,253,276876,197632,619134,523
7)5,715915,5SS311,61748 U 934441,753
$319;
! 121;i 209,3,241,
1,3%!i 682,I 231,I 176,I 673,i 127,i 121,'6,542,1,315,i 759,I 631.! 569,! 646,! 346.i 839,4,191,2,671.1,943,
169,2, 754,! 2)4.I 5)5:i 33.; 13.T1,837,
299,240434,676941,238567,272142,130133,647898,9"1294,433260,3783 ".0,430277,614804,922466,771362,5263>l,903932,6)8645,684373,0^3421,493976,801933,810441,115503,384423,530918,503815,2414)3,121815,313415.623165,918148,619
Total netincjme.
Incometax.
War excessprofits tax.
$60,430,997,
31,80?,23,999,
322,260,96,761,181,855,123,477,34,393,18,677,73,110,3 ;, 012,14,9U,
,133,783,133,322,77,849,121,396.82,89)!88,178',55,824,103,891,831,735,307,749,273.447,14,814,3)2,11),31,312,43,181,3,8)5,16,319,
253,212.
518 !S2,
428 !993 i901318 j541 j423 i560 '504 !
726 |867 I419'26
867313212?44
613590583324892687159274687285024048144 12,
6«3,29241,562
486,7951SI,763877,927743,9SO999,231891,878759,629927,4 "0436,177402,490733,739593,2-1381,338760,362914,921841,3 U178,419716,969326,249442,865575,903014,902743,039431,232535, 490242,131192,815575,915064,685
$12,491,015204,298
5,112,0882,780,-3G
42,503,3419,912,117
36,743,41223,262,7372,317,5281,473,6198,826,7909,978,5111,763,713
165,421,53821,797,8318,756,966
13,656,91413,541,37213,379,2205,321.557
13,373^54498, 781,84048,392,60235,883,368
1,184,36842/) 10, 74)2,?55,8264,483,425
238,6522.423,397
35,216,004
$15,17'174,347249,860593,863962,299384,268616,097742,6931-4,615117,157401,069312,9673S1,O31497,412018,819179,169517,328611,871390, 723557,6390^2,526699, 793224,70)968,503893;270927,417452,011891.316728, 558431,487181.312283', 683
Percentof
t)tal
Num-ber re-
portingno net
tax. lincome.
0.71.01.31.19
2.72
Percent oftrial
numberof c )r-p >ra-ti.ms
in eachState.
- o !
2.091.36
.19
.11
.57 !
.53 i
. 1 2 j10.23
1.32 |.58 !.92 !.81 i.82 I.38 !.87 I
6.40 !2.85 i2.28 I
. 0 9 I2.68.18.31.02.15
2.21
1,157119779566
9,4184,0791,713
415442
1,12394720080 i
7,9902,1702,861
9241,727
983921
1,3 ;33,9102,8312,2 1
3805, 5361.344'719
652287
3,8.10
33.3456.1353.3622 4151.2753.5434.4342.4831.0037.5519. 1132.4242.6235.6924.0830 8520.0730. 9124.0027.8231.842 i 6 328.3323. 7320.9837.3135.6117.0662.0324.3838. 47
Total grossincome.
$39,495,9731,003,1507,910,202
13,286,975235,674,279
48,9:6,851104,103,815
12,234,95011,230,56831,608,32261,893,474
2,509,35513,401,090
403,337,235106,863,96286,497,47659,606,59644,825,29148,028,48422,297,89759,272, 099
325,363,706182,288,812150,211,711
16,105,503183,211,25122,231,44831,671,2125,834.113
13,146,053280,604,130
Totaldeductions.
$44,027,8291,202,695
10,927,70914.615,121
281', 485; 02561,463,372
114,122,81220,332,85912,944,62437,096,96067,594,447
2,864,93615,315,242
411,077,054116,849,79890,555,84264,876;83348,995,22554,682,21525,773,51167,167,550
311,903,741213,693,864169,113,049
17,502,8682-)4,848,660
23,184,99533,481,071
8,571.56814,451,022
278,178,033
Deficit.
$4,
3,1,
45,12,10,
8,1»5,5,
1,42,
9,4,4,4,6,3,7
26',31,
531,199,017,328,810,506,013,097,714,488,695,355,9"4,739,985,018,270,169,653,475,895,
8565455071467465219979090 6638973581152849836366237934731614451
540,035401,
18,861',1, 397.
18, 557,4,2,2,1,
17,
954,8)9,676,3^4,•573
012338359409547859
,455969
,903
UiHHUiH1/2
O
5QQBBJ
CnCO
Digitized for FRASER http://fraser.stlouisfed.org/ Federal Reserve Bank of St. Louis
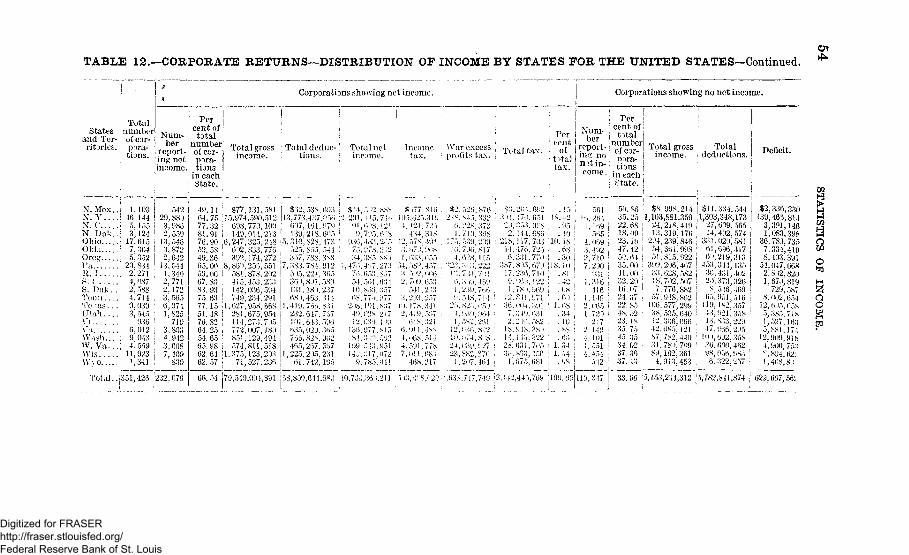
TABLE 12.—CORPORATE RETURNS—DISTRIBUTION OF INCOME BY STATES FOR THE UNITED STATES—Continued,
Statesand Ter-ritories.
N.Mex..N. Y. . . .N. eN. Dak..OhioOklaOre?raR.IS. VS. Dak. .TennTec a s . . .Utah
VaWash....W. Va . . .WlsW y 0
Total..
Totalaumberof cor-pora-tions.
1,10346,144
5,1553,124
17,6157, 3645,352
20,8342,2714, 0872, 5884,7149,0393, 545
6,0129.0434, 559
11,9231,341
351,426
1
Num-ber
report-ing netincome.
54 229,88)
3, 9862,559
13,5463, 8722,642
13.5441,3492,7712,1723, 5656,9741, 825
3,8034', 9423,0087, 469
839
232,079
Percent oftotal
numberof cor-pora-tions
in eachState.
19.1164.7577.3281.9176. 9052. 5849.3665.0059.0067. 8')83. 9375 6377. 1551. IS
64 2554 6565. 9862.6162. 57
66. 1
To ta l grossincome.
$77, 131.58115,974,590,512
608,770,100149,014,213
6, 247,325,2 IS6)2,8 53,7763: )'\ 174,272
8. 8'j), 256, 551581.87S. 2024 i 5, 453, 233142,036,594710,234 2Q1
,627,95S,66S2S 1,675,954
772,007, ISO851,129,491571.8L1.5I8
1 s 373,123,2 137i, 527. 236
79,540,004,891
Corporations showing net income.
!
Total deduc- !
tions.
i3,773,-1:7,."56 ,6)7, 161,07')139,21S.6:V> '
5,310,82s, 173525. s:->~>, 544357, 788. 3M
7,383.781,012 '5)5 . 221. 3t')5 !3f>),S.M 5S<) '131,18), 23768 1,463.31 1
I, 1!9,766.S}1232.617,737
635.020 .5057t)'j, Si11-* 002465,267.567
1.225,2)5.23!61,742, 195
'.8,S)9,644.68,,'
Total netincome.
•SI 1,.". ,2..v>_',201, ! 15.7
91 ,6 IS ' .(} 7 \ ) f,
O3'\ is:',, 2.7.i "7s ';
31,3S-> s
7o 65"? v/") j . -, ; j (;••>
if),s.)') ;\~6^ .77 i.:'7
2 0 N . 10! . v.
1'>.(V_!>.2-
1O[>.'.J77.Ms I . : : , ! .,•
109. .".{?.*:.'1 J. .'. i *~. * *T
|
s
• )
J
717777
-• >1;!
1
1
Incomet a x .
8 >77i ) 1.625.
! ' 2 !
12. 57 s,•>. u~,i.
!. 63."<,' U , 5 V > .
->> ."i VJ2.7i)l).
51 i,3, 2' '3,.
!'). 17s.2.119.
6.0J !,1, ''!'>,4. 5 9 1
sMi31'J
J,|s
<, \
157\> n\>53
257S f •>.7
v-">! !"7s
7 , 0 ! l .MX ,
Itis.i
5;::,i; s
>I7
'2:
War excessprofits tax.
82. 526 8762»s, s-i") i\,vj
i!1..'.'2s 37;,i. 71') 368
'.75.530.209, ( / ) 7 t , t ; y,[7
1.6,!8. 1 15>-•>.."it;; 222
6.35'< It)1.'1. 2 >!' 7dt)! . 518 71}
2 5 . ^.'> i,'5 1! . ( 10 ,061
10 ;,7i, s s2 ) . i.',:][\; 272 3 , WS2. [)7C
1/2)7. 161
,<'i*\ 7 17,7-40
' Total tax.
s".1 % . ' i
•_ i
2218
l l(i
3s7179i
!236
'
! Xj ;
2*i.
, 3.51
-\l \1
2-, l,!7 '353.U4.1 i7,476.331.S <5,23!'>." . ' • j .
7s i.^ 1! ,004.310.
HV
631,
!)/.),
. i . - ,
(V. 2(\'A0; "<.68670372577067.)710122069'J71391»W1
"s )o227t '5
6S1
769
Percent
i O f
trta]tax.
, , -! s. 42
. 95i . 10L(>. IS
. 6S1 .3018.10
. 81
. 42
. i * >
. fi )1. ,'N
.:u
. 60J. •) 1
1 I 41
loo. (•:;
Num-ber
report-ing non^tin-
561
1. ! >\95t>5
i i)t)9
3 . IV22 . 7 1 07. 2 )()
9311,316
1161. ! 192. U''\.~)1. 72 >
2 U 91. Mil
i . ^n I4.454
5 12
i !'*,:: \7
Corporations showing no net income.
Per! cent of, totalnumber: of cor-
pora-tions
in each:State. |
5'). St)35.25 122.6818.09 '23.1047.12 i5). 6135. 0011.0032. 2016 0724 3722 S548. 52
35 754^> .'„')34.0237 X637. 13
S3. V>6 ,
Total grossincome.
SS, 998. 214,163,S81.35921,2iS13,319
2 J 1,23954.36151, Si 5
V. 10. 29633.62818 7O'>7.776
.)7,9!s,106,577,
j ' ) ' • • . u > '
12,085,87. 7>2,3J, 7s >;*<>, 162,
1.918,
153,2}]
4191768469V8922467582:>> )7882M»2299610
1214107'H)
361153
i
Totali deductions.
$111,301
2714
331616 )
453362)s,
6.)119
1 •>'
17.1 1 J i ,
;->6.
vs,6,
331,541,348,1736 )9,565402,574020, 5816.)6, 1172J9,:?I3311, 135131,402373, 3265 )6; 469951,516!s2,357921.358
i'66,2.'56J2,3586;)0, 46205b, bb-j322,257
,811,874
Deficit.
S2L39
31
3f)7
s
33616)39108378)334103
51,04721
,si2•>;
,'/12,
4,
1,
62J,
iS )2 ,
670729,002,6 )5,3s5,
SS1 ,909,000,\)4,4r,.s,
6';7,
330814146398735419391668820819587654
7Js
171
75;-!62:8 )
5b;
STA
TE
Ma)_oo%
Digitized for FRASER http://fraser.stlouisfed.org/ Federal Reserve Bank of St. Louis
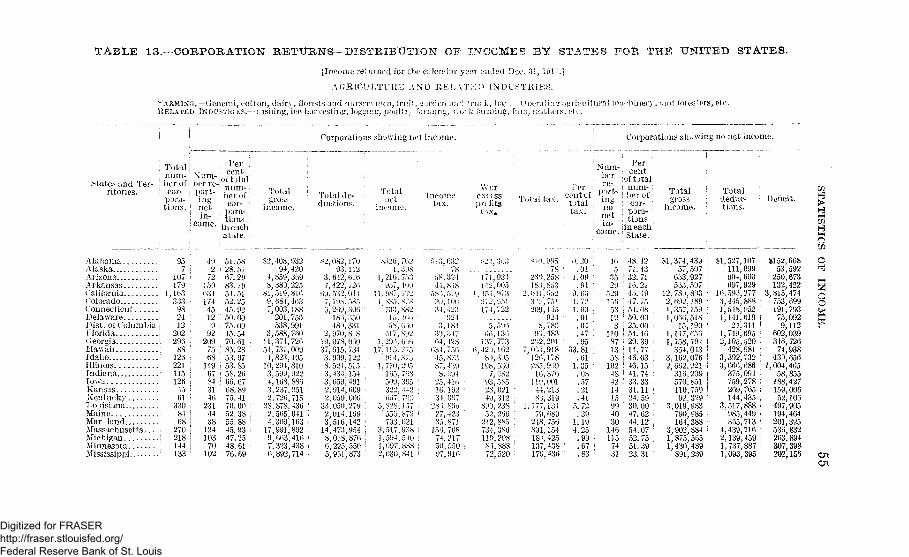
TABLE 13.- COKPORATION RETITRNS DISTRIBUTOR" OF r>T f J 0 M Ec By STATES T;O?v THE UNITED STATES.
n".>n e r e u m d for t >n> o . i V ' d i r \ v> i -Uvi^a !K"
\ ( ; m a s / n i i 1 : w o I J K I U \ :> I X D J ^
K l L V I L I '
; Total i
o n , d a i i \ , f l o r i s t s i n d MU? - T u ( j i , ( n 'i s h i n g , H p ha i \ t "5 t i i iC r , lo<r.:i"C, D o a l t i i ig . ? o k ). .1 incr, !• T •>, 1. 'it 1 u \ i
I'erJLULU1 ! ; c e n tj n u m - ! N u m - L f * ' + „ ! ;
S t a t e s a n d T e r - I b e r o f i h e r r e - j 0 ! ; ? ™ :r i t o r i e s . ! c o r - j p o r t - i ^ u
tm " f : T o t a l
g r o s scor- ! port- ; £ u m
f :pora- ; ing o e ; m ,
I come ;I come. it b n s
i n e a c hstate.
A l a b a m a I 9 5 ; 4 9 : 5 1 . 5 8A l a s k a : 7 i 2 | 2 8 . 5 7A r i z o n a ' 1 0 7 i 7 2 ; 6 7 . 2 9A r k a n s a s 1 7 9 I 1 5 0 8 3 . 7 9C a l i f o r n i a 1 , 1 6 3 6 3 4 : 5 4 . 5 1( C o l o r a d o i ' 3 3 3 < 1 7 4 5 2 . 2 5C o n n e c t i c u t j 9 8 : 4 5 ; 4 5 . 9 2D e l a w a r e ! 2 1 1 2 ' 5 0 . 0 0D i s t . o f C o l u m b i a j 1 2 9 •• 7 5 . 0 0F l o r i d a j 2 0 2 9 2 •, 4 5 . 5 4G e o r g i a i 2 9 . 5 2 u 9 7 0 . 6 1H a w a i i •; 8 8 7 5 8 5 . 2 3I d a h o 1 2 6 i 6 8 5 3 . 9 7I l l i n o i s 2 2 1 ; 1 1 9 i 5 3 . 8 5I n d i a n a 1 1 5 I 6 7 i 5 8 . 2 6I o w a 1 2 6 | 8 4 ; 6 6 . 6 7K a n s a s 4 5 | 3 1 6 8 . 8 9K e n t u c k y 6 1 i 4 6 7 5 . 4 1L o u i s i a n a 3 3 0 • 2 3 1 7 0 . 0 0M a i n e 8 4 j 4 4 5 2 . 3 8 :M a r l a n d 6 8 ! 3 8 5 5 . 8 8 ;
M a s s a c h u s e t t s : 2 7 0 [ 1 2 4 4 5 . 9 3 :M i c h i g a n i 2 1 8 j 1 0 3 1 4 7 . 2 5 ,M i n n e s o t a ; 1 4 4 j 7 0 j 4 8 . 6 1 IM i s s i s s i p p i ! 1 3 3 ! 1 0 2 ' 7 6 . 6 9 i
§2,408,93294,420
4,859,3698,380,22581,519,81G
9', 68^,4637^003,188 :'201,758 :538,991 ;
3,588, 76011,374,72654,731,0094,823,495 .10,294,8103,599,922 '4,168,886 ••3,237,051 '2.726,715 -
38,878,436 '2,565,041 i4;309,163 •
1 7 , 9 9 1 , 8 9 29 , 6 6 3 , 4 1 6 17 . 3 2 3 , 4 3 8 i6 , 8 9 2 , 7 1 4 .'
Corporations showing net income.
Total de-ductions.
03,.612,
4S),,970,,078,,615,,909.,52l',, *3t., (55i»,,911,.059,.OoO,, ni 4,,516.,473.,0lis.,225^,961,
112616
33J8 b!)W731122:,!.')lot191(509
2.9l'o911295187t)550873
Totalnet
income.
9 5 7 , t (h>
. 1 ] .">' • ] 1 ,
.770
t , 1 1 ,
V 7 5
'', 7').)
55),'7J3,(
,517,<,501,.,007,:,030,;
Incometax.
M o . 6 3 ;
: ^ . : ^44!,:s,H
.;i.-2.j
5 >.
Hi.31.1
S 7 3
4 Ji)
:-9j410
87i7(8217550916
Wcrexcesspnfitstax.
171,9311 !L',OI»)
, 1.V..M73_'. -\ > 51171,722
"j, 'tin• •.», 1 3 ' )
137,773.. 1 2 ) , 1 6 2
28.02119.312
S i ) 2 3 S
212,8 V,731,3 S6i 1 ()', 20S
S i, >,8S72,520
Total tax.
2 3 ' ) , 2 5 81 8 J , 8 5 3
2 , 0 1 1 , 5 5 23 ' ) * / , 7 5 /2 0 9 , M 5
9 2 4S , 7 8 0
9 . . 4 8 32 0 2 ; 2 0 1
7 , 0 5 4 ^ 9 1 81 2 6 , 1 7 8
2 S 5 , 9 o 91 6 , 3 7 6
1 1 9 , 0 0 14 4 . 2 1 38 3 , 3 1 9
1 . 1 7 7 , 1 3 17 9 ' , 6 8 9
2 4 8 , 7 5 68 9 1 , 1 5 41 8 1 , 4 2 51 3 7 , 4 3 81 7 0 , 4 3 6
!:>! i>' » 'iiner.' , .mi foresters, e t c
I ' e r
Corporations showing no net income._ _ _
• _,^vf ! num- ;; J^~ \ her of
I Z I P'S- !; ^ C ; tions ,L m " jineach:i come. Q f o f o ,
Totalgross
income.
0 . 2 0 :. 0 1
1 . 0 9. 9 1
9 . 6 3 :
1 . 7 21 . 0 0
.oi ;
. 0 4 '
. 4 7 ;
. 9 53 3 . 8 1 i
. 6 11 . 3 5
. 0 8. 5 7 '. 2 1 ;
. 4 15 . 7 2
. 3 91 . 1 94.25 :
. 9 0 '! . 6 7
. 8 3
i 4 8 . 4 27 1 . 4 3
! 3 2 . 7 12952915953123
110871358102484214159940301461157431
! 16.45.
j 54!! 50.| 25.! 51.i 29.! 14.i 46.
21497508000046397703
i 46.15I 41.i 33.; 31.24.' 30.: 47.i 44.
74331159006212
1 54.07! 52.i 51.
,75,39
1 23. 31
S I , 3 7 4 , 4 3 9 !5 7 , 5 0 7 !
6 5 3 , 9 2 7 I5 5 5 , 5 0 7 '
1 2 , 7 8 0 , 8 0 3 ;2 , 6 9 2 , 1 8 9 i1 , 3 5 7 , 1 5 9 !1 , 0 5 6 , 5 1 8 !
1 5 , 1 9 9 !1 , 1 4 7 , 6 5 6 11 , 7 5 8 , 7 9 4 i
3 5 4 , 0 4 3 I3 , 1 6 2 , 0 7 6 !2 , 6 6 2 , 2 2 1 I
3 1 6 , 2 3 9 I5 7 0 , 8 5 1 !1 1 0 , 7 5 9 !
9 2 , 3 2 9 '3,019,983 :
790,985164,388
3,902,884 !1,875,565 i1,430,489 !
891,239 '
Totaldeduc-tions.
SI, 527,107 :111.099904^600697,929 ;
16,595,2773,445,8881,548,952 ;1,141,610 {
24,311 I1,749,695 !2,105,520428,981
3,592,7323,666,686
375,094759,278269,765144,435
3.517,888'985,449365,713
4,439,7162,139,4591,737,8871,093,395
Deficit.
$152,66853,592
250,673132,422
3,815,474753,699191,79375,0929,112
602,039346,72674,938
430,6561.004,465
58,855188,427159,00652,108
497,905194,464201,325535,832263.894307; 398202,156
wo
o
Ox
Digitized for FRASER http://fraser.stlouisfed.org/ Federal Reserve Bank of St. Louis
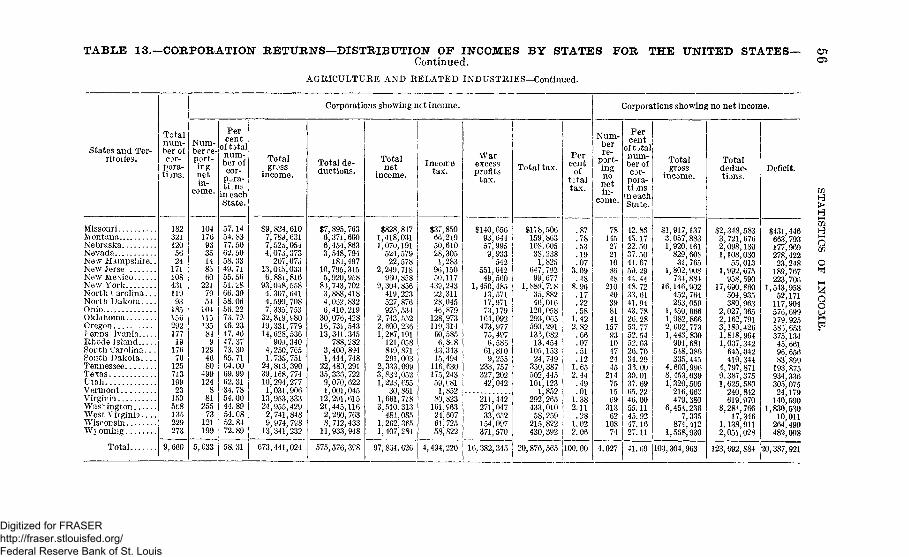
TABLE 13.—CORPORATION RETURNS—DISTRIBUTION OF INCOMES BY STATESContinued.
AGRICULTURE AND RELATED INDUSTRIES—Continued.
FOR THE UNITED STATES- Cn
States and Ter-ritoiies.
MissouriAi ontanaNebraskaNevadaNew Hampshire..New JerseNew MexicoNew YorkNorth Carolina...North DakotaOhioOklahomaOregonFenns IvaniaRhode IslandSouth Carolina...South DakotaTennesseeTexasUtahVermontVirginiaWashingtonWest VirginiaWisconsinWj oming
Total ...
Totalnum-ber ofcor-
pora-tions.
1823211205624
17110843111993
185156292177
19176
70125713199
231505fc8135229273
9,660
Corporations showing net income.
Num-ber re-port-ingnetin-
come.
1041769335148560
2217954
104115135
8l129
4680
499124
881
25573
121199
5,633
Percent
of totalnum-ber ofcor-
pjra-ti.ns
in eachState.
57.1454. 8377.5062.5058. 3349.7155.5651. ii866.3958.0656.22TS. 7246.2347.4647.3773.3065. 7164.0069.9962.3134. 7854.0044.8954.0852. 8472.89
58.31
Total, grossincome.
$9, 824,6107, 789,6317,525,0544,073,373
207,07513,015,0336,88i,8l6
93,048,5584,307,6414,590, 7087,335, 753
32,8i9, 8019,331,77914,628,536
90J, 3404,250,7651,735,751
24,813,39039,168,77410,294,2771,031,906
13,953,33324,955,4292,741,8489,974, 788
13,341,232
673,441,024
Total de-ductions.
$7,895, 7636,37i,6006,454,8533,548,794
181,49710,795,3155,920,958
83, 743,7023,888,4184,062,8326,410,219
30,076,42816,731,54313,341.345
788,2823,400,8941,444,748
22,483,29135,336,7229,070,6221,001,045
12,291,61521,445,1162,260,7638,712,433
11,933,948
575,576,388
Totalnet
income.
$828,8471,418,0311,070,191
524,57922,578
2,249,718960,858
9,304,856419,223527,876925,534
2, 743,5522, 600,2361,287,191
121,058849,871291,003
2,333,0993,832,0521,223,655
30,8611,661,7183,510,313
481,0851,262,3651,407,284
97,834.626
Incometax.
$37,85066,21950,61028,305
1,28396,15050,117
439,24322,31128,04546,879
128,973119,31460,5856,8., 8
43,34315.494
116,630175,24359,081
1,85289,823
161,96324,60761,72558,822
4,494,220
Warexcessprofitstax.
$140,65693,64457,9959,933
542551,642
49,5601,450,485
13,57117,97173,179
164,092473,977
75,4976,586
61,8J09,255
233,757327,202
42,042
211,442271,047
33,652154,097371,570
16,382,345
Total tax.
$178,506159,863108, 60538,238
1,825647,792
99,6771,880,718
35,88246,016
120,058293,065593,291133,08213.454
105,15324,749
350,387502,445101,123
1,852292,265433,010
58, ?59215,822430,392
20,876,565
Percentof
t:taltax.
.87
.78
.53
.19
.073.09
.488.96
.17
.22
.581.422.82
.66
.07
.51
.121.652.44
.49
.011.382.11
.281.022.06
100. 00
Corporations showing no net income.
Num-berre-
port-ingnonetin-
come.
78
*%21108548
21040398141
1579310472445
214751569
31362
10874
4,027
Percent
oft>talnum-ber ofcor-pora-tions
in eachState.
42.8545.1722.5037.5041.6750.2944. 4448.7233. 6141.9443.7826.2853. 7752.5452. 6326.7034.2933.0030.0137.6965.2246.0055.1145.9247.1627.11
41.69
Totalgross
income.
$1,917,1373,057,8831,920,161
829, 60831,765
1,802,908734,881
16,146,902452,764263,059
1,450, 6661,982,8662, 602,7731,443, 830
991,681548,386335,445
4,603,9968, 453,0391,320,505
216,663479,380
6,454,2367,335
874,4121,568,930
103,304,963
Totaldeduc-tions.
$2,318,5833,721,6762,098,1301,108,030
55,0131,992,675
958,59017,690,860
504,935380,963
2,027,3652,162,7913,189,4261,818,9641,037.342
645', 042419,344
4,797,8719', 387,3751, 625,580
240,842619,970
8,284,76617,346
1,138,9112,051,028
123,692,884
Deficit.
$431,446663,793177,969278,42223,248
189,767223,708
1,543,95852,171
117,904576,699179,925583,653375,13445,66196,65683,899
193,875934,336305,07524,179
140,5901,830,530
10,011264,499482,098
20,387,921
w>
O
j
o
Digitized for FRASER http://fraser.stlouisfed.org/ Federal Reserve Bank of St. Louis
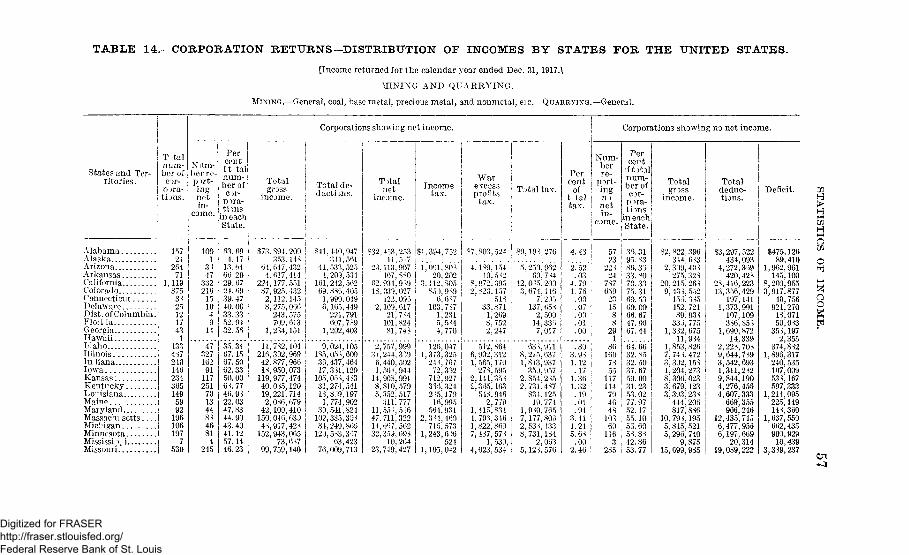
TABLE 14.™CORPOIIATION RETURNS—DISTRIBUTION OF INCOMES BY STATES FOR THE UNITED STATES.
[Income returned for the calendar year ended Dec. 31, 1917.]
MINING AND QUARRYING.
MINING.—General, coal, base metal, precious metal, and nonmetal, etc. QUARRYING.—General.
States and Ter-ritories.
Alabama !
Alaska !Arizona IArkansasCalifornia IColorado !
Connecticut }Delaware iDist. of Columbia.!FloriJa jGeorgia iHawaii |Idaho iIllinois iIn lianaIowaKansas:KentuckyLo isianaMaine_ _, -,MarylandMassachi settsMichiganMinnesotaMississi"); iMissouri/
T-talnum-ber ofcor-
pora-tions.
Corporations showing net income. Corporations showing no net income.
Num-ber re-
Percentft talnura-
!
or-! mra-
I State.
netin-
1572426471
1,1198753>251217431
13343724014623436514959921961061977
530
100I334733221615104914
47327162911172517013448346814
245
63.694.17
13. 6466.20296724. 6939.4740. 0033.3352. 9432. 56
67.5062.3350.0063.7746.9322.0347.8344.9043.4041.1257.1446.23
Totalgross
income.
Total de-ductions.
Totalnet
income.
Incometax.
Warexcesspromts
tax.Total tax.
$73,894,200 !353,143 I
64,647,432 j4,617,414 !
224,177.551 j87, 925', 432 I2,112,145 i8,275,066 !
243,575 j709,613 !
1,234,151 i
841,440,947341,561
41,533,5254,203,534
161,242,56269, 836, 4051,990,0496,165, 449
221,791607, 739
1,202,403
11,732,104216,302,96942,877,966I S 950,073
119,977,47440,0*5,12019,221,7142.036,679
42', 100,410150,046,63343,917,423152,943,065
73,63799,759,140
9,024,105185,05^, 60033,437,46417,3*1,129
105,03*, 43331,274,54113,839,1971,774,902
33,541,824102,335,30334,249,866
120,533,33763,423
76,009, 713
$32,453,253 SI,394,752H,5s7 | ' . . . .
23,113,907 ; 1,051,80*407,830 i
62,934,939 I18,039,027 i
122,09) i2,109,617 I
21,734 !101,824 !81.743 i
20,2023.112,805
850,9396,6*7
103,7371,2315,5*44,770
4,139,154 !40,5*2 i
8,972,395 l
2,823,157 I513 '
33.871 ;1,269 i8,752 j2', 247 :
5. 259,96260,734
12,0*5,2003,674,146
7,205137,65*
2, 50014,3367,017
2,757,999 I31.244,3 396,440,502 !1,56*, 944 !
14,903,9918,810,5795,352.517
31i;77711,55 i, 5*647,711,322Hi 667, 56232,359,693
10,26423,749,427
126,0471,373,325
24*, 76772,3)2
712792733), 3242*5,17916,995
564,9312,3*4,460
715,5731,243,6 )6
5241,105.042
512,8646,902,3121, 565,170
273,5952,141,3531,365,163
543.9462,779
1.415,8344,793,3461,822,8607,487,57*
1,539,4,023,534
63*. 911S,275j6371,813,937
353,9572.854,2*52,731,437
834,12519,774
1,9*0,7657,177,8032, 53*, 4338,731,134
2,0635,123,576
Percent
oft taltax.
Num-berre-
port-ingn >netin-
come.
Percent
)ft)talnum-ber ofcor-
pora-ti ms j
in each;State.
$7,803,524 | $9,193,276 4.43
2.52 I.03 i
4.79 !1.76 I
.00 !
.07 i
.oo !
. 0 1 i
. 0 0 :
. 3 0 I3.9* I1.12 !
. 17 !1.36 i1.32 !.19.01.94
3.411.215.63.00
2. 46
5723
22*24
787659 75.3123 ! 60.53
36.3195. 8386.3333. SO70. 33
1588
291
8616073
11711479
10360
1163
00. 0066. 6747.0667.44
64. 6632. 8532.5037.6750.0031.23 |53.02 i
46 ! 77.97 i48 I 52.17 |'" ' 55.10 j
53. 60 j53.83 '42.86
285 I 53.77
Totalgri)ss
income.
$2,S22,396344,6*3
2,339,40*275,323
20,215,26*9, 43 *, 552
153,3*5452,72189,033
333,7751,332,675
11.9*41,853j8267,74*, 4723,392,1531,204,2738,306,0233,679,1233,393.233
444,206817,836
10,79*, 1955,815,5215,298,740
9,87515,699,935
Totaldeduc-tions.
Deficit. n
O
ao
Digitized for FRASER http://fraser.stlouisfed.org/ Federal Reserve Bank of St. Louis
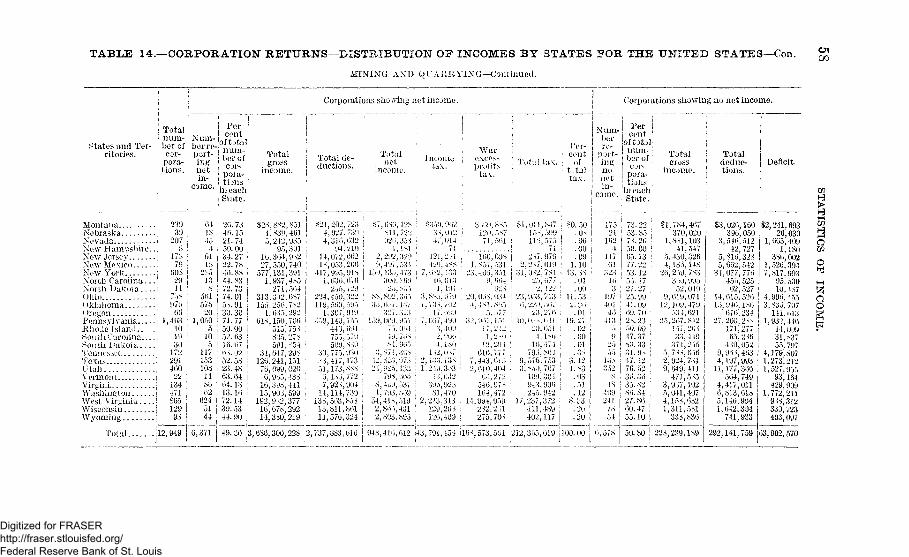
TABLE 14.—CORPORATION RETURNS—DISTRIBUTION OF INCOMES BY STATES FOR THE UNITED STATES—Con.
MINING ANTD QUARKV1NG—Continued.
00
States and Ter-ritories.
"MontanaNebraskaNevadaNew Hampshire.New JersevNew MexicoXTew YorkNorth Carolina..North Dakota. . .OhioOklahoma . . --OregonPennsylvaniaRhode IslandSouth Carolina...South DakotaTennesseeTexas . . . .UtahV erm on tVirginiaWashington
WisconsinWyoming
Total
1 Total !num-
i ber of:1 cor- ;! pora-:
tions.
239 :'39 I
i 207 i8 !
•• 1 7 8 •79 |
60S i.! 29 I
11 '758 :976 |
.-' 66 ;
.: 1,463 !
.; io !
.; IO ;
.; 30 :
172 |J 291 :! 460 ;i 22 !
. | 134 i-I 471 SJ 865 !.j 129 i.1 98 !
J12,949j j
Num-ber re-port-ingnetin-
come.
oll b
1ol
1-5s
> t > l
O(
*.O1 0 0
0
10)
11/1 ill J11
( 2624ol44
| Per 'j cent|oft3tal
ber of;I or- :i pora- i1 tijns !|in each;' btatc
26 7>Io 1 >21 74>() 00
oi 2722 t \i i Vs.
41 M72 771 01:>> 91>0 S\)71 77oO 00> 2 «>}
16 (t) 0>)2 >z:5 }sGi 64t l l iIo 1)
6J >>11 ))
Totalgross
income.
S>s1
1027
1
1 1 *I -
101 S
j <
1 >0
o101 .
1?o11,
s,S2 8 jM > If2\ 3s9) i)
-561 (»\,_
j
|
L
>>Q 740131 31 '9-57,42 7 1 , >i312 0 >'
• •> ) H
1 )0 ( )'
j . ) i -
s ) ... *) >1 J
Oh .. i*.41 1 )1
' i s , '3i>s i 190 \ o
3^0,211
o00,2*
> |i 1
I
Corporations
Total de-ductions.
\ 2 1 , 2 O 2 «^>
4 0 2 / >
1 oio oi211 AJ
14 0/ M >>1 ^ , 0 ) 5 J H
2 1 ) i- '
11 >>l )>
1 », 1 1 J i ) > I4 j ; ( 1
7bJ ^^ '
i i / ) ) 0
j 4 1 7 , J « 5. 17) -^
ti 1 •> / 2
1 1 1 1 1 , < J
J j t j ' s « l ' s o l11, < , L l
showing net income.
Totalnet
income.
>
<
1
1
t ">
v l l
\
1 )<
)0 )
>
(
I
x
s >
1 v
-
} >
s
i
J0 i, ^
-j ^
i ^
^(
)
1 .^ ' )
012
Incometax.
)
121L )
i«
1s >
1 / >
, ( ) ) /
II 2
I .. >
> i >s
* "-Ji 0,
i , 7 31,
0101
71
onj
j )! i
t
1 ii t
9.'4/0
OJ
J
I excessprofits
! t ax .
-> )1')
, i
] »t f
1 s /
) »
. ) 0 s 1
5 » 1
l
1 -
( 1 0 /
^7
1
1)
J
1
I/
2 ) x O t«)4
() > u
U 1, 1
2 , >,7<
1 0 , o >
2
I
i
!
! Total tax.
"1 i l l N !1 , if)
7 i
2 2v 01 )31 J ; sj
2j<) \ 7 n
i) j i i[
- ) * >ii i> >
I ii i7) M.> i
- ) ) 7 /
j ) J »i
21 ( 12
/? ii \'^\102 117
212 3 ) ) u l J
IVr-i cent
oft ta]tax.
v 0 ) )
(;00 >
1 1 0
1 > ^
0100
1 1 >
01I > . .
(L0001
o 1 )
i ^ >
W>
U
Iz J
1)0 (0
Nnm-
ro-
"ingnonetm-
_
>i
\
11/0 1>-,
It}
197
4 )H >
<
j n
1 ,>
' 8
| - l l 1/ "i
ii } ^
Corporations showing no net income
Percent
ofUtal
ber ofcor-
pora-tions
in eachState
_, 2)
>' s
)0 0 )) > i -y
>) 1 J
2/ 272 ) 9 34] 09n ) 0
) t )
17 3/< 3^
>i H
1/ -7o >23 J)
i 10
) J
Totalgross
income.
"i-'l
1
, j
4
0
25
o•>
35
1
223,
7843708 si
41430
239
52619
5"'i 1
267157,33
371,788,M'M649j4719-V7041,
311.
239,
4670201035473261487^39950100714796?18!2268419255656781411
10?407
836
189
i Totaldeduc-tions.
02639654642
8i aoj 662
14
27
94
11
46
1
292,
45662
615
67020017165
430W «197177j504;417813,
642741,
141,
16005051' ;
7273'>8542
5255275^6186234
277286052463993366749011618
304933
759
Deficit.i
1
1
4
1,
411
1,
63,
>6665
1' 865268179510
996
14193:>
143155
179?73r^7931
4?9.772,
403,
902,
693030409
, ISO0023949935304874 5")
707
446
837797807212955164909211312723097
570
WTA
TIS
H
SOI
o
oQg•
Digitized for FRASER http://fraser.stlouisfed.org/ Federal Reserve Bank of St. Louis
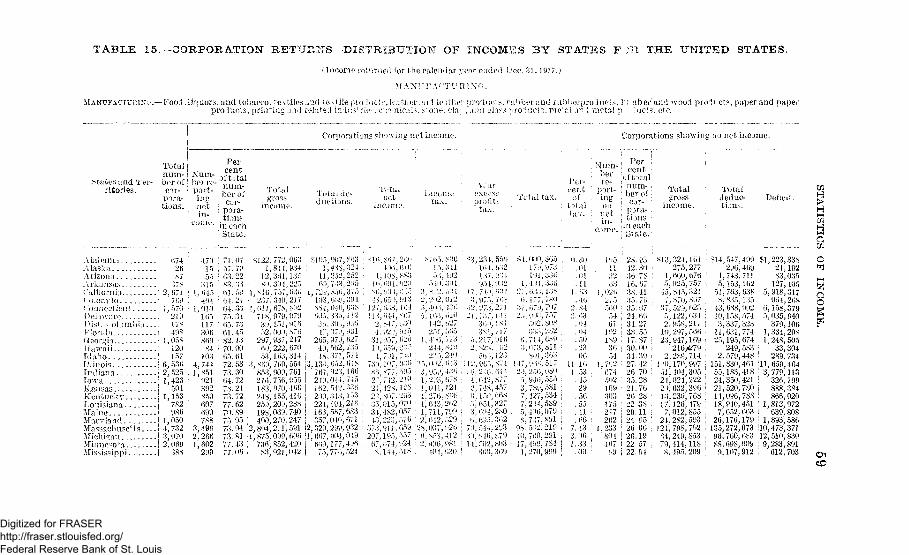
T A B L E 15.—CORPORATION P.ET7Ji:?7S D I S T R I B U T I O N OF I N C O M E S 3 Y S T A T E S F -It T H E U N I T E D STATES.
M A N U F A C T U R I N G . — F o o d . l i q u o r s , a n d . l o ' u e e o , : e ^ t i l e s a n d :» f i l e p r o ' i . i - t > • , I f a i i u i i n 3 i e i ' i »". i i i o n u 1 s , H I M - C a n d r u b ! <•. p * o i i : ' - \ , ) • ; ' i b e r a r i d , w o o d p r o d u c t s , p a p e r a n d p a p e r
C o r p o r a t i o n s s h o w i n g n e t i n c o m e . Corporations showing no net income.
P e r -
States and Ter-ritories.
s 1 is'en*rizo la\rlva!k>d^
C idio/'ii <1 o ora !o
1 lei iw ai<-1 M^1 ol ' imbi i .Ki(V! 1 .({eo'ji ii ia 'va i i""Id.rio
Iowa . •Kan-visJVLMluCkv
i o'lishma
MarVhud . ' . . . ' .
\riclurrafiMuiue-o'a
num- !ber of Icor- jpora- itions. |
07120
2 07 i, i
17^U K
1,0 Vs12>.)1 57
0 ") 0•>' - 9 ^
1' 423501
1 1 53'7^2
i f)sO1 010I 7323,0702 009
Num-ber re-port-"ingnetin-
come.
17 '1")3")
t 0 4 >
i M
I Ml '»
11"300
^ <
JO-5j . - j \.
1 ' S51'021
102s*>)h()7n)f)
7sS^ 19)/ 2001,002
centoftital11 um-ber ofcor-
pora-tions
in each'• State.
71 07- - p//> j 2s ^ <>'
O l ") v
' 1 21Oi ,37> 3 .T> 7301 4")S2 137 0 ; i ( t
- (i
72 ."87 3 30hi 727 217*3 7277 027') ^975 0573 <H73 si77 H77 Of)
Totalgross
income.
s 22, 7/~1 S4 I
12 >')1;
S i ! >41 s l o 7 >7
\*r, no1 / i s )7lt
< ) , h ,>2 00 1
2 9 7 , U 3 i0 )' 222,
J s( / 7'(), s ^ , 0 O )
l s j , f»;oMS, 1 )")
• 23), 20*,1 l(>s, 06).i 4 )1 ,27 ''2, S94,2 ' l ,1 s71 0 » ,
, 7ih s")2! s-5 02!,
Co J' ,1
^ ~i i o
s »2c , < i
0 1,
s7t2170 7 "• s l 1
7M
lo t ,HO2ss7>02^7")(*10 'n1-0
Totai de-ductions.
, -I
U(,
1 7J i l 3^s \
\\1
2» >
\)1 f S
5 . 1 i '
1 7 07! 2P1 J 0 2
I ' '>221,163,317,
i2 2 \1 ((< -
00 )1 7"),
f)"7 ^ '313") >2 ^
2J2^2JJ1 )-> 2 '")
0 >] i t<UI 0 >v
-> / s }
^) , ' (<
. < ' > !J 7 •• < > 2 (
M)2 ; i 1 )
3 ( / " l0 )-. 0 S02,, loo
> } S , J ; }
I M . 2 1 ,V 7 . b )(MO 0712 H> 0 ,2i i ) t p • t
I " , 1 »'77 > Y21
n e ti n c o m
- 1 1 <• i . i
1 J >
l - '^
I « h
. J 0 c
J 2, > 1
1 I ' i 4 1,
2 s i
t • -
1 , ' ><
j ' w l
'-, j '
2 7 [22 , 12s
} • J i .
31 is2,1 h 22 i
u\ ni
(- ' i
^ ] U
e.
2<<I (
s \ >I * . '
< j ,
1 '
>o1 1
0 u
t<\ >
c *,
> 0
j ^
_. 1 >
II, )
()~7
/ 0
i | S
- < 0 5
) 1
2 '2* j ( f '
> 1 0 ) ,! 12
2 L,
! 02
> 0 2( i , i
1 J >
, o | l2. 0
, ( . 1
^ 0 i, ,\ \ ,> ) r)
0 1
sn3 i lt '2
1
P i -
1 f
> t1 - 7)0 y
1. 5
> i i
} j
1 •
123v (2' 27( J
2(*' 2o* 2
1j
1
3
_j
2
i
1;
1
\ t c
e\ccp: J
ra
. 2,31l u l1.4 .
~ 1
, ' ! 7 '. 27 )
• ! S L
. 217s -,~\U »n 0 "
012
. ! " • • )
. ( ^ ) '
. 0 ) ',511
^ |t)
' , - • ) !?
Si,."*
i
t
, 550, •> .2, " ' 1.! ' V2
. . J
. . i > -
.271
. J 17
. ' Si, t i 7. '»io
. J2 J
' / i
. 157, < t N
, 327, 2sO. J 2. 2',)3."" 79, v ("3. ",f',v)
Tv
s i
1•'
,,
i 172 ),
-
/,7?5,S .
' ! \ ,)0.17,
1.
0I
1i,
!
i ,
")
I I
r
>
i27571
!
•J
, : '
"7 ."9;II ,
>2,
i ,
"3,
. 0
>6
n\
*o
.«.o)7,j
330
7^ i7' '775 r
l'S20 s *'s i LJo.'I
5! 7
CM5345 SO'(79s9l2192917^49^0
!
f
1
;1
1
11 -
)!
t . l l
.V."01i ! l
. 1 1«,;>
10
,, [
)J
1' \. 50. 23
''6J'>5.3152 >")('.
. Ci,~)
l l. !>•)
IX00XXOi
1 e-
in?
111-
i1 5
n
3."2'»
5»;ooliii
! >2
i S 9
'!'•- j
i , 71 2
5f *2
•'«)317,)2^7202
1, i'xx>°i4(>7
centi t >tain um-ber ulcor-
ti .JL-'me
' ^1230163.v<
,i5,'52431HS17'V312726
2126222921'2C>
2622
, 22
achAc.
I'.,307s67^17,,i)7662751S7O{(
391270
762S3s11fv()•'.195791
1
t )
.'37
2!>23
1 1"
' ~>i2 I21317
21I2Jst
's
Total
.321,275,
. 000,
, 025,,Sf,',
, o2 ),,122,, 95s,, 297,, 917,
U-1277076757321
023•J31217<~>('n\169
2L6,«27(>
170'110 \\, 024,
'.23-l!. 126^J012'. 2S2,, 798,.219,, U4,
7 1 19''7305222
76s179b"io5937''2853
us209
Totaldeduc-tions
1 I5
51S
43103
1121,
2151,
00
2121,14,IS1
726,
1 :'>.%90,ss,
r».
>172 i(>'
4<H
4b1.)
743, '711153,763s.C>!Os^^15s[3:57,031,195,219)579,s30',1 S3,350,
1020 3 S
I '?•"
0025713237710745S341846141N
121520,7S0O')6,P10,652.176,272)760,60S,107,
78s4516^!;
179073()v-3009912
'•1,223,33821,19283,035
127,4055,918,317
964,2686,158.3795,035,940'379,106
1,331.208l,2tS,505
33,3042s>9, 734
11,659,4643,779,113
326,1998SS, 384866,020
1, 813, 972639,808
1,893,58610,473,37112,510,8309,283,891
612,703
£H(—4
oo
CO
Digitized for FRASER http://fraser.stlouisfed.org/ Federal Reserve Bank of St. Louis
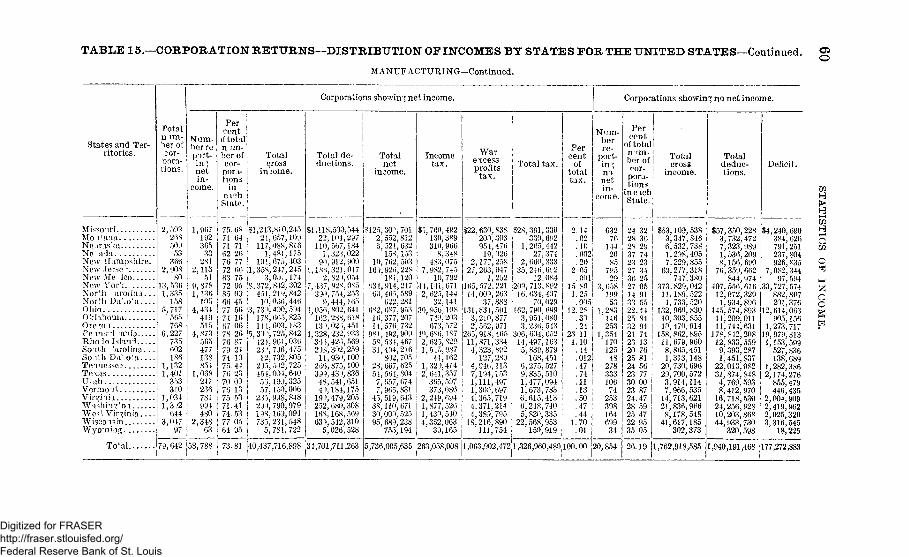
TABLE 15.—CORPORATION RETURNS—DISTRIBUTION OF INCOMES BY STATES FOR THE UNITED STATES—Continued.
M A N U F A C T U R I N G - C o n t i n u e d .
States and Ter-
ritories.
MissouriMo l1 anaNeons^aNe aiaNew tiampshire.New Jerse'-New Me icoNew Yof:North arolina...Nor'h Da^oLaOhioOklahomaOre TO 1Pe ns"Tl 'aniaRholelslaniSouth 'arolina...So ith Da o'.aTe messesTe vasUtahVermoitVirgiiiaWashing* 01WeV, VirginiaWisconsin .Wyoming
Total
Totaln im-ber ofcor-pora-tions.
2,593268509
53366
2, 90880
13,5361,335
1585,717
565768
6,227735602186
1,1321 401'3533L0
1,034i;3')2
6443 047
97
79,642
Num-ber report-in Tnetin-
come.
1,967192365
332X1
2,11351
9,8781,136
1054,434
419515
4, 873565477138854
1,0682172.36781994480
2 34863
58,788
Percent
if totaln im-ber ofcor-pora-tions
ineichState.
75. 6871716276726372856677746778767974
7670767571747764
73.
64712677667595094556160626872419442303135341530595
81
11
1,
8.
3,
5,
4C
Totalcross
income.
,213,810,24521,657,109
117,088,8161,481,175
101,675,403358,247,245
3,001,174372,842,302451,219; 84210,0o6,446
73">,490, 594178,665,825141,603,18339 \ 725, 842421,961,0362-P,796,47512,732,805
2)5,542,725454,004, 64053,199,32557,150,006
235,998,848233,790,97919S, 169,094735,231,548
5, 781, 722
),437,716,898
SI
t,
7
'3,
4,
Corporations showing net income.
Total de-ductions.
,118,500,54422
no, i ,90,
18X2
437390
9056162,1 3 \3283)5,2)S,
11,266,333,
48'4 "\>
104,297567,184323,022912,900321,017820,05492S 085754,253444,165802,641288,61802o,451232,933426,569302,259930,100875,10043), 836541,651184,175
19V479-205252,16S,
680,308168,569
633, 512 3105, 026,528
34,701,711,263
Totalnet
income.
$125,30^, 7012,552,8126,521,632
158,15310,762,503
163,926,22818i,l20
931,914,2176i), 465,589
622,2816X2, 687, 95316,377,20714,576,732
981,492,90958, 534,46731,494,216
S02,70528, 667, 62554,564,804
1, 657; 6747,965,831
45, 519,6433S, 110,67130,003, 52595 689,238
'755,194
5,736,005,635
Incometax.
$5,760,492130,389310,966
8,348483,075
7,982,74510, 792
44,141,6712, 625,144
32,14130,956,108
740,203673,572
4% 6%, 1872, 625, 8291,5,5,987
41,1621,323,4142 641,357
' 365,597373,086
2,249,6941,877,5261,43^,5104 352,063
' 33,165
263,058,008
Ware \ue^>sprofits
tax.
$22,
227,
16514
131,3,2,
265,\\4,
4,
1,h4,4,4
18,'
1,06
630,S38200,303954,476
19,026177,258263, 947
1,292572,221009,263
37, 888831,591210,877562,971918,465871,334323; 892127,289946,113194,153111!497300, 697365,719371,214389,795216,890111,754
3,902,472
Total tax.
$28,391,
1
235
20916
16233,
330,265,
27,660,246
12713634,
3306924423743336J/2084892407
70,029790,951,236,
306,60414
5,
69,1,1,6,6,5,
22,
497,
699080543652163
839,879168,275,
477'673,615,248;820,568150,'
451527510094783413740335953919
Percent
oftotaltax.
2.14.02.10. 002.20
2 65.001
15 801.25
. 00512. 28
.39
.2423 111.10
.44
.012
.4774
:Ii.13.50.47.44
1. 70.01
1,326,960,480,100.00
1
Num-berre-
port-ingnonetin-
come.
63276
1442085
79529
3, 65819953
1,283146253
1,35417012548
278333106
7425339816469934
20,854
Corporations showin
Percent
of totalnum-ber ofcor-pora-tions
ineichState.
24282837232736271433
32362974233425059155
22.44253221232025242330232428252235
26.
849474137681567700874759479505
19
Totalgross
income.
$533617
,109,538,347,846,532,738,298,405,229,855
69,277,318747,380
373,829,04211
1132
1010
1581181
20
,189.522,733;520,960,830,303,855, 470, 914,862,895,679,960,865,451313,148
,730,6962 9 ' 70fV JV79
37
1421
841
914,114966,535713,621836,966178,548617,185302,373
1,762,918,585
1 no net income
Totaldeduc-
$573718
76
40712
11451111
17812
91
2231
48
16241044
tions
, 350,732,323,,536,156,359844,
, 556,072,, 934,,574,
228472989209690662974m 6329896893
,209,011,744,, 842,, 833,, 393,,451,
631208559287837
,013,082874
\ 769,',412,,718,,256,
848593970530P28
,203,868933
'320^730598
1,940,191,468
Deficit.
$4,
7
33,
12,
1,19,
1,
1,2
2,2,2,3
240,690384,791,237,926,082,
97,727,
882,201,614,905,273,
626251804835344594574807376063156717
979,313153,527,138,282,174855,446,004,
599836689386276479435909
419,962025,316
320
18,225
177,272,883
IS3HSin
Cgft
Digitized for FRASER http://fraser.stlouisfed.org/ Federal Reserve Bank of St. Louis
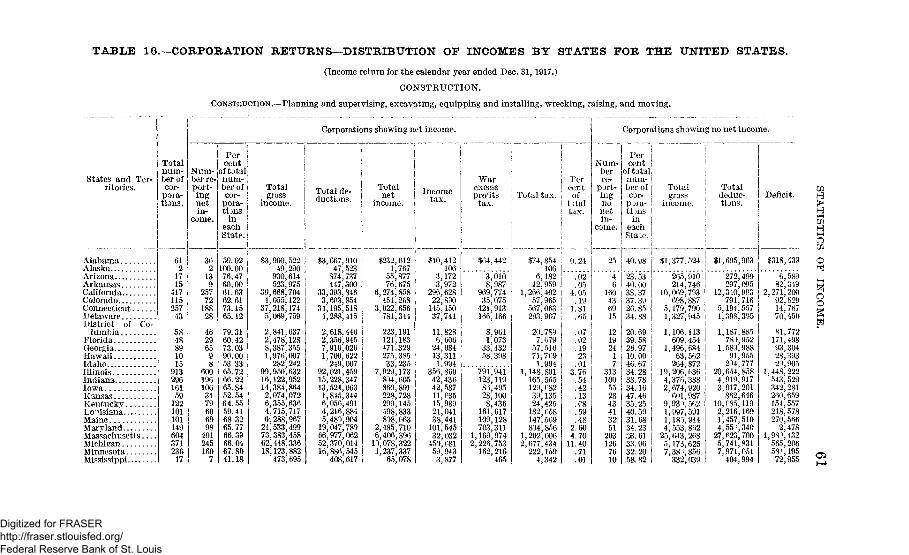
TABLE 16.—CORPORATION RETURNS—DISTRIBUTION OF INCOMES BY STATES FOR THE UNITED STATES.
(Income return for the calendar year ended Dec. 31, 1917.)
CONSTRUCTION.
CONSTRUCTION.—Planning and supervising, excavating, equipping and installing, wrecking, raising, and moving.
States and Ter-ritories.
AlabamaAlaskaArizonaArkansasCaliforniaColorado...ConnecticutDelaware . . . .District of Co-
lumbiaFloridaGeorgiaHawaii „IdahoIllinoisIndianaIowa.KansasKentuckvLouisianaMaineMarvland ..MassachusettsMichiganMinnesotaMississippi
Totalnum-ber ofcor-
pora-tions.
61
1715
417115257
43
5848891015
913296161
59122101101149604371236
17
Num-ber re-port-ingnetin-
come.
362
139
25772
18828
46296598
6001961063179606998
401245160
7
Percent
of totalnum-ber ofcor-pora-
ti3nsin
eachState.
59.02100.0076.4760.0061.6362.6173.1565.12
79.3160.4273.0390.0053 3365.7266.2265.8452.5464.5559.4168 3265.7766.3966.0467.8041.18
Totalgross
income.
$3,900,52249,290
930 614523,975
39,668,7044,055,122
37,218,1745,069,759
2,841,6372,478,1288,387,3551,976,007
282,24299,950,63216,122,95214,384,8642.074,0726;355,6364,715,7176,288,967
21,533,49973,383,45862,448,33618.123,882
473,695
Corporations showing net income.
Total dp
$3,667,91047,523
874,737447,300
33,393 8463,603,854
34,195,5184,288,415
2,618,4462,356,9457 916,0261,700,622
249,00792,021,45915,228,34713,524,0631,845,3446,056,4914,216,8845,480,904
19,047,78966,977,06252,370,01416 886,545
408,617
Totalnet
income.
$232,6121,767
55,87776,675
6,274,858451,268
3,022,656781,344
223,191121,183471,329275,38533,235
7,929,173804,605860,801228,728299,145498,833808,063
2,485,7106,406,396
10,078,3221,237,337
65,078
$10,412106
3,1723,972
296,62822,800
145,15037,741
11,8286,606
24,08413,3111,994
356,86042,43642,58711,03515,98921,04138,441
101 54532,032
450,68159 9433,877
WarexcessproTts
tax.
$64,442
3,0108,987
969 77435,075
421,913166,166
8,9611,073
33 43258,398
791,941123,1198 %49528,1008,436
161,617109,128703,311
1,169,9742,226,753
162 216465
Total tax.
$74,854106
6,18212,959
1 266 40257,965
567,063203,907
20,7897,679
57,51671,7C91,994
1,148,801165,555129, f8239,13524,425
182 P-58147,569804 856
1,202,0062,677 434
222 1594,342
Percentof
t)taltax.
0.24
0205
4 0519
1.8165
.07
.021923
.013 76
54.42.13.0859
.482 604.70
11 4071
.01
Num-berre-
port-ingnonetin-
come.
25
46
160436915
121924
17
313100552843413251
2031267610
Corporations showing no net income.
Percent
of totalnum-ber ofcor-
pora-tions
ineachState.
40.98
23 5340.0038 3737.3926.8534. 88
20.6939.5826 9710.0046 6734.2833 7834.1647.4635.2540.5931.6834.2338.6133 9632 2058.82
Totalgross
income.
$1,377,524
265 910214,746
10 069 793698,887
5,179,7901,327,945
1,106,113609,454
1 496 684' 63,562264 872
19,206,6364,376,3882,674,920
601,9879,93\5(-21,997,5911,183,9444 553 862
25,643,2685 17o 6257'38> 856'332,039
Totaldeduc-tions.
$1,695,963
272,499297,095
12 340,993791,716
5,194,5571,398,395
1,187,88578), 952
1,580,98891,955
204,77720,654,8584,919,9173,017,201
862,64610,085,1192,216,1691,457,5104,55 >, 340
27, f>23,7005,741,8317 971 051
404,994
wDeficit. H
H
C
$318,439 Ohrj
6,58982,349 5
2,271,200 Z<92,829 X14;767 §70,450 §
81,772171,49893,30428,39320,905
1,448,222543,529342,281260,65915*, 557218,578270,566
2,4781,98 V 32
565,20658* 195 .72,955 £
Digitized for FRASER http://fraser.stlouisfed.org/ Federal Reserve Bank of St. Louis

TABLE 16.—CORPORATION RETURNS—DISTRIBUTION OF INCOMES BY STATES FOR THE UNITED STATES—Contd.
CONSTRUCTION—Continued.
a*to
States and Ter-ritories.
MissouriMontanaNebraskaNevadaNew HampshireNew JerseyNew MexicoNew YorkNorth Carolina.North Dakota..OhioOklahomaOregonPennsylvania...Rhode Island...South Carolina..South Dakota..TennesseeTexasUtahVermontVirginiaWashingtonWest Virginia..WisconsinWyoming
Total
Totalnum-ber ofcor-pora-tions.
46575906
21535
52,330
5922
796121125645633032
1211346410
11418511328322
Corporations showing net income.
Num-ber re-port-ingnetin-
come.
10,743
31055634
16374
31,428
4917
5547869
4375214237685419
8911186
20115
Percent
oftotalnum-ber ofcor-pora-tions
ineichState.
66.6773.3370.0066. 6776.1969.9160.00
i 61.2983.0577.2769.6064.4655. 2067.7582.5446.6771.8862.8163.4364.0690.0078.0760.0076.1171.0568.18
7,073 65.84
Totalgross
income.
131,513,673 :4,224,725 j8,508,275 •
3^,256 i598,8''8 j
61,316,075 I68,709
325,956,278 !3,592,2U !
960,561 !96,374^383 i3,902,602 ;
5,023,838 ;157,381.400 :
4,847,334 :3,085,814 ;1,074,855 !5,795,375 !
10,301,967 I3,354,058 :
483,566 i31,200,264 !26,456,705 i4,092,787 i
28,504,893839,228 I
Total de-ductions.
$29,731,0373,950,5707,876,940
36,994560,498
57,060,32264,915
288,750,7013,433,319
907,73384,548,2363,577,1764.080,873
144,460,6204,594,0792,978,887 '1,012,8525,494,1769.200,0543 093,775
455.9952% Mi, 45025,119,3893.792,512
26;427,390804,646
1,252,798,052 {1,127,981,857
Totalnet
income.
$1,782,636274,155631,335
2,262 !38,370 !
4,255,753 !3,764 ;
37,205,577 :158,812 ;52,828 I
11,826,150 '325,426 ;942,965
12,920,780253.255 :107J007 :
62,003 i301,199 ;
1,101,913260,283 ;30,571
4,655,814 !1,337,316
300,275 i2,077,503 !
94,582 |
Incometax.
$86,57813,48932,979
1362,281
192,831226
1,600,4717,0483,035
559,25615,22244,766
545,20411,0965,0022,979
15,14351,61613,5371,696
206,63458,11215,31091,5594,398
Warexcessprofitstax.
124,816,185 | 5,334,965
8,916,71045,1892,249
1,823,73448,666
183,575 '3,308,785 |
69,912 i23,641 !4,027 !
25,871 !69,59614,1552,306
988,683308,77921,913
454,03621,283
24,390,255
Total tax.
$315,91067,31564,697
1362,624
591,971226
10,517,18152,2375,284
2.382,99063,888
228,3413,853,981
81,00828,6437,006 ;
41,014121,21227,692 !4,002 I
1.195,317 I' 366,891
37,223545,59525,681
Percentof
totaltax.
Corporations showing ho net income.
Num-berre-
port-ingnonetin-
come.
1.01.21.21
IPer
centoftotalnum-ber ofcor-pora-tions
ineachState.!
Totalgross
income.
Totaldeduc-tions.
-I-
.011.94
33.88 i.17 !.02 I
7.62 j.21 !
1.36 j12.43 !.26 i.09 l
.02 ;
.13
.40 :
.09 ,
.01 j3.84 I1.18 i•121.76 i
155 33.3320 I 26.6727 ! 30.00
33.3323.8130.0940.0038.7116.9522.7330.4035.5444.8032.2517.4653.3328.1237.1936.57 j35.94 i10.0021.93 I40.00 i23.89 '28.9831.82
25
1612
902105
24243562081116
29,725,220 j 100.00 3,670 j 34.16
I
$6,335,508419,280960,424385,89593,778
8,837,91862^708
69,439,484578,40196,364
14,690,1151,634,0156,391,75833,071,969
987,427351,879147,653
2,573,5703,848,9451,513,439
21,8631,089,3157,057,1881,113,9694,082,566
120,020
271,649,409
$7,086,711472,808
1,098,053393,435102,845
9.939,654'109,918
77,122,481614,075114,098
15,719,6451,902,0376,8o5,67734,511,7031,084,471371,215162,819
2,913,5004,079,7681,585,659
26,8671,320,9027,757,9491,269,7334,448,766170,856
Deficit.
$751,203
53,528137,6296,5409,067
1,101,73647,210
7, 683,00535,67117,734
1,021,530268.022473,919
1,431,73497,04419,33615;166
331,930230,82372,2205,004
231,587700,761155,764366,20050,836
18I—I
o
oo
296,693,764 125,044,355
Digitized for FRASER http://fraser.stlouisfed.org/ Federal Reserve Bank of St. Louis
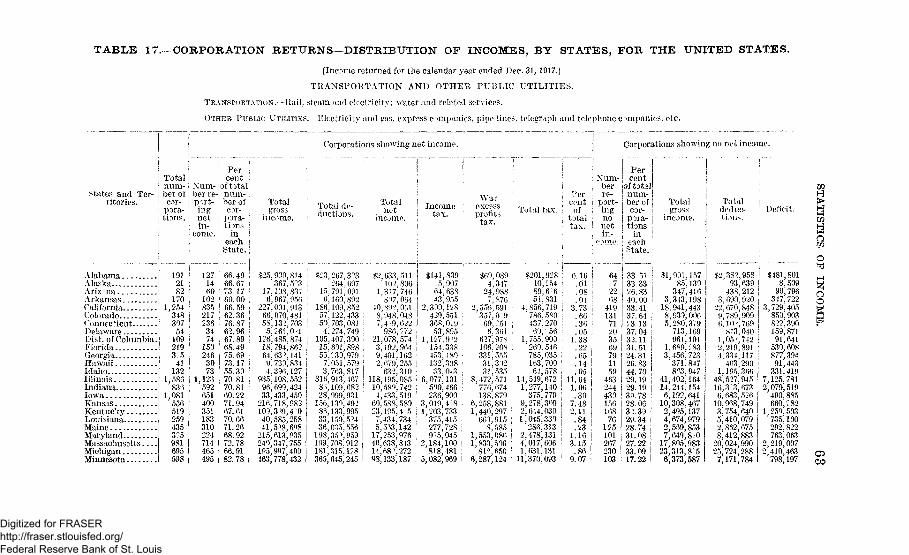
TABLE 17. CORPORATION RETURNS -DISTRIBUTION OF INCOMES, BY STATES, FOR THE UNITED STATES.
[Income returned for the calendar year ended Dec. 31, 1917.]
TRANSPORTATION AND OTHER PUBLIC UTILITIES.
TRANSPORTATION.—Rail, steam and electricity: water and related services.
OTHER PUBLIC UTILITIES.—Electricity and gas, express companies, pipe lines, telegraph and telephone companies, etc.
1Corporations showing net income. Corporations showing no net income-
States and Ter-ritories.
| Total! num-| ber ofI cor-| pora-I tions.
! Per |! cent j
Num.- (of total!ber re-! num- !port- | ber of |ing \ cor- I
AlabamaAlaskaAriz naArkansasCaliforniaColoradoConnecticutDelawareDist. of Columbia.FloridaGeorgiaHawaiiIdahoIllinoisIndianaIowaKansasKentuckyLouisianaMaineMarylandMassachusettsMichiganMinnesota
netin-
come.
1912182
1701,254348307541092193541132
1,586836
1,0815565192594353?5981695598
pora- !tions i
in Ieach jState. |
1271460102S3521723634741502463073
1,123592651400351183310224714465495
66.4966.6773.1760.0066.5962.3676.8762.9667.8968.4975.6973.1755.3070 8170.8160.2271.9467.6170.6671.2668.9272.7866.9182.78
Totalgross
income.
$25,900,814 I367,5°3 !
17,108,837 l
6,967,956 !227,001,913
66,070,481 !5S'.13?,703 !5,261,0>l :
126,485,874 j18,794,862 |64,63 >, 141 i9,739,834 !4,396,127 |
935,108,552 j96,699,42433,433,450 |
216.718.982 I103', 3 >9) 4 040,585,25841,5^8,6«8
215,613,935240,347,755195,997,400463,778,432
Total de-ductions.
$23,267.3 °3264,697
15,791,0916,160,892
186,109,85257,122,43350, 703,081
4\ 274,749105,407,30015.601,89855',: 30,9797,051,5793,763,817
816,913,4678 >. 109,68228', 999J 931
156,130,4028^,133,99533,150,5°436,035,556
198,35 \ 959199,708', 912181,315:128365,645,245
Totalnet
income.
82,033,511102,806
1,317,746" 807,064
40,89?, 0818,948'. 0487,4-9,622
986,?7221,078,5743;192,9649)401.1622,679)255 j
632,310118,195,085 i10,580,742 !4,433,519 •
60,588,580 j23.195,4 5 !7)434,734 I5,5^3,142 I
17,253,976 !40,638,813 i14,68',272 ;98,133,187 i
Incometax.
Wat-excessprofits
tax.
«60,0894,347
24,9887.876
2,556,591'357;o ~9
$141,8395,907
64,63843.955
2,300,128429,551368,019
I 53.895i 1,127'. 9
154)33853)480
132,3;33,043
6,077,101500,466236,900
3,019,4"81,203,733
375)415277,7289"5,045
2,184,100818,481
5,082,969
Total tax. j
$201,92810,25489,6 651,831
4,856,7197S6,580437.270
60)' 56755,900
'260.546785,035163,70064,578
14,549,6721)277,140
375,7799,278,3092,644,0301,045,330
286,3132,478,131 !4,017,606 I1,631,131 !
11,370,093 i
1,
Percentof
totaltax.
Per! Num- cent
ber jof totalre- i num-
port- ber ofing cor-110 I pora-net [ tionsin- j in
corny. } eachI State.
0.16 (.01 I.08 i.04 ;
3.73 I.66 I.36 I.05 I
1.38 I99 I
.'65
.14 !
.05 j11.64 j1.06.30
7.482.11.84.23
1.163.15
.869.07
647
2268
419131712035
33.5133 3326. 8340.0033.4137.64>3.1337.0432.11
69 I 31.51
59463
24.3126. 8344.7029.19
244 i 29.19430 I 30. 78156 | 28.0616876
125101267230103
3>.3929.3428.7431.0827.2233.0917.22
Totalgross
$1,901,15785,130
317,4163,313,198
18,941,4438,939,0065,280,379
713,169961,101
1,689,283 I3)456,723
371,8478^3,947
41,402,16414,244,1546)19?,641
10,308,4672,495,1374,674,9792,589,8537,649,8^0
17,805,98323,313,8^56,373,587
Totaldeduc-tions.
$2,382,958 I93,639
438,2123,690,920
22,670,848 j9,789,909 !6,10\ 769 I
873,040 Il,05>)742 I2,219,891 '4,334,117 I
463,290 I1,195,366 !
48,527,945 |16,3 3,673 I6,683,526
10,968,7493,754,640 i5,410,0792,862,6758,412,883
20,024,99025,724,2887,171,784
Deficit.
$481,8018,509
90,796347,722
3,729,405850,903822,390159,87191,641
530,608877,39491,443
331,4197,125,7812,079,519
490,885660,582
1,250.503735)100292,822763,063
2,219,0072,410,463
798)197
ao
co
Digitized for FRASER http://fraser.stlouisfed.org/ Federal Reserve Bank of St. Louis
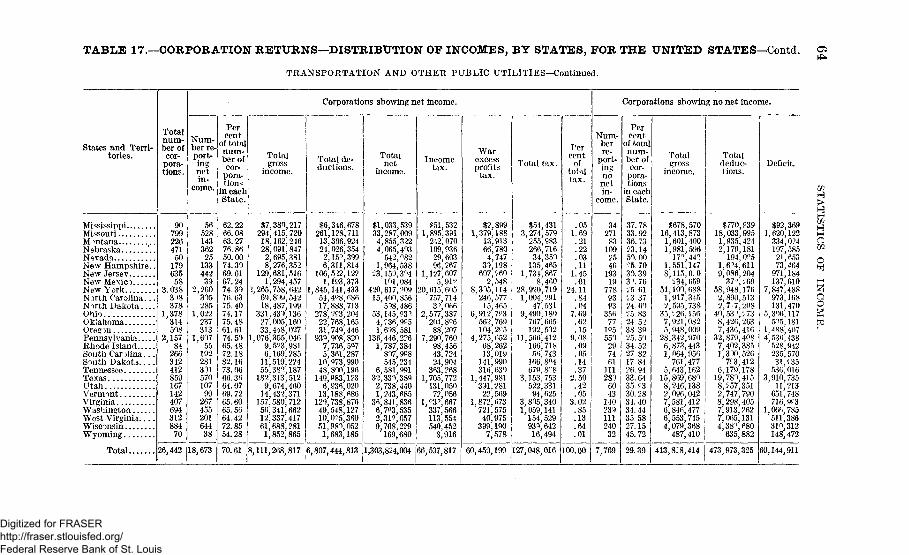
TABLE 17.—CORPORATION RETURNS—DISTRIBUTION OF INCOMES, BY STATES, FOR THE UNITED STATES—Contd.
TRANSPORTATION AND OTHER PUBLIC UTILITIES—Continued.
States and Terri-tories.
MississippiMissouriMontanaNebraskaNevadaNew Hampshire..New JersevNew MexicoNew YorkNorth Carolina...North Dakota. . . .OhioOklahomaOregonPennsylvaniaRhode IslandSouth Car j l ina . . .South DakotaTennesseeTexasUtahVermontVirginiaWashingtonWest VirginiaWisconsinWvoming
Total
Totalnum-ber ofcor-
pora-tions.
9079922647150
17963558
3.038318378
1,378314508
2,15784
26634241285916714240769431288470
26,442
Corporations showing net income.
Num-ber re-port-ingnetin-
come.
5652814336225
13344239
2,260305285
1,022237313
1,60755
19228130157010799
26745520164438
18,673
Percent
of totalnum-ber ofcor-
pora-tions
in eachState.
62.2266.0863.2776.8650.0074.3069.6167.2474.3076.6375.4074.1775.4861.6174.5065.4872.1882.1673.0666.3664.0769.7265.6065.5664.4272.8554.28
70.61
Totalgross
income.
$7,380,217294,415,72018,162,24628,091,8472,695,3818,276,352
129,681,5161,294,457
2,265,758,64269,809,54218,487,199
331,430,13627,005,16033,448,027
1,076,355,0469,523,9816,169,285
11,519,22455,38?, 187
182,313,5129,674,460
14,432,371157,580; 71256,341,66212,337,41761,688,2811,852,865
Total de-ductions.
$6,346,678261,128,71113,306,92424,026,3542,15-?, 3996,311,814
106,512,12?1,193,373
1,845,141,43354,4«8,fi8fi17,888,713
278,2P3,20422,768,16531,740,446
930,908,8207,736,5075,3fil, 287
10,973,99048,800,196
149,983,1536,936,020
13,188,686120,738.87649,548;12710,0? 5,36051,980 0521,683,185
Totalnet
income.
$1,033,53933,287,0094,855,3224,065,493
542,P821,964,538
23,159,304101,084
420,617,?0915,400,856
508,48653,145,93^4, "36,9P51,698,581
136,446,2261,787,384
807,9P8545,234
6,581,99132,330 3802,738,4401,243,685
36,841,8366,7P3,5352,31? 0579,708,229
169,680
8,111,268,817 6,807,444,813 j 1,303,824,004
Incometax.
£51,5321,895,391
242,070199,P3629,60396,267
1,127,6075,919
20,615,605757,7143> 066
2,577,387204,8°688,207
7,290,76098,45643,72424,904
3^3,2681,705,772
131,05072,056
1,P3?,667337,566113,554540,452
8,916
66,537,817
Warexcessprofits
tax.
$2,8991,379,188
13; 91366,7804,747
30,198607 260
2,5488,305,114
246,57715,465
6,912,7P3562,769104,2P5
4,275,65268,26213,019
141,990316,630
1,447,981391,28122,569
1,872,673721,57540,975
399,1907,578
60,450,199
Total tax.
$54,4313,274,579
255,983266,71634,350
135,4651,731,867
8,46028,920,7191,004,991
47,5319,490,180
767,665192,502
11,566,412166,71856,743
166,8°4679,8°8
3,153,753522,33194,625
3,805,3401,059,141
154,529930,64216,494
127,048,016
Percent
oftotaltax.
.051.69.21.22.03.11
1.45.01
24.11.84.04
7.69.62.15
9.08.09.05.14.37
2.50.42.05
3.02.85.13.64.01
100.00
Corporations showing no net income.
Num-berre-
port-ingnonetin-
come.
3427183
1092546
19319
77893P3
35677
1P5550297461
111283
6043
14023911124032
7,769
Percent
of totalnum-ber ofcor-
pora-tions
in eachState.
37.7833.9236.7323.1450.00"5.7030.393 \ 7625 6123 3724.6025.8324. 5238 3925.5034.5227.8217.8426.9433.6435. P330. 2834.4034.4435.5827.1545.72
29.39
Totalgross
income.
$678,57016,413,8731,601,4001,981,596
1 T>, 4421,551,1478,115,0,0
234,65951,100,6881,917,3452,595,738
35,^26,1567,921,0825,948,009
28,342,9706,873,4431,064,956
761,4775,643,162
15,869,6808,246,1382,096,0427,581,4126,846,4776,553,7454,079,368
487,410
413,818,414
Totaldeduc-tions.
$770,93918,033,9951,935,4242,179,181
194,0P51,6^4,6119,086,204
37->, 26958,948,1762,890,5132,7; 7,208
40,53> 2738,426,2637,436,416
32,879,4087,402,3851,300,526
7f3,4126,179,178
19,780,4158,257,3512,747,7908,298,4057,913,2627,065,1314,38^, 680
635,882
473,973,325
Deficit,
$92,3691,620,122
334,074197,58521,65373,464
971,184137,610
7,847,488973,168131,470
5,306,1175\5,181
1,488,4074,536,438
528,942235,57031/35
536,0163,910,735
11,213651,748716,9f3
1,066,785511,386310,312148,472
60,144,911
o
OO
Digitized for FRASER http://fraser.stlouisfed.org/ Federal Reserve Bank of St. Louis
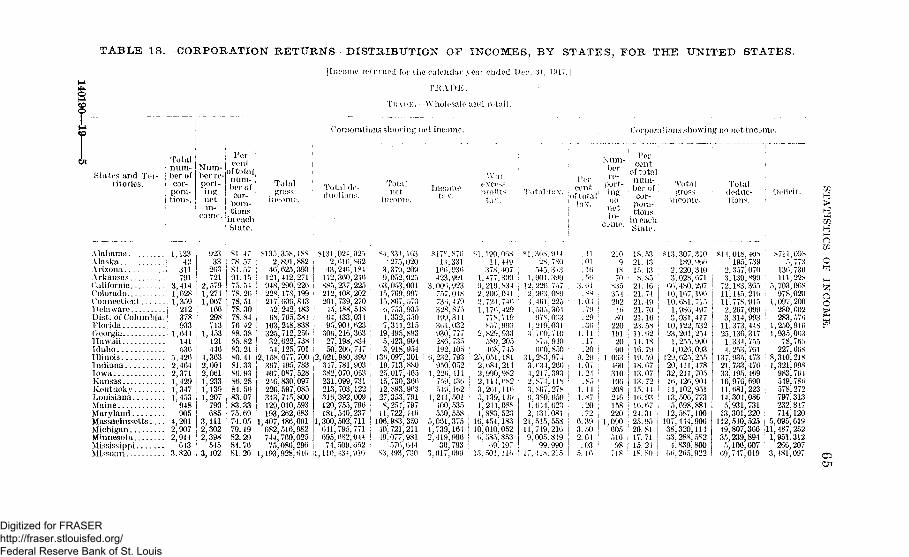
TABLE 18, CORPORATION RETURNS DISTRIBUTION OF INCOMES, BY STATES, FOR THE UNITED STATES.
r : Totali nu in-
states and Ter- i ber ofritories. i cor-
pora-s tions.
Num-ber re-port-ingnetin-
come.
Percent
of total,num- ]
| ber of| cor-j pora-I tionsI in eachI State.
AlabamaAlaska jArizona \ArkansasCaliforniaColorado \Connecticut iDelaware jDist. of Columbia JFlorida 'GeorgiaHawaiiIdahoIllinoisIndianaIowaKansasKentuckyLouisianaMaineMarylandMassachusettsMichiganMinnesotaMississippiMissouri
1,133' 42311791
3,4141,6281,359
212378933
1,644141530
5,4202, 4642,3711,4291,3471,453
948905
4,2012,907 |2,914
643 I3.820 I
92333
203721
2,5791,2741,067
166298713
1, 453121446
4,3632,0042,0611,2331,1391,207
790685
3,1112,3022,398
5453,102
81.4778. 5784. 5791.1575. 5478. 2t78.5178.3078.8476 4288.3885.8283. 2180. 4181.3386. 9386. 2884. 5683.0783.3375.6974.0579.1982.2984. 7681.20
Totalgross
income.
$135,358,1882,891,882
: 40,625,393i 121,412,271j 948,290,226: 228,178,199i 217,606,843| 52, 242, 483j 68, 765,384! 103,248,838| 325,712,256
32,622,738. i 54,125,701. 12,158,077,700' ! '367,495,783
| 407,087,528i 246,830,097| 226,597,085
343,745,800129,010,593193,262,683
1,407,486,061682,516,982744,760,025
, I 75,086,296) ll, 193', 928,646
| Income returned for the calendar year ended Dec. ;*], 1917.]
T R A D E .
TKAIM:. -Wholesale and retail.
Corporations showing net income. Corporal ions showing no net income.
Total de-ductions.
43!112',885',212;201.
\\
95.306'.
27;50;
2,021'347;382;23L213^316,120,181,
1,300,641,695,
74,1,110',
024,025616,862246,184360,246237,225408;202739,270488,548433,034904,623216,363198,s34206, 747980,399781,903070,063099,731703,122392,009755,796540,237502,711795,771 I682,044 !509,652 j
43-1; 916 i
Totalnet
income.
S4.331.103: 275', 020
3,379,2099,052,025
63,053,00115,709,99715,867,5736,753.9354.332;3507,344,215
19,495,8935,423,9043,918,954
136,097,30119.713; 88025; 017,46515,730,36612,893.96327,353; 7918,254, 797
11,722,446106,983.35040,72i; 21149,077.981
576;644S3,493,730
IncomeUlK.
S17S1 S7l»14,331
166', 936423*991
3,006,923' 757,018736,479328,875199,344361,032930,777286,735192,105
6,232, 793950,052
1,226, 111759;436546,162
1,241,501400, 535550,558
5,061,3751,739,1642,419,996
30,7933.917,099
W a re xcessprofitstax.
'ii 100 m;s14,419
378,4071.477.3999,219,8342,206,0412,724,7461,176', 429
778,719S57,999
2,829;9335S9.205468; 745
25,051,1812.684,2142', 990,9822.114,(iS23', 261,1165,139,149i; 244,0881,883,523
16,454,18310,010,0526; 585,853
69.19713, 501, IK".
Total tax.
$1.30S,9U2S,780
545,3i31,901,390
12.220,7572, 963,0893;461,2251,505,301
978,0631,219,0313, 7< 0,710
S75,940660,850
31,283,9743.634', 2664,217,3932,874,1183, S()7, 2786,380,6501,644,6232,434.081
21,515', 55811, 749', 2169,005', 849
99; 99017. ! IS. 215
Percent
'of tolatax.
i
.41
.01
.16
.563. 61
ssl.'O3
. 79
.29
. 361.11
.17
.209.29
! 1.07! 1.24' .85
1. 14i 1.87
.20i 72| 6." 391 3.50! 2.64
.031 5.16
X um-
ber
port-'•' i ng
nonet
in-CJIUC.
2L09
4870
S3 5: 3541 292f 16: so! 220: 191
20! 90! 1.063; 460! 310! 196i 20Si 246! 158i 220j 1,090
'605516
I 98! 718
Percent
of totalnum-ber ofcor-
pora-tions
in eachState.
18.5321.4315. 438. 85
24. 4021.7421.4921.7021. 1(523. 5811.6214.18L6. 7919. 5918. 6713.0713.7215. 4416.9316. 6724.3125. 9520.8117.7115. 2418. SO
Totalgross
income.
?«13
23'!
66'10,10
1,
ioJ,23,
i,4,
129',20,
307,310189.«66220,340028,671480,297167', 196681.715986,497031,417122,532201,254255,990026,093625,255411,478
32, 211', 70516,11,
426,904102,951
13,500;773
12,'107,38,33,
4,00
698,884587,100444,906320,114288,582839, 800265,922
Totaldeduc-tions.
S14.O18.40.N195,739
2.357,0703.139,899
72,183,36511', 145,21611,778,9152,267,0993,314,993
11,373,44825,136,317
1,334,7554,253,761
137,935,47321,733,47633;195,46916,976,69011,681,22314,304,0865,931,731
13,301,220112,540,52549,807,36635,239,894
5,100,00769,747,019
Deficit.
: >7ii,09*5. 773
136; 730111,228
5,703', 068: 978;020
1,097,200280,602
1 283,576! 1,250,916
1,935,06378 765
227,66S8,310,2181,321,998' 983,761549,780
; 578,272' 797,313! 232,847i 714,120i 5,095,01911,487,252
1,951.312266,207
3,481,097
O
o
Digitized for FRASER http://fraser.stlouisfed.org/ Federal Reserve Bank of St. Louis
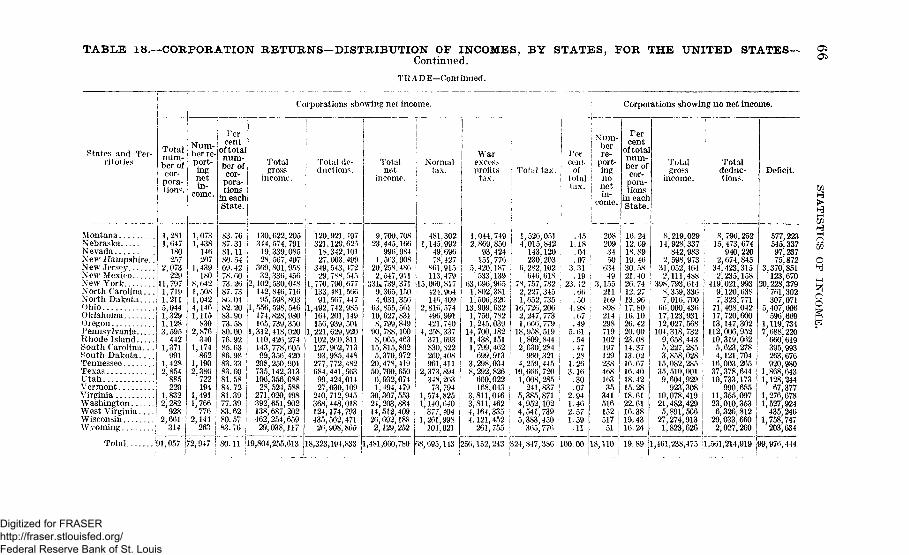
TABLE 18.—CORPORATION RETURNS—DISTRIBUTION 9F INCOMES, BY STATES, FOR THE UNITED STATES—Continued.
TRADE—Continued.^ , __ , . . _
! Corporations showing net income. !
OS
States find Ter-ritories.
MontanaNebraskaNevadaNew Hampshire..New JerseyNew MexicoNew YorkNorth CarolinaNorth DakotaOhioOklahomaOregonPennsylvania"Rhode IslandSouth Carolina...South DakotaTennesseeTexasUtahVermontVirginiaWashingtonWest VirginiaWisconsinWyoming
Corporations showing no net income.
Total 1num- {ber ofcor- I
pora- it ions.!
Num-ber re-port-ingnetin-
come.
Percent
oftotalnum-ber ofcor-
pora-tions
in eachState.
t
Totalgross
income.
Total de-ductions.
Totalnet
income.
1,0731,438
140207
1,439ISO
8, 0421,5081,0424; 1401,115830
2,876340
1,174862
1,1902,386722194
1,4911,766776
2,144263
83.7687.3181.1180. 5469. 4278.0073.2087. 7380.0482.2083. 9073.5880.0076.9285.6386.9883.3383.6081.5884.7281.3977.3983.6280.5783. 70
_|
130,022,205344,574,791
19,339,08528,507,407
309,801,95832,330.456
|2,102,530,0481 142,846,716
95,598 803550,598,546174,828,980165,739,350
1,312,418,020110,426,274143,778,60599,356,420298,250,901735,142,313106,356,08828,524,588271,020,498392; 651,902138,687,202462,254,65929,038,117
Total ;91, 057 72,947 j 80.11 19,804,255,613 ,18,323,194,833
120,921,497321,129,025
18,342,10127.003,499
349,543,47229,788,545770,790,077133,481,56691,507,447
1,492,742,985104,201,149150,939,501
1,221,629,920102,360,811127,962,71393,985,448277,772,482684,441,66399,424,01427,030,109240,712,945368, 448,018124,174,793435,562,47120,908,865
9,700,70823,445,166
996,9841,563,908
20,258,4862,547,911
331% 739,3719,365,1504,031,35063,855,56110,627,8318,799,84990,788,1008,065,46315,815,8925,370,972
20, 478,41950,700,6506,932' 0741,494,479
30,307,55324,203,88414,512,40920,692,1882,129,252
Normaltax.
W a rexcessprofits
tux.
Peri cent
, Total tax. of1 total
tax.
Num-berre-
port-ingnonetin-
come.
481,3021,145,992
j 49,69678, 427
I 861,915! 113,47915,060,817
424,904146, 409
2,816,574496,991421', 740
4,258,337371,693830,822260,408961,411
2,373,894348,203
73,7941,574,8251,140,640
377,4041,261,998
104,021
,481,060,780 68,695,143
1,044,7492,869,850
93,424151,776
5,420,187533,139
03,696,9651,802,3811,506,320
13,909,6321, 750,7821,245.039
14,700,1821,438,1511, 799,462
699,9133,298,0348,292,826
660,022168,043
3,811,0463,811,4624,164,3354,121,452
201, 755
250,152,243 324,847,386 100.00
| 1,526,0514,015,842
I 143,120i 230,203i 6,282,102) 646,618
78,757,782 '2,227,3451,652,735
16,726,2062,247,773 i1,666,779 !
18,958,5191,809,844 |2.630.284 '
900,321 !4,259,445 !
10,666,720 i1.008.285 !
241,837 '5,385,871 !4,952,102 '4,541,739 ;5,383,450 :
305,776
.451.18 j
.04
.07 !3.31
.19 i23.42
J'A\ :.50 j
4.98 i.67 i.49 j
5.61.54.47.28
1.263.16
.30
.072.941.462.571.59.11
2082093450
03449
3,15521110989821429871910219712923840810335
34151615251751
Percent
oftotalnum-ber ofcor-
pora-tions
in each IState.!
Totalgross
income.
Totaldeduc-tions.
16. 2412. 0918.8919. 4630. 5821.4026.7412.2713.9017. SO10.1020.4220.0023.0814.3713.0210.0716.4018.4215.2818.6122.6116.3819.4316.24
18,110 l 19.89
8,219,02914,928,337
842,9832,598,973
31,052,4642,111,488
398, 793,6148,359,3367,016, 700
66,000,43617,123,93112,027,568
104,318,7329,658,4435,227,2853,858,028
15,082,28535,510,0019,604,929
923,30810,078,41921,482,4295,891,566
27,274,9131,823,626
796,252473,674940,220674,845
,423,315,235,158,021,993,120,638,323,771,408,042,720,600,147,302,006,952,319,062,623,278,121,704,003,265,378,644, 733,173990,685
, 355,097,010,353, 326,812,033,660,027,260
Deficit.
577,223545,33797,23775,872
3,370,851123,670
20,228,379761,302307,071
5,407,606596,669
1,119,7347,688,220
660,619395,993263,676920,980
1,868,6431,128,244
67,3771,276,6781,527,924
435,2461,758,747
203,634
in
o
oI—I
b
1,461,238,475 !l,501,214,919 ;99,970,444
Digitized for FRASER http://fraser.stlouisfed.org/ Federal Reserve Bank of St. Louis
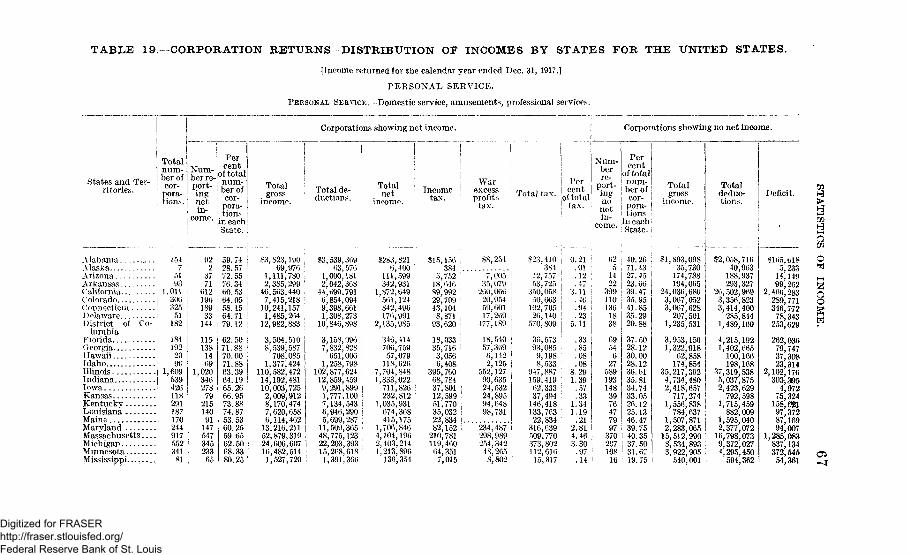
TABLE 19. CORPORATION RETURNS DISTRIBUTION OF INCOMES BY STATES FOR THE UNITED STATES.
[Income returned for the calendar year ended Dec. 31, 1917.]
PERSONAL SERVICE.
PERSONAL SERVICE.—Domestic service, amusements, professional services.
Corporations showing net income.
States and Ter-ritories.
| Totali num-| ber ofj cor-! pora-
tions.in-
i come.
Percent
! tions j;in each jState. ;
Alabama , 154 j 92 59.74 jAlaska 7 ! 2 28.57 !Arizona 51 : 37 72.55 IArkansas ' 93 i 71 76.34 ;(California : 1,011 \ 012 60.53 {
Colorado j 300 | 190 04.05 •Connecticut ! 325 ! 189 58.15 !Delaware j 51 j 33 ; 64.71 ;
District of Co- j 182 144 79.12 ilumbia I | \ >
Florida ; 184 | 115 62.50 !Georgia ! 192 j 138 71.88 iHawaii 20 j 14 70.00Idaho ! 96 j 69 71.88 jIllinois | 1,609 1,020 63.39Indiana 539 346 64.19 ;Iowa I 426 ! 278 65.26 iKansas i 118 79 66.95 1Kentucky < 291 215 73.88 'Louisiana 187 140 74.87 ;
Mains ; 170 91 53.53 iMaryland 244 1 147 60.25Massachusetts 917 • 547 59.65Michigan 552' 345 62.50;Minnesota 341 ! 233 68.33Mississ ippi . . . . , . , , 81 , 65 80,25*
Totalgross
income.Total de-ductions.
$3,823,190 ;69,976
1,111,7802,385,299 !46,563,4407,415,218 i10,241,1571,485,26412,982,883 i
3,504,5108,539,587708,085
1,377,424110,582,47214,192,48110,003,7252,009,9128,170,4747,620,6586,114,46213,216,211 |52,879,31924,606,60716,482,5141,527,720
$3,539,36963,576
1,000,1812,042,36844,690,7916,854,0949,398,6611,308,27310,846,898
3,158,096 i7,832,828 j651,006 !
1,258,798 |102,877,624 |12,859,459 !9,291,8991,777,1007,134,543 I6,946,290 I5,699,287 :11,509,365 ;48,775,12322,203,39315,268,618 '1,391,366
Totalnet
i
$283,821 ]6,400 '
111,599342,931
1,872,649561,124842,496176,991
2,135,985
346,414706,75957,079118,626
7,704,848 I1,333,022 j711,826 '232.812
1,035; 931674,368415,175
1,706,8464,104,1962,403,2141,213,896136,354
: WarIncome ! excess
tax. • profitstax.
$8,254$15,
5,18,89,29,43,8,
93,
18,35,3,6,
395,68,37,12,51,
150384752646992709104871620
033716056408760784801599770
35,03222,82,210,119,64,7,
834152781460351015
i, cos I35,079 I200,006 !20,954 I59,601 !17,209 !
477,189 I
18,54057,3696,1422,125
552,12790,63524,53224,89594,64898,731
234,487298,989254,34248,2658,802
$23,410 1384 j
12,75753,725350,058 !50,663 !102,70526,140 !570,809
36,57393,0859,1988,533
947,887 '159,41902,333 l37,494146,418133,76322,834316,639509,770373,802112,61615,817
Corporations showing no net income.
Num-berre-ingno
netin-
come.
0.21.01.12.47
3.11 !.46 I.94 i.23 1
5.11 I
.33 !
.088.291.39.57.33
1.341.19.21
2.814.463.30.97.14
14223991101361838
6954627589193148397647799737020710816
j Percent
(of total! num- :| ber of| cor- '| pora-| tionsin each! State.
40.2671.4327.4523.6039.4735.9541.8535.2920.88
37.5028.1230.0028.1236.6135.8134.7433.0526.1225.1346.4739.7540.3537.5031.6719,75
Totalgross
income.
$1,893,09835,730174,788194,065
24,036,6803,007,0523,067,628207,501
1,235,531
3,953,1561,322,918 j
62,858 )174,854 I
35,217,3624,734,4802,418,657717,274 ;
1,556,838 i784,637 ;
1,507,871 j2,283,065 !
15,512,990 '•8,534,893 j3,922,905 !
540,001 I
Totaldeduc-tions.
$2,058,71640,903188,937293,327
20,502,9693,356,8233,414,400285,844
1,489,160
4,215,1921,402,665100,166198,168
37,319,5385,037,8752,423,629792,598
1,715,459882,009
1,595,0402,377,07216,798,0739,372,0274,295,450594,362
Deficit. 3>m
a
$105,0185,23314,14999,262
2,406,283289,771346,77278,343253,629
262,03679,74737,30823,314
2,102,176303,3954,97275,324158,62197,37287,16994,007
1,285,083837,134372,54554,361
3oog
Gi
Digitized for FRASER http://fraser.stlouisfed.org/ Federal Reserve Bank of St. Louis
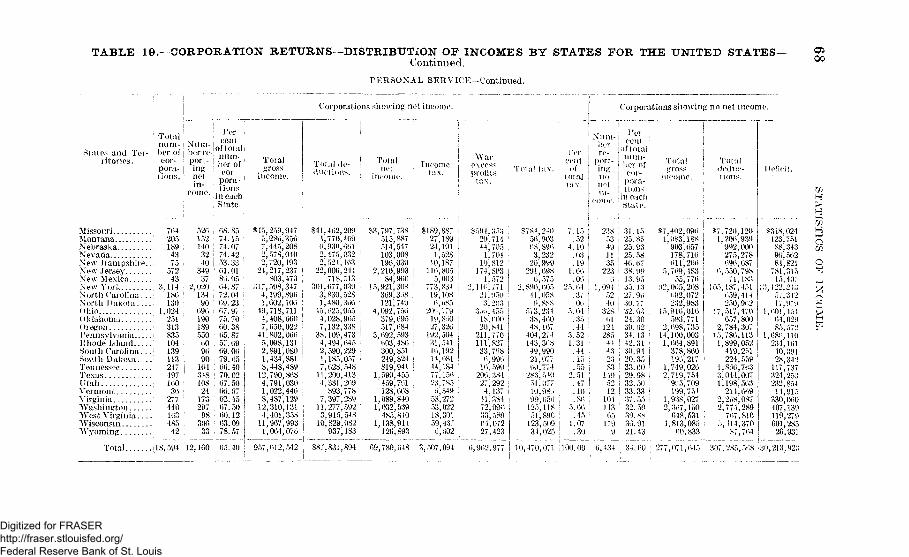
TABLE 19.—CORPORATION RETURNS—DISTRIBUTION OF INCOMES BY STATES FOR THE UNITED STATES-Continued.
PERSONAL SERVICE—Continued.
Corporations showing net income.
00
1 Totalnum-
SI ales and Tor- ber ofritories. cor-
pora-i
•ort- Iing ber of i
1 cor- i
•me ! . a o n s xm c # in eachi State.
Missouri 704Mon tana 205Nebraska 189Nevada 43New Hampshire.. 75New Jersey 572New Mexico 43New York 3,114North Carolina...: 180North Dakota 130Ohio 1,024Oklahoma 251Oregon 313Pennsylvania 835Khode Island : 104South Carolina...! 139South Dakota ' 113Tennessee 247Texas 497Utah ; 100Vermont 30Virginia 277Washington j 440West Virginia | 103Wisconsin I 485Wyoming j 42
Total il8,594 (12,100 05.40
520 ,152 ,140 !
32 !40 |
349 !37 '
2,020 i134 i
90 !
090 i190 ;189 '550 ;
00 i9 0 •
90104 :348 i108 i24
17329798 :
30033
08.8574.1574.07 i74.42 ;53.3301.01 I815.0f> :04.87 !72.04 i09.2307.9775.70 {
00.38 !05.87 !57.09 I09.00 i79.05 i00.40 I70.02 !07.50 |00.07 |02.45 j07.50 !00.12 !03.09 j78.57
Totalgross
income.
$45,259,5,-280,'7,445;2,578,2,720,
24,217,803,
317,598,4,199,1,002,
19,718,4,408,7,050,
41,802,5,098,2,891,1,434,8,448,
12,790;4,79i;1,022,8,487,
12,310;4,401;
11,907;1,004,
Total de-ductions.
$41,402,4,770,«,93O,2,475,2,524,
22,000,718,
301,077,3,830,1,480,
45,025,4,028,7,132,
38,109,4,494,2,590,1,185,7,028,
11,200,1,331,
893,7,397.
11,2773,915
10,829937
Totalnet
income.
Incometax.
Warexcessproiits
t a x .
! Num-! ber
iYr I re-cent port-
Tola! tax. ; of ing-total I notax.
Corporations showing no net income.
con
cent•)f t o t a lnum-ber ofcor-pora-
, tions,", Jin each
" ; State.
209 '409001 .032 !
403 :
244513 .039 '.528 ;300 I955 i905 I338 i473 i045 !
229057 '548413209778289592
; 548082
S3,
2
15,
4,
3,
1,
1,1
1,
797,738 i515,887514,547103,008190,030210,993 I84,900 '
921,308 i309,308 i121,740 *092,750 |379,095 i517,084 !092,593 i003,480 I300,851 i249,824 I819,941 I590,455459,701 ,128,008 :
089,840 :032,539485,810 i138,911120,893
$189,88727,18924,1911,52810,187110,8055,003
773,83419,1080,085
20b,77919,80027,320192,50431,54110,19214,08144,18477,15023,7850,S4958,27253,02218,30159,4370,(302
?594,35329,71444,7051,70410,812174,893
1 5722,110^771
21,9503, 203
3 .0, 45518,TOO20,841211,770111,82733,7980,99010,590200,38427 2924 13741,38472,09033,58904,07227,423
$784,24050,90308', 891)3,232
20,999291,098
0 5752, 890,'005
41,058(.),8S8
573,23138,40048,107
404,274143,30849,99021,07700,774
283,54051,07710,98.>99,050125,11851,890123,50934,025
7.15.52
4.10.03.191.00.00
25. 04.37. (fa
5.04. 35.44
3.521.31.44.15. 55
2.51.47.10.80
5. 00.45
1.07.30
238 i53 i49 in :35 \
223 jo ;
1,094 !52 i40 !
328 !01 I
124 j285 !44 !43 !23 i83 I149 j52 '12 !
104;143 ;
' 05179 ,9
31.1525. S525.9325. 5840.0738.9913. 9535. 1327.9030. 7732, fti24.3039. 0234.1342. 3130.9420.3533.0029.9832.5033.3337.5532.5039. 883o. 9121.43
$7,1,
f,
1)2
15,
o14*1,
1,2
1,2
4,
402,090083,188903,057178,710till, 200709,48355,770
005,208002,072232,9839U> 011)593*771098,735100,003004,891378,80019o,217749,020719,754905,709199,754938,027307,150048,531813,08500,833
5*7,1,
0,
105,
1",
2,15,1,
1,3I,
22
5
7202009922750905507118705925051705778478089941922480004419821420877470711487
957,012,542 I 887,831,894 09,780,048 3,507,094; 0,902,977
Total I Totalgross | (ledi'.c- Deficit,
income. tions.
i,120 $3L8,024i,939 123,751!, 000 88,343i,278 90,502.,087 84,821
798 781,315,183 15,407,451 13, 122,-243|,414 57,342),9C2 I 17,979,470 | 1,001,454,800 I 04,029,307 85,572
I , 1 1 3 1,08!",, 1101,052 234,1011,251 40,391r,559 28,342i,703 117,737:,007 324,253;,503 232,854»,009 14,915
8,087 330,0004,289 407,1397.810 ! 119,2794J370 j 001,285•7,704 20,931
in
H
H
o
10,470,071 1100.00 0,434 34.00 277,071,045 307,285,508 (30,213,923
Digitized for FRASER http://fraser.stlouisfed.org/ Federal Reserve Bank of St. Louis
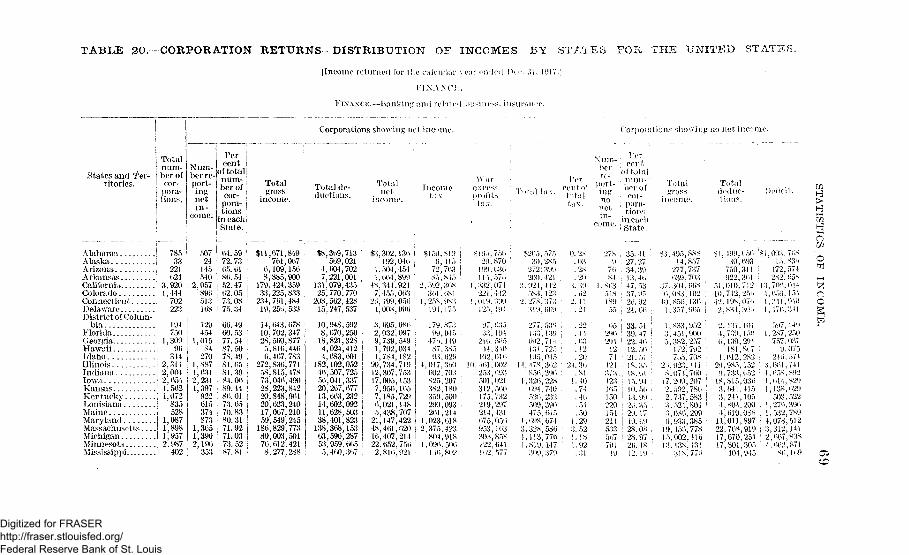
TABLE 20. CORPORATION RETURNS DISTRIBUTION OF INCOMES BY STATES FOR THE UNITED STATES.
[Income returned for the. calendar year ended The. ;>i, 1917.';
F I N A N C E .
FINANCE.—Bunking and related business, insurance.
States and Ter-ritories.
Alabama jAlaska jArizona IArkansasCaliforniaColoradoConnecticut ;DelawareDistrict of Colum- i
bia 'FloridaGeorgia ,Hawaii iIdaho ;Illinois iIndiana !Iowa |Kansas |Kentucky ILouisiana iMaine iMaryland jMassachusetts !MichiganMinnesotaMississippi ;
Totalnum-ber ofcor-
pora-tions.
-
Num-ber re-port-
ingnetin-
come.
Corporations showing net income. Corporations showing no net income.
785 I33
221 !
024 :3,9201,444702 ,223
194750
1,309 i90
3442,3112,0042.6541,5021,072
835528
1,0871,8981,9572', 987
402
Per jcent |
of total!num-!her of |cor- j
pora- jtions
in each IState, i
507 04.59 I24 72.73 |
145 I 05.01 !540 I 80.54 :
2,057 ! 52.47 ,890 | 02.05 i513 | 73.08168 ! 75.34
Totalgross
income.
129454
1,015 ;84 ;
2701,8871,0312,2311,397922015374873 :
1,3051,3902,190353 ,
00. 4960.5377.54 i87.50 i78.49 I81.05 i81.39 I84.00 i89.44 i80.01 j73.05 |70.83 i80.31 I71.92 i71.03 |73.52 i87.81 |
$11,671,849701,007
0,109,1508,885,900
179,424,35933,225,833234,701,48419,250,533
14,043,078 j10,702,347 !28,500,8775,810,4400,407,783
272,830,77158,815,47873,046,49028,223,84220,848,90120,023,24017,007,21059,549,245
186,829,77380,003,50170,012,4218.277,288
Total de-ductions.
$8,309,713 '509,021
4,004,7027,221,001
131,079,435 I25; 770.770 ;208,502,428 i15.247,537 !
10,948,8, 070!18,821i4,024,4,083,
182,102;40,507,50,041,20,207;13,663,14,602;11,028,38,401;138,368,63,596,53,959'5,400!
592 i250 j328412601052725337077232092503823153287005307
Totalnet
income.
$3,302,130 !192,040 1
1,504,454 !
1,004,899 !48,344,9247,455,063 i
2(1,199,050 !4,00S,990 j
3,095,0802,032,0979,739.5491,792,0341,784,182
90,734,71912,307,75317,005,1537,950,1057,185,7290,021,1485,438,70721,147,42248,461,6201(1,407,21422.652,750
Incometax.
W a rexcesprofit' t a x .
$159,819 i9,415 !
72,703 I85,845 !
2,592,368301,081
1,25S',<)S3191, 175
179.87399,945
47«i, 14987,38593,029
4,017,300002,703825,207 :382,180350,500290,093201,214
1,023,018 .2,375,423
804,9181.090.500 .
J4O,8(.^
55105.20'.
199,
1,332'22i;
1,019.125.
117,33,
210.44.
102,10. 401,
253,501,312,175,219,214,075,953,30S,122,102,
Total la
Percento!totaltax.
870030
074442390494
19150534001000209302150073229743105010380S041577
§205,30.
272;200,
3,924,5S3,
2.278319,
,133,092,131.105',
14,478,S56J
1,320,094,52(1,509475
1,0983.3281,1131,819
309
285399421442 !
123373009
508 ;139 i714 :725 >045 :
.302 ;
228740232
, 390,045, 074,580,770,147, 379
0.2*AW
.JO3. i'J
N um-berre-
port-ingnonetin-
come.
Per: centioftjta], TI um-
ber of• cor-; pora-
tions'.in eachi State.
. (.31 2
.2024. 3<
. s i1. U)
. 7 '
. 40
..",1
. 501.293. 521. i s1.92..51
'2%2M1
1271
123U.5150'220154214533
Total
income.
Totaldeduc-t ions.
, 195, NSS14,s57
277,737t.39, 703
..$01,0i>s. .(W, 102),S5h. 13(>1,357,905
, r51,900,.K2,257
i 72,7927n5,70s
, 923, Ml.07l,7<»0,25)0,207, 5 0 2 , 7 M .,737, 5S3 '
750,311922, 3i-I
Deficit.
51.00',.7
172,.l
1 >,70 ». 04. (>.")). 1
2. ITi. 1014,7.VJ, 150
1,012, LViiN.iKi, 15'2
3, (.41. 4153.241,105I, SOU 200
I. 171.. ''.
.7(7. 1
757.9.
21b.{.()i>l,1 A 5x,l,<>Li,l,13>,
503,
«.«.) i».iW3,3N5 11,011,897 1,07^,512()« , 19, 15), 778 22,76S,919 3,312,14197 1"). 002,116 17,070,25 \ 2, '< \ .7, S3sis U. UK 431 17. SOU 305 I.t,i.2,s711M !is,77(> 101.915 s i , , \(,<)
H>
o
Digitized for FRASER http://fraser.stlouisfed.org/ Federal Reserve Bank of St. Louis
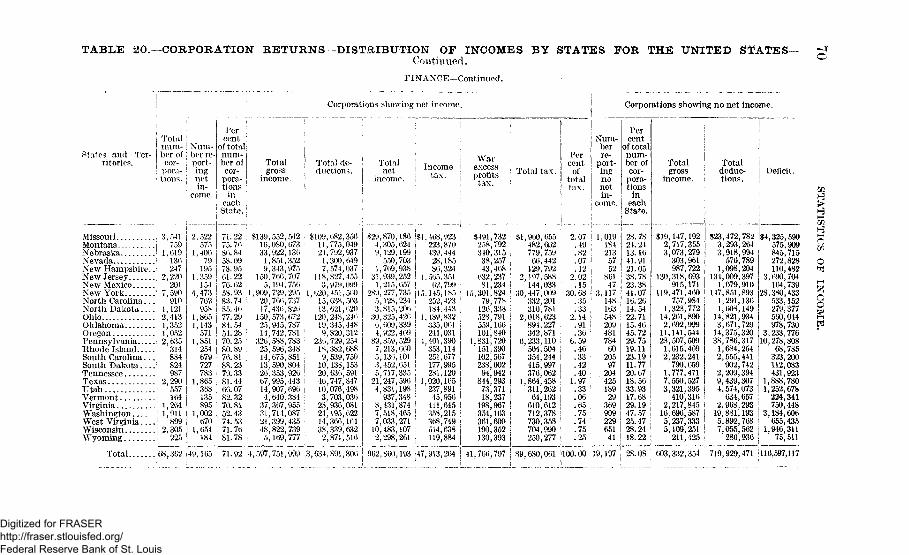
TABLE 20.- CORPORATION RETURNS -DIST&IBUTION OF INCOMES BY STATES FOR THE UNITED StfATES-Contimied.
FINANCE-Continued.
States and Ter-ritories.
MissouriMontanaNebraska..NevadaNew Hampshire..New JerseyNew MexicoNew York.. .North Carolina...North DakotaOhioOklahomaOregon . . .PennsylvaniaRhode IslandSouth Carolina...South DakotaTennesseeTexasUtah . .VermontVirginiaWashingtonWest VirginiaWisconsin .Wyoming
Total
Totalnum-ber ofcor-
pora-tions.
3,541759
1,619130247
2,220201
7,590910
1,1212,4131,3521,0522,035
314884824987
2 290557104
1,2041,911
8992,305
225
08,362
Num-ber re-port-ingnetin-
come.
2,522575
1,40079
1951,359
1544,473
7(52958
1, SOS1 143
5711,851
254679727783
1 865368135895
1,002670
1,654184
49,165
Percent
of totalnum-ber ofcor-
pora-tions
meachState.
71. 2275. 7080.8458.0978.9501.2270.0258.9383.7485. 4077.2984. 5454.2870.2580.8970.8188.2379.3381.4466.0782.3270.8152.4374.5371.7681.78
71.92
Totalgross
income.
.$139,552,,54216,080,67333,922,13<>1,851,3529,343,975
150,760,7075,194,750
1,909,729,29520,700,73717,430,820
150,573,07225,945,78711,742,781
320,588,78325,590,34814,075,85113,590,80420,353,92007,995,44314,907,6904,040.384
37,307,95531,714,08721,399,43548,822,7395,109,777
4,597,751,999
Corporations showing net income.
Total de-ductions.
$109,082,35011,775,04921,792,9371,300,0497,574,037
118,827,4553,979,0y9
l,020,451,5i>()15,038,50313,021,020
120,248,24019,345,4489,820,312
230,729,25418,382,0889,539,750
10,133,15320,630,59140,747,84710,076,4983,703,030
28,936,08124,195,62214,360,10438,339,6322,871,516
3,034,891,800
Totalnet
income.
§29,870,1804,305,0249,129,199
550,7031,709,938
31,939,2521,215,057
289,277,7355,128,2343,815,200
30,325,4200,000;3394,922,409
89,859,5297,213,0005,130,1013,452,0515,717,335
21,247,5904,831,198
937,3488,431,8747,518,4057,033,271
10,483,1072,298,261
902,800,193
Income
.
§1,4(38,923223,870439,44428 18580,324
1,505,35102,799
15,145,185252,423184,443
1,489,832335,001241,031
4,401,390353,114251,077177,995281,120
1 020,165237,89145,956
411,645358,2153(38,749514,638119,884
47,913,204
profits
$491,732258,792340,31538,25743,468
032,23731,234
15 301,82479,778
120,338528,791559,160101,840
1,831,720151,390102,507238,00294,942
844,29373,37118,237
198,967354,163361,609190,352130,393
41,700,797
Total tax.
$1,900,055482,602779,75966,442
129,7922,197,588
144,03330,447,009
332,201310,781
2,018,623894,227342,871
6,233,110504,504354,244415,997376,062
1,864,458311,26264,193
610,012712,378730,358704,990250,277
89, &80,001
Percent
oftotaltax.
2.0749
.8207
.122.02
.1530. 08
. 35
.332.14
.91
.306.59
.46
.33
.42
.401.97
.33
.06A\5. 75.74.75.25
100.00
Num-berre-
port-ingnone tin-
come.
1,019184213
5752
80147
3,117148163548209481784
60205
9720442518929
36990922965141
19,197
Corporations showing no net income.
Percent
of totalnum-ber ofcor-
pora-tions
ineach
State.
28.7821.2413.1641.9121.0538.7823.3841.0716.2614.5422.7115.4645.7229.7519.1123.1911.7720.6718.5633.9317.6829.1947.5725.4728.2418.22
28.08
Totalgross
income.
$19,147,1922,717,3553,073,279
303,961987,722
130,318,093915,171
119,471,4(30757,984
1,323,77214,261,8902,692,999
11,141,54423,507,5091,615,4692,232,241
790,6591,777,4717,550,5273,321,395
410,3162,217,845
16,696,5875,237,3335,109,251
211,425
003,332,354
Totaldeduc-tions.
$23,472,7823,293,2043,918,994
576,7891,098,204
134,009,3971,079,910
147,851,8931,291,1361,608,149
14,821,9343,071,729
14,375,32038,780,3171,684,2542,555,441
902,7422,209,3949,439,3074,574,073
634,6572,968,293
19,881,1935,892,7687,055,562
286,936
719,929,471
Deficit.
Tf:
$4,325,590 £575,909 tf845,715272,828 O110,482 ^
3,690,704164,739 K
28,380,433 £533,152 g279,377 S560,044 M978,730 IS
3,233,77610,278,808
68,785323,200112,083431,923
1,888,7801,252,678
224,341750,448
3,184,606655,435
1,946,31175,511
116,597,117
Digitized for FRASER http://fraser.stlouisfed.org/ Federal Reserve Bank of St. Louis
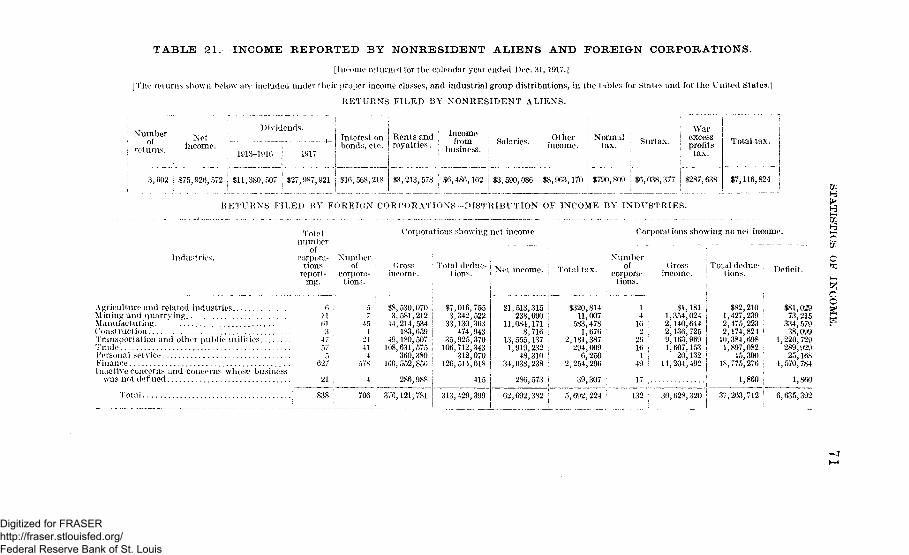
TABLE 21. INCOME REPORTED BY NONRESIDENT ALIENS AND FOREIGN CORPORATIONS.
[Income returned for the calendar year ended Dec. 31, 1917.|
[The returns shown below are included under their proper income classes, and industrial group distributions, in the tables for States and for the United States.j
R E T U R N S F I L E D BY N O N R E S I D E N T A L I E N S .
Numberof
Dividends.Net Interest on Rents and
1917bonds, etc. royalties.
Incomefrom
business.Salaries. Other
income.Normal
tax. Surtax.
3,602 i $75,926,572 ! $11,380,507 $27,987,921 j $16,568,218 $3,213,578 \ $6,486,162 j $3,590,086 ; $8,963,170 j $790,809 I $6,038,377 $287,638 $7,116,824 j
R E T U R N S F I L E D BY FOREIGN C O R P O R A T I O N S - D I S T R I B U T I O N OF INCOME BY I N D U S T R I E S .
Industries.
Totalnumber
ofcorpora- Number
tions ofreport- corpora-
ing, tions.
Corporations showing net income. Corporations showing no net income.
Grossincome.
Total deduc- jtions. i Net income. • Total tax.
A gricult ure and related industries G , 5 38,530,070 i $7,016,755Mining and quarrving 11 7 3,581,212 1 3,342,522M anufacturing 61 45 44,214, .534 | 33,130,363Construction 3 1 483,659 I 474,943Transportation and other public utilities 47 21 49,480,507 ! 35,925,370Trade . . 57 41 108,631,575 i 106,712,343Personal service 5 4 360,380 ; 312,070Finance . 627 578 100, 552,856 • 126,514,618Inactive concerns and concerns whose business ;
was not defined
Total
$1,513,315 I238,690 |
11,084,1718,716 i
13,555,137 I1,919,232 i
48,310 i34,038,238 i
$320,81411,007
583,4781,676
2,181,387294,009
6,2502,254,296
21 :
838 •
4
706 1 376,
286,988 j
121,781 | 313,429,
415
399 62,
286,
692,
573 1
382 !
39,
5,692,
307
224
Numberof
corpora-tions.
14
16 :2 :
26 ;16;I ;
49 !
17
(Jrossincome.
$1,1811,354,0242,140,6442,136,7259,163,9691,607,153
20,13214,204,492
; Total deduc-5 tions.
$82,2101,427,2392,475,2232,174,824 i
10,384,6981,897,082
45,30018,775,276 j
1,860 j
Deficit.
$81,02973,215
334,57938,099
1,220,729289,92925,168
4,570,784
1,860
C
C
132 ' 30,628,320 ! 37,263,712 ) 6,635,392
Digitized for FRASER http://fraser.stlouisfed.org/ Federal Reserve Bank of St. Louis
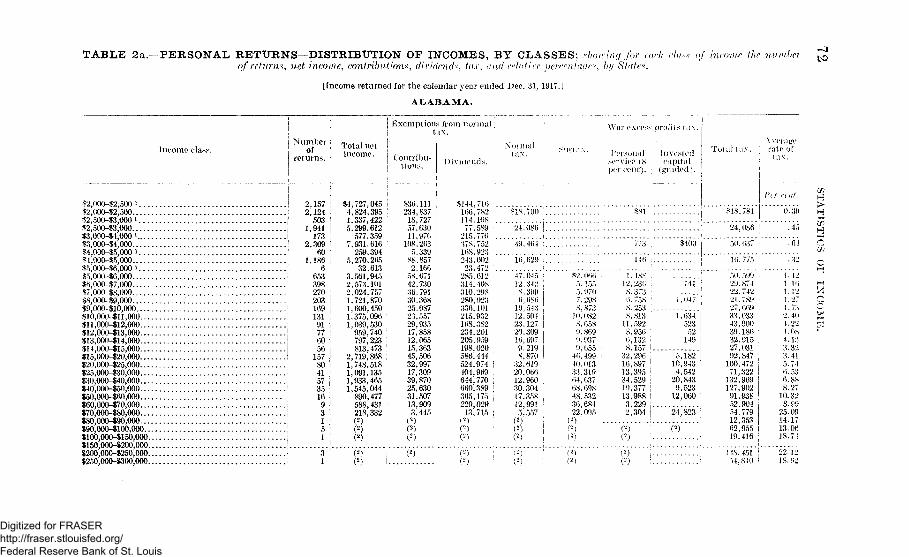
TABLE 2a. PERSONAL RETURNS—DISTRIBUTION OF INCOMES, BY CLASSES; showing for each claxx of income the numberof return**, net income, contributions, dividend*, tax, and relative percentage--, by State*.
[income returned for the calendar year ended Dec. 31, 1917.]
A L A B A M A .
to
$2,000-$2,500 i$2,000-$2,500$2,500-$3,000 i$2,500-?3,000$3,000-$4,000 i$3,000-54,000«4000«5;000i$4,OOO-$5,OOO$5,000-16,000 K...$5,00O-$6,000$fi, 000-17,000$7,000-$8,000$8,000-89,000$9,000-$10,000$10,000-$ll ,000.. . .$11,000-$12,000....$12,000-$13,000....$13,000-$14,000....$14,000-115,000....$15,000-$20,000....$20,000-$25,000....$25,000-$30,000....$30,000-$40,000....$40,000-$50,000....$50,000-160,000....$60,000-$70,000....$70,000-$80,000....$80,000-$90,000....$90,000-$100,000...$100,000-S150,000..$150,000-$200,000..$200,000-«250,000..$250,000-$300,000..
I Exemptions from normali tax.
Income class.Number
ofreturns.
2,1572,124
503 ;1,941 i
1732,309
601,186
6653398270 ;203 i169 j131
i6056 I
157SO4157351693 !1 i5 j1 !
Tota l netincome.
$4,727,0454,824,3951,337,4225,299,612
577,3597,931,616259,394
5,270,26532,613
3.561,9452,573,1012.024,7571.721,8701,600,4501,375,0961,039,530959,740797,223813,473
2,719,8681,748,5181,091,1351,933,4651,545,044890,477588,431218,332(2)
Contribu-
te. Ill234,837
18,72757,63011,976
108,2635,339
88,8572,166
58,67142,73036,79130.36825,08723,55729,93517,85812,06515,36345,50632,99717,30939,87025,63031,50713,9093,445
C2)(2)(*)
Dividends.
SI 44,716166,782114.10877,589
215,77637S.752168,923243,00223.472
2S5.W2314,40S310.298280,923336,101215,932168,382234,201205,959198,020586,444524,974 |404,969 ,644,770 |660,389 l
305,175 ;229,02913,715 i
00(2)
War excess profit
Normaltax.
?18.700 :
16,629 !
47.04512,3428,3996,686
10.54312,504 j23,127 |20,309 i16,697 I9.219 I8,870 |
32,619 I20,06612,960 I30,304 ;17,358 i12,9915,557
(2)
(2) (•-')
Personal Invostcdservice (8 capitalper ecu('). (graded).
Total tax.
SSI
$400
SIS.781
A vrragerate of
Per cent.
6"39
24,086 I
50,637
V. 1555.9707.29SS,873
10.0828, 6589,8699,9379,655 .:
46,499 i40,01333,31964,637 '68,698 ,48.53236,68422.095
))
1. 488J2.236S.3736.75SS.253S.81311.5928,9566,1328,157
32,29616,89713,39534,52919,37713,9883,2292,304
(~)
141
1,047
1,63452352149
5,18210,9434,542
20,8439,523
12,060
24,823
50.59929.87422.74221.78927,66933,03343,90039.18632,91527,03192,847100,47271,322
132.969127,90291,93852,90454,77912,35362,95519.416
1.421.161.121.271.732.404.224.0s.4.133.323.415.746.536.888.2710.328.9925.0914.1713.0618.74
U.S. 45154,840
22-1218.62
o
Digitized for FRASER http://fraser.stlouisfed.org/ Federal Reserve Bank of St. Louis
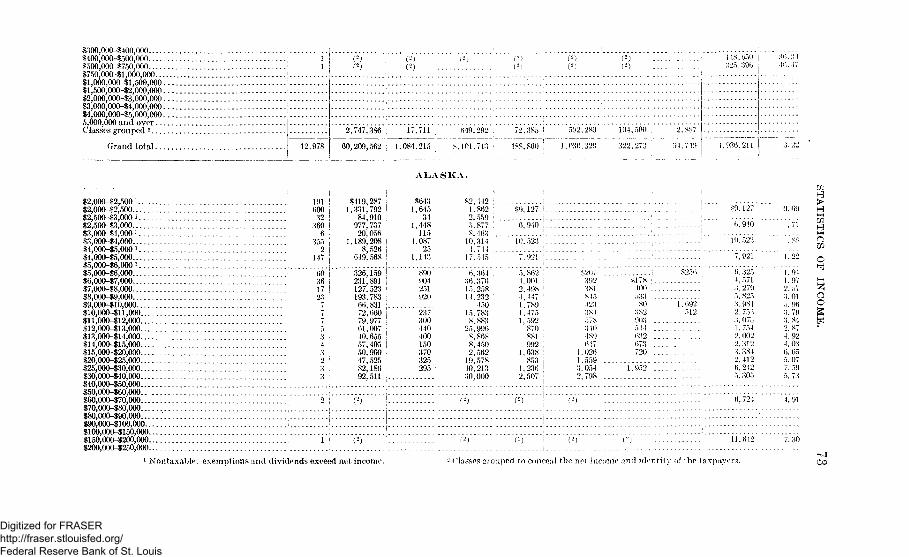
S300,000-$400,000$400,000-S500,000 i$500,000-$750,000 i$750,000-$l,000,000 1Sl,000,000-$1,500,000 1.$1,500,000-$2,000,000 !$2;000,000-$3,000,000 !.$3,000,0O0-$4,00O,O0O I.$4,000,000-$5,000,0005,000,000 and overClasses grouped 2
Grand t o t a l . .
325.396
12,978
2,747,386 ; 17.711 649,292
60,209,562 | 1,081.215 s,101.713
72.3X5 5(i2,2S9 101,500
1.030,320 , 322.273
2 S«7 Ii
;M,7!') I 1.'.ISO. 211
A L A S K A .
$2,000-82,500 l
$2,000-$2,500$2,500-$3,000 i$2,500-13,000$3,000-84,000 l
•S3,OOO-$4,OOO$4,000-$5,000 iS4,0O0-S5,0O0$5,000-$6,000 i,$5,000-16,000$6,000-$7,000$7,00O-$8,000$8,000-$9,000$9,000-$10,000$1O,OOO-$11,OOO$ll,000-$12,000$12,000-$13,000$13,OOO-$14,OOO$14,000-115,000$15,000-$20,000$20,000-$25,000$25,000-330,000$30,0O0-$40,00O$40,000-150,000$50,000-$60,000$60,000-$70,000$70,000-$80,000$80,000-$90,000 '$90,000-$100,000$100,000-$150,000$150,000-$200,000$200,000-$250,000
600 j32 j
360 !6 .
$419,2871,331,792 !
84,910 |977,737 i20,056 !
1.189,208 j8,526 |
649,568 !
$6431,645
341,448
1154,087
251.143
$2,4421.8622,5595.8778, 463
10,3141,744
17.545
$9,127 I.
6.940
7.921
60361723
326,159 !231,891 !127.523 |193.783 i66,831 i72,660 |79,97761,007 i40,655 |57,405 i50,90047,52582,18692,511 . . . .
890904251920 '
2373 0 0 ;440 i400 i150 !370 |325 I295 |
!
6,364 ,36,376 i15,258 114,232 1
45015,7838,883
25 ,9%S,86S ;
8,450 i2,562
19,57840,21330,000
5.8621,0012, 4984,4 471, 7891.4751,592
870881992
1.638853
1,2362,507
S2073923818)5
3St578310480647
1,0261,5593,0542,798
§178100533
SO382003514632673720
1.692512
1,952
c-)
$9,127
6,910
10,523
7,921
6.3254,5713,2795,8253,9812.75°,3,0731.7542.0022,3123,3842.4126,2425,305
6, 724
11,612
. 69
.71
. 88
H
1Owo
3ao
1 Nontaxable; exemptions and dividends exceed net income. 2 Classes grouped to conceal the net income and identity of the taxpayers. CO
Digitized for FRASER http://fraser.stlouisfed.org/ Federal Reserve Bank of St. Louis

TABLE 2a.— PERSONAL RETURNS—DISTRIBUTION OF INCOMES, BY CLASSES; showing for each do** of income the numberof return-, net income, eonfrihvtion , dividends tax, and relative percentages, by State:—Continued.
ALASKA—Continued.
| Exemptions from normal j •<\ t a x . i I
Income class.
$250,000-$300,000$300,000--1M 00,000S400,000-$500.000$500,000-1750,000$750,00O-$l,000,000...SI,000,000-$l,500,000.$1,500,000-$2,000,000.$2,000,000-$3,000,000.$3,000,000-11,000,000.% 1,000,000-$5,000,000.$5,000,000and over..Classes grouped »
(Jrand total
War excess profits tax.j Number
of Total netincome.
tions. I Dividends.
! Normal j Surtax,tax. Personal I Invested
service (8percent).
capital(graded).
Total tax.Averagerate of
Per cent.
$296,109 .... $287,189 ; $328 \ $17,798 j $240 i
1,876 ; 0,508,506 $14,622 i 574,008 ; 05,480 j 30,921 7,237 I $2,460 I $106,098
A R I Z O N A .
1.63
O
oC
$2,000-$2,500 2.$2,000-$2,500...$2,500-$3,0002.$2,500-$3,000...$3,000-$4,0002.$3,000-$4,000...$4,000-$5,000 2.$4,000-$5,000...$5,000-$6,0002.$5,000-$6,000...$6,000-$7,000...$7,000-18,000...
9451,662164
1,25853
1,208255224
311242155
$2,062,0103,733,581436,054
3,421,508179,844
4,037,748112,044
2,322,36221,390
1,694,4931,535,3811,155,073
$7,5357,3152,45513,6881,388
20,2441,40913,4811,42811,08911,00814,664
$38,81424,14531,70744,38479,95469,66180,724109,89617,700133,80298,741123,281
$16,459
17,275
28,537
25,670
24,60027,61221,800
$1,2203,1353,611
[
j
|
$192
168 |
5"|::::::::::.:1,912 !4,245 !
$16,459
17,275
28,729
25,838
25,82532,65929,656
0.44
.50
.71
1.11
1.522.132.57
Digitized for FRASER http://fraser.stlouisfed.org/ Federal Reserve Bank of St. Louis
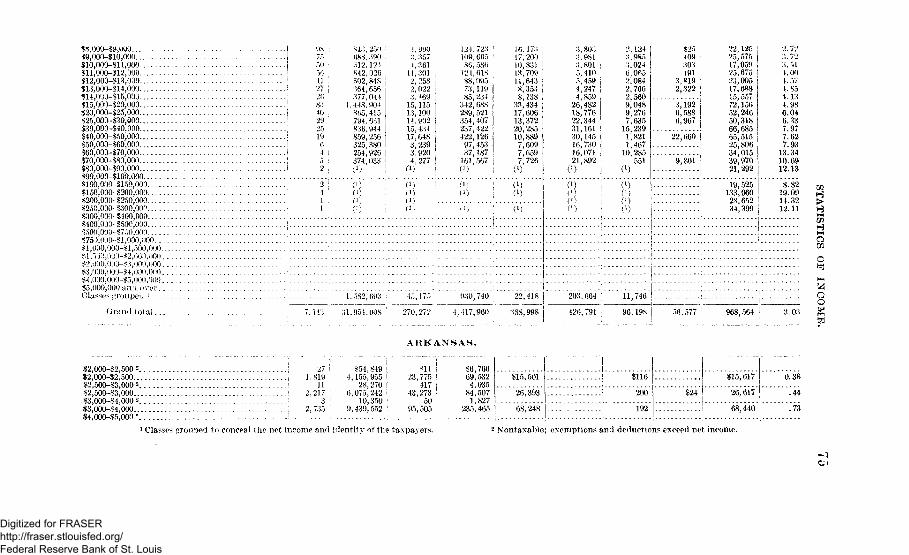
$*,000~$9,000 -$9,000-$10,000.$10,000-111,000...$ll,000-$12,000$12,000-113,000$13,000-814,000$14,000-$15,000$15,000-$20,000$20,000-425,000$25,000-130,000$30,000-140,000$40,000-$50,000$50,000-$60,000$60,000-$70,000$70,000-$80,000$80,000-190,000$90,000-$100,000$100,000-^150,000$150,000-3200,000*200,000-$250,000•S250,0')0-(?300,00nswo,oo:)-$40o,ooo$400,0 JO- $5()(\000
O S 7 5•$75 V> H>-$1,'MM),.>r)Os i , 000,000-^1, 500,ni)()
l " / i ; D < 2 ^ ) ) ) K )
, , ,$5,000,000 an-i over .I'la-^ex grouped '
Grand total
9K7550 :5 6 :•
11 i2 7 |26 |83 !40 |29 125 i19 I6 j4 !5 !2 !
24L1
813, 2.)0688.390532' 124642,026502,84S364,656377,044
1.448,904865, 415794,631836,944859,256325,380254,926374,033
ro111
4,95X)3.3571,36111,3012, 2582,0223. 46915,11513,10014,90215, 43117,6483,2393,9204,277
A)'
0)
<i)
124,723109,66586,586
121,61888,09573,11985,234
342, 688289,521354.407237; 422422,12697,45337,187
161.567
16,17317,20010, 83113,70911,6438,3538,138
33,43417,60613,37220,28510.8897, 6097,6597,726
C1)
(M
2,1243,9853,0246,0651>.0842,7662,5609,0489,2767,635
15,2391,8211,467
10,285551
3,2,
3,
6,
22,
9,
$2.)409303491R19322
192588967
660
801
I1)
(M
1.582,693 15,175
31,954,008 : 270,272
930,740 22,418
4,417,960 388,998
203,664
426,791
11,746 !.
96,198 I
22,12525,57517,95925,67523,00517,08815,55772,15652,24650,31866,68565,51525,80634,01539,97021,292
19,525 j133,960 :28,65234,399
968,564
2.723. 723.514.004.574.854.134.986.046.337.977.627.93
13.3410.6912.13
8.8219.0914.3212.11
3. 03
1Q
A R K A N S A S .
$2,000-$2,500 2.$2,000-S2,500...$2,500-$3,000 2 .82,500-$3,000...$3,000-14,000 2.$3,000-14,000...14,000-15,000 \
1,819 !11 i
2.217 I3 !
2,735 ;
154,849 !4,155,955
28,2706,075,242 I
10,350 !9,439,552 J
*n !23,775 !
4 1 7 ;43,273 !
50 I95,505 !
$6,76669,5324,03584,5071,827
235,465
$15,501
26,393
68,248
$116
200
192
$24
$15,617
26,617
68,440
0.38
.44
.73
1 Classes grouped to conceal the net income and identity of the taxpayers. 2 Nontaxable: exemptions and deductions exceed net income.
Digitized for FRASER http://fraser.stlouisfed.org/ Federal Reserve Bank of St. Louis
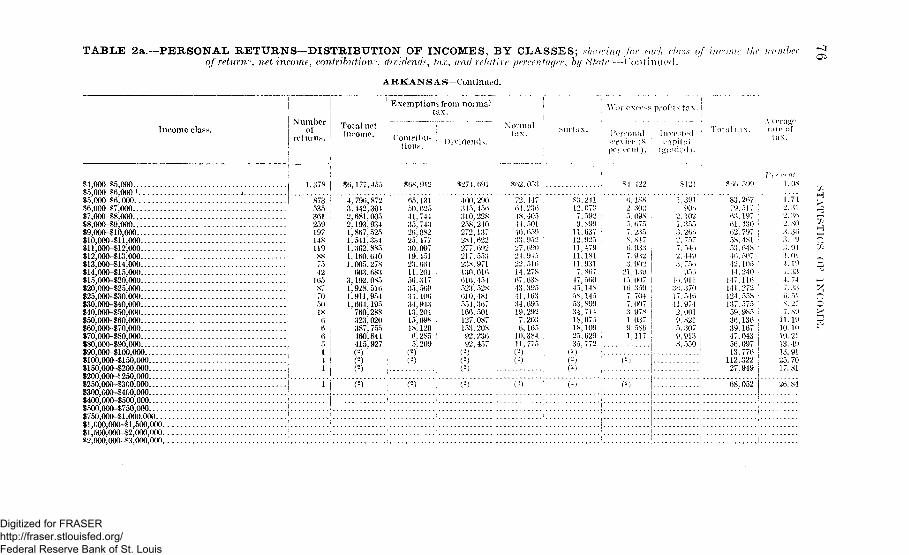
TABLE 2a.— PERSONAL RETURNS—DISTRIBUTION OF INCOMES, BY CLASSES; .Voicing /or each class of income the number0/return\ net income, contribution', dividend*, tax, and relative percentage?, by State:—('ontinned.
A R K A N S A S - C o n t i n u e d .
IncomeNumber
ofj returns.
Total netincome.
j Exemptions from normal! tax.
Contribu-tions. Dividend.-
Normallax.
War excess profit s tax. i
Personalservice (Xpei rent).
capita;(graded).
Total 1.ix.Averagerate oftax.
$4,000-$5,000$o,000-$fi,000 1 j$5,000-?6,000•%,000-?7,000$7,0OO-$8,000S8,000-$9,000$9,000-$10,000$10,000-S11,000SI 1,000-112,000$12,000-$13,000$13,000-$14,000$14,000-$15,000«15,000-$20,000$20,000-$25,000$25,000-330,000$30,000-$40,000$40,000-$50,000$50,000-$60,000$60,0OO-$70,O00$7O,OOO-$8O,OOO$80,000-$90,000$90,000-$100,000$100,000-$150,000$150,000-$200,000$200, OOO-JF 250,000$250,000-1300,000$300,COO-$400,000$400,000-$500,000$.500,000-$750,000.$750,000-11.000,000$1,000,000-11,500,000$l,500,00O-$2,000,OOO$2,000,000-13,000,000
, 155 $68,012 $274,691 862. Ovt •«4, 422 $121 !?66. .")!)<)
873535361259197148119
4210587705018 :
4.796,8723,442,3042,681,0052.193,9341,867,5251.541,3341.302,8851.160,040],005.278603,683
3,102,0851,928,5161,911,9541,664,195760,288323,020387,755460,844415,927(2)(2)
(2) ;
65,13150.62541,74435, 74326,08225,47730,097 '19,45123,66411,20156,31735,56934,40034,94313,20415,09818', 1206,285 i5,209(2)
400, 290345,456310,228258,240272,137284,622277.692217,553238,97L130,0161)16. 454523^ 52N610,481554,3(>7166,501127, 087153,20892,23692,457
C2)
72.447 ,() 1,236 '48,40544,50140,059l«,95227.69024,94522.51614.27867,03 s43.39541,10334,09519, 2927. 20:50.105
10^384 ;11,775
12,07;)7,5929.89911,63712.92511,47911,18111.9317,867
47. 5()()45,1485S,145.W, 89934,71418,07518,10925,02935,772
(2)
C2)
0.1882,3025.0985,1)757, 235s. S476.9337,9323. 902
21.13915.007Hi. 3597. 7047,0073,9781,0379. 5861,117
1.391' 906
'2.1021,3553.2662, 7577, 5402.4493,750
95!).16,91136.37017,54641.9742,0019.8215,3070,913 ,8.550 !
83,267 !79'. 517 !63.19761,430 i62.797 J58,481 :
5:5,648415. 50712,10544.240147,116141.272 !
124,558 •137,57559,985 :
36,136 139,167 147,043 I56,097 I13,776 1
112,322 '27,949 i
68,052
1.08
1.7 42. 312.362. 803.363. 9:;. 94•1.014.197. 334. 74
6. 518. 277. 89
11.1910. 1010. 2113. 4913. 9125. 7017. 81
26. 84
Digitized for FRASER http://fraser.stlouisfed.org/ Federal Reserve Bank of St. Louis
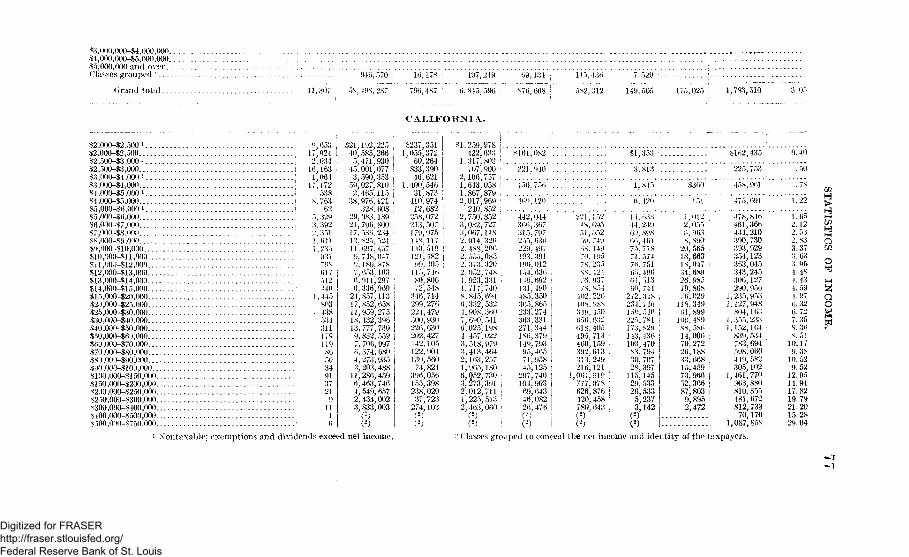
.*3,000,000-$4,000,000$4,000,000-$5,000,000$5,000,000 and overClasses grouped - 946,570 ,
totul. 11,307 58,498,287
16,178 497,249
796,487 ; 6,815,596 :
69,134 ;
876,668 !
145,436
582,312
7,529
149,505 175,025 1,783,510 3. 05
C A L I F O R N I A .
$2,000- 2,500 !
$2,000-82,500$2,500-13,000'$2,500-13,000$3,000-84,000 •'•S3,000-84,000U, 000-15,000 i84,000-85,00085,000-86,000 l
$5,000-36,00086,000-87,00087,000-88,00!)$8,000-19.00089,000-810,000.$iO,')OO-«l 1,000$11,000-112,000812,000-813,000$13,000-114,000$14,000-^15.000$15,000-820,000820,000-825,000.125,000-130,000#30,000-$40.000840,0()0-$50,000850,000-$6'),000J$60,000-.$70,000870,000-880,000$8),000-190,000«#) ,000-8100,0008100,000-8150,0008150,000-8200,0008200,000-8250,0008250,000-8300,0008300,000-8400,0008100,000-1500,0008 ")00,000-8750,000
9,65317,924 I2,034
16,163l',064
17,172538
8,763
5,3293,392
1'. 6 f 11,235
93170S617512440
1,445803
. 438534311179J19865034913721
911
16
$21,192,225 j40', 585,266 !
5,471,930 |45,001,077 !
3;590,353 I59,027,810 i2,465,115 I
38,976,121 I328.608 •:
29,083.189 :
21,796.80017. 536'. 23413, S25, 52411,697,4579,718,0479', 180,8781, 653;1036,911,297li, 336, 96924,857.11317,852,65811,959,27518, 132,39613,777,7309,832,5597,706,9976,374,6804, 273, 9353,203,488
11,286,4596,463, 7464,549, 6572.434,0023.833,003
(2)
$237,3511,055,372
60,264833,39046,621
1,400,54631,873
410.97412'. 682
258;072213,507179,975148,117140,519121,482
99', 405115,74680,80672,548
346,714299,276224', 479300, 930226,630202,427142,1051.22,904139,56074,824
396,056155,398238', 020
37,723274,103(2)
81.259,97b122,63:;
l,317,S03707,900
2,106', 7571,643,0581,867,8792,017,969' 210, 852
2, 750', 8523,0*2,7273, 067,11.s
2, lSs',2<M>2.555,0852.373.320L\052,74S1,923,3311,717,7405. SI.V, 6946,332;5321, 90s'. 3607,690', 5116,025; 198I, 157,0223, 518,9793,413,4642,163,2571,965, ISO6, 052,7303, 273', 3912,012,711 •1.225,513 ,2,463,060
(h
si 61,
221.
150.
1 »',<).
0S2
910
756
120
s i 3.->3
3 s];$
l.sr>
6.12U
8360
151
5162,435 :
225,753
458,961 !
475,691
0. 40
50
. 78
1.22
142,044366,367315,797255, 631 >22< 197
100.012154,636I Mi; 092131,490185.350365i 865 1233.274 •363,331 ,271,314 ,186,379 ;14«)',793 '95,465 !7i; 95815,125 •
207,740 ;101,903 I69,643 j46,08226, 176 I
M: 1,152IS, 1)95
Us.1 1970. Ut.')78, 235ss.42476,9377S. S54
ll)2,22f«108, 98s3)9, 15d
61 si 105195,713460,159392,613333,249216', 121
,06! ,91! '777,07,8626,876 '420,458 •780,643
,11.219i\'J, SI'Shi)', 16175,71871.57476', 75165, 19661,-)1360,744
272,3iS234, 7i(i15<>, 5-10 j22'), 781173, s29113,436 ,103,470 ;S3,791 '30, 707 '28,397 I
115,145 i29,533 !
26,5335,2373,142
8
1,0122,055li 963s, S9O
20,56518,663IS/ ) 1731,6S926,98519.86876', 029
US, 34961,899
109. 18!)SS,5X614,00670,27226,18833, i)^15.45973', 966 152,36687,803 i
9, 8952,472
4/8, S46461,366444,210390, 730393,929354,123363,045343,245306,127 I290,956 |
1,235,953 !
1, 127,948 :' 804,163 1
1,355,2331, 152,164
839, 534783,694 ;
598,060449,582 !
305,1021,461,770
963,880810,855481,672812,733
70,1701,087,858
1 . 6J>
2.122. 532.833.373. 633 954. 484.434.591 976. 326. 727. 358.36S. 54
10.179. 38
10. 529. 52
12.9514.9117.8219.7921.2015.2829. 04
wHh-i
aoK
1 Xontaxable; exemptions and dividends exceed net income. 2 Classes grouped to conceal the net income and identity of the taxpayers.
Digitized for FRASER http://fraser.stlouisfed.org/ Federal Reserve Bank of St. Louis
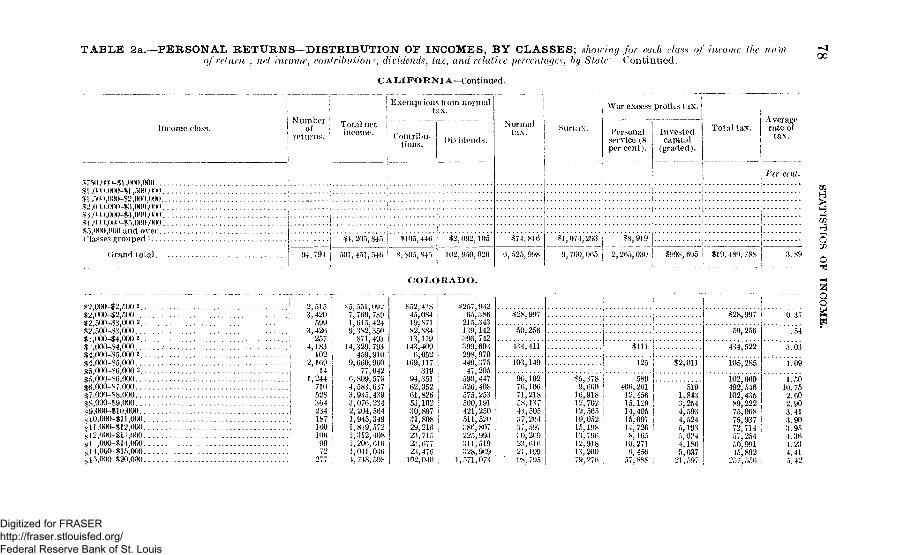
TABLE 2a.—PERSONAL RETURNS—DISTRIBUTION OF INCOMES, BY CLASSES; showing for each clasa of income the mnnof return , net income, contribution?, dividends, tax, and relative percentage,-;, by State—Continued.
CALIFORNIA—Continued.
00
Income class.
*<s7oO,OOi> $1 ,000 ,000
i i Exemptioni ! t
N ™ b e r j Total net | ~
return.. \ i n c o r a e - • Contribu-tions.
i
3 from norma lax.
Dividends .
« l O«IO 000 $1 500 000 ; i1H,.!iO:tyKH>-<*2,000,000 ' -;^2 OiK) 000~$3 000000 jS^o:V),(K)0-$4 000,000 ! . . . . ;>U,00)/K)0-S5,000,000 1So 000 000 a n d over ! j :
Classes g r o u p e d l 1 i S-i 205 X4. i $U)r> 44H
(J rand total
i j
94,794 | 501,451,546 I 8,805,845
$2,092,105
102,950,020
Normaltax.
$74,816
6, 525, 998
Surtax.
$1,074, 293
9, 700,065
War excess
Personalservice (8percent).
profits tax.
Investedcapital
(graded).
Total tax.
$8,919
2, 265,030 $998,695 $19,489, 788
Averagerate of
tax.
Per cent.
3. 89
*2,000-$2,500 2$2,000-12,500$2,500-13,000 2$2,500-13,000$j,000-$4,000 2$i,000-$4,000$4,000-15,000 2$4,000-15,000$5,000-16,000 2$5,0OO-.$6,0(K)$6,000-17,000$7,000-18,000«8,000-$9,000$9,000-$10,000ijl0,000-$l 1,000<t 11,000-$! 2,000
COL, OK A I X ) .
,312,408 i,206,616 i,041,036 !
'slf>;000-$20',000 277 4, 748,598 j
•,000-814,0004000$15000
!, 5151, 420599
;,426257
[, 183102
J,16914
., 244710528364234187160lOtt9072
551,092769,789615,424382,350871,493329,793459,910660,96077,042
809,579583,637935,439076,234,204,564945,34989572
,45,19,82,13,
143,6,
169,
94,62,61,53,30,31,29,23,23,23,
102.
$257,93265,386215,343139,142396, 742399,603298,979440,37547,205
590,447526,408575,253500,191421,250511,520I'M, 807225,993311,519328,969
1,571,073
$28, 997
50,256
434,411
103,149
96,10276,10671,21858,IS74*,50537,26437,597: ( ) , 2 ( i 923,Mt>21,199
" 98,795
$5,3789,660
16,91812,70212,56519,052Lr>, 19813,79612,91813,20079, 276
S i l l
125
589406,261
12,45615,12914,40515,09714,7268,165
10,2710,456
57,888
$2,011
5191,8433,2544,5934,5245,1935,0244,] 865,037
21,597
$28,997
50,256
434,522
105,285
102 069492,546102,43589,22275,06875,93772,71457,25450,99145,892
257,550
0.37
.54
3.03
1.09
1 5010. 752.602.903.413.903.954.364.234.415,42
i3
3ao
Digitized for FRASER http://fraser.stlouisfed.org/ Federal Reserve Bank of St. Louis
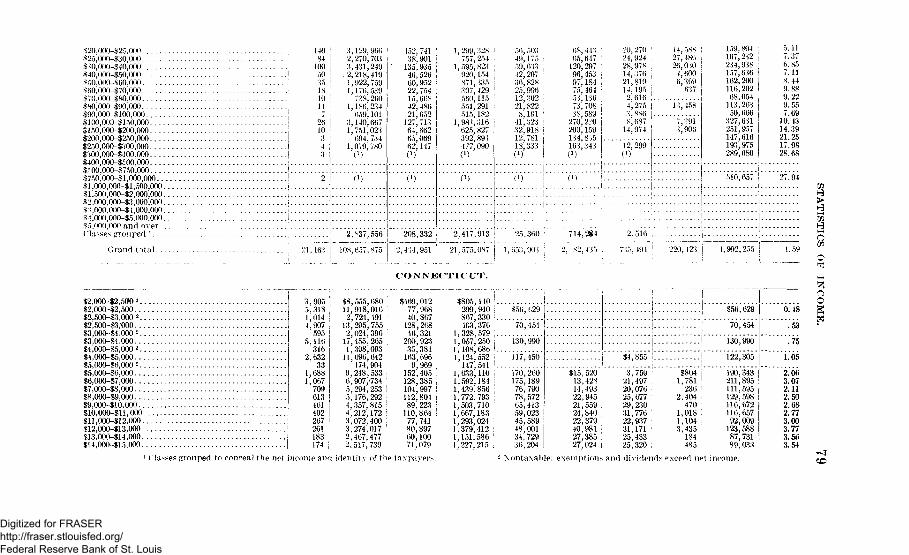
S20,000-$25,000«25,000-830,000$ *0,000-$40,000#40,000-850,000$50,000-$60,000^60,000-170,000§ 70,000~$80,000$80,000-190,000$90,000-.$100,000H 00,000-^150,000$150,000-$200 000•$200 000 $250 000$250,000-,$300 000$300 000-S400 000$400 000 $500 000If 00 000 $750 000^750 000 $1 000 000tl 000 000 $1 500 000S1 i00 000 12 000 000«2 000 000 $3 000 000.t!,000.000-.$4,000,000$4 000 000-S5 000 000$5 000 000 and over(lasses gronped 1
Grand total
140; 84! IOOi 50
35181014
72610
4
1
21,163
3,129,9662,270,7033,431,249
. 2,218,4191,922,7591,176,539
73 X, 2601,1X6,234
659,1013,140,6671,751,02*
694 7*41,079,' 780
( i )
2,-37,556
1OX,657.X75
452,74138,901
135,93546,52660,95222,75415,60842, 48621,652
127,71364,66265 06962^ 147
208,332
2,4)4,951
1,
1,
1,
2
21
299, 328757,254595,823920,154S71,*35397, 429560,115551,291515,18298*, 316625,82739'? 89*477,090( i )
P)
417.913
575,087
56,50349,175 ;59,63342,20736,82X25,90612,30221,822
8,19141,32*32,91812 781 .18,333
!
25,360
1,653,90*
68,443 ;65,647
120,29796,453 j97,18475,4645*, 1-*.(>73,70838,589
270,2/0200,15913 4 8>5 i16*, 343 |C1)
(M '1
714.284
2, •>S2, -135
20,27024,92428,97814,37621,81914,1952, 6164,2753,886S, 687
14,974
12,299C1)
2.516
735, 191
14,58827, 48626,030
. 4,6006,309
637
; 13,458
7,3913,906
I1
220,-123
159, 804167,232234,938157,636If 2,200116,20268,054
113, 26350,666
327,631251,957147,61619*, 975289,680
"10,657
5.117.376.857.118.449.889. 229. 557.69
10. 4314.3921.2517.9828.68
27.94
4.992,255 4.59
CO NNECTIC UT.
$2,000-$2,5OO -'$2,000-$2,500$2,500-83,000 2$2,500-$3,(000$3,000-$4,000 2$3,000-14,000$4,000-$5,000 2
$4,000-15,000$5,000-$6,000 2$5,000-$6,000$6,000-$7,000$7,000-$8,000$8,000-$9,000$9,000 $10,000$10,O00-$U, 000$ll,000-$12,000$12,000-$13.000$13.000-114,000$14,000-$15,000
3,9055,3181,0144,907 |
5955,116
3162,632
331,6881,067
709613 i461402267261183174
$8,555,68011,918,0162,724,491
13,295,7552,024,396 I
17,455,2651,398,093 I
11,696,642 ;
174,904 i9,248,533 i6,907,734 !5,294,253 !5,176,292 !4,357,815 ;4,212,172 ;3,072,400 :3, 274; 017 '2,467,4772,517,739
$469,01277,96840, 867
128,26846,321
200,92335,381
163,6969,969
152,405128,385104,997112,80489,223
110,86477, 74180,89760,10071.079
$805299867463
1,3281,0571,1081,124
1471,6331,5921,439,1,772,1,503,1,667,1,293,1,379,1,151,1,227,
140 !.940 i330 i.376579 .250 i686 I.552 j541 L110 !184 \856 !793 i710 j183 !024 '412 i586 '215 ;
$56, (,29 I
'"70," 454 "I130,990
117,450
170,260175,18976, 79078,57265,41359,02345,58948,00134,72936,204
$15,52013,42814,49322,94521,55924,84022,37940,981 i27,38527,024 |
$4,855
3,75921,49720,07625,67729,23031,77622,93731,17125,43325,320
$8041,781236
2,404470
1,0181,1043,435
184485
$56,629
70,454
130,990
122,305
190,343211,895111,595129,598116,672116,65792,009
123,58887,73189,033
0.48
.53
.75
1.05
2.063.072.112.502.682.773.003.773.563.54
1 ("lasses grouped to conoeal the net income and ident i ty of the t axpaye r s - Xontaxable; exemptions and dividends exceed net income.
Digitized for FRASER http://fraser.stlouisfed.org/ Federal Reserve Bank of St. Louis
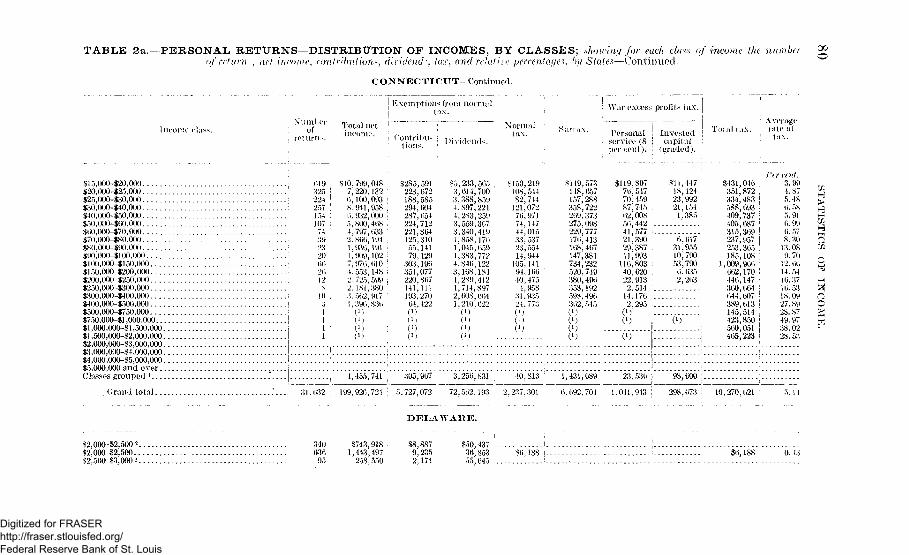
TABLE 2 a . - PERSONAL RETURNS—DISTRIBUTION OF INCOMES, BY CLASSES; showing for each class of income the numberof return , net income, c<mtribv(ions, dividend', tax, and relative percentage?, hy States—Continued.
00
o
CONNECTICUT—Continued.
liu-omo class.X ii in I,or
; of; returns.
Exemptions from normal| ' tax.
Total netincome. j Contribu- I ] ) i v i d e n ( l s i
Normaltax. Surtax.
War excess profits tax .
Personal | Invested \service (8 | capitalper cent). I (graded).
Total tax.Averagerate of
tax.
$15,000-$20,000S20,000-$25,000$25,000-$30,000$30,000-$40,000$40,000-$50,000$50,000-$00,000S00,000-$70,000$70,O00-$80,000$80,000-$90,000$90,000-$100,000$l00,000-$150,000$150,000-$200,000$200,000-$250,000$250,000-$300,000....$3OO,000-$4O0,OO0$400,000-1500,000$500,()00-$750.000$750,000-$! ,000,000...$t, 000,000-$ I, 500,000.$J ,500,000-12,000,000.$2,000,000-$3,000,000.$3,000,000-$4,000,000.$4,000,000-$5,000,000.$5,000,000 and over. .Classes grouped i
22425715410774
232000
103
$10,799,0487,220,132 !0,100,093 !8,941,958 [0.932,0005,800,408 ,4,797,033 '2,800,194 :1,930,1911,909^1027,970,010 !
4,553,148 i2,725,599 |2,181,3803,502,9171,390.830
$285,591223,072188,585294,004287,054 ,224,712221,804125,31055,14179,129
303,190351,077220,807141,lit193,27004,4220)(>)
0.)
$5,233,5053,014,7003,388,8594,897,2214,283,2593,559,3073,340,4191,858,170
1,' 383' 772 '4,840,1223,108,1811,289,4121,714,8972,008,0041,210,022
C1)
$150,219108,51182,744
121,07270,97174,14744,01533.53723,55414,944
105,14194,10040,475
4,95831,935 j
24,7730)C1.)( J )
$149,573 i148,057 '157,288358,722209,373 :275,098229;777 :170,413 !108,407 '147,381734,232 I520,749380,490 ;353,192598,490302,5450)(\)C1)C1) ;
$119,80770,54770,45987,745 i02,00850,442 :41,577 i21,39029,387 :11,993
110,80340,020 ;22,913
2,514 I14,170 12,295 i
(M :
$11,44718,12423,99221,1541,385
0, 01731,95510,79053,7900,0352, 2(53
C1)
C1)
$431,040;351,872 I334,483 !588,693 I409,737 I405,687 '315,369 I237,957 I253,305 I185,108 i
1,009,900 !002,170 i440,147 I300,004 !044,007 !389,013 I145,514 ;423,850 i500,051 i465,223 1
Per cent.3.994.875.480.585.910. 990. 578. 3013. OS9.7012.0014.5410.3710.5318.0927. 8928.8749.9738. 0228. 53
4,455,741 | 305,907 j 3,250,831
Grand total ."... 31.032; 199,920,724; 5.727,072; 72,502,193
40,813 i 1,431,089 i 23,530 j 98,000 I
2,237,301 , 0,092,704 j 1,041,943 j 298,073 j 10,270,021
h.
w
DELAWARE.
$2>000-$2,5002.$2,000-12,500..$2.500-13,000 2.
340030
95
$743,9181,443,497
258,550
$8,887 !9,235 i2,174 ;
$50,437 !. : . J36,853 $0,188 I :• $(>, 188 : 0. 4355^ C45 |
Digitized for FRASER http://fraser.stlouisfed.org/ Federal Reserve Bank of St. Louis
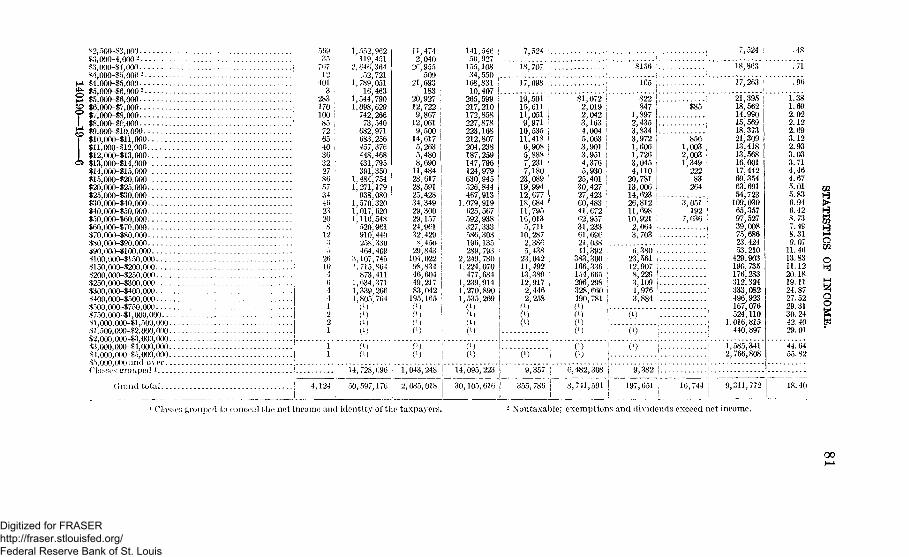
$2,500 -$3,000§3,000-4,000 2
$3,000-84,000$4,000-85,000 2$4,000-15,000$5,000-16,0002
$5,000-$6,000 -$6,000-87,000$7,000-88,000 -$8,000-89,00019,000-110,000$10,000-111,000$11,000-812,000$12,000-813,000$13,000-814,000$14,000-115,000$15,000-120,000$20,000-525,000$25,000-130,000$30,000-140,000$40,000-150,000$50,000-160,000$60,000-170,000870,000-880,000$80,000-890,000$90,000-1100,000$100,000-8150,000$150,000-8200,000$200,000-8250,000$250,000-8300,000$300,000-8400,0008400,000-8500,000$500,000-1750,0008750,000-81,000,000$1,000,000-11,500,000$1,500,000-12,000,000$2,000,000-83,000,000$3,000,000-14,000,000$4,000,000-85,000,000$5,000,000 and over(Masses grouped 1
(Jrand to ta l
11,4742,040
26,955509
21,693183
20,92712,7229,867
12,0619,500
14,6175,2635,4808,690
11,48428,61728,59125,42834,34929,30029,15724,96132,429
8j 45029,843
104,02298,83446,60449,21783,042
195,165
( i )
0)
71)
14,728,(;96 1,043,248
*)6935767121013
283 •170 'ioo !85 I72 :65 i40 !36 i3227 :8657344623208123526104(j44
1,552,9(52119,451
2,646,364.52,721
1,789,05116,463
1,544,7901,098,629742,26673,540082,971683,256457,376448,468431,795391,350
1,484,7541,271,179938,080
1,570)3201,017,6201,116,548520,961910,440258,330464,409
3.107,7451', 715,864873,411
1,634,3711,339,2661,805,764
4,124 50,597,17(5 2,085,018
141,54650,927
155,10834,550
168,83110,407
265,599217,210172,858227,878223,168212,807204,238187,259147,796124,979630,945526,844467,913
1,079,919625,567592,938327,333586,303196,135289,793
2,249,7801,224,070
477,6841,239,9141,270,8901,535,269
0)
0)0)
M* 095* 223
I
30,105,616
7,524
"is," 707*
17,098
(
C1)C1)
$156
165 ;
19,50115,61111,0519,97110,53511,4186,9085,8887,2317,180
23,08919,99412,67718,68411,79516,0135,71110,2872,3865,43823,04211,49213,38912,9172,4462,258
$1,072 i2,019 !2,0423,163 I4,004 j5,063 !3,901 13,951 !4,376 |5,930 i25,401 130,427 I27,423 !60,483 !
41,672 <62,95731,233 i61,696 •21,03841,392383,300166,336154,665296,298328,660190,781
c)C1)C1)(
822847
1,8972,4353,8343,9721,6061,7263,045 i4,110 !
20,781 I13,006 j14,623 !26,812 I11,69810,9212,064 13,703 ;
6,380 i.23,561 i.12,907 I.8,229 !.3,109 I.1,976 ).3,884 j .
$85
8561,0032,0031,349
22283
264
3,051 i192 !
7,636 !
7,524 :
"18,863*
.48
17,263
"e," 482* 308 "I "9*382" i
21,39518,56214,9S015,56918,37321,30913,41813,56816,00117,44269,35463,69154,723
109,03065,35797,52739,00875,68623,424.53,210
429,903190,735176,283312,324333,082496,923167,076524.110
1,016,815440,897
1*585,'341*2,766,808C1)
9*357
355,786 I 8,741,591 | 197,651 , 16,744 j 9,311,772 I
.96
1.381.692.022.122.693.122.933.033.714.464.675.015.836.946.428. 737.498.319.07
11.4613.8311.1220.1819.1124.8727.5229.3130.2442.4029.01
44*6455.82
18.40
1 Classes grouped to conceal the net income and identity of the taxpayers. 2 Nontaxable; exemptions and dividends exceed net income.
OO
Digitized for FRASER http://fraser.stlouisfed.org/ Federal Reserve Bank of St. Louis
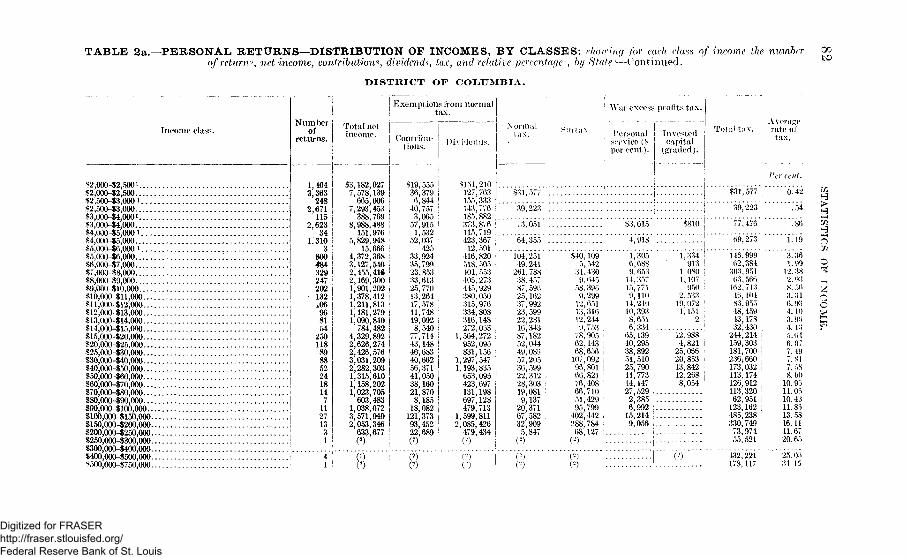
TABLE 2a.—PERSONAL RETURNS—DISTRIBUTION OF INCOMES, BY CLASSES; show lag for each clans of income the numberof return*, net income, contribution*, dividends', tax, and relative percentage-, by State'—'Continued.
DISTRICT OF COLUMBIA.
Income class.
$2,000-52,500 *$2,000-$2,500$2,500-$3,000 i$2,500-$3,000$3,000-$4,000i$3,000-$4,000$4,000-$5,000 i$4,000-15,000S5,000-$6,000 iS5,000-$6,000.%,000-$7,000$7,O00-$8,O0O$8,000-89,000$9,000-$10,000«10,000-$11,000»ll,000-$12,000$12,0()0-$13,000$13,000-$14,000$14,000-$15,000$15,000-$20,000$20,000-$25,000$25,000-130,000$30,000-$40,000.$40,000-$50,000 ; . . .$50,000-$60,000$60,000-$70,000$70,000-$80,000$80,000-190,000$90,000-1100,000$100,000-$150,000$150,000-$200,000$200,000-$250,000$250,000-$300,000$300,000-$400,000$400,000-$500,000^500,000-1750,000
N u m b e r jof
returns.Total notincome.
464 j36324867111562334
3103
800484329247202132.069681,54
250118898852241814711271331
Exemptions from normaltax.
; War excess profits tax.
Contribu-tions. Dividends.
Normaltax.
S3,182,0277,578,139665,006
7,293,453388,769
8,988,488151,976
5,829,94815 666
4,372,3683,127,5402,455,41*2,169,3001,901,2021,378,4121,211,8131,181,2791,090,840784,482
4,329,8922,626,2742,426,5763,031,2092,282,3031,315,6101,158,2021,023,705603,483
1,038,0723,571,9492,053,346633,677
$19,555 !36,379 j6,844 !40,757 !3,065 157,915 !1,532
52,037425
33,92435,79923,85333,61325,77013,26417,57811,74819,092 i8,540 177,714 !43,148 i46,683 !40,66256,371 !41,05038,160 |21,8708,185 !18,082 i121,37393,452 J22,689 !
1
11
12
S154,210127,763155,333143,776185,882373,876115,719423,36712,501416,820518,505401,553408,273445,929380.050315,976334,808316,148272,033,564,272952,096831,156, 297,547,193,835653,096423,697131,198697,128479,713,599,811,085,426479,434
$31,577
39,223 ;
73,051
64,355
104,25149,241
261.788 •38.45787,59!)25,16237,99223,59922,28116,34387,18252,04449,08557,20536,59922,312 i28,303 <19,081 !9,137 !
20,37167,58232,9095,847
(2)
Personalservice (8per cent).
Investedcapital
(graded).
Total tux.
S3,615 $810
4,918
§40,1095,542
31.4309,645
58,3969,299
12,65113,31612,2449,753 .
78,905 i62,143 :68,656 i
107,092 i96,801 I66,821 '76,40866,71051,42995,799
402,442 i288,78468,127 .()
1,3056,6889.65314,35715,7719,11014,24010,3938,6516,33465,13940,29538,89251,51025,79011,77314,14727,5292,3856,99215,2149,056
1,334 !913 t
1,0X0 i1,107 '950 '
2,533 :1.9.072 ]1,151
2 !
12,988 '4,821 j25,086 I20,853 I13,84212,2688,054 !
$31,577
"39*223"
7,476
69,273
148,99962,384303,95103,5661(52,71346,104S3,95548,45943,17S32,430244,214 !159,303 !181,700 i236,660173,032 !113,174 ;126,912 :113,320 !62,951 !123,162 I485,238 ;330,74973,97455,521
()(*)
432,221178,117
Averagerate oftax.
Per ecu,/.
6*42
. 54
5*2
"i."i9 Q.86
3.361.9912. 382.938. 563. 346. 9^4.103.9!)4. 135.646.077.497.817. 588.6010.9G11.0810.4311.8813. 5816.1111.6720.65
25. 0834. 10
QO
Digitized for FRASER http://fraser.stlouisfed.org/ Federal Reserve Bank of St. Louis
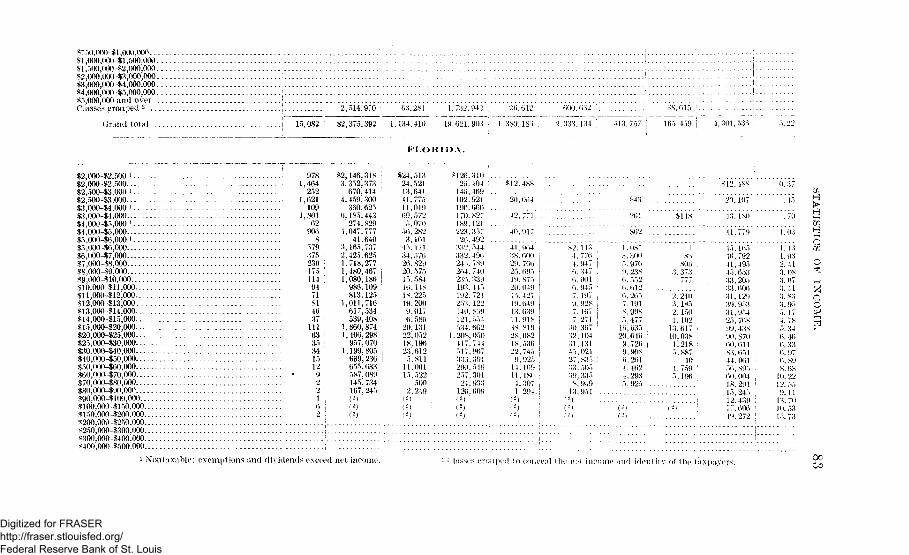
^750,000-$1,000,000....«-1,000,000-81,500,000.«i ,500,000~$2,000,000.S2,000,000-$3,000,000.*3,000,000-$4,000,000.$4,000,000-85,000,000 -#.5,000,000 and o v e r . .Classes grouped 2
Grand total-
2,514,970 ;
15,082 ; 82,375,392 ,
03,281 1.732,942 26,612 600,632
1,134,410 19,621,903 ; 1,389,18:) , 2,333,134 413,757
38,615 l
165,459 ; 4,301,536
FLORIDA.
$2,000-$2,500 i$2,000-12,500$2,500-13,000 i$2,500 -S3,000$3,000-84,000 l
$3,000-$4,000$4,000-$5,000 l
$4,000-85,000$5,000-16,000 i$5,000 $6,000$6,000-$7,000$7,000-88,000$8,000-19,000$9,000-810,000$10,000-811,000$ll,000-$12,000$12,000-113,000$13,000-814,000$14,000-$lo,000$15,000-820,000$20,000-825,000$25,000-130,000$30,000-$40,000$40,000-150,000$50,000-160,000$60,000 $70,000$70,000-880,000$80,000-190,000$90,000-1100,000$100,000 -$150,000$150,000 -$200,000$200,000-1250,000$250,000-$300,0008300,000-8400,000^400,000 $500,000
978,464252
,621109
,80162
9068
579375 !2301751149471814637
111633534151292
162
$2,146,3183.352,373
670,414 !4.459,300
360.6256.185.443
274,8294,047.777
41,6403.165.7372,425.6251.718,2771,480,467 I1,080,186 I
986,109813,125
1,011,716617,534539,408
1,860,8741,406,298 !
957,070 !1.199,805 |
639,236 |655,633587,089145,734167,245
•124,51324.52113,64141,77511,01969,5725.070
56,2823,1614-5,17134,57626,82920.57515,584Hi, 14818,22519.200
9,0176', 586
20,13122,05218,19623,6125,811
11.06115,522
5002, 249
(-)(-)
*126.3102o'.404 i
146,469102.921190.660170.827I89.121223,357
21), 492 ,332, M4332,496245, 789264,740235.339193.445192.724253,122I40,8',)9121,554534.662
1,208,050417,744517,96733), 391290.549257,301
24,933126,609(-)(2 )
$12,488
20^054
"42." 771"
40.917"
$12,488
20,107"
41,96438,60029,76626,69519,87520,049
19.649 I13.639 !11,918 I38,81928,0S218,53622,7459,92514.16911,1804.3071.294,
(-)
261
"802"
*2 1134,776 ;4.947 I6,347 i0,0010.9457,197 ,9,928 j7. 167 !7,271 j
30,36732,10431.13145,02127,83533,50539.335
s; 95913,951
1 . 0873,3005.9769. 2386, 5526,' 612(>, 2657,1918,9985,4771(V. 63520,6469, 7269,9980.2614.4624,2935.025
8063. 373
2,2403, 1852, 1501, 102
13,617 -10,0381.218 ;
5.88740
4.7595,196
41,779
45,16546,792 '41,49.545.65333,20533,60631,12939.95331.95425,76S99.43N90,87060,611S3,65144,00156,89560.00418,29115,24512. 43977,60649,272
1.03
1.431.932.413. 083. 073.413. 833. 955. 174. 785. 340. 466. 336.976. 898. OS
10.22
Ell13.7010. 5315.73
H>
H
co
1 NY)iitaxable; exempt ions and dividends exceed net income. - '"lasses grouped !oconceal the no! income and identity of Ihe taxpayers . OOCO
Digitized for FRASER http://fraser.stlouisfed.org/ Federal Reserve Bank of St. Louis
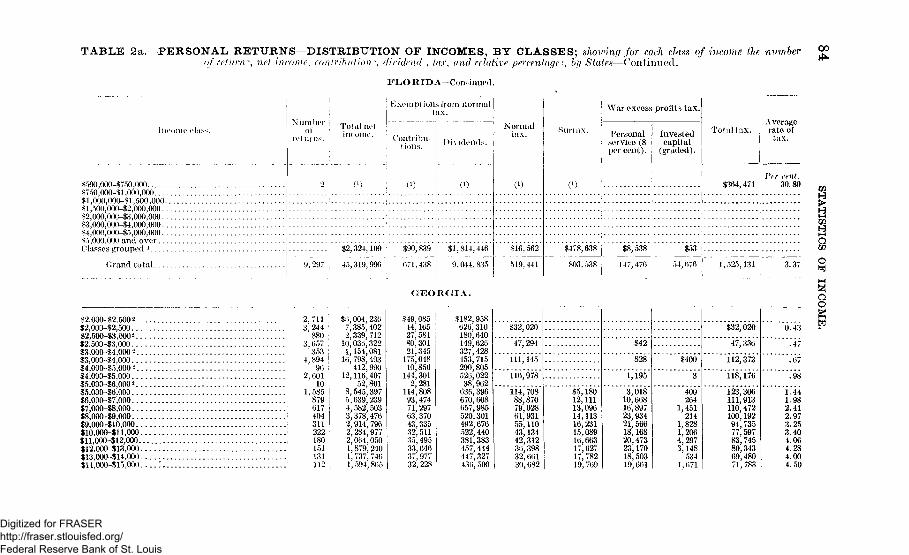
TABLE 2a. - PERSONAL RETURNS—DISTRIBUTION OF INCOMES, BY CLASSES; showing for each class of income the numberof return'-, net income, contribution •, dividend , ta:\\ and relative percentage •, by States—Continued.
00
FJL O It ID A—Continued.
Exemptions from normaltax.
income eias*.
$500,000-$750,000..i75O,OOO-$l ,000,000.
$1,000,000-$1,500,000..Sl,500,000-$2,000,000...$2,000,000-$3,000,000. - -$3,000,000-$4,000,000...$4,000,000-85,000,000. . .•115,000,000 and overClasses grouped l
Number iOf !
rot urns.
Total net
Contribu-
0)
Dividends.
0)
$2,324,109 $90,839 $1,814,446
Grand total ! 9, 297 , 45,319,996 671,438 | 9,044, 835i : • _ I
Normaltax.
C1)
$16,562
519.441
Surtax.
$478,638
803,538
War excess profits tax.
Personalservice (8per cent).
Investedcapital
(graded).
Total tax.
$364,474
$8,538 i $53
147,476 ; 54,676 1,525,131
Averagerate oftax.
Per cent.30.80
3.37
Ii—<
s
( J E O R C I A .
$2,000-12,5002.$2,000-$2.500..$2,500-43,000*.$2,500-$3,000..$3,000-84,000 2.$3,000-$4,000..$4000$5000$ , $ ,$4,000-$5,000...$5,000-86,000 * . .$5,000-16,000...$6,000-$7,000...$7,OOO-$8,OOO...$8,000-$9,000...$9,000-$10,000..S10,000-$ll,000.$11,000-$12,000..$12.000-$13.000.$13,000~$14,000.$14,000-$15,000.
711244880657 ;353 i894 !96 i601 I10 |585 j879 !617 j404 !311 I222 !180 !151131112 :
$6,004,2367,385,4022,339,71210,036.3221,154,08116, 798,493
412,99012,116,407
52,8018,545,3975,639,2394,582,5033,378,4762,914,7962,284,9772,064,0501,879, 2401, 737, 7461,594,865
$49,08544,16527,58180,30121,345
175,04810,856
144,3012,281
114,80893,47471,29763,37043,33532, 51135,49533,64637,97732, 228
$182,626,180,149,327453,290,526,38;
636,670,657,520,492,522,381,457,447,436,
$32,020
47,294
111,145
116,978
114,70888,87079,02861,93155,11043,13442,31230,39832,66130,682
$5,18012,11113,09614,11316,23115,08916,66317,62717,78219,769
$42
828
1,195
3,01810,66816,89723,93421,56618,16820,47323,17018,50319,661
$400
3
400264
1,451214
1,8281,2064,2973,148534
1,671
$32,020
47,336
112,373
118,176
123,306111,913110,472100,19294, 73577,59783,74580,34369,48071, 783
0.43
.47
.67
.98
1.441.982.412.973.253.404.064.284.004.50
3ao
Digitized for FRASER http://fraser.stlouisfed.org/ Federal Reserve Bank of St. Louis
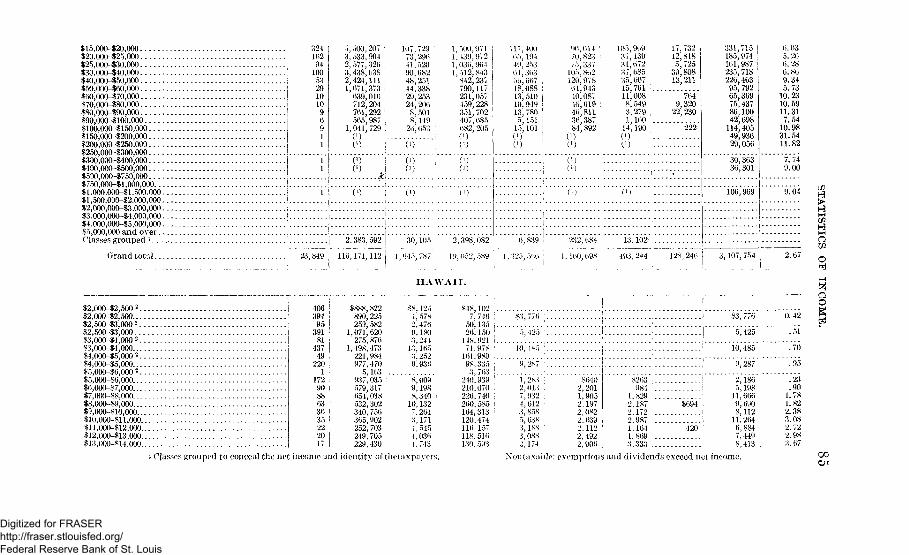
$15,000-120,000$20,00O-$25,000$25,000-830,000$30,000-140,000$40,000-150,000$50,000-860,000$60,000-$70,000$70,000-$80,000$80,000-190,000$90,000-$100,000$100,000-8150,000 ....$150,000-$200,000$200,000-$250,000$250,000-1300,000$300,000-8400,000$400,000-1500,000 ,$500,000-8750,000$750,000-81,000,000$l,000.000-$l.500,000$1,500,000-82.000,000$2,000,000-83,000,000$3,000,000-$4,000,000$4.000,000-15,000,000$5,000,000 and overClasses grouped i
Grand total
32410294
1005329101090911
5,500,207 '3, 533,9042, 577,3203,438,0382,424,1111,071,373 I
039,010 :712;204 :761,292 |505,987 i
1,041, 7290) -0) i
107,72973, 29041,52090,08248,25144,33829,25324,2008,5018,149
20,653
1, 500, 9711,439,9721,030,9641,512,843
842,237790,117231,057459, 228351, 702407,085082, 2050)0)
C1)C1)
0)0)
0)0)
117,400 [
05,19449,25301,303 ;50,00718,088 !13)510 |10,949 I13,780 !
5,15115,101
C1)
00,014 •70,823 i75,337
105,802120,97801,94340,08740,019 :40,81130,38784,892 ••
105,90937,13931,07237,08535,00715,76111,0088, 5493,2791,100
14,1900) :C1)
17,732 I12,818 I5,725 I
30,808 I13,211
7049,320
22,230
222
0))
I 2,383,592
23,849 j 110,171,112
30,105 2.398,082 0,839 ! 232,084 13,102-
1,045,787 19, 052, 589 j 1, 325, ofiO j 1,100,098 493,244
331,715 j185,974101,987235,718226,40395, 79205,36975,43780,10042,698
114,40549,93629,050
30,30336,301
100,969
128, 240 j 3,107, 754
0.035. 200.280.809.345.73
10.2310.5911.317.54
10.9831.5411.82
7.749.00
9.04
2.07
M
o
HAWAII.
$2,000-82,500 2 . .$2,000-12,500....$2,500-$3,0002..$2,500-83,000...$3,000-14,000 2 . .$3,000-84,000....$4,000-85,000 2 - .$4,000-$5,000....$5,000-86,000 2 . .$5,000-$6,000....$6,000-87,000....$7,OOO-8S;OOO....$8,0O0-$9,OOO....$9,000-$10,000...110,000-811,000..$ll,000-$12,000..$12,000-813,000..$13,000-814.000..
40639495
39181
43749
2201
1729088633635222017
$888,890,259,
1,071,275,
1,498,221,977,5,
937,579,054.532)340,365,252,249,229,
822225582620876473984470163035317038302756902703705430
$8,1254,5782,4769,1803,24413,1653,2529,936
8,0099,1988.340 i10', 1327,2643,1714, 5451,0364,743
$48,1027,746 !50,135 j20,150148,921 I71,978161,98998,335 i3,763 I
240,939210,070 !226.740260,585164,313120,474116,157118,510130,593
13,776 ;
5^425
10,4X5
9,287
1, 2X3
932612858638188088174
$6402,2011.9052,1972,0822,6392,1122,4922,906
$263984
1.8292,1872,1722,9871,1641,8693,333
$694
$3, 776
5*425
10,485
9,287
2,1865,19811,6669,6908,11211,2646,8847,4498,413
.95
.23
.901.781.822.383.082.722. 983.67
ao
l CJasses grouped to conceal the not income and identity of thetaxpayers. Nontaxable: exemptions and dividends exceed net income. OO
Digitized for FRASER http://fraser.stlouisfed.org/ Federal Reserve Bank of St. Louis
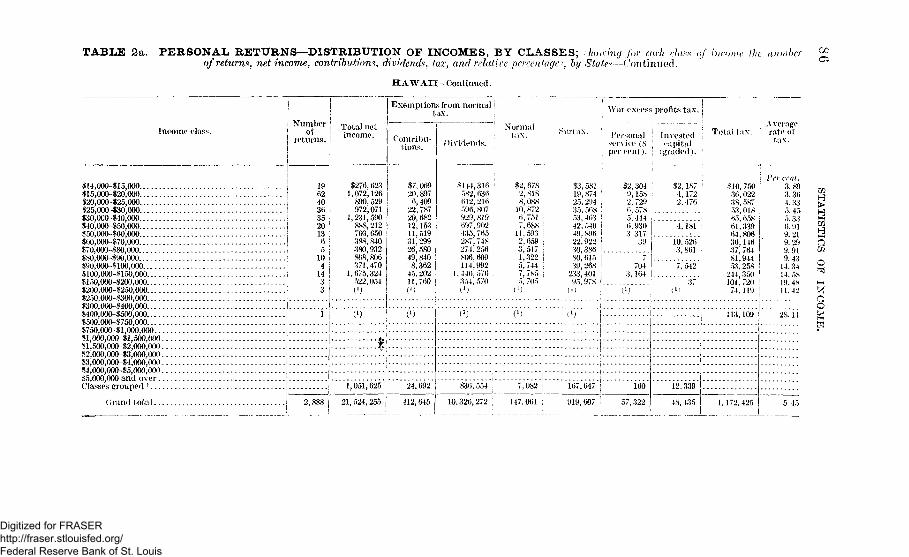
TABLE 2a. -PERSONAL RETURNS—DISTRIBUTION OF INCOMES, BY CLASSES; howhuj for each vlmx of him meof returns, net income, contribution?, dividends, tax, and relative percentagey, by State*—Continued.
the nber
H A W A H - Continued.
OC
Incomei Number \! of II returns.
$14,000-$15,000$15,000-120,000$20,000-$25,000 !«25,000-$30,000 i$30,000-$40,000 !$40,000-$50,000 1$50,000-$60,000 !$60,000-$70,000 S$70,000-$80;000 i$80,000-190,000 !190,000-1100,000 1$100,000-1150,000 j$150,000-1200,000 ! !$200,000-1250,000 i$250,000-$300,000 i.$300,000-1400,000 1.$400,000-$500,000 !$500.000-$750,000 j.$750,000-$1.000,000 i.$1,000,000-11,500,000 '.$1,500,000-$2,000,000 j -$2,000,000-$3,000,000 !.$3,000,000-$4,000,000 j .$4,000,000-15,000,000 \.$5,000,000 and over j .Classes grouped l !.
19 ;6240 j36 I35201365
104
1433 i
Exemptions from normal jtax. j
Total netincome.
$270,6231,072,126
890,529972,071
1,231, 590888,212703,650388,840380,932868,806371,470
1,675,324522,054
)
Contribu-tions.
$7,06920,8976,40922,78720,68212,15311,51931,29926,58049,8408,36245,20211,7600)
Dividends.
$144,316 •582,636612,216596,807929,819697,902435, 765287, 748274,256806,609114,992
1,446,576354, 570I1)
Normaltax.
$2,6782,8188,088 |
10,872 !6,751 i7,688 i
11,593 :
2,6593,517 :'1,322 |5,744 j7,785 ;5,705
I1)
; War excess profits tax .
: Personal • Invested; service (8 j <'apital| per cent). ; (graded).
$3,58119,87425,29435, 56853, 46342,54049,89622,92230,38680,61539,268
233,401 j
(M i
$2,304 :9,158 i2,729 |6,578 I5,444 I6,930 j3.317 I
39 i
$2,1874,1722.476
4,181
10,5263,861
7043,164
7,542
37
Total tax.
$10, 75036,02238,58753,01865, 65861.33964, 80636,14637, 76481,94453,258
244,350101,720 i74,119
I1)
Grand total.
1,051,625 i 24,692
21,524,255 j 412,645
C1)
836,5.54 . 7,082 167,647 160
10,326,272 ; 147,061 919,607 | 57,322
12,339
Averagerate of
tax.
Per cent.3.893.364.335. 455.336.919.219.299.919.43
14. 3414. 5819. 4811.42
113,109
48,435 I 1,172,425
28.11
oto
oo
Digitized for FRASER http://fraser.stlouisfed.org/ Federal Reserve Bank of St. Louis

I D A H O .
$2,000-$2,500*$2,000-$2,500i52,50O-$3,0O0 2«2,500-$3,000S3,000-$4,000 2
$3,000-$4,000S4000$5000 2$4,000-$5,000$5,000-$6,0002$5,000-$6,000S6,000-$7,000$7,000-$8,000$8,000-19,000$9,000-$10,000$10,000-$U,000$ll,000-$12,000$12,000-113,000$13,000-$14,000$14,000-115,000*15,000-$20,000$20,000-$25,000... .$25,000-$30,000$30,000-$40,000$40,000-$50,000$50,000-$60,000$60,000-$70,000$70,000-$80,000$80,000-$90,000$90,000-1100,000$100,000-$150,000$150,000-$200,000$200,000-$250,000$250,000-$300,000$300,000-$400,000$400,000-$500,000$500,000-$750,000$750,000-11,000,000...$l,000,000-$l,500,000.$1,500,000-$2,000,000-$2,000,000-$3,000,000.$3,000,000-$4,000,000.$4,000,000-$5,000,OOO.$5,000,000and ove r . .Classes grouped l
Grand total.
1,048 $2,303,7661.310 2,965,104 ;
332 887,9731.311 3,591,100 ;
312,175 !
1,68425
8103
4182491641136469583230
79,699 i108,262 i
3,584,041 i16,271 ;
2,253,954 I1,607,192 :1,203,625
952,451 :603,847 .717,527 '668,160400,757394,247
23 316,5915638122946221
976,146820,625330.259905,066 :165,338324,640 I133,352 i143.044 !
' i
$25,701114,54713,30830,8485,660
60,423
42', 991270
25,42922,79315,69712,3975,7324,9138,3925,5063,2204,1486.5127. 5062.636
14.6261,82735.082,395
435
$62,71716,45139,16222,58570,07485,51263,35790,117 !9,348 ;
92,601 l
147,598122,671154, 89298,32972,35187,21650,41376.16496,403
239.41616S.387131,354324,001
79,292163,878705,681,789
$12,825
" 16,567
39,776
36,592
14,9796,239
12,34018,74811,61317.18116,0139,7647, 7595,947
21.71319.7126,896
18,5832,8054,5542,1754,321
$2,804 i2,7043,4113,873 i2,8765,376 i5,9724,6513,71(i3,838 '
16,741IK, 3X1 '9,666
31,716 ;
4,23814,4355,588 I
12!843 !..
$4,1031,0641,9973,0461,9061.7872,8641.1273.01S1,664
13,0775,7451,520
10,49896
4,917548
$40
632841
151.632
682,168
!1 3,842! 7.658•; 45• 5 . 9 1 3! 441\ 7,692!1ji
7,994
1,370,302 ! 8,749 1,046,400 I 15,196 149,372
33,835,514 455,744
25,209
84,186 j
$12,825
16,567
39,776
36,592
16,616 . . . .
Classes grouped to conceal the net income and identi ty of the taxpayers.
3,683,046 322,298 302,201 j 84,186 j 47,603 756,288
2 Nontaxablc; exemptions and dividends exceed net income.
1. 02
21,926 i10,00718,38026,50816,41025,97624,91717,71014,49315,29159,189J3.SS323,99561,23814,&3123,9068,311
17,16411,620
85,29462,769
.97
.621. 532.782.723. 623. 734. 423. 684. 836. 065. 357. 266.778.977. 366.23
12. 0013. 88
13. 2319. 30
UlHI
Hw>—*rr
C
o
I
OC
Digitized for FRASER http://fraser.stlouisfed.org/ Federal Reserve Bank of St. Louis
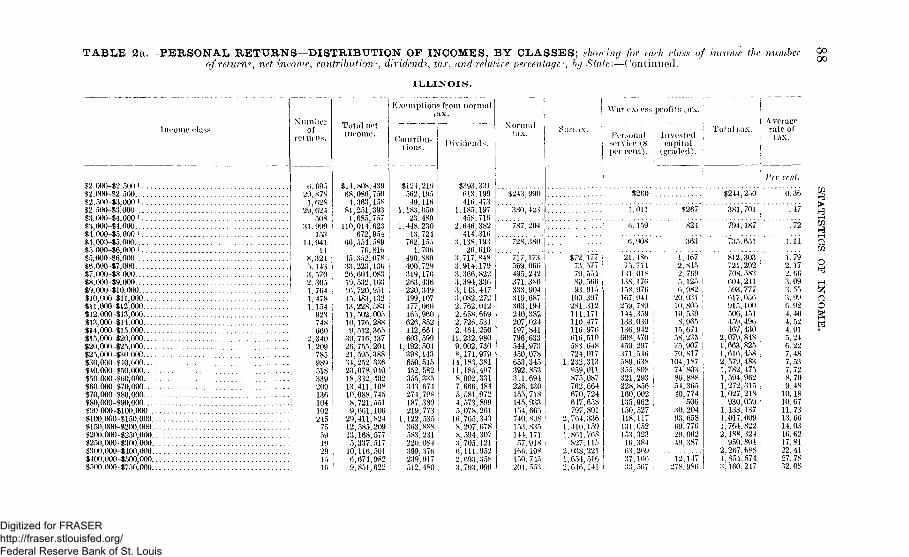
TABLE 2a.—PERSONAL RETURNS—DISTRIBUTION OF INCOMES, BY CLASSES; showing for each clans of income the numberof return?, net income, contribution*, dividend?, tax, and relative percentage', by State—Continued.
0000
I L L I N O I S .
Income elas,
$2.000-$2.500 <S2.000-$2'500«2,:>00-$3,000 l
$2 500-$3,000$3.000-$4,000 '$3,000-$4.000St.000-So.000 i$i,ooo-$5,oooSo 000-$6',000 l . . . .$5^000 -$6,000$6.000-$7,000$7,000-$8' 000$8, 000 -$9,000$9,(K)0-$10,000$10,000-$11,000*11,000 -$12,000$12.000-$13,000$13,000 -$14,000$14;000-$15.000$15,000 -$20,000$20,000-$25,000$25.000-$30 000$3O,OOO-$4O,OOO$40.000-$50,000$50,000-$60,000$60,000 $70.000$70,000 $80,000•$80,000-$90,000$90.000-$100,000$100,000 -$150,000$150, (KM) -$200,000$200,000-$250,000$250,000 $300.000$300,000-$400,000$40O,00O-$5OO,0OO$500,000 $750,000
Numberof
returns.
29,1,
29,
f>9587862862450899915394114
324143570305764478154923748660340209785989518339209136104102245
59 |19 I29 |15 I16 i
Total netincome.
$14,808,43968,086;7504,363,15881,251,3931,685,757
110,014,623672,954
66,554,58976,816
45,352,07833.223,13626,604 08319.532.10316,720,95115,483,13213, 228,58311,502,00510,176,2889,512,36539,716,13726,755.20421,595,38834,252,33623,078,94018,332,40213,411,10810,088,7458,721,5519,661,10629,411,82412,585,20913,168,5775,337,517
10,116,5016,674,9829,851,622
Exemptions from normaltax.
Contribu-tions.
$121,219562,195 I
49,116 I1,183,050
23,480 !1.448.230 '••
13,724 i762,155
1,706490, 880400,729319,176263,436220,349 i199,107 ;177,060 j165,960 j626,852 I142,664603,599
1,192,504398,143650,515452,582355,335343,674274,798187,380 !219,773 I
1,122', 535 1'363,888 !5S3,231 !220,084 ;399,376 !239,917 i512.480 |
Dividends.
$393,331613,199416,473
1,185,197458,716
2.646,382414,316
3,138,19326.610
3.717.8483.914', 1793,366,K223,394,3363,143,4473,082,2722,762,0122,658.6692,726,5312.464,250
11,232,9809,002,7308,171,979
14,183.38111.185,4978^902,3317,666,4845,581,9724,573,8995,078,26116,765,3438' 207,6788,594.3073,705', 1216; 111.9522,693,3583,793,099
Normaltax.
$243,990
380,423
787.204
*728."380
717,173569,060495.212371,380333,904319,687363,194240,382207,024197,841796,633544,973450,078653,345392,853311,694226,430155,718145,933154,6G5740,898153 835144,17157.918
166.198150,745201,553
War excess profits tax. <
Personal ; Invested ;service (8 capital Iper cent). ; (graded). '
Total tax.Averagerate of
tax.
$244,250
1.011
6.159
$267
'" '824'
6,908 363
381, 701
'794,'187
'735^651
Fir cent.
$72,177 I
:89,56093,915
109,397281,312111,171110,477116,976616,510583,648724,017
1,232,313959,011875,087762,664670,724647,658797,801
2,764,3361,410,1591.861,768
827,1152,038,2211,654,5162,646', 141
21,486 ,75,714
131.018138,176158,976167,941259,789144,359 !133;030136,942608,470 I459,297 ;371.546589;638 !
355,808 I321,293 I228,856 j160,002 !135,962 !150,527418,117131,052153,32316.38-163.26937.16633,567 .
1.4672,8452. 7695,1256,98220,03110,80510,5398,96515,67158,23575,90770,817104,18774.80386,88854;36540,774
50630,20493,65869,77629,06249,387
, j278,9S6 I
812,303 i721,202 !70S,5X3604,241 ;593.777 '617', 056915,100506,451459,496467,430
2,079,8481,663,8251,616,4582,579,4831,782,4751,594,9621,272,315 I1,027,218 [930,059 !
1.133.137 !4;017,0091,764,822 !2,188,324950,804 j
2,267,688 ;1,854,574 ;3,160,247 1
0. 36
' ".'47
' "."72
1.11
1.792.172. 663. 093. '->')3. 99C). 924. 404. 524.915. 246.227.487. 537.728. 709.4810.1810.6711.7313. 6614.0316. 6217. 8122. 4127. 7832.08
a
aog
Digitized for FRASER http://fraser.stlouisfed.org/ Federal Reserve Bank of St. Louis
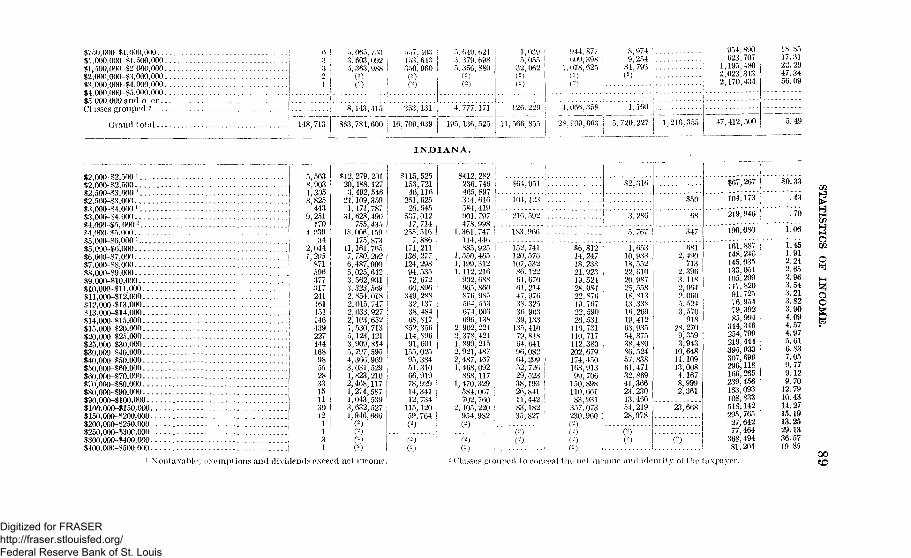
•$750,000-81,000,000$1 000 000-81,500 000. .$1,500,000-82 000,000$° 000 000 $3 000 000* 3'ooo'ooo $4 ooo ooo84'. 000,000-85.000.000$5,000,000 and o er
Grand t o t a l . . . . . . . .
$2,000-82,500 l
$2,000-82,500
$2,500-83,000$3,000-84.000 1
$3,000-84.000M,000~$5,000 l
34,000 $5,000• ^ OOQ—%(\ 0 0 0 *
$5 000-86,000$6,000-87,00087.000-88,000^8 000 89 000 -$9 000-810,000$10 000 811 000 . . .«11 000-812,000SI2 000 $13 000 . . .$13 000 $14,000*14 000 815 000$15 000 820,000$20 000-825 000$25,000-830,000$30 000 $40 000840,000-850,000 - -$50 000 $60 000860,000-870,000$7o non-880 ooo$80 000-S90 000$90' 000-8100 000$100,000-8150,000.$150 000-8200 000$200 000-8250 000$250 000-$300 000$300 000-$400 000$400 000 $500 000
1 X on taxable: e
..33
I
148,713
5,5638,9031.3058; 825
4439. 251
i 039
i 2.0441,205'871596377317
. . 1 241! 161i i5i! 146! 4391 227
144! 168
98I 55
. : . ; . . . ; . ; ; ; • ; 2 8
xempf ions and divi*
3315113012 i
1131
lends exce ^d
5,065,7533 603 0925,363, 988
C-)
8,143,415
863,784,600
$12,279,20120,488,1273.492,546
24;109,3591.471,787
31,628,490755,435
18.006,159175 S73
11,161,7657, 780. 2026,487,9005,025 6423,562,9313,323 5692, 854.0182,015 7472,033,9272,103,6527,530, 7135,123.4213,909,8145, 797; 5954,366,9693,03i; 5291,823,2102,468,1171,274 5871,043 5393,632,5271 946 666
net income
557,403153' 643350, 960
353,131
16.709,039
I N D
$115,525153,72146,116
251,625
537,01227, 714
255.5167 886
171^211136.277124', 29894,53572', 6721J6, 896
349,28832,13738,48468,817
852,356114,89691.601
155,02595,38451.31066; 91978,92914,34112 734
115,12059 764
5.649,6213', 379.6985; 356, 880
4,777,171
195,136,525
I A N A .
$412, 282 I.. -236,746 I465 897 i344'616
901, 797
1.361,747 !114 446 ;
885,9251,550,465 i1,199,3121,112.216 :
902, 688905, 860876.985564,553674,003696,138
2,902, 2242,378,4241, 899,2152,921,4872,487,4671,468,092
868,1171,470,329 '
584,067 i702 760
2,105,220 1954 982
(2)
- Classes £rr>upe
1 0395' 055
32,062
126.229
566,855_ .
$64*951* --
104,123 . .
216,592 . .
183,966 . . .
152,741120,576107,53286,12261,670
47,97638.32536,96339,133
135,41079, 81864, 64196,08264,299 152,72629,52338,193 126,841 '11 4-12 !
83,18235 827
d 10 cone•ea
944,877609,398
1,078, 625
(-)
4,066,358
28, C09,063
«6,81214, 24718.23821,92319,52428, 98422 87619.76722,59026,531
116,731110,717112,380202,679174,450168,913
99, 706150, 898110 66183 931
357,073230 900
(-)(*)
the net inc
8,9749. 254
84, 793
1,160
5.720,227
82,316
3,286
5. 767
1, 65310,93318,55222,61020,98725,55818,81313.33816,26919,41263,93554,87538,48086,52457,83861,47132,86941,36623,23013' 48054.21928'978
P>
1,216,355
$50
08
347
6812.490
7132.3963,1182,0642.0605.5243,570
91828,2709,3593.943
10,64811.10913,0084,1678,9992,361
23,668
C-)
ome and ident it v of the
954,890623,707
1,195,4802,023,3132,170,434
47,412,500
$67, 267
104,173
219,946
190,080
161,887148,246145,035133,051105,299117,820
91, 72576,95479,39285,994
344,346254,799219,444395, 933307,696296,118166, 265239.456163,093108,833518,142295,76527,64277,464
368,49481, 204
axpayer.
IS. 8517.3122. 2947. 3456. 09
5.49
$0.33
.43
.70
1.06
1.451.912.242.652.963.543.213.823.904.094.574.975.616. S37.059.779.129.70
12.7910.4314.2715.1913.2529.1336-57I9.8o
to
rr>
c^
I_I
OO
QOCO
Digitized for FRASER http://fraser.stlouisfed.org/ Federal Reserve Bank of St. Louis

TABLE 2a.—PERSONAL RETURNS-DISTRIBUTION OF INCOMES, BY CLASSES; thawing for each class of income the number gof return •, net income, contribution>\ dividend , tax, and relative percentages, by State;—Continued.
INDI AN A—Continued.
Income class.
<r.(u\ noiy-S T'So POO^7."0 000-$ 1 000 000*1 000 000- SI 500 0(X)< 1 500 000 #2 000 000^2 000 000-$3 000 000S3 000 000 $4 000 000^4 (MM) 000 85 000 000So 000 000 and o\ er(Masses grouped l
(Jrand total
Number iof I
ret urns. ;
45 908
Total netincome.
$1,890,909
202,595,926
Exemptions from norma l !
tax.
tions. IMC ones.
$42,098
4,316,852
$695,946 ;
35,707,423
Normaltax.
$41,769 ;
2,081, 667
Surtax.
$385,567
2,506,158
War excess
Personalservice (8percent).
profits tax.
Investedcapital
(graded).
$44,909
781,648
$82,559
222,090
Total tax.A veragerate of
tax.
Ptr cent.
$5,591,563 2.76
STA
TI
mo
I O W A .
$2,000-12,500 2 . .$2,000-$2,500....$2,500-13,000 2 . .$2,500-$3,000....$3,000-$4,000 2 . .$3,000-14,000....$4,000-$5,000 2..$4,000-15,000....$5,000-$6,000 2 . .$5,000-$6,000....$6,000-$7,000....$7,000-$8,000....$8,000-19,000....$9,000-$10,000...$10,000-$ll,000..$11,000-112,000..$12,000-$13,000..$13,000-$14,000..$14,000-$15,000..
11,431 | $2(3,124,799 11,024,681
394*618*
$160,376
"328," 488";
$95,615 $95,615
13,408 | 36,835,690 259,998 j.
16,658 57,301,870 2,159,231
4li,322*
808,059 376,870 | S456 ! $5 :
i i
259,998
377,331
• 71
. 66
7,790 | 34,682,732 719,258 : 357,353 |. 358,105 1.03
905 |144 !241 |841 !
561 ;392269197 •169145
21,349,87013,847,8739,273,4377,108,8,"95,306,9064,104,5633,088,3532,457,2372,277,6312,100,147
271,964214,603144,515123,45896,85585,29751,78454,08569,21042,418 ,
853,821620,381657,364769,690650,797710,131545,260492,916554,629597,049
311,139 !245,794 i182,191143,998 i112,161 I86,984 i67,305 |54,029 146,56248,544 1
$13,78428,14331,40132,55830,92031,31026,53625,41725,75626.652
2,351 •49,76921,36121,32618,50423,432 ;14,32312,84613,84213,660 i
60,1522,706
11,05418,08117,39614,15010,90813,80417,51110,903
387,426326,412246,007215,963178,981155,876119,072106,096103,671 j94,759 j
1.812.362. 653.043.373.803.854.314. 554. 51
Digitized for FRASER http://fraser.stlouisfed.org/ Federal Reserve Bank of St. Louis
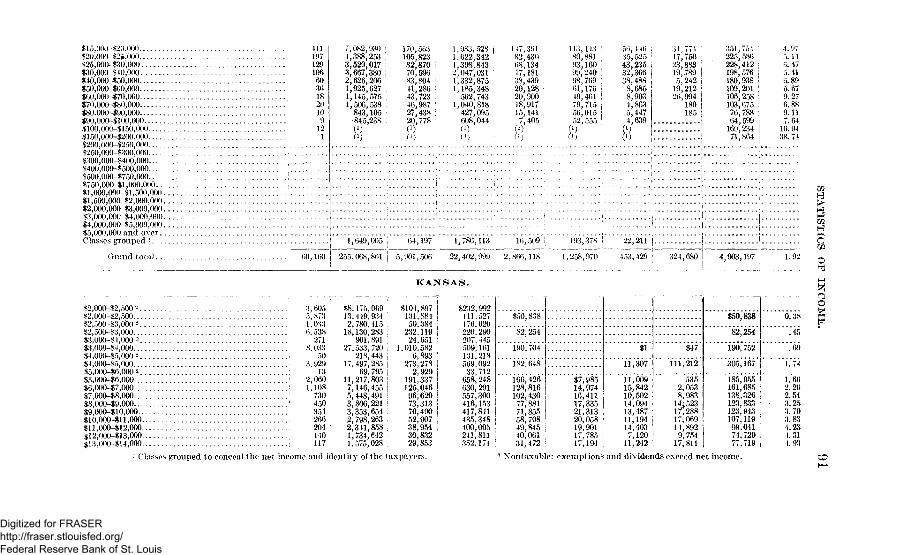
$lo,000~$20,000120,000-f 2#,0()0$25,000-330,000$30,000-340,000$40,000-350,000150,000-360,000$60,000-370,000$70,000-380,000$80.000-390,000$90,000-1100,000$100,000-$150,000$150,000-3200,000$200,000-1250,000$250,000-1300,000$300,000-1400,000$400,000-1500,000$500,000-1750,000 ,$750,000-11,000,000$1,000,000-11,500,000$1,500,000-82,000,000$2,000,000-$3,000,000S3,000,000- -$4,000,000$4,000,000-35,000,000$5,000,000 and overClasses grouped l
Grand total
$2,000-12,500 2$2,000-32,500$2,500-33,000'-'$2,500-33,000$3,000-$ 1,000 2
$3,000-34,000$4,000-35,000 2
$4,000-35,000$5,000-$6,0002.. .$5,000-16,000$6,000-17,000$7,000-18,000$8,000-19,000$9,000-$10,000$10,000-311,000$11,000-312,000$12,000-313,000$13,000-314,000
41119712910660361820109
121
082,,388,529,
,667;,626,,925,, 145,,506,843,•845,0)0)
930 !253017380 i206 i627 i575 I538 i105 !
,238 ;
170,563105,823 :82,870 i70,59683,804 ;
41,286 :43,72346,987 i27,438 :20,778 !
C1)C1)
1,983,5281,622,3421,398,8432,047,0311,332,8751,185,348
502,7431,040,818427,095608,0440)0)
17,39182,43068,13447,18138,439 :20,12820,90018,91715,1417,405
(l)
Oj
113,143 ^89,88193;16099,240 ;98,769 i61,176 !49,461 i79,715 ;56,015 |52,555 !
0)
5li, 44635,52543,23532,36638,4888,6858,9034,8635,4474,639
oj
34,17,23,19,,'y
19',26,
77!750 i883 i789 !242 i212 1994 !180185 i
1
351,751225,586228,412198,576 i180,938 !109,201 ;106,258 \103,675 176,788 !64,599 !160,234 j71,864 1
4. 975. \\6.475. 416.895.679.276.889.117.6410.9438. 74
1,649,005 1 64,197 1,786,113 16,509 i 193,378 | 22,211 j . . .
255,068,861 j 5,901,506 22,402,999 2,866,118 j 1,258,970 i 453,429 | 324,680 j 4,903,197 •
KANSAS.
605 :,873, 03353827103350
92913
,060,108730450 !354266204 :140117
$8,175,069 i13,449,934 !2,780,415 '
18,130,283 i901,891 |
27,533.720 |218,443 |
17,497,285 j69,795 j
11,217,803 |7,146,455 i5,448,491 i3,806,221 i3,353,6542,798,263 \2,3 41,858 ;1,734,642 ;1,575,028
$104,897131,S8450,384
232,11924,651
1,010,5826,893
273,2782,929
191,337125,04696,62073,31370,49052> 90738,95430,83229,853
$232,992111,527176,020220,290207,445509,161131,218569,09233,712
658,248630,291557,300416,153417,841435,348400,005241,811352,174
1.92
$50,838
82,254
190,704
182,648
166,426128,816102,43077,88171,85558,79849,84540,06131,472
$7,98514,97416,41117,33521,31320,05819,90117,78517,194
$1
11,307
ii,00915,84210,50214,09413,48711,19414,4037,120
11,242
' *" •
347
111,212
5352,0538,98314L523It, 2S817,06914,8929,75417,811
$50,838
82,254
190,752
305,167
185,955161,685138,326123,833123,943107,11999,04174,72077,719
0.38
.45
.69
1.74
1.662.262.543.253. 703.834.234.314.93
H <
UlH
sUl
ao
'- Classes grouped to conceal the net income and ideniity of the taxpayers. 2 Nontaxable; exemptions and dividends exceed net income.
Digitized for FRASER http://fraser.stlouisfed.org/ Federal Reserve Bank of St. Louis
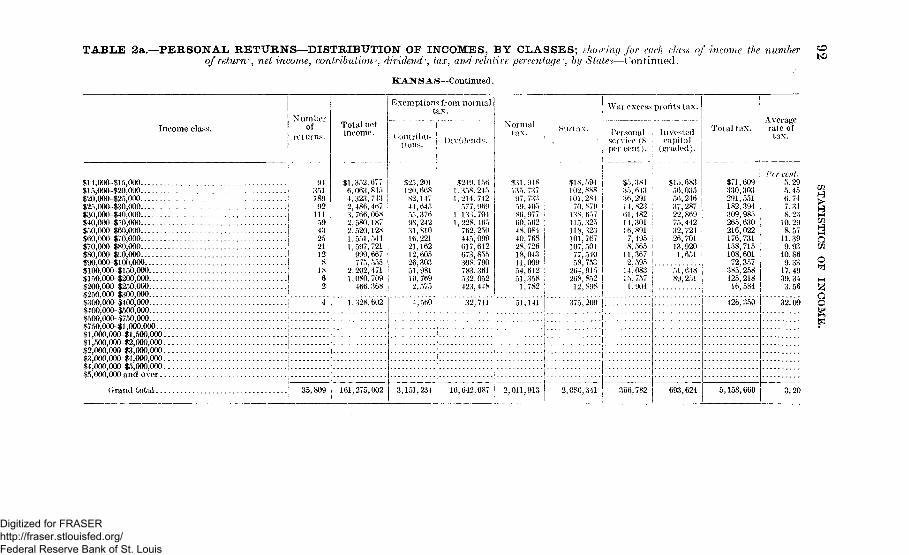
TABLE 2a.—PERSONAL RETUItNS—DISTRIBUTION OF INCOMES, BY CLASSES; showing for each c7<m of income the numberof return7-, net income, contribution*, dividend, tax, and relative percentage -. by S tate v—Continued.
KANSAS—Continued.
Income class.
$14,OUO-$15,OOO$15,000-~$20,000$20,000-$25,000$25,000-130,000$30,00()-$40t000$40,000-$:"0,000$50,000-$60,000$60,0O0-$70,00O$70,000-180,000$80,0OO-$90,00O$90,0O0-$100,000$100,000-$150,000$150,000-$200,000$200,000-$250,000$250,000-8300,000$300,000-8400,000$100,000-1500,0008500,000-8750,000$750,000-$l,000,000...$l,000,000-$l,500,000.$1,500,000-$2,000,000.$2,000,000-13,000,000.$3,000,000-$4,000,000.$4,000,000-15,000,000.$5,000,000and o v e r . .
N u m b e rof
91351189
921115943
21128
IS
Total netincome.
$1,352,6776, 063,8454.323,7132,486,4673,766,0682,580,1872,520,1281,551,5441,597,721999,667
Exemptions from normaltax.
2,202,4711,080,709
466,368
Contribu- |t ions. :
$25,201120,66882,14744,64")55,37698, 24231,81016,22121,16212,60526,30351,98110,7692,575
Dividends .
$249,1561,358,2451,214,742
577,9691,133,7041,228,465
762,250445,099617,612673,855308,790783,361532,052423,448
Normallax.
$31,948135,73797,73359,40586,97760,56248,08440,76828,72618,043 I11,009 !54,612 !51,358 !
1,782 I
War excess profits t ax .
Personal Investedservice (8 j capi talper cen t ) . I (graded) .
$18,594102,888101,28170,879138,657115,325118,323101,767107,50477,54058, 753264,915268,852
12,898
$5,38435,61336,29114,82361,48214,30116,8917,4958,56511,3672,59514,08315,7571,904
$15,68356,03556,24637,28722,86975,44232,72426,70113,9201,651
'"51*648"89,251
Total tax.
$71,609330,303291,551182,394309,985265,630216,022176,731158,715108,60172,357385,258425,218 ,16,584 !
Averagerate of
tax.
Grand total. 35,809
1,328,602 j 4,560 , 32,711 i"" "51,141 " " 375,209 |
161,275,002 3,151,234 16,642,087 j 2,011,913 | 2,086,341 366,782
cr cent.5.295.456.747.348.23
10.298.57
11.399.93
10.869.33
17.4939.34
3.56
tP
£">.£jt—iXflHa
oXfl
o
426,350 I 32.09 O
693,624 5,158,660 3.20
Digitized for FRASER http://fraser.stlouisfed.org/ Federal Reserve Bank of St. Louis
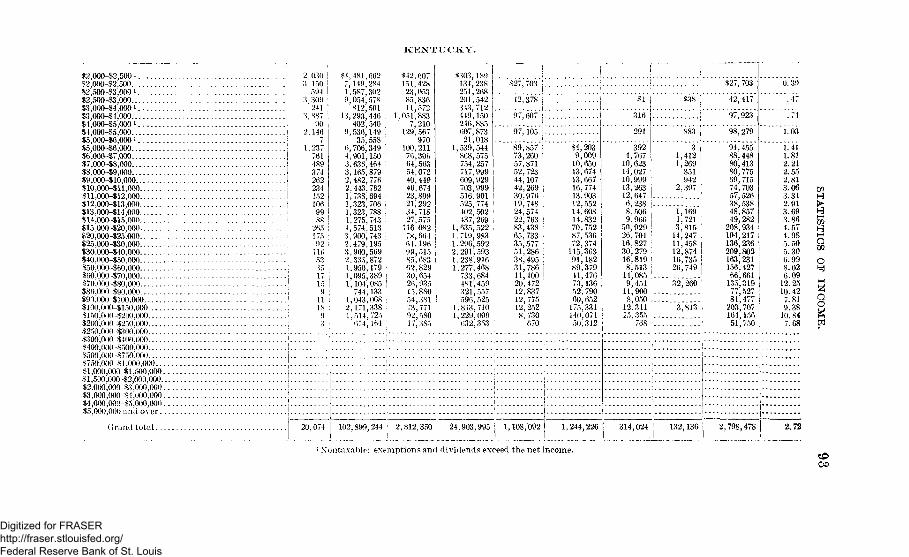
K E N T U C K Y .
82,000-82,500 1
S2,00042,.500$2,500-83,000182,500-83,00083,000-84,000!83,000-84,000$4,O0O-$5,000 i84,000-85,000$5,000-16,000 i$5,000-~$6,000$6,000-$7,000$7,000-18,000$8,000-19,000$9,000-110,000810,000-811,000811,000-812,000$12,000-113,000$13,000-114,000814,000-815,000$15.000420,000$20,000-125,000825,000-830,000$30,000-140,000$40,000-150,000$50,000-160,000860,000-870,000$70,000-$80,000880,000-890,000$90,000 $100.0008100,000-8150,000$150,000 -$200,0008200,000-82.30,000$250,000-$300,0008300,000 $400,0008400,000-8500,0008500,000-8750,0008750,000-81,000,000$1,000,000 -81,500,00081,500,000-82,000,000$2,000,000-13,000,000$3,000,000 -84,000.00084,000,000-85,000,00085,000,000 and over
2,0303.150
5943,309
2413,887
90 ,2,146
1,237761489374262234 J152 |106 i99 !88 !
265 !1792 i
116 !53 I35 !
11 i1893
$(,481,6627,149,2841,587,3029,054,578
812,50113,293,446
402,5409,536,149
35,5586,706,3494.901,1503,636,4643,165,8792,482,7762,443,7621,738,6941,323,706 i1,323,788 I1,275,7434,574,5133,900,7432,479,195 :
3,960,5692,335,8721,950,1791,095,389 ;1,104,085 I
744,1331,043,008:2,171,3381,514,725
674,164
$42,607151,42823,05385,83611,572
1,051,8837,210
129.567970
100,21176,30664,56354,07240,44946,67423,80921,29234,71827,575126,08278,66464,19699,51585,68362,82930,65426,93513,88054,38173,77192,58017,385
$303,134,251,201,313,449,246,607,21,
1,539,868,754,717,609,703,516,525,402,437,
1,635,1,719,1.296,2,291,1.238,1,277,
733,481321596
1,8131,229632
189238268542712150885873018544575257999929999901774502269522983592593916468684459557525710009353
$27,703 |
42,378
97,607
"97*165"
81 $38:
89,85773,26057,87152,72344,10742,26930,97619,74824,57422,76383,43865,73335,57751,28638,49531,78611,10020,47212,83712,77512,2528,730670
$4,2039,00910,65013,67413,66716,77413,90312,55214,60814,83270,75287,53672,374115,36391,18289,37941,47673,13652,79060,652175,331140,07150.312
316
'29l'
(1 rand to ta l . . . 20,074 102,899,244 2,812,350 i 24,903,995 1,108,092 1,244,226
3924,767
10,62314,02710,99913,26312,6476,2388,5069,966
50,92926,70116,82730,27916,8198,513
14,0859,451
11,9008,050
12,31115,355
768
883
31,4121,269
351942
2,397
1,1,3!14,11,12,16,26,
32,
169721815247458874735749
260
3,813 I
314,024 132,136
$27,703
42,417
97,923
98,279
94,88,80,80,69,74,57,38,48,49,
208,194,136,209,163,156,66,135,7781*203,164,51,
455448413775715703526538857282934217236802231427661319527477707156750
1.411.812.212.552.813.063.312.913.693.864.574.985.505.306.998.026.0912.2510.427.819.3810.847.68
2,798,478
] Nontaxable: exemptions and dividends exceed the net income.
2.72
oCO
3ao
CO
Digitized for FRASER http://fraser.stlouisfed.org/ Federal Reserve Bank of St. Louis
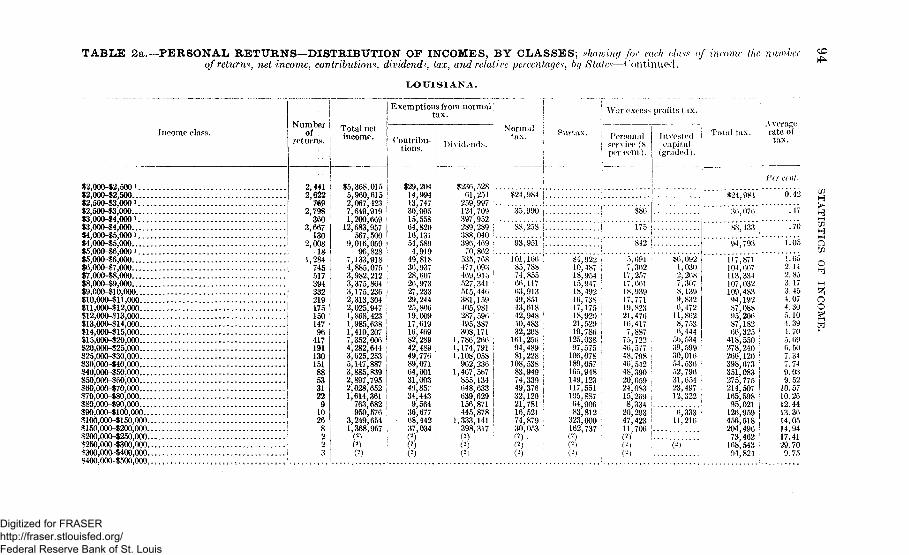
TABLE 2a.—PERSONAL RETURNS—DISTRIBUTION OF INCOMES, BY CLASSES; showing for each class of income the numberof return?, net income, contributions, dividend?, tax, and relatire percentages', by State*—Continued.
LOUISIANA.
Income class.
$2,000-82,500 i$2,000-$2,500$2,500-$3,0001$2,500-83,000$3,000-84,0001$3,000-84,000$4,000-15,000 i$4,000-15,000$5,000-86,000 i$5,000-86,000$6,000-$7,000$7,000-18,000$8,000-89,000$9,000-810,000$10,000-811,000$11,000-812,000$12,000-$13,000$13,000-814,000$14,000-815,000$15,000-820,000$20,000-825,000$25,000-830,000$30,000-$40,000$40,000-850.000$50,000-860,000$60,000-$70,000$70,000-880,000$80,000-890,000$90,000-$100,000$100,000-8150,000$150,000-$200,000$200,000-8250,000$250,000-8300,000$300,000-8400,0001400,000-1500,000 T
Numberof .
2,441 I2,622 |
2,798 I360 !
3,667130
2,00818
1,28474551739433221917515014796
417191130151885331229
10268223
Exemptions from, normal \tax. War excess profits tax. I
Total netincome.
$5,368,0155,960,6152,067,423 I7,649,919 !1,200,669 i
12,683,957567,500
9,016,059 I96,828 !
7,133,918 !
4,885,075 !3,982,212 ;3,375,864 (3,175,236 !2,313,304 i2,025,947 !
1,868,423 i1,985,638 !1,410,2077,352,00(34,282,6443,625,2535,147,8873,885,8392,897,7952,028,6521,614,361 i
763,682 !950,576 !
3,249,654 j1,368,957 !
CO i
Contribu-tions.
$29,204 i14,994 J13,74730,09515,558 i64,820 !16,13154,589 !4,919 •
49,818 ;
36,93728,60726,97327,23329,24425,80619,00917,61916,46982,289 ;42,48949,776 !89,071 i64,001 i31,003 !
46,857 l
34,4439,564 i
36,67768,442 i37,034 |
$ !
00
Dividends
$236,52861,254259,997124,709397,952289,289 !388,040 i396,469 i70,862 i535,768477,093469,915 '527,341515,44(5381,159405,981287,596495,387308,171
1,786,266 ;1,174,791 !1,108,058 I962,236 !
I,467,5b7 I855,134648,633 !639,629 !156,871 I445,878 !
1,333,141 !398,317Cf) j
o o i
Normaltax. Surtax.
101,16685,78874,85566,11763,91349,85143,61842,94840,48332,208161,25694,48981,228108,53883,94974,33949,37632,12021,78116,52174,87930,053(2) .
Personalservice (8per cent).
Investedcapital
(graded).
Total tax.A veragerate of
tax.
1 ;$24,984
35,990
88,258
93,951
! $86
$24,984
36,076
1 175 <1 842 .
88,433
94,793 '
Per cent.
0.42
.47
.70
1.05
$4,922 i10,487 I18,954 !15,94718,49216,73817,175 i18,920 !21,529 |19,786 j
125,038 !97,575 '
106,078 '189,057 !165,948149,123 •117,551105,88764,90683,812 ;
323,000162,737
7,36217,25717,66118,93917,77119,82321,47616,4177,887
75,72246,577 ;48,798 I46,542 I48,39020,659 i24,083 ;15,269 I8,334 i
20,293 !47,423 i11,706 i(2) !V1) :
$6,0921,0302, 2687,307S, 1399,8320,472
11,8028,7536,444
5b,53439,59930,01654,53652,79631,65423,49712,322 ;
6J333*1
11,216
117,871104,667113,334107,032109,48394,19287,08895,20687,18266,325
418,550278,240266,120398,673351,083275,775214,507165,59895,021
126,959456,518204,49673,462
168,54304,824
1.6a2.142.853.173.454.074.305.104.394.705.690.507.347.749.039.52
10.5710.2612.4413.3614.0514.9417.4129.709.75
oin
io
i
Digitized for FRASER http://fraser.stlouisfed.org/ Federal Reserve Bank of St. Louis

$500,0OO-$750,000$750,000-$l, 000,000...11,000,000-$l,500,O00.$1,500,000-12,000,000.$2,000,000-13,000,000.S3,0O0,00O-$4,OO0,OO0.S4,000,000-$5,000,000.S5,000,000 and over . .Classes grouped2 1,902,065 31,743 |
Grand total. 20,015 115,896,180 \ 1,145,101
1,133,698 |
18,739,170 |
32,984
1,705,(543 i
254,101
2,107,703
8,208
573,391
"41^530!
428,238 4,815,035 ;
M A I N E .
S2,000-$2,500 i$2,000-$2,500$2,500-83,000 i$2.500-$3,000$3^000-$4,000 i$3,000-$4,000$4,000-15,000»$4.000-15,000S5,000-$6,0001$5,000-$6,000$6,000-17,000$7,000-$8,000$8,000-89,000$9,000-110,000$10,000-$11,000$11,000-$12,000$12,000-113,000$13,000-$14,000$14,000-$15,000$15,000-$20,000$20,00O-$25,000$25,000-$30,000•1530,OOO-$40,OO0HMO, 000-550,000$50,000-$60,000$60,000-$70.000$70,000-880,000$80,000-$90,000$90,000-$100,000$100,000-1150,000$150,000-$200,000*200,000-$250,000$250,000-3300,000$300,000-$400,000
907 i1,460 !
301 I
Si1,635 '
'62 ;838 ':547 i366 |271 !204 i155 !10090 ;75 :6180
16396
66 i44 ;24 i12 i20 !7 !3 I
16 !42 ;
$1,994,759 I3,303; 992
813,282 !3,748,017 I
601,093 j5,612,041 I
267,292 !3,744,470 !
26,172 I3,001,308 j2,367,051 !2,026,546 i1,720,868 I1,462,365 !1,047,267 !1.034,349 !
940,178809,720 i
1,156,079 !2,821,654 !2,153,088 ;1,540,119 !2,263,420 !1,933,013 !1,329,392 i
784,414 j1,494,378
589,150289,828 j
1,911,994690,743<*) '(2)
$24,455 j22,457 !11,393 |38,362 !8,560 !63,6375,047
50,837478
46,053 '!39,042 i35.076 (27,307 i25,60216;37520,11817 26518,77622;$9754,81956,04136,00848,04958,20931,862 i1 9 , 1 7 45 4 , 5 9 03 1 , 1 5 3
5 , 8 3 25 4 , 1 5 6
7 , 2 5 5
C2)
1
11
1
£252 056 1
22()' 647 '112,301 ;298 317283,412187 419 i306,281 [
21 190 i45o',412 !433,370411,645471i669417,901280.573.'530, 827278,864254,676396,571,086,373773,6126SL537 ',433,549 i.025,989 ;575,297 1410,433 !,210,019 !330,70749.872
975,461475,404(-)(-)
$12,084 ;
IS 372
39,809 !..
38 789
37.96235,15232,68026, (>9924,2241 9 , 8 5 1I S . 8 2 91 7 . 1 2 21 5 , 0 8 1I S , 0 7 35 5 , 2 1 94 1 , 8 6 52 0 , 4 7 03 1 , 8 3 53 1 , 8 1 42 7 , 8 3 813.17214', 0546,652s; 71s
32,30911,842
SI, 8701,3197,514
11,3557,6697, 434s, 221S. 2857, 55311,97040,99550,23141,11772,033SO,01773,78744,23487.81030', 477
184\58295,135(-)('A
^54
3 7 •
786 ;
2,909 ;.9,8445.2508,1996.80+9,0175 195
7 05224,12721.77013,14716,84120,0348, 2">93? 0535,704 !1 090 ]
3,143 '.14,4531.949
'' -)(")
SOD,700
3,580153
1.140:.',O34496
1,2484,150
12,91018,007
7 , 0 7 11 0 , 9 7 71 1 , 2 7 21 0 , 1 6 0
2 S , 3 2 65 4 . 6 4 0
• ¥ 1 2 , 0 8 4
I S , 3 7 2
3 0 8 0 3
3 8 S 2 0
1 1 0 , 3 1 84 2 , 3 8 05 3 , 0 1 S4 3 . 4 5 74 1 \ 2 3 S3 6 , 1 2 33 0 , 5 6 03 0 , 0 0 23 0 , 8 6 51 1 , 2 5 1
1 3 9 . 2 5 71 3 1 , 8 7 3
8 7 , 8 1 11 3 1 , 6 8 61 5 2 , 7 3 71 2 0 . 0 4 4
0 0 , 4 5 91 0 7 , 5 6 8
3 8 , 8 2 54 0 . 7 7 5
2 5 9 ; 6 7 01 6 3 , 5 7 2
8 0 , 9 3 80 8 : 0 1 8
0. 37
. 49
.71
1.04
3. 6S
1.792. 052. 532. 823. 453. 533. 25
\\. 574 . 9 40 . 1 25. 705. 827.900. 037 717.2(10. 5914.0713. 5S23.6816.7825.83
t>H\f-
tn
O
c0
1 Xontaxahle; exemptions and dividends exceed net income. : Classes grouped I o conceal the net income and identity of t he tax payers. CO
Digitized for FRASER http://fraser.stlouisfed.org/ Federal Reserve Bank of St. Louis
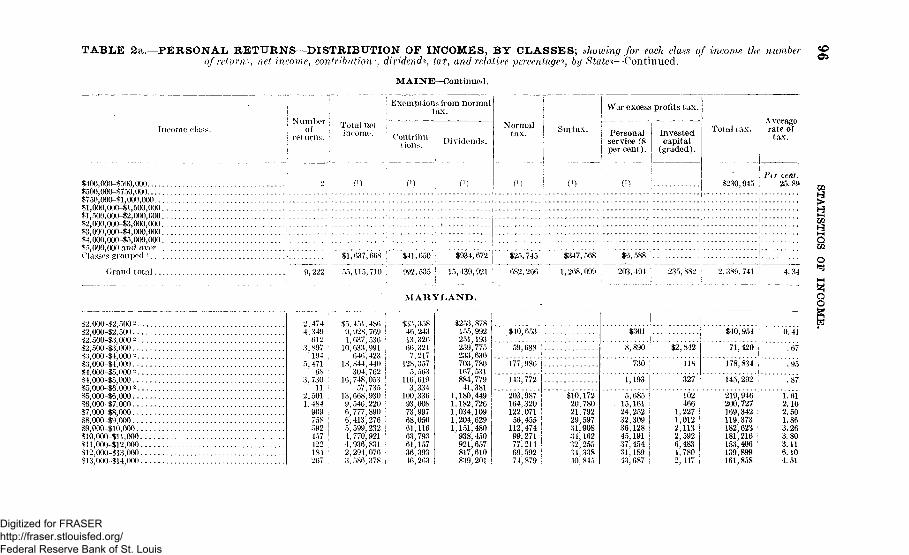
TABLE 2a.—PERSONAL RETURNS—DISTRIBUTION OF INCOMES, BY CLASSES; showing for each class of income the numberof return?, net income, contribution-, dividend?, hit, and relative percentages, by State*—Continued.
MAINE—Continued.
! Exemptions from normal; tax.
Tneomc class.
('•rand total
$2.000-$2,500 =$2,000-$2.f>00$2,500-$3,000 2$2,500-$3,000$3,000-$4,000-$3,000-$4,000$4,000-15,000 ••$4,000-$5,000$5,000-$6.000 2$5,000-46,000$6,000 $7.000$7,000 -$8,000$8',000 $9,000$9,000-$10,000$10,000 -$11,000$ll,000-$12',000$12,000-$13,000$13,000 --$14 000
Number;
returns.Total net !inoome.
$100,000-$500,000S5O0,OQO-$750,000$750,00O-$l,000,OO0 i.!?l,000,000-$l,500,000 ;.$1,500,000-$2,000,000 ;.$2,000,000-$3,000,000»3,000,00O-S4,0OO,000 !$4,O00,OO0-$5,O0O,OO0 j
85,000,000 and over ;.Classes grouped ! !•.
< « " - i Dividends.
0)
War excess profits tax.
Normaltax. Surtax.
0)
Personal| service (8| percent).
Investedcapital
(graded).
! AverageTotel tax. j rate of
> tax.
! Per cent.$230,9-15 i 25. S9
$1,637,66$ $41,650 : $934,672 $25,745 | $347,568 j $8,588 | . . .
9.222 5,115,710
474349612897194 :4716H73011 ;501484909 :758 |592457 !422:184267
$5,451,4869,928,7691,637'536
10,633,991646,423
18,844; 440'304,762
16,748,05357,735
13,668,9309,546,2206,777,8906,413,2765,599,2324,770,9214,936,8312,294,0763.586,378
992,535 ; 15,439,921
M A R Y L A N D .
$33,35846,24313,32666,321
7,217128,357
5,563116,619
3,334100,33693,00873,99768,05061,11663, 79361,15736,39346,263
682,266 1,268,099 , 203,494 235,882 : 2,389,741 4.34
I$253 878155,992251)193259 775233,630703,780167,531884,77941 381
1,180,4491,182,726L, 034,1091,204,6291,151,480938,450921,657817,610839,201
$40,653
59 688
177,986
143,772
203,987164,320122,07156,455112,47499,27177,21469,59274,879
$io,20,21,29,31,34,32,34,40,
172780792597908162255338845
$301
8 890
730
1,193
5,68515,16124,25232,30936,12845,19137,45431,18943,687
$2,
1,1,2,2,6,4,2,
84?
118
327
102466227012113592483780447
$40,954 I
71,420 i' 1
178,834 ;
145,292 1
219,946200.727169,342 ;119,373182,623181,216153,406 '139,899161,858
Ris
0 41
07
.95
.87
1.612.102.501.863.263.803.116.104.51
Digitized for FRASER http://fraser.stlouisfed.org/ Federal Reserve Bank of St. Louis
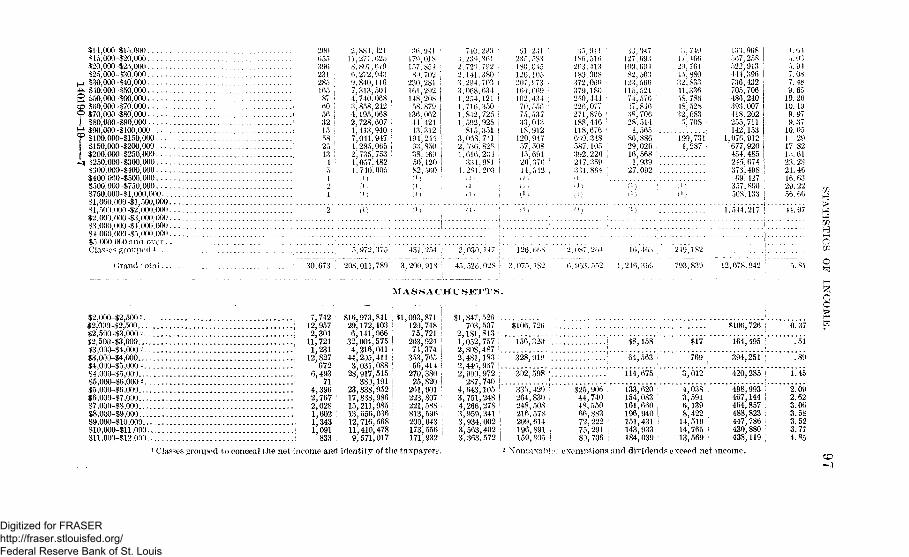
$i5.ooo$15,000 $20,000 . . .$20,000 425,000.$2.1,000 330 000 . . .
i $30,000-$40,000- $10.000-$50,000> S50.000-$60,000 . .5 $60'.000-1570.000> 370,000-880.000
$80,000-$90.0001 $90,000-$100,0005 $100,000-1150,000
$150,000-$200,000$200,000-3250,000
I $250,000 -$300,000$•$00,000 -$400,000$400.000-$500,000$500,000 $750,000 . .$750,000-Sl.000,000$1.000.009-$1,500,000$1,50 )'000-$2,000.000$2 (K)) 000-$."} 000 000 . . .$'V!000.000 $4.000.000$ t 000,000 -.?">, OOO 000
v' gi 'OUped 1
(Jrand ! o'al
200i55W6
m165.37 'HO56 ,3215582513 '
1
I
1
2
2,SM, 12111,277.025S.SO7.O706, 272.'.* 13<}.S40,1107,313.5044.740.06S3,858,2424,195; 0682. 728', 607l', 413,9407,041,9474', 285,0652,735.753 !1,057,4821.7 40.005
, 1l ,
> i ,
36 1)4117M 0 1 S157." S.M
s l 702230,281161.292143.20s5S.879
136,06241,42143,312
19 4,2449 3 , ,35038]46950,12082.56011, i
> ' •
! (
7J(J.
2 729.2. 14L3.2J4.3 06 *L2.U!1,716.1.S12.1,592,
M5.
2*. .VDO!
1.616.
1.2M
.1, i
-1
2;".)3617923X0703634121 •JoO (
725 •92 S351 :
82 K !23 4 ,QSi !203 !
'31,2X5.L^O126.207,16 t.102.7075
18'120
57,15'26ui ,
. 1 ,
1 ,
2.51
01.-105'7366913 t5." 6537013912917 '508 .6913705 12
1 SO*. 516203.413189', 908372;060379.180250^444 •226,077271,876 *188;446 !118'676 •669,348 :
587.105 :392/226 1217.359 ;
3U.864 |
•: \ ' \
( i )
r 1 ' ) '
33.047127'. 093109,691
82, ,3031231566115,521
74', 576!7',S4638,70628,5144,565
86,886 .29,020 !16,568 : . .1'939 !
27,092 ;
( l)(i)
n
::, 74917,4662i),76145.88032,83341,33658,78648,52832' 083
5,70S
199,7314,287 ;
• - ' )
13') 968567^258522,913144,396736,432705,706486,240393,007118,202255,711142,153
1,076,912677,920454,485245,674373,49869,427
357,800508,133
1.544.217
4.645. 035. 917.087. 489. 65
10. 2610. 199.979.37
10. 051 2917 82I 0 . 6 I23. 2321. 4616. 6329. 2256. 66
41.97
30,673
5,l>72, •'575 « J , 251 ' 2, 030. 147
208.011, 739 3. 200, 91S ,' }5. 52M. 02^ I
]26.C,l.s
,075, JS2
2,0^7,264
0.953,552
16,463
,2 46,36f-
219,182
793.839 12,078,942 ' o
M A S S A C H U S E T T S .
$2,000-$2,5002 7,742 $16,973,841 j $1,003,871 \ $1,847,526$2,OD0-$2,500 1 12,957 29,172,103 ! ' 129,748 ! 703.507$2,500-$3,000 - i 2,301 6,141,066 ! 75,721 i 2,181,813$2,50a-$3,000 1 11,721 32,004,575 | 203,924! 1,052,757$3,000-$4,000 -' i 1,231 4,216,041 74,374 | 2,808', 487$3,000-14,000 12,827 44,205,411 : 353,765 | 2,481,183$4,0!)0-$5,000 - ! 672 3,031,088' 56,414! 2,446,967$4,000-$5,000 6,493 28,917,515: 270,380 1 2,900,972$5,000-$6,000 2 i 71 389,191; 25,820! 287,740$5,000-$6,000 4,396; 23,838,952 i 261,901' 4,643,105$6,000-$7,000 2,767 ' 17,838,986 ' 223,807 ! 3,751,248$7,000-$8,000 2,028 15,211,985 : 221,588 : 4,266,278$8,000-$9,000 1,602 13,656,036 ! gi3; 59ft , :^95^341$9,000-$10,000 : 1,343 12' 716,568 i 200,043 ! 3,934,002$10,000-$11,000 i 1,091 11,410,478 i 173,556; 3,563,402$U,000-$12.000 ! 833 9,571,017 ' 171,932 3,363,572
1 Classes grouped to conceal the net income and identity of the taxpayers.
$106,720
156.320
328 919
302 598 !
.i $8,158 :
64,563 >
114,675 :
$17
769
3,012
$106,726 ;
164,495 :
394,251 ;
420,285 i
0.37
.51
. 80
1.45
335,429 :264,830 ;248,508 !216.578 ;
209,614196,891 !159,805 i
$25,90644,740 ;
48,55066,883 :
72,222 :75,291 l
89,706 ;
133,620 i154,083161,660 ,196,940 I151,431 !143,933184,039
4,038 I3,591 I6,139 !8,422 I
14,51914,765 !13,569 >
2 N"ontaxabl:>; exempt ions and dividends exceed net income.
498,993 i467,144 1464,857 ;488,823 i447,786 i430,880 :
438,119 ;
me.
2.092.623.063.583.523.774.85
CD— 7
Digitized for FRASER http://fraser.stlouisfed.org/ Federal Reserve Bank of St. Louis
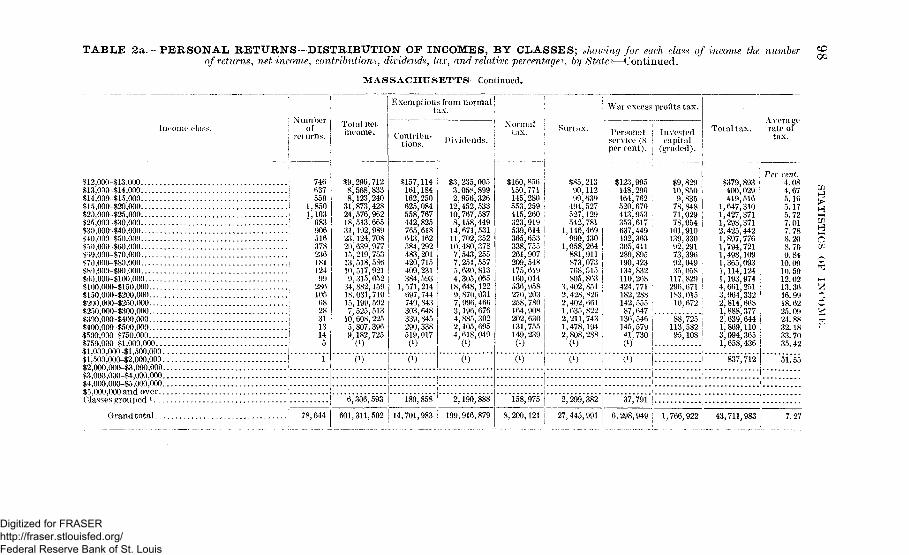
TABLE 2a.—PERSONAL RETURNS—DISTRIBUTION OF INCOMES, BY CLASSES; showing for each class of income the numberof returns, net income, contributions, dividends, tax, and relative percentage1, by State*—Continued.
MASSACHUSETTS—Continued.
00
NumberIncome class. of
i returns.
$12,000-$13,000 746$13,000-$14,000 i 637$14.000-$15,000 ! 559$lo,000-$20,000 i 1,850$20,000-125,000 ' 1,103$25,000-$30,000 1 " 683$3a,000-$40,00() 906S40.000-$50,000 516$50,000-$60,000 378$!>Q,000-$70,000 236*70,000-$80,000 : 181$XO,000-$90,000 124$90,000-1100,000 99S100,000-$150,000 286$toO,000-$200,000 :, 105$2f)0,000-$250,(XX) ! 68#250,000-$300,000 ' 28«330,000-$400,000 i 31$400,000-$500,000 | 13$500,000-$750,000 1 14$750,000-11,000,000 { 5$1,000,000-$1,500,000 1$1,500,000-$2,000,000 | 1$2,000,000-$3,000,000 j$3,000,000-54,000,000 j$4,000,000-$5,000,000 i$5,000,000 and over JClasses grouped 1
Total netincome.
$9,296,7128,568,8338,123,240
31,873,42824,576,96218,513,66531,192,98923,124,70820,639,97715,219,75313,518,58610,517,9219,315,052
34,882,15918,031,71015,199,5027,525,513
10,608,2255,807,3969,182,725
0)
Exemptions from normal;tax. i ' War excess profits tax.
" 2 I
0)
Contribu-tions.
$157,114161,184162,250625,084558,767442,825765,618643,162584,292483,201420,715409,231384,593
1,571,214697,744740,843303,648339,845290,338519,017
6,306,593 i 180,858
Grand total 78,644 601,311,502 j 14,701,983
Dividends.
$3,235,0053,058,8992,956,326
12,452,53310,767,587 |8,158,449 1
14,671,53111,702,35210,480,3787,543,2557,251,5575,630,8134,305,065
18,648,1229,870,0317,996,4663,196,6764,885,3022,105,6954,618,049
C1)
2,190,888
199,916,879
Normaltax.
$160, 856150,771145,280553.259415.260323,919539,614365,653338,755261.907209,548175,619160,014536,958270,203258,780164.908202,630131,755149,239
0)
Surtax. Personalservice (8percent).
$So,21390,11299,639
494,527527,129542,781
1,146,469 !990,430 j
1,058,264 I881,911 !873,073 |768,515 i805,863 I
3,402,851 I2', 428,826 |2,402,661 !1,635,8222,211,7431,478,1942,808,288
0)
$123,995148,296164,762520,676413,953353,617637,449402', 363305,411280,895190,423134,832110,268424,771182,288142,55587,647
136,546 I145,579 j41,730 |C 1 ) I
Investedcapital
(graded).
Total tax.j Average
rate ofi tax.
$9,82910,8509,835
78,84871,02978,054
101,910139,330 :92,291 !73,396 |92,049 i35,058
117,829 |296,671 i183,01510,672 i
"88," 725* I113,582 !95,108 |
$379,893400,029 !419,516
1,647,310 j1,427,371 i1,298,371 i2,425,442 I1,897,776 ;1,794,721 ;1.498.109 i1,365,093 !1,114,1241,193,974 i4,661,251 !3,064,332 '2,814,668 !
1,888.377 i2,639,644 i1.869.110 j3,094,365 !1,658,436 i
Per cent.4.084.675.165.175.727.017.788.208.709.84
10.0910.5912.0213.3616.9918.6225.0924. 8832.1833.7035.42
C1) C1) 837,712
158,975 j 2,299,382 37,791
51.55
I
8,200,121 | 27,445,991j 6,298,949! 1,766,922 J 43,711,9 7.27
Digitized for FRASER http://fraser.stlouisfed.org/ Federal Reserve Bank of St. Louis
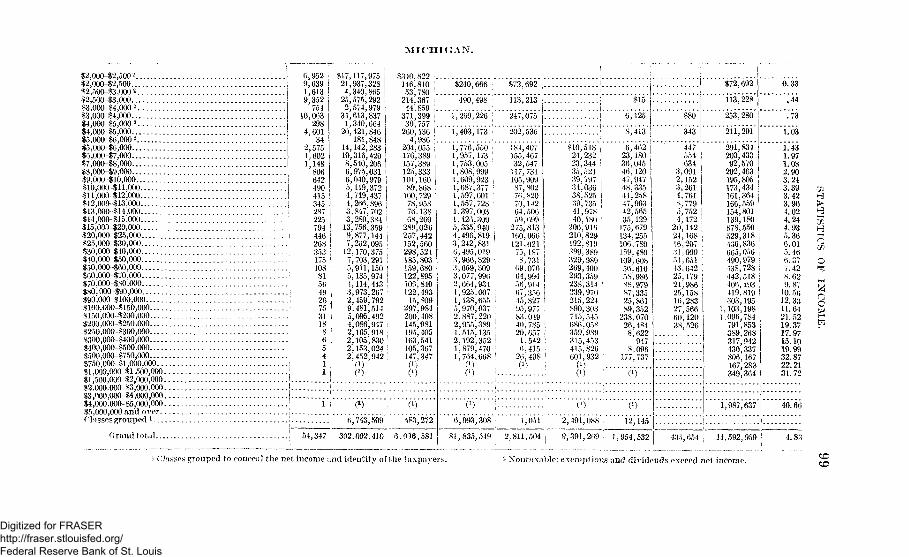
MICHIGAN.
Grand total.
$2,000-$2,5002 6,95282,000-82,500 9,639$2,500-83,000 2 1,613$2,500-83,000 9,352$3,000-$4,000 2 754$3,000-14,000 10,063$4,000-15,000 2 298$4,000-$5,000 4,601$5,000-$6,0002 34$5,000-86,000 2,5 75$8,000-37,000 1,60287,000-88,000 1,148$3,000-$9,000 806$9,000-810,000 642810,000-811,000 490$11,000-812,000 415$12,000-813,000 | 345$13,000-414,000 . i 287$14,000-815,000 ' 225$15,000-120,000 794•120,000-125,000 i 446$2o,000-$30,000 268$30,000-$40,000 353$40,000-850,000 175$50,000-160,000 108$60,000-870,000 : 81$70,000 -$S0,000 i 56$80,000-$90,000 ) 49$90,000-$100,000 ! 26$100,000-8150,000 ; 75SI 50,000-$200,000 31 I$200,000-8250,000 18 j$250,000-8300,000 8 |$300,000 -$400,000 68403,000-8500,000 i 5$500,000-1750,000 4$750,000-$!,000,000 i 1$1,000,000-11.560,000 j 1$1,500,000-$2,000,000 i$2,000,000-83,000,000 !$3,000,000-$4,000,000 1$4,000.000-85,000,000 ! 1 | (I)$5,000,000 and over 1 . .H asses grouped l 1 - 6,743,509
SI 7,117,97521,937,3284,340,865
25,575,2922,574,979
34,613,8371,340,664
20,421,846181,848
14,142,28310,316,4208,540,2066,975,0316,040,9795,119,3724,719,4374,266,8963,847,7023,280,384
13,756,3599,877,1447,232,095
12,170,3757,703,2915,911,1505,135,9744,114,4433,973,2672,459,7929,481,5145,095,4924,086,9472,165,9182,105,, 8302,153,0242;452,942
$310,822146,81053,780
214,36744,859
371,39930, 757
260,1364,986
204,055176,389157,389125,333101,16089,868
100,72978,95876.13868,269
289,026257,442152.560298,524185,803159,680122,895106,840122,49315,809
297,984200,408145,981195,405163,541105,367147,347(l)0)
483*272
54,347 1 302,002,410 6,016,581
$240,666 •.
"496*498*
$72,692 !.
1,269,226 :
1,403,173 i
1,776,550 i1,957,173 '1,753,005 !1,808,999 .1,609,923 |1,687,377 :
1,597,0011,557,728 ;
1,397,003 ;
1,12a,3095,335,940 i4,496,819 I3,242,8316,495,0193,966,8293,659,3093,077,9962,664,9341,925,0071,138,655 I5,970,0372,887,220 :
2,955,389 !1,515,135 i2,192,352 i1,879,470 !1,764,668 !
113,213
247,075
202,535
184,407155,46732,547
117,731105,90987,80276,82070,14264,50659,699
275,, 813160,066121,02175,1878,731
69,07664,99456,91467,35645,82795,97783,04940,78520,657
1,5426,415
26,498
0)
$10,51824,23223,34435,52139,79734,03638,52539,73541,97840,180
206,916210,829192,819399,389320,989269,400293,359238,314239,970215,224890,303715,545686,058359,989315,453415.826601,932
0)
$15 I
6,125 j
8,413 ! 343
$72,692
113,228
253,280
211,291
6,46223,18036,04546,12047'; 94748,33541,25847,90342,56535,129175,679134,255106,789159,480109,60856,61058,98688,97987,33525,86189,352238,07026,4848,622
9478.096
177,737
C1)
C1)
447554634
3,0912,1523,2614, 761S,7795,7524,172
20,14224,16816,20731,00051,65143,64225,179.21,98625,158.16,28327,56660,12038,526
201,834203.43392,570
202,463195,805 I173.434 I161,364 |166,559 ;154,801 !
139,180 i678,550 i529,318 !436,836 ;665,056 :490,979438,728 \442,518 i406,193 1419,819 !303,195 i
1,103,198 '1,096,784
791,853389,268317,942430,337806,167167,283349,364
1,987,637
6,993,308 1,051 2,491,088 \ 12,145 I..
81,835,549 2,811,504 1 9,391,209 1,954,532 j 435,654 | 14,592,959
0.33
\*44
.73
1.03
1.431.971.082.903.243.393.423.904.024.244.935.366.015,466.377.428.629.8710.5(>12.3311.6421.5219.3717.9715.1019.9932.8722.2131.72
40.66
4.83
? ("hisses grouped to conceal the net income and identi ty of the taxpayers . 2 Xontaxable; exemptions and dividends exceed net income. CDCD
Digitized for FRASER http://fraser.stlouisfed.org/ Federal Reserve Bank of St. Louis

TABLE 2a.--PERSONAL RETURNS—DISTRIBUTION OF INCOMES, BY CLASSES; allowing for each cla** of income thof returns, net income, contributions, dividends, tax, and relative percentage*, />// State •••^-rontinued.
the number
MINNESOTA.
O
o
Income class.
Exemptions from normal!tax. |
Numberof Total net
returns. 1 income.
j War excess profits tax.I ___
Contribu-tions.
Surtax.Dividends.
Personalservice (8per cent).
Investedcapital
(graded).
$2,000-$2,5001$2,000-12,500$2,500-$3,000 i t$2,500-$3,000 ;$3,000-$4,Q001 |$3,000-$4,000 |$4,000-15,000 i !$4,000-$5,000 1$5,000-86,0001 |$5,000-16,000 1$0,000-17.000 j$7,000-$8,000$8,000-$9,000 1$9,000-810,000 '$10,000-$l 1,000 !$ll,000-$l2,000 i$12,000-$13,000 j$13,000-^14,000 j$14,000-115,000 !$15,000-$20,000 1$20,000-125,000 j$25,000-830,000 1$30,000-$40,000$40,000-150,000 1$50,000-160,000 !$60,000-870,000 1$?0,000-$80,000 i$80,000-$90,000 ]
$90,000-$100,000$100,000-1150,000$150,000-$200,000$200,000-$250,000$250,000-1300,000$300,000-1400,000 1
6,8927,1292,3897,945
7819,058
1493,842
232,0171; 085
8105323.71302243237163114451283169202130
81534037276027
954
$15,358,562 '16,250,024 I6,116,546 ].
21,775,589 ;2,591,025 !
31,534,734 ;667,909
17,057,640120,351
10,992,2947,003,3876,126,2034,515,0553,508,975 '<3,146,235 '2,772,884 i2,944,311 j2,194,696 |1,655,684 |7,751,816 I6,294,943 j4,624,775 |6,940.823 I5,788', 743 I4,394,920 i3,378,703 !2,915,129 i3,150,933 !2,539,778 !7,239,624 i4,619,989 |1,889,339 !1,374,3981,508,960 I
§164,744 j.835,860 I84,648 i.
243,028 j45,769 I.403,342 |14,326 !.245,523 i4,078 i.
183,903 I114,468 '97,376 i94,20179,14457,01757,52161,84616,97815,322
173,333163,057119,474 :235,865 ;
184,363816,915108,22781,769146,32095,729291,199146,24797,75539,75322,741 :
$154,962 $61,991
272,252 84,210 !
791.573 | 194,115 j
S280
454
927,559 163,094 5,926
$68
401
i AverageTotal tax. | rate of
Per
1,070,740 :1,013,935 i1,078,668 !'925.024 !839,271 j894,961 !841,405 !831,598 !697. 354 I465,488 j
3,140,712 j2,975,841 '1,938,0503,597,7523,179,536 |2,839,609 !2,008.134 !2,026,364 I2,297,5901,369,353 I4,732,4393,565,3331,632,292748,322754,818 i
141,324 !105,672 |99,430 :76,053 '59,817 I56.051 |19,525 j5o,851 |39,463 !30, 727126,69392,174SO, 872107,11487,31750, 78150,27328,09930,21937,890 I81,091 !31,907 |10,395 ;22,870 i29 272 i
$6,082 l
12,62416,47918.32619,21019,03'821,27725,33522,007 i19,171 |111,646 i102,749 !107,284193,411 :206,676 ;162,331157,337 !116,095 :173,182164,952 I667,135374,787337,426 ,233,928384,938 ,
3,806 I12,624 |25,831 i23,495426,344 |26,098 I23,05233,20620,68420,350107,379 ;73,096 i78.229 i95,078 j74.299 i51,483 '35,029 !27,05926,235 !-30,873 I-23.230 '15,722 !.3,297 |.3,811 !.4,403 -
298 !
2,103 ;1 . 1 5 8 '•759 .746 ;
2,650676 !
5,846 !1,986 i2,702 !12,565 I14,575 ;25,442 :29,904 i11,993 i18,254 I14,075 [
19,478 !
80,776
862,339
84,2i6
194,649
169,421
151,510133,023142,898118,633506,117103,843 i94,530 !
120,238 |84,140 i72,950 !
358,283 |282,594 ;291,827 !425,507 I380,285282,849256,714190,731 i229,636 |233,715 !852,238 j422, 416 |351,118 !260,609 I418,613 i
0.38
"".39
".'62
H>3HO
1.391.902.332.63
14.423.303.414.083.834.414.624.496.316.136.576. 447.606.547.299.20
11.779.14
18.5818. 9627.74
hrj
HH
O
o
Digitized for FRASER http://fraser.stlouisfed.org/ Federal Reserve Bank of St. Louis
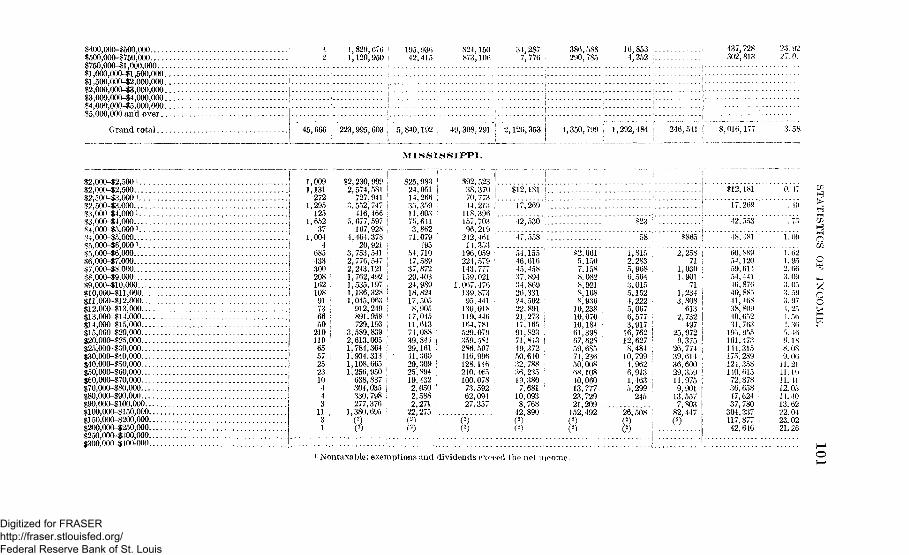
S400,000-$500J000$500,000-1750,000$750,000-11,000,000SI ,000,000-11,500,000...$l,500,000-$2,000,000...$2,000,000-$3,000,000...$3,000,000-$4,000,000...$4,000,000-15,000,000...$5,000,000 a n d over
Grand total.
L,I,
829,120,
(576 !950 i
195,'12,
93(i415
824,873,
15010ft
34,7,287776
380,290,
588785
Hi4,853252
437,728302,818
45,666 223,995, 603 5,840,192 19,308,291 2,126 353 I 4,350,799 1,292,484 I 246.541 | 8,016,177 j
MISSISSIPPI.
23. 9227. 01.
3. 58
!2,000~$2,500 • !$2,000-12,500 i$2,500-$3,000 ' I$2,500-- $3,000 j$3,0OO-$4,00O i , !$3,000- $4,000 1$4,00O-$5,000 l I$4,000-$5,000 !$5,000-16,000 i I$5,000-$6,000 !$6,000-17,000 i$7,000-18,000 1§8,000-$9,000 !S9,ooo-sio,ooo ;SI 0,000-111,000 1.$11,000-112,000 i$12,000-113,000 i$13,000-$l 4,000 1$14,000-815,000,115,000-120,000$20,000-125,000$25,000-$30,000$30,000-140,000$40,000-150,000$50,000-$60,000$60,000-170,000$70,000-$80,000$80,000-190,000$90,000-1100,000$100,000-$150,000$150,000-$200,000$200,000-$250,000$250,000-1300,000$300,000-4400-000
1,0091,131
272 '1,295
1251,652
371,004
4685433300208 i162:108917366 '50 !
210 i119 ;6557252310443
1131
12,230,9992,574,581
727,941 i3,552,747 i
416,466 i5,677,597 !
167,928 S4,464,378
20,921 I3,753,541 !2,776,547 '2,243,121 :1,762,492 I1,535,197 i1,136,328 i1,045,063 I912,249 i891,958 I729,193 i
3,589,839 !2,613,005 {1,784,364 !1,934,313 !1,108,665 i1,256,950 i638,837 !304,035 I330,798 i277,376
1,380,695
(2)
$25,98324,051 I14,266 j35,359 i11,003 i75,641 !3,862 :71.079 I
495 •54,710 ;
47,589 i37,872 !29.403 j24,989 ;18,824 !17,5058,905 '17,045 !11,61374,088 i39,844 i29,161 i41,36029,309 !25,89419,432 .2.050 '2.588 ;2,271 i
22,275
(2) '
$92,52338.37070,77344,213118,396157,70396,219
242,46114 353
196,059224,579143,777159,021
1.067,476139.87395,441130,018119,446164,781529,079359,581286,507416,996128,146210,465100,07873.59262.09427,357
(2)(2)
$12,181 i
17,269 '
42,530 i...
47,558 1
54,15546,61645,45837,89434,86926,33124,50222,89121,273 i17,165 !
91,82371,843 !49,372 ;50,640 •32,788 :•36,23519,3807,681 •
10,0938,768 :42,890
(2)
$2,6615,1507,1588,0828,9218,1688,93610,23810,07010,18461,39867, (m59,68574,23650,00868,10840,06013,77723,72921,209152,492
(2)
$23
58
1,8152,2835,9686,5643,0155,1524,2225,0676,5773,91716,76212,6278,48410,7994,9626,9131,1635.299245
26,508
(?)
$865
2,25871
1,0301,901
711,2343,808613
2,732497
25,9729,375
26,77439,61436,60029,35911,9759,90113,5577,80382,447
$12,18117,269
42,553
48,481
60,889 '54,12059,61454,44146,87640,88541,16838, 80940,65231,763195,955161,473144,315175,289124,358140,61572,87836,65847,624 j37,780 :304,337117,877 .42,646 •
0. 17
. 49
7.1
1.09
1.621. 9o2.663.093. 053.593. 971. 25I. 56•!. 36
5. 466.188. 089. 0611.2111.1911.4112.05M.-JO13.6222.0423.0221.26
XH
H
ohrh-l
c
1 Nontaxable; exemptions and dividends exceed the net income.
Digitized for FRASER http://fraser.stlouisfed.org/ Federal Reserve Bank of St. Louis

TABLE 2a.—PERSONAL RETURNS—DISTRIBUTION OF INCOMES, BY CLASSES; .showing for each elms of income the numberof return*, net income, contributions, dividend, tax, and relative percentage, by States—-Continued.
MISSIS SI PP I—Continued.
Income class. Total net
Exemptions from normal: tax. \
;«- | Dividends.
j War excess profits tax.
Normal II Personal1 service (8i percent).
Investedcapital !
(graded). ;
| AverageTotal tax. rate ol
tax.
S400,000-$500,000 1#500,000-8750,000 . IS750,00O-$l, 000,000 :
$ 1,000,000-$ 1,.500,(KM) . ! !$1,500,000-42,000,000 . . . . j . .:$2,000,000-83,000,000 i i$3,000,000-$4,000,000 j ,S4,OO0,000-&5,OO0,000 '. i '•>5,000,000 and over I !
Classes grouped i j ; $712,589
Per cent.
SI.5.50 :
Grand t o t a l . 9,240 ! 52.5.50,713 820,016
$192,068 ;
5,701,445 '
MISSOURI.
$26,394
898,599
$129,766 I
811,664
$1,598
140,321
•S2, 765
311,222 $2,191,806
tf2
H
o
o
$2,000-12,500 2$2,000-$2,500 !$2,50ft-S3,000 2$2,500-13,000 !
$3,000-84,000 2
$3,000-$4,000$4,000-15,000 2$4,000-85,000$5,000-86,000 2$5,000-86,000$6,000-87,000$7,000-88,000$8,000-19,000$9,000-$10,000$10,000-811,000$11.000-812,000$12,000-813,000$13,000-814,000
4,9,1,9.
1,
5,
3,1,1,
268 S490 1013 !760 !
375251:118 I595 !10 !
179 !854 !268 !941 !720 !563463 i367 '273 •'
$9,402.87321,535,5012, 717,52726,796,4821,256,515
38,678,328518,162
24,896,64555,377
17,367,34011,975,7869,470,7067,960,9476,812.3075,907;0515,315,1764,591,2693,683,424
$69,213 I121,104 i32,438 '
205,709 !20,111 I
381,779 !8,479 !
301,522 ;2,294 i
225,457 !988,983146,823 '124,115 i115,798 '102,750 I91,70082,668 >84.086 <
$413,167240,130423,785417,084507,715
1,128,788340,825
1,528,85039,050
1,930,6501,694,9371,718,3341,629,4651,713,9081,743,8541,504,6281,547,2951,246,805
$97,350
122,707
239,620
83,199
50,32386,86830,260145,60030,03711,28930,16277,98063,331
$13,543 !22,877 i34,57435,44737,038 :40,017 !43,800 •42,47640,324 ,
$423 1
543 |
891 11
13,093 1..
10,411 i' 20,571 !41,823 !48,433 !49,754 I50,59756,142 i48,874 !35,823 |
|
1i|
$60 |
1""'
89 j389 i
1,003 !1,301 !3,844 :
1,247 i3,0521,0224,111 ,
$97,773
123,250
240,57 1
96,292
74,366130,705107,660230,781120,673103,150133,156170,352143,589
0.45
.46
Y"3.39
.431.091.142.901.771.752.513.713.90
Digitized for FRASER http://fraser.stlouisfed.org/ Federal Reserve Bank of St. Louis
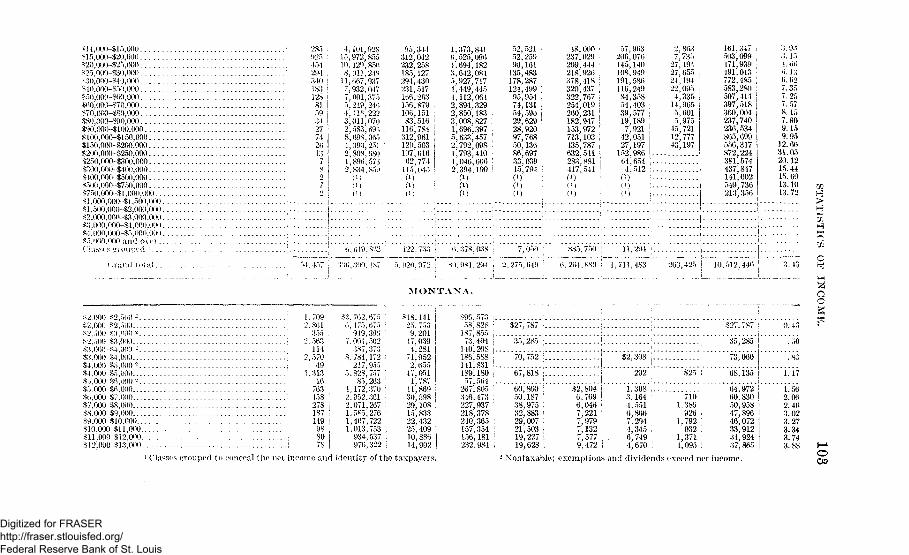
H },000-SI 5,001)815,000-^20,000*2O00$250OO
, ,S 25,00* )-SW. 000** 10,000-%">0,000V,0,000- $60,000•*00,000-370,000
S80,000-890,000mooo- -$ 100,000s 100,000-3150,000*150,000-?ti200,000s200,000~$250,000S250,000~*300,000S;>00,00P-S400,000S400,000-$500,00O<GO;>OOOS750OOO^750,000-Sl ,000,000 . .S 1,000,000-S1.500,000..•>l,5OO,OOO»:i>2,oe)O,OO>r
28.->l >25
154291
•uo1S3
12S8J59342771261378
4,101,92815,972,85510,129,8568,011,249
11,667,9377.932,0477\ 001,3755,249,2404,416,2223,011,0702,583^ 6968,698,0654,393,2512,808,680 •:1,896,5732,834,859
05,344312,042232,258185,127294,430231,517166,263156,879106,15183,516
116,784312;961120,503107,61662,774
115,045
1,373,8416,525,0964,694,1823,642,0845,927,7174,449,4454,112,0642,894,329 i2,850,183 »3,008,827 :1,696,397 i5,633,457 j2;792,098 S1,793,410 i1,046,666 !2,394,190 !
C1)(l)C1)
52,521 :52,25990,161135,483178,287124,499 ;95,954 :74,131 :54,595 j29,629 !28,920 I97,768 I50,136 •86,697 I33,039 !15,794 !
!()(0
48,000 :237,029209,444218,926378,418 I320,437 :322,767254,019260,231182,947153,972 I713,103 '435', 787632,541283,881417,5410)0)0)
57,963206,076145,140108,949191,586116,249%\, 35854,40339,57719,189
7,92142,05127,197
152,98664,6544,512
0)
27,
2727'24,22,
4,14?
5,
45,'124 3 ;
863735194655194095335965601975721777197
161,347503,099471,939491,013772,485583,280507,414397,518360,004237,740236,534865,699556,317872,224381,574437,847141,002549,736213,356
L600. I:J•>. 627.357.257.578.157.909.159.95
12.6631.0520.1215.4415.6913.1013.72
<;,ooo,ooo~ ^l.oooS4.l)OO,<K)O-!$5,l!00,00O<5,OiV),onn a n d O U T - -
S2.000 K2,500 --2.000 S2,500<2.")()() s:} Hi).) a. . . .
^3.000-^4,000•< 1,000- S."), 000 2
"i.OOO X'i,0(>0 2.^.•),000 S6.000S»).0(K)-S7.000
>.'x.ooo-.s:),ooo
"$io.ooo->n,ooosn,ooo su>,ooosi2.000-^13.000 . .
6,649.8i)2
.'{00,300, !S7
122,733 I
•, 926.972 ;
(>,378,038 i 7,050 i
SO,981,294 i 2.275,649 i
885,750 j 11,294 '
6,264,889 ! 1.711,483 260,425 i 10,512,446
M O N T A N A .
709801 :355 .563 '114570 ;
49313 !
16763 !458 •278 ;187 !149 !98 ;80 !78
702,675 ;.475,675 :949,396001,502387,373784,172 ;217,955 !
,828,757 '83,263 '
,172,370 \952,301 :
,071,267 ;,585,276 i,407,722 I,013,753 i934,537 '976,322
141 j753 1201039 !281952655051787869598108833432
, 409886902
*96,57358, 828
187,85573,404
140,268186,588141,831189.18057,564267,805346', 473227,937218,378240,365157,354156.181232,984
1 ('lassos grouped to conceal the net income and identity of the taxpayers.
64,97260,83050,95847,89646,07233,91234,92437,865
• Xontaxable; exemptions and dividends exceed net income.
60.860 I50,187 '38,975 ;32,883 129,007 !21,503 i19,227 119,628 1
$2,804 !6,769 !6,046 j7,221 I7,979 I7,132 i7,577 I9,472 i
1,308 ,3,1644,5516,8667,2944,345 ;6,749 ,4,670 !
7101,386
926 -1,792
932 i1,3714,095
$27 787 i
35,285 1
70,752 j
67,818 :
$2,308
292
: • $27 787
'• 35 ,285
73,060
S25 i 68,135
0. 43
.50
.83
1.17
1.562.062.463.023.273.343.743. 88
o00
Digitized for FRASER http://fraser.stlouisfed.org/ Federal Reserve Bank of St. Louis
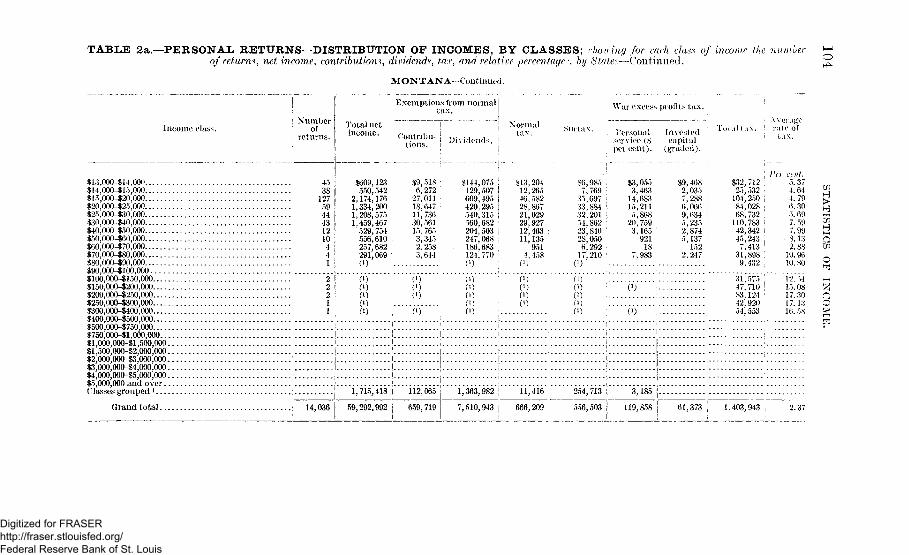
TABLE 2a.—PERSONAL RETURNS—DISTRIBUTION OF INCOMES, BY CLASSES; yfiowing for each class of income the numberof return*, net income, contributions, dividends, tax, and relative percentage', by Stales—-Continued.
MONTANA—Continued.
Income class.
$13,0O0~$14,00O$14,00O-$lo,000$15,000-$20,00()$20,000-$25,000$25,000-130,000$30,000-$40,000$40,000-$50,000$50,000-160,000$60,000-$70,000$70,000-180,000$80,000-190,000$90,000-1100,000$100,000-$150,000$150,000-$200,000$200,000-$250,000$250,000-$300,000$300,000-1400,000$400,000-$500,000$500,000-$750,000$750,000-$l,000,000...I I , 000,000-S1,500,000.$1,500,000-12,000,000.$2,000,000-$3,000,000.$3,000,000-84,000,000.$4,000,000-$5,000,000.$5,000,000 and over . .Classes grouped !
Numberof
returns.
4538
1275944431210441
i Exemptions from normaltax. War excess profits tax.
Total net I"income, j Cor}inhu.
' tions. i Dividends.
$609,123550,542
2,174,176 ;1,334,2001,208,5751,459,467 I
529,754 !556,610 f257,682291,069 I0)
$9,51S ;6,272
27,01118,647 :
11,73630,56115,7653,3452,2583.644
$144,075129,507609,495420,295540,315560,682204,503247,068186,683124,770
Normal
tax.
§13.20412,26546,58228,86721,02929,92712,46311,135
9514,458
C1)
$6,985 ;7,769 :
35,697 !33,884 I32,201 j54,862 ;23,8402S,0506,292
17,210(') :
Personalservice (8per cent).
$3,0553,46314,68315,2115,86820,7593,16592118
7,983
Investedcapital
(graded).
$9,4682,0357,2886,0669,6345,2352,8745,137
1522,247
i AverageTotal tax. | mto of
i tax.
2
22 !1 i1
((V)0)
0)0)0)
i1)
(l))(M(V)
Grand total j 14,036
1,715,418
59,292,992
0)(J)f i )
C1)
112,065
659,719
* 1,363,'982'| 11,416* j 254," 7i3
7,510,943 { 666,209 | 556,503
3,185
$.32, 71225,532104,25084,02868, 732110,78342,34245,2437,413
31,8989,432
Per cent.5.374.644.796.305.697. 597.998.132.88
10.9610.80
.31,57547,710 !83,124 ;
42,92054,553
12. >415.0817.3017.1316. f>S
p
Digitized for FRASER http://fraser.stlouisfed.org/ Federal Reserve Bank of St. Louis
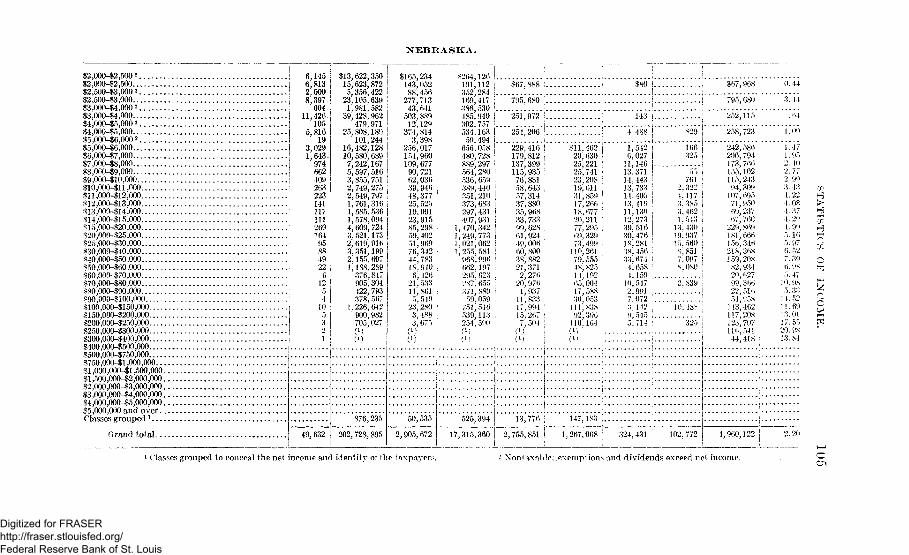
N E B R A S K A .
$2,000-$2,5002
$2,000-$2,500S2500$3000 2
Grand total..
$2,500-83,000$3)000-84,000 -$3,000-84,000$4,000-15,000 *$4,000-15,000$5,000-86,0002
$5,000-86,000$6,000-17,000 !$7,000-88,000 !$8,000-^9,000 !$9,000-$10,000 l$10,000-$ll ,000 i$11,000-$12,000$12,000-113,000$13,000-$14,000$14,000-815,000$15,000-820,000$20,000-825,000$25,000-830,000$30,000-140,000 :$40,000-$50,000$50,000-860,000 i$80,000-170,000$70,000-880,000S80,000-190,000890,000-8100,000$100,000-$l 50,000$150,000-8200,000$200,000-8250,000$250,000-1300,000$300,000-$4O0,00O$400,000-8500,000$500,000-8750,000$750,000-$1,000,000$1,000,000-11,500,000$1,500,000-$2,000,000$2,000,000-83,000,000$3,000,000-84,000,000$4,000,000-15,000,000$5,000,000 and overClasses g r o u p e d l
6,1456,8132,0008,397
60411,426.
1055,816
193,0291,643.
974662409263223141117ill269164958849.22
1251
10
$13,622,15,623,5,356,
23,105,1,981,
39,428,479,
25,808,101,
16,482,10,580,7,242,5,597,3,855,2,749.2,549;1,761'1,585!1,5784,609!3,521)2,619,3,351,2,155,1,188,
905!422',378)
1,226,'900,705,
0)
350872422639 I582 !962 1971 J189 !244 I128 I689 I167 !516 I
275 j
316 j536 i094724173
199 j697 I289 I
304793 j
642982027
$165,234143,05288,456
277,71343,641
503,88912,129
374,8143,398
256,017154,960109,67790,721 ,62,03639,946 ,48', 377 !
25,52519,09123,91585,298 •.59,40251,96976,34244,78318,940 .6,426
21,53311,861 ;5.549
23.2803)488 ;3,675 I
(M ;
0)
S264,126101,112352,284169,417386,530485,940302,757534,163
59,494656.058480,728889,297564,280536,659
351,210373,683297,431407.931
1,470)3421.249,773I', 021.0621,255)581
968,996662,197295,623?S7,655371)88959,059
751)546539,113254,500(l) '
$67,888 ; $80
795,680 ;
"251*972":
254,206 |
143 j .
"4*488J S29 !
49,632
876,235
202,728,895
50,535
2,905,672
525,394 13,776 j 147,183 !
$67,968 !
* 795," 680*
258,723
229.416 !179)812 i137,399 '115,935 ';76,83158,643 ;57,31437,88035,968 i33,73399,62861,92449,00660,80038,88221,3712) 27620,9761)93711,83317,994 ;
15 267 i7)504 j(J) i(l) I
$11,462 j20,630 !25,221 •25*741 \23)208 :
19,61131,859 !
17,26618,677 '20,21177)295 j69,32973,499 i110,26179.55548,X2514,19265,00417,58836.053111'X3N02,396110,164(i)
1,5426,02711,14613,37114,44313.73314,40513,41011,13012.27339,51630,476IS) 28138, 45033, 6744, 6584,15910,5472,9917,072:;) 1429, 5455, 714
166325
7612,3221,1173,3853, 4621.543
13,43019,93715.560s, 8517,007s.oso2*839'
10.18S
325
242,586206,794173,766155,102115.24394)309107,69571,95069,23767,760
229) 869181,666156,346218,368159,20SS2,93420,6271)9,36622,51654)95S143,462117,208123,707110,54144,41S
17,315,360 j 2,755,851 j 1,267,068 324,431 102,772 4,960,122 !
0. 44
"h'.u
1.00
1.471.052. 402.772.90:?. 1:?i, 224. OF.4. 37•t.20
,).5.0.7.0..").10.5.11.11.
17.20.13.
100752300v.47OS3352600155OSM
2.20
ha
1 Classes grouped to conceal the net income and ident i ty of the t axpayers . - Nontaxab le ; exempt ions and d iv idends exceed ne t income.
Digitized for FRASER http://fraser.stlouisfed.org/ Federal Reserve Bank of St. Louis
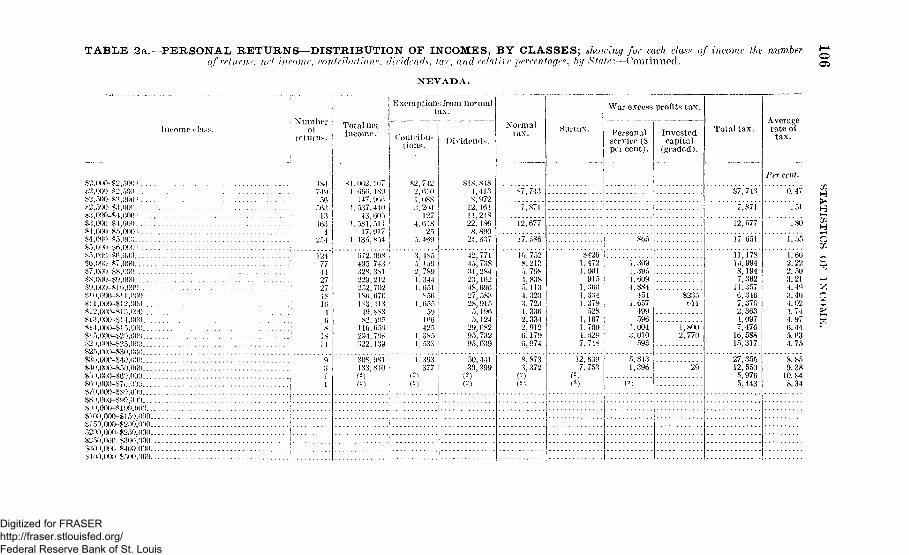
TABLE 2a. PERSONAL RETURNS—DISTRIBUTION OF INCOMES, BY CLASSES; showing for each daw of marine the number gof return--, net- income, contribution'', dividends, tar, and relative percentages, by Staler—rontinued. Q$
NEVADA.
Income class.
.""2,000->-2.500 I•-"2 :>KY )-<:], :>:)••)
S2,500-S"',;MM) i
sl3,0;)0-.k:l 1,00:)
S25,00:)-><30,000..
Numberof
rot urns.
IS-l7-19
56:WA
13163
42."4
Total netincome.
Exemptions from normaltax.
Contribu-tions.
II . 6 6 H , !S<I !
1 4 7 , Ht'»t> '1.537, n o I
43,60.1 'I.,"^1,.M1 '
17,917 j1. 135, S14 ,
.",.201 !127 :
1.61S :
Dividends.
sis, sis4,413V.)72
12, 16!11,2 IS22.IN«
8, 89021,637
229.212 '2."2,7()2 'is»;.r»7i)KI.-M3 ,
19, ss:is2, in.")
3,185 !
L344 j
1, 3s:>
42,7714 J , 7 3 S31.2S12."., 162•IS, 69627. :>s:-i2,s,9ir>
T), 196;>,i2-i
29, f 1S2»o,7329,"), 039
Normaltax.
s;7, 713
*7,"S7I
!7,;'.S6
10,752
:>! 79*1,8385, 1134,32;i3,7231,3362.3312,9126,179(>, 974
War excess profits tax.
Surtax. Personalservice (8per cent).
Investedcapital
(graded).
1
S4261.472 i1,001 '
91.") ,i,:'.6o1,33-i1,379;
52S1,167 ]1.760 !i,t529 ;7,74S i
Total tax.
i.3091,39.)1,6094,SS4
lol1,6.77
499.'96
1,0043,010
595
$7,743
7,871
12,677
17 ^~
11,17810,9948,1947,362
11,3576,3467,3702,3634,0977,476
16,58S15.317
Averagerate oftax.
0. 47
" .51
' 7 80
"i'.hh
1.662.222. 503. 214. 493. 404.024.744.976.445A'34. 75
H
30S.9S! !
!33,NI0 i1,393
37750,14130,399
C2)
, 3 ;3,372 I
n \
12,639 I 5,8131,396 29
27,35512,5505,9765,443
8.859.38
10.848.34
S !,),O00-S!!)!).()()•') I.
M00,l)')!) -S500.00')
Digitized for FRASER http://fraser.stlouisfed.org/ Federal Reserve Bank of St. Louis
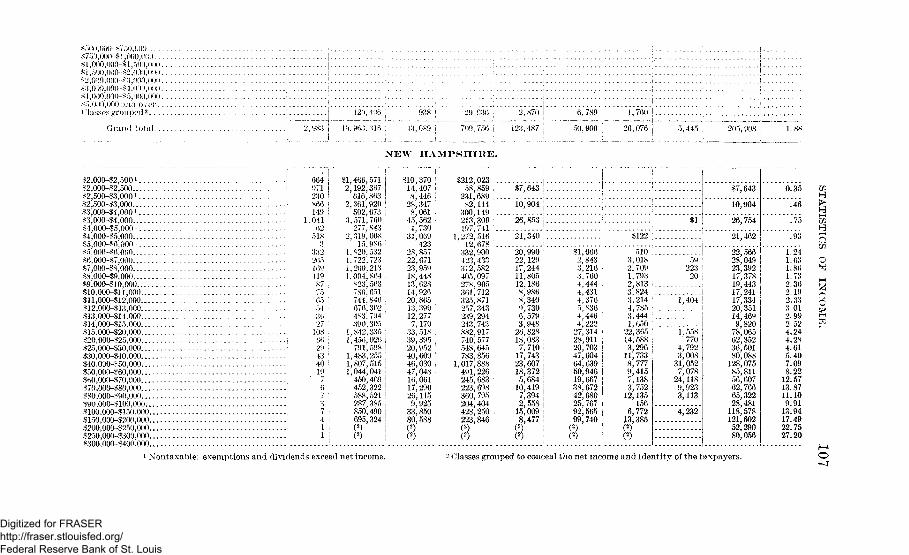
Grand J.otal. Hi, 9ti:->. X1
2 S70
123,487 I
6,789 i 1,760 j
50,900 j 26,076 5,445 | 205,908 |
NEW HAMPSHIRE.
$2,000-12,5001$2,000-12,500$2,500-$3,0001S2,500-$3,00033,000-^4,000 l
$3,000-14,000,$4,000-85,000!
$4,000-§5,000.•S5,000-«6J000 '
srooo$(o6o$6,00O-$7,000$7,000-88,000$8,000-19,000.$9,000-$10,000$10,000-$l1,000$11,000-812,000$12,000-$13,00()$13,000-814,000.S14,000-$15,000$15,000-820,000$20,000-$25,000$25,000--S30,000$30,000-$40,000$40,000-^50,000$50,000-^60,000860,000-870,000 -$70,000-880,000...$80,000-890,000$90,000-3100,000$100,000-1150,000$150,000-$200,000$200,000-8250,000$250,000-8300,000$300,000-$400.000
664 |971 !230 1X66 i149 !041f>2 ;5183
332205169119877505543027 •108;00 i29 i43 i40 !197 :07 !37 I4 !
$1,466,5712,192,367616,863
2,361,920502,673
3,571,760277, 843
2,319,00815,986
1,820,5321,722,7231,200,2131,004,804823,563786,651744,846676,302483,794390,305
1,842,3351,456,026791,598
1,483,2551,807,5151,044,041450,469452,322588,521287,385850,490695,324
$10,370 j14,407 (8,446 :
28,3478,061
45,5624. 73031,009
42328,85722,67123,95918,44813,62814,92620,86513', 391)12,2777,170
33,51839,895 •20,952 !40,609 146,03047,04816,06117,290 I26,115 !9,925 i
33,850 |80,588 !(2) !
$212,023 i58,859 j231,689 L82,144 !
300,149213,309197, 741
1,272,516' 12,678332,900•423,433372,582405,097278,905361,712325,871257,343239,294243,743882,917740,577548,645783,856
1,017,888491,226245,683223,698360,795204,404428,250223,846(2)
$7,643 |
10,904;
26 853 i
!
$1
$7,643
10,904
26,754
0.35
.46
.75
21,340 ; 21,462 I
20,99022,12917,24411,80512,1868,9868,3409,7306,5793,94826,828IS,0837,71017,74323,60718,3725,68410,4197,3942,55815,0098,477
SI,0662,8433,2163,7604,4444,4314,3765,8364,4464,22227,31428,91120,70347,60464,63950,94619,66738,67242,68025,76792,56599,740
5103, 0182 7091,7932,8133,8243,2144,7853,4441,65022,36514,5883,29611,7338,7779,4157,1383,75212,135
1566,77213,385(2)
(2)
5922320
1,404
1,558770
4,7923,00831,0527,07824,1189,9233,113
4,232
22,56628,04923,39217,37819,44317 24117,33420,35114,4699,82078,06562,35236,50180,088128,07585,81156,60762,76665,32228,481118,578121,60252,29080,056
.93
1.241.631.861.732.362.192.333.012.992.524.244.284.615.407.098.22
12.5713.8711.109.91
13.9417.4922.7527.20
I
L Nontax able: exemptions and dividends exceed net income. - Classes grouped to conceal the net income and identity of the taxpayers.
Digitized for FRASER http://fraser.stlouisfed.org/ Federal Reserve Bank of St. Louis
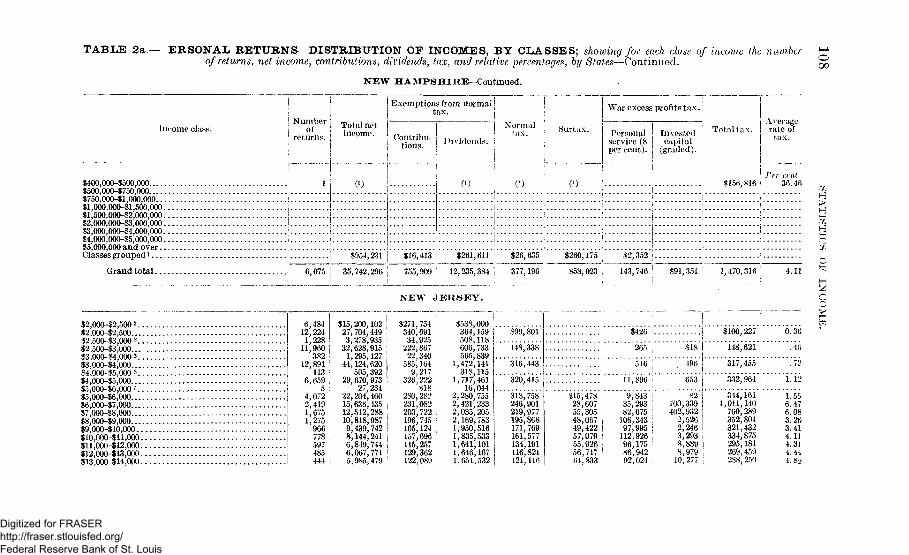
TABLE 2a — ERSONAL RETURNS—DISTRIBUTION OF INCOMES, BY CLASSES; showing for each class of Income the numberof returns, net income, contributions, dividends, tax, and relative percentages, by States—Continued.
NEW HAMPSHIRE-Continued.
Income class.! Numberi of1 returns.
Total netincome.
Exemptions from normal Itax. |
Contribu-tions.
$400,000-$500,000$500,000-5750,000$750,000-81,000,000...$1,000,000-$1,500,000.$1,500,000-$2,000,000.$2,000,000-$3,000,000.$3,000,000-84,000,000.$4,000,000-$5,000,000.$5,000,000 and over..Classes grouped *
Dividends.
0)
Normaltax. Surtax.
0)
Grand total.
$954,231 $16,413 | $261,611 ; $26,635 $260,175
6,075 35,742,296 755,909 12,235,384: 377,196
NEW JERSEY.
858,023
War excess profits tax.;
Investedcapital
(graded).
Total tax.Averagerate of
tax.
Per cent.$156,816 36.46
$2,352 j
143,746 ! $91,351 1,470,316 4.11
Ooo
>
$2,000-$2,500 2
$2,000-$2,500$2,500-$3,000 2
$2,500-$3,000$3,000-14,000 2
$3,000-$4,000$4,000-$5,000 2
$4,000-15,000$5,000-$6,000 2
$5,000-$6,000 .$6,O0O-$7,000$7,000-$8,000$8,000-$9,000$9,000-$10,000$10,000-$ll,000$ll,000-$12,000$12,000-$13,000$13,000 $14,000 , . . , , . , , , , ,
6,12,1,
11,
12,891113
6,659
$15,200,10227,704,449 •3,278,935 i32,628,915 !1,295,127 i
44,124,620505,392
29,670,97327,234 !
22,204,460 !15,636,435 i12,512,28810,818,9879,439,7428,144,2416,819,7446,067,7715,985,479
$271,754 I340,691 i34,925222,86722,340585,1649,217
326,222818
280,282231,082203,722 i196,745 !165,124157,696115,257129,362122,089
$538,000364,159508,118606,733565,839
1,472,141318,115
1,717,46116,044
2,280,7552,421,2332,035,2052,169,7831,950,5161,835,5331,641,1011,646,1671,651,532
$99,801
'148*338'
316,443
320*415
318,758246,901219,977195,868171,769161,577134,191116,821121,116
$426 :
"'265*; $18
516 |
11^896 |
496
$100,227 ;
**i48,'62l*'
653 j
317,455 i
"332^964*:
$15,478 '•28,60755,305 ;48,067 j49,422 |57,079 i55,926 :56,717 •64,833
9,843 i35,293 ;82,075 i106,343 i97,995 !112,926 ;96,17586,94292.024
82700,339402,9322,5262,2463,2938,8898,97910,277
344,161,011,140760,289352,804321,432 !334,875295,181269,459 l288,250
0.36
".4G
1.12
1.556.476.083.263.414.114.3J4.444. S->
Digitized for FRASER http://fraser.stlouisfed.org/ Federal Reserve Bank of St. Louis

814,00O--$15,000 1$15,000-120,000 1$20,000-825,000 1$25,000 -$30,000 !$30,000-140,000 !$40,000-850,000 •$50,000-$60,000 i$60,000-870,000 !
$70,000-880,000 '$80,000-190,000 i$90,0Q0-$100,000 i$100,000-^150,000 i$150,000-^200,000 !$200y000-$250',000$250,000-1300,000 i$300,000-1400,000$400,000-1500,0008500,000-8750,000$100,000-81,000,000$1,000,000-11,500,000$1,500,000-82,000,000$2,000,000-83,000,000$3,000.000-84,000,000$4,000,000-455,000,000 ;
$5,000,000 and over ;.Classes grouped l i.
34 J172659438196253
121.886350131453216191622
4,20,14,11,16,U,
7,
4n16'
74,6
941,188,764,920,901,259,640,822,533,334,726,183804,167
502159109563798598749521527079164950442376
309,8554280)
n>(i)(i)
280
99,710 :•151,166 '307,529 !346,556 l
1,038,627 j355,861 I297,998 j196,472243,310179,010 !147,812 j552,712 I257,795 !327,703 !282,192 j208', 229 I
C1)' !
)0)
2,241,931 :
(i, 113,991 l
.3,131,484 :4,594,1777,085,4805,355,8484,368,965 t3,673,144 |3,059,505 i2,904,834 12,218,184 I8,558,297 !4,043,090 |5,051,101 !2\111,888 '3.764.522 !
en ' i
97,412,291,226,318,199,181,150,121,85,88,
262,127,i\U.
82:93:
asC1)
871700255435 ;394 i444 ;
058 :346276024 i007 !585,557 ;
.201 1,773 ]
58,617323,249312,749324,822600,730464,543526,103477,734440,772373,155377,256
1,607,503087,356948.582759'. 736
1.351'. 999f i)
0)
77, 156366,831278,759 i237,433 i316,000 !193,450 IL57,210 j
165,981 !114,195 I107,778 !89,483 L
171,120129,640 I73,774 !65,220 i62.719 !.(M ;.(l)
3,30014', 843:J7,86926,46436,549 ;65,35420,51969,135 ;30,947 i52,684 ;
173*85024,46615,40235,837
237,. 147,920,815,
1,271,922,884,863,707,618,554,
2,215,5,269,L.107,942,
1,508,83,
824,713773
1,057738
2-14623632154673791890196190641746058025070994491517383880740820145
4. SO5. 086.24$.847.528.209.18LI. 0310.8211.6011.7413.6916.2615.4521.8823.4719.4722.0536.4436.2431. 2435. 43
13,735, 858 '
G rand total. 68.770 ! 421,757,424
337,808 I
9,045,853 !
10,714,632 I 113,096 3,952,553 ; 125,836 j
H
104.729.508 j ,492,309 1.4,318,893 ; 3,465.610 ! L. 777,949 : 25,054,761 5.94 ^
N E W M E X I C O .
$2,000-82,500 2 . .$2,000-12,500....$2,500-83,000 2 . .$2,500-83,000....$3,000-14,000 2 . .$3,000-14,000....$4,000-15,000 2 . .14,000-15,000....85,000-86,000 2 . .$5,000-16,000....$6,000-87,000....$7',000-$8,000....$8,000-19,000... .$9,000-110,000...$10,000-811,000..$11,000-112,000..$12,000-«13 000..
628 :845 i14377659 :
779 :21 j
334 l
4 i229129 !110 !
i!36 !29 -26
$1,1,
377,072902,672385,008117,012197,222667,90591,540
491,41320,847
253,702849,062823,746474,337524,314379,714333,351321,759
$4,614ft, 6942,566
11,6101,152
18,068640
10,101554
12,80912,89214,29521,6913,767 ;
4,6911,9981,806
-840,9,
39,30.83,59,62,41,15,99,69,
106,49,38,84,65:
$7,908
j 10,934 ; ;
1 iti]hki'''.'.I'.'.'.'.'.'.'.'.'.'.'.
16,231
18,325 i14,066 ;
15,118 !8,637 i
10,900 I6,040 '7,512 !7,201 i
$96
$891 •1,6572.6735,5013,042 i2,4362,9743,350
164198
1,4801,7551,0772,1491,9782,437
S484
3583,360
$7,908
11*030
"is," 581
16,231
0.42
.52
.70
T69
19,38015,92119,27116,37715,01910,98315,82412,988
1.
2.?j.2_2*.4.4.
5588344586897504
1 Classes grouped to conceal the net ncome and identity o the taxpayer. 2 Nontaxable; exemptions and dividends exceed the net income.
Digitized for FRASER http://fraser.stlouisfed.org/ Federal Reserve Bank of St. Louis

TABLE 2a. - PERSONAL RETURNS—DISTRIBUTION OF INCOMES, BY CLASSES; showing for- each class of income the numberof returns, net income, contributions, dividends, tax, and relative percentages, by States—Continued.
NEW MEXICO—Continued.
$300,000-$400,000$400,000-1500,000$500,000-$750,000*750,000-$1,000,000...$1,000,000-11,500,000.$1,500,000-12,000,000.$2,000,000-$3,000,000.$3,000,000-$4,000,000.$4,000,000-$5,000,000.$5,000,000 and over . .Classes grouped i
Income, class
$13,000~$14,000 j$14,000-515,000 i$15,000-420,000 !$20,000 -$25,000 i$25,000430,000 '<*30,000-«40,000$40,000-$50,000 !
$50,000~$00,000S60,000-*70,000$70,000-$80,000$80,000 -490,000$90,000-4100,000S100,000-$150,000 ;
15150,000-4200,000$200,000-$25(),000 1$250,000-$300,000..
Numl er jof j
returns. |
2717
2613219462413
Total netincome.
$364,108245,343895,252592.236356!921696', 196392,297213,050401,016152,778340,974(1) '( i )
(M
Exemptions from normaltax.
Contribu-tions.
$4,3691,9607,0989,7931,9293,6252,4752,1903,706' 955
2,0000 )I1)
Dividends.
$83,93338.498
235,890166,41460,237
193,422140,467125,463129,832
50231.259t 1 ) '( I s )
I1)
War excess profits tax.
0) 0)
Normaltax.
$6,4235,592
18,01612,2178,61412,0507.8272,9367,3685,8226,8310)O)
0)
Surtax. ! Personal I InvestedI service (8 j capital! percent). | (graded).
$3,6962,191
13,408 ,13,45510,43719,81221,5077,457
18,40914,40920,365
0)(!)(r)
$643633
5, 8192,695
9053,7133,940
$4,1123,900
12,2335,044
16,3256,3274,339
4,079
6,i42
9,012
0)
Grand total. 4,448
1,031,868
20,892,721
12,257
782,305
623,300 13,349 |
2,981,064 I 248,498
107,687
275,, 357 40,583
12,934
78,428
$14,87412,316 i49,476 i33,411 !36,281 141,902 I37,613 i10,393 I38,86820,23133,33810,35636,121 !
47,76740,406
Averagerate oftax.
Per cent.4.085.025.535.64
10.166.029.594.889.69
13.249.78
10.4810.0214.4816.64
(72H£>•H
sIf}
642,866
Digitized for FRASER http://fraser.stlouisfed.org/ Federal Reserve Bank of St. Louis
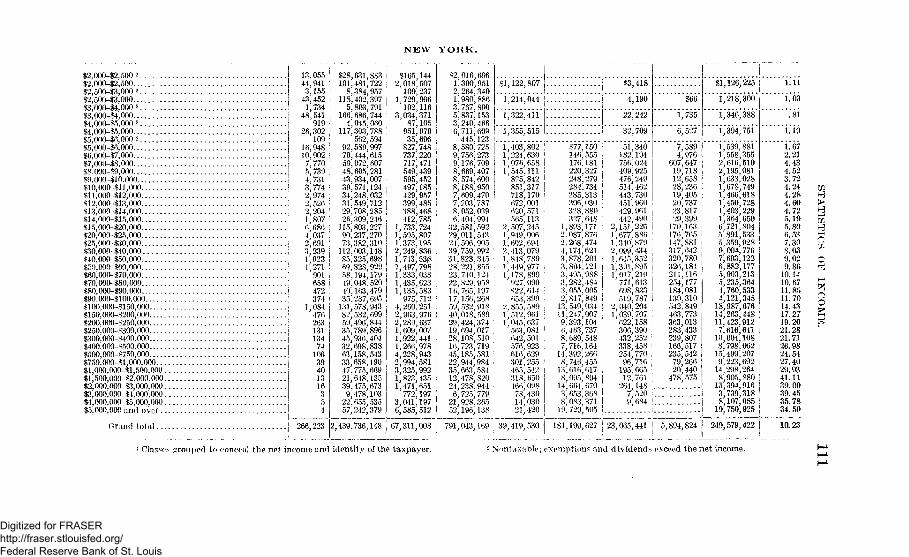
N E W Y O K K .
$2,000-12,500 2$2,000-82,50052,500-13,000 2$2,500-13,000$3,000-14,000 2 |$3,000-$4,000 !$4,000-15,000 2 i$4,000-$5,000 185,000-86,000 2 1$5,000-86,000 j$6,000-$7,000$7,000-18,000 |88.000-89,000 i$9.000-110.000 S$10,000-811,000 !$11,000-812,000 '$12,000-813,000 :$13,000-114,000$14,000-815,000$15,000-$20',000$20,000-825,000$25,000-830,000 ;$30,000-840,000 i$40,000-850)000$50,000 $60,000 >$60,000-870,000 :
$70,000-880,000 \$80,000-890,000 j$90,000-8100,000 !
$100,000-8150,000 !$150,000-$200,000 i$200,000-8250,000 !$250,000-$300,000 i$300)000-8400,000 j8400,000-8500,0008500,000-8750,000$750,000-81,000,000$1,000,000-81,500,000$1,500,000-$2,000,000$2,000,000-83,000,000$3,000,000-84,000'000$4,000)000-85,000,000$5,000,000 and over
(irand total
13,05544,9413,155
43,4521,734
48,541919
26,302109
16,94810,9027,770 j5,7394,7313,7742,9742,5262,2041,8076,6864". 0372'. 6913,2391 9231' 271
901658472374
1,08447626313113474
106394013163
266,223
$28,631,883101,481,722
8,384,957118,402,397
5,803,791166,686,744
4,045,060117,303,788
562,59492,589,99770,444,61559,072,60748,605,28143,934,00739,571,12434,248,03231,549,71229,708,28526.309,246
115'803,22790,237,27073,382,310
112,003,14885,325,69869,828,92958,194,17949,048,52040.163,47935; 237,695
131,578.94382,582169959,496,84435,789,89645,936,40432,69S; 83863,158,54333,658,19047,775,66921,648.13539,475,6739,478,103
22,655,53557; 242; 379
$165,1442,018,507
100,2371,729,996
102,1163,034,371
87,105951,97935,696
827,748737,220717,471549,439595,452497,185429,957399,485388,468412,785
1,733,7241,505,807 I1,373,195 I2,249,8361.743,53(81,497,798 !1.333,033 I1,435,623 i1,135,583
975,7124,260,2512,963,9762,280,637 I1,609,007i;922,4411,266,9784,228,9432,994,5813,325,9921,823,4351,471,651
772,1973,041,1976,585,512
2,439,736,148 | 67,311,008 791,043,169 \ 39,419,530
$2,016,6961,300,9512.264,3401,980,8863,767,8905,837,1533,240,4666,711,609
445,1238,580,7259,756,2739,176,7098,669,4078,574,6008,188,9507,609,4707,203,7878,052,0396,404)994
32,581,59229,011,54324.506,905 ,39)759,992 i31,823,345 '28', 221,855 i23.740; 124 ,22 829 95816'765,'19717,156,26859,532,918 i40,018,58929,424,37419,694,01728,108,510 ]16,723,719 j45,185,581 !22,944,984 i35,663,584 j12,478,820 i24,238,944 =6,725,779 i
21,928,365 i52,196,138
$1,122,807
*i*2l4*644'|
1 $3,418
4,190
1,355,515 {
22,242
32," 709
1,403,8021,224,6301 076.658l', 545', 111
835,842851,317718,170672,001620,571565,113
2,507,2451,949,0061,602,6942,413,0791,848,7891,449,977I'178,899
927,090S22)614653,399
2.855,5891)512,9611.045,637
'563,081642,501576,923616,629301,255465, 542318,650466,09878,43014,03021.420
$77,150146,555176,181220,327248,279284,734285,313306,030328,880327,648
1,893,1712.087,8762,268,4744,174,6213.878,2013', 804', 1213,495,9883.282,4843', 055,0052,817,849
13,549,03411,247,0079;393,1046,463,7378,689,5487,716,164
14,392,266S, 746,455
13,616,6178,095,894
14,664,6703,653,3688,083,371
19,729,505
181,199,627
51,340182,194756,024409,925476,249514,462443,730451,960429,961442,490
2,151,2251,677.8861,340,8792,099,4341,645,3521,301,895i 017,210' 771,613698,833519,787
2,040,2041,039.707
622)158306,390432,252338,458254,77096,716
195,66512,761
264,1487,5209,684
$66
1,735
6,527
7,5894,976
607,64719,71812,65828,23619,40520,73723,81729,399
170,163176,765147,881317,642320,780326,184211,116254,177184,081130,310542,849463,773363,013283,433239,807166,517235,54279,26620,440
478,575
$1,126,225
""i*2i8,"366'
l, 346, 388
1,394,751
23,065,441 ! 5,894,824
1,539,8811,558,3552,616,5102,195,0811,633,0281,678,7491,466,6181)450,7281,403,2291,364,6506,721,8045,891,5335,359,9289,004,7767,693,1226,882,1775,903,2135,235,3644,760,5334,121,345
18,987,67614,263,44811,423,9127,616,641
10,004,1088,798,062
15,499,2079,223,692
14,298,2648,905,880
15,394,9163,739,3188,107,085
19,750,925
1.11
249,579,422 j
1.03
.81
1.19
1.672.214.434.523.724.244.284.604.725.195.806.537.308.039.029.86
10.1410.6711.8511.7014.4317.2719.2021.2821.7126.9824.5427.4029.9341.1139.0039.4535.7834.50
10.23
1 Classes grouped to conceal the net income and identity of the taxpayer. - Nontaxable; exemptions and dividends exceed the net income.
Digitized for FRASER http://fraser.stlouisfed.org/ Federal Reserve Bank of St. Louis

TABLE 2a.—PERSONAL RETURNS--DISTRIBUTION OF INCOMES, BY CLASSES; showing for each class of income Ihtof returns, net income, contributions, dividends, tax, and relative percentages, by States—Continued.
nnber
NOKTH CAllOLINA.
Exemptions from normal'tax. j War excess profits tax.,
Income class.Number
of, returns.
Total notincome.
$2.000-«2,500i....$2,000-42,500$2,500-$3,000 i . . . .$2.500-43,000$3,000-44,000 i$3,000-44,000$4,000-85,0001$4,000-45,000$5,000-46,0001$5,000-$6,000$6,000-17,000$7,000-18,000$8,000-19,000$9.000-$10,000$10.000-$11,000....$11,000-112,000....$12,000-$13.000....«13,000-$14.000_...$14,000-$l5.000....$15,000-$20,000....$20,000-$25.000....$25,000-$30,000....$30,000-140,000....$40,000-450,000....$50.000-$60,000....$60,000-$70,000....$70,000-480,000....$80,000-190,000....$90,000-1100,000...$100,000-4150.000..$150,000-$200,000..$200,000-4250,000..$250,000-4300.000..$300,000-1400,000..$400.000-$500,000..
,716,476674
.919340
, 585137
,34026
782523345253198126104 '89 j62 I58 I
168 j
8827 I17 i
$3,819,5103,358,4401,816,2155,272,0011,146,0398,880,493
611,7325,960,135
137,2194,269,5363,368,5512,572,6572,145,5351,870,3741,309,2131,189,0531,111,200
835,019839,963 j
2,896,1532,248,2831,539,4882,995,2431,22,0,781 !
915,905502,270594,488 \930,561 !190,097 ]
1,405,391 ,335,142 :
1,153,477 I569,734 !(2) I
!
Contribu-tions.
$56,691 ,37,30839,276 I71,335 !35,644 :
158,832 ;18,750 :
128,784 !8,748
100,15169,51971.65152,920:^, 06336,14729.91843,30123,44623,23396,90781,85748,19091,79040,50156,300 |13,538 j6,397 i17,362 |1,65545,7874,23017,0707,534(2)
Dividends.
$264,50263,148
274,675107,625438.933303,781378,538378,59392,766
513,252515,915520,753432,205486,437351,764360,348363,479255,650301,035
1,164,377975,647665,383
1,379,000590,640484,069405,397193,203226,581
70,950768,61352,856
357,393553,114
Normalj tax . Surtax. Personal
service (8Investedcapital
Total tax .Averagerate oftax.
percent). | (graded).
i•515,093 i
23,870 '>
54 03 9
i- - i
|I
1...
1
i
$213
60 $3 j
$15,093
24,083
54,102
Per cent.
0.4f
.46
.61
oo, 151
52.09847,63537,98435,92230,80023,32",19,67420,02114,67213,63049,69737,87024,86649,33718,0929,5585,19514,40725,7674,41919,79210,37227,006
139(2)
(2)
$2,5385,7806.9489,02810,227S, 5349,98111,723S, 8939,83144,63749,70340,46498,46645,60229,96424,63548,63973,44413 93897.54651.458197.134116,998(2)
(2)
827
8203,9368,08110,24210,4138,9817. 4656,7508,2257,523
21,37926,84018,75034,78815,6467,1116,0843,9946,694350
6,23713,72220,208
733
(2)
786
144336784
1,65592(i
1,4811,571273
3,2573,288253
3,13616,13011,03319,1771,513
9,041
49,752
71,556
56,764
55,60057,68753,79756,84752,36642,32138,69138,76735,04734,272115,966117,549100,210193,62498,51748,14635,91476,081105,90518,707173,32775,552
315,904117,870137,436109,536
.95
1.301.712.092.6.r
2. S(3.233.253.491.204. OS4.005.236.516.468.075.267.15
12*. 8011.389.8412^3322 5427.3820.6934.8827.13
Ip
O
Digitized for FRASER http://fraser.stlouisfed.org/ Federal Reserve Bank of St. Louis
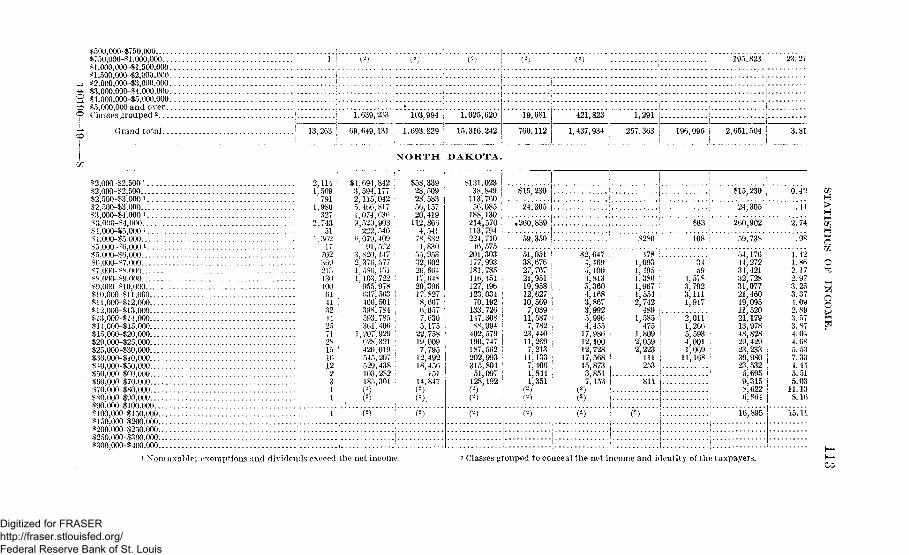
$500,000-4750,000$750,000-$!,000,000§1,000,000-81,500,000...$1,500,000-42,000,000. - .
•_i $2,000,000-43,000,000. - -4^ $3,000,000-$4.000.000...2 $4,000,000-85,000,000o $5,000,000 and over
19a,823 !
Classes grouped 2
Grand total i 1 3
i
2 6 3 JI
1,
69
639,
649
233
131 1
103
,693
994
829
1,
15,
025,
316,
620
242
19,
760,
681
112 1,
421,823 ;
437,934 i
1,
257,
291
363 196 095 I 2 651,504 3 81
N O R T H D A K O T A .
$2,000-12,500 i$2,000-82,500..$2,500-53,0001$2,500-$3,000..$3,000-$l,000i53,000-44,000..S 4,000-85,000 l
S-l.000-$5.000..S5.000-$6,000 ^$5.000-8*3,000Sfi',OOO-87',OOOS7,000-«S',(KH) . . _38,000-19,000$9,000 -810,000810,000-811,000$11,000-812,000$12,000-$13,000$13,000-814,000$14,000-815,000$15,000-820,000820,000-825,000$25,000-830,000$30,000-$ 10,000$40,000-850,000850,000-860,000$60,000-870,000$70,000-880,000§80,000-890,000$90,000-8100,000$100,000-8150,000$150,000-8200,000$200,000-8250,000$250,000-1300,000$300,000-8400,000
!,114.569791,980327
1,74351
177023692131301006141 :324425712815 !
10122311
$4,694,8423;594.1772, II5; 042 •5,466,8171,074,6369,520,903222,540
0,079, 40991,572
3,820,117 :
2.370,5771.580, 451 ;I', 103,722 •955,978 I037,563 i466,501398.784 ,593.785 :361', 400 !
1,207", 929 !028.321 ;
420.019545'207 :
529,438103,282 i185.301
$58,33928,50928,58356,15720,419
112,8664,541
78,8821.830
ru), 95332, G0226,66417,64S20,39617.8278,6676,0577,6305,175
22, 75819,0097,795
12,49218,456
15114.847
$131,023 I38,849 '
113,76056,085
188,130214,570 !113,794 '224,710
16,575201,303177,993181,785116,451127,496123,03470,192
133,726147,30888,994
402,579190,747187,562 I202,993 i315,804 '51,097 •
128,192 i
51,051 I38,676 I27,767 l
21,951 |19,958 j12,627 !10,569 |7,039 I
11,587 i7, 782 |
23,440 :11,269 i7,213 !
11,133 •7; 406 {
1,8441,351 '
00
$15,230
24,305
*260,839
59,350 $280
$63 ;
ios !
$15,230 j
24,305
260,902
59,738
0.42
. 11
2.74
.98
647469100813360168867 i992 i996 !455 ;986 i100 !728 i568 I873 i851153 ;
4781,0931,4951,3861,9671,5542,742489
1,585475
1,8092,0592,223
111253
3459
4,5783,7923,1111,917
2,0111,266 ;5,593 i4,001 i1,069
11,168
811
54,17644,27234,42132; 72831,07721,46019,09511,52021,17913,97848,82829,42923,23339,98023,5325,6959,3158,6226.864
16,895
1.421.K62.172.973.253.374.092.893. 573.874.044.085. 537.334.445.515.03
11.138.16
15.11
m
£§
c
B
1 Xoni axahle; exemptions and dividends exceed the net income. 2 Classes grouped to conceal the net income and identity of the taxpayers.
Digitized for FRASER http://fraser.stlouisfed.org/ Federal Reserve Bank of St. Louis
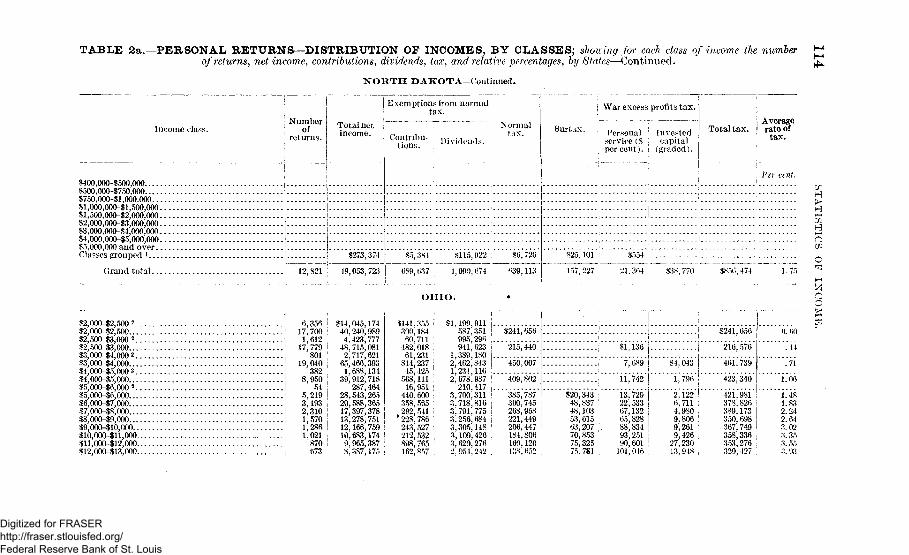
TABLE 2a.—PERSONAL RETURNS—DISTRIBUTION OF INCOMES, BY CLASSES; showing for each class of income the numberof returns, net income, contributions, dividends, tax, and relative percentages, by States—Continued.
NORTH DAKOTA—Continued.
Income class.
$400,000-8500,000$500,000-8750,000$750,000-51,000.000...$1,000,000-$1,500,000.$1,500,000-82,000,000.$2,000.000-$3,000,000.$3,000,000-84,000,000.$4,O00,00O-$5,00O,O00.$5,000,000 a n d o v e r . .Classes grouped i
Grand total.
i Number; of
returns.
Exemptions from normal
Total netincome. Contribu-
tions. Dividends.
N ormaltax.
$273,374
12,S21 ! 49,053,723
.$5,3S4
0S9,037
SI 15,922 $0,720
039,1134,090,074
| War excess profits tax.
Surtax. Personal ' Investedservice (8 | capitalpercent), j (graded).
AverageTotal tax. rate of
tax.
Per cent.
$25,101
157,227
$554
21,304 $850,474
H>
• O
OHIO.
$2,000-$2,500 ? i 6,350 iS2,000-$2,500 j 17,700$2,500-$3,000 2 | 1,612$2,500-83,000 1 17,77983,000-84,000 2 801$3,000-$4,000 19,040$4,000-85,000 2 i 382$4,000-85,000 i 8,950$5,000-$6,000 2 - ! 54$5,000-86,000 ! 5,219$6,000-87,000 1 3,193$7,000-88,000 i 2,310$8,000-19,000 i I) 570$9,000-$10,000 1,286$10,000-111,000 » 1,021$11,000-812,000 ! 870$12,000-$13,000 i 073
$14,045,17440,240,9894,423,777
48,715,0812,717,621
65,466,3931,688,134
39,912,718287,464
28,543,26520,588,36517,397,37813,278,75112,166,75910,683,1749,965,387S,387,175
$141,300,
60.482;
61,814,
45,568,
16,440.358;292,
'228,243,212,898,162,
355 i184 :
7 1 1 •018 I231 i237 !425 i111 !951 1600 i565 !541 I786 !527 |532 j765 |857 ;
•SI, 199,587,995,941,
1,389,2,462,1,234,2,678,
210,3,700,3,718,3,791,3,256,3,305,3,109,3,620;12.054
$241,656
215,440
450,007
'469,862
385,787300,745268,958221,449206,447184,800160,120l'!S, 652
$1,136
"7," 689' $4,043 I
$20,343 i48,83748,103 !53,615 !63,207 :.70,853 '75,32575.7S1
$241,050
" 216," 576'
401,739
'423,'34O"
13,72922,53307,13265,82888,83493,25190, 60101,046
2,122 i0,711 !4,980 I9,806 '9,261 !9,42627,23013,948 ,
421,981 !378,820 !389,173 i350,698367,749 !358,336353,276 i329,427 i
1.481.832.242.643.023.353.55;$. 93
Digitized for FRASER http://fraser.stlouisfed.org/ Federal Reserve Bank of St. Louis
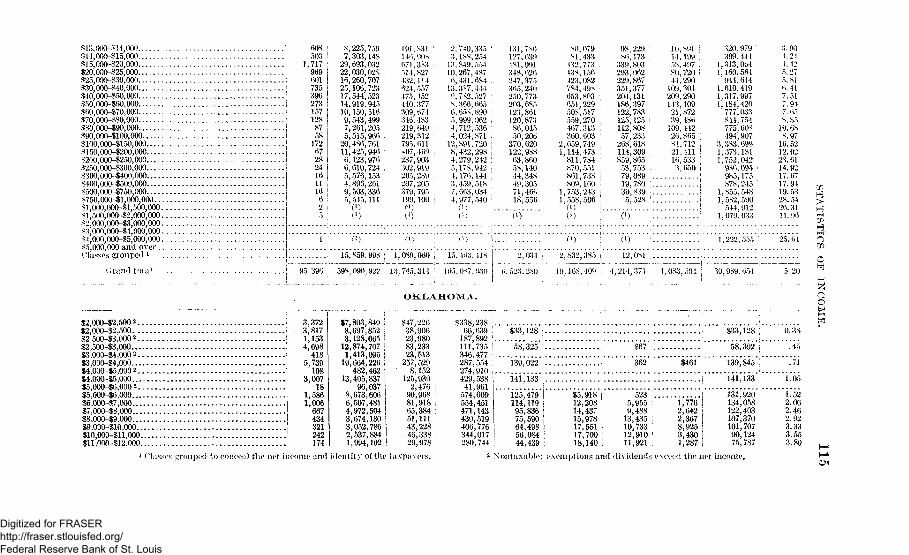
313,000- $14,000$14,000- $15,000$15,000-820,000$20.00O-$25,000S25,000-130,000£30,000~$40,000«40.00O-$50,000
$5o'ooo$6o;ooo$60,000-870,000$70,000-$80,000$80,000-190,000$90,000-1100,000.$100,000-1150,000m 50,000-1200,000$200,000-$250,000$250,000-$300,000$300,000-$400,000$400,000-$500,000$500,000-1750,000$750,000-41,000,000$1,000,000-11,500,000••?1,500,000-$2,000,000$2,000,000-13,000,000«3,000,000-$4,000,000«4,000,000-$5,000,000$5,000,000 and over('lasses grouped l
60S50S
1,71796960173539627315712887581726728241611166
8,225,7597.303,148
29,693.03222,030,02816,260,70725,106,72317,544,52314,919,94510,150,5169,543,4997,261,2055,515,966
20,486,76111,425,9466,123,9766,610,724 :5,576,1534.896,2619,503,3365; 545,111O)
191,S31146, 90S671,3*3514,827432,114624,557475,152440.377309,674346.483219,649219,312 |795,611 I4)7,469 i237,903 i302,919205,289 i207,205 1379,795199,100
2,740,335 '3.18S.25413,S49i55410,267,4876,431.68413,387,444
S.360,6656,658,8905,999,062 i4,712,536 '4,024,871 i12,891,720 !8,432,298 I4.279,242 !5.178,942 It, 176.144 :
3,459,5187,663,0344,977,540 ;
(r)
131,7*0 '127,639181,991348,626247,375365,240250,773203,685123,8611.20,87386,04550,206 i
370,620122,988 ,63,86058,14014,34849,30571,46618,556
80,079si, 433132,773438,156123,082 i784,498 !653,803 !651,229 !
508,517 :559,270 i467,313 |360,603 !
2,659,749 '1,114,473 I811,784 IS70,551861,738 i809,160 i
1,753,2431.558,506 ''CM II1)
98/229stU73
339;803293,062229,867351,377204,131186,397122,783125,125 I112,80857,233268,618114,309859,865 '53,75379,089 ;19,780 !
30,8395,528
14.199 i58.497 i80,720 I44,290 I109,304209.290 i143,109 !
21,872 i39.486 I109,44226,86581', 71221,41116,5333.650
320,979309,444
1,313,0641,160,564944,614
1,610,4191,317,9971,184,420777,033844,754775,608494,907
3,383,6991,373.1811,752,042986,094985,175878,245 •
1,855,5481,582,590544,912
1,079,033
:i. 90t.214. 12
5! 816.417. 517.9 V
8.8510. 6S8. 9716.5212.0228. 6114.9217.6717.9419.5328.5426.3111.9(1
<;rand total
1 i (1)
*.*! "is,"859*998*;
95,396 i 598,090,922 •
1,222,555
1,089,060 i
13.745,314 ! li)5,US7,<13(.
O K L A H O M A .
2,034
>, 523, 280
"2^832,385 1
19,108,409 4,214,371 ; 1,083,594 i 30,989,654
$2,000-82,5002..$2,000-$2,500. ..$2,500-$3,000 2..$2,500-13,000....$3,000-14,000 2..$3,000-14,000....$4,000-$5,000 2..$4,000-15,000....$5,000-16,000 2..$5,000-$6,000....$6,000-$7,000....$7,000-$8,000....$8,000-$9,000....$9,000-$10,000...$10,000-$ll,000..$11,000-$12,000..
3,3723,8171,1534,698418
5,739108
3,00718
1,5861,006667434321242174
$7,8,3,12,1,19,
13
8643321
', 803,840!, 697,852!, 128,0651,874,707,413,096•,664,226482,462
1,405,83796,037
;, 673,606.,507,481k972,5043,674,1303,052,7862,537,8841,994,102
$47,22638,90623,98083,23323,513257,5298,152
125,9302,476 i
90,968 !
81,918 ;65,384 :51,111 ;43,228 146,338 !29,978
$338,66,187,111,346.287,274,429,41,
574,554,471,430,406,344;280!
238639 1892 !
$33,128 j $33,128 ! 0.38
T35477 ;554 !910 i538 j961009451143519,776 ,,017 i,744 ;
58,325 ! $67 58,392
139,022 ! 362 $461 139,845
"I4IJI33 1.05
125,479114,11995,83675,59064,49856,08444,439
$5,91812,20814,43715,97817,55117,70018,140
5235,955 i9,488 ;13,435 ,10,73312,910 ]
11,921
1,7762,6422,3678,9253,4301,287
131,920134,058122,403107,370101,70790,12475,787
1.522.062.462.923.333.553.80
25. (54 O
ao
1 (lassos grouped to conceal the net income and identity of the taxpayers. 2 Nontaxuble: exemptions and dividends exceed the net income.
Digitized for FRASER http://fraser.stlouisfed.org/ Federal Reserve Bank of St. Louis
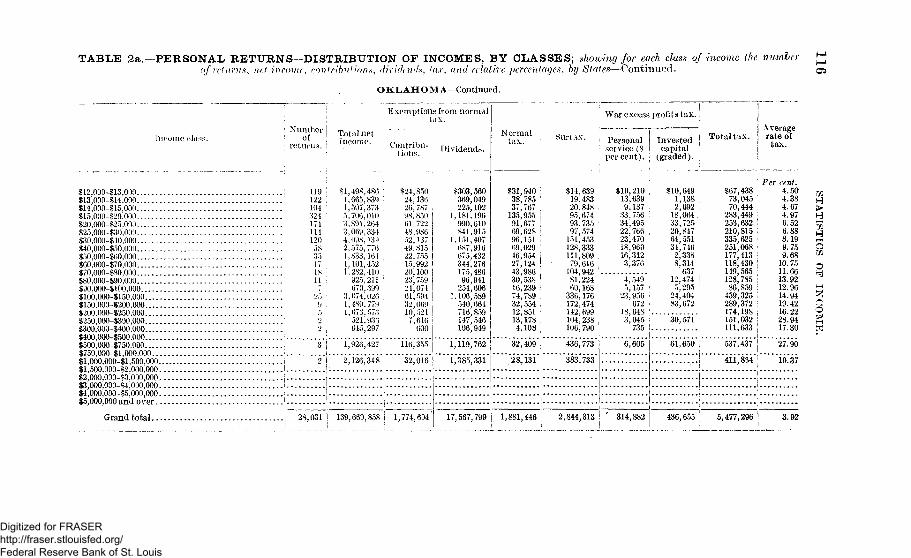
TABLE 2a.- PERSONAL RETURNS—DISTRIBUTION OF INCOMES, BY CLASSES; showing for each class of income the numberof returns, net income, contribution*, dividends, far, and relative percentages, by States—Continued.
O K L A H O M A — C o n t i n u e d .
[ncome olass.
$12,000-$13,000$13 000-$14 000$14 000-815 000 . . . .115 000 $20 000$20 000 $25 000$25,000-130,000$30.000-840,000$40 000-850 000$50,000-880,000$60 000-S70 000$70 000 $80 000$80 000-$90 000$90,000-8100,000$100,000-$150,000$150.00L)-$200,000$200 000-8250,000 -$250 000-8300 000$300 000-$400,000$400 000 $500 000$500 000-$750 000$750 000 $1 000 000151 000 000 %1 500 000SI 500 000 182 000 000$2 000 000 $3 000 000$3 000 000 $4 000 000 . -$4 000 000 $5 000 000$5,000,000 and over
Grand total
! Number I•; o f ;
! returns. !
119122104324 '174114
. . . . 120583517IS
-
9 :
')
3 i
> 2 !i . i .! I .
I j
• 28,031 S
Total netincome.
$1,498,4861,665,8391,507,3735,706,0103,891,2643,069,3344,098,1392,575,7*61,833,1641,101,4521,282,410
925,211670,399
3,074,0261,489.7791,073.573
521,936645,297
1,926,427
2,126,348
139,660,858
Exemptions from normaltax.
Contribu- , , i v i d e n d s _
i $24,85024,13626,78798,85061 72248,98652,13749,81522,75515,99220,10023,75924,07461,59432,06910,5217,616
600
: U6,355i
32,016
!1!
j 1,774,604
$303,560369,049225,102
1,181,196990,610841,915
1.151,407687,916675,432344,276175,48696,941
254,6061.106,589
540,664716,859147,546106,949
i,ll9,762
1,385,331
17,567,799
Normaltax .
831,94038,78537,767
135,95591,67769,62896,15169,02946,95427,12443,98630,53816,23974,78932,55412,85113,1784,108
32,409
28,, 131
Surtax.
$14,63919,48320,84895,67493,73597,574
151,453128,333111,80979,616
104,94281,22460,168
336,176172,474142,699104,238106,790
436,773
383,733
1,881,446 2,844,313
War excess profits tax.
Personalservice (8per cent).
810,21013,6399,137
33,75634,49522,76623,47018,96016,3123,376
4,5495,157
23,956672
18,6483,045
735
6,605
' 314,882
Investedcapital
(graded).
$10,6491,1382,692
18,064.33,72520,84764,55134,7462,3388,314
63712,4745,295
24,40483,672
30,571
61,650
Total tax.
$67,43873,04570,444
283,449253,632210,815335,625251,068177,413118,430149,565128,78586,859
459,325289,372174,198151,032111,633
537,437
411,884
436,655 5,477,296
Averagerate oftax.
Per cent.4.504.384.674.976.526.888.199.759.68
10.7511.6613.9212.9614.9419.4216.2228.9417.30
27.90
19.37
3.92
H
H
o
o
Digitized for FRASER http://fraser.stlouisfed.org/ Federal Reserve Bank of St. Louis
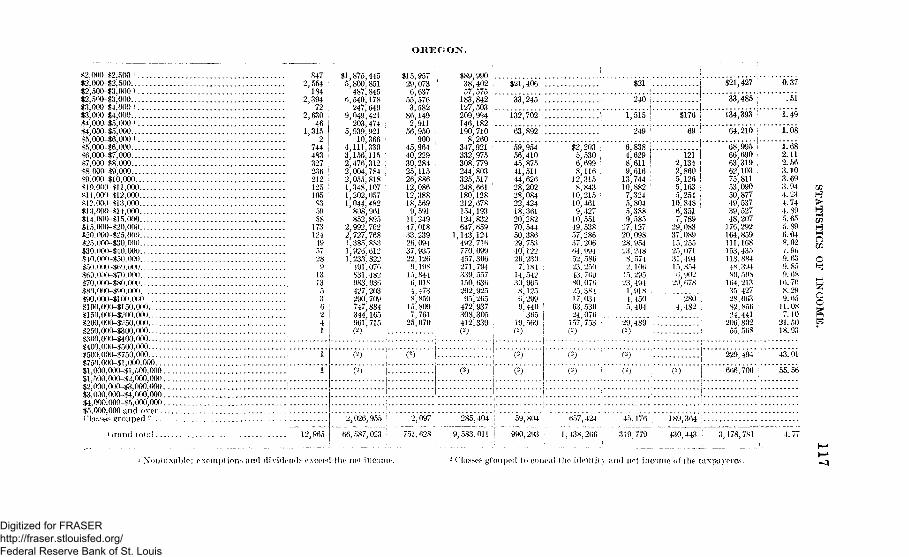
O R E G O N .
$2,000-12.500 i$2,000-$2,500$2,500-13,000 i$2,500-$3,000S3,00O-$4,000 i$3,000-$4,000$4,000-$5,000 i$4,000-15,000$5,000-$6,000 i i$5,000-16,000 '$6,000-$7,000 ;
$7,000-88,000$8,000-$9,000$9,000-110,000$10,000-$] 1,000$11,000-$12,000$12.000-$13,000$J3,000-$14,000$14,000-$!5,000 *$15,000-$20,000*20.000~-«25,000S25.00O-$30,00D$30'.000-$40.000$40,000-150,000,$50,000 -$1)0,000$60.000- $70.000$70,000-$80,000$80'.000-$90,000 .$90,000-$!00,000 .. .$100,000-$150,000$150,000-1200.000$200,000-.$250,000$250,000-$300,000$300,000-8400,000$400,000-$500,000$50:),000-$750,000 .'$750,OO0-$l,O00,000 ;$1,000,000-$1,500,000 •$L500,000-$2,000,000$2,000,000-13,000,000 i$3,000,000-$4,000,000$4,000,000-$5,000,000$5,000,000 and over('lasses grouped -
847!,554
184!,394
72!,630
46,315
2744483327236212125105835958
173124
19
289
1313536241
Grand total
$1,875,4455,800,851
487,8456, .540,178
247,6499.049,421
203,4745,939,921
10,3664,111,3303,156,1152,476,3122,004,784 :2,055,818 •'1,348,1071,202,0571,044,482
808,961 '852,895
2,992,7022,727.7681,385'. 8881,926; 6121,233' 822'491,070831,482983', 03(1427; 203290,709747,884344,165961,715(2)
$15,95729,0736,63755,5763,582 :86,1492,91156,950 I
900 !45,964 !40,229 |30,284 ;25,11526,886 ,12,08612,38818,569
9,59111,24947,01833.23926,09437,93522.1269,19815,8446,018
4,4738,85015,8097,761
25,070
$89,99038,40257,575183,842127,503209,994146,182190,7108,260
347,921332,975308,779244,803325,517248,661180,128212^678154,193124,832647,659,143; 124492.716770', 099457,306271', 794339,557150, 63(i202', 92595,265472,937308,305412,339(2)
63,892 :
59,95456,41045,87541,51144,62628,20228,08422,42418,36120,28270', 54450,38629,75340,12226 2307;iS4 :
14,54230,9658,12")6,2999,440 !'365 1
19,560
$91 406
33,245
132 702 '
$21
240
1,515
jj
$i76i . .
$21,427 i
33,485
134,393
0.37
.51
1.49
249 64,210 I
$2,2035,530 ,6,699 I8,116 !
12,315 I8,843
10,215 i10,461 '9,427
10,55149.53857', 28637,20664.99452', 58623.25043.769SO.07625,38417.03463,53024,076
157,753
6,838 i4,629 j8,611 !9,616 i
13,744 :10,882 !
7,3245,8045,3889; 585
27,12720,09828.95423;2488, 5742,106
15,29523,494
1,91S1,4505,404
1212,134 I2,860 j5,126 I5,163 •5,254 .
10,848 !6'. 35J7,789 :
29,08337.089In', 25525,07131.4941 "y. 8546, 902
29' •578
2804,482
29,489 ;
68,995 I66,69063,319 ;62,10375,81153,09050,87749,53739,52748,207176.292164;859111,168153,435US', 88448', 394SO, 508164,21335,42728. (K>382 85624;441206,80255,568
(¥) (V)
229,494
'666'706'i
2,026,955 i 2,097 ! 285,404 j 59,804
66.587,023 ' 751,628 I 9,583, OH i 990.293
657,424 45,176 189,364 j
1,43s. 266 ' 319,779 430,443 : 3,178,781
l.C
1.682.112.563.103.693.944.234.744.895.655.896.048.027.969.639. 859. OS
16. 708.299. 65
11.087.10
21.5018.93
43.01
"55." 56
6
1 Noj)1a\nble; exempt ions and dividends exceed the net income 2 ('lasses grouped to coueal (lie identity and net income of the taxpayercs.
Digitized for FRASER http://fraser.stlouisfed.org/ Federal Reserve Bank of St. Louis
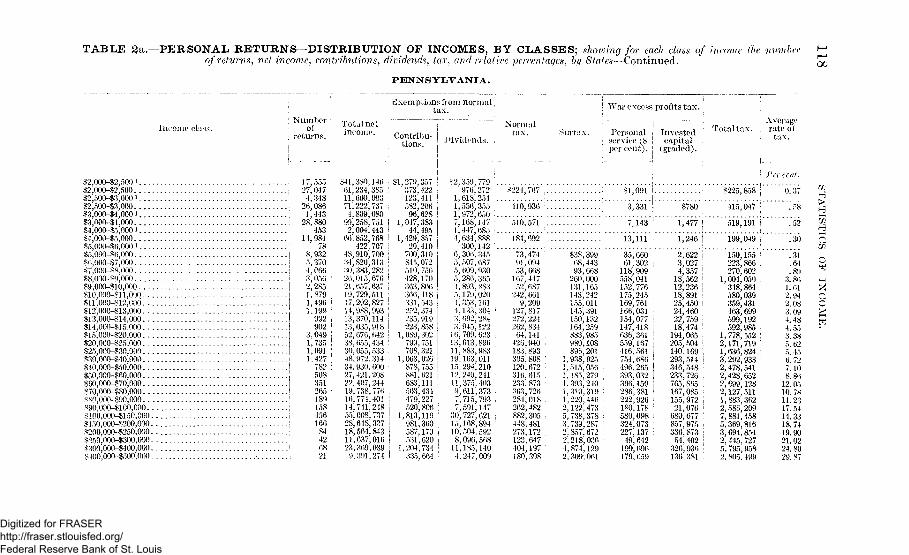
TABLE 2a.—:PERSONAL RETURNS—DISTRIBUTION OF INCOMES, BY CLASSES; showing for each class q,of returns, net income, contributions, dividends, tax, and relative percentages, by States—Continued.
)f income the number
PENNSYLVANIA.
00
Income class.
Exemptions from normaltax.
Number: Total not
returns. i n c o m o - Contribu-tions. ! -Dividends.
Normaltax. Surtax.
War excess profits tax.
Personalservice (Spercent).
Investedcapital
(graded).
• AverageTotal tax. rate oi
i tax.
$2,000-82,500 i$2,000-82,500$2,500-^3,000 *$2,500-$3,000$3,000-84,0001. . . .§3,000-14,000$4,000-85,000 i . . . .S4,000-$5,000$5,000-86,000 i$5,000-86,000•«6,000-87,00037,000-88,000$8,000-^9,000$9,000-810,000810,000-81 1,000. - .§11,000-812,000...$12,000-813,000...$13,000-814,000...814,000-815,000. . .$15,000-$20,000. - .$20,000-825,000. . .825,000-830,000. - .R30,000-$40,000...$40,000-850)000. - .850,000-860,000...$60,000-$70,000 - - -$70)000-$80,000. . .880,000-890,000. - .$90,000-8100,000 - -$100,000-8150,000.$150,000-8200,000.$200,000-8250,000.$250,000-8300)000 -$300,000-8400,000.$400,000-8500,000.
1 7, i)5r>27,047
4. 34826,086
1,44328.880
45314,984
788,9325,3704,066
i
3,056 ;
2.285l'.8791,496 '•1,199
992 1902 !
3.049 !1,735 i1,091 !1', 427 !
782 \508351265 :189158456166
.84:426821
*41,380,11 661.234,385 '11.660,90371'. 222,737 ;4,809,080
99,258,751 i2,004,443 !
66.852,768 !422,707 :
48,910,700 '34.820.313 |30,383,282 ;26.015,676 i21,657,637 \19,729,511 ;17,292,827 !14,988,993 I13,370,114 I13)035,918 I52,676,642 j38,655,434 :30.055,533 i48.972.314 j34,930,600 i27,421)208 I22,407,244 I19,738,776 '16,774,401 |14,741,248 j55,008)737 I28,648) 33718,564,84311,637,01623,369,039 j9.391,274 !
81,279,357373,422123,411582,20696,628
1,047,38344,495
1,429,85720,410700,310845,072510,756428,170363.806366)418331,543 i252,374235,919223)858
1,089,302 i799,751708,321
1,063,026878,755 I881,621 j683,111 |503,434 !479,227 i520,806 ;
1,813,119 !981,360 !587,173 *531,620 !
1,204,734 !335,664
^2,359,779976,272
1,618,2541,556,3551,972,6507,168,1471.447, 6854,634,888300,142
6,306,3455,507', 6875, 609,9305,286, 3654,893,8835,179,0204,353,1614.133,3043, 692'. 2843', 945; 12216,709.62313.613,89611,883)98319,163,01115,294,21012.249,24111,375,4039,611,3737; 715, 7937,591,147
30,727,62115, .168,89410,504.5928,096,56811,185,1404.247,009
$224,707
410,936
510,571
184 692
i SI,091
3,331
7.143
13 111
$780
1,477
1,246
$225,858
415,047
519,191
199,049
Per cent.
0.37
. "8
.52
.30
73,47491,09453,668167,44752, 687242,6619,209
127,817272,224262, 83464,141426,940 ;183,893305,808 ;120,672 :316,615233.873 :363,726284,018262,482882,305 !448,481273,172123,647404,197180.398
$38,39968,44393,668260,000131,165143,242155,011145)391150,132164,259 !883,985 !980,108 :896,201
1,938,9251,515,056 i1)485,279 11,393,240 !1,310,319 :1,220,4462.122.4735)738,378 ;3,739,2872'. 857,6722)218)0364.874,1292,309;061
35,66061,302118,909558,041152,776175,245169, 761166,031154,077147,418636,361559,167116,561754,686496,265393,032306,150286,381222,926180,178580,098324,073227) 13749,642190,696179,659
2,6223,0274,35718,56212,23618,89125,45024,46022,75918,474194,065205,504140.169293,514346,548233,726765,865167,085155,97221,076680,677857,975336,87354,402326,936136.381
150,155 '223,866 j270,602
1,004)050348,864580,039359,431463,699599,192592,985 i
1,778,552 !2,171,719 !1,636,824 I3,292,933 i2,478,541 !2,428,652 \2,699,128 i2,127,511 !1,883,3622,586,209 :7,881,458 !5,369,8163,694,8542,445.727 •5,795,958 !2, 805, 499
.31
.64
.893.861.612.942.083.094.484.553.385.625. 456. 727.108.86
12. 0510.7811.2317.5414.3318.7419.9021.0224. 8029. S7
Digitized for FRASER http://fraser.stlouisfed.org/ Federal Reserve Bank of St. Louis
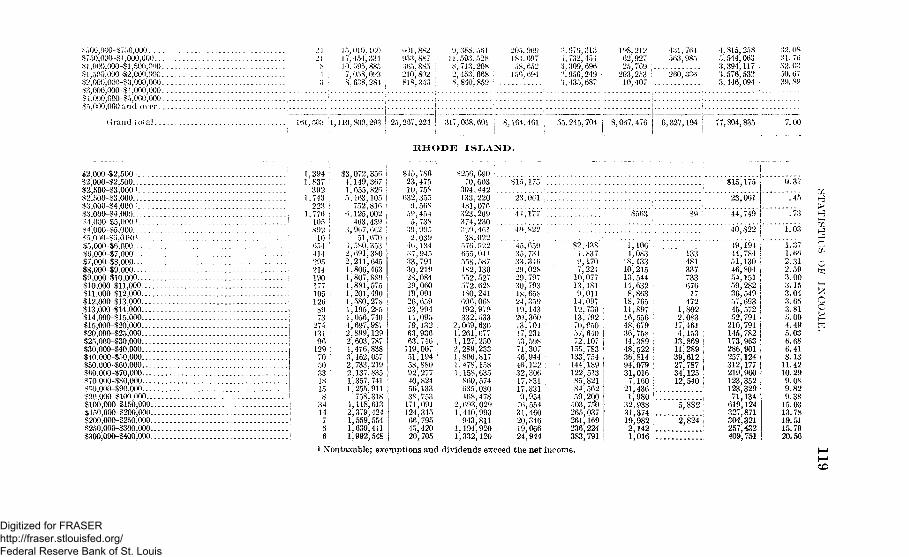
$750,000-8.1,000,000Sl,000,000-$l,500,000Sl;500,000-$2,000.OOC$2,000,000-83,000^000!?3,0O0,000-$4,000.00054,000,000-$5,000',00035,000,000 a n d over
2421
1"), 010.100 '17', 454,33410' 595, 885
7,058,0938.638,284
601,882953,887305.885 :210J802 !818.343 !
I). 38$, 56111,593,5288,713,20S2,453,6688,840.859 ;
205.009184.09758,652156.694
3.979,3131,732,4543,309, 6962.956,2493,435,687
198,21262,92725,709
203,25310,407
431,764563,985
260^336
4.815,2585.544,0633,394,1173,576,5323.446,094
Grand to ta l 161,503 !l, 110,800,293 ! 25,287,224 317,068.601 | 8,164.461 j 55,245,704 8,067,476 6,327,194 77,804,835 j
32. 0831.7632. 0350. 6739. 89
RHODE ISLAND.
$2,000 42,500 i$2,000-12,500$2,500-$3,000 l
S2,500-S3,000$3,000-$4,000 !
$3,000-84,000$4,000- $5,000 >_$4,000 $5,000S O S S O O$5,000 -$6.000$6,OOO-$7,OOO'-17,000 -$8,000$8,000-$9,000$9,000-$10,000... i$10,000-$11,000 1$11 .ooo $12.000 :$12,000-$13;000 i$13,000-$14'.000 |$14,000-$15,00O j$l5,000-$20,000 j$20,000-125,000 1$25,000-130,000 1$30,000-$40,000$40,000-$50,000$50,000-$60,000$60,000-5870,000S7O',OOO-$8O,OOO$80,000-$90,000$90,000-$100,000$100,000-S150,000.S150.000-S200.000$200',000-$250J000$250'000-^300,000$300,000-1400,000
1,3941.837
3921,743
2233,776
105N92
10054414295214190177105126
8973
27413196
12970503318158
3414
$3,072,3564,149,3671,055,8265,163,105
752,8166.125,002
463.4393,907', 662
51,6703,580', 3532,691,3802.211,6451', 806,4631,807,8891,881,5751,201,4901,580,2781,195,2^51,056,7404,697,9872,899,1292,603,7871,476,8383,162,0572,733,2192,137,8351,357,7411,255,911
758,3184,118,6132,379,4241,559,5541,630,4411,992,548
$15,78623,47510,758
032,3559,568
59,4545,738
39,9952,039
•10,13437^,94533,79130,21928,08429,060IT), 09126,65923,994 :14,09579,132 ;63,936 i63,746 :
119,00751,194 !58,880 :92,27740,82456,13338;753
171,091124,31566,79545,420 •20,705
8256,69070,603
304,442133.220481'. 076323', 269374,2303C/M6138,022
576.522655,041558,587482,130552,527572,628480,241606,068492,979332,533
2,069,6361,261,0771,127,2502,289,2331,806,8171,478,1581.158,635
860,574635,030468,478 •
2,693,0291,410,993
943,8111,194,9201,332,120
$15,175
23,061
44.177 $563 $9
$15,175
23,061
44,749
0.3;
.4*
7?
40 S22
45.65035,73133.34629,02829,79730,79318,65824,35919,14320,36073,70147,23143,59871,30746,94446,12232,306 !17,83117,3319,95476,55431,46020,34619,06624,944
$2,4384.8379,1707,22410,07713,1819,01114,09712,73013,79270,95057, 64072,107155,783133,754144,189122,51385,82184,56259,200503, 75*0265,037261,169236,224383,791
1.1064,083 :
• 8,13310,21513,54414,6328,86318,76511,89716,556 ;48,67936,75844,389 148,522 i36,814 i94,079 i31,0167,160 1
21,436 :1,980 !
32,938 i31,374 ;19,982 i2,142 i1,016 ]
13348133773367617472
1,8022,08317,4614,15313,86911,28939,61227,78734,12512,540
5,8S2
2,824
40,'822'
49,19444,78451,13046,80454,15159,28236,54957,69345,57252,791210,791145,782173,963286,901257,124312,177219,960123,352123.32971', 134619,124327,871304,321257,432409,751
1.03
1.371.66
2. 593.003.153.043. 653.815.004.495.036.686.418.13
11.4210.299.089.829.38
15.0313.7819.5115.7920.56
1 Nontaxable; exemptions and dividends exceed the net income.
Digitized for FRASER http://fraser.stlouisfed.org/ Federal Reserve Bank of St. Louis
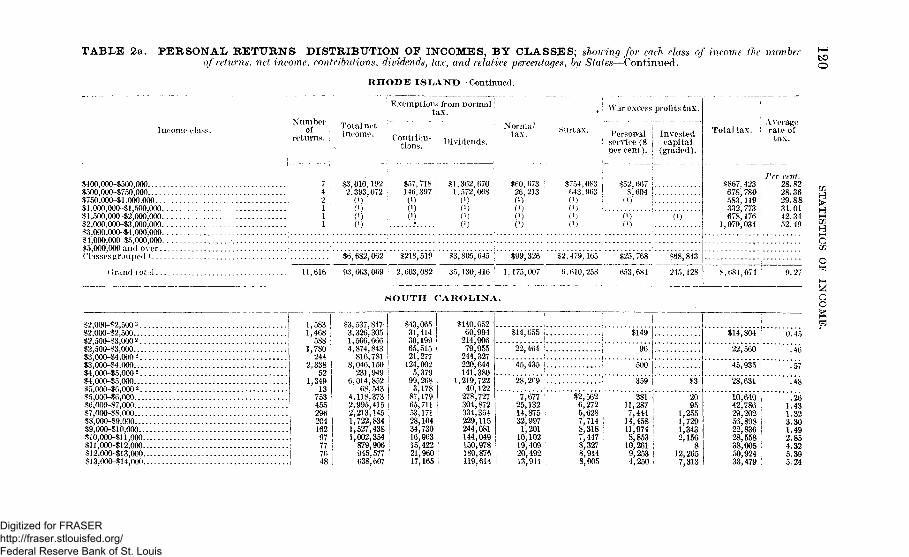
TABLE 2a.—PERSONAL RETURNS—DISTRIBUTION OF INCOMES, BY CLASSES; showing for each class of income 1he numberof returns, net income, contributions, dividends, tax, and relative percentages, by States—Continued.
RHODE ISLAND—Continued.
o
! Exemptions from normal!tax.
Income el us;
8400,000-8500,000•1500,0004750,000$750,000-11,000,000...81,000,000-81,500,000.$1,500,000 $2,000,000.$2,000,000-$3,000,000.$3,000,000-84,000,000.§4,000,000 -$5,000,000.#5,000,000 and over..Hisses grouped '
Numberof
returns. •Total net '"income. j C o n t r i b u .
tions. I Dividends.
$3,010,192 ;2,393,072 i
C1)0 )0 )C1)
$57,718 I146,397 i0)C1)0)
$1,362,670 i1,572,068
Normaltax.
$60,67326,213
()0)
, ' War excess profits tax.
Personal j Investedservice (8 j capitalper cent), j (graded).
$754,083 |643,963 !
$52,667 ;8,604 I
', AverageTotal tax. | rate of1 tax.
)
0)
$867, 423678,780583,119332,773678,176
1,079,034
Per cent.! 28.82
28.3629.8831.0142.3452.49
$6,682,062 $218,519, S3,805,645! $99,326 $2,479,165 $25,768 $68,843
(Jrand total. 11,616 93,663,069 2,603,082 35,130,416 1,175,007 6,610,25S 653,681: 245,128 8,684,074
S O U T H C A R O LIN A .
$2,000-S2,500 2..$2,000-42,500....$2,500-13,000 *..$2,500-13,000....$3,000-14,000 a..$3,000-34,000....$4,000-85,0002..$4,000-85,000....$5,000-86,0002..85,00O-$6,O00....$6,000-$7,000....£7,000-88,000....$8,000-19,000....S9,000-$10,000...!U0,000-*l 1,000..811,000-812,000..$12,000-813,000..$13,000-814,000..
11
1
9j
1 j
m4685887809443385?3491375345529620416297777648
$3,537,8473 326,3051,566,6664 874 843816,781
8,046,150231,949
6,014,85268,543
4,118,3732,995,4152,213,1451,722,8341,527,4381,002,354879,906945,577638,607
$43,31,30,65,21,124,
5i993876553283416152117
065414199515?77003379?68178179711171104730963,422,960,165
$140,65260,994214,90679,955244,327220,644141,380
1,219,72240,122278,727304,872334,364
i 229,115244,081144,049150,978
' 180,876i 119,614
114,655 !
22,464 '
45,435 !...
28,269 :..
7,677 '25,13214,875 132,9971,20110,10219,40920,49213,911
j
$2,562 16,272 15,6287,714 18,318 i7,4478,3278,9148,005 J
$149
96
500
359
38111,2877,44414,45811,9748,85310,2619,2534,250
;
1,1,1,2
i 12,
20952557293431568
265313
$14 804
22 560
45,935
28,631
16,64042,78629,20256,89822,83628,55838,00550,92433,479
0 45
46
57
48
.261.431.323.301.492.854.325.395.24
IIQ
o
Digitized for FRASER http://fraser.stlouisfed.org/ Federal Reserve Bank of St. Louis
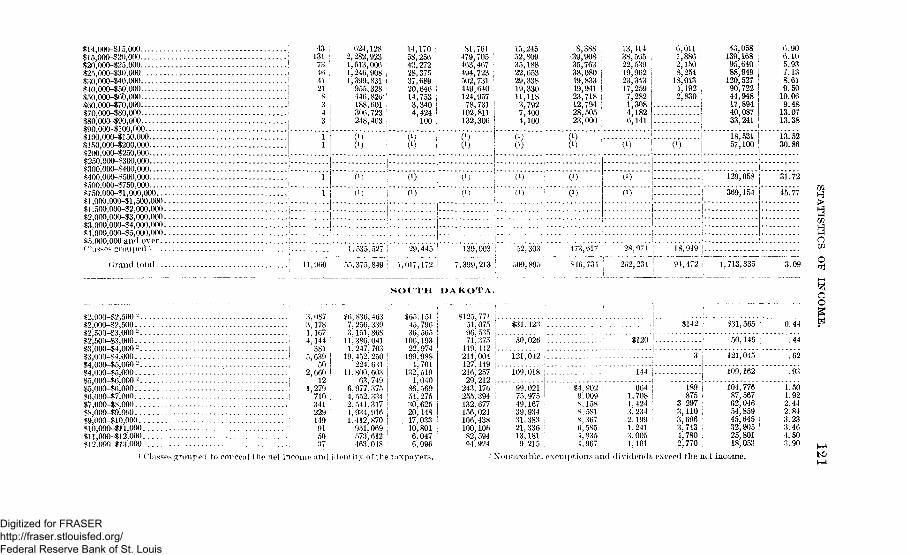
$14,000-815,000$15,000-820,000$20,000-125,000$25,000-$30,000$30,000-$40,000$ 10,000-$50,000S50,000-$6t),000$60,000-$70,000$70,000-180,000$80,000-190,000 :$90,000-$100,000$100,000-$150,000$150,000-$200,000$200,000-$250,000$250,000-$300,000.$300,000-$400,000$400,000-1500,000$500,000-8750,000.
4313173464121s343
2l',1,1,
624,282,613,246,399,955,446,188,306,248,
128923006908831328826-601723463
14,17058,25642,27228,37537,68920,64614,7533,3404,424
100
0)C 1 ) 0)
•ItiOUU,UUU— <BW UU,\JUU
$750,000-81,000,000$1,000,000-11,500,000SI ,500,000-12,000,000$2,000,000-13,000,000.. . .$3,000,000-14,000,000•5 4,OOO,OOO-$5,OOO,OOO#.5,000,000 a n d over(lassos grouped "i
0)
81,761479,705463,467494,723502,731449,640124,95778,731
102,811132,306
0)0)
15,24552,80935,18822,65329,33819,33011,1183,7927,4004,100
8,38839,908 ;35,763 :
38,080 !49,833 !49,941 !23,718 !12,794 !28,50523,000
C1)(l)
C1)C1)
0) C1)
13,41438,56522,53919,96223,34317,2597,2821,3084,1826,141
6,0117,886 j2,1508,254 !18,013 !4,192 I2,830 i
i• 1
1
43,058139,16895,64088,949120,52790,72244,94817,89440 08733,241
6.906.105.937.138.619.5010.069.4813.0713.38
C1)
C1)
C1)18,53157,100
129,058
0) 369,154
13.5230.86
31.72
45.77
\ ! 1.535,527 1 29,445; 139,003! 52,303
Grand total • 11,900 j 55,375,849 j 1,017,172! 7,399,213- 509,895
473,617 | 28,974 j
846,734 ; 262,234 I
18.949 |
94,472 j 1,713,335 | 3.09
S O U T H D A K O T A .
$2,000-82,500 2 3,087$2',000-$2,500 3, 178$2,500-83,000 2 1,167$2,500-$3,000..$3,000-54,000 2
83,000-84,000$4.000-$5,000 -$4^,000-15,000 ."85,000-86,000 2
$5,000-86,000$6,000-87,000$7,000-88,000$8,000-89,000$9,000-110,000$10,000-811,000811,000-812,000$12,000--$ 13,000
4,144381
5,63950
2,66012
1,279710341229149915037
,836,463 i,256,339,151,868 :,386,041 I,247,703 !,452,250 I224,631 {800,603 i63,749 I
,977,375 !,552,334 !,541,317 ;934,916 I412,870 !951.069 i573,612 ;
463.018
$65,15145,79636,565
106,19322,974
199,9884,701
132,5191,040
86,56954,275 j30,625 j20,148 I17,033 !10,801 |6,047 :6,096 ;
$12551:9Cy.
7i:119:211:127'.216:
29;243.255:132,156;106,100.82.94'.
$31,423 $31,565
50,026 ! $120 50,146 j
121,042 i
109,018 I 144
99,02175,49,39,31,21,13,9.
975167934383336181215
121,045
'109,162"
$4,902 !9,009 :
s,i58 :S, 581S, 3670,5854.8354', 967 ,
664 ;1,708 !1,424 '3,2342,199 ;
1,2413,0051.101
189875
3 2973,1103,6963,7434,7802,770
104,77687,56762,04654,85945,64532,90525,80118,053
.62
.93
1.501.922.442.843.233.464.503.90
OwO
coK
es grouped to conceal the net income, and identity of the taxpayers. 2 Xontaxable; exemptions and dividends exceed the net income.
Digitized for FRASER http://fraser.stlouisfed.org/ Federal Reserve Bank of St. Louis
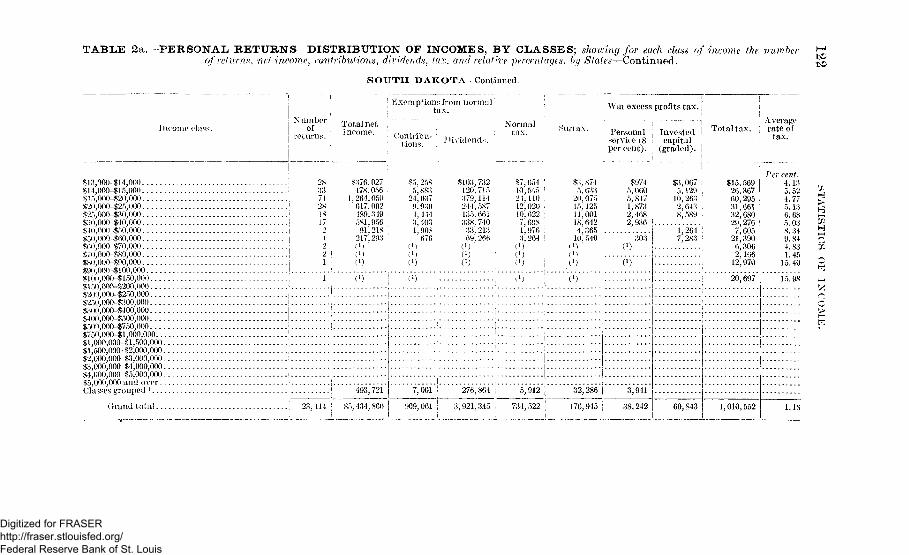
TABLE 2a. -PERSONAL RETURNS—DISTRIBUTION OF INCOMES, BY CLASSES; showing for each class of income the numberof returns, net income, contributions, dividends, tax, and relative percentages, by States—Continued.
SOUTH DAKOTA -Continued.
toto
1 Exemptions from normal' tax. .'
Income class.
$13,000-$14,000$14,OOO-$15,OOO$15,000-520,000$20,000-$25,000$25,000-$30,000$30,000-$40,000S10,00(t-$50,000#50,000-$60,000$60.000-870,000$70^000-^80,000«80,000-$90,000$90,000 --$100,000S10(),000-S150,000$150,000-?.200,000§200,000-8250,000^250,000-S300,000$800,000-$400,000$400,000-5500,000$500,000-$750,000$750,000-11,000,000...$1,000,000-$1,500,000..$1,500,000-$2,000,000.$2,000,000-$3,000,000.S3,000,000-,$4,000,000.$4,000,000-$5,000,000.$5,000,000 a n d o v e r . .Classes grouped i
Number .of :
returns.
Total netincome.
2833 j74 !28 [
IS i17 ,2 '4 ;
$376,027478,056
1.264,050617,002489,349581,95691,218217.298
c1)
Contribu-tions.
$5,2585,88324,0379,9304,4443,4031.908' 676
(V)
Dividends.
Normal
tax.
War excess profits tax.
Personal j Investedservice (8 i capitalpercent). ; (graded).
i AverageTotal tax. : rate of
tax.
$103,732120,715379,114244,587185,661338'. 74033.21369'. 266
0) '(v)(v)
87,654 '10,545 !
24,110 ,'12,020 i10,622 :
7,698 ••1,976 i3,264 I
] i
•58,8745,63320,07515,12511,00118,642 '4,365 ''.10,540
(*)
$9745,0005,8471,8732,4682,936 l.
S3,067 I5,12910,26:$2,6438,589
3031,2647,283
493,721 7,001
(Irand total : 23,414 • Hn, 434,860 909,061
276,864 5,912
3,921,345 734,522
32,286 | 3,941
176,945 I 38,242 60,843
$15,56926,36760,29531,66132,680 j29,2767,60521,3906,3062,16612,970
20,697
Per cent.4.135.524.775.136.685.038.349.844.831.45
1,010,552 1. IS
15.40 ~
Digitized for FRASER http://fraser.stlouisfed.org/ Federal Reserve Bank of St. Louis
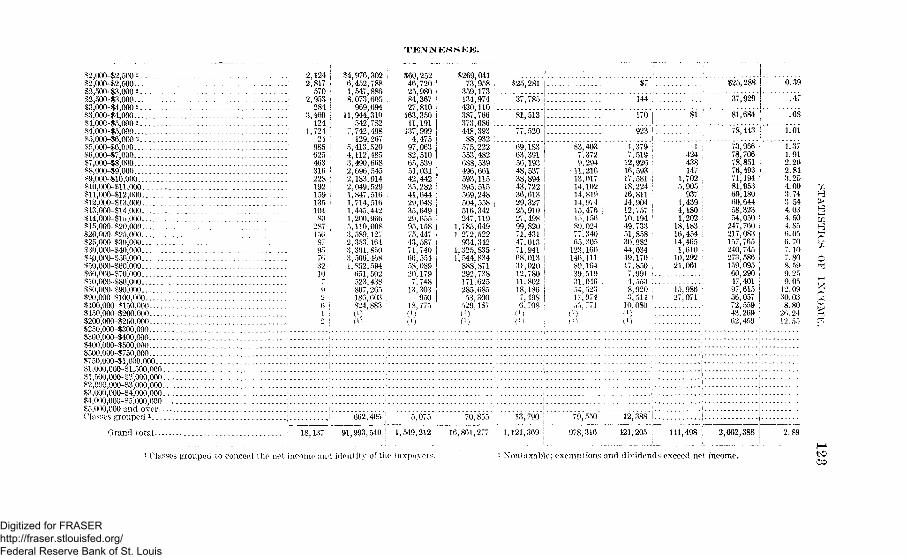
TENNESSEE.
$2,000-82,500 a - -$2,000-82,500 -$2,500-$3,000 2$2,500-83,000$3,000-$4,000 s*3,000-$4,000.... - - - - - - -84,000-$5,000 2S4,000-$5,000$5,000-$6,000«35,000-16,000...$6,000-$7,000$7,000-88,000$8,000-$9.000$9,000-$10,000$10,000-111,000S11,000-S12,000 . . .•1!12,000-$13;000 . . .S13,000-$14,000 - . . . -*14,000-$lf>,000S15,000-!$20,000S20,000-$25,000.$25,000-$30,000S30,000-$40,000 9;$40,000-850,000850,000-860,000$60,000-870,000 . . . .$70^000-180,000$80,000-$90,000«90,000-$100,000$100,000-S150,000$150,000-1200,000•S200,000-$250,000$250,000-^300,0008300,000-8400,000«400,000-$500,000$500,000-1750,000$750,000-$1,000,000SI. 000,000-81,500,000 . . . .Sl',500,000-S2,000,000...S2,000,000-S3,000,000$3,000,000-14,000,000$4J000,000-$5,000,000§5,000,000 and overClasses grouped *
2,1242,817570
2,953284
5,460124
1,7242498562546331622S192159135104SO28715687957632107
261
54,976,3026,452,7881,547,8868,073,605969,694
11,944,310542,782
7,742,498129,267
5,413,5204,112,4853,490,6682,696,5452,183,9142\ 049,5291,847,5161,714,5161,445,4421.200,9665,110,0083,589,1272,353,1643 391,8503,506,4681,852,594651,502523,438807,265186,603824,883i1)
$60,252 <46,720 !25,980 I84,367 !27,810 j163,350 I11,191 !137,999 |4,475 i97,06382,510 165,539 !51,031 .'42,44235,282 ;41,64429.64835.64929,655 i95,158 i75,447 I43,587 i71,740 I66,554 I58,020,179 |7,74813,303 I
950 |18,7
]1 1
11
^269 041~73,;958359,173134,974430 110387*766373 686448,39388,932 .575,222553,482688,539496,661593,115395,515569,248504,558 i516,342247,119,785,649.272,522934,342,325,835', 544,834888,871292,738171,625285,68553,300
529,1S7
n\
$25,281
37,785
SI, 513
77 520
69,18363.39156,19348,53738,89443,72236,61329,32725,91027,49899,82071,43147,01371,94168.01331,02012,78011,80218,1867,4986,7080)
S3,4037,3729,29411,21613,01714,10214,81914,97415,476 115,156SI)! 02477,34065,305123,160 :146,11189,16439,51931,04654,52317,974nn,771
$7
144
170
923
1,3797,51912,92616,59317,581-18,22416,81114,904
io!19449,73351,85830.98244,03449,17017,8507,9914 5538,9203,51410,080
(V)
1,5,
1,4,1,18,1614|1,10,21,
15,27,
$1 I
1 :4 2 4 •
438 \147702 !905 '•
937439 !180 i202 !183454 ;465610292061
986071
125,288
37,929
SI,684
78,443
73,96678,70678,85176,49371,19481,95369,18060,64458,32354,050
247,760217,083157,765240,745273,586159,09560,29047,40197,61556,05772,55943.26962,459
0.39
.47
.68
1.01
1.371.912.262.843.254.003.743.544.034.504.856.056.707.107.808.599.259.0512.0930.038.80
26.2412.55
71
H
h5:hi>—i
Cl
Ct>
662,405 i 5,075 i 70,855 ! ' 13," 790"! 79,550 j 12,388 j
Grand total 18,137 I 91,993,540 \ 1,549,212 | 16,861,27'
1 Classes grouped to conceal the net income and ident i ty of the taxpayers .
1,121,369 \ 978,316 | 421,205 ! 141,498 | 2,662,388
- Xontaxable ; exempt ions and d iv idends exceed net income.
2.89
to
Digitized for FRASER http://fraser.stlouisfed.org/ Federal Reserve Bank of St. Louis

TABLE 2a.—PEBSONAL RETURNS—DISTRIBUTION OF INCOMES, BY CLASSES; showing for each class of income tlu numberof returns, net income, contributions, dividends, tax, and relative percentages, by States—Continued.
TEXAS.
Income class.
$2,000-82,500 i$2,000-$2,.r>00$2,o(XM8,000 '82,500-83,000 i$3,000-$4,000 '$3,000»$-*,000$4,000-85,000 '8-1,000-85,00085,000-86,000 •85,0<X)-86,00086,000-87,000$7,000-88,000.88,000-89,000.$9,000-810,000810,000-811,000$11,000-112,000812,000-813,000$13,000-814,000814,000-815,000815,000-820,000820,000-825,000825,000-830,000S3O,OOO-$4O,OOO840,000-850,000$50,000-860,000$60,000-170,000$70,000-880,000$80,000-890,000$90,000-1100,000S100,000-$150,000$150,000-1200.000$200,000-8250,000$250,000-8300,000$3Q0',00O-840O,0OO$400,000-8500,000
Exemptions from normaltax.
Number jof ;
returns. :
2144103995S87844542029574027206447S0207*8568432340308258765367 !240 j261 j142 !
65 !46 !34 !26 j
16371713
11
Total netincome.
515,959,96819,125.9026,463,58626,246,7322,588,70242,904,318
891,46526,531,446
213,01417,975,32513,550,96111,691,3978,792,6347,089,9115,954,3004,954,4804,287,1664,151,4283,742,37313,136,1268,244,4596,528,1668,987,7566,538,8003,616,1242,996,6172,558,0662,198,1871,511,5774,298,1473.255,3462,794,180
2)
Contribu-tions.
,005,77986,92161,106
165,39739,543
335,21321,593
654,4347,250
593,106152,104168,391119,90695,39588,65573,569
271,67860,29952,998
203,967126,349230,94391,815
110,10670,13673,86872,82942,03549,790
998,782146,361
46,666• f
2' )
Dividends.
8864,988242,845535.960316,061716,778908,698669,900
1,010,538145,4on
1,244,3761,187,0881,043,0031,755,1291,083,581
943,0031,018,523
895,822833,017661,609
3,065,0762,420,6062,331,0693,174,1512,496,3561,155,1831,334,7191,202,2071,052,973
473,0392,125,393
729 088868,102
Normaltax.
War excess profits tax.
\ Personal j Investedi service (8 i capital, percent). (graded).
Total tax.Averagerate oftax.
$75,404
116,360
"789," 707"
266,839
258,829230,493209,699177,803145,194127,823107,52093,89295,82995,259
511,264187,627 I149,244 :202,495 j132,805 j
79,451 I59,075 •44,611 i40,375 i37,60184,01836,3^572,4812)
227
8,087
1,441
$17,13531,75433.17542,13940.68742,50548,16342,90150,62556,982
217,863 !196,606207,144352,736 I276,110 I194,886 :163,935 !169,203 :
137,297145,107531,134877,650484,221
$75
"66*;
4,68418,049 ,
729,82133,96137,319 I30,61827,87427,494 !32,123 i21,898 j
130,959 177,11051,06266,12252,57631,70125,95310,23013,141 I14,507 I25,218 I31,843 I17,667
2671,7488,9918,728
13,04018,36212,48316,17011,9449,292
51,85387,61329,44492,51033,4125,6281,818
37,70122,488
48515,19857,18423,632
Per cent.
$75,812
116,587
797,869 i
268,346
(2)
0.40
.'ij
1.86
"i.'oi
280,915282,044981,686262,631236,240219,308196,040180,457190,521183,431911,939548,956436,894713,863494,903311,666250,781261,745213,301197,700655,568
1,003,022598,001260,08385,279169,806
1.562.088.402. 993.333.683.964.214.594.906.946.666.697.947.578.628.3710.239.7013.0715.2530.8121.4099.2626.4419.24
c
Digitized for FRASER http://fraser.stlouisfed.org/ Federal Reserve Bank of St. Louis
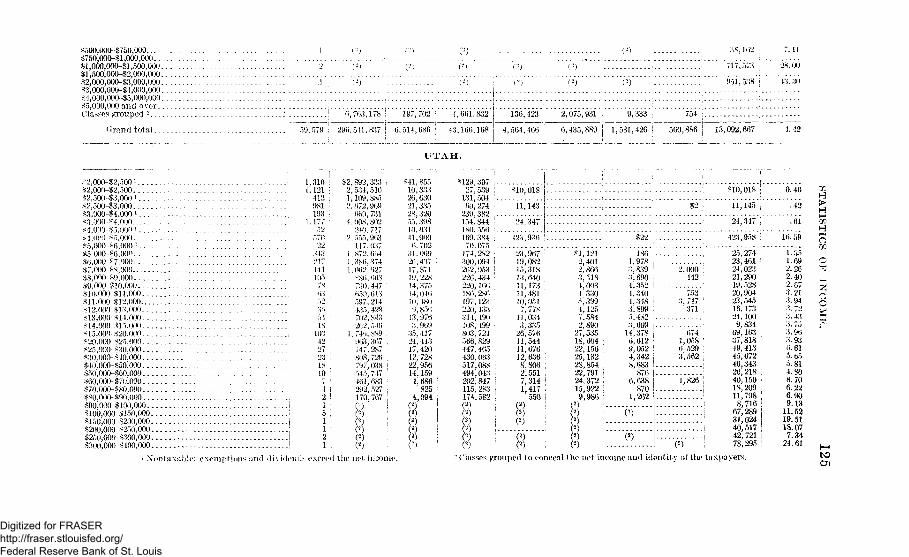
$500,000-4750,000S750,000-$l,000,000*;i,ooo,ooo-$i,500,oooSI,500,000-$2,000,000.$2,000,000~$3,000,000$3,000,000-14,000,000...$4,000,000 -$5,000,000$5,000,000 and o verClasses grouped "-'.
(trand total
6,763,1"8 j 197,702 4,661,832 | 136,423
59,579 i 296,541,837 | 6,514,686 ; 43,166,168 4,564,466
U T A H .
2,075,931 9,333 754
38,162
717,573
951,538 j
6,435,889 1,531,426 | 560,886 I 13,092,667
7.11
" 28.00
13. 30
-•2,000 -S'2,5001 1,310 ^2,892,333 .^41,855^2,000-^2,500 1 .121 ' 2,534,510 10,333S?,.i(K> -$3',000 ' 412 1,109, SS5 26,630s2,500-53,000 - 981 2. 672,969 21.335*3,000-?4.000 i 193 060, 731 2S, 320<3,000-?f,n;v) . . 1. IT.* 1.00N.S02 55.398«4,00')-?.),0')n' - . _ _... . r> :>.u),7i: IO.OMI•* J.0"*: Vi.OO'i 570 2.555.963 11,900s;),000-s6,000T> . 22 117.037 6.702So.000 -*6.000 343 1, 872. 6;>4 31. '169"ifi.OOO >'7,000 217 1. 3S6, 374 2(5. 437s7.000-.SS.000 141 : 1. 062, 627 17, 87 1.NS,0 ' )0 fcfl.OW 105 SS(5, <;03 19,22S•SO,000-.? 10.000 7S 731). 447 14,375s 10,000 SI 1,000 «>3 (150, 0 1 3 14.046tfl 1,000 .* 12.000 52 597.214 10, WO> 12,000 .*]'?,000 . . :>," 135,42* 9,85C<13,000>H,000 51 702, S43 13,976S14,000-^15.000 IS 202,510 3,969*15,00O->?20.000 103 1. 71'), SS9 35, 417*20,000 s2V)00 42 963,367 21, 413 ,S25.O00 ^30,000 27 ,47,287 17,420s:jo,()l)O <40,000 23 SUN, 726 12.728>40,000 850.000 IS 797,03S • 22,956s50,000-*60,000 10 545,747 14,159 ,S60.000 i>70,000 7 46l', ()8"i 4,686 \S70.000 >NO,000 4 292,527 825 '>.so;non-s90,000 2 ! 170,767 ' 4,094 '^90,000 ?100,000 1 ' (-; i C1)•S100,000-yi50,000 • 5 ! (2) (2)S1.)0,000 $200.000 > 1 (2; (2)$200,000^250,000 . . . ! l | (2) \ («)1250,000-$300,000 1 2 j (2) | (2)S300,000 $400,000 ! 1 ! (2) • (2)
i N"ontaxablo; e x e m p t i o n s a n d d i v i d e n d s exee<id the ne t income.
SI 29,30'27,5?131,504 ;-60,274239,382154.8441.S0.556169,38470.075174,282300,094262,953226, 434220,166186,286197,123220,133314,490108,499803, 721566,829447,465430,063517,088494,043202,847115,283174,5822
19 i $10,018 j
11,143 |
24,347 i
423,93«j ]
23,96719,08215,31813,64011,17311,481. '10,0517,77s11,0343,33526,o ti11,54411,67612,636 i8,806 I2,551 !7,314 i1,417 .550 I
!
§22 :
.*1.1212,4012,8663, .5184, 0034 330.',3994,1257,5842,890
27,53518,60422,15625,13228,85422,79124,37215,9229,986
(2)
()C-)
186 -1.978 i-3,839 !3,6904,352 j .4,340 ;
4,348 j3.899 I5,482 i.3,609 |.
14,378 i6,612 !
9.052 i4; 342 !8,683 i.
876 I.
2,000442 :
7533,747 ]
371
6741,058 'ti 5293', 562 ;
6,638870
1,262
(2)
(2)
1,826
(V)
810,018 I
11,145 ;
24,347 j
0.40
>
25,27423,461 i24,02321,29019,52820,90423,54516,17324,1009,83469,16337,818 i49,41345,672 j46,343 126,218 i40,150 i18,209 i11,798 |8,716 !67,289 |3i;02440,517 |42,721 i78,295 !
-u->. on
1.351.692.262.402.673. 213-943. 723.4;*3. 753.963.936.615.655.814. SO8.706.226.909.1311.5219.5118.077.3424.61
O
o
1__
- Classes grouped to conceal the net income and identity of the taxpayers. to
Digitized for FRASER http://fraser.stlouisfed.org/ Federal Reserve Bank of St. Louis

TABLE 2a.—PERSONAL RETURNS—DISTRIBUTION OF INCOMES, BY CLASSES; showing for each class of income the numberof returns, net income, contributions, dividends, tax, and relative percentages, by States—Continued.
UTAH—Continued.
Exemptions from normaltax. War excess profits tax. j
Income class.| Number I Total net |~i . Q + ™. I income, j
I Contribu- j Dividends,tions.
Normal [
tax. Surtax. I Personal | Invested \ T°t»ltax.j service (8 ! capitali percent). \ (graded).
Averagerate oftax.
$400,000-$500,000$50O,0OO-$750,0OO$750,000-$l,0O0,00O...$l,000,000-$l,500,000.$l,500,000-$2,000,000.$2,000,000-$3,000,000.S3,000,000-$4,000,000.$4,000,000-$5,000,000.$5,000,000 and over . .Classes grouped *
Grand t o t a l . . .
Per cent.
1,191
$1,963,119 j $70,984 $1,386,276 ; $14,531 $237,547 $8,616
33,877,446 j 611,493 8,510,622 ; 693,904
V E K M O N T .
471,136 97,074
$7,868
28.832 $1,290,946 !
$2,000—$2,500 2 . .$2,000—$2,500...$2,500—$3,000 2 . .$2,500—$3,000....$3,000—$4,000 * . .$3,000—$4,000....$4,000—$5,000 2 . .$4,000—$5,000....$5,000—$6,0002...$5,000—$6,000....$6,000—$7,000....$7,000—18,000....$8,000—$9,000....$9,000—$10,000...$10,000—$11,000..$11,000—$12,000..$12,000—$13,000..$13,000—114,000..
41972313766765697283893
2311589177.55*2383725
$917,998], 637.058372'710
1,819,672220,919
2,394,683127,337
1,728,97315,669
1,269,3091,082.645680)384652,530521,995440,744436,367458,372338,030
$8,21914,2894,65417,2643,00828,5473,29322,314
12018,93418,71213,20513,6199,8109,2377,1598,8317,436
$86,44439,958118,34565,713118,166119,84577.761137) 47411,093185,802 i250,809 !158,377 ;171,952171,175 ;152,153 i133,389196,077107,013 ,
$5,555
"7*876":
18,555
17,372
$159
80
16,411 i13,617 !10,925 I10,256 :7,3276,9237,2056,0786,124
$8121,7001,9462,6552,5773,0573,4314,2823,748
2101,0781,4802, 1111,6711,6803,3872,6531,739
$5,555
$71
7,876 ;
'is,7U\
'l7,523*i
1.134 i'248 !
17,433 i16,395 !14,35115,022 i12,709 i11,90814,02313,43511,611
3.81
1.371.512.112.312.432.703.212 933.43
ao
Digitized for FRASER http://fraser.stlouisfed.org/ Federal Reserve Bank of St. Louis
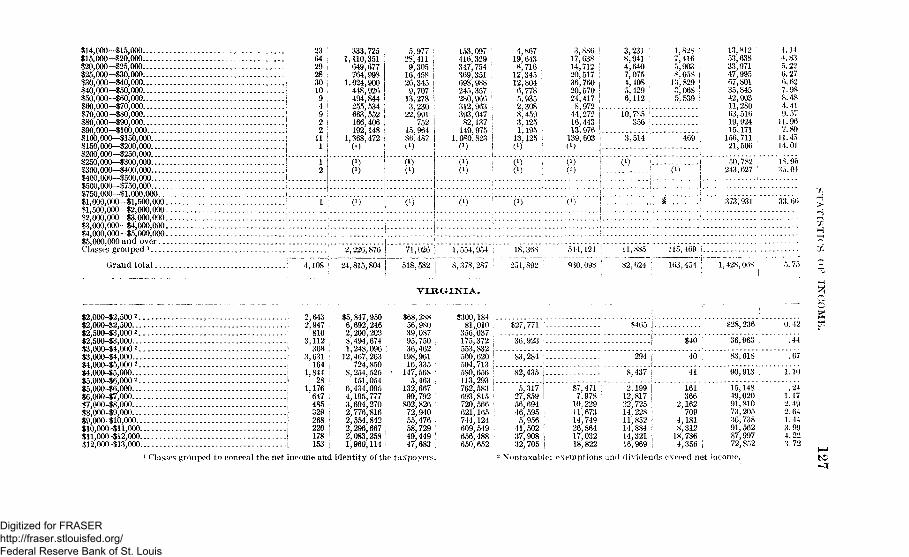
$14,000—$15,000$15.000—$20,000$20,000—$25,000825,000—$30,000$30,000-840,000$40,000—$50,000$50,000—$60,000$60,000—$70,000$70,000-180,000$80,000—190,000$90,000—$100,000$100,000—$150,000$150,000—$200,000$200,000—$250,000$250,000—1300,000$300,000—$400,000$400,000—$500,000$500,000—$750,000$750,000—$1,000,000...$1,000,000—$1,500,000.$1,500,000—$2,000,000.$2,000,000—$3,000,000.$3,000,000—$4,000,000.$4,000,000—$5,000,000.$5', 000,000 and ove r . . .Classes grouped J
Grand to t a l .
$2,000-12,5002..$2,000-12,500....$2,500-$3,000 2 . .$2,500-63,000....|3,000-$4,0002..$3,000-$4,000....$4,000-15,000 2 . .$4,000-15,000....$5,000-16,000 2 . .$5,000-$6,000....$6,000-17,000....$7,000-$8,000....$8,000-19,000....$9,000-110,000...$10,000-$ll,000..$ll,000-$12,000..$12,000-113,000..
23 '6429 i283010 i94 i9 i2 |
i f I1 |
333.7251,110,351
649,677764,998
1.024,900448,926494,844255,534663,552166,406192,148
1,368,472( )
5,97728,4119,30516,45826,3459,70713,2783,23022,991
75215,96486,487C1)
153,097416,329347,754369,351698,988 i245,357 !280,966 I312,963 ;393,047 |82,137 '140,975 !
1,080,823 I
4,86719,6438,716
12,34512,8046,778 I5,9352,308 i8,459 \3,125 I1,195 !
13,125 i0) !
3.88617 63814,71220,51736,76020,57024,4178,972
44,27216,44313.976139,6030)
3,2318,9414,6407,0754,4085,4296,112 ,
1,S2S !7,4165,9038,058 i13,829 I3,068 !5.539 i
10,785 '356
3.514 469
13,81253,63833,97147,99567,80135,84542,00311,28063.51619,92415,171156,71121,506
4.144.835.226.276.627.988.484. 419.5711.967.81)11.4514.01
C1)0)
C1) 0)(0 C1)
50.782243,627
18.9635.04
0) C1) 373,931 33.66
i 2,226,876 ;
4,108 ! 24,815,804 I
71,026 I 1,554,954
518,582 j 8,378,287
V I R G I N I A .
18,368 '
251,892
544,124 ;
930,098 !
11.885
82,624
115,469 I
163,454 | 1,428.068
2,6432,947816
3,112368
3,631164
1,84428
1,176647485329268220178153
$5,847,9506,692,2462,200,2038,494,6741,248.09612,467^263
724,850S,254,525151,054
6,434,0954,195,7773,694,2702,776,816 !2,554,842 \2,296,667 j2,083,258 i1,960,114 i
$68,28S56,98039,08795,75036,462198,96116,335147,5685,463
132,66799,792802,82672,94055,47658,729 '49,449 '47,683 ;
$300,18481,010
356,037175,372553,832500,620504,713580,656113,293762,583693,815720,566621,165744,124609,549656,488650,652
$27,771 '
36,923 1
83 284 '
«465
-i 294
$40 !
40;
t$28,236 ;
36,963
83,618
0.42
, .44
.67
82,435
5,31727,85956,69446,5955,95641,50237,90832,705
8,437
$7,471 I7,978 i
10,229 l11,673 i14,749 !26,864 I17,032 |18,822 |
2,19912,81722,72514,22811,85214,88414,32116,969
161366
2,162709
4,1818,31218,7364,356
1 Classes grouped to conceal the net income and identity of the taxpayers. - Xontaxable; exemptions and dividends exceed net inco.
7;HH
15,14849,02091,81073,20536,73891,56287,99772,852
no.
.241.172.492.641.443.994.22'5.72
to-a
Digitized for FRASER http://fraser.stlouisfed.org/ Federal Reserve Bank of St. Louis
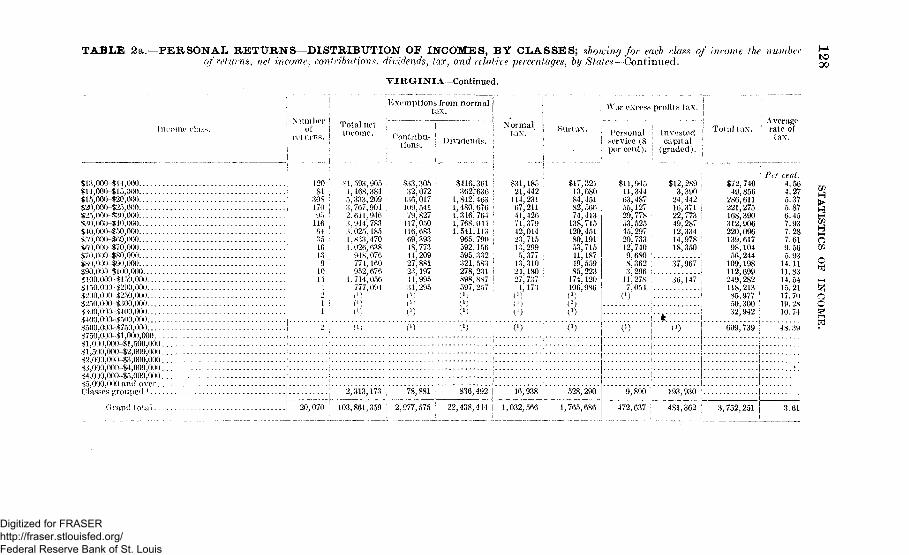
TABLE 2a. -PERSONAL RETURNS—DISTRIBUTION OF INCOMES, BY CLASSES; showing for each das,of returns, net income, contributions, dividends, tax, and relative percentages, by States—Continued.
is of income the number
VIRGINIA—Continued.
00
Income clas>j Number! T o t a l n o t
i returns. | in i '01™-
$13,000-$14,000 120 ; SI,593,905, ,$14,000-$15,00OS15,000-S20,000$20,000-$25,000$25,000-$30,000S30,00a-:$40,000$40,ooo-$50,ooo$5O,0O0-3fO0,OOOS60,O0l)-3t7O,O0O.i>70,O00-$S0,0O0$ O O $ 9 0 0 0 0$90,003-$100,000*100,000-$150,0003150,00()-$200,000$2i)0,0l>0-$250,000$250,000-1300,000$300,000-$400,000$40o,ooo-$50o,ooo$500,000-1750,000$750,000-$1,000,000$i,oao,ooo-$i,50o,ooo$l,500,000-$2,000,000$2,000,000-13,000,000$3,000,000-$4,000,000$4,000,000-15,000,000$5,000,000 and over jClasses grouped l |
81308 '170 !95 '
116 .64 !3516139
io ;144
1 i1
1,168,3845,333,2093,767,9042,611,9463,944;7833,025,1851,833,4701,026,638
948,076774,160952,676
1,714,056777,094i l )0)
Exemptions from normaltax.1
Contribu-t ions.
$33,30532,072
136.017109,54179', 827
117,050116,68369,39348,77344,20927,88123,19744,99531.295
Div idends .
$416,361362/636
1,842,4631,480,6761,316,7641,768,0441.541,113
965,790592,156595,332321,583278,231H98,8<S7597,257
Normal
tax.
$31,18521,442
114,23167; 21141,42671,37942,01423,71513,2995,377
13,31024,18027,7374,173
Surta>
! $17,1384;82,74,
138,120,
80,53"41,49,85,
174,106,
I1)
War excess profits t ax .
-! AveragePersonal | Invested
service (8 i capi ta l !
per cen t ) , i (g raded) . 1
J gI Total tax. : rate of
321680451566413715451191715187559223120 I986
C1) I1) C1)
2,313,173 78,881 836,492 J 46,9 528,290
Orand total i 20,070 103,861,359 2,977,575 22,438,444 | 1,032,566 1,765,686
$11,94511,34463,48755,12729,77853,52545,29720,73312,7409,6808,3623,296 :
11,2787,054
C1)'
$12,289 I3,390 :
24,44216,371 j22,773 !49,28712,33414,978 j
18,350
"377967*:
36,147 j
(l)
9,800 ! 193,930
tax.
$72,74049,856
286,611221,275168,390312,906220,096139,61798;10456,244
109,198112,699249,282118,21385,97750,30032,942
472,637 481,362 3,752,251
cent.4.564.275.375.876.457.937.287.619.555.93
14.1111.8314.5415.2117.7019.2s10.74
609,739 ; 48.39
3.61
o
Digitized for FRASER http://fraser.stlouisfed.org/ Federal Reserve Bank of St. Louis
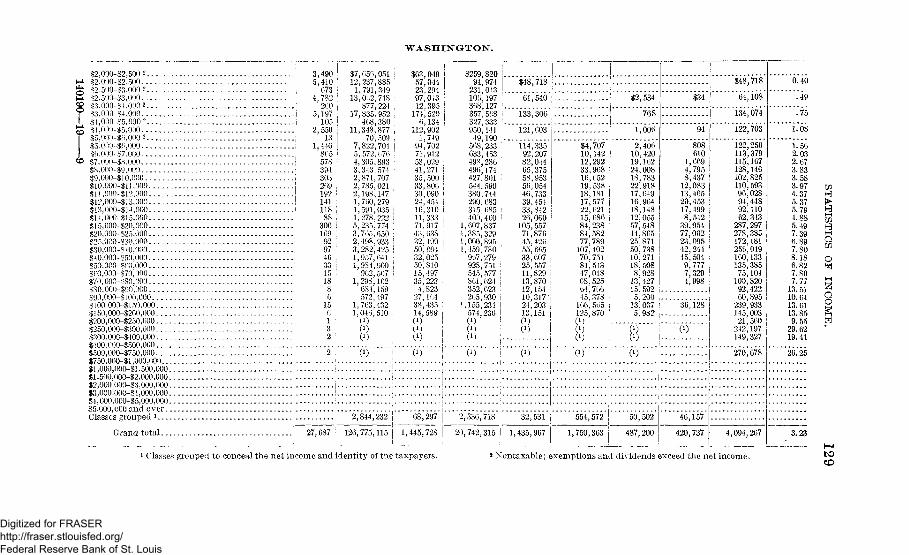
WASHINGTON.
$2,000-12,500 2.$2,000-82,500...82.500-83,000 2.82,500-83,000....$3,000-$3,000 2.
$3,000-14,000..
81,000-85.000$5,000-80,000 2
$5,000-80,000$0,000-57,000$7,000-88,000$8,000-$9,000$9,000-$! 0,000$10.000-811,000$11,000-812.000$12,000-813,000$13,000-814,000814 i000-815,00081 o',000-820,000$20.000-825,000$25,000-$39,000$30,000-$10.0(W$40,000-350,000$50,000-$C0,000$f;6,ooo-$7o,ooo$70,000-f-80,000$80,000-190,000$90,000-$] 00,000$100,000-$]50,000$150,000-$2G0,000$200,000-$250,000$250,000-$300,000 -$3OO,OOO-$4OO,OOO$400.000-8500,0008500,00O-$750,O0O$750,000-81,000,000$1,000,000-$! ,500,000$1,500,000-82,000,000$2,000,000-$3,000,000$3,000,000-8-1,000,000$4,000,000- $5,000,000$5,000,000 and over 'Classes g rouped 1
3,4905,410673
4,782200
5,197105
2,55013
1,4408055783943032091921411188830610992974033151886156132
$7,65012,2371,791
13,0;>2877
17,835468
11,34870
7,8225, 5724,3053,3432,8712, 7852,1981, 7001,5911,2785,2353,705,2,49R3,282,1,957,1,984,
902,1, 298,
684,572,
1,763,1,046,
C1)0)C1)
051 i885 !349748 !224952380877 ,509 I701 i(70 i893 ;
574 :707 !021 j
147 :279 :
035 j222 i774 •650 ;933 1425 !041 :
900 |507 !102 i159 !497 j432 I510
$63,04957,04423,29497,01312,395174,5200,134
112,9021,749
94,70271,91253,02941,27135,50033,80630,09024,45416,31011,33371,91743,OSS32,199 iSO! (104 .32^025 i50,81015.49735,'2234,82327,10438,43514,589
(OC1)C1)
$259,820 i94,974
231,043105,197 |308,127 I357,508 !327,333 '950,14149,190 :.
568,233 i633,453 !
498,286490,174427,801 i544,590380,744290,083315,085 !400,400 j
1,607,837 !1,385,329 '•1,000,895 'i1,459,780 !9'o7,279 i928,751 i545,577 !801,624 |352,623 i205,930 !
!,155,234 |574,230 i(O !
C1) :
C1) ';-
114,33592.20782;04465,37558,95356,05446,73339,45433,84226,060 '105,55771,87645,42655, 60533,00725,55711,82913,87012,15410,317-j24,203 i13,151
C1) !
$4,70710,14212,29233,96816,05219,53818,18117,57722,02115,68684,23881,58277.789107! 40270', 75181,51347,01808.52504', 70645,378166,505125,870C1)C1)(l)
2,40610,42019,16224,00818,78322,91817,64916,96418,14812,05557,54844,86525.87150,73810,27118,5088,92813,42715,5025,20013,0375,9S2
6101,6694,7958,437 !12,083 I13,465 I20,453 l
17,499 j8,542 j
39,954 |77,062 ;23,095 i42.244 !
45^504 i9,777 ;7,329 !
4,998 ;
36,128 j
C1) C1) C1) 0)
C1)C1)
0) C1)
2,844,232 | 68,297
Grand total i 27,687; 126,775,115 j 1,445,728
2,336,718 32,531 554,572 50,502 46,157
20,742,315 | 1,435,967 1,750,363 487;200 | 420,737 4,094,267
122,256113,379115,167128,146102,825110,59396,02894,44892,11062,343
287,297278,385172,181 i256,049 !160,133135,38575,104100,82092,42260,895239,933 !145,003 I21,560 j242,197 I149,327 S
270,678
1.562.032.673.833.583.974.375.375.794.885.497.396.897.808.186.827.807.77
13. 5110. 6413. 6113.859.55
29.6219.41
26.25
3.23
QO
1 Classes grouped to conceal the net income and identity of the taxpayers. 2 Nontaxable; exemptions and dividends exceed the net income. toCD
Digitized for FRASER http://fraser.stlouisfed.org/ Federal Reserve Bank of St. Louis
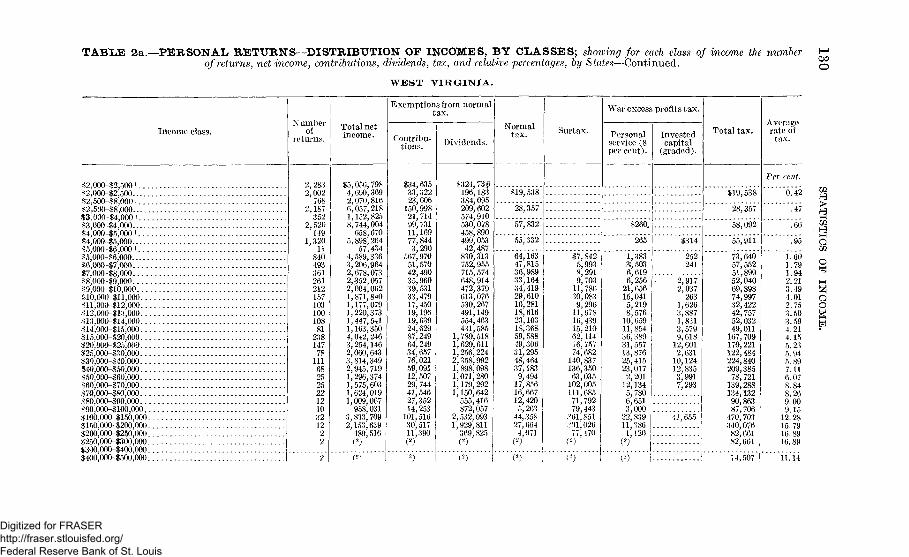
TAB'LE 2a.—PERSONAL RETURNS—DISTRIBUTION OF INCOMES, BY CLASSES; showing for each class of income the numberof returns, net income, contributions, dividends, tax, and relative percentages, by States—Continued.
WEST VIRGINIA.
CO
o
Income class.
$2,000-12,500 i . . .$2;000-$2,500•S2,500-JS8,000'..$2,500-$8,000$3,000-$4,000i...$3,000-$4,000$4,000-15,000 i . . . .$4,000-$5,000-15,000-16,000 i . . .85,000-86,000$6,000-17,000$7,000-18,000«8,000-$9,000$9,000-$10,000$10,000-811,000...$ll,000-$12,000...$12,000-$i:j,000...$13,000-114,000...$14,000-115,000...$15,000-$20,000...$20,000-325,000...$25,000-$30,000...$30,000-140,000...$40,000-$50,000...$50,000-160,000...$60,000-170,000...$70,000-180,000...$80,000-190,000...$90,000-$100,000..$100,000-$150,000.$150,000-1200,000..1200,000-1250,000.$250,000-$300,000.«300,000-$400,000.$400,000-$500,000.
Numberof
returns.
!, 283!,002
7681,187
352?,520
149,320
1184049336126121215710310010881
23814778
111682525221210321222
Total netincome.
$5,056,7984,690,3692,070,8166,057,2181,152,8258,744,004658,670
5,898,26457,434
4,589,3363,206,9642,678,0732,352,0572,004,0621,871,8401,177,0791,220,3731,447,5411,163,3504,042,2463,254,1462,060,6433,814,3492,945,7191,296,3741,575,6031,624,0191,009,067958,031
3,833, 7092,153,639
489,516(2)
Exemptions from normaltax.
Contribu-tions.
$34,63533,32223,006150,99821, 71499,73111,16977, .8443,290
567,97051,57042,49035,96039,53133,47917,45019,19619,63924,62987,24964,24934,65776,02159,09112,50729,74441,54627,35214,253
101,51630,51711,390(2)
Dividends.
$324,736196,183384,095209,602574,910530,078458,890499,05342,487
830,313752,955715,574648,914472,379613,076530,267491,149554,463431,585
1,789,5181,629,6111,256,2242,358,9921,898,0981,071,2801,179,2921,150,642
555,416872,057
2,532,0931,929,811
369,825(*)
Normaltax.
$19,538
28,357
'57," 832
55,332
64,16347,81536,98933,16434,41929,61016,28118,61623,10318,36859,58849,30631,29548,46437,1839,494
17,85616,66712,4205,263
44,35827,6644,071
Surtax.
$7,8425,9938,2919,703
11,78630,0839,296
11,67816,43915,21062,11476, 75774,682
140,837136,35063,035
102,005111,68571,79279,443
361,851301,026
77,470(2)
War excess profits tax.
Personalservice (8per cent).
Investedcapital
(graded).
265 $314
1,3833., 5036,6196,256
21,65615,0415,2198,576
10,659 !11,854 j36,389 [31,557 j13,87625,415 I23,0172,201
12,1345,7806,6513,000
22,83911,386
1,120(2)
252241
2,9172,037
2631,6263,8871,8313,5799,618
12,6012,631
10,12412,8353,9917,293
Total tax.
41,655 !
$19,538
28,357
"58,* 092
55,9ii
73,64057,55251,89952,04069,89874,99732,42242,75752,03249,011
167,709170,221122,484224,840209,385
78,721139,288134,13290,86387,706
470,703340,076
82,661H2,661
Averagerate oftax.
Per cent.
6." 42
.47
74,507
1.601.791.942.213.494.012.753.503.594.214.155.235.945.897.116.078.848.269.009.1512.2815.7916.8916.89
I1—1WH1—1OU
3ao
11.14
Digitized for FRASER http://fraser.stlouisfed.org/ Federal Reserve Bank of St. Louis
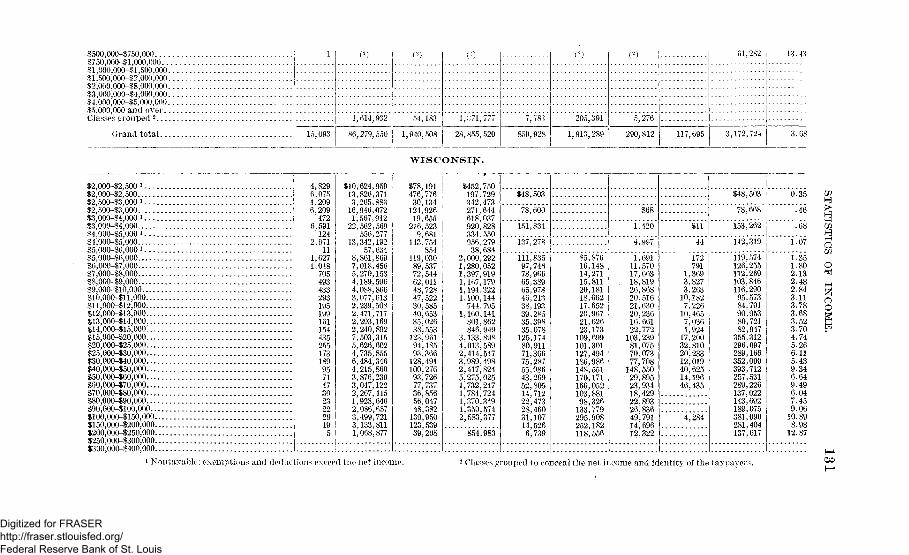
$500,000-^750,000$750,000-41,000,000$1,000,000-11,500,000!$1,«500,000-$2,000,000$2,000,000-48,000,000$3,000,000-14,000,000$4,000,000-15,000,000$5,000,000 and overClasses grouped 2
Grand total
$2,000-12,500 i$2,000-12,500$2,500-$3,000 i$2,500-$3,000S3,000-$4,000 i$3000$4000$4,000-$5.000 i$4,000-$5;000$5,000-86,000 i$5,000-$6,000$6,000-$7,000$7,000-$8,000$8,000-$9,000$9,000-410,000$10,000-$ll,000....$ll,000-$12,000....$12,000-$13,000....$13,000-414,000....$14,000-$15,000....$15,000-$20,000....$20,000-$25,000....$25,000-$30,000....$30,000-$40,000....$40,000-$50,000....$50,000-$60,000....$60,000-170,000....$70,000-$80,000....$80,000-190,000....$90,000-$100,000...$100,000-$150,000..$150,000-1200,000..$200,000-$250,000..$250,000-$300,000..$300,000-$400,000..
15,093
4,8296,0751,2096,209
4726,591
1242,971
111,6271,048
70549343329319519916115443525517318995714730232229
1,614,932
86,279,550
$10,624,95913,826,3713,265,883
16,946,0721,567,912
22,562,569'556,277
13,342,19257,634
8,861,8697,018,4565,270,1534,189,5964,088,8663,077,6132,239,5082,471,7172,293,1692,240,8927,503,3155,626,6024,735,8556,484,3464,215,8603,876,2303,047,1222,267,4151,928,6462,086,6573,499,7213,133,8111,068.877
54,18-3
1,940,508
1,271,777
28,855,520
7,783
850,928
205,391
1,913,289
C1)
5,276
290,812 117,695
61,282 13.43
3,172,724 3.68
W I S C O N S I N .
$78,191476,77630,134 j
124,926 |19,655 I
216,5239,681 !
143.754 :'854 I
119,03089,537 i72,544 i62,011 |48,72847,52230,585 I40,653 I35,02638,553
123,96194,18593,366
128,491100,27693,72677,73736,85656,04748,382
130,950123,53939,208
$48,503
"78*666'
151,831
137,278
1,420
" 4," 997
854,983
111,83597,74678,96665,38965,97846,21338,19339,28535,39835,078125,17480,91171,36675,28755,98643,26952,80514,71222,47328,46031,10714,5266,739
$5,87616,14814,27115,81120,18118,66217,65220,96721,62623,173109,699101,301127,494186,986148,551170,171166,052103,88198,326133,779295,908252,182118,556
1,69111,57017,66318,81926,86820,51621,63020,23616,66122,772103,23981,07570,07377,708148,55029,89523,93418,42922,89326.83649,79114,69612,322
$11
"44
172791
1,3693,8273,263
10,1827,226
10,4657,0361,924
17,20032,81020,23312,01940,62514,19646,435
4,284
$48,503
78,668
'i53,'262 i
142,319
119,574 !126,255112,269103,846116,29095,573 I84,701 I90,953 !80,72182,947355,312 i296,097 I289,166352,000393,712257,531289,226137,022143,692189,075381,090281,404137,617
0.35
""."46
1.07
1-351.802.132.482.843.113.783.683.523.704.745.266.115.439.346.649.496.047.459.06
10.898.98
12.87
hQXJi
3O
og
1 Nontaxable; exemptions and deductions exceed the net income. 2 Classes grouped to conceal the net income and identity of the taxpayers.
Digitized for FRASER http://fraser.stlouisfed.org/ Federal Reserve Bank of St. Louis
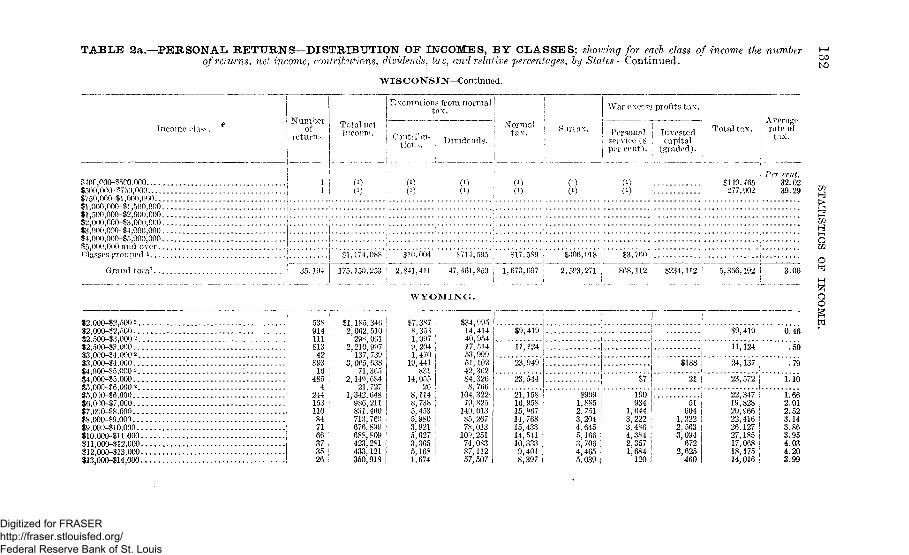
TABLE 2a.—PERSONAL RETURNS—DISTRIBUTION OF INCOMES, BY CLASSES; showing for each class of income the numberof returns, net income, contributions, dividends, tax, and relative percentages, by States—Continued.
WIS C O N S I N - Continued.
Coto
Income rj NumberI ofI returns.
$4or,poo-$oco,ooo$500,000-8750,000$75O,OOO-$l,000,000$l,000,000-$l,500,000...$1,500,000-$2,000,000...$2,000,000-93,000,000...$3,0OO.O0O-$4,000,000...$4,00(1000-$5,000,000...$5,000,000 and overClasses grouped i
Grand total.
$2,000-32,500 2 . .$2,000-$2,500...$2,500-$3,000 2 . .$2,500-83,000...$3,000-54,000 2 . .13,000-14,000...$4,000-^5,000 * . .$4,000-^5,000...85,000-56,000 2 . .$5,000-$6,000...$6,000-17,000...$7,000-^8,000...$8,000-39,000...$9.oo:)-sio,ooo..$ 10,000-$l 1,000.$11,000-112,000.$12,000-$13,000.$13,000-^14,000.
Exemptions from normal itax. ! War excess profits tax. !
Total netinconre.
(00)
tioiK.
0)(0
Dividends.
0)(
Normaltax. Surtax. Personal i Invested
service (8 [ capitalper cent). (graded).
AverageTotal tax. | rate of
! tax.
0)I1)
()0)
)0)
> Per cent.$119,465 32.02277,902 39.29
$1,174,088 $10,004 714,595 $17,589 • $406,018 I $3,760 ;
175.150,253 ! 2,841,411 47,461,859 j 1,670,697 : 2,5P3,271 > 868,112 i $234,112 5,366,192 j
WYOMING.
53891411181342
89316 !
485 !4 :
244 !
153 i110 !84 '71 '66 :
37 I35 I26 i
$1,185,346 I2,062,51029S, 061
2,210,997137, 739
3, 0R5, 63871,365
2,149,68421,727
1,342,648986,211831,460713, 769676,899688,809423,281433,121350,918
$7,3878,3531,9979, 2041,47019,441
831 |14,055
26 !8,114 i8,738 i5,453 !5,980 I3,921 !5,027 |3,3655,1681.674
$34,99514,41440,95417,51453,99951,10242,36284,3268, 766
104,32279,825140, 01385,26778,013109,25174,08387,11257,507
3.06
$9,419
11,124
23,949
23,544
21,15816,95815, 96714,76815,43314,54110,3339,4018,397
iI
1! ^7
$9991,8852. 7513,2044,6455,1663,7064,4655,039
190934
1,6443,2223,4864,3842,3571,684120
$188
21
51604
1,2222,5633,094
6722,625460
$9,419 0.46
11,124 .50
24,137 ; .79
23,572 | 1.10
22,347 ! 1.6619,828 ; 2.0120,966 i 2.5222,416 i 3.1426,127! 3.8627.185 i 3.9517,068 i 4.0318,175 1 4.2014,016 ! 3.99
Ul
I iQUl
3oo
Digitized for FRASER http://fraser.stlouisfed.org/ Federal Reserve Bank of St. Louis
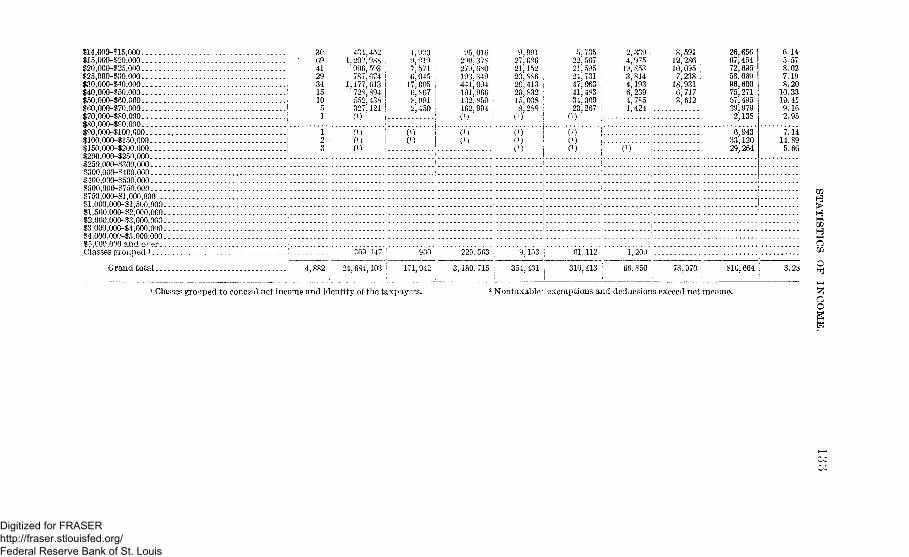
114,000-1-15,000$15,000-820,000$20,000-125,000$25,000-830,000$30,000-$40,000.$40,000-8 50,000$50,000-160,000$60,000-170,000$70,000-180,000$80,000-890,000$90,000-1100,000$100,000-8150,000$150,000-1200,000$200,000-1250,000$250,000-.S300,000$300,000-8400,000$400,000-8500,000$500,000-8750,000$750,000-81,000,000$1,000,000-81,500,000$1,500,000-82,000,000$2.000,000-83.000,000$3,000,000-84',000,000$4,000.000-$5.000.000
30694129341510
434,452 ;1,209,988 !
906,593 i787,674 i
1,177,613 i728,894 |552,438 i327,121 !C 1) ' i -
1,9909,919 I7,571 i6,045 |
17,005 |6,867 I8,991 !2,450 j
95,016290;378279,680193,349441,094191,966132,850162,994 :
(i)
9,99127,686 I21,152;20,886 i26,413 j20,832 :15,038 !8,288 !
5,73522,507 :21J595 i24,731 I47,063 ;41,48334,060 j20,267 i
2,3394,975 !
19,8533,8144,1936,2394,785 I1,424 ;
8,59112,28610,0957,238 ;
18,9316,7173,612
(C1)
C1)C1) 0)
i 1 )C1)
$5,000,000 and over.Classes grouped i , ,
26,65667,45472,69556,66996,60075,27157,49529,9792,138
6,94333,12029,264
6.145.578.027.198.2010.3310.419.162.95
7. i414.895.66
909,147 900 iJ
229,563
Grand total. 4,882 24,684,103 | 171,942 3, ISO, 715 | 354,431
01,112 ; 1,200
310,413 j 66,850 810,664 i 3.28
1 Classes grouped to conceal net income and identity of the taxpayers. 2 Nontaxable: exemptions and ded actions exceed net income. 3Og
Digitized for FRASER http://fraser.stlouisfed.org/ Federal Reserve Bank of St. Louis