inclusive growth: coalitions needed
DESCRIPTION
Presented by Roger van den Brink, World Bank Group Philippines lead economist and program manager, at the Kusog Mindanaw "Eminent Mindanawon Leaders Meeting", Marco Polo Davao, 5 October 2015TRANSCRIPT
Inclusive Growth:
Coalitions Needed
Rogier van den Brink Lead Economist and Program Leader
World Bank Group, Philippines
Eminent Mindanawon Leaders Meeting
October 5, 2015
Marco Polo Hotel, Davao
Overview
• Inclusive growth: more than growth, need to tackle poverty and
inequality
• No short cuts to getting structural transformation from agriculture
to manufacturing to services right, with a special role for
agriculture
• Need inclusive economic institutions, competition
• Need good governance: accountability between citizens,
politicians and civil servants
• Reforms to create inclusive growth are difficult: good leaders not
enough, need coalitions
• Progressive Era in the US: inspiration?
2
Inclusive growth: What is it? It is more than growth, but it
does start with growth, and growth
needs macroeconomic stability
Inclusive growth challenge: More than growth
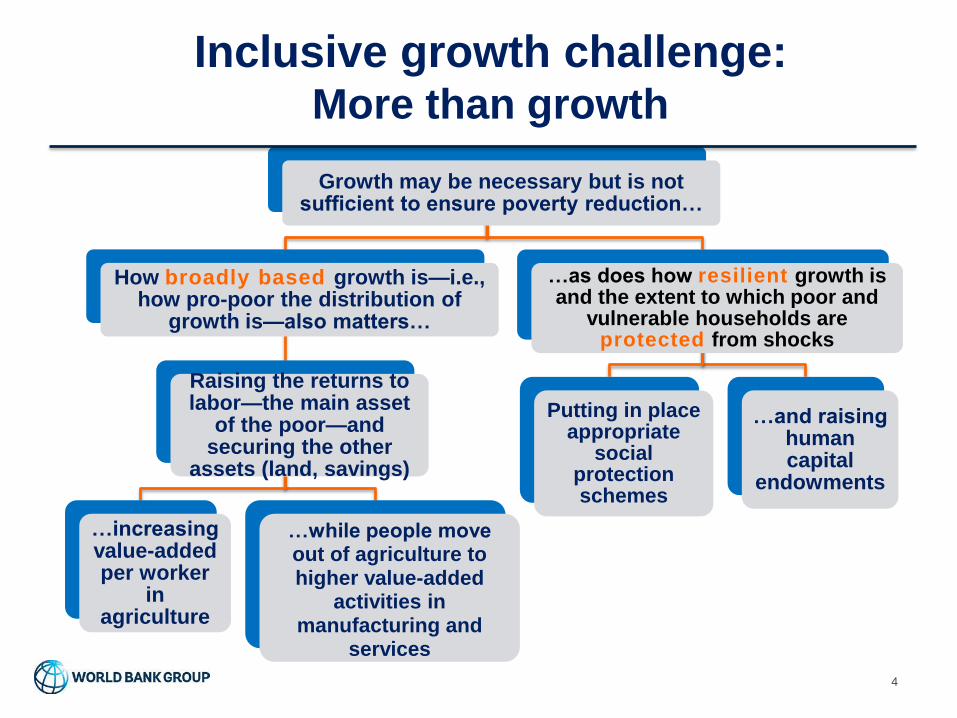
Growth may be necessary but is not sufficient to ensure poverty reduction…
How broadly based growth is—i.e., how pro-poor the distribution of
growth is—also matters…
Raising the returns to labor—the main asset
of the poor—and securing the other
assets (land, savings)
…increasing value-added per worker
in agriculture
…while people move out of agriculture to higher value-added
activities in manufacturing and
services
…as does how resilient growth is and the extent to which poor and
vulnerable households are protected from shocks
Putting in place appropriate
social protection schemes
…and raising human capital
endowments
4
5
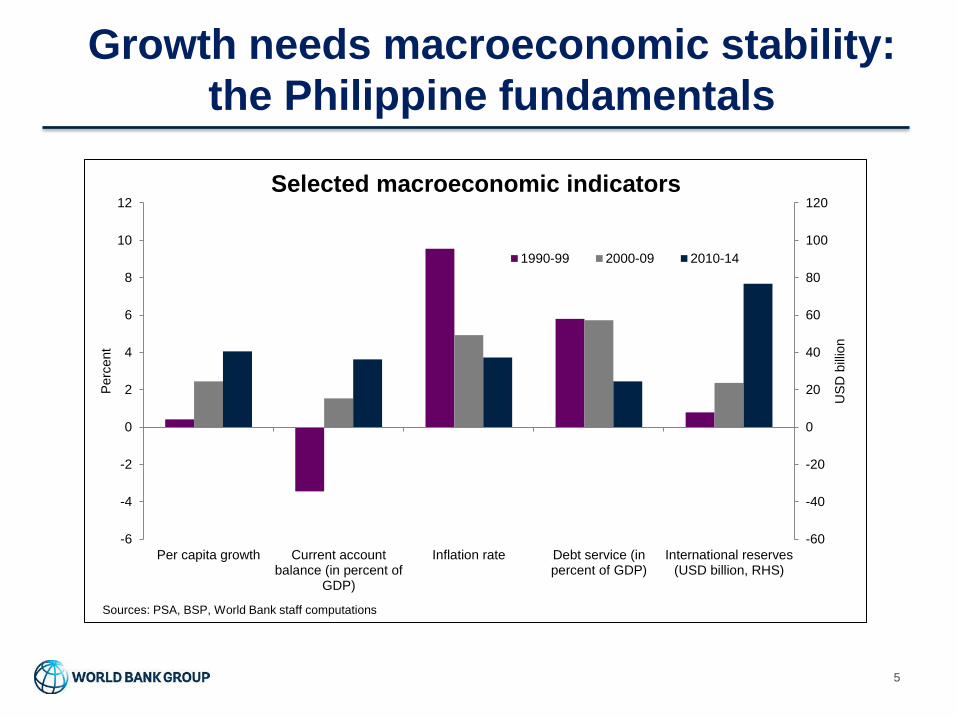
Growth needs macroeconomic stability:
the Philippine fundamentals
-60
-40
-20
0
20
40
60
80
100
120
-6
-4
-2
0
2
4
6
8
10
12
Per capita growth Current accountbalance (in percent of
GDP)
Inflation rate Debt service (inpercent of GDP)
International reserves(USD billion, RHS)
US
D b
illio
n
Perc
ent
Selected macroeconomic indicators
1990-99 2000-09 2010-14
Sources: PSA, BSP, World Bank staff computations
Inclusive Growth: inequality is the new growth agenda
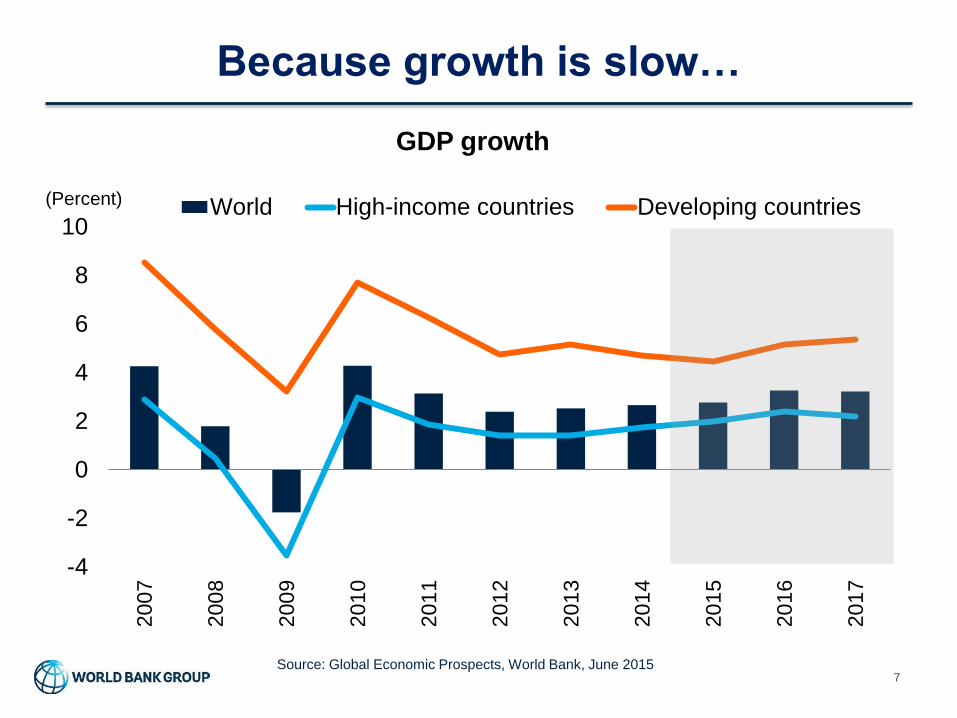
Because growth is slow…
7
-4
-2
0
2
4
6
8
10
200
7
200
8
200
9
201
0
201
1
201
2
201
3
201
4
201
5
201
6
201
7
World High-income countries Developing countries(Percent)
GDP growth
Source: Global Economic Prospects, World Bank, June 2015
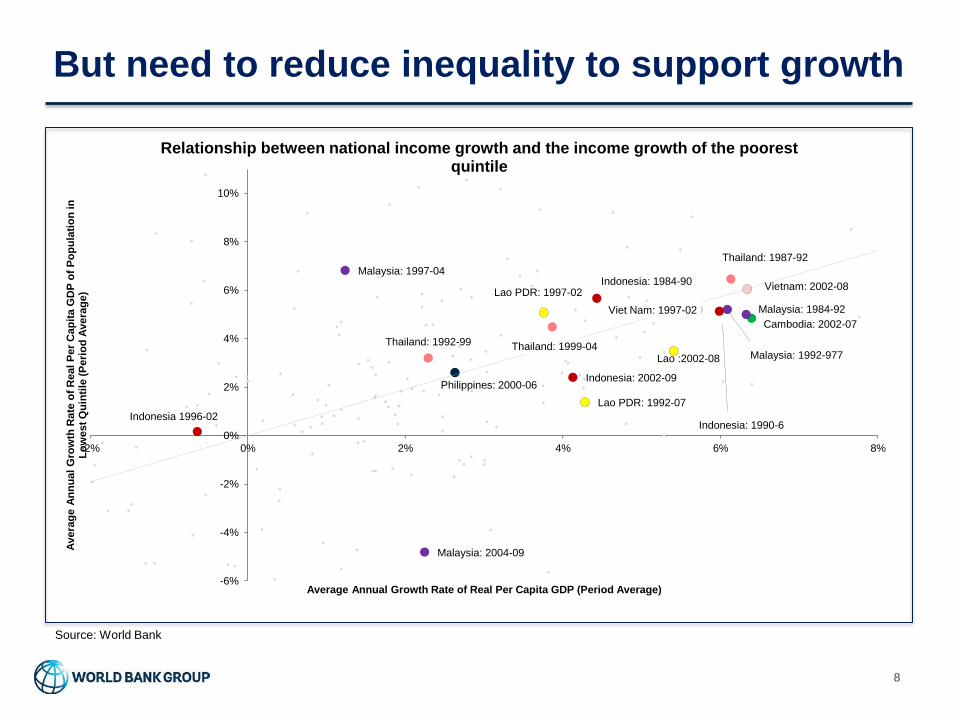
But need to reduce inequality to support growth
8
Philippines: 2000-06
Cambodia: 2002-07
Indonesia: 1984-90
Indonesia: 1990-6 Indonesia 1996-02
Indonesia: 2002-09
Lao PDR: 1992-07
Lao PDR: 1997-02
Lao :2002-08 Malaysia: 1992-977
Malaysia: 1984-92
Malaysia: 2004-09
Malaysia: 1997-04
Thailand: 1987-92
Thailand: 1992-99 Thailand: 1999-04
Viet Nam: 1997-02
Vietnam: 2002-08
-6%
-4%
-2%
0%
2%
4%
6%
8%
10%
-2% 0% 2% 4% 6% 8%
Avera
ge
An
nu
al
Gro
wth
Rate
of
Real
Per
Cap
ita G
DP
of
Po
pu
lati
on
in
L
ow
est
Qu
inti
le (
Peri
od
Avera
ge
)
Average Annual Growth Rate of Real Per Capita GDP (Period Average)
Relationship between national income growth and the income growth of the poorest quintile
Source: World Bank
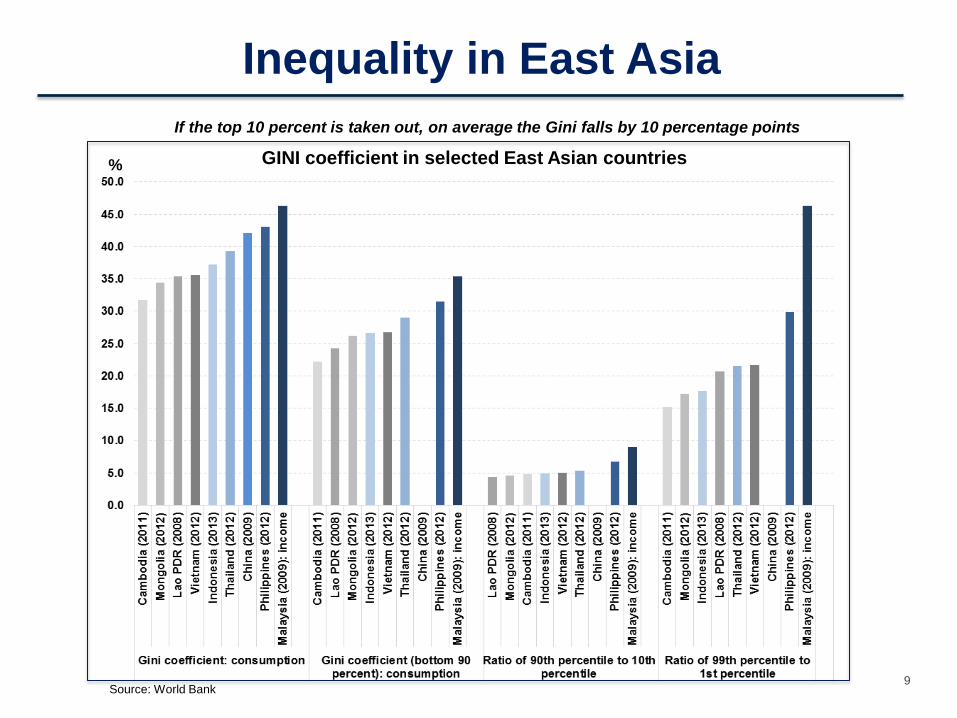
Inequality in East Asia
9
GINI coefficient in selected East Asian countries %
If the top 10 percent is taken out, on average the Gini falls by 10 percentage points
Source: World Bank
Inclusive Growth: the special role of agriculture
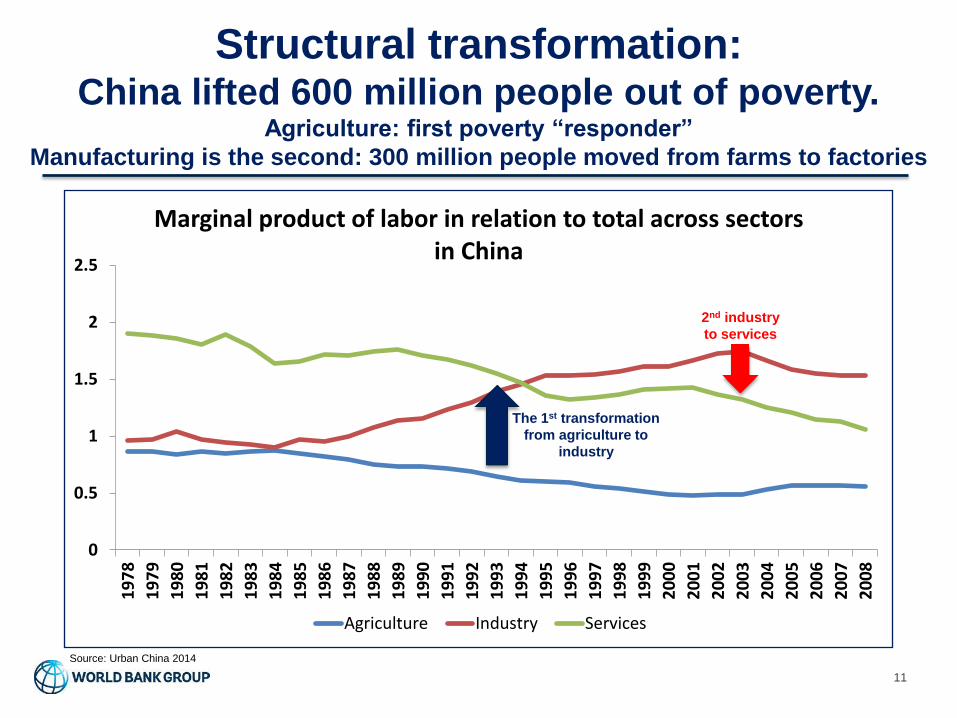
Structural transformation: China lifted 600 million people out of poverty.
Agriculture: first poverty “responder”
Manufacturing is the second: 300 million people moved from farms to factories
Source: Urban China 2014
0
0.5
1
1.5
2
2.5
19
78
19
79
19
80
19
81
19
82
19
83
19
84
19
85
19
86
19
87
19
88
19
89
19
90
19
91
19
92
19
93
19
94
19
95
19
96
19
97
19
98
19
99
20
00
20
01
20
02
20
03
20
04
20
05
20
06
20
07
20
08
Marginal product of labor in relation to total across sectors in China
Agriculture Industry Services
2nd industry
to services
The 1st transformation
from agriculture to
industry
11
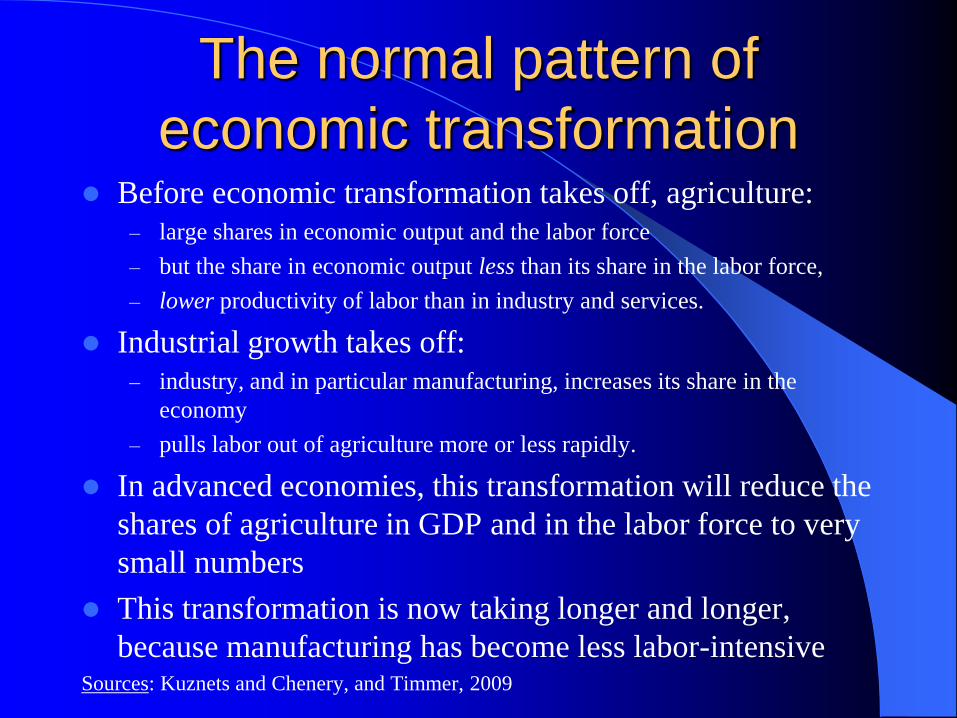
The normal pattern of
economic transformation Before economic transformation takes off, agriculture:
– large shares in economic output and the labor force
– but the share in economic output less than its share in the labor force,
– lower productivity of labor than in industry and services.
Industrial growth takes off:
– industry, and in particular manufacturing, increases its share in the
economy
– pulls labor out of agriculture more or less rapidly.
In advanced economies, this transformation will reduce the
shares of agriculture in GDP and in the labor force to very
small numbers
This transformation is now taking longer and longer,
because manufacturing has become less labor-intensive Sources: Kuznets and Chenery, and Timmer, 2009
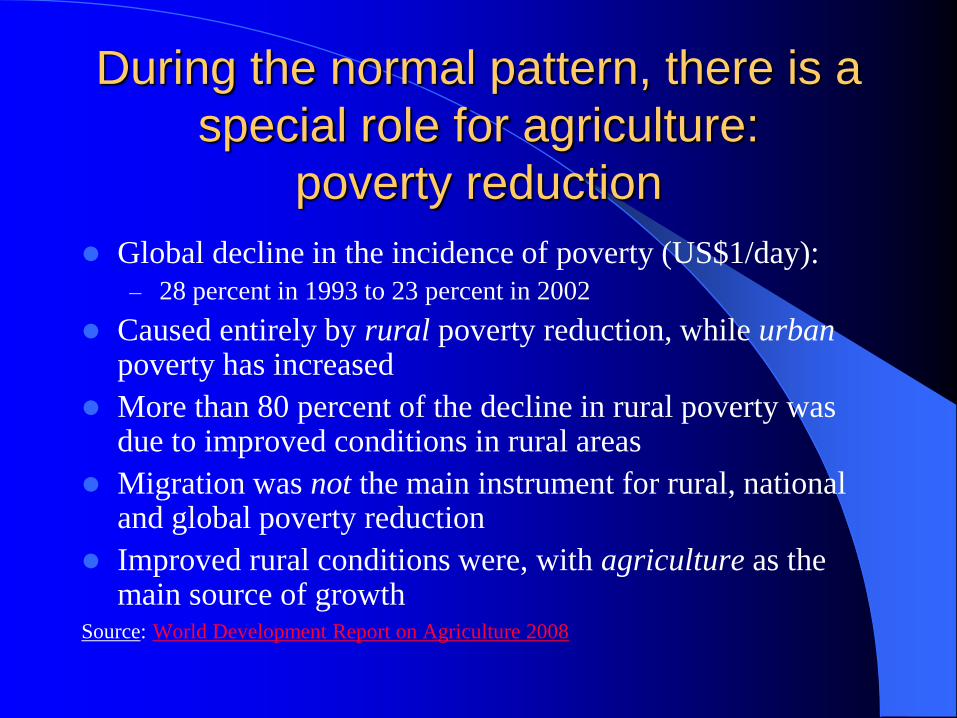
During the normal pattern, there is a
special role for agriculture:
poverty reduction
Global decline in the incidence of poverty (US$1/day):
– 28 percent in 1993 to 23 percent in 2002
Caused entirely by rural poverty reduction, while urban poverty has increased
More than 80 percent of the decline in rural poverty was due to improved conditions in rural areas
Migration was not the main instrument for rural, national and global poverty reduction
Improved rural conditions were, with agriculture as the main source of growth
Source: World Development Report on Agriculture 2008
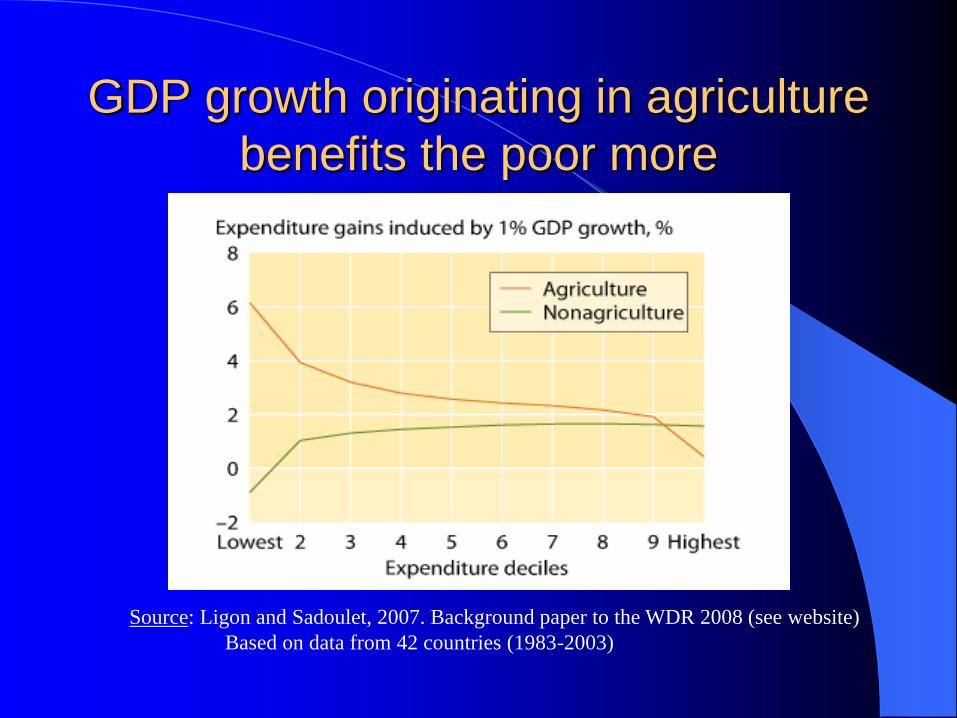
GDP growth originating in agriculture
benefits the poor more
Source: Ligon and Sadoulet, 2007. Background paper to the WDR 2008 (see website)
Based on data from 42 countries (1983-2003)
How does agriculture reduce
poverty economically? By raising agricultural profits and labor income
By raising non-farm profits and labor income via multipliers: – Agricultural growth multipliers generally vary from around 1.5 to 2.0
– And consumption linkages even larger than production linkages
By causing lower prices of non-tradable foods: – Consumption basket of the poor gets cheaper
– Also leads to lower real wages in other sectors, which then grow faster
And under tightening labor markets and higher unskilled wages, economy-wide, by effectively setting the minimum wage for the entire economy
– the agricultural minimum wage is often the reservation wage for unskilled laborers
Sources: Johnston and Mellor (1961), Delgado and Alfano (1994), WDR 2008, Delgado et al.
(1998), Block and Timmer (1994)
Family farms: efficient in production…
and in creating inclusive institutions
Family farms with little hired labor benefit from the superior incentives of family members to work hard, save, and invest—this makes them efficient
However, family farms are at a disadvantage in access to markets, credit, technology, but these disadvantages rarely offset the advantages from better incentives
Inverse farm size – productivity relation literature demonstrates this effect
But there is more…also a link from family farms and their property rights to land to institutions which generate broad-based economic growth
Take rural land distribution and its impact on overall economic growth
Sources: On superior efficiency of family farms: large body of literature, see Berry and Cline, Stiglitz, Hazell.
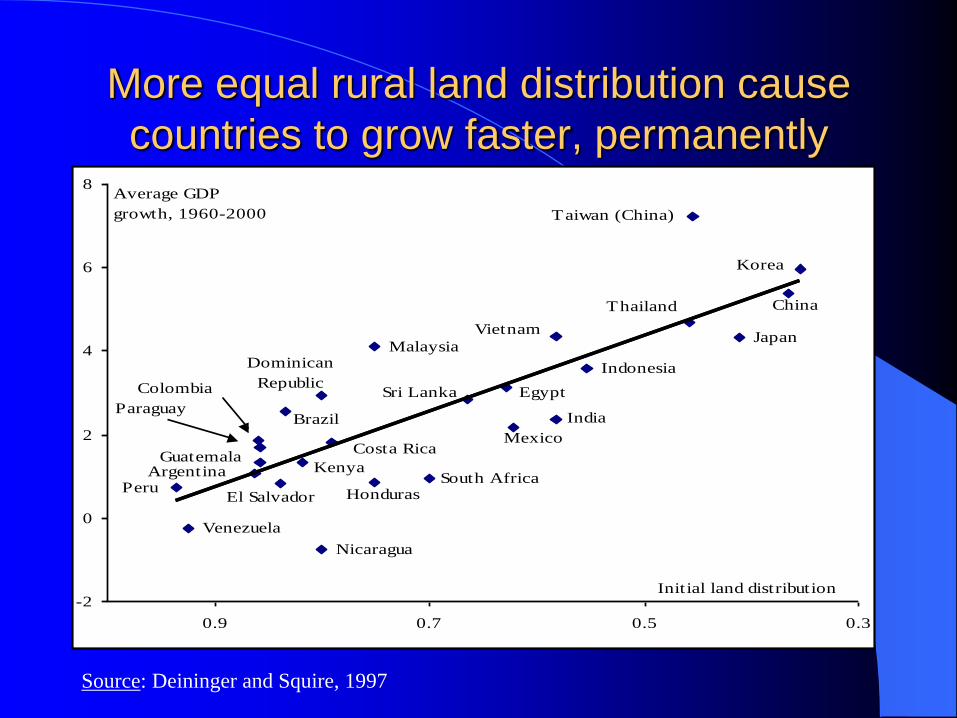
More equal rural land distribution cause
countries to grow faster, permanently
Guatemala
El Salvador
Argentina
Honduras
Dominican
RepublicSri Lanka
Vietnam
Colombia
Costa Rica
Paraguay
Kenya
Brazil
Thailand
Japan
Taiwan (China)
China
Korea
Malaysia
Indonesia
Egypt
India
Mexico
South AfricaPeru
Venezuela
Nicaragua
-2
0
2
4
6
8
0.30.50.70.9
Initial land distribution
Average GDP
growth, 1960-2000
Source: Deininger and Squire, 1997
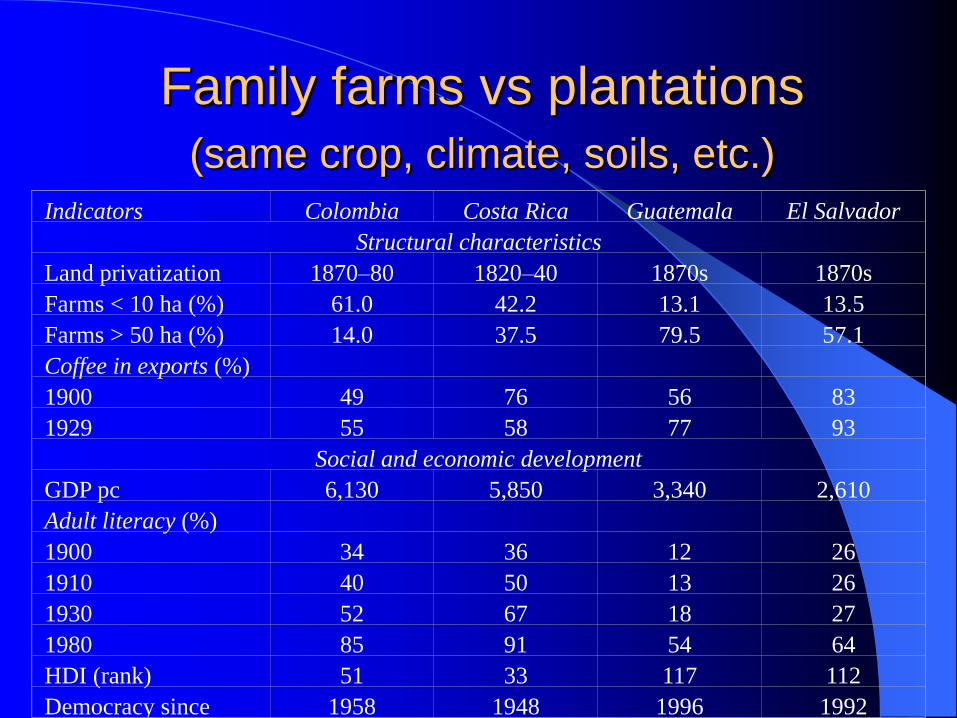
Family farms vs plantations
(same crop, climate, soils, etc.)
Indicators
Colombia
Costa Rica
Guatemala
El Salvador
Structural characteristics
Land privatization
1870–80
1820–40
1870s
1870s
Farms < 10 ha (%)
61.0
42.2
13.1
13.5
Farms > 50 ha (%)
14.0
37.5
79.5
57.1
Coffee in exports (%)
1900
49
76
56
83
1929
55
58
77
93
Social and economic development
GDP pc
6,130
5,850
3,340
2,610
Adult literacy (%)
1900
34
36
12
26
1910
40
50
13
26
1930
52
67
18
27
1980
85
91
54
64
HDI (rank)
51
33
117
112
Democracy since
1958
1948
1996
1992
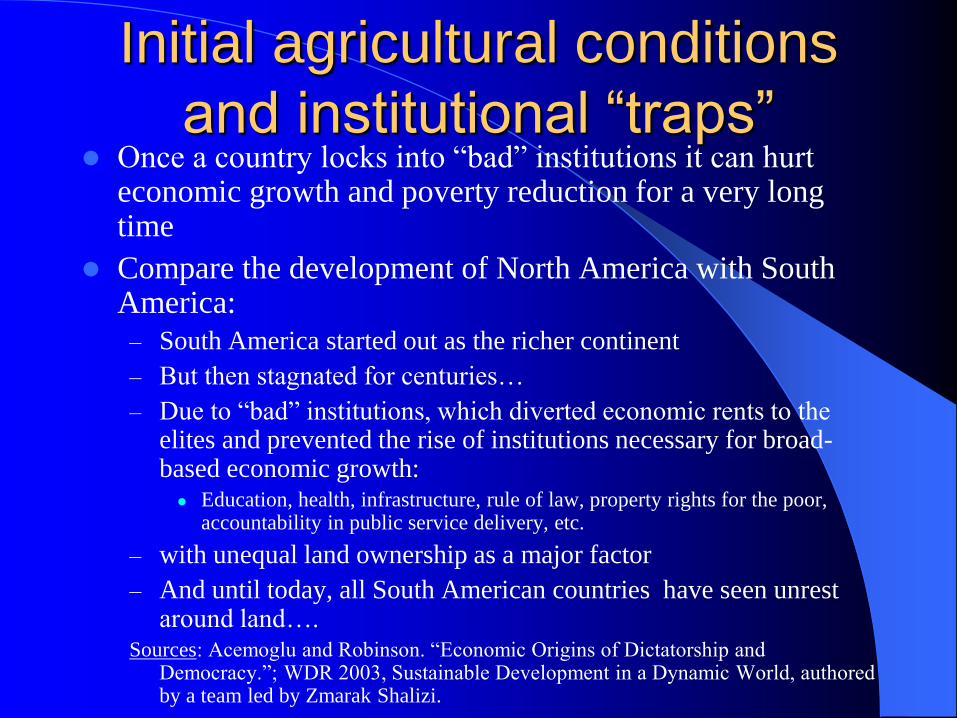
Initial agricultural conditions
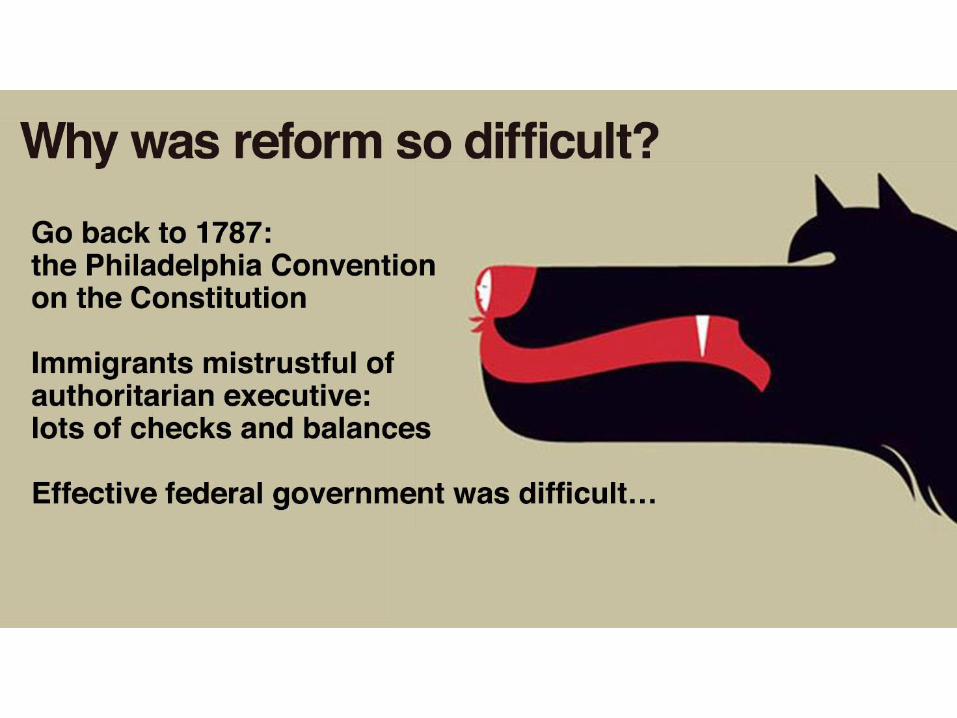
and institutional “traps” Once a country locks into “bad” institutions it can hurt
economic growth and poverty reduction for a very long time
Compare the development of North America with South America:
– South America started out as the richer continent
– But then stagnated for centuries…
– Due to “bad” institutions, which diverted economic rents to the elites and prevented the rise of institutions necessary for broad-based economic growth:
Education, health, infrastructure, rule of law, property rights for the poor, accountability in public service delivery, etc.
– with unequal land ownership as a major factor
– And until today, all South American countries have seen unrest around land….
Sources: Acemoglu and Robinson. “Economic Origins of Dictatorship and Democracy.”; WDR 2003, Sustainable Development in a Dynamic World, authored by a team led by Zmarak Shalizi.
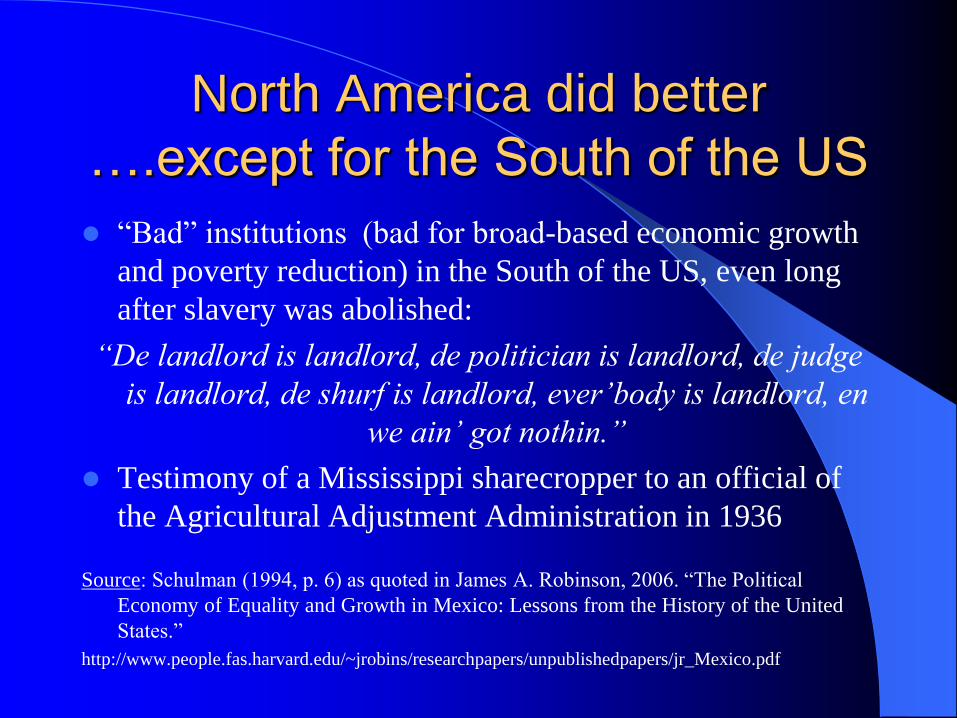
North America did better
….except for the South of the US
“Bad” institutions (bad for broad-based economic growth
and poverty reduction) in the South of the US, even long
after slavery was abolished:
“De landlord is landlord, de politician is landlord, de judge
is landlord, de shurf is landlord, ever’body is landlord, en
we ain’ got nothin.”
Testimony of a Mississippi sharecropper to an official of
the Agricultural Adjustment Administration in 1936
Source: Schulman (1994, p. 6) as quoted in James A. Robinson, 2006. “The Political
Economy of Equality and Growth in Mexico: Lessons from the History of the United
States.”
http://www.people.fas.harvard.edu/~jrobins/researchpapers/unpublishedpapers/jr_Mexico.pdf
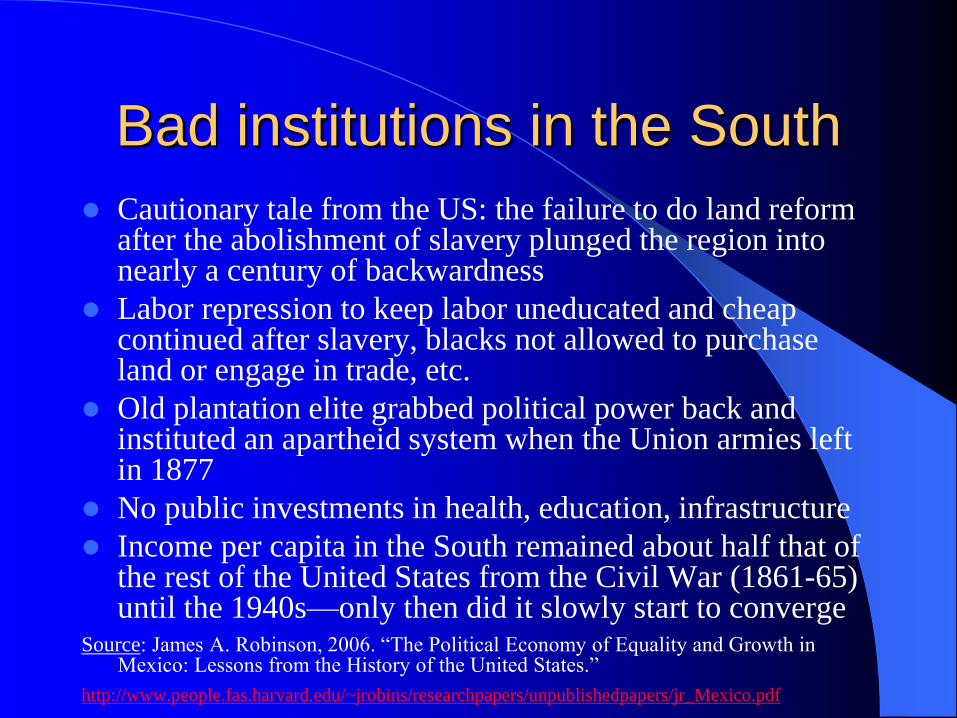
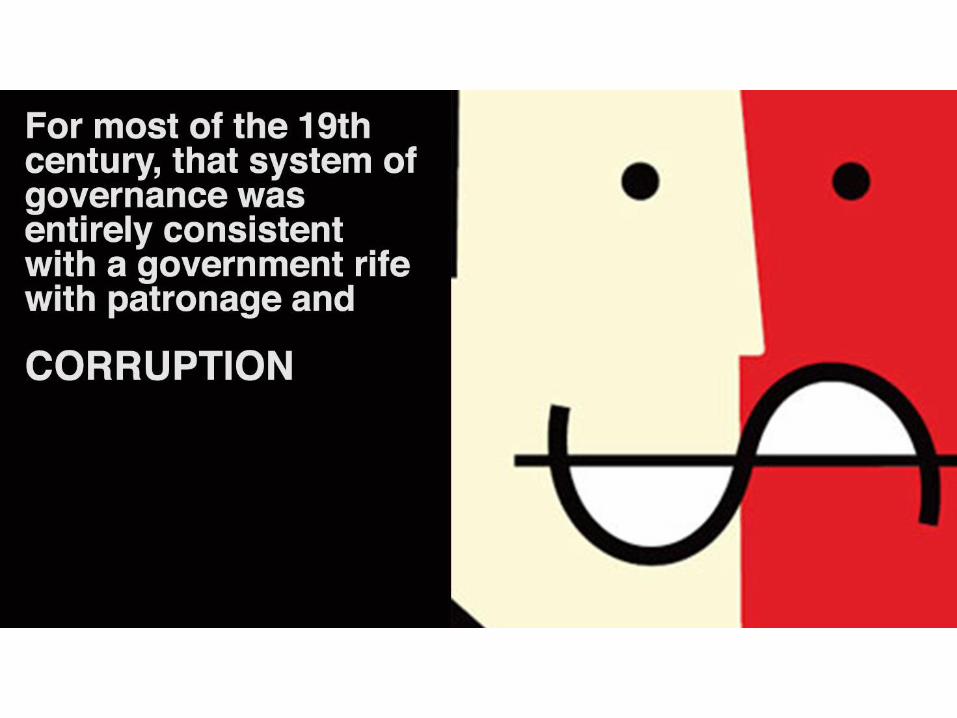
Bad institutions in the South
Cautionary tale from the US: the failure to do land reform after the abolishment of slavery plunged the region into nearly a century of backwardness
Labor repression to keep labor uneducated and cheap continued after slavery, blacks not allowed to purchase land or engage in trade, etc.
Old plantation elite grabbed political power back and instituted an apartheid system when the Union armies left in 1877
No public investments in health, education, infrastructure
Income per capita in the South remained about half that of the rest of the United States from the Civil War (1861-65) until the 1940s—only then did it slowly start to converge
Source: James A. Robinson, 2006. “The Political Economy of Equality and Growth in Mexico: Lessons from the History of the United States.”
http://www.people.fas.harvard.edu/~jrobins/researchpapers/unpublishedpapers/jr_Mexico.pdf
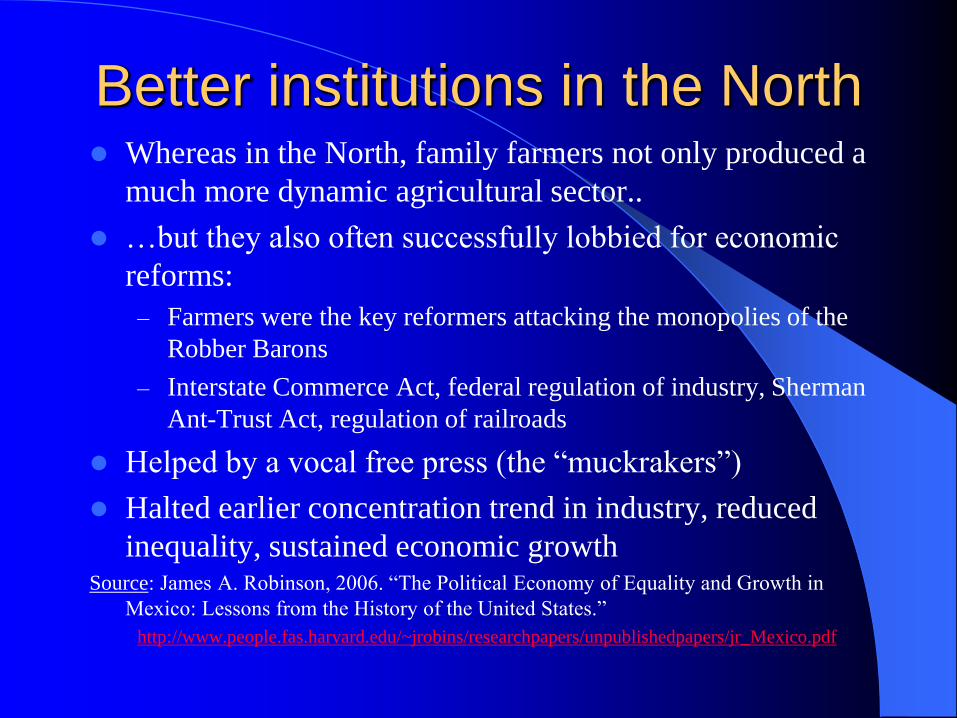
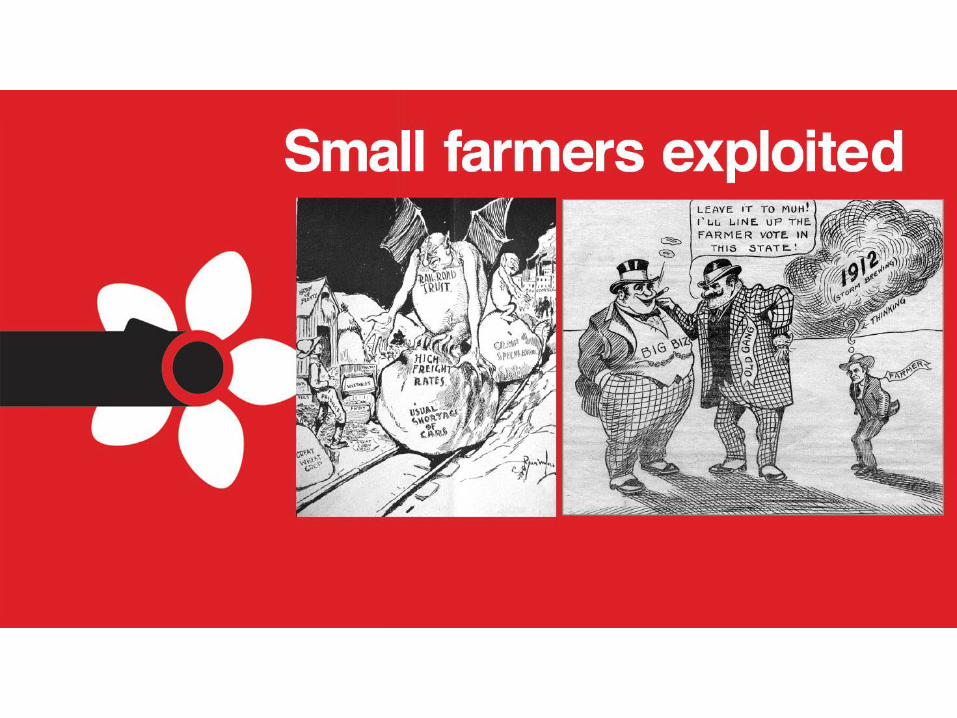
Better institutions in the North Whereas in the North, family farmers not only produced a
much more dynamic agricultural sector..
…but they also often successfully lobbied for economic
reforms:
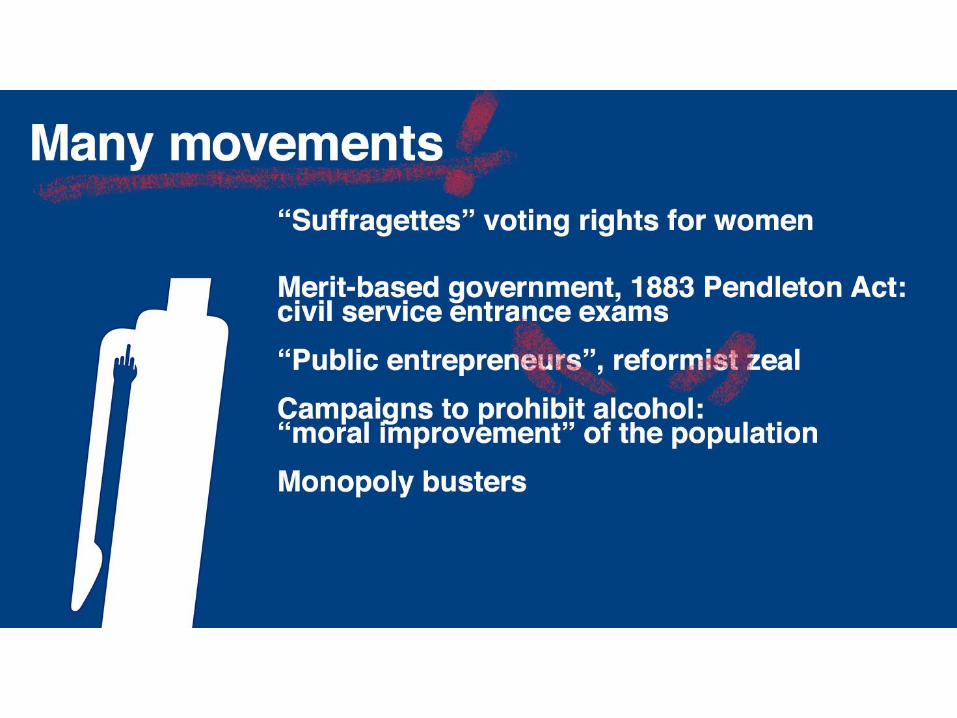
– Farmers were the key reformers attacking the monopolies of the
Robber Barons
– Interstate Commerce Act, federal regulation of industry, Sherman
Ant-Trust Act, regulation of railroads
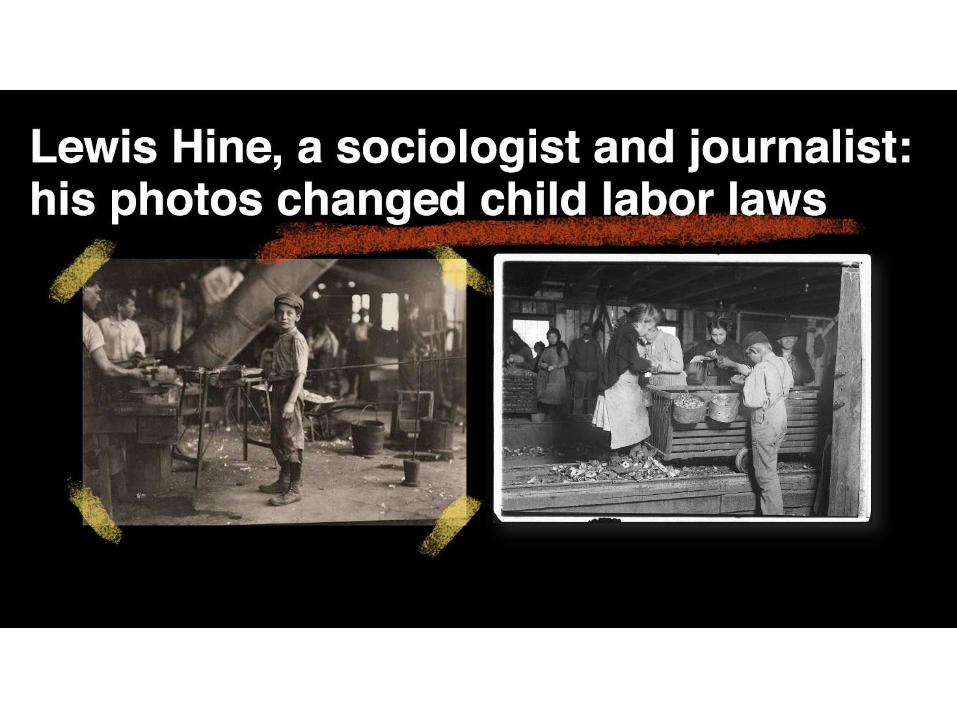
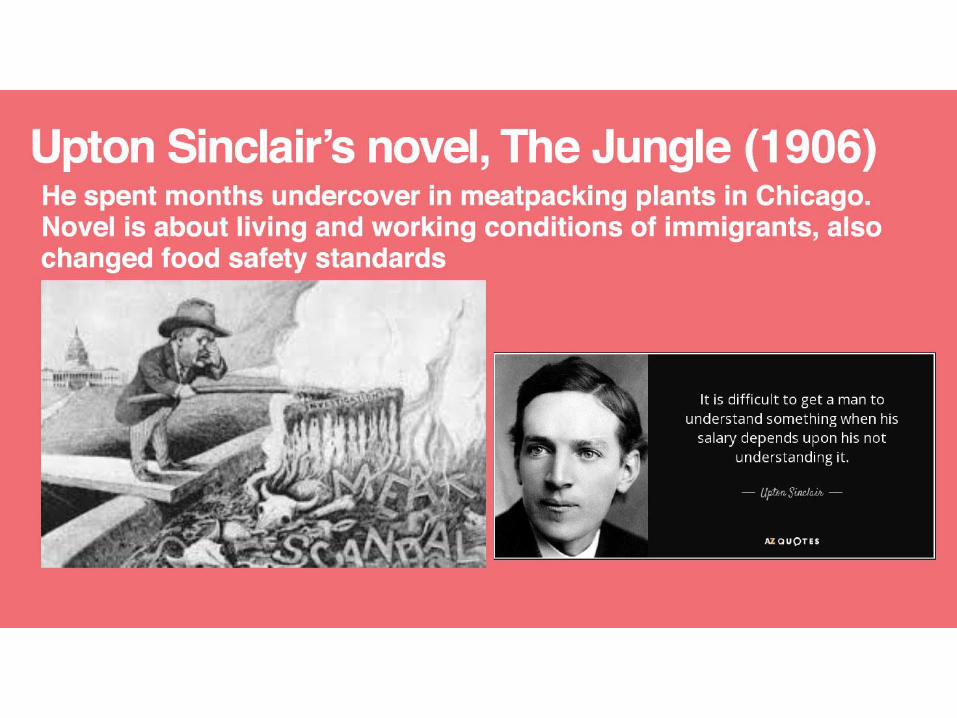
Helped by a vocal free press (the “muckrakers”)
Halted earlier concentration trend in industry, reduced
inequality, sustained economic growth Source: James A. Robinson, 2006. “The Political Economy of Equality and Growth in
Mexico: Lessons from the History of the United States.”
http://www.people.fas.harvard.edu/~jrobins/researchpapers/unpublishedpapers/jr_Mexico.pdf
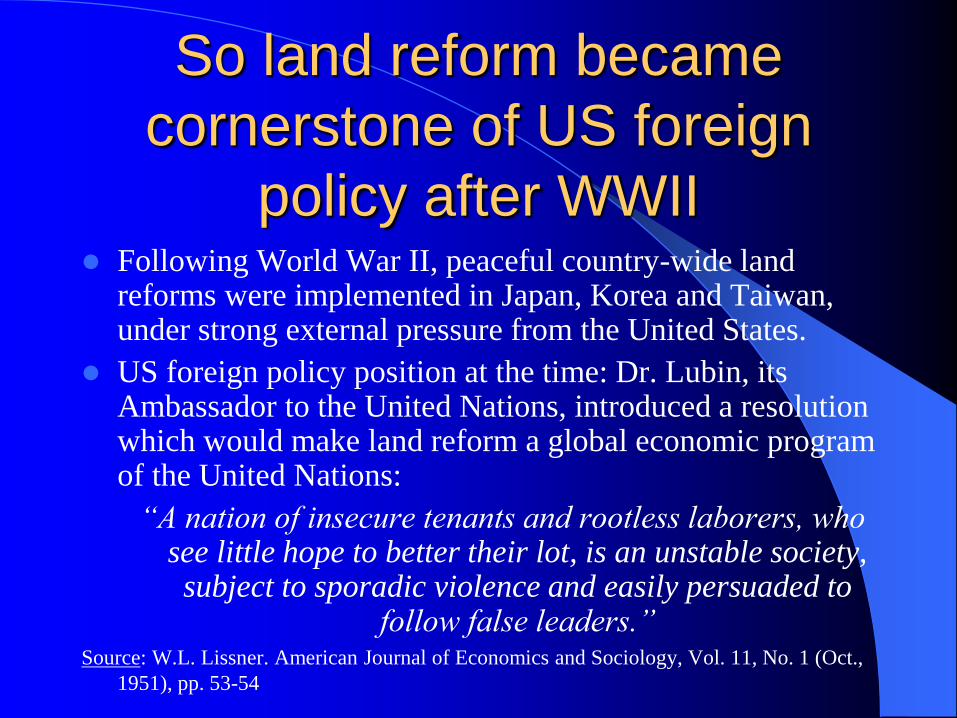
So land reform became
cornerstone of US foreign
policy after WWII Following World War II, peaceful country-wide land
reforms were implemented in Japan, Korea and Taiwan, under strong external pressure from the United States.
US foreign policy position at the time: Dr. Lubin, its Ambassador to the United Nations, introduced a resolution which would make land reform a global economic program of the United Nations:
“A nation of insecure tenants and rootless laborers, who see little hope to better their lot, is an unstable society, subject to sporadic violence and easily persuaded to
follow false leaders.” Source: W.L. Lissner. American Journal of Economics and Sociology, Vol. 11, No. 1 (Oct.,
1951), pp. 53-54
Inclusive Growth: inclusive economic institutions,
competition
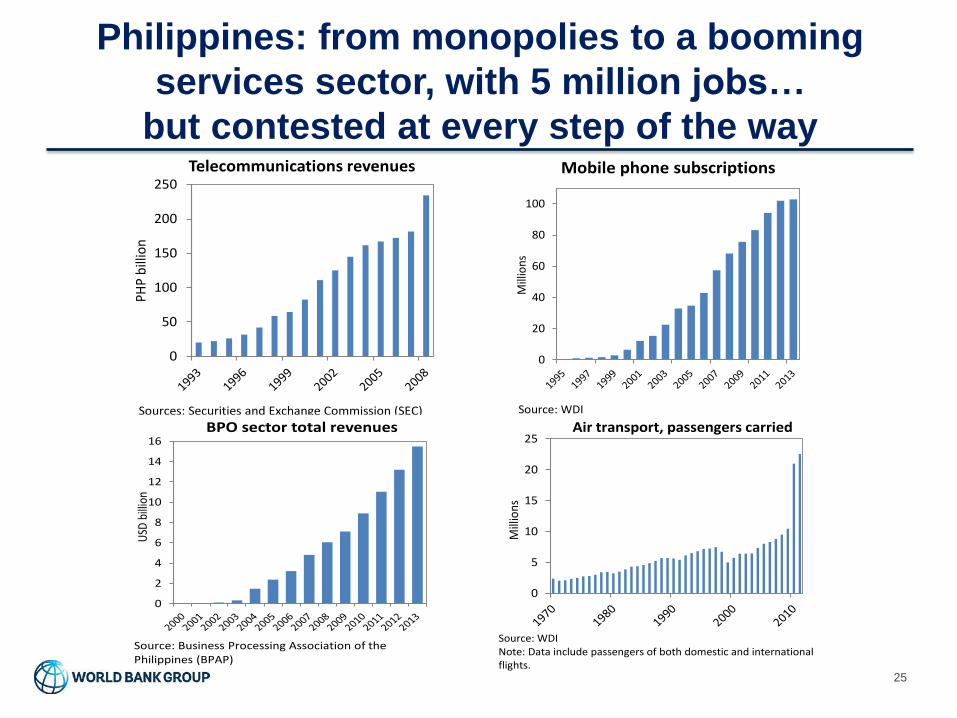
Philippines: from monopolies to a booming
services sector, with 5 million jobs…
but contested at every step of the way
0
50
100
150
200
250
PHP
bill
ion
Telecommunications revenues
Sources: Securities and Exchange Commission (SEC)
0
2
4
6
8
10
12
14
16
USD
bill
ion
BPO sector total revenues
Source: Business Processing Association of the Philippines (BPAP)
0
5
10
15
20
25
Mill
ions
Air transport, passengers carried
Source: WDINote: Data include passengers of both domestic and international flights.
0
20
40
60
80
100
Mill
ions
Mobile phone subscriptions
Source: WDI
ndicators
25
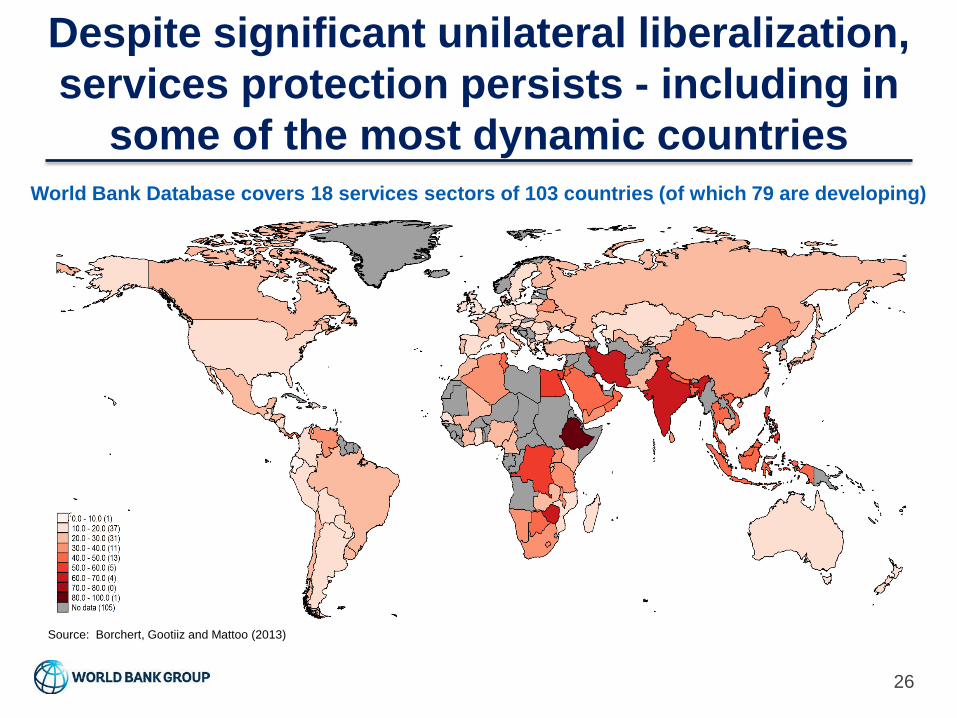
Despite significant unilateral liberalization,
services protection persists - including in
some of the most dynamic countries
26
World Bank Database covers 18 services sectors of 103 countries (of which 79 are developing)
Source: Borchert, Gootiiz and Mattoo (2013)
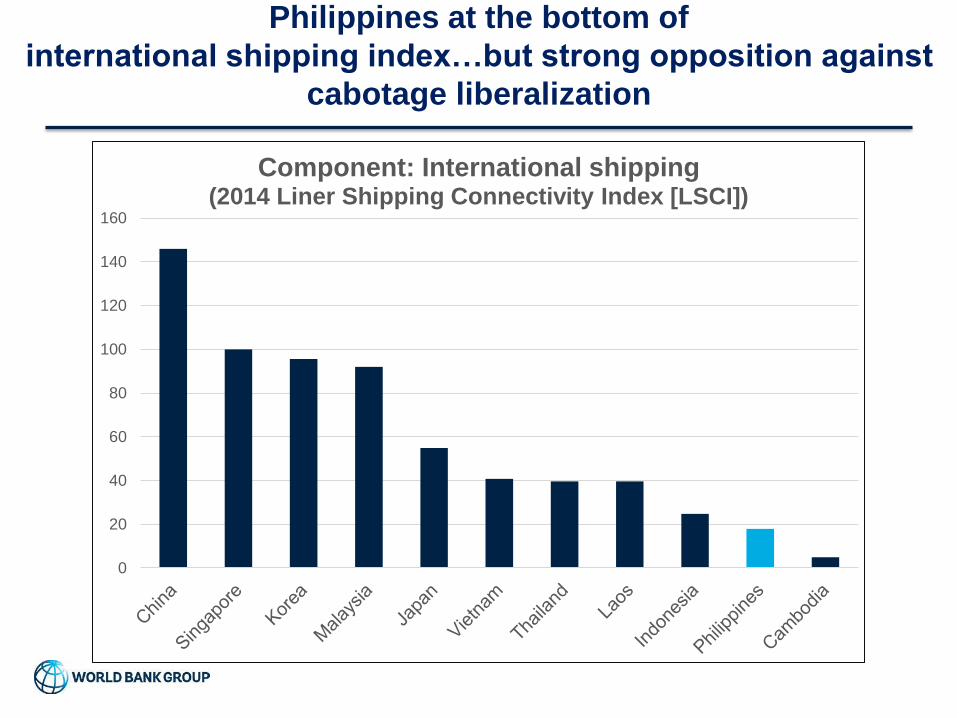
Philippines at the bottom of
international shipping index…but strong opposition against
cabotage liberalization
0
20
40
60
80
100
120
140
160
Component: International shipping (2014 Liner Shipping Connectivity Index [LSCI])
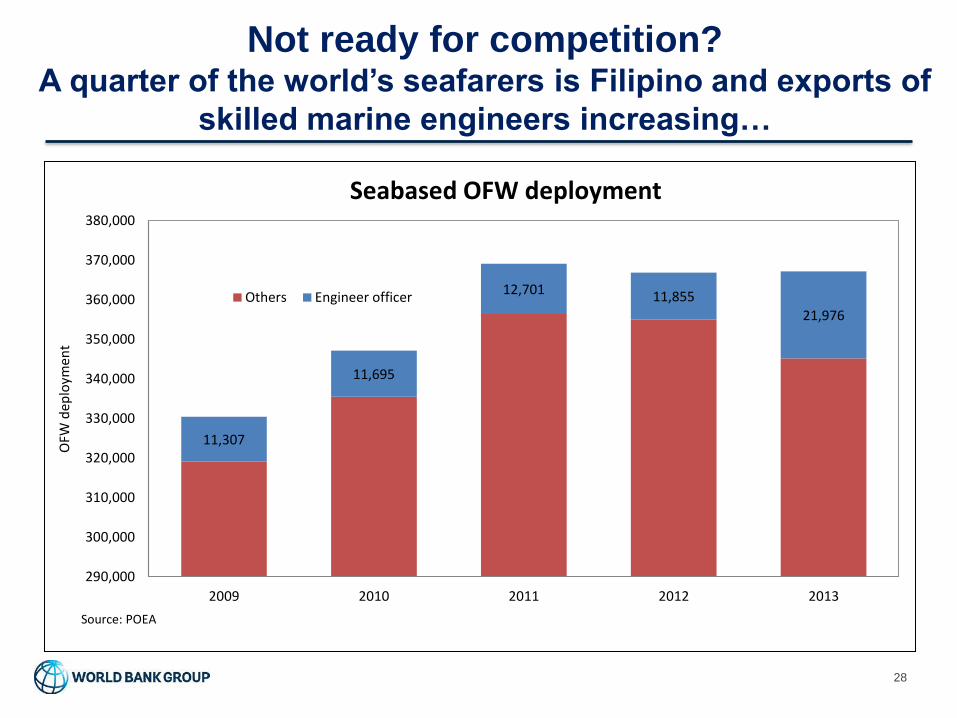
Not ready for competition? A quarter of the world’s seafarers is Filipino and exports of
skilled marine engineers increasing…
28
11,307
11,695
12,701 11,855
21,976
290,000
300,000
310,000
320,000
330,000
340,000
350,000
360,000
370,000
380,000
2009 2010 2011 2012 2013
OFW
dep
loym
ent
Seabased OFW deployment
Others Engineer officer
Source: POEA
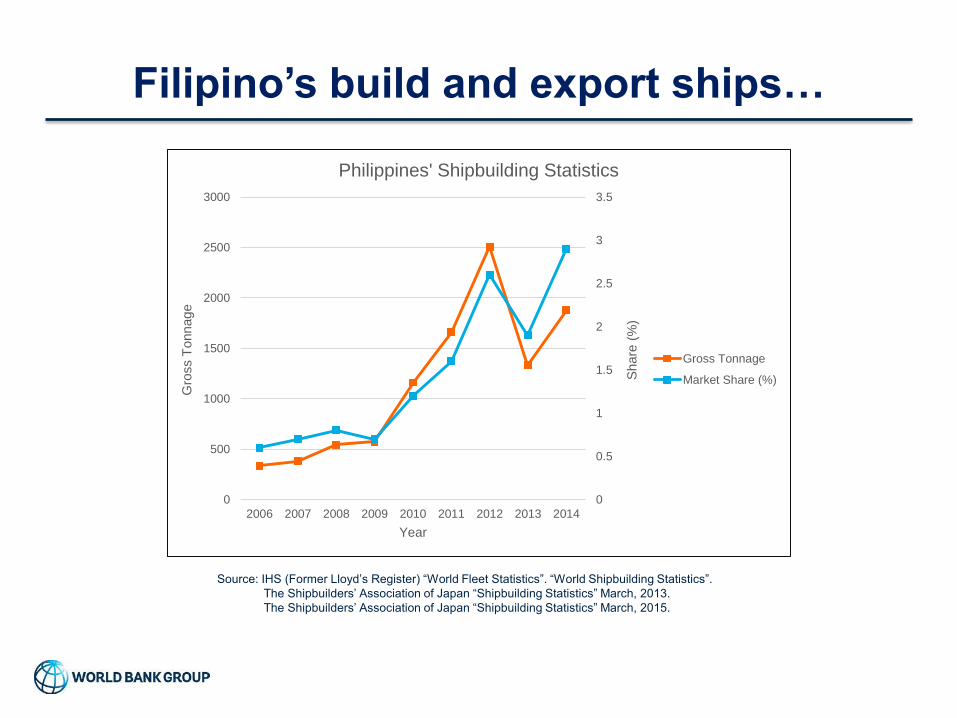
Filipino’s build and export ships…
0
0.5
1
1.5
2
2.5
3
3.5
0
500
1000
1500
2000
2500
3000
2006 2007 2008 2009 2010 2011 2012 2013 2014
Share
(%
)
Gro
ss T
onnage
Year
Philippines' Shipbuilding Statistics
Gross Tonnage
Market Share (%)
Source: IHS (Former Lloyd’s Register) “World Fleet Statistics”. “World Shipbuilding Statistics”.
The Shipbuilders’ Association of Japan “Shipbuilding Statistics” March, 2013.
The Shipbuilders’ Association of Japan “Shipbuilding Statistics” March, 2015.
30
The Foreign Ships Co-loading Act
• In July 21, 2015, the President signed RA 10668
into law.
• This is also known as the ‘The Foreign Ships Co-
loading Act’
• Move in the right direction: foreign ships can now
load and unload imports and exports along
domestic routes
• It will help reduce costs for importers and
exporters and it will also aid in decongesting ports
within the country
• But reform is incomplete…domestic shipping is
still protected…”not ready for competition”
31
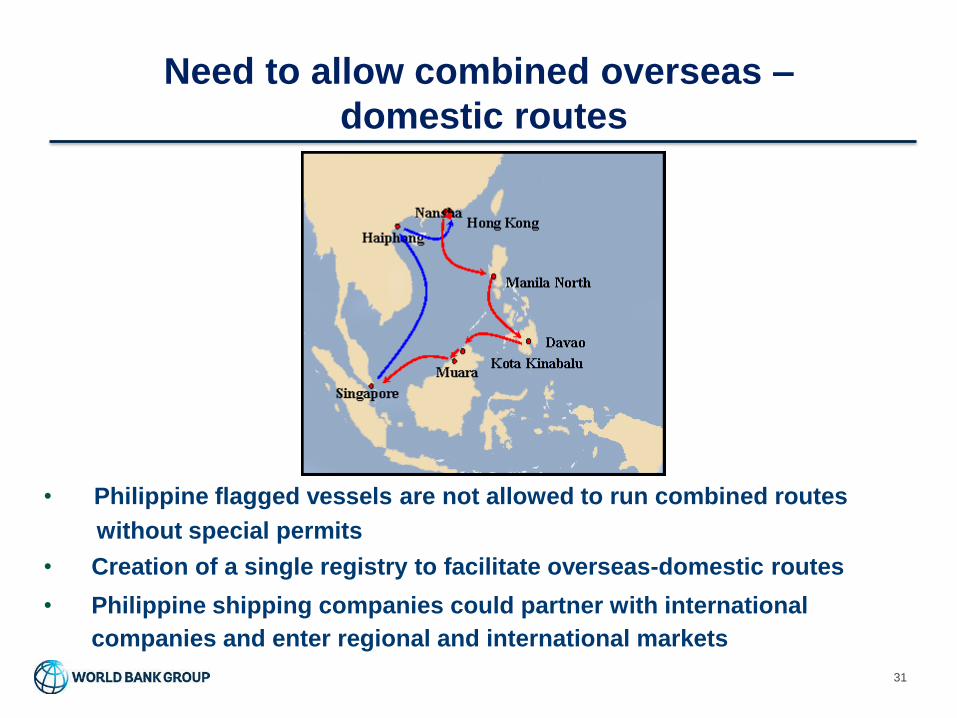
Need to allow combined overseas –
domestic routes
• Philippine flagged vessels are not allowed to run combined routes
without special permits
• Creation of a single registry to facilitate overseas-domestic routes
• Philippine shipping companies could partner with international
companies and enter regional and international markets
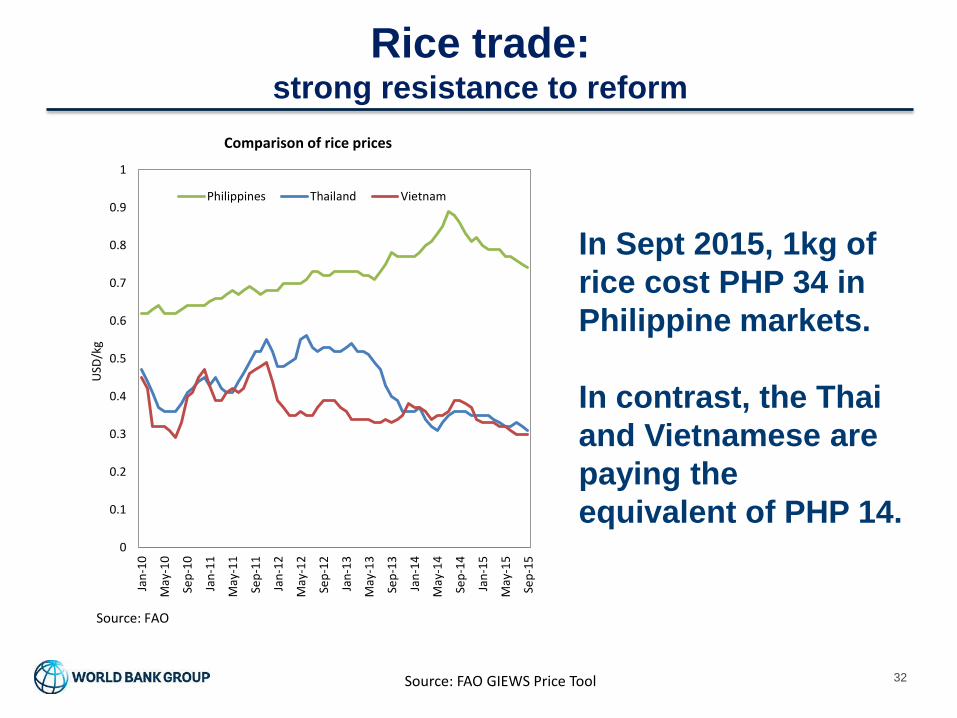
Rice trade: strong resistance to reform
Source: FAO GIEWS Price Tool 32
In Sept 2015, 1kg of
rice cost PHP 34 in
Philippine markets.
In contrast, the Thai
and Vietnamese are
paying the
equivalent of PHP 14. 0
0.1
0.2
0.3
0.4
0.5
0.6
0.7
0.8
0.9
1
Jan
-10
May
-10
Sep
-10
Jan
-11
May
-11
Sep
-11
Jan
-12
May
-12
Sep
-12
Jan
-13
May
-13
Sep
-13
Jan
-14
May
-14
Sep
-14
Jan
-15
May
-15
Sep
-15
USD
/kg
Comparison of rice prices
Philippines Thailand Vietnam
Source: FAO
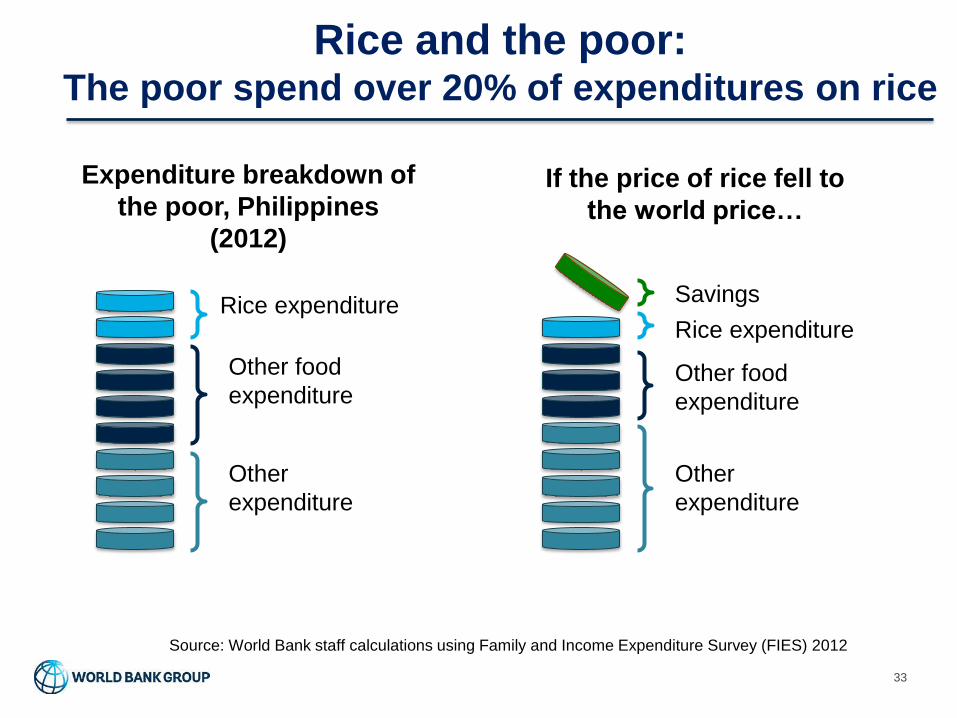
Rice and the poor: The poor spend over 20% of expenditures on rice
33
Other
expenditure
Other food
expenditure
Rice expenditure
Expenditure breakdown of
the poor, Philippines
(2012)
If the price of rice fell to
the world price…
Other
expenditure
Other food
expenditure
Savings
Source: World Bank staff calculations using Family and Income Expenditure Survey (FIES) 2012
Rice expenditure
Inclusive Growth: good governance
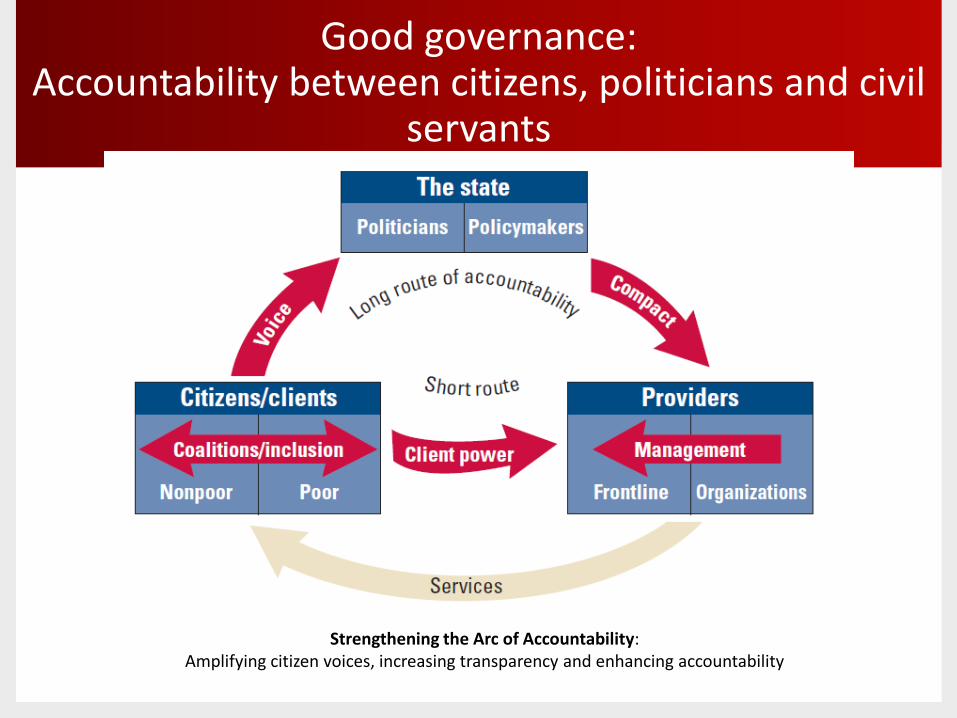
Good governance: Accountability between citizens, politicians and civil
servants
Strengthening the Arc of Accountability: Amplifying citizen voices, increasing transparency and enhancing accountability
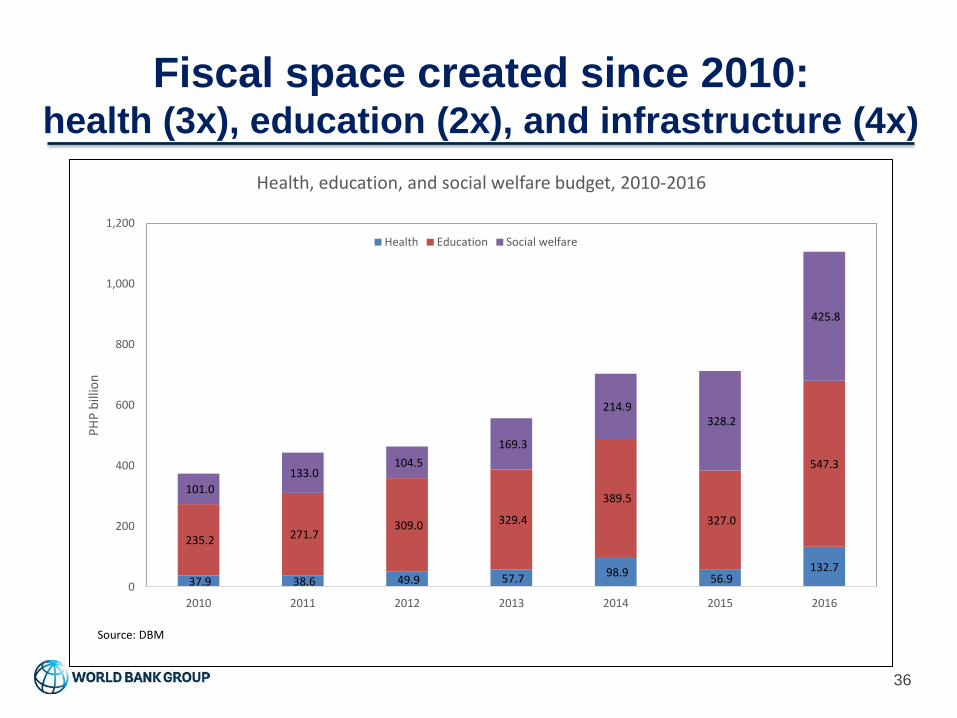
Fiscal space created since 2010: health (3x), education (2x), and infrastructure (4x)
36
37.9 38.6 49.9 57.7 98.9 56.9
132.7
235.2 271.7 309.0 329.4
389.5
327.0
547.3
101.0
133.0 104.5
169.3
214.9 328.2
425.8
0
200
400
600
800
1,000
1,200
2010 2011 2012 2013 2014 2015 2016
PH
P b
illio
n
Health, education, and social welfare budget, 2010-2016
Health Education Social welfare
Source: DBM
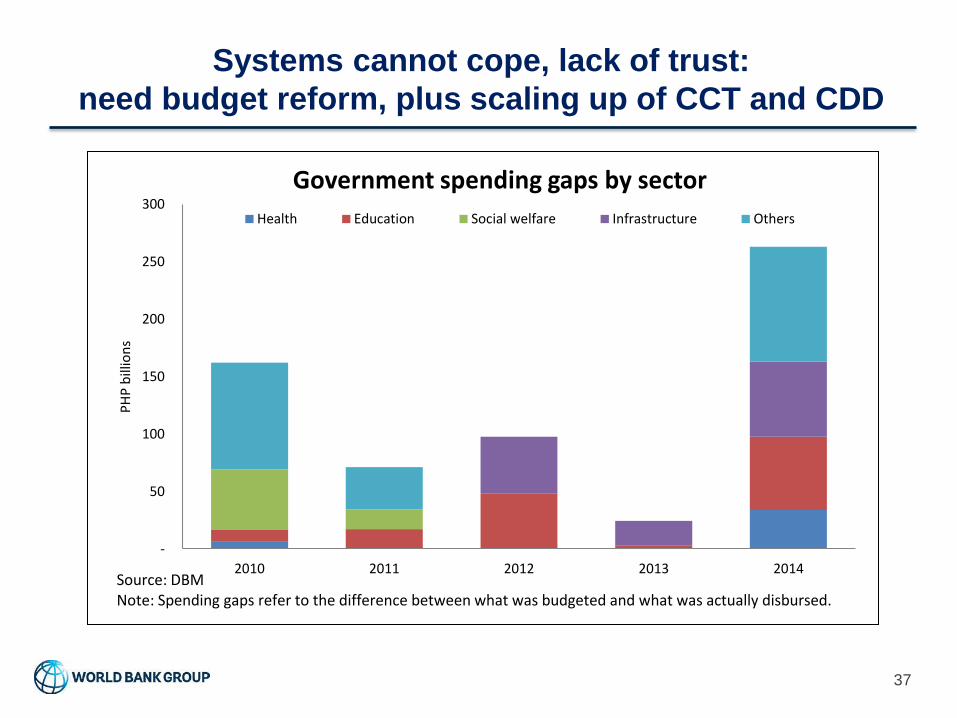
Systems cannot cope, lack of trust:
need budget reform, plus scaling up of CCT and CDD
37
-
50
100
150
200
250
300
2010 2011 2012 2013 2014
PH
P b
illio
ns
Government spending gaps by sector
Health Education Social welfare Infrastructure Others
Source: DBMNote: Spending gaps refer to the difference between what was budgeted and what was actually disbursed.
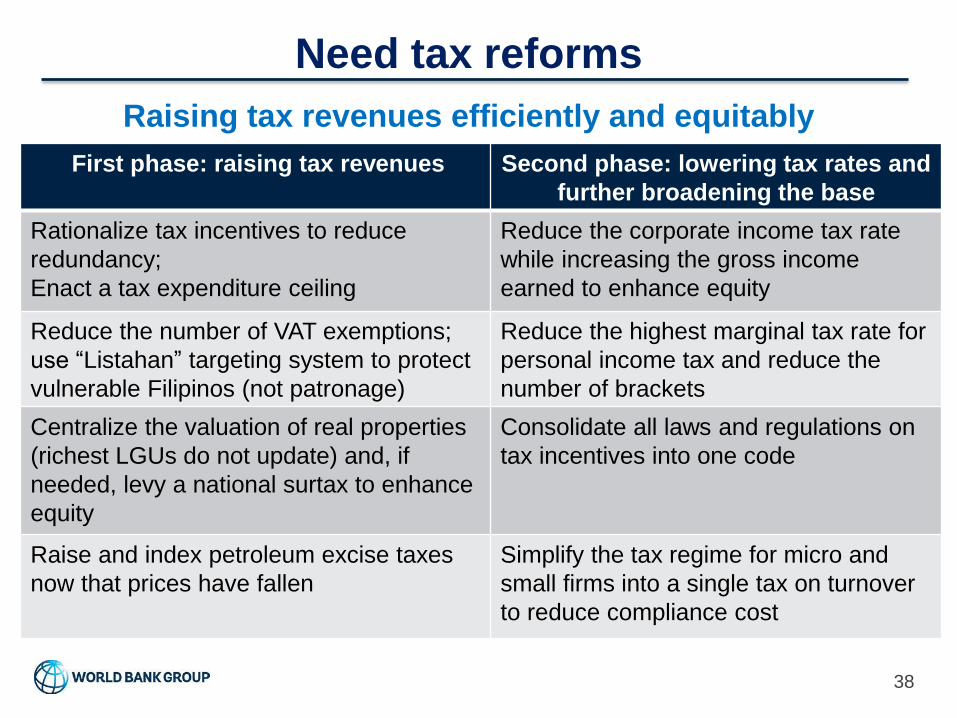
Need tax reforms
38
Raising tax revenues efficiently and equitably
First phase: raising tax revenues
Rationalize tax incentives to reduce
redundancy;
Enact a tax expenditure ceiling
Reduce the number of VAT exemptions;
use “Listahan” targeting system to protect
vulnerable Filipinos (not patronage)
Centralize the valuation of real properties
(richest LGUs do not update) and, if
needed, levy a national surtax to enhance
equity
Raise and index petroleum excise taxes
now that prices have fallen
Second phase: lowering tax rates and
further broadening the base
Reduce the corporate income tax rate
while increasing the gross income
earned to enhance equity
Reduce the highest marginal tax rate for
personal income tax and reduce the
number of brackets
Consolidate all laws and regulations on
tax incentives into one code
Simplify the tax regime for micro and
small firms into a single tax on turnover
to reduce compliance cost
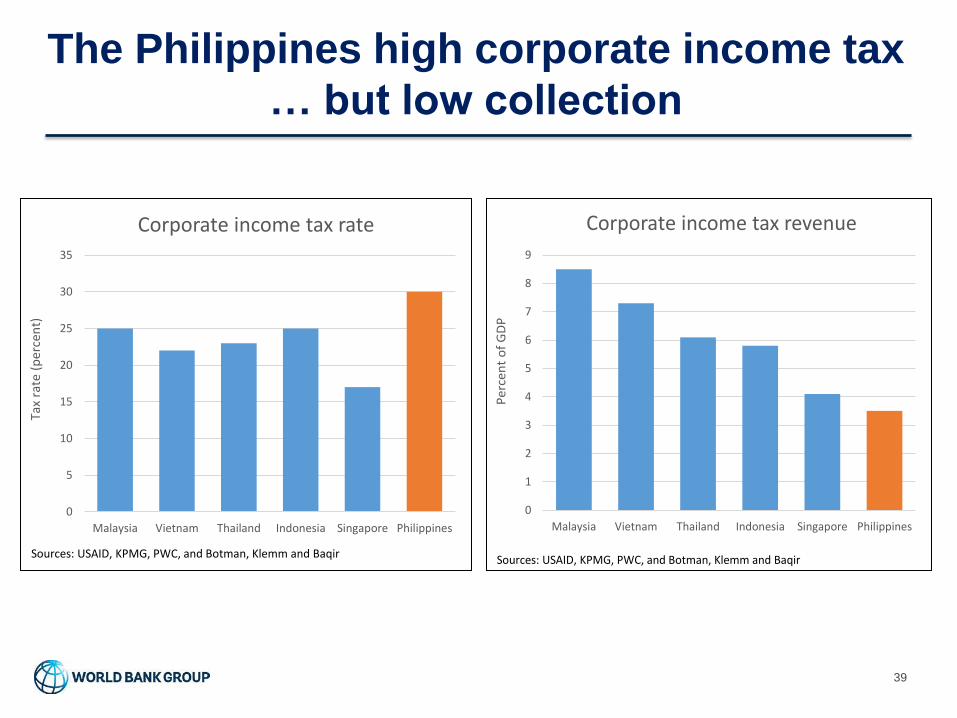
39
The Philippines high corporate income tax
… but low collection
0
5
10
15
20
25
30
35
Malaysia Vietnam Thailand Indonesia Singapore Philippines
Tax
rate
(p
erce
nt)
Corporate income tax rate
Sources: USAID, KPMG, PWC, and Botman, Klemm and Baqir
0
1
2
3
4
5
6
7
8
9
Malaysia Vietnam Thailand Indonesia Singapore Philippines
Pe
rce
nt
of
GD
P
Corporate income tax revenue
Sources: USAID, KPMG, PWC, and Botman, Klemm and Baqir
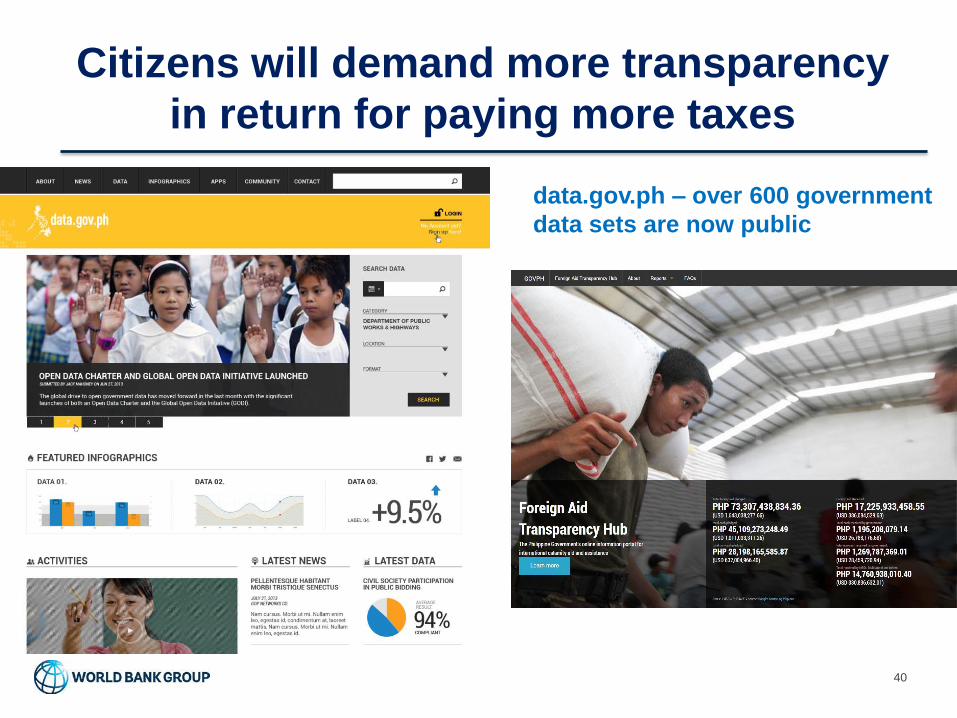
Citizens will demand more transparency
in return for paying more taxes
data.gov.ph – over 600 government
data sets are now public
40
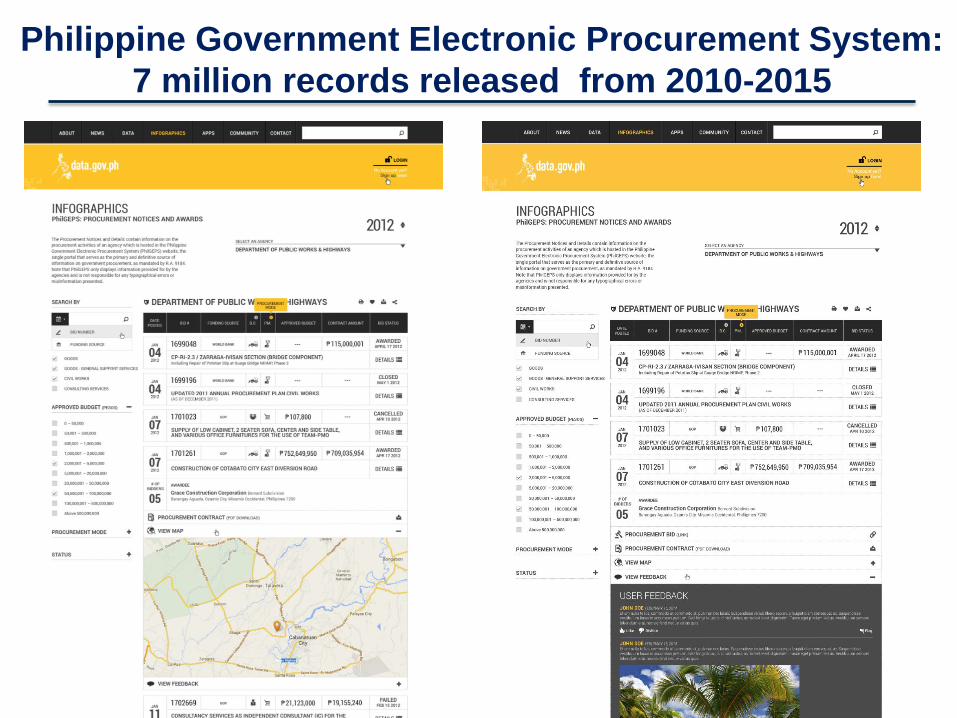
Philippine Government Electronic Procurement System:
7 million records released from 2010-2015
Inclusive growth: good leaders not enough, coalitions
needed
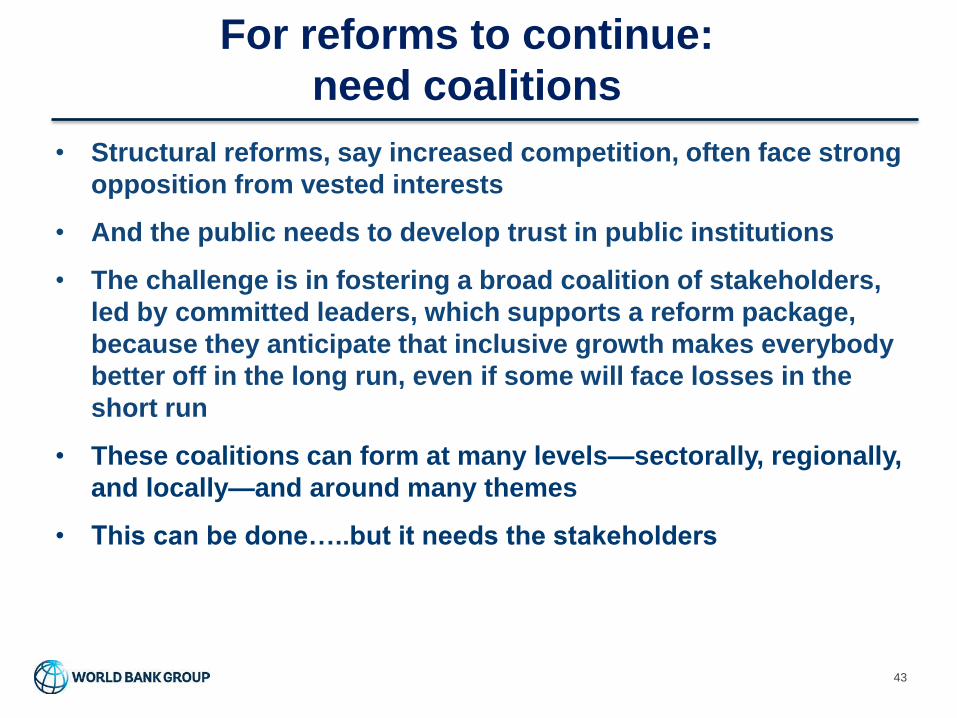
• Structural reforms, say increased competition, often face strong
opposition from vested interests
• And the public needs to develop trust in public institutions
• The challenge is in fostering a broad coalition of stakeholders,
led by committed leaders, which supports a reform package,
because they anticipate that inclusive growth makes everybody
better off in the long run, even if some will face losses in the
short run
• These coalitions can form at many levels—sectorally, regionally,
and locally—and around many themes
• This can be done…..but it needs the stakeholders
For reforms to continue:
need coalitions
43