inclusion matters: promoting equality, diversity and ... · spinout companies – a case for...
TRANSCRIPT

Centre for Diversity Policy Research and Practice | 1
Inclusion Matters: Promoting Equality, Diversity and Inclusion in University Spinout Companies - A Case for Action
GENDER AND UNIVERSITY SPINOUTS IN THE UK: Geography, Governance and GrowthDr Heather Griffiths and Dr Anne Laure Humbert Centre for Diversity Policy Research and Practice, Oxford Brookes University

2 | Gender and university spinouts in the UK: geography, governance and growth
web: www.brookes.ac.uk/women-and-spinouts | twitter: @WomenSpinouts | email: [email protected]
Citation: Griffiths, H. and Humbert, A.L. (2019) ‘Gender and university spinouts in the UK: geography, governance and growth’, Oxford: Oxford Brookes University Centre for Diversity Policy Research and Practice.
Report produced as part of the EPSRC funded project ‘Promoting Equality, Diversity and Inclusion in University Spinout Companies – A Case for Action’ (EP/S010734/1) as part of their Inclusion Matters initiative.
© 2019 Oxford Brookes University Centre for Diversity Policy Research and Practice

Centre for Diversity Policy Research and Practice | 3
TABLE OF CONTENTSAcknowledgements 5
Executive Summary 7
Introduction 9
Methodology 10
Data source 10
Definitions 10
Spinouts 10
Founders and the C-Suite 10
Active Spinouts 11
Findings 13
Spinouts’ geography in the UK 13
National and regional distribution of active spinout companies 13
Spinout creation by institution 15
Spinouts from the Russell Group 15
Gender and spinouts governance 16
Spinout evolution 16
Women in spinouts by industry sector 17
National and regional distribution of women in spinouts 18
Women in spinouts by institution 20
Women in Russell Group spinouts 22
Gender and growth 22
Size of spinouts companies 22
Investment and high-growth potential 25
Conclusion 31
Next Steps 33
Appendices 35
Appendix 1: Stages of spinout evolution (source Beauhurst) 35
Appendix 2: Number of spinouts by institution 36
Appendix 3: Methodology 39
Authors 40
Core Project Team 41
Our Partners 44
Advisory Board 45

4 | Gender and university spinouts in the UK: geography, governance and growth
LIST OF TABLESTable 1 Institutions with over ten active spinout companies 14
Table 2 Number of active spinout groups originating from Russell Group universities 15
Table 3 Sex composition of C-Suite by stage of evolution 17
Table 4 Sex composition of founders in the C-Suite by stage of evolution 17
Table 5 Number and percentage of women in spinouts by Standard Industry Classifications 18
Table 6 Number and percentage of women founders per UK nation 18
Table 7 Institutions with over ten active spinout companies who have the highest proportion of women founders 20
Table 8 Women in active spinouts across the Russell Group universities 21
Table 9 Number of employees in active spinouts by region (based on location of founding institution) 23
Table 10 Number of women founders to number of employees/size of company 24
Table 11 Percentage* of women in the C-suite to number of employees/size of company 24
Table 12 Growth strategies by region 25
Table 13 Logistic regression models – effects of number of women in the C-suite on growth strategies 26
Table 14 Logistic regression models – effects of gender and founders on growth strategies 27
Table 15 Grants and fundraisings amounts – summary statistics 29
Table 16 Linear regression – effects of gender and founders on capitals received and net worth 29
LIST OF FIGURESFigure 1 Stages of evolution of active spinouts in the UK as of 2019, n = 921 12
Figure 2 Number of spinouts by UK region, based on location of institution, n = 78 13
Figure 3 Proportion of active spinouts with one or more woman founder - by region 19

Centre for Diversity Policy Research and Practice | 5
ACKNOWLEDGEMENTSThe authors would like to thank everyone who has supported the completion of this report, from inception to publication. We are grateful to Beauhurst who have given us freedom and guidance from the beginning, in particular Ava Scott and Henry Whorwood. We would also like to extend our thanks to everyone on our Advisory Board for offering their time and expertise, especially Ana Avaliani, Sue O’Hare, Lesley Thompson and Hamish McAlpine for their invaluable feedback on previous drafts of this report. Our collaborators, University of Oxford, have also been a valuable source of support in the writing of this report, especially Professor Helen Byrne who provided in-depth feedback on the draft report and has been a critical friend throughout. We would also like to thank all those – too numerous to name – who have provided useful feedback, comments and suggestions as we engaged in data analysis and developed drafts of the report. Finally, thank you to the EPSRC for their generous funding which has made this project possible

6 | Gender and university spinouts in the UK: geography, governance and growth

Centre for Diversity Policy Research and Practice | 7
EXECUTIVE SUMMARY
This report provides an overview of the UK spinouts landscape from a gender perspective. It is part of a wider project, funded by the EPSRC’s Inclusion Matters programme, looking at the participation of women scientists, engineers and mathematicians in university spinout companies. The results examine sex-disaggregated data1 on the geography, governance and growth of these university spinout companies.
The findings of this report are timely and important since little is known about spinouts from a gender perspective. This is despite evidence that women are greatly underrepresented on patent applications (14% according to Elsevier2), spinouts are overwhelmingly founded or co-founded by men (Jarboe et al3), and women only make up one in three entrepreneurs more generally (Rose Review4). Addressing women’s underrepresentation in spinout companies is thus not only a matter of social justice, but could also address a critical element of the UK’s Industrial Strategy, which aims to increase business and growth through research and innovation.
GeographyThe geographical distribution of spinouts is an important first step to understand the barriers and enablers to inclusive spinning out. The majority of spinouts are located in the ‘golden triangle’ delineated by vertices at Oxford (114 spinouts), Cambridge (82) and London (predominantly Imperial College and University College London with 51 and 40 spinouts respectively), followed by Scotland (mostly Edinburgh University with 32 spinouts).
Membership of the Russell Group appears to be an important factor as 70% of active spinouts originate from these institutions. This might reflect a stronger and more established culture of commercialisation, supported by resources, networks and reputations that promote innovation.
GovernanceOn average, spinouts have 4.6 individuals listed C-suite5 members, consisting of 4 men and 0.6 women. The majority of spinouts (91%) have fewer than 50% women in their C-suite. In fact, 59% of spinouts have no women listed as C-suite members at all. Women are slightly more represented at seed stage of the spinout but it is not clear whether this represents higher failure rates, greater involvement from women in spinouts over time, or a phenomenon of ‘masculinisation’ as spinouts seek business expertise and investment from a community dominated by men.
Women are also greatly underrepresented as founders of spinout companies. At seed stage, only 17% of spinouts have a woman founder in their C-suite, dropping sharply at later stages of evolution. It is not clear whether this reflects an increase in women founding spinouts in recent years, higher failure rates, or women stepping out after the initial stages of the spinout process.
1 Based on data provided by Beauhurst. See Methodology for detail (p. 10)
2 Elsevier (2017) Gender in the Global Research Landscape. Available at: https://www.elsevier.com/data/assets/pdf_file/0008/265661/ElsevierGenderReport_final_for-web.pdf (Accessed 11 March 2019).
3 Jarboe, N., Grisoni, L and Manfredi, S. (2018) University spinouts: exploring women’s participation - a discussion paper Available at: https://www.brookes.ac.uk/uploadedFiles/Faculty_of_Business/Gender_and_University_Spinouts/Site_assets/Documents/University%20Spinouts.pdf (Accessed 31 July 2019).
4 Rose, A. (2019) The Alison Rose Review of Female Entrepreneurship. Available at: https://natwestbusinesshub.com/content/rosereview (Accessed 11 March 2019).
5 Cassidy, F. (2018) What is the C-suite? Available at: https://www.raconteur.net/hr/c-suite-guide (Accessed 31 July 2019). See also p. 11.

8 | Gender and university spinouts in the UK: geography, governance and growth
Women are underrepresented across all industry sectors. The majority of spinouts operate in manufacturing, information and communication, or the professional, scientific or technical sectors. However, it is also in these sectors, compared to others, that women are less likely to be represented either as founders or as C-suite members.
Across the UK, 13% of active spinouts have at least one woman founder. This is consistent across all nations, with the exception of Wales where there have been no women founders. The representation of women in spinouts across institutions is uniformly low. An exception is the Royal College of Art where 43% of their 28 spinouts have at least one woman founder. It appears that there are more women founders in the three most prolific institutions (Oxford, Cambridge, Imperial) but not all institutions in the ‘golden triangle’ meet the national average of 13%.
GrowthWomen in spinouts miss out on investment, both financially and in terms of wider fundraising and high-growth activity. This can have later consequences in ensuring that these companies are able to scale-up and grow. The majority of active spinout companies in the UK are small. More than half (56%) have less than 10 employees (micro-enterprises) and a further 38% employ between 10 and 49 people (small enterprises). Regionally, the predominant position of England as a nation is evident, as this is where a disproportionate number of larger (50+ employees) spinouts originate.
Women in decision-making positions are more likely to be found in smaller spinouts. Only nine spinouts with a woman founder or co-founder have 25 employees or more. This might represent an increase in women’s spinout involvement in recent years or alternatively to women being less successful in terms of growth because of structural and other factors.
The vast majority of spinouts (86%) have participated in accelerator programmes, been included in high growth lists, received equity funding and/or have received a large innovation grant. This is representative across all nations, with the exception of Wales where this drops to 54%, somewhat driven by lower levels of equity funding. There are strong regional inequalities in terms of funding, with spinouts from England and Scotland clearly ahead of their counterparts in Wales and Northern Ireland. England also demarcates itself when it comes to accelerator programmes, possibly speaking to the higher availability of networks and incubators in the ‘golden triangle’.
Controlling for factors such as sector or company characteristics, more women in the C-suite increases the likelihood of taking part in an accelerator programme but decreases the likelihood of having received a large innovation grant. This does not establish a causal link, nor does it provide information as to the direction of these relationships. There is no relationship between the number of women listed in the C-suite, controlling for other factors, and receiving equity funding or featuring in a high growth list.
Moreover, the number of women founders, when controlling for other factors, is negatively associated with both receiving a large innovation grant and featuring in a high-growth list. The number of women founders was not associated with receiving equity funding or attending an accelerator programme.
The grants and funds raised by spinouts in the UK since 2011 exceed £5 billion. The majority of spinouts (497) had received at least one grant, with an average of just over three per spinout company. This corresponds to an average of nearly £800,000 in grants since 2011 but can range widely (from £2,165 to over £10 million). Spinouts were valued at an average of £16 million after capitalisation, ranging from £40,000 to £1.5 billion. Spinout companies with more women founders received lower amounts through fundraising and their companies tended to have lower pre-money valuations.

Centre for Diversity Policy Research and Practice | 9
INTRODUCTION
This report offers an overview of the UK spinouts landscape by disaggregating data on all active university spinout companies by sex. It is part of a wider project, funded by the EPSRC’s Inclusion Matters programme, looking at the participation of women scientists, engineers and mathematicians in university spinout companies. The long-term vision of this project is to achieve a step change in institutional capabilities to increase the participation of women researchers in university spinouts and to mainstream gender in the ecosystem that drives innovation. The project will identify, and seek to understand, the barriers and enabling factors that women researchers face on their pathways to spinout. This new knowledge will inform the development of interventions to build institutional capabilities that facilitate inclusive entrepreneurial career progression pathways for women to spinout. Materials to support these interventions will be developed as a separate part of this project. The report offers a sex-disaggregated overview of the spinout landscape in the UK by focusing on the geographic distribution of university spinout companies, their governance and their growth trajectories, including how gender affects fundraising and investment.
The recent Gender in the Global Research Landscape report by Elsevier6 shows that across a range of countries, including the UK, the global share of women among inventors listed in patent applications between 2011-2015 was only 14%. As highlighted by Jarboe et al., it is not surprising that university spinouts are overwhelmingly founded or co-founded by men8. The Rose Review of Female Entrepreneurship7 found that only 1 in 3 UK entrepreneurs is a woman and argues that addressing women’s underrepresentation in entrepreneurship in the UK could boost the economy by £250 billion. Therefore, encouraging and understanding women’s engagement in spinout companies should be considered a critical element of the UK’s Industrial Strategy, which aims to increase investment in research and innovation, and to support new business and growth.
This report focuses on the areas of geography, governance and growth to understand where in the UK women are represented in university spinouts, the extent of their involvement in spinning out intellectual property (IP) and the relationship between women founders and executives and company growth. The results are presented in three parts. Part one is an overview of the spinout landscape in the UK to compare national, regional and institutional appetites for commercialising IP through spinout creation. Part two reviews the number of women spinout founders as well as how many women are in spinout executive teams. This data will also be displayed geographically for comparison with the findings in Part one. The final part of the report considers how the presence of women in spinouts affects a company’s growth opportunities. This section looks at the size of companies and their stages of evolution as well as analysing how the presence of women impacts high-growth potential and capitalisation.
6 Elsevier (2017) Gender in the Global Research Landscape. Available at: https://www.elsevier.com/data/assets/pdf_file/0008/265661/ElsevierGender-Report_final_for-web.pdf (Accessed 11 March 2019).
7 Jarboe, N., Grisoni, L and Manfredi, S. (2018) University spinouts: exploring women’s participation - a discussion paper Available at: https://www.brookes.ac.uk/uploadedFiles/Faculty_of_Business/Gender_and_University_Spinouts/Site_assets/Documents/University%20Spinouts.pdf (Accessed 31 July 2019).
8 Rose, A. (2019) The Alison Rose Review of Female Entrepreneurship. Available at: https://natwestbusinesshub.com/content/rosereview (Accessed 11 March 2019).

10 | Gender and university spinouts in the UK: geography, governance and growth
METHODOLOGY
Data sourceThis analysis is based on data provided by Beauhurst, an organisation that tracks high-growth companies in the UK, including all companies that have spun out from an academic institution. The dataset includes key details about each company, including the institutions and individuals involved, their history of investment and recent financial reports. Data are collected from a variety of sources, including Companies House, media articles and press releases, company websites, LinkedIn and from large public bodies such as Innovate UK. When a spinout company meets one of Beauhurst’s growth ‘triggers9’, their company profile is updated accordingly. Beauhurst’s data was acquired from Spinouts UK in 2018, which has tracked the progress of UK spinouts and their fundraising activity since 2011. The results presented here are based on the data available as of 28th January 2019, and therefore any company updates tracked after this date will not be reflected in our findings.
Definitions
Spinouts
Beauhurst defines a university spinout as a company that was created using university-based research commercialised through the business and enterprise development officer in the institutions10. The significant difference between a spinout and a start-up is that a spinout company is set up to exploit IP that was developed within a UK academic institution, with some ownership of the company held by the institution in which this IP was developed. This definition is broadly adopted from the Higher Education Statistics Agency’s (HESA) definition of a spin-off which requires the IP (including copyrights and patents) to be owned by the Higher Education Provider (HEP) and/or the HEP has some ownership in the company in the form of company shares and board representation11. The HEP’s equity shares often provides the initial capital investment for spinouts and the HEP continue to hold these shares unless they decide to exit or if the spinout company is sold to a larger investor. Typically, HEPs also expect to have representation at board level as part of this investment package. The institution may also provide access to resources such as internal or external incubators and premises or facilities in which the spinout can operate.
Founders and the C-Suite
The findings in this report recognise two incidences of women’s involvement in spinout companies. The first identifies the number of women who have founded spinouts in the UK. The second recognises those women who are not necessarily founders but represent key decision-makers within these spinout companies. In Beauhurst’s dataset, these key decision-makers are identified as members of ‘the C-Suite’. The C-Suite comprises the most senior level executives who are responsible for developing strategies to ensure the company meets its objectives. These positions have acquired the C-suite label because the most senior
9 Beauhurst rely on a range of criteria to identify high-growth companies that they refer to as ‘triggers’. These triggers indicate that a business is active-ly growing or developing plans for growth. When a business meets one or more of these triggers, Beauhurst will create a new profile for that company or update an existing profile accordingly. Examples of common triggers include equity or venture debt investment, management buy out or buy in and receipt of an innovation grant. See Beauhursts’ website for more details: https://about.beauhurst.com/data/.
10 Beauhurst (2018) UK University Spinouts: who are they and their investors? Available at: https://about.beauhurst.com/blog/uk-university-spinouts-investors/ (Accessed 24/04/19).
11 HESA Support Definitions, key terms and acronyms. Available at: https://www.hesa.ac.uk/support/definitions/hebci (Accessed 17/05/19).

Centre for Diversity Policy Research and Practice | 11
roles in a business tend to have the word ‘chief’ in the title12. These roles are highly influential and come with significant responsibility and so analysing women’s representation in the C-Suite provides a broader understanding of women’s inclusion within university spinout companies.
Analysis at the level of the C-Suite rather than women on boards, which is more typical in research on gender in organisation studies, was a methodological decision based on the data provided by Beauhurst. The raw data includes details of all members of the C-Suite, their job titles and confirms whether they were founders of the spinout. Whilst rigorous, this approach has limitations, which are reflected in the findings. If a founder is not listed as a C-Suite member, their details will not be in Beauhurst’s database. In the majority of spinout companies, founders will also be company executives but our qualitative research suggests this is not always the case. In addition, founders may have sold their shares and exited the business even though the company is still trading. We have tried to minimise these cases by only analysing ‘active’ companies (see below). Despite occasional disparities between Beauhurst and Companies House’s classification of an ‘active or ‘dormant’ company, this has only a minimal effect on our findings.
Active Spinouts
Only spinouts listed in Companies House that have an ‘active’ status are included in this analysis, reducing the number of spinouts to n = 921 (from n = 1,080). These 921 spinouts are at different stages of evolution as defined by Beauhurst (see Appendix 1). Nearly half of all active spinouts in the UK are at ‘seed’ stage, and a further quarter at ‘venture’ stage, showing that the spinouts arena is populated by young companies. Comparatively, few companies are either at ‘growth’ or ‘established’ stage. Information about the length of time since spinning out is only available for 483 currently active spinouts and suggests an average company age of just below six years. As expected, the average age increases in line with stages of evolution. Seed-stage spinouts have been operating on average for about four years, increasing to nearly eight for venture-stage companies, nearly 10 for growth-stage and over 16 years for established.
A total of 10% (n = 89) of all spinouts active on Companies House have exited e.g. through an Initial Public Offering (IPO) or an acquisition. As part of the exit strategy, the HEP will have relinquished their shareholding in the company meaning they have sold the IP. For this reason, we have excluded all companies that have exited as they are not currently operating under the model of a spinout business. A further 4% (n = 43) have been classed by Beauhurst as ‘zombie’ or ‘dead’ companies. A full explanation of these categories can be found in Appendix 1, but in summary, these are companies that have ceased trading or that Beauhurst deem to be inactive. Excluding this latter group leaves a total of 789 spinouts upon which the remainder of this analysis is based. The decision to include only active spinouts in the analysis ensures attention is focused on the current spinout landscape and distinguishes our approach from those who do not differentiate between spinouts’ evolutionary stages. Future research directions could include some further analysis on the 14% of UK spinouts not included in this report in order to better understand the routes to exit and the point at which companies cease to trade.
12 Cassidy, F. (2018) What is the C-suite? Available at: https://www.raconteur.net/hr/c-suite-guide (Accessed 31 July 2019),

12 | Gender and university spinouts in the UK: geography, governance and growth
Figure 1 Stages of evolution of active spinouts in the UK as of 2019, n = 921
Seed Venture Growth Established Exited Zombie Dead
49%
26%
7%
3%
10%
2% 2%

Centre for Diversity Policy Research and Practice | 13
FINDINGS
Spinouts’ geography in the UK As well as considering national and regional differences, this section includes a breakdown of the data at HEP level. Understanding regional and institutional differences raises awareness of disparities and highlights areas for improvement. This is the first step in identifying the institutional barriers that may be discouraging women from spinning out their innovations. Such barriers can include gender-blind national and institutional policy toward innovation, but also less explicit issues such as access to the right networks or support from those within the institution.
Figure 2 Number of spinouts by UK region, based on location of institution
National and regional distribution of active spinout companies
The majority of active spinouts are located in England, with the South East, East of England and Greater London areas seeing most activity (see Figure 2)13. Scotland has the highest number of active spinouts outside the ‘golden triangle’14 and more than all three northern regions added together.
13 It is important to distinguish between the regions in which the intellectual property originated from the region in which it is being commercialised through a business venture. These findings are based on the location of the founding institution but the spinout companies may have operate their business in a different geographic location. For example, some London-based institutions such as Imperial College have spinouts that operate from Cambridgeshire. Other institutions use London as a base. It should also be noted that in a minority of instances, innovation stems from collaborations between institutions which might also explain the degree of ‘delocalisation’ that can be observed. Instances of joint collaboration between institutions are noted in the table provided in Appendix 2. However, in subsequently analysis, only the first registered institution is taken into account due to methodological reasons. As this affects only a limited amount of cases (n = 15), the effects on the overall results are negligible.
14 We adopt the definition of the ‘golden triangle’ from Raffe & Croxford (2015) which includes Oxford, Cambridge and the large London institutions. Raffe, D. & Croxford, L. (2015) ‘How stable is the stratification of Higher Education in England and Scotland?’ British Journal of Sociology of Educa-tion, pp. 313-335. DOI: 10.1080/01425692.2013.820127.

14 | Gender and university spinouts in the UK: geography, governance and growth
Given that Scotland has 17 universities15, they have an average of 7.2 active spinouts per institution compared to England’s 4.5 and Wales’ 4.4. Five out of the top 20 most prolific spinout institutions also originate from Scotland (see Table 2). This suggests that the climate in Scottish Higher Education is more conducive to innovation than in England or Wales. Universities Scotland have created a Five Point Plan for Innovation which includes a commitment to provide enhanced start up and spinout programmes and all 19 Scottish higher education institutions have signed up to support their statement of shared principles on spinout company formation. Interestingly, Northern Ireland also has a high number of active spinouts per institution with 13 per university or 6.5 including university colleges. The majority of these (n=21) originate from Queen’s University Belfast (Table 1) where creating new enterprises and transferring innovations16 via university spinouts is a strategic priority.
Table 1 Institutions with over ten active spinout companies
Institution Number of active spinouts
Percentage of all active spinouts
University of Oxford* 114 14%
University of Cambridge 82 10%
Imperial College London 51 6%
University College London (University of London) 40 5%
University of Edinburgh 32 4%
Royal College of Art 28 4%
University of Manchester 26 3%
University of Strathclyde 26 3%
University of Bristol 24 3%
Queen’s University Belfast 21 3%
University of Warwick 21 3%
Swansea University 20 3%
University of Leeds 17 2%
University of Sheffield 16 2%
University of Southampton 16 2%
Heriot-Watt University 14 2%
University of Aberdeen 13 2%
University of Nottingham 13 2%
University of Glasgow 13 2%
University of Birmingham 11 1%
Total from institutions with > 10 spinouts 598 76%
*Russell Group universities are in italics for comparison
15 Taken from the Complete University Guide which excludes regional Open Universities and other higher education institutions such as colleges: Scot-land, n = 17; Wales, n = 8; Northern Ireland, n = 2; England, n = 134. Available at: https://www.thecompleteuniversityguide.co.uk/universities/#pro-fileList-england (Accessed 22nd May 2019).
16 Queen’s University Belfast, Innovation and Impact Available at: https://www.qub.ac.uk/corporate-plan/innovation-impact/ (Accessed 31 July 2019).
Centre for Diversity Policy Research and Practice | 15
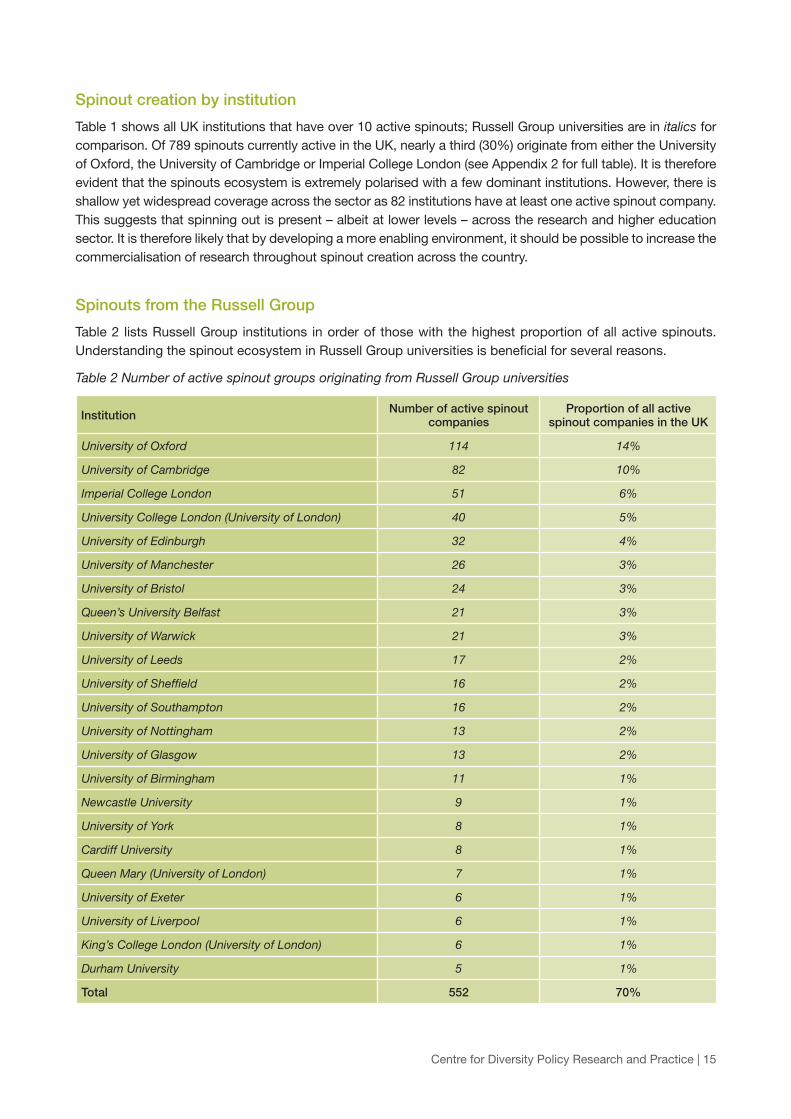
Spinout creation by institution
Table 1 shows all UK institutions that have over 10 active spinouts; Russell Group universities are in italics for comparison. Of 789 spinouts currently active in the UK, nearly a third (30%) originate from either the University of Oxford, the University of Cambridge or Imperial College London (see Appendix 2 for full table). It is therefore evident that the spinouts ecosystem is extremely polarised with a few dominant institutions. However, there is shallow yet widespread coverage across the sector as 82 institutions have at least one active spinout company. This suggests that spinning out is present – albeit at lower levels – across the research and higher education sector. It is therefore likely that by developing a more enabling environment, it should be possible to increase the commercialisation of research throughout spinout creation across the country.
Spinouts from the Russell Group
Table 2 lists Russell Group institutions in order of those with the highest proportion of all active spinouts. Understanding the spinout ecosystem in Russell Group universities is beneficial for several reasons.
Table 2 Number of active spinout groups originating from Russell Group universities
Institution Number of active spinout companies
Proportion of all active spinout companies in the UK
University of Oxford 114 14%
University of Cambridge 82 10%
Imperial College London 51 6%
University College London (University of London) 40 5%
University of Edinburgh 32 4%
University of Manchester 26 3%
University of Bristol 24 3%
Queen’s University Belfast 21 3%
University of Warwick 21 3%
University of Leeds 17 2%
University of Sheffield 16 2%
University of Southampton 16 2%
University of Nottingham 13 2%
University of Glasgow 13 2%
University of Birmingham 11 1%
Newcastle University 9 1%
University of York 8 1%
Cardiff University 8 1%
Queen Mary (University of London) 7 1%
University of Exeter 6 1%
University of Liverpool 6 1%
King’s College London (University of London) 6 1%
Durham University 5 1%
Total 552 70%

16 | Gender and university spinouts in the UK: geography, governance and growth
Firstly, these institutions are generally considered the most elite and prestigious universities in the country and home to world-leading research and educational standards. Russell Group universities tend to have a stronger and more established culture of commercialisation, supported by the resources, networks and reputations, which enable them to promote innovation. Furthermore, academics have already identified the Russell Group as meeting the criteria used to identify entrepreneurial universities17 and so it is expected that they will be amongst the most prolific institutions for commercialising IP.
The only Russell Group University not represented is the London School of Economics, which has no active spinouts listed18. Spinouts from Russell Group universities account for 70% of all active spinout companies in the UK, with the top three of University of Oxford, University and Cambridge and Imperial College London hosting almost half (44%) of all Russell Group spinouts. Oxford and Cambridge are home to over a third (35%) of all active spinouts in the Russell Group and nearly a quarter (24%) of all spinout companies in the UK. Whilst the size of these collegiate universities is a contributing factor to this, their history, wealth, facilities and networks work simultaneously to nurture and support innovation and entrepreneurialism amongst their members.
Gender and spinouts governance
Spinout evolution
On average, there are 4.6 individuals listed as members of the C-Suite in each active spinout, consisting of 4 men and 0.6 women (Table 3). Across all active spinout companies, this translates to just 13% of C-Suite members being women. Strikingly, the majority of spinouts (91%) have fewer than 50% women in their C-suite. In fact, 59% have no women C-Suite members at all. Women’s representation at this senior executive level is relatively even across all stages of evolution (see also Figure 1), despite a tendency for the size of the C-Suite to increase up to growth stage. Very few spinouts have gender-balance or are dominated by women at senior executive level. It is nonetheless interesting to note that there are more women present in the C-suite of companies who are in the earlier stages of evolution (see Table 3).
It is not clear whether a higher proportion of women executives at seed stage is related to a time effect where women are becoming more involved in spinouts or whether this is the result of higher failure rates, perhaps due to lack of support, lack of experience or greater obstacles in relation to the type of innovation being commercialised. Another possible explanation is that as these companies evolve they are forced to expand their executive board to ensure continued business growth. As well as recruiting executives with significant business experience, companies will also be seeking larger investment, often from sources such as venture capitalists who typically take board and/or executive positions. Both these areas – business expertise and investment – are dominated by men and, as such, as the size of the C-Suite increases, the proportion of women is likely to reduce.
17 Guerrero, M., Cunningham, J. and Urbano, D. (2015) Economic impact of entrepreneurial universities’ activities: An exploratory study of the United Kingdom. Research Policy, 44 (3). pp. 748-764. ISSN 0048-7333 Published by: Elsevier URL: http://dx.doi.org/10.1016/j.respol.2014.10.008 This version was downloaded from Northumbria Research Link: http://nrl.northumbria.ac.uk/27576/
18 According to further research using SpinoutsUK data, London School of Economics has never registered a spinout company.

Centre for Diversity Policy Research and Practice | 17
Table 3 Sex composition of C-Suite by stage of evolution
Number of active spinouts
Average size of C-Suite
Percentage of women in the
C-Suite
Percentage of spinouts with at
least one woman in the C-Suite
Percentage of spinouts with at
least 50% women in the C-Suite
Seed 455 3.5 14% 35% 12%
Venture 244 5.7 12% 47% 5%
Growth 62 8.6 13% 58% 3%
Established 28 4.9 12% 43% 7%
All spinouts 789 4.6 13% 41% 9%
Table 4 shows that women are greatly underrepresented as founders across all stages of spinout evolution. At seed stage, only 17% of spinouts have a woman founder in their C-suite, dropping sharply at the later stages (Table 4). Across all active spinouts, founders are most likely to be involved at the early stages – seed and venture particularly, with 75% and 71% respectively having a founder listed among the C-Suite. However, it is not clear whether this means that spinouts founded by women have a propensity to fail more often or if instead, this signals that women’s founding activities have increased in recent years. Similarly, it might also reflect that founders have stepped away from the business after the initial stage.
Table 4 Sex composition of founders in the C-Suite by stage of evolution
Number of active spinouts
Percentage of spinouts with a founder listed in
the C-Suite
Percentage of spinouts with a woman founder
listed in the C-Suite
Percentage of the C-suite who are
founders
Percentage of all spinout founders that are women
Seed 455 75% 17% 46% 14%
Venture 244 71% 8% 24% 9%
Growth 62 58% 2% 12% 3%
Established 28 36% 7% 10% 6%
All spinouts 789 71% 13% 35% 12%
Women in spinouts by industry sector
There is very limited data available on the type of spinout companies created or the academic disciplines from which they originate. The database includes the Standard Industrial Classification (SIC) codes of the companies, based on information provided by Companies House. These only offer a crude estimate of where these companies sit in the UK economy and do not represent the complexity of the IP being developed and spun out. It can, however, provide an indication of the types of activities these companies are engaged in, and whether participation in these activities varies by sex. Table 5 shows that over half of all spinouts in the UK are classed as ‘Professional, scientific or technical’, which includes the categories of ‘Scientific research and development’ and ‘Architectural and engineering activities; technical testing and analysis’. This could mean that over half of all active spinouts are in the areas of STEM, but this can only be a speculative assessment because this classification also includes services such as management consultancy, and research and development within the social sciences. Disaggregating this data by sex shows that there is no discernible

18 | Gender and university spinouts in the UK: geography, governance and growth
underrepresentation of women in spinouts across these three industries as the percentage of companies with at least one woman founder is consistent with the wider sample. However, women do seem to be more represented in ‘Other’ industries as over a quarter of spinouts in this category have more than one woman founder, despite this classification only applying to 8% of all active spinouts.
Table 5 Number and percentage of women in spinouts by Standard Industry Classifications
Standard Industrial Classification (SIC)
Total number of spinouts
Number of spinouts with at least one
woman founder
Percentage of spinouts with at least one
woman founder
Number of spinouts with at least one
woman in the C-suite
Percentage of spinouts with at least one
woman in the C-suite
Manufacturing (C) 166 18 11% 56 34%
Information and communication (J) 161 17 11% 58 36%
Professional, scientific or technical (M) 454 55 12% 198 44%
Other 72 18 25% 35 49%
Sum of all 853* 108 13% 347 41%
*some companies are listed under more than one SIC code, total number of active spinout companies remains at 789
National and regional distribution of women in spinouts
Across the UK, 13% of active spinouts have at least one woman founder19. With the exception of Wales, the proportion of women spinout founders is consistent across all nations. Wales is the only nation where there have been no women spinout founders. Less than 5% of all UK spinout companies originate from a Welsh university but in order to reach the UK average, it would still require four of those companies to have at least one women founder. England is the only nation to have spinout companies with more than one women founder, although this still only represents 1% of all English spinout companies, or seven out of 522.
Table 6 Number and percentage of women founders per UK nation
Number of spinouts with no women
founders
Percentage of spinouts
with no women
founders
Number of spinouts with one woman founder
Percentage of spinouts
with one woman founder
Number of spinouts with two or more women
founders
Percentage of spinouts
with two or more women
founders
Total active spinouts
England 522 86% 76 13% 7 1% 605
Northern Ireland 23 88% 3 12% 0 0% 26
Scotland 108 88% 15 12% 0 0% 123
Wales 35 100% 0 0% 0 0% 35
All active spinouts 688 87% 94 12% 7 1% 789
19 The percentages used throughout this report are intended to be indicative only. Because there are so few women in spinouts, some of the values used in this analysis are very small which can distort the apparent significance of the findings.

Centre for Diversity Policy Research and Practice | 19
Analysing this data at the regional level (see Figure 3) shows that the golden triangle of Oxford, Cambridge and London appears to perform relatively well in terms of the number and proportion of women founding spinouts. London in particular fares well with 18% of spinouts having at least one woman founder. However, as the next section will show (see Table 7), this result can be attributed to two institutions in particular who have significantly more women founders than the national average.
The South West, East Midlands and the North East are also all seeing a larger proportion of women spinout founders than the national average. However, this should be contextualised with the results displayed in Figure 2 as the South West has almost as many active spinouts in total as the East Midlands and North East combined. Likewise, the North West and West Midlands have a similar number of spinouts to the North East and South West but less than 10% of spinouts in the North West or West Midlands are founded by women (7% and 2% respectively).
Scotland and Northern Ireland both have 12% of active spinouts founded by women, which is just shy of the national average. This analysis suggests that national and institutional initiatives to increase innovation are unevenly distributed across the UK and there are significant disparities both regionally and nationally. Furthermore, the presence of such initiatives appears to have done very little to increase the number of women entrepreneurs, even in areas where there is a greater propensity to spinout university IP.
Figure 3 Proportion of active spinouts with one or more woman founder - by region

20 | Gender and university spinouts in the UK: geography, governance and growth
Women in spinouts by institution
Table 7 shows the institutions with the highest proportions of active spinouts where at least one founder is a woman. Only institutions with more than 10 active spinout companies have been included, which represents less than a quarter (24%, n = 20) of the 82 universities listed in the database. For comparison, Russell Group universities are coded in italics (see also Table 7). The institution with the highest proportion of women spinout founders is the Royal College of Art (RCA) where 43% of their 28 spinouts have at least one woman founder. As well as having the highest proportion of women founders, the RCA are also the sixth most prolific institution for creating spinouts and the highest ranked non-Russell Group university with more than 10 spinouts.
Table 7 Institutions with over ten active spinout companies who have the highest proportion of women founders
Institution Number of active spinout companies
Number of active spinouts with at least one woman founder
Percentage of active spinouts with at least one woman founder
Royal College of Art 28 12 43%
Heriot-Watt University 14 4 29%
University of Nottingham* 13 3 23%
Imperial College London 51 11 22%
University of Oxford 114 21 18%
University of Cambridge 82 14 17%
University of Bristol 24 4 17%
University of Strathclyde 26 4 15%
University of Aberdeen 13 2 15%
University College London (University of London) 40 5 13%
University of Leeds 17 2 12%
Queen’s University Belfast 21 2 10%
University of Edinburgh 32 3 9%
University of Manchester 26 2 8%
University of Sheffield 16 1 6%
University of Southampton 16 1 6%
University of Warwick 21 0 0%
Swansea University 20 0 0%
University of Glasgow 13 0 0%
University of Birmingham 11 0 0%
All institutions > 10 spinouts 598 91 13%
*Russell Group universities are in italics for comparison

Centre for Diversity Policy Research and Practice | 21
Interestingly, of the 10 institutions with the highest representation of women founders, only six are from the Russell Group. Of the four institutions in this table who are not in the Russell Group, three are based in Scotland. It is also worth noting that the three institutions with the highest number of active spinout companies – University of Oxford, University of Cambridge and Imperial College London – all have a higher than average percentage of spinouts founded by at least one woman at 18%, 17% and 22% respectively. At the bottom end of the table, there are four universities with no women founders – University of Warwick, Swansea University, University of Glasgow and University of Birmingham. The universities of Warwick and Swansea both have over 40 active spinouts between them and yet have no women founders at all. Swansea has the most active spinouts of all Welsh universities and in order to meet the average number of women founders (13%) they should have at least three women founders amongst those twenty companies.
Table 8 Women in active spinouts across Russell Group universities
Institution Number of spinout companies
Proportion of all spinout companies
founded in the UK
Number of spinouts with at least one woman
founder
Percentage of spinouts with at least one woman
founder
Newcastle University 9 1% 3 33%
University of York 8 1% 2 25%
University of Nottingham 13 2% 3 23%
Imperial College London 51 6% 11 22%
University of Oxford 114 14% 21 18%
University of Cambridge 82 10% 14 17%
University of Bristol 24 3% 4 17%
University of Exeter 6 1% 1 17%
University of Liverpool 6 1% 1 17%
University College London (University of London) 40 5% 5 13%
University of Leeds 17 2% 2 12%
Queen’s University Belfast 21 3% 2 10%
University of Edinburgh 32 4% 3 9%
University of Manchester 26 3% 2 8%
University of Sheffield 16 2% 1 6%
University of Southampton 16 2% 1 6%
University of Warwick 21 3% 0 0%
University of Glasgow 13 2% 0 0%
University of Birmingham 11 1% 0 0%
Cardiff University 8 1% 0 0%
Queen Mary (University of London) 7 1% 0 0%
King’s College London (University of London) 6 1% 0 0%
Durham University 5 1% 0 0%
All Russell Group spinouts 552 70% 76 14%
22 | Gender and university spinouts in the UK: geography, governance and growth
Women in Russell Group spinouts
Although they have a relatively low numbers of active spinouts compared to their counterparts, the three Russell Group universities with the highest proportion of women are all located in the North of England. This is closely followed by the three most prolific spinout institutions (Imperial College London, University of Oxford and University of Cambridge) but not all institutions in the ‘golden triangle’ meet the national average number of spinouts founded by at least one woman. University College London just makes the 13% national average but King’s College London have no women founders at all. Whilst there are several (n = 7) institutions with no women spinout founders, the University of Warwick fares the worst because of all institutions with no women founders, they are the most prolific, with 3% of all active spinouts in the UK (n = 21). Because of the regional history and current presence in the motor industry, Warwick’s commercial activity focuses around engineering, which may explain the dearth of women in their spinout community.
Gender and growthThis final part of the report will switch the frame of analysis to the spinout companies themselves. It looks at the performance of spinout companies and the effect that women’s involvement has upon the outcomes. First, this section gives an overview of the size of the spinout companies across the UK, followed by a sex-disaggregated analysis of these data. The second half of this analysis looks at some of the explanatory factors behind company growth, with a focus on investment and fundraising. At every stage, women’s involvement either as a founder or C-suite member, is compared to the wider spinouts landscape. This section situates itself within a wider body of research on the financial underinvestment of companies founded by women. It provides additional evidence that women are missing out on investment, both financially and in terms of wider fundraising and high-growth activity.
Size of spinouts companies
The majority of active spinouts in the UK are small in terms of numbers of employees. More than half (56%) have less than 10 employees, which puts them in the category of micro-enterprises. A further 38% can be classified as small enterprises, as they employ 10 to 49 people. A regional analysis finds that spinouts in Northern Ireland and Wales are comparatively smaller than those in England and Scotland. These latter two nations have an advantage in the number of spinouts they have produced, and also in terms of their size. With the exception of one spinout based in a Northern Irish institution, all spinouts with above 100 employees (15 out of 747 for which employee information is available) are based in England and Scotland. Even then, the predominant position of England compared to other nations is evident, as this is where all spinouts with over 250 employees originated.

Centre for Diversity Policy Research and Practice | 23
Table 9 Number of employees in active spinouts by nation (based on location of founding institution)
Latest employee countNation
TotalEngland Northern
Ireland Scotland Wales
< 5Count 156 9 31 11 207
% within nation 27% 35% 26% 39% 28%
5 to 9Count 150 8 41 11 210
% within nation 26% 31% 34% 39% 28%
10 to 24Count 177 5 38 4 224
% within nation 31% 19% 31% 14% 30%
25 to 49Count 47 3 8 1 59
% within nation 8% 12% 7% 4% 8%
50 to 99Count 29 0 1 1 31
% within nation 5% 0% 1% 4% 4%
100 and more
Count 13 1 2 0 16
% within nation 2% 4% 2% 0% 2%
Total Count 572 26 121 28 747
When the same analysis is performed to disaggregate by sex differences, a clear pattern emerges. On the whole, women in decision-making positions are most likely to be found in smaller spinouts. In total only nine spinouts with a woman founder or co-founder have 25 employees or more. Moreover, of those spinouts that have at least one woman founder, two-thirds have less than 10 employees. Spinout companies with less than five employees are almost more likely to have 50% or more women in their C-suite than companies with five to nine employees. Whilst 16% of micro-enterprises have one or more women founder, only 6% of larger companies (50 employees or more) have one woman founder. One possible explanation is that women are involved in spinning out companies that are less successful in terms of growth. Potential structural factors related to this are explored in the next section, although from the data it is not possible to assess the extent to which this reflects ambition for growth and/or the barriers experienced by women founders. Alternatively, this result may be symptomatic of a time lag, as women’s participation in spinouts has increased over time. Larger companies will be further along in their evolution and therefore it is likely that they have been established for a decade or more, spinning out at a time when women’s representation in spinouts was even lower than it is today.

24 | Gender and university spinouts in the UK: geography, governance and growth
Table 10 Number of women founders to number of employees/size of company
Number of women founders
<5 employees
5-9employees
10-24employees
25-49employees
50-99employees
100 + employees Total
0 173 178 199 53 29 15 647
1 31 32 21 6 2 1 93
2 or more 3 0 4 0 0 0 7
Total number of active spinouts 207 210 224 59 31 16 747*
Total number of spinouts with at least one woman founder 34 32 25 6 2 1 100
Proportion of spinouts with at least one woman founder 16% 15% 11% 10% 6% 6% 13%
*data missing for 42 spinout companies.
Table 11 Percentage* of women in the C-suite to number of employees/size of company
<5 employees
5-9employees
10-24employees
25-49employees
50-99employees
100 + employees Total
No women 147 131 121 20 7 5 431
1 to 10% women 0 0 1 3 3 0 7
11 to 39% women 27 61 85 32 20 10 235
40 to 60% women 23 11 10 4 1 0 49
61 to 90% women 3 2 6 0 0 1 12
All women 7 5 1 0 0 0 13
All active spinouts 207 210 224 59 31 16 747**
Number of spinouts with at least 50% women in the C-suite
32 17 13 2 0 1 65
Percentage of spinouts with at least 50% women in the c-suite
15% 8% 6% 3% 0% 6% 9%
*Percentage used to account for variance in board size **data missing for 42 spinout companies.
Centre for Diversity Policy Research and Practice | 25
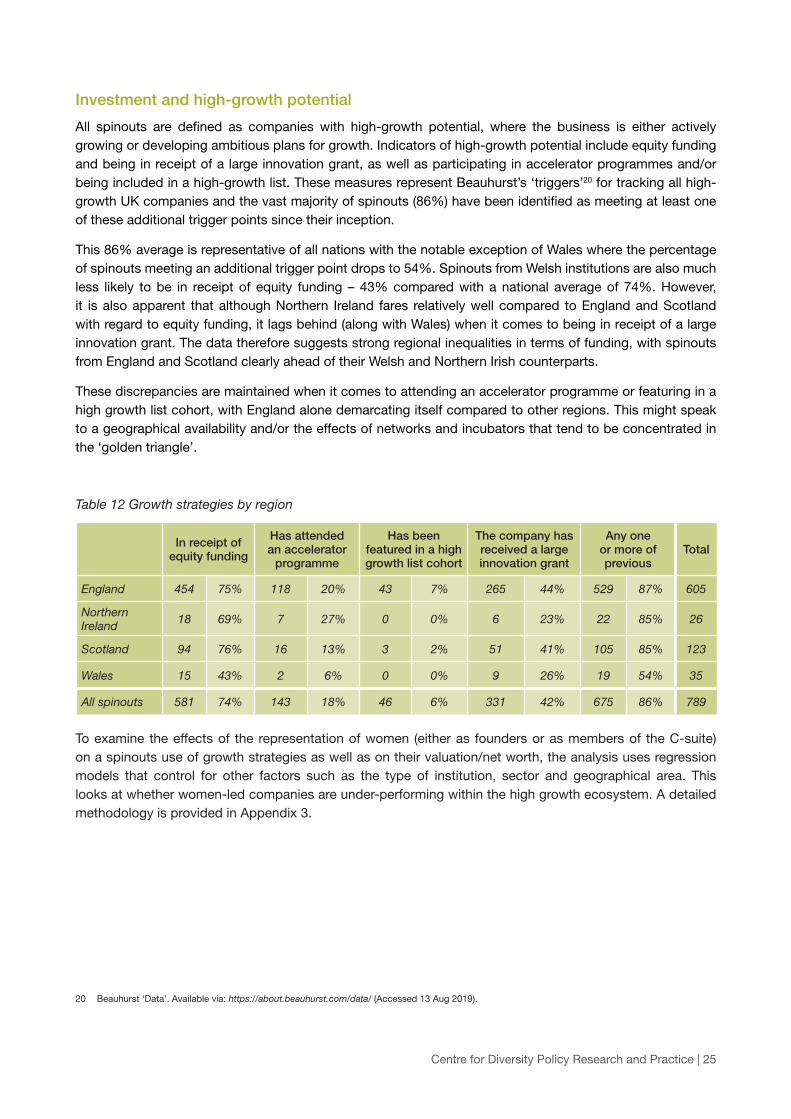
Investment and high-growth potential
All spinouts are defined as companies with high-growth potential, where the business is either actively growing or developing ambitious plans for growth. Indicators of high-growth potential include equity funding and being in receipt of a large innovation grant, as well as participating in accelerator programmes and/or being included in a high-growth list. These measures represent Beauhurst’s ‘triggers’20 for tracking all high-growth UK companies and the vast majority of spinouts (86%) have been identified as meeting at least one of these additional trigger points since their inception.
This 86% average is representative of all nations with the notable exception of Wales where the percentage of spinouts meeting an additional trigger point drops to 54%. Spinouts from Welsh institutions are also much less likely to be in receipt of equity funding – 43% compared with a national average of 74%. However, it is also apparent that although Northern Ireland fares relatively well compared to England and Scotland with regard to equity funding, it lags behind (along with Wales) when it comes to being in receipt of a large innovation grant. The data therefore suggests strong regional inequalities in terms of funding, with spinouts from England and Scotland clearly ahead of their Welsh and Northern Irish counterparts.
These discrepancies are maintained when it comes to attending an accelerator programme or featuring in a high growth list cohort, with England alone demarcating itself compared to other regions. This might speak to a geographical availability and/or the effects of networks and incubators that tend to be concentrated in the ‘golden triangle’.
Table 12 Growth strategies by region
In receipt of equity funding
Has attended an accelerator
programme
Has been featured in a high growth list cohort
The company has received a large innovation grant
Any one or more of previous
Total
England 454 75% 118 20% 43 7% 265 44% 529 87% 605
Northern Ireland 18 69% 7 27% 0 0% 6 23% 22 85% 26
Scotland 94 76% 16 13% 3 2% 51 41% 105 85% 123
Wales 15 43% 2 6% 0 0% 9 26% 19 54% 35
All spinouts 581 74% 143 18% 46 6% 331 42% 675 86% 789
To examine the effects of the representation of women (either as founders or as members of the C-suite) on a spinouts use of growth strategies as well as on their valuation/net worth, the analysis uses regression models that control for other factors such as the type of institution, sector and geographical area. This looks at whether women-led companies are under-performing within the high growth ecosystem. A detailed methodology is provided in Appendix 3.
20 Beauhurst ‘Data’. Available via: https://about.beauhurst.com/data/ (Accessed 13 Aug 2019).

26 | Gender and university spinouts in the UK: geography, governance and growth
Model 1: Effects of sex composition of the C-suite on growth strategies
Results from Model 1 provide evidence that the sex composition of the C-Suite has an effect on some of the growth strategies of spinouts. For each additional woman C-Suite member, controlling for C-Suite size and other factors, there is an increased likelihood of 29% that a spinout has taken part in an accelerator programme (eβ= 1.29, p = 0.03). This raises interesting questions about the directionality of the effect: is it that women’s presence in the C-Suite opens up opportunities that are women-only for example or that a more diverse team leads to considering different avenues for support? Alternatively, is it that spinouts respond to regulatory and/or reputation pressures by adding women in the C-Suite in order to get access to accelerator programmes?
Moreover, for each additional woman in the C-Suite, active spinout companies were 20% less likely to have received a large innovation grant (p = 0.02). The directionality of this effect also needs to be unpacked. It is unlikely that women’s positions in the C-suite undermines potential to receive large innovation grants, but instead that the types of spinouts that receive these grants might not provide an inclusive environment for women in senior executive positions.
Table 13 Logistic regression models – effects of number of women in the C-suite on growth strategies
Dependent variable
Has either received equity
funding, received a large innovation
grant, attended an accelerator programme or
featured in a high growth list cohort
Has received equity funding
Has attended an accelerator
Has been featured in a
high growth list cohort
Has received a large
innovation grant
eβ p eβ p eβ p eβ p eβ p
Number of women in the C-Suite 0.90 0.56 0.95 0.72 1.29 0.03 1.03 0.87 0.80 0.02
Size of C-Suite 1.71 0.00 1.48 0.00 0.99 0.77 1.27 0.00 1.17 0.00
Russell group 1.36 0.21 1.58 0.02 1.39 0.17 1.32 0.55 1.12 0.52
Scotland 1.02 0.96 1.45 0.15 0.68 0.22 0.57 0.40 1.04 0.85
Wales 0.35 0.01 0.54 0.12 0.43 0.26 0.00 1.00 0.59 0.21
Northern Ireland 0.83 0.75 0.88 0.80 1.39 0.49 0.00 1.00 0.40 0.06
Venture stage 0.91 0.71 1.07 0.73 1.23 0.32 0.62 0.25 1.26 0.17
Growth stage 1.33 0.52 0.95 0.87 0.98 0.96 0.38 0.35 1.61 0.09
Established stage 1.23 0.70 0.74 0.46 0.62 0.46 1.21 0.86 1.32 0.50
SIC C Manufacturing 1.30 0.42 1.12 0.66 1.54 0.11 2.17 0.07 1.27 0.28
SIC J Information and Communication 0.86 0.67 0.87 0.61 2.49 0.00 0.87 0.79 1.04 0.88
SIC M Professional Scientific or Technical 1.00 1.00 0.94 0.79 0.72 0.20 0.68 0.36 1.48 0.06
Constant 0.88 0.75 0.48 0.03 0.13 0.00 0.02 0.00 0.25 0.00
Cox & Snell R Square 0.13 0.15 0.06 0.08 0.06
Nagelkerke R Square 0.24 0.22 0.10 0.24 0.08

Centre for Diversity Policy Research and Practice | 27
Model 2: Effects of sex composition of founders on growth strategies
Overall, higher numbers of women founders has little significant effect on a company’s association with high-growth strategies. However, for each additional women founder, companies are 39% less likely to have received a large innovation grant (p = 0.02). Similarly, each additional woman founder is associated with a company being 88% less likely to feature in a high-growth list cohort (p = 0.04) which is perhaps related to the lower receipt of large innovation grants.
Model 2 model also shows that when controlling for the sex composition of founders, spinouts from Russell group universities are 75% more likely than other institutions to engage in high-growth activities and almost twice as likely to have received equity funding. In contrast, spinouts originating from Welsh institutions are 73% less likely to have engaged in high-growth activities and 40% less likely to have received equity funding. These results suggest that there is less availability and/or awareness of high-growth strategies within the Welsh Higher Education context and may explain why spinouts from Welsh universities only represent 4% of all active spinouts in the UK (see Table 5).
Table 14 Logistic regression models – effects of gender and founders on growth strategies
Dependent variable
Has either received equity
funding, received a large innovation
grant, attended an accelerator programme or
featured in a high growth list cohort
Has received equity funding
Has attended an accelerator
Has been featured in a high growth list cohort
The company has received
a large innovation
grant
eβ p eβ p eβ p eβ p eβ p
Number of founders that are women 0.87 0.65 0.76 0.25 1.41 0.14 0.12 0.04 0.61 0.02
Number of founders 1.38 0.01 1.36 0.00 1.42 0.00 1.22 0.15 1.02 0.83
Russell group or affiliated 1.75 0.02 1.91 0.00 1.33 0.24 1.68 0.22 1.27 0.18
Scotland 1.14 0.67 1.53 0.10 0.73 0.30 0.41 0.16 1.00 0.99
Wales 0.27 0.00 0.40 0.02 0.51 0.37 0.00 1.00 0.47 0.07
Northern Ireland 0.79 0.69 0.83 0.67 1.54 0.36 0.00 1.00 0.38 0.04
Venture stage 0.83 0.41 0.92 0.68 1.12 0.58 0.42 .026^ 1.15 0.41
Growth stage 1.10 0.83 0.73 0.31 0.80 0.55 0.17 .090^ 1.40 0.23
Established stage 0.85 0.75 0.49 0.09 0.61 0.44 0.60 0.63 1.04 0.93
SIC C Manufacturing 1.26 0.46 1.07 0.78 1.65 0.06 1.90 0.11 1.25 0.30
SIC J Information and Communication 0.93 0.83 0.91 0.72 2.53 0.00 1.14 0.78 1.09 0.72
SIC M Professional Scientific or Technical 1.13 0.67 1.02 0.93 0.74 0.24 0.74 0.45 1.47 0.06
Constant 3.05 0.00 1.41 0.24 0.09 0.00 0.06 0.00 0.47 0.00
Cox & Snell R Square 0.47 0.57 0.78 0.46 0.03
Nagelkerke R Square 0.84 0.83 0.13 0.13 0.04

28 | Gender and university spinouts in the UK: geography, governance and growth
Capitalisation
Spinouts can rely on grants and/or fundraisings for their capitalisation. The majority of spinouts in the Beauhurst database of active spinouts (700 out of 789) had resorted to one of these strategies. Overall, the grants and funds raised by spinouts in the UK exceed £5 billion since 2011.
In total, 497 spinouts had received at least one grant, with an average of just over three grants per spinout company. This corresponds to an average of nearly £800,000 in funds received through grants since 2011. The average figure masks the great amount of variation in the average value of the grants received by different spinouts, which range between £2,165 to over £10 million. In parallel, 586 active spinouts engaged in fundraising, also with an average of just over three investments per company. This represented an average of over £8.5 million, ranging from £5,000 to nearly £500 million.
Looking at only the last round of fundraising provides useful information on the amount involved in each round of fundraising rather than the lifetime capitalisation of spinouts. The last round averaged about £3.3 million, ranging from £5,000 to £88 million (Table 15) and had taken place, on average, in the previous two years. Spinouts were valued at an average of £16 million after capitalisation (post-money valuation), ranging from £40,000 to £1.5 billion.
Table 15 Grants and fundraisings amounts – summary statistics
Total amount received by the
company through grants
Total amount received by the
company through fundraisings
Amount received by the company
in its latest fundraising
Latest pre-money valuation
Latest post-money valuation
Mean £795,347 £8,547,711 £3,300,079 £13,226,359 £16,213,192
Median £311,800 £1,759,724 £600,000 £3,199,984 £4,191,539
Standard deviation £1,253,945 £26,862,650 £8,565,314 £71,255,449 £77,264,458
Minimum £2,165 £5,000 £5,000 £17,900 £40,000
Maximum £10,925,000 £492,722,794 £88,400,000 £1,438,309,036 £1,538,306,341
Sum £380,175,719 £4,906,385,985 £1,844,744,218 £7,142,234,095 £8,755,123,783
n 478 574 559 540 540
Model 3: Funding and valuation: women spinout founders
Companies with more women founders receive lower amounts through fundraising and their companies tend to receive a lower pre-money valuation. There is some evidence that these companies are less likely to receive money from grants (large or small) but this is less statistically significant (p = 0.08). On the whole, the more women founders a spinout company has, the less financial investment it receives. These findings support the claim that companies founded by women are receiving smaller amounts of investment than companies led by men.
This model also includes data on funds received by Russell Group universities. As earlier analysis has shown, the Russell Group is home to 70% of all active spinouts in the UK and the results in Table 14 indicate that spinouts from these institutions generate twice as much investment through fundraising as companies from non-Russell Group institutions. This might reflect the ability for Russell Group institutions to access more and/or better networks and investor connections, while also leveraging their elite status to gain credibility in the eyes of the investors. This linear regression analysis also reveals that spinouts from Russell Group institutions receive more than one and a half times (57%) more investment through grant funding and obtain pre-money valuations that are 48% higher. Overall, spinouts located in Russell group institutions were more likely to have received grants and funds with associated higher valuation and networth.

Centre for Diversity Policy Research and Practice | 29
Tab
le 1
6 Li
near
reg
ress
ion
– ef
fect
s of
sex
and
foun
der
s on
cap
itals
rec
eive
d a
nd n
et w
orth
Dep
end
ent
vari
able
Tota
l am
oun
t re
ceiv
ed b
y th
e co
mp
any
thro
ugh
gra
nts
(GB
P) -
log
ged
Tota
l am
oun
t re
ceiv
ed
by
the
com
pan
y th
roug
h fu
ndra
isin
gs
(GB
P) -
log
ged
Am
oun
t re
ceiv
ed b
y th
e co
mp
any
in it
s la
test
fu
ndra
isin
g (G
BP
) - lo
gg
ed
Late
st p
re-m
one
y va
luat
ion
-lo
gg
edN
et w
ort
h
βan
tilog
(β)
pβ
antil
og(β
)p
βan
tilog
(β)
pβ
antil
og(β
)p
βp
(Con
stan
t)5.
3220
8449
.00
0.00
5.99
9705
09.0
00.
005.
5635
9749
.00
0.00
6.40
2517
676.
000.
00-5
1321
8.00
0.59
Num
ber
of f
ound
ers
th
at a
re w
omen
-0.1
60.
69.0
75
-0.3
30.
460.
00-0
.24
0.57
0.01
-0.2
10.
610.
01-2
0566
3.00
0.79
Foun
der
(num
ber
)-0
.01
0.98
0.75
0.01
1.02
0.84
0.07
1.18
0.02
0.03
1.08
0.22
4081
95.0
00.
12
Rus
sell
grou
p0.
201.
570.
010.
342.
180.
000.
261.
800.
000.
171.
480.
0213
3167
6.00
0.04
Sco
tland
0.01
1.03
0.88
-0.1
50.
700.
13-0
.25
0.57
0.01
-0.1
20.
760.
1410
5277
.00
0.89
Wal
es-0
.21
0.62
0.20
-0.2
40.
570.
31-0
.50
0.31
0.03
-0.2
40.
570.
2439
4818
.00
0.77
Nor
ther
n Ir
elan
d-0
.63
0.24
0.00
-0.3
60.
440.
08-0
.32
0.48
0.11
-0.4
20.
380.
01-3
0645
5.00
0.84
Vent
ure
stag
e-0
.04
0.91
0.51
-0.1
60.
700.
05-0
.10
0.79
0.17
-0.1
90.
650.
00-7
4919
7.00
0.21
Gro
wth
sta
ge-0
.20
0.63
.056
^-0
.31
0.49
0.02
-0.2
90.
510.
03-0
.34
0.45
0.00
-110
4432
.00
0.28
Est
ablis
hed
sta
ge0.
031.
060.
88-0
.32
0.48
0.13
-0.2
40.
580.
24-0
.48
0.33
0.01
-774
931.
000.
60
SIC
C
Man
ufac
turin
g0.
111.
300.
200.
141.
380.
170.
061.
150.
540.
101.
240.
2420
6262
.00
0.79
SIC
J In
form
atio
n an
d C
omm
unic
atio
n0.
041.
090.
71-0
.05
0.88
0.62
0.00
1.01
0.97
0.01
1.01
0.95
7970
1.00
0.93

30 | Gender and university spinouts in the UK: geography, governance and growth

Centre for Diversity Policy Research and Practice | 31
CONCLUSIONThis report has provided a unique overview of the UK spinouts landscape by disaggregating data on all active spinout companies by sex. The focus has been on geography, governance and growth to understand where in the UK women are represented in spinouts, the extent of their involvement in spinning out IP and the relationship between women founders and executives and company growth.
Scotland and Northern Ireland had the highest number of spinouts per institution but only 12% of those spinouts had one or more woman founders. Universities Scotland are actively encouraging innovation and commercialisation of research through their Five Point Plan for Innovation but the Statement of shared principles for Spin-Out Company formation21, signed by all Scottish institutions, makes no reference to issues of diversity and inclusion or widening participation as part of spinout creation and governance. Although the climate in Scottish institutions may be more conducive to commercialising research, the current framework does little to acknowledge or address the underrepresentation of women in spinouts and academic entrepreneurship more widely.
In England, the highest proportion of women spinouts founders were from institutions in the Oxford-Cambridge-London ‘golden triangle’. London had the highest percentage of women founders at 18%, a figure boosted by the Royal College of Art (RCA) where 43% of their 28 spinouts had at least one woman founder. Further research is needed to understand more about the RCA’s approach to entrepreneurship and gender. Over the last few years, they have been credited with having the highest number of student spinouts in the UK22 and the institution as a whole has a mean gender pay gap, which is half the national average in HE23. Furthermore, InnovationRCA24 (the university’s centre for enterprise and entrepreneurship), is led by a woman and has a gender balanced team. This suggests that the institution is more gender diverse than many of its peers and also that it may take a different approach to innovation which recognises student IP as viable for spinning out, as supposed to perceiving spinout creation as something for academics later in their careers.
This is a stark contrast to institutions at the other end of the scale, such as Warwick and Swansea, who have no women founders despite having over 40 spinouts between them. These findings suggest that as well as the entrepreneurial intention of their staff and students, local and institutional history may be influencing the type of design and innovation that is encouraged. Whilst the RCA specialise in design through art and creativity, Warwick and Swansea are embedded in regional histories built on material sciences and engineering. This approach allows these institutions to capitalise on local expertise and create profitable partnerships but it inadvertently promotes innovation in subjects that are traditionally perceived as masculine and still predominantly occupied by men.
Results across Russell Group institutions were mixed. The Russell Group is responsible for producing 70% of all spinouts in the UK but has less than the average number of women founders (11%). Spinouts from Oxford and Cambridge account for almost a quarter of all spinouts in the UK and have a higher than average number of spinouts founded by women, at 18% and 17% respectively. Yet almost one in three Russell Group universities had no spinouts founded by women. This is important as spinouts from the Russell Group were found to have higher pre-money valuations than those from other institutions and received substantially more grant money and funding. Russell Group universities have the resources, networks and reputations that enable them to promote innovation but it appears that women are not engaged in these areas to the same extent as men.
21 Universities Scotland, Statement of shared principles for Spin-Out Company formation Available at: https://www.universities-scotland.ac.uk/wp-con-tent/uploads/2019/02/Spin-Out-Statement-2017-US191017-1.pdf (Accessed 31 July 2019).
22 Royal College of Art InnovationRCA Available at: https://www.rca.ac.uk/research-innovation/innovationrca/ (Accessed 31 July 2019).
23 Royal College of Art Equality and Diversity Available at: https://www.rca.ac.uk/more/about-rca/official-information/equality-diversity/ (Accessed 31 July 2019).
24 Royal College of Art InnovationRCA: About Available at: https://www.rca.ac.uk/research-innovation/innovationrca/about/ (Accessed 31 July 2019).

32 | Gender and university spinouts in the UK: geography, governance and growth
The analysis in this report also considered the proportion of women represented in the C-suites of spinouts as these are recognised as the most influential positions within an organisation. The average size of a spinout C-suite, across all stages of evolution, was 4.6 members of which 4 were men and 0.6 were women. There is some inevitable overlap here as many women founders will also take positions in the C-suite, but this is not always the case. The C-suite tends to consist of business ‘experts’ brought in to help grow the company by focusing on the commercial side of the business. These experts tend to be men and early findings from our qualitative research suggests that many C-suite positions in small spinouts are appointed by reputation through established networks. Whilst this long-established recruitment process is considered the norm across the business world, it perpetuates the continued lack of women in senior business roles and in entrepreneurship more widely. As more women prove themselves as successful spinout and start up founders, this pattern is slowly starting to change but it is an area where unconscious bias and gender-blind procedures are commonplace, meaning that the proportion of women executives in spinouts is lower than in the wider economy.
As well as governance and power, the analysis also focused on spinout growth. Three quarters of spinouts were either in seed or growth stages and over half employed less than 10 people. Of these, only 16% of spinout companies had more than one woman founder and larger companies tended to have an even smaller proportion of women founders. Only 6% of the 47 spinouts with more than 50 employees had one woman founder. This could be symptomatic of the more recent propensity for women to found spinouts compared to several years ago25. Whilst job creation has been a common measure of entrepreneurial success in recent years, government strategies are now shifting the focus to productivity in the form of economic contribution. This strategy may suit women founders who are making valuable contributions to the economy but are lacking the resources to quickly grow their businesses.
Such resources are measured in the report by analysing the high-growth measures (or triggers) associated with individual spinout companies. Interestingly, for each additional woman C-suite member a spinout has, it is significantly more likely to participate in an accelerator programme but there is less evidence to suggest this is true when a spinout has more woman founders. More worryingly though, for each additional woman founder or C-suite member, a spinout is significantly less like to receive a large innovation grant and is associated with receiving less investment overall. This finding suggests a paradox where spinouts led by women are receiving smaller resources to grow which in turn makes their companies less eligible for larger investment. The reasons for this are unclear but one possible explanation is that women are undervaluing their businesses and/or requesting smaller sums of investment than men. It may also be a consequence of the type of innovation women are commercialising – as some sectors command or require greater investment than others – as well as some women having limited access to certain investment and support networks.
Analysis of spinouts by industry sector found no discernible underrepresentation of women in STEM based companies but that they are overrepresented in ‘other’ sectors. SIC codes are used to group companies into categories so Companies House, and other state level bodies, can measure business activity in different sectors. Despite an abundance of sub-categories to choose from, these SIC descriptions mask the complexity of a company’s operations and give no indication to the specialisms of those involved in setting up and running the business. The academic background of spinout founders and executives is not included in the Beauhurst database but additional research conducted by the Centre for Diversity Research and Practice indicates that around 9 out of 10 women spinout founders have qualifications in STEM subjects. This same analysis shows that trying to dissect spinout companies and their founders according to academic discipline or industry is, perhaps, highlighting a disparity between academia and the realities of the commercial world. Innovation, by its nature, tends to be interdisciplinary. As are those who innovate.
25 Elsevier (2017) Gender in the Global Research Landscape. Available at: https://www.elsevier.com/data/assets/pdf_file/0008/265661/ElsevierGender-Report_final_for-web.pdf (Accessed 11 March 2019).

Centre for Diversity Policy Research and Practice | 33
Next StepsThis report represents the first phase of data analysis in this mixed methods project, funded by the EPSRC and conducted by The Centre for Diversity Policy Research and Practice at Oxford Brookes University, in collaboration with Oxford University. High-level quantitative analysis, such as this, inevitably generates as many questions as it does answers and further research is often needed to address this. It is hoped that the overall research design of this project will go some way to doing so.
At the same time as writing the report, interviews have been conducted with spinout founders across the UK, the analysis of which will be contextualised within the findings of this report. Semi-structured interviews have been conducted with women and men spinout founders - as well as with key stakeholders from inside and outside the institutions – and focus group workshops are being conducted with staff and doctoral students at several universities. These techniques ensure that evidence is gathered from stakeholders at different positions within the spinout environment to provide a deeper understanding of how the spinouts ecosystem is experienced as gendered.
This qualitative research will develop the ideas discussed in this report and extend the analysis to understand more about the individual experience of spinning out. It will explore whether men and women had different experiences when founding and growing their spinout companies, including the support they received and the challenges they faced. It may also shed more light on the interdisciplinarity of STEM spinouts by asking founders about their journey to spinning out as well as those they have worked with along the way.
The focus group workshops with staff and doctoral students are designed to tap into a community of stakeholders who are often overlooked in research into university spinouts – those who have not yet commercialised their research. This group includes those who have seed ideas they wish to explore further, right through to those who have never even considered commercialising their work. This area of the research aims to gauge the level of awareness staff and students have about the possibilities to spinout and commercialise their research. It also seeks to understand whether women and men perceive different barriers to commercialisation and if these perceptions change depending on career stage.
Ultimately, this project hopes to promote academic entrepreneurialism at the institutional level by encouraging senior leaders and key stakeholders to foster an inclusive environment for enterprise. As well as improving the underrepresentation of women in spinouts, institutions can also work to ensure women spinout founders are supported to grow their business by reviewing commercialisation policies and practices through the lens of gender. Project outputs will also target researchers by providing materials that actively encourage women to consider academic entrepreneurship and spinning out, such as tools to demystify the process of spinning out and by promoting visible role models to inspire future women spinout founders.

34 | Gender and university spinouts in the UK: geography, governance and growth

Centre for Diversity Policy Research and Practice | 35
APPENDICESAppendix 1: Stages of spinout evolution (source Beauhurst)
StagePercentage
of spinouts at each stage
Description
Seed 49%
A youngish company with a small team, low valuation and funding received (low for its sector), uncertain product-market fit or just getting started with the process of getting regulatory approval. Funding likely to come from grant-awarding bodies, equity crowdfunding and business angels.
Venture 26%A company that has been around for a few years, has either got significant traction, technology or regulatory approval progression and funding received and valuation both in the millions. Funding likely to come from venture capital firms.
Growth 7%
A company that has been around for 5+ years, has multiple offices or branches (often across the world), has either got substantial revenues, some profit, highly valuable technology or secured regulatory approval significant traction, technology or regulatory approval progression, funding received and valuation both in the millions. Funding likely to come from venture capital firms, corporates, asset management firms, mezzanine lenders.
Established 3%
A company that has been around for 15+ years, or 5-15 years with a 3-year consecutive profit of £5m+ or turnover of £20m+. It is likely to have multiple (often worldwide) offices, be a household name, and have a lot of traction. Funding received, if any, is likely to come from corporates, private equity, banks, specialist debt funds and major international funds.
Exited 10%The company has done an IPO or been acquired. (MBOs are not considered to be exits, i.e. reasons to stop tracking companies, but rather a trigger for starting to track a company.)
Zombie 2%The company’s website and/or social media presence show prolonged neglect and/or its Companies House status is somehow troubled – Administration, Liquidation, Dissolution First Gazette, etc.
Dead 2%The company has met one or more of these conditions: it has declared it has definitively ceased all activity, its top parent company has been dissolved, it has been at Zombie stage for a prolonged period of time.

36 | Gender and university spinouts in the UK: geography, governance and growth
Appendix 2: Number of spinouts by institution
Institution
Number of total Spinouts in Beauhurst’s
database
Number of spinouts active on companies
house
Number of spinouts
analysed for this report
(excluding ‘exited’, ‘’zombie’ & ‘dead’)
Research Institute
University of Oxford 131 126 114
University of Cambridge 107 92 82
Imperial College London 76 64 51
University College London (University of London) 52 47 40
University of Edinburgh 41 34 32
Royal College of Art 30 29 28
University of Manchester 36 32 26
University of Strathclyde 35 29 26
University of Bristol 28 27 24
Queen’s University Belfast 31 24 21
University of Warwick 31 26 21
Swansea University 29 20 20
University of Leeds 21 19 17
University of Sheffield 18 18 16
University of Southampton 21 18 16
Heriot-Watt University 20 17 14
University of Aberdeen 18 16 13
University of Glasgow 18 14 13
University of Nottingham 19 16 13
University of Birmingham 17 14 11
Newcastle University 16 12 9
University of Dundee 11 11 9
Cardiff University 14 13 8
University of St Andrews 11 8 8
University of York 11 10 8
Queen Mary (University of London) 12 11 7
University of East Anglia 7 7 7
University of Surrey 10 9 7
King’s College London (University of London) 9 8 6

Centre for Diversity Policy Research and Practice | 37
University of Exeter 8 6 6
University of Liverpool 9 7 6
Durham University 10 7 5
Lancaster University 11 6 5
University of Bath 8 6 5
University of Ulster 14 10 5
Bangor University 5 4 4
City University 5 4 4
Coventry University 6 5 4
Edinburgh Napier University 6 5 4
University of Bradford 4 4 4
University of Plymouth 5 4 4
Aston University 3 3 3
Loughborough University 7 4 3
Science and Technology Facilities Council (STFC) 8 6 3 Y
St George’s (University of London) 3 3 3
University of Leicester 6 4 3
University of Salford 4 4 3
University of Teesside 4 3 3
Aberystwyth University 2 2 2
Goldsmiths (University of London) 2 2 2
Keele University 3 2 2
Nottingham Trent University 2 2 2
Oxford Brookes University 2 2 2
Robert Gordon University 4 2 2
Rutherford Appleton Laboratory 2 2 2 Y
Staffordshire University 3 2 2
University of Hertfordshire 3 3 2
University of Kent 2 2 2
University of Wolverhampton 2 2 2
Babraham Institute 1 1 1 Y
Brunel University 5 2 1
Cardiff Metropolitan University 1 1 1
Cranfield University 1 1 1

38 | Gender and university spinouts in the UK: geography, governance and growth
Culham Centre for Fusion Energy 1 1 1 Y
Falmouth University 2 1 1
John Innes Centre 1 1 1 Y
London School of Hygiene and Tropical Medicine (University of London) 1 1 1
Moredun Research Institute 1 1 1 Y
National Physical Laboratory (NPL) 1 1 1 Y
Royal Holloway (University of London) 1 1 1
Royal Veterinary College (University of London) 1 1 1
The Francis Crick Institute 1 1 1 Y
University of Central Lancashire 1 1 1
University of Essex 2 1 1
University of Greenwich 2 1 1
University of Lincoln 1 1 1
University of Northampton 1 1 1
University of Portsmouth 1 1 1
University of Reading 1 1 1
University of Sussex 3 2 1
University of the West of England 2 2 1
University of the West of Scotland 2 1 1
Centre for Ecology & Hydrology 1 0 0 Y
De Montfort University 4 1 0
Defence Science and Technology Laboratory (DSTL) 1 0 0 Y
Institute of Cancer Research (University of London) 1 0 0 Y
Laboratory of Molecular Biology 1 1 0 Y
Liverpool John Moores University 1 0 0
MRC/Cancer Research UK/BHF Clinical Trial Service Unit & Epidemiological Studies Unit (CTSU)
1 1 0 Y
Sheffield Hallam University 1 1 0
University of South Wales 2 2 0
Totals 1080 921 789
Note: some spinouts are partnerships between two university (one in York and Durham; two in Cambridge and Imperial; one in Oxford and Imperial; one in Queen Mary and Imperial; one in Birmingham and Imperial; one in the Francis Crick Institute and King’s College; two Imperial and Royal College of Art; one in Bristol and Bath; two in Glasgow and Edinburgh; one in Kent and Essex; one in Strathclyde and Glasgow; one in Cranfield and Nottingham)

Centre for Diversity Policy Research and Practice | 39
Appendix 3
Methodology
The analysis was performed using Excel and SPSS v 25.
Variables on growth strategies are examined using a logistic model since it consists of a binaryoutcomes, i.e. 1 when applies and 0 otherwise.
Variables on capitalisation and net worth are used in linear regression models, with log10
transformations for all variables except net worth to address the right-skewness of the distribution.
Throughout, coefficients are presented exponentiated or antilogged where appropriate.
Variance Inflation Factors (VIFs) were assessed, and as all values rested between 1 and 2, there is noevidence that multicollinearity may be of concern.

40 | Gender and university spinouts in the UK: geography, governance and growth
AUTHORSDr Heather Griffiths
Heather Griffiths joined the Centre for Diversity Policy Research and Practice as a Research Assistant after completing her PhD in Sociology at the University of Warwick. Her ESRC funded doctorate explored how gender is embedded in flexible working practices, paying particular attention to the ways time and work are negotiated between employees. Heather’s research interests are around gender and work, work life balance and feminist organisational theory and she is keen to extend these interests to include feminist theories on time, to critique the rhythms and routines of everyday life.’
Dr Anne Laure Humbert
Dr Anne Laure Humbert, PhD, is a Reader in Gender and Diversity and Director of the Centre for Diversity Policy Research and Practice at Oxford Brookes University. Anne is very experienced in gender equality research at national and EU level, policy analysis and assessment as well as gender statistics. She specialises in applying advanced quantitative methods to comparative social and economic analysis, particularly in relation to work and organisations, entrepreneurship, and work-life balance. Relevant work to this project includes several publications on gender and entrepreneurship as well as women’s representation in STEM.

Centre for Diversity Policy Research and Practice | 41
Professor Simonetta Manfredi
Professor Simonetta Manfredi is Associate Dean for Research and Knowledge Exchange (ADRKE) at Oxford Brookes Business School. Her area of research expertise is on equality and diversity issues in the workplace with a focus on applied diversity policy research in HE. She has led a number of studies, and knowledge exchange initiatives funded by Equality Challenge Unit, HEFCE, the Leadership Foundation for Higher Education and the European Social Fund on women’s career and participation in leadership roles in HE. In 2009 she led a study on the implementation of equality guidance in RAE 2008 and the recommendations from this work underpinned HEFCE equality guidance for REF 2014.
Professor Linda King
Professor Linda King is the Pro Vice-Chancellor for Research and Global Partnerships at OBU and the Project Primary Investigator. She has led two successful Athena Swan Bronze Institutional applications and a Faculty Silver award; she leads on AS for OBU. She played an integral role in the establishment of Oxford Expression Technologies (OET), trading initially under Oxford Brookes Enterprises Ltd, from 1997 and was co-founder of spinout OET Ltd in 2007.
Professor Helen Byrne
Professor Helen Byrne is an applied mathematician whose research focuses on the development and analysis of mathematical models of biomedical systems. She is Director of Equality and Diversity at the Mathematical, Physical and Life Sciences Division at the University of Oxford.
CORE PROJECT TEAMOur Partners

42 | Gender and university spinouts in the UK: geography, governance and growth
Yasmin Marshall
Yasmin Marshall joined the Centre for Diversity Policy Research and Practice in 2018 after completing her Master’s degree in International Relations at Oxford Brookes. Her dissertation examined the types of gender discriminations that women political leaders face when running for national office. Yasmin is interested in intersectionality, gender discrimination and equalities issues in the workplace.
Dr Louise Grisoni
Dr Louise Grisoni is a Senior Research Fellow with over 30 years’ experience in Higher Education. Formerly she worked as Head of Department and ADRKE. Her current research focus is on equality and gender, gendered relationships, women’s career and work-life balance. She is widely published in this area.
Dr Kate Clayton-Hathway
Dr Kate Clayton-Hathway is a Research Fellow within the Centre for Diversity Policy Research and Practice at Oxford Brookes University and has a long-standing interest in equalities issues. She has extensive experience as a qualitative researcher, conducting interviews and running focus groups. Prior to this, she built on a professional services career, specialising in HR operations consulting to work as a diversity consultant and trainer delivering equalities workshops for a range of public sector organisations.

Centre for Diversity Policy Research and Practice | 43
Alexis Still
Alexis Still joined the Centre for Diversity Policy Research and Practice in September 2019 as a Research Assistant. She previously held a post at COMPAS at the University of Oxford where she worked in Communications and previously completed her Master’s degree in Social Anthropology. She has a particular interest in cultural constructions of gender, migration, social justice and mental health.
Dr Charoula Tzanakou
Dr Charikleia Tzanakou holds a PhD in Employment Research (with focus on early career paths of researchers) from the University of Warwick. Her research interests are academic careers, highly skilled migration, gender equality and transitions from education to employment. She is currently a Senior Research Fellow in the Centre for Diversity Policy Research and Practice at Oxford Brookes University. Charoula is also co-leading a workpackage on careers and culture change on a Horizon 2020 project around gender equality in academia (PLOTINA).

44 | Gender and university spinouts in the UK: geography, governance and growth
Vitae
Vitae is the global leader in supporting the professional development of researchers, experienced in working with institutions as they strive for research excellence, innovation and impact. They are a non-profit programme, part of The Careers Research and Advisory Centre (CRAC) Ltd with nearly 50 years’ experience in enhancing the skills and careers of researchers. They strengthen institutional provision for the professional development of researchers through research and innovation, training and resources, events, and consultancy membership.
Benedetta Magri
Benedetta Magri is the Manager of the International Labour Standards, Rights at Work and Gender Equality Programme at the International Training Centre of the International Labour Organization (ITCILO). She has worked for ITCILO as an expert in training and capacity building for gender equality and non-discrimination in the world of work for some 25 years. She has managed many large-scale capacity building projects – at international and EU level - and authored toolkits and training materials on this topic. She has extensive experience in gender mainstreaming and in participatory gender audit methodologies, as tools for change and gender action planning at organisational level, including in higher research institutions. More recently she has been particularly active in programmes aiming to prevent and address gender-based violence and harassment in the world of work.
Norma Jarboe
Norma Jarboe has extensive experience in women’s development and diversity and has worked at senior levels in public/private partnerships, the private sector and the not-for -profit sector. She was previously Director of Opportunity Now (1999-2008), the UK’s leading employer network to advance women in the workplace. Norma is the founder and director of WomenCount which benchmarks the participation of women in leadership roles in Higher Education. She is also past Chair and Trustee of the Women’s Equality Network Wales which is funded by the Welsh Assembly Government
OUR PARTNERS

Centre for Diversity Policy Research and Practice | 45
Dr Michele Barbour
Dr Michele Barbour is the inventor of Pertinax technology, CEO of Pertinax Pharma and is a respected academic in the field of biomaterials, having published over 50 peer-reviewed publications in the field. As well as her role in Pertinax, Michele is Reader in Biomaterials at the University of Bristol where she leads a research group, teaches undergraduate students and serves as Deputy Head of Bristol Dental School.
Ana Avaliani
Ana Avaliani is the Head of Enterprise at the Royal Academy of Engineering and is responsible for the development and implementation of the Enterprise Hub strategy. Having started her career in a technology start up Ana has worked in public and private sector organisations in policy, R&D and consulting roles. Ana’s expertise is in operations, change management and innovation management.
ADVISORY BOARD
Dr Olivia Champion
Dr Olivia Champion is the co-founder and CEO of BioSystems Technology and was named one of 50 entrepreneurs by world leading university business incubator, SETsquared, in 2017. She has been a research Fellow at Exeter University for over nine years and earlier in her career was a Clinical Scientist at Public Health England and an Intern with the World Health Organisation. During her career, she has published over 20 peer reviewed research articles, six book chapters and filed two patents.

46 | Gender and university spinouts in the UK: geography, governance and growth
Professor David Gavaghan
David Gavaghan is a Professor in Computational Biology. Along with being the Director of EPSRC-funded Doctoral Training Programme he also chairs the Department of Computer Science’s Equality and Diversity Committee; and in recognition of his commitment to gender equality initiatives, the department gained a Bronze Athena SWAN award in April 2015.
Ahmed Goga
Ahmed is the Director of Strategy and Programmes at OxLEP and leads a variety of high-profile strategic programmes with global impact, including continued involvement in Oxfordshire’s growth deal and the county’s response to the government’s industrial strategy.
Dr Katy Gearing
Dr Katy Gearing is the Head of Industry Engagement at the Royal Society. She previously studied biochemistry at St Catherine’s College, Oxford, graduating with a PhD in 1989. She has since worked extensively in industry in the fields of biotechnology and pharmaceuticals. She joined the Royal Society in 2016 as Head of Industry Engagement and is leading on growing the Society’s links with industry.
Dr Hamish McAlpine
Dr Hamish McAlpine is Head of KE data and evidence at Research England, part of UK Research and Innovation (UKRI). Hamish looks after data and evidence for knowledge exchange, including the HE-BCI survey and forthcoming KEF metrics exercise. He has a particular interest in EDI issues in University enterprise and entrepreneurship, and has extensive experience of the HE sector, most recently at the University of Bristol where he managed large, industrially engaged research projects.

Centre for Diversity Policy Research and Practice | 47
Dr Sue O’Hare
Dr Sue O’Hare is a knowledge transfer professional working in innovation and enterprise, managing the European Space Agency’s UK business incubator at the STFC Rutherford Laboratory at Harwell, Oxfordshire. She is also a member of the Advisory Group at TeenTech CIC, an organisation to help young teenagers see the wide range of career possibilities in Science, Engineering and Technology.
Nicola McConville
Nicola is a corporate lawyer and Partner at Taylor Vinters. She has a passion for advising on spinouts from universities and other institutions, recently spear heading a project to produce the first report examining the spin out sector in the UK. She has personally advised over 75 start-ups and spin outs from Oxford University, as well as several from other institutions, from spin-out stage and through several subsequent funding rounds and exit.
Dr Lesley Thompson
Dr Lesley Thompson joined Elsevier in 2016 as Director Academic & Government Strategic Alliance in the UK. Prior to joining Elsevier, Lesley worked for 26 years at the Engineering and Physical Sciences Research Council, EPSRC, the largest of the UK’s 7 Research Councils.

48 | Gender and university spinouts in the UK: geography, governance and growth