in vitro metabolism of cannabigerol in several mammalian species
TRANSCRIPT
BIOMEDICAL AND ENVIRONMENTAL MASS SPECTROMETRY, VOL. 19, 545553 (1990)
In vitro Metabolism of Cannabigerol in Several Mammalian Species
D. J. Harvey? and N. K. Brown University Department of Pharmacology, South Parks Road, Oxford OX1 3QT, UK
Microsomal incubations were prepared from the livers of male mice, rats, cats, guinea-pigs, hamsters and gerbils and both male and female rabbits and were incubated with cannabigerol (CBG), a constituent of marihuana. Metabolites were extracted with ethyl acetate, concentrated by chromatography on Sephadex LH-20 and examined as trimethylsilyl (TMS) and (*H,)TMS derivatives by gas chromatography/mass spectrometry. Structural eluci- dation was aided by hydrogenation of the metabolites to tetrahydro derivatives. Similar metabolites were produced by each of the species but the ratios of the individual compounds differed considerably. Twelve metabolites were identified. The major metabolites were monohydroxy compounds with the hydroxyl group at C-8‘, C-9, C-4’ or at one of any position of the pentyl chain. Reduction of the del ta4 double bond was prominent in the cat to give 8’-hydroxy-6‘,7’-dihydro-CBG. The other major metabolic route was epoxidation of this double bond and hydro- lysis to give 6,7’-dihydroxy-6‘,7’dihydro-CBG. Although epoxidation of the other double bond was detected, the resulting metabolite was present in low concentration and hydrolysis was not observed. The mass spectral fragmen- tation of CBG and its metabolites was dominated by formation of the tropylium ion by cleavage of the C-l’-C-2’ bond and by ions formed by cleavage of the C-3’-C-4‘ and C-4‘-C-5’ bonds. In addition, compounds containing hydroxylation at C-l”-C-4” (pentyl chain) gave rise to the same abundant diagnostic ions that have been observed for corresponding metabolites of other cannabinoids.
INTRODUCTION
Most of the pharmacological activity of marihuana is associated with the cannabinoids, a group of terpene- related compounds unique to the plant Cannabis satiua L. Over 60 of these compounds have been identified to date’ and their relative abundance has been shown to be dependent on both geographical origin and age of the sample. Delta-9-tetrahydrocannabinol (delta-9- THC), cannabidiol and cannabinol are the most abun- dant cannabinoids in the majority of samples, and the metabolism of these compounds has been extensively studied.’ Metabolites of delta-9-THC, the major psy- choactive constituent, contribute significantly to the drug’s pharmacological profile.
Among the less abundant cannabinoids whose metabolism has not yet been studied is cannabigerol (CBG, I), a biochemical precursor of the above major cannabinoids. Although normally of low relative con- centration in cannabis samples, CBG has recently been reported to be the major cannabinoid in a strain of can- nabis from F r a n ~ e . ~ It is active in reducing intra-ocular
9’ I I OH
CBG, I
t Author to whom correspondence should be addressed.
0887-6 134/90/0905454!9 %05.00 0 1990 by John Wiley & Sons, Ltd.
pressure: a property it has in common with delta-9- THC, and which suggests its possible use for the treat- ment of glaucoma. This paper reports the in uitro metabolism of this cannabinoid in seven common laboratory species with metabolite identification by gas chromatography/mass spectrometry (GC/MS).
MATERIALS AND METHODS
Materials
CBG was obtained from the National Institute on Drug Abuse (NIDA) and was found to give a single peak by GC (trimethylsilyl (TMS) derivative). CBG was also synthesized by condensation of olivetol (1.0 g) with geraniol (0.87 g) according to the method of Mechou- lam and Yagen.5 The crude product (1.85 g) was puri- fied by chromatography on a silica-gel column (500 mm x 40 mm) using hexane containing increasing proportions of ether. The product (200mg) was eluted with a 6% (by volume) mixture of ether in hexane and this gave a single peak by GC as its TMS ether. GC/MS and nuclear magnetic resonance (NMR) properties were identical to those of the authentic material.
Tetrahydrocannabigerol. This was synthesized from CBG (50 pg) by hydrogenation in methanol (0.5 ml) over a 10% Pd/C or a 5% rhodium/alumina catalyst for 5 min at room temperature. The catalyst was removed by cen-
Received I8 December 1989 Accepted 15 April 1990
Received at Wiley 18 May 1990
546 D. J. HARVEY AND N. K. BROWN
trifugation and the ethanol was evaporated with a stream of nitrogen.
8-Hydroxy-CBG. CBG (10 mg) was converted into its acetate by allowing it to stand for 1 h with a 10% solu- tion of acetic anhydride in pyridine. After dilution of the solution with water, the product was extracted with ethyl acetate (3 x 10 ml), washed with water (1 x 10 ml), sodium bicarbonate solution (1 x 10 ml), water (1 x 10ml) and saturated sodium chloride solu- tion (2 x 10ml). GC/MS showed quantitative conver- sion to the bis-acetate. This compound (1 mg) was dissolved in a 9 : 1 (v/v) mixture of chloroform and dimethylsulphoxide (DMSO) (1 ml) and reacted with N,N- 1,l -tetramethyl-2-((selenino)oxy)ethylamine oxide and 4,5-dichloro-3,6-dioxo- 1,4-~yclohexadiene- 42- dicarbonitrile (DDQ) according to the method described by Fretz and Woggon.6 The former reagent was prepared by the reaction of 1,1,N,N-tetramethyl- ethanolamine with hydrogen peroxide followed by addi- tion of microcrystalline selenium dioxide (W.-D. Woggon, private communication). After 30 min the reaction mixture was filtered through a silica-gel column (100 x 10 mm) using a 1 : 1 (v/v) mixture of ether and hexane. The solvent was removed under reduced pressure and the product, dissolved in dry ether (2 ml), was reduced with an excess of lithium aluminium hydride. The resulting allylic alcohol (8'-hydroxy-CBG) was extracted using standard procedures and examined as its TMS derivative by GC/MS.
Animals. Details of the animals used are listed in Table 1. All animals were male unless stated.
Preparation of microsomes
Animals were killed by cervical dislocation, the livers were removed and homogenized at 4 "C in phosphate- buffered saline (pH 7.4) equal to 3 x the weight of liver. The homogenate was centrifuged at 20000 x g for 30min and the supernatant was centrifuged for a further 60 min at 105000 x g. The crude microsomal pellet WiIS resuspended in phosphate-buffered saline (pH 7.4) and centrifuged for a further 60min at 105000 x g. The pellet was again resuspended in phosphate-buffered saline and either used directly for metabolism studies or stored at - 70 "C. Protein content was measured by the method of Lowry et al.' and cytochrome P-450 by the method described by
Omura and Sato.' The specific P-450 content is listed in Table 1.
Microsomal incubations
CBG (0.5 mg) in ethanol (10 pl) was added to a mixture of nicotinamide adenine dinucleotide phosphate (NADP) (0.8 mM), glucose-6-phosphate (40 mM) and magnesium chloride (10 mM) (concentrations are those of the final solution) at 4°C. The microsomes (1 ml) were added followed by glucose-6-phosphate dehydro- genase (20 units) and the volume was made up to 10 ml with phosphate-buffered saline (pH 7.4). The mixture was bubbled with a mixture of oxygen (95%) and carbon dioxide (5%) for 1 min and then incubated in a shaking water bath for 60 min at 37 "C.
Extraction of metabolites
Metabolites were extracted from the cooled microsomal incubations with ethyl acetate (3 x 10 ml) with centrifu- gation at 1450 x g (2000 rev min-') to aid separation of the two layers, and concentrated by chromatography on Sephadex LH-20 (5 g packed into a 1 cm diameter column) in chloroform and chloroform-methanol mix- tures as described earlier.g The metabolite-containing fraction, which was eluted with 35-70 ml of chloroform and 50 ml of a 10% mixture of methanol in chloroform, was concentrated under reduced pressure and the residue was redissolved in ethyl acetate (1.0 ml) for storage. Aliquots (0.1 ml) of this solution were con- verted into derivatives for GC/MS as described below.
Preparation of derivatives
TMS derivatives. The sample was heated with N,O-bis- (TMS)-trifluoroacetamide (BSTFA, 10 pl) for 10 min at 60 "C.
(*H,)TMS derivatives." These were prepared as for the TMS derivatives with ('H ,)bis-TMS-acetamide repla- cing the BSTFA.
Catalytic hydrogenation
CBG or the metabolic fraction, dissolved in methanol (0.1 ml), was added to a suspension of rhodium/aIumina (Aldrich Chemical Co.) in ethanol (1 ml) contained in a
Table 1. Details of animals used for the metabolic study
Animal Strain Weight No. used
Mouse Rat Guinea-pig Rabbit (male) Rabbit (female) Hamster Gerbil Cat
Charles River CD-1 Wistar Dunkin Hartley New Zealand white New Zealand white Syrian long-haired Mongolian Oxford inbred
23-25 g 200 g 400 g
2.5-3 kg 3.5 kg
60 g 40 g
2.5 kg
160 8 5 3 3
10 10
1
Specific P-450 (nmol mg-' protein)
1.19 0.79 0.90 0.99 1.22 1.09 0.42 0.23
METABOLISM OF CANNABIGEROL
:@-
g 33-
2 50-
$ 4 0 -
m. U k 0 -
- I
541
'3
% TMS 391
Id8
381
121 10-
8
4 8
m l z
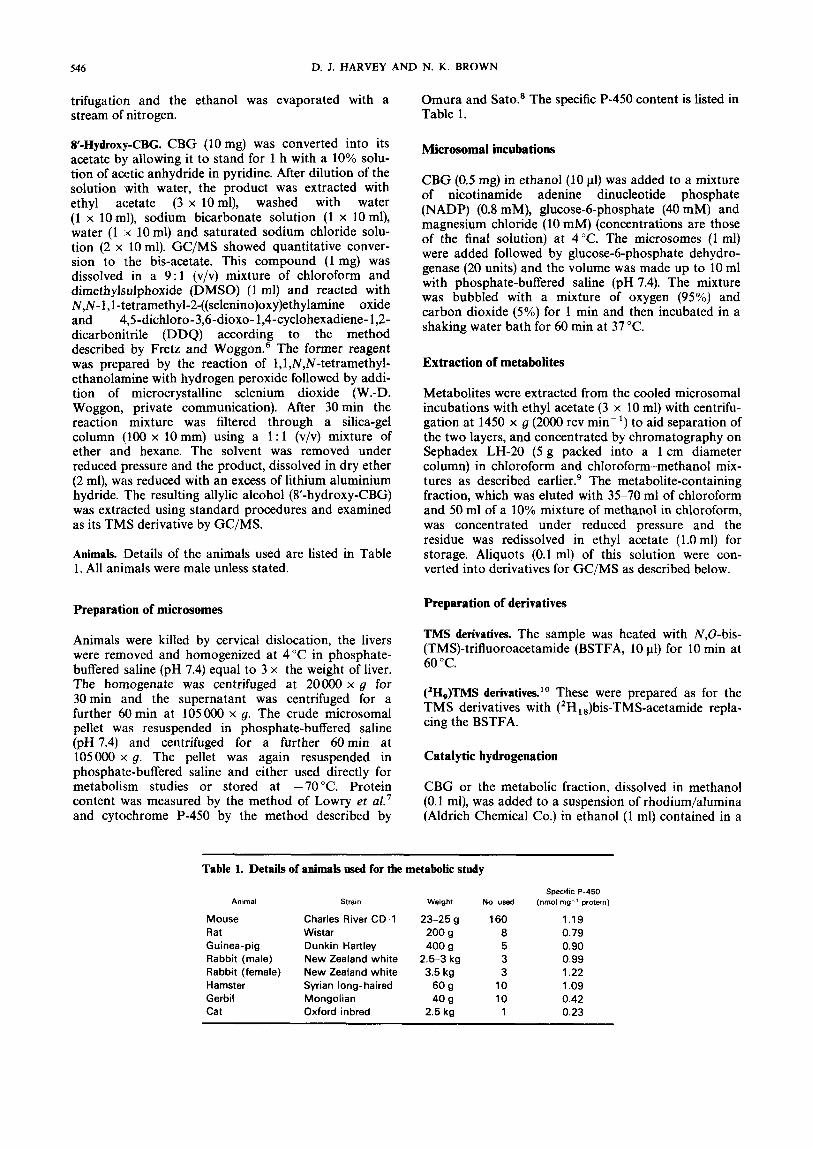
Figure 1. Mass spectrum (70 eV) of the TMS derivative of CBG.
3.5 ml screw-cap vial that had been filled with hydro- gen. This was shaken overnight at room temperature, centrifuged to precipitate the catalyst, and the ethanol was removed from the separated supernatant with a stream of nitrogen. The products were converted into TMS derivatives as described above.
Gas chromatography
Metabolite fractions were examined by GC using a Hewlett-Packard 5980A gas chromatograph fitted with a 50 m x 0.3 mm OV-1 bonded-phase fused-silica capil- lary column (film thickness 0.52 pm). Helium at 2 ml min-' was used as the carrier gas with a split ratio of 10: 1. The injector and detector (FID) temperatures were both 300 "C and the column oven was temperature programmed from 200 "C to 350 "C at 4 "C min - '.
GCWS
Two systems were used for GC/MS. The first consisted of a VG 12B single-focusing mass spectrometer inter- faced via a glass jet separator to a Varian 2440 gas chromatograph which was fitted with a 2 m x 2mm (i.d.) glass column packed with 3% SE-30 on 100-120 mesh Gas Chrom Q (Applied Science Laboratories, State College, Pennsylvania, USA). Helium at 30 ml min-' was used as the carrier gas and the injec- tor, separator and mass spectrometer ion source tem- peratures were 300, 300, and 260"C, respectively. The column oven was temperature-programmed from 180 "C to 300 "C at 2 "C min- '. Other operating condi- tions for electron impact (EI) mass spectrometry were : accelerating voltage, 2.4 kV; trap current, 100 PA; elec- tron energy, 25 eV; scan speed, 3 s/decade. Spectra were acquired with a VG 2050 data system and processed with a linked VG 11 : 250 data system.
The second GC/MS system consisted of a VG 70/70F double-focussing mass spectrometer interfaced to a Varian 2440 gas chromatograph. The column was a 30 m x 0.2 mm OV-1 bonded-phase (film thickness 0.33 pm) fused-silica capillary terminating 1 cm inside the ion source. Helium at 1 ml min-' (measured in the absence of the vacuum) was used as the carrier gas. The injector was a Scientific Glass Engineering (SGE) split/ splitless system used in the split mode with a split ratio
of 1O:l and the column oven was temperature- programmed from 220 "C to 300 "C at 2 "C min- '. Operating conditions were: injector, transfer line and ion source temperatures, 300, 300 and 280"C, respec- tively; electron energy, 70 eV; trap current, 1 mA; accel- erating voltage, 4 kV. The instrument was scanned repetitively at 1 s/decade and spectra were acquired with a VG 11 :250 data system. Semi-quantitative data on metabolite concentration was obtained from the cap- illary GC/MS run by integrating the area under the metabolite peaks.
RESULTS
Metabolites were identified by GC/MS using the spectra of various derivatives and of the products of catalytic hydrogenation. In order to rationalize the EI- induced fragmentation of the metabolites, the spectrum of the TMS derivative of CBG (Fig. 1) and of its tetra- hydro analogue (11) were examined. Spectra of both compounds were dominated by the tropylium ion a (Scheme 1) at m/z 337. The major difference in the
2 H
C
Scheme 1.
spectra of the two compounds was the presence of the prominent ions at m/z 377 (b), and 391 (c) and a weak ion at m/z403(d) in the spectrum of CBG. Ions b-c were absent from the spectrum of the TMS derivative of tetrahydro-CBG, which contained only three significant ions in addition to ion a. These were the TMS cation, the molecular ion (m/z 464 (12%)), and m/z 408 (7%).
HO
I I
548 D. J. HARVEY AND N. K. BROWN
____*
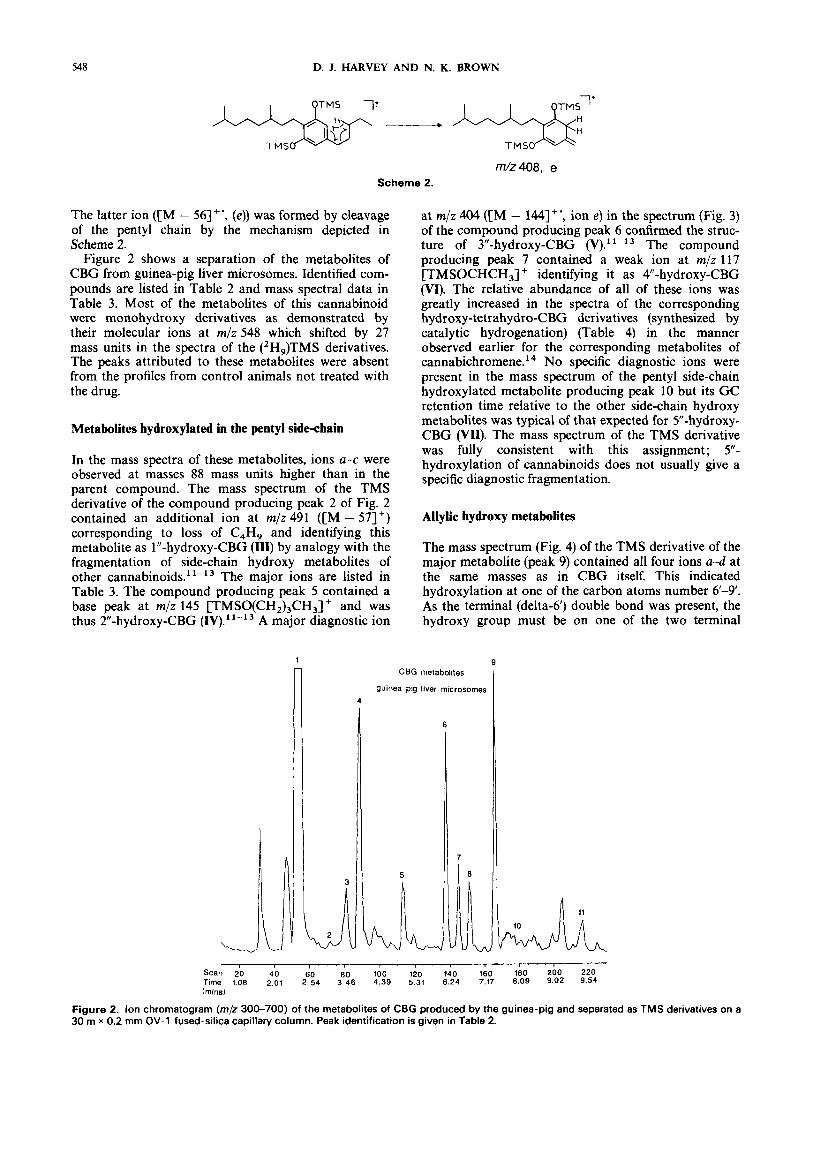
TMS TMSO
m/z408, e Scheme 2.
The latter ion ([M - 56]+', (e)) was formed by cleavage of the pentyl chain by the mechanism depicted in Scheme 2.
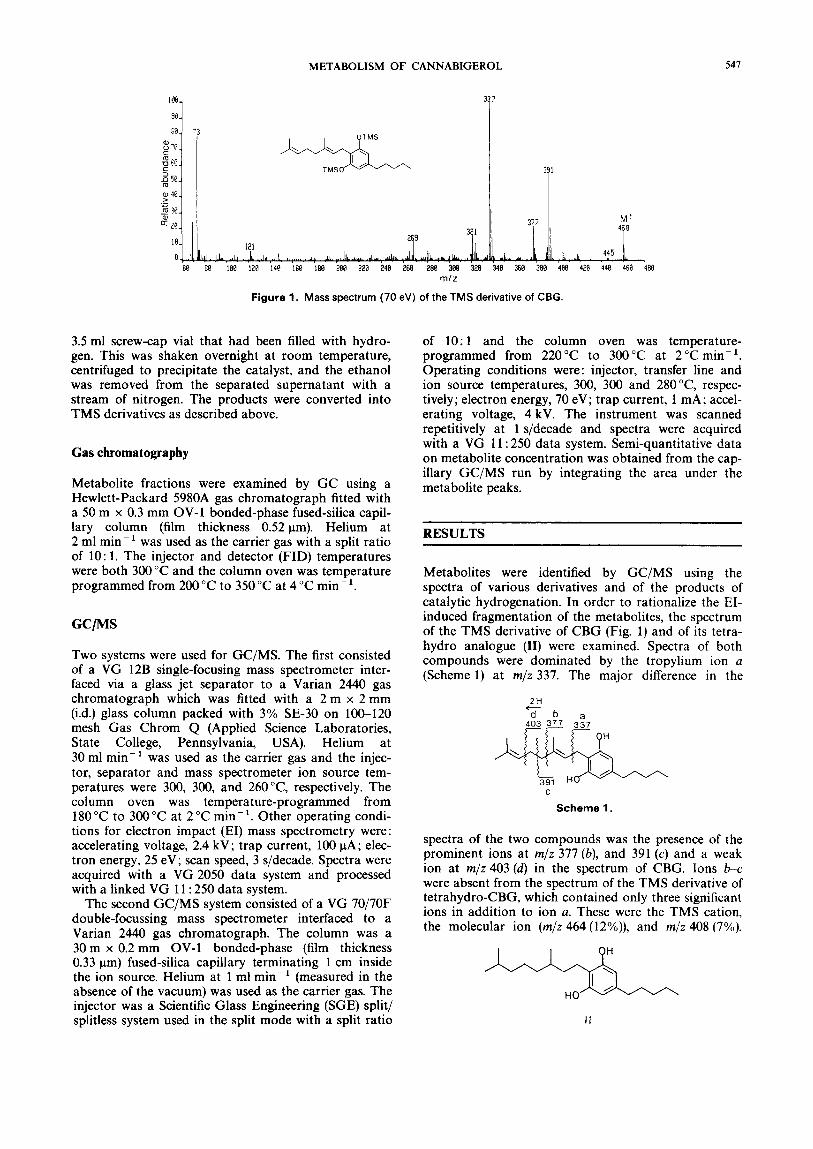
Figure 2 shows a separation of the metabolites of CBG from guinea-pig liver microsomes. Identified com- pounds are listed in Table 2 and mass spectral data in Table 3. Most of the metabolites of this cannabinoid were monohydroxy derivatives as demonstrated by their molecular ions at m/z 548 which shifted by 27 mass units in the spectra of the (2H,)TMS derivatives. The peaks attributed to these metabolites were absent from the profiles from control animals not treated with the drug.
Metabolites hydroxylated in the pentyl side-chain
In the mass spectra of these metabolites, ions a-c were observed at masses 88 mass units higher than in the parent compound. The mass spectrum of the TMS derivative of the compound producing peak 2 of Fig. 2 contained an additional ion at m/z 491 ([M - 571') corresponding to loss of C,H, and identifying this metabolite as 1"-hydroxy-CBG (111) by analogy with the fragmentation of side-chain hydroxy metabolites of other ~annabinoids."-'~ The major ions are listed in Table 3. The compound producing peak 5 contained a base peak at m/z 145 [TMSO(CH2)3CH3]+ and was thus 2"-hydroxy-CBG (IV).1'-13 A m ajor diagnostic ion
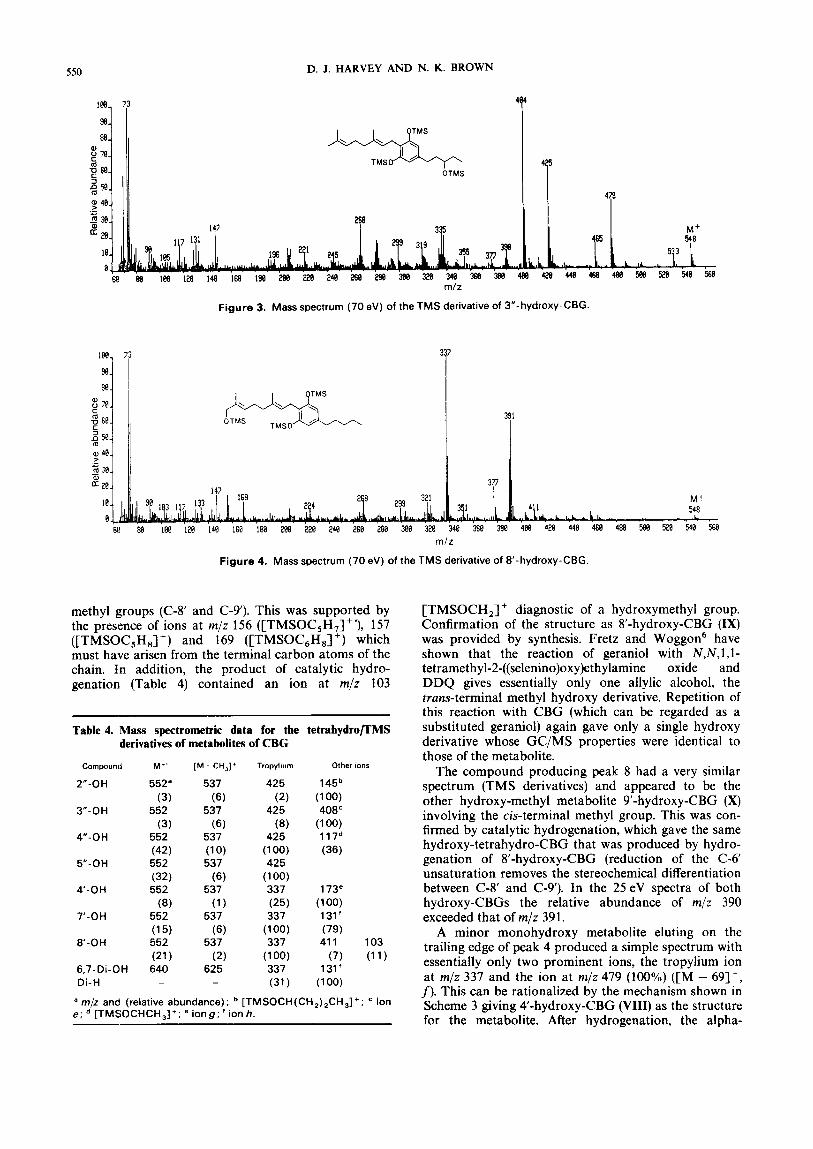
at m/z 404 ([M - 144]+', ion e) in the spectrum (Fig. 3) of the compound producing peak 6 confirmed the struc- ture of 3"-hydroxy-CBG (V).11-'3 The compound producing peak 7 contained a weak ion at m/z 117 [TMSOCHCH3]+ identifying it as 4-hydroxy-CBG (VI). The relative abundance of all of these ions was greatly increased in the spectra of the corresponding hydroxy-tetrahydro-CBG derivatives (synthesized by catalytic hydrogenation) (Table 4) in the manner observed earlier for the corresponding metabolites of ~annabichromene.'~ No specific diagnostic ions were present in the mass spectrum of the pentyl side-chain hydroxylated metabolite producing peak 10 but its GC retention time relative to the other side-chain hydroxy metabolites was typical of that expected for 5"-hydroxy- CBG (VII). The mass spectrum of the TMS derivative was fully consistent with this assignment; 5"- hydroxylation of cannabinoids does not usually give a specific diagnostic fragmentation.
Allylic hydroxy metabolites
The mass spectrum (Fig. 4) of the TMS derivative of the major metabolite (peak 9) contained all four ions a-d at the same masses as in CBG itself. This indicated hydroxylation at one of the carbon atoms number 6-9. As the terminal (delta-6) double bond was present, the hydroxy group must be on one of the two terminal
I CBG metabolites
guinea pig liver rnicrosomes
9
Scan 2b 40 $0 & loo 4 0 140 160 180 ZOO 220 Time 1.08 2.01 2 54 3 46 4.39 5.31 6.24 7.17 8.09 9.02 9.54 (mind
Figure 2. Ion chromatogram (m/z 300-700) of the metabolites of CBG produced by the guinea-pig and separated as TMS derivatives on a 30 m x 0.2 mm OV-l fused-silica capillary column. Peak identification is given in Table 2.
METABOLISM OF CANNABIGEROL
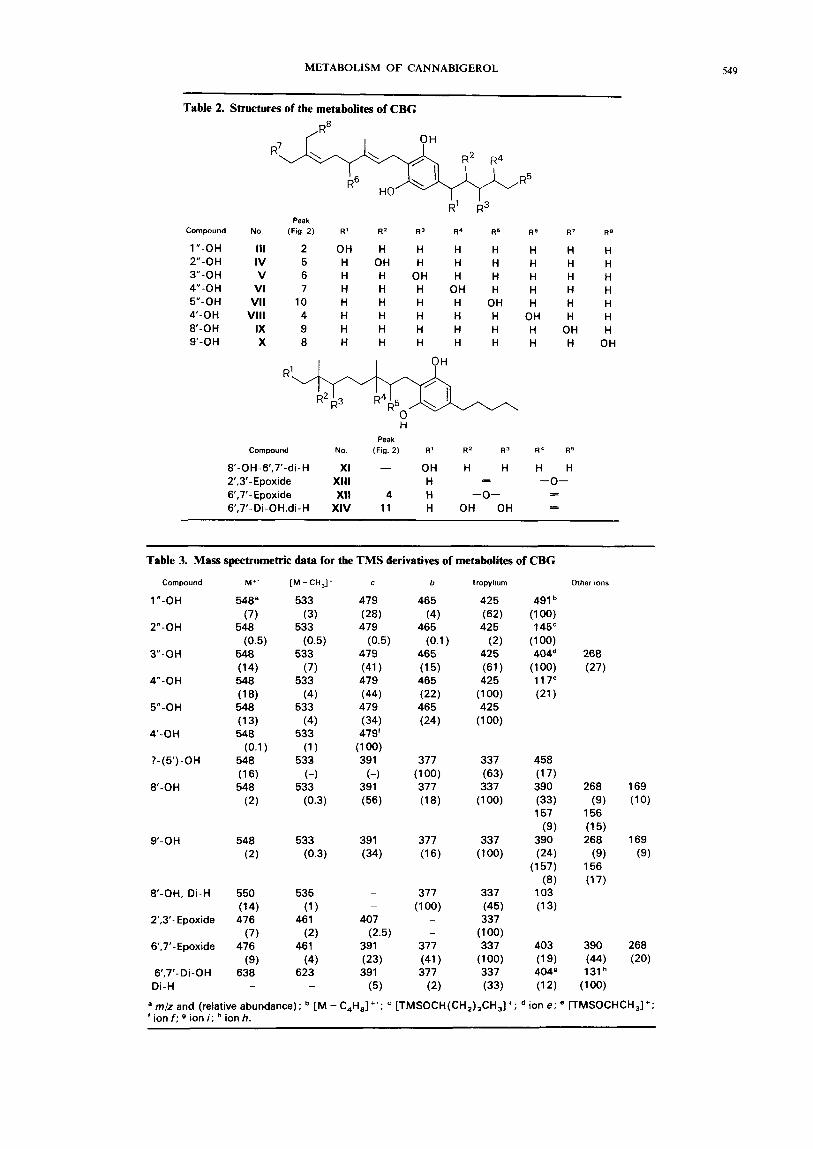
Table 2. Structures of the metabolites of CBG
549
Compound
l "-OH 2"-OH 3"-OH 4"-OH 5"-OH 4-OH 8'-OH 9-OH
Peak No. (Fig. 2) R' R' R 3 R4 R5 Re
111 2 O H H H H H H IV 5 H O H H H H H V 6 H H O H H H H
VI 7 H H H O H H H VII 10 H H H H O H H
Vlll 4 H H H H H O H IX 9 H H H H H H X 8 H H H H H H
H Peak
Compound No. (Fig. 2) R ' R Z R 3 R4
R 7 Rs
H H H H H H H H H H H H
OH H H OH
R 5
8'-OH-6',7'-di-H XI - OH H H H H 2',3'- Epoxide Xlll - H 3 -0- 6',7'-Epoxide XI1 4 H -0- = 6',7'-Di-OH,di-H XIV 11 H OH OH =
Table 3. Mass spectrometric data for the TMS derivatives of metabolites of CBG
Compound
1"-OH
2"-OH
3"-OH
4"-OH
5"-OH
@-OH
?- ( 5 ) -OH
8'-OH
9'-OH
8'-OH, Di-H
T.3'- Epoxide
6,7'-Epoxide
6',7'- Di- OH Di-H
[M -CH,]'
533 (3)
533 (0.5)
533 (7)
533 (4)
533 (4)
533 (1 1
533 (-1
533 (0.3)
533 (0.3)
535 (1 )
461 (2)
46 1 (4)
623 -
C
479 (28) 479
479 (41 ) 479 (44) 479 (34) 479'
(1 00) 391
(-1 391 (56)
(0.5)
391 (34)
-
-
407
391 (23) 391
(5)
(2.5)
Other ions
268 (27)
a m/z and (relative abundance); [M - C4HB]+'; [TMSOCH(CH,),CH,]+; ion e; [TMSOCHCH,]+; ' ion f: 0 ion i ; ion h.
5 50 D. J. HARVEY AND N. K. BROWN
IRB 7 3
$31 I T
Figure 3. Mass spectrum (70 eV) of the TMS derivative of 3”-hydroxy-CBG.
m i z
Figure 4. Mass spectrum (70 eV) of the TMS derivative of 8-hydroxy-CBG.
methyl groups (C-8’ and C-9). This was supported by the presence of ions at m/z 156 ([TMSOC5H7]+’), 157 ([TMSOC,H,]+) and 169 ([TMSOC,H,]+) which must have arisen from the terminal carbon atoms of the chain. In addition, the product of catalytic hydro- genation. (Table 4) contained an ion at m/z 103
Table 4. Mass spectrometric data for the tetrahydroPMS derivatives of metabolites of CBG
Compound Mi’ [M -CH3]+ Tropylium Other ions
2”-OH 552” 537 425 145b (3) (6) (2) (100)
3”-OH 552 537 425 408‘ (3) (6) ( 8 ) (100)
4”-OH 552 537 425 117d (42) (1 0) (100) (36)
5“-OH 552 537 425 (32) (6) (1 00)
4 - O H 552 537 337 173“
7‘-OH 552 537 337 131‘
8 - O H 552 537 337 411 103
6.7-Di-OH 640 625 337 131’
(8 ) (1 ) (25) (100)
(1 5) (6) (100) (79)
(21 1 (2) (1 00) (7) (11)
Di-H - - (31) (100)
a m/z and (relative abundance); [TMSOCH(CH,),CH,]+; Ion e; [TMSOCHCH,]+; iong; ‘ ion h.
[TMSOCH,] + diagnostic of a hydroxymethyl group. Confirmation of the structure as 8’-hydroxy-CBG (IX) was provided by synthesis. Fretz and Woggon, have shown that the reaction of geraniol with N,N,l,l- tetramethyl-2-((selenino)oxy)ethylamine oxide and DDQ gives essentially only one allylic alcohol, the trans-terminal methyl hydroxy derivative. Repetition of this reaction with CBG (which can be regarded as a substituted geraniol) again gave only a single hydroxy derivative whose GC/MS properties were identical to those of the metabolite.
The compound producing peak 8 had a very similar spectrum (TMS derivatives) and appeared to be the other hydroxy-methyl metabolite 9’-hydroxy-CBG (X) involving the cis-terminal methyl group. This was con- firmed by catalytic hydrogenation, which gave the same hydroxy-tetrahydro-CBG that was produced by hydro- genation of 8’-hydroxy-CBG (reduction of the C-6 unsaturation removes the stereochemical differentiation between C-8’ and C-9). In the 25eV spectra of both hydroxy-CBGs the relative abundance of m/z 390 exceeded that of m/z 391.
A minor monohydroxy metabolite eluting on the trailing edge of peak 4 produced a simple spectrum with essentially only two prominent ions, the tropylium ion at m/z 337 and the ion at ni/z 479 (l0oY0) ([M - 69]+, f ) . This can be rationalized by the mechanism shown in Scheme 3 giving 4-hydroxy-CBG (VIII) as the structure for the metabolite. After hydrogenation, the alpha-
METABOLISM OF CANNABIGEROL 551
___, T MS
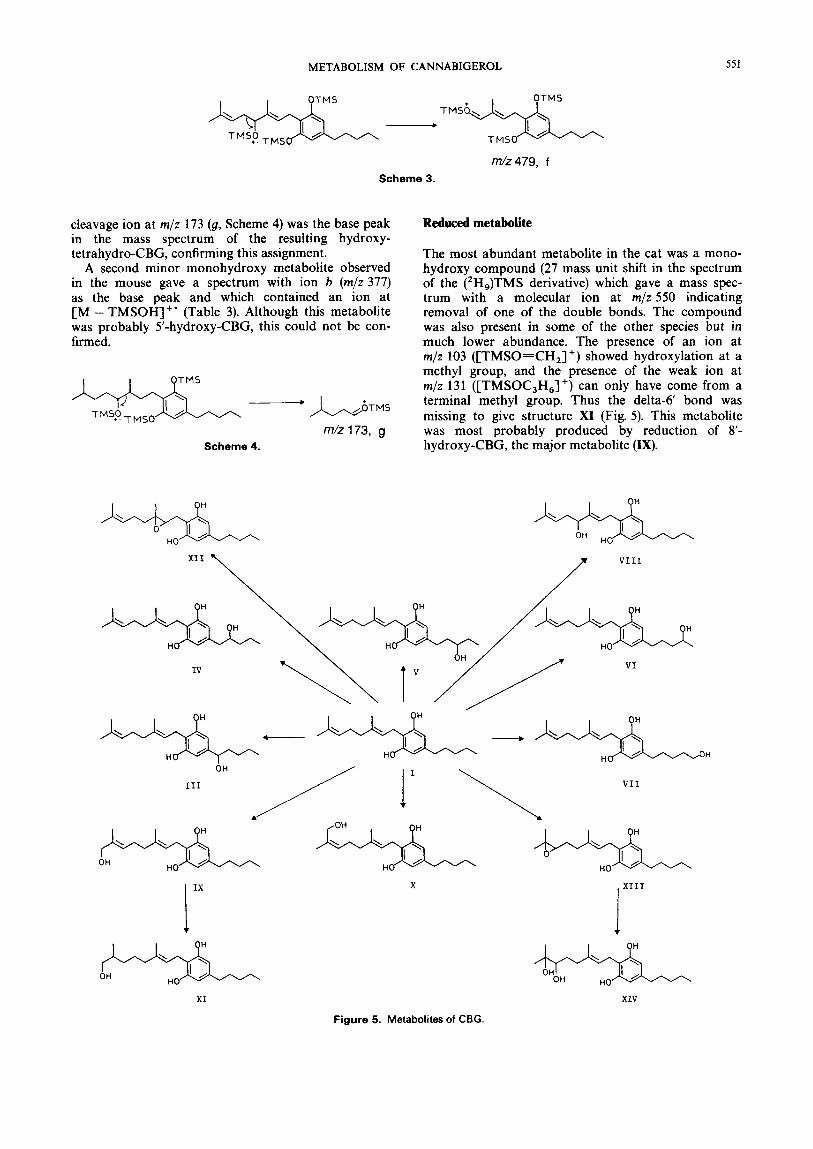
mlz479, f Scheme 3.
cleavage ion at m/z 173 (9, Scheme 4) was the base peak in the mass spectrum of the resulting hydroxy- tetrahydro-CBG, confirming this assignment.
A second minor monohydroxy metabolite observed in the mouse gave a spectrum with ion b (m/z 377) as the base peak and which contained an ion at [M - TMSOH]" (Table 3). Although this metabolite was probably 5'-hydroxy-CBG, this could not be con- firmed.
Scheme 4.
Reduced metabolite
The most abundant metabolite in the cat was a mono- hydroxy compound (27 mass unit shift in the spectrum of the ('H,)TMS derivative) which gave a mass spec- trum with a molecular ion at m/z 550 indicating removal of one of the double bonds. The compound was also present in some of the other species but in much lower abundance. The presence of an ion at m/z 103 ([TMSO-CH,] +) showed hydroxylation at a methyl group, and the presence of the weak ion at m/z 131 ([TMSOC,H,]+) can only have come from a terminal methyl group. Thus the delta-6 bond was missing to give structure X I (Fig. 5). This metabolite was most probably produced by reduction of 8'- hydroxy-CBG, the major metabolite (IX).
OH \ OH
IV -\ +---* / / /
I IX
111 VII
OH - L n L j L & - HO / H / HO /
X
jlllj HQ HO
XI XIV
Figure 5. Metabolites of CBG.
552 D. J. HARVEY AND N. K. BROWN
Metabolites produced by the epoxide-diol pathway
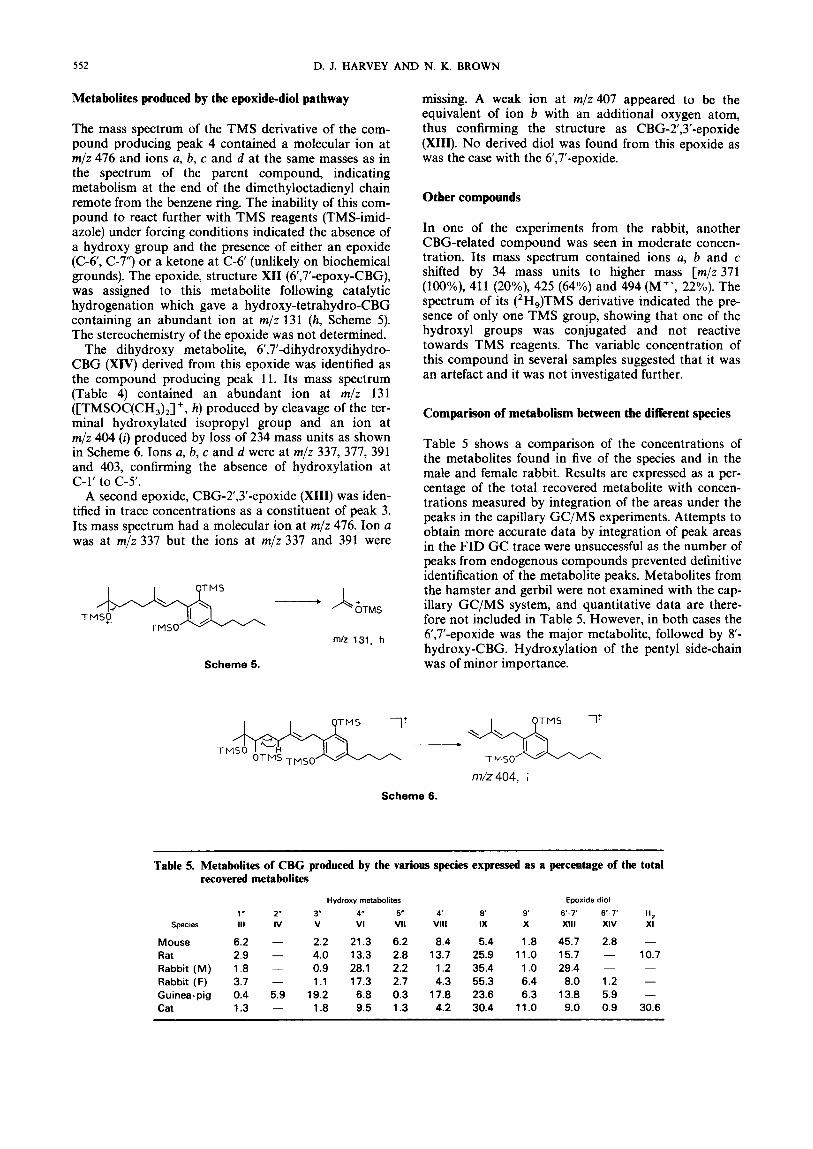
The mass spectrum of the TMS derivative of the com- pound producing peak 4 contained a molecular ion at m/z 476 and ions a, b, c and d at the same masses as in the spectrum of the parent compound, indicating metabolism at the end of the dimethyloctadienyl chain remote from the benzene ring. The inability of this com- pound to react further with TMS reagents (TMS-imid- azole) under forcing conditions indicated the absence of a hydroxy group and the presence of either an epoxide (C-6, C-7”) or a ketone at C-6 (unlikely on biochemical grounds). The epoxide, structure XI1 (6,7’-epoxy-CBG), was assigned to this metabolite following catalytic hydrogenation which gave a hydroxy-tetrahydro-CBG containing an abundant ion at m/z 131 (h, Scheme 5). The stereochemistry of the epoxide was not determined.
The dihydroxy metabolite, 6’,7’-dihydroxydihydro- CBG (XIV) derived from this epoxide was identified as the compound producing peak 11. Its mass spectrum (Table 4) contained an abundant ion at m/z 131 ([TMSOC(CH,),] +, h) produced by cleavage of the ter- minal hydroxylated isopropyl group and an ion at m/z 404 (i) produced by loss of 234 mass units as shown in Scheme 6. Ions a, b, c and d were at m/z 337,371,391 and 403, confirming the absence of hydroxylation at C-1’ to C-5’.
A second epoxide, CBG-2’,3’-epoxide (XIII) was iden- tified in trace concentrations as a constituent of peak 3. Its mass spectrum had a molecular ion at m/z 476. Ion a was at m1.z 331 but the ions at m/z 331 and 391 were
m/z 131, h
Scheme 5.
missing. A weak ion at m/z 407 appeared to be the equivalent of ion b with an additional oxygen atom, thus confirming the structure as CBG-2’,3’-epoxide (XIII). No derived diol was found from this epoxide as was the case with the 6’,7’-epoxide.
Other compounds
In one of the experiments from the rabbit, another CBG-related compound was seen in moderate concen- tration. Its mass spectrum contained ions a, b and c shifted by 34 mass units to higher mass [m/z 371 (loo%), 411 (20%), 425 (64%) and 494 (M”, 22%). The spectrum of its (’H,)TMS derivative indicated the pre- sence of only one TMS group, showing that one of the hydroxyl groups was conjugated and not reactive towards TMS reagents. The variable concentration of this compound in several samples suggested that it was an artefact and it was not investigated further.
Comparison of metabolism between the different species
Table 5 shows a comparison of the concentrations of the metabolites found in five of the species and in the male and female rabbit. Results are expressed as a per- centage of the total recovered metabolite with concen- trations measured by integration of the areas under the peaks in the capillary GC/MS experiments. Attempts to obtain more accurate data by integration of peak areas in the FID GC trace were unsuccessful as the number of peaks from endogenous compounds prevented definitive identification of the metabolite peaks. Metabolites from the hamster and gerbil were not examined with the cap- illary GC/MS system, and quantitative data are there- fore not included in Table 5. However, in both cases the 6’,7’-epoxide was the major metabolite, followed by 8‘- hydroxy-CBG. Hydroxylation of the pentyl side-chain was of minor importance.
I I ?TMS 1: I O T M S 1’
TMSO
m/z404, i
Scheme 6.
Table 5. Metabolites of CBG produced by the various species expressed as a percentage of the total recovered metabolites
Hydroxy metabolites Epoxide diol
H* Species 111 IV V VI VII Vlll IX X Xlll XIV XI
Mouse 6.2 - 2.2 21.3 6.2 8.4 5.4 1.8 45.7 2.8 - Rat 2.9 - 4.0 13.3 2.8 13.7 25.9 11.0 15.7 - 10.7
1” 2” 3” 4“ 5” 4‘ 8’ 9 fj.7’ 6.7’
Rabbit (M) 1.8 - 0.9 28.1 2.2 1.2 35.4 1.0 29.4 - -
Rabbit (F) 3.7 - 1.1 17.3 2.7 4.3 55.3 6.4 8.0 1.2 - Guinea-pig 0.4 5.9 19.2 6.8 0.3 17.8 23.6 6.3 13.8 5.9 - Cat 1.3 - 1.8 9.5 1.3 4.2 30.4 11.0 9.0 0.9 30.6
METABOLISM OF CANNABIGEROL 553
DISCUSSION
The metabolic pathways found for CBG are sum- marized in Fig. 5. The metabolites were very similar to those found for other cannabinoids in that hydrox- ylation and epoxidation were the major in vitro path- ways, with the preferred hydroxylation site showing considerable species variation. The major metabolic route in most species was allylic hydroxylation at the trans-terminal methyl group (C-87, a pathway similar to that previously found for the cannabinoid CBC,I4 which has a similar side-chain. This biotransformation pathway has also been observed for the oxidation of geraniol by cytochrome P-450,,,, from Catharanthus roseus (L.) G. Don6 Hydroxylation at an allylic methyl position also gives the major metabolites for cannabin- oids in which the C,, chain has cyclized. In common with the metabolism of other cannabinoids, the guinea- pig produced relatively high concentrations of metabo- lites hydroxylated in the pentyl side-chain.
The EI-induced mass spectra of the TMS derivatives of these compounds was largely predictable. Hydrox- ylation in the pentyl side-chain gave the same diagnos- tic ions as observed previously for other cannabinoids"-' whereas the spectra of the hydro-
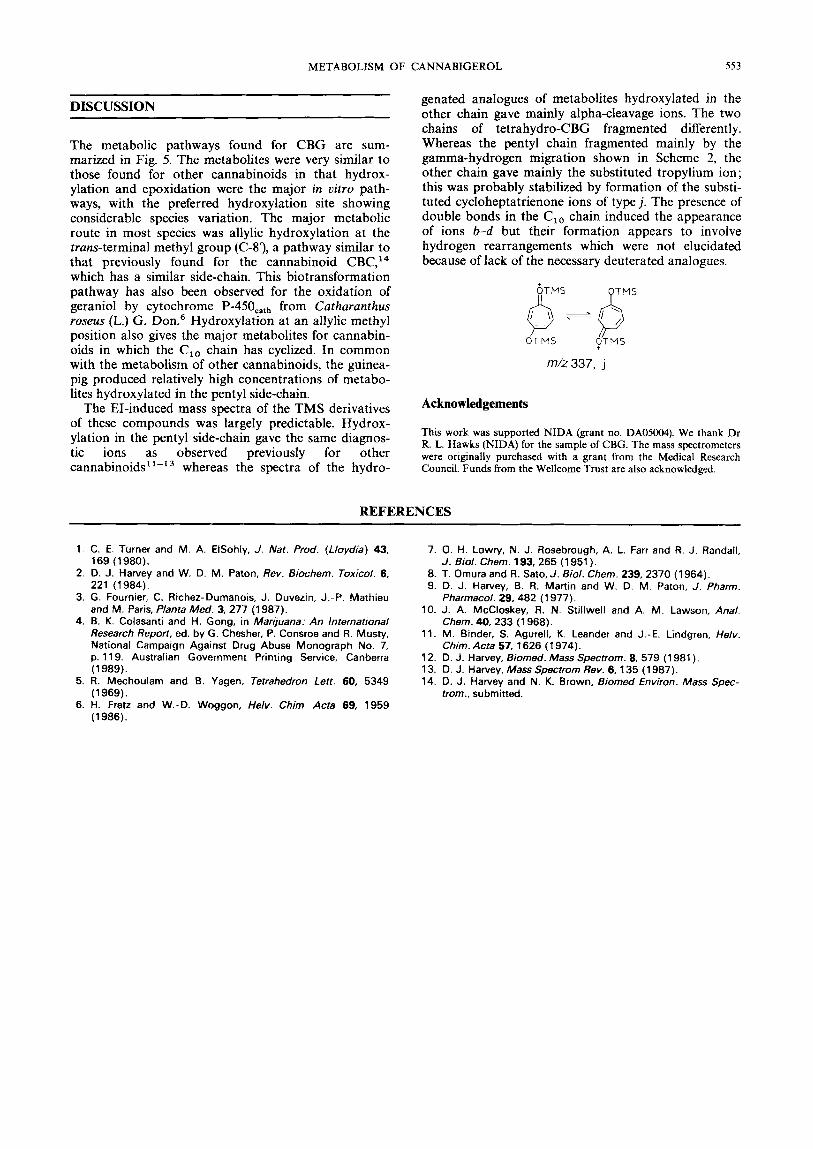
genated analogues of metabolites hydroxylated in the other chain gave mainly alpha-cleavage ions. The two chains of tetrahydro-CBG fragmented differently. Whereas the pentyl chain fragmented mainly by the gamma-hydrogen migration shown in Scheme 2, the other chain gave mainly the substituted tropylium ion ; this was probably stabilized by formation of the substi- tuted cycloheptatrienone ions of type j . The presence of double bonds in the Clo chain induced the appearance of ions b-d but their formation appears to involve hydrogen rearrangements which were not elucidated because of lack of the necessary deuterated analogues.
YS
O T M S ?TM5
m/z 337, j
Acknowledgements
This work was supported NIDA (grant no. DA05004). We thank Dr R. L. Hawks (NIDA) for the sample of CBG. The mass spectrometers were originally purchased with a grant from the Medical Research Council. Funds from the Wellcome Trust are also acknowledged.
REFERENCES
1. C. E. Turner and M. A. EISohly, J. Nat. Prod. (Lloydia) 43, 169 (1980).
2. D. J. Harvey and W. D. M. Paton, Rev. Biochem. Toxicol. 6, 221 (1984).
3. G. Fournier, C. Richez-Dumanois, J. Duvezin, J.-P. Mathieu and M. Paris, Planfa Med. 3, 277 (1 987).
4. B. K. Colasanti and H. Gong, in Marijuana: An International Research Report, ed. by G . Chesher, P. Consroe and R. Musty, National Campaign Against Drug Abuse Monograph No. 7, p. 11 9. Australian Government Printing Service, Canberra (1 989).
5. R. Mechoulam and B. Yagen, Tetrahedron Lett. 60, 5349 (1 969).
6. H. Fretz and W.-D. Woggon, Helv. Chim. Acta 69, 1959 (1 986).
7. 0. H. Lowry, N. J. Rosebrough, A. L. Farr and R. J. Randall,
8. T. Omura and R. Sato, J. Biol. Chem. 239, 2370 (1 964). 9. D. J. Harvey, B. R. Martin and W. D. M. Paton, J. Pharm.
10. J. A. McCloskey, R. N. Stillwell and A. M. Lawson, Anal.
11. M. Binder, S. Agurell, K. Leander and J.-E. Lindgren, Helv.
12. D. J. Harvey, Biomed. Mass Spectrom. 8, 579 (1 981 ). 13. D. J. Harvey, Mass Spectrom Rev. 6,135 (1 987). 14. D. J. Harvey and N. K. Brown, Biomed Environ. Mass Spec-
J. Biol. Chem. 193, 265 (1951).
Pharmacol. 29,482 (1 977).
Chem. 40,233 (1 968).
Chim. Acta 57, 1 626 (1 974).
trom.. submitted.