in-situ metathesis reaction combined with ultrasound-assisted ionic liquid dispersive...
TRANSCRIPT

Talanta 98 (2012) 145–151
Contents lists available at SciVerse ScienceDirect
Talanta
0039-91
http://d
n Corr
E-m
journal homepage: www.elsevier.com/locate/talanta
In-situ metathesis reaction combined with ultrasound-assisted ionic liquiddispersive liquid–liquid microextraction method for the determinationof phenylurea pesticides in water samples
Jiaheng Zhang, Zhe Liang, Songqing Li, Yubo Li, Bing Peng, Wenfeng Zhou, Haixiang Gao n
China Agricultural University, Department of Applied Chemistry, Yuanmingyuan West Road 2#, Beijing 100193, China
a r t i c l e i n f o
Article history:
Received 1 April 2012
Received in revised form
21 June 2012
Accepted 24 June 2012Available online 29 June 2012
Keywords:
Dispersive liquid–liquid microextraction
Phenylurea pesticides
Ionic liquid
Plackett–Burman design
Central composite design
In-situ metathesis
40/$ - see front matter & 2012 Elsevier B.V. A
x.doi.org/10.1016/j.talanta.2012.06.062
esponding author. Tel./fax: þ86 10 62731991
ail address: [email protected] (H. Gao).
a b s t r a c t
A novel microextraction technique, named in-situ metathesis reaction, combined with ultrasound-
assisted ionic liquid dispersive liquid–liquid microextraction was developed for the determination of
five phenylurea pesticides (i.e., diuron, diflubenzuron, teflubenzuron, flufenoxuron, and chlorfluazuron)
in environmental water samples. In the developed method, 360 mL LiNTf2 aqueous solution (0.162 g/mL)
was added to the sample solution containing a small amount of [C6MIM]Cl (0.034 g) to form a water-
immiscible ionic liquid, [C6MIM]NTf2, as extraction solution. The mixed solutions were placed in an
ultrasonic water bath at 150 W for 4 min and centrifuged at 3500 rpm for 10 min to achieve phase
separation. After centrifugation, fine droplets of the extractant phase settled to the bottom of the centrifuge
tube and were directly injected into the high-performance liquid chromatography system for analysis. The
quantity of [C6MIM]Cl, the molar ratio of [C6MIM]Cl and LiNTf2, ionic strength, ultrasound time, and
centrifugation time, were optimized using a Plackett–Burman design. Significant factors obtained were
optimized by employing a central composite design. The optimized technique provides good repeatability
(RSD 2.4 to 3.5%), linearity (0.5 mg/L to 500 mg/L), low LODs (0.06 mg/L to 0.08 mg/L) and great enrichment
factor (244 to 268). The developed method can be applied in routine analysis for the determining of
phenylurea pesticides in environmental samples.
& 2012 Elsevier B.V. All rights reserved.
1. Introduction
Since the 1940s and the 1950s, phenylurea pesticides havebeen introduced as the ‘‘second generation of pesticides’’ [1].After several decades of development, these herbicides are stillused in large quantities for selective control of broad-leaf andgrass weeds and as algicides in paints and coatings throughoutthe world [2]. However, the remaining low concentration residuesof these compounds in soil can affect the groundwater system.Due to their residual activity and extensive use, phenylureapesticides are frequently detected in surface water in concentra-tions exceeding the EU limit value of 0.1 mg/L for pesticides indrinking water [3–5]. Moreover, their prolonged usage may causetoxicological effects in the environment and serious hazards tohuman health through accumulation in the food chain at toxiclevels [6,7]. Therefore, rapid, simple, sensitive, and ‘‘green’’analytical methods are essential for monitoring these compoundsin the environment.
ll rights reserved.
.
Several analytical methods, such as micellar electrokineticchromatography [8], immunoassay [9], gas chromatography[10], high-performance liquid chromatography (HPLC) [11], andliquid chromatography-tandem mass spectrometry (LC-MS/MS)[12,13] have been developed to determine phenylurea pesticidesin the environment and in plant samples. However, samplepreconcentration and pretreatment procedures are often neededprior to instrumental analysis because most of the herbicidesexist at trace levels in the environmental system. The mostpopular pretreatment techniques are solid-phase extraction[14,15] and liquid–liquid extraction [16]. Although these methodsoffer high reproducibility and high sample capacity, they aretime-consuming and labor-intensive. Furthermore, a largeamount of toxic organic solvents are used to elute the analytein the analysis. Recently, research on sampling approachesfocused on the development of efficient and economical techni-ques requiring less organic solvents. Such methods include solid-phase microextraction (SPME) [17], liquid-phase microextraction(LPME) [18], single-drop microextraction (SDME) [19], hollowfiber-based liquid-phase microextraction (HF-LPME) [20], andliquid–liquid microextraction (LLME) [21]. Compared with theolder types of preconcentration and matrix isolation techniques,the more recent sampling methods are miniaturized, automated,

Fig. 1. Formation of [C6MIM]-NTf2 by in situ reaction.
J. Zhang et al. / Talanta 98 (2012) 145–151146
consuming less organic solvent, and easy to conduct. However,several drawbacks still exist in the newer methods, such asdeclining performance with time and sample carry-over problems[22].
A new microextraction technique, namely, dispersive liquid–liquid microextraction (DLLME), was developed by Rezaee et al.[23] to enable sample extraction and preconcentration to be donein a single step. The basic principle of this method involves thedispersion of a non-water-miscible extraction solvent assistedwith a water-miscible disperser solvent in an aqueous solution togenerate a very high contact area between the aqueous phase andthe extraction solvent. Based on the DLLME method, Zhou andco-workers performed the most preferred modifications, namely,ultrasound-assisted dispersive liquid–liquid microextraction(UA-DLLME) [24]. In this modified method, emulsification of amicrovolume of the extraction solvent in the aqueous samplesolution is enhanced by the assistance of ultrasound energy, inwhich the analytes are more easily extracted into the finedroplets of the emulsified extraction phase. It was successfullyapplied for the preconcentration of pesticides [25], pollutants[26], drugs [27], antibiotic [28], and metal ions [29], etc.
In traditional UA-DLLME, the extraction and disperser solventsare usually toxic organic solvents, such as chlorobenzene, carbontetrachloride, acetonitrile, and acetone. Consequently, the devel-opment of new extraction and disperser solvents is an importantissue in DLLME evolution. Room temperature ionic liquids (ILs),noted as ‘‘green’’ solvents, are promising and suitable solventsthat may be used in ionic liquids dispersive liquid–liquidmicroextraction (IL-DLLME) procedures. In fact, 1-hexyl-3-methy-limidazolium hexafluorophosphate ([C6MIM][PF6]) and 1-octyl-3-methylimidazolium hexafluorophosphate ([C8MIM][PF6]) havebeen successfully applied as extraction phases for the determina-tion of several insecticides in our previous studies [30,31]. Never-theless, an organic dispersive solvent is also required both intypical DLLME and IL-DLLME to assist in the formation of finedroplets in the extraction solvent during dispersion. To furtherimprove and expand the applications of the IL-DLLME method,Baghdadi et al. and Yao et al. introduced a modified IL-DLLMEmethod involving in situ solvent formation [32,33]. In thesemethods, a small amount of a hydrophilic IL was dissolvedcompletely in the aqueous sample solution, after the addition ofan ion-pairing reagent, a cloudy solution with fine microdropletsof the water-immiscible IL (1-butyl-3-methylimidazolium bis[(trifluoromethane)sulfonyl]imide, [C4MIM]-NTf2) was formed(Scheme 1). The extraction and metathesis reaction are accom-plished in one step and result in an efficient and excellentextraction performance. The advantages of in-situ metathesisreaction-assisted IL-DLLME are the exclusion of the requirementfor utilizing a disperser solvent and the remarkable increase insurface area of the IL extraction solvent.
In the present study, in-situ metathesis reaction combinedwith UA-IL-DLLME method (in-situ UA-IL-DLLME) in conjunctionwith HPLC was introduced and applied to determine five pheny-lurea pesticides in several environmental samples. In the extrac-tion procedure, a hydrosoluble IL (1-hexyl-3-methylimidazoliumchloride, [C6MIM]Cl) and an ion-exchange reagent (lithium bis[(trifluoromethane)sulfonyl]imide, LiNTf2) were added to theaqueous solution in sequence and a novel hydrophobic IL(1-hexyl-3-methylimidazolium bis[(trifluoromethane)sulfonyl]i-mide [C6MIM]-NTf2) was formed as extraction solvent (Fig. 1).Furthermore, experimental factors, such as the quantity of[C6MIM]Cl, the molar ratio of [C6MIM]Cl and LiNTf2, ionicstrength, ultrasound time, and centrifugation time were assessedand optimized with the aid of response surface methodologybased on statistical design of experiments (DOE). A Plackett–Burman (P–B) factorial design was developed to define the
significant experimental variables, after which a central compo-site design (CCD) was employed in finding the optimumconditions for the in-situ UA-IL-DLLME.
2. Materials and methods
2.1. Reagents
Five phenylurea pesticides (diuron, diflubenzuron, teflubenzuron,flufenoxuron, and chlorfluazuron, 98% to 99% purity) and humic acidsodium salt were purchased from Aladdin Reagent Corporation(Shanghai, China). The methanol for spectroscopy was obtainedfrom Dikma Limited (China) and the deionized water was purifiedfrom a Milli-Q SP Reagent Water System (Millipore, Bedford, MA,USA). Sodium chloride (analytical grade) was obtained from BeijingChemical Reagent Company. 1-Hexyl-3-methylimidazolium chloride[C6MIM]Cl was obtained from the Center for Green Chemistry andCatalysis, LICP, CAS (Lanzhou, China). LiNTf2 was purchased fromZhejiang Jiuzhou Pharmaceutical (Zhejiang, China).
The stock standard solutions of 3000 mg/L for each insecticidewere dissolved in HPLC-grade methanol and stored at 4 1C in therefrigerator, protected from light. A mixed standard solution of3 mg/L of each pesticide was prepared in methanol. Chromato-grams and peak areas were obtained for quality control. Calcula-tion of enrichment factors (EF) and recoveries (%R) was performedby injecting mixed standard solutions into the instrument systemfive times a day. The working standard aqueous solutions wereprepared daily by serial dilution of the mixed standard solutionwith ultrapure water before extraction. River water, reservoirwater and lake water collected from Xiaoyue River (Haidian,Beijing), Shangzhuang Reservoir (Haidian, Beijing), and BaiyangLake (Baoding, Heibei), respectively were used for method valida-tion. The environmental water samples were stored in glasscontainers at 4 1C and filtered through a 0.22 mm membrane(Agla, USA) prior to analysis. The soil sample was collected fromthe experimental field of our campus (China Agricultural Uni-versity, Beijing). Twenty grams of soil were weighted into 200 mLdistilled water and followed by ultrasound radiation for 10 min.After the centrifugation at 4000 rpm for 5 min, the supernatantwas filtered through a 0.22 mm membrane and stored in glasscontainers at 4 1C.
2.2. Instruments
Chromatographic analysis was carried out on an Agilent 1200HPLC system (California, USA) equipped with variable-wave-length detection (VWD). A high-pressure injection valve fittedwith a 20 mL loop was used for the sample injection. Theanalytical column was Agilent Eclipse Plus C18 column (5 mm,4.6 mm�250 mm). A Baiyang 52A (Baoding, China) centrifugewas used for centrifugation. A KQ3200DE ultrasonic water bath(Kunshan Ultrasonic Instrument Co. Ltd., Kunshan, China) (150 Wand 40 kHz) was applied to emulsify the IL. All glassware used inthe experiments were washed with deionized water and acetoneand then dried at room temperature.

Table 1Experimental variables and levels of the Plackett–Burman design.
Variables Level
Low (�1) High (þ1)
(Q) the quantity of [C6MIM]Cl (g) 0.028 0.034
(R) the molar ratio of [C6MIM]Cl and LiNTf2 1:1 1:1.6
(I) ionic strength (NaCl concentration; w/v) (%) 0 8
(UT) ultrasound time (min) 0 4
(CT) centrifugation time (min) 5 20
J. Zhang et al. / Talanta 98 (2012) 145–151 147
2.3. Determination of target compounds by HPLC
The flow rate of mobile phase was kept at 1 mL/min.The mobile phase A and B were methanol and water, respectively.The gradient conditions are as follows: 0–10.5 min, 77% A;10.5–15 min, 77–83% A; 15–30 min, 83% A; 30–35 min, 83–77%A. The temperature of column was controlled at 25 1C. Themonitoring wavelength was 240 nm for diuron and 254 nm fordiflubenzuron, teflubenzuron, flufenoxuron and chlorfluazuron.
2.4. In-situ UA-IL-DLLME procedure
A total of 0.034 g of [C6MIM]Cl was added into a 15 mL glassconical centrifuge tube. A total of 10 mL of spiked water wasplaced into the tube. Then, the tube was shaken gently to disperseand dissolve the IL into the water sample. After quickly adding360 mL LiNTf2 of aqueous solution (0.162 g/mL) to the watersample, the mixed solution was vibrated using an ultrasonicwater bath at 150 W for 4 min. A turbid cloudy solution wasformed. The solution was then centrifuged at 3500 rpm for10 min to achieve phase separation. The upper aqueous phasewas removed with a syringe. The volume of the sedimented phasecollected after removal of the aqueous phase was approximately37 mL. From the remaining sedimented phase, 10 mL was aspi-rated into a 50 mL microsyringe (Agilent, USA) and directlyinjected into the HPLC system for analysis.
Fig. 2. Pareto chart of the main effects obtained from the Plackett–Burman design
for phenylurea pesticides.
2.5. Optimization strategy
Several factors may affect extraction performance, such as thequantity of [C6MIM]Cl, the molar ratio of [C6MIM]Cl and LiNTf2,and ultrasound time. P–B design was used for variable screeningto define the significant experimental variables of in-situ UA-IL-DLLME for the extraction of phenylurea pesticides from the watersamples. After determining the variables that mainly affect theextraction process, CCD was performed to derive the correspond-ing response surface equation and investigate the interactionamong these variables. The experimental design matrix and dataanalysis were performed using MINITAB version 16 software.
2.6. Calculation of EF and R%
EF is the ratio between the analyte concentration in thesediment phase (Csed) and the initial concentration in the analyte(C0). To evaluate the effect of experimental conditions on theextraction efficiency, EF and R% were calculated according to thefollowing equations:
EF¼csed
C0ð1Þ
R%¼CsedVSed
C0Vaq� 100¼ Ef �
Vsed
Vaq� 100 ð2Þ
where Csed is obtained from the calibration graph of the directinjection of standard solution in methanol in the range of 0.1 mg/Lto 12 mg/L and Vsed and Vaq are the volume of the sediment phaseand the volume of the sample, respectively.
3. Results and discussion
In previous studies on IL-DLLME, single-dimensional searcheswere usually performed to optimize the parameters relevant tothe extraction process. However, univariate searches are labor-ious, time-consuming, and proceed without considering theinteractive effects of the test variables. To resolve these problems,P–B design and CCD, which combines screening and optimization,were used in the developed method to determine the optimalexperimental conditions. These chemometric methods allow asimultaneous varation in whole factors and facilitate the quanti-fication of linearity, correlation coefficients, and the interactiveeffects of the tested variables.
3.1. P–B design
P–B design was used to identify the factors having significanteffects on the extraction efficiency among a large number ofvariables. In the present study, based on the literature and theprevious experience of the current authors [32–34], the influenceof five factors, namely, quantity of [C6MIM]Cl, molar ratio of[C6MIM]Cl and LiNTf2, ionic strength, ultrasound time, andcentrifugation time at two levels, were selected. To evaluate themain effects of these five factors, a matrix of the P–B design wasdeveloped consisting of 12 experiments and performed randomlyto eliminate the effects of extraneous or nuisance variables. Theirlevels and the corresponding symbols are depicted in Table 1.Each of the trials was performed in triplicate and the mean of thecorresponding recoveries were treated as responses. ANOVA testwas used to determine the main effects using the t-test with a95% probability [35].
The standardized effects for the P–B design are illustrated in aPareto chart in Fig. 2. Given that all analytes showed similarresults, only the chart of diflubenzuron was chosen as a repre-sentative example of the phenylurea pesticides. Variables signifi-cant at 5% level (Po0.05) were considered to have greaterinfluence on recoveries. Considering that the bar length wasproportional to the significance in Fig. 2, the quantities of both[C6MIM]Cl and ultrasound time were statistically important, andthe quantity of [C6MIM]Cl was the most significant factor.Centrifugation time was another significant variable next toultrasound time. Moreover, as shown in Fig. 2, ionic strengthand the molar ratio of [C6MIM]Cl and LiNTf2 revealed no
J. Zhang et al. / Talanta 98 (2012) 145–151148
significant effect on extraction efficiency. Consequently, NaClconcentration was fixed at 0%, supporting our previous results.After the reaction equilibrium between [C6MIM]Cl and LiNTf2, anextra quantity of LiNTf2 acts the role of NaCl in the present study.Therefore, to ensure 100% completion of in-situ metathesis reac-tion without unnecessary wastage, the molar ratio of [C6MIM]Cland LiNTf2 was chosen at 1:1.2 as a compromise value. Finally, thefactors considered in the next optimization step were the quan-tity of [C6MIM]Cl, ultrasound time, and centrifugation time, whilethe molar ratio of [C6MIM]Cl and LiNTf2 was fixed at 1:1.2 with nosalt addition.
3.2. CCD design
The next step in the present research was the optimization ofthe three factors chosen from the first screening design. Manyexperimental designs, such as Box–Wilson and CCD, can be foundin the literature to perform the optimization. In the present study,a circumscribed CCD was employed and constructed using severalsuperimposed designs. The CCD used consists of a factorial design(2f) augmented with star points (2f) and central points (C), wheref is the number of variables to be optimized and C is the numberof running times [36]. The star points are located at þa and �afrom the center of the experimental domain. The value of a wasselected as 1.682 to establish the rotatability condition of the CCD[37]. In the current study, f and C were set to 3 and 6, respectively,which meant that twenty experiments were required in thisdesign and performed randomly, for the same reasons as men-tioned for the P–B design.
The CCD allowed a quadratic model fit to the data andpermitted the response to be modeled by a polynomial fit, whichcan be expressed in the following equation:
y¼ b0þb1Qþb2UTþb3CTþb12Q � UTþb13Q � CT
þb23QT � UTþb11Q2þb22UT2
þb33CT2
where b0 is the intercept, b1 to b33 represent the regressioncoefficients, and y is the response function (recovery, in thepresent study). The CCD model consists of three main effects,three two-factor interaction effects, and three curvature effects.This mathematical model was obtained by applying the Minitabprogram to perform the multivariate regression analysis on thechromatographic data for each design point. The results obtainedfrom the CCD, namely, the parameter estimates, the Studentst distribution, and p values, are listed in Table 2. The experimentaldata shows a good fit with second-order polynomial equations.The coefficient value of determination (R2), which measures theamount of variation around the mean explained by the model,was 0.917. The adjusted R2 is an adjustment for the number ofterms in the respective model, and higher adjusted R2 valuesindicate a better accordance with the experimental data and thefitted model. In the current work, the adjusted R2 was 0.842.
Table 2Analysis of variance (ANOVA) for central composite design.
Model term Parameter estimate (coefficients) t P
Constant 88.250 131.954 0.000
Q 2.1368 4.815 0.001
UT 2.417 5.448 0.000
CT �1.5367 �3.463 0.006
Q�UT 0.338 0.582 0.573
Q�CT 1.986 3.428 0.006
UT�CT 1.738 2.997 0.013
Q2�0.627 �1.452 0.177
UT2�1.387 �3.212 0.009
CT2�1.706 �3.949 0.003
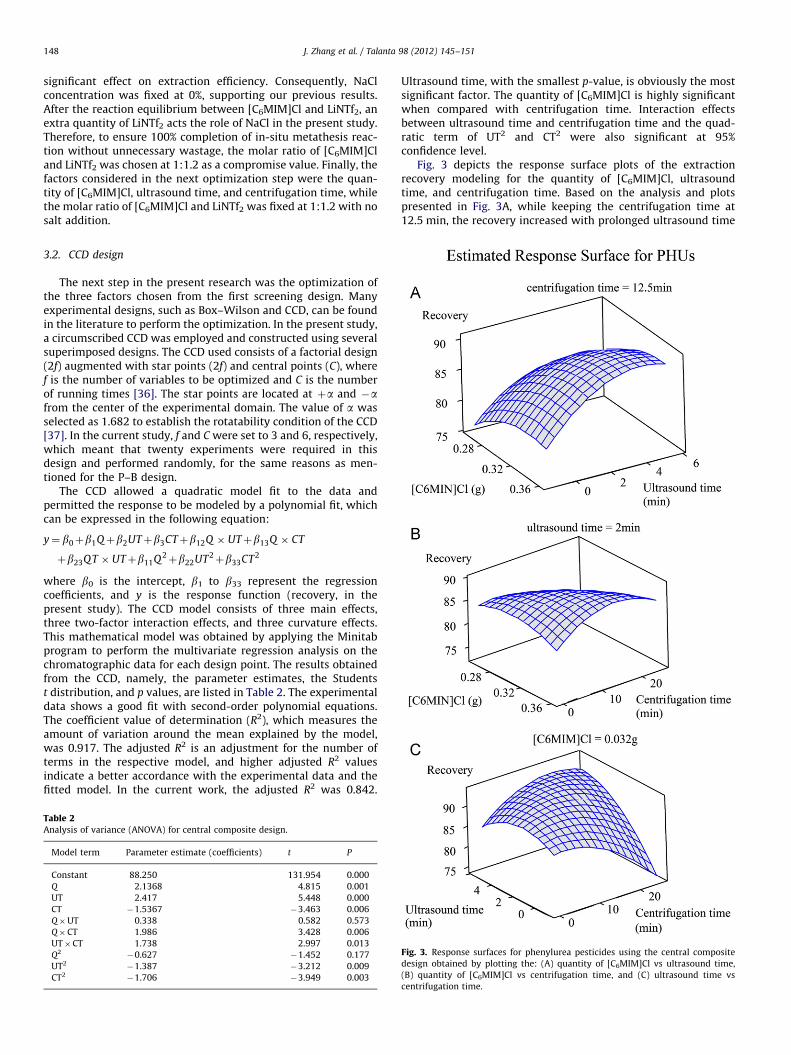
Ultrasound time, with the smallest p-value, is obviously the mostsignificant factor. The quantity of [C6MIM]Cl is highly significantwhen compared with centrifugation time. Interaction effectsbetween ultrasound time and centrifugation time and the quad-ratic term of UT2 and CT2 were also significant at 95%confidence level.
Fig. 3 depicts the response surface plots of the extractionrecovery modeling for the quantity of [C6MIM]Cl, ultrasoundtime, and centrifugation time. Based on the analysis and plotspresented in Fig. 3A, while keeping the centrifugation time at12.5 min, the recovery increased with prolonged ultrasound time
Fig. 3. Response surfaces for phenylurea pesticides using the central composite
design obtained by plotting the: (A) quantity of [C6MIM]Cl vs ultrasound time,
(B) quantity of [C6MIM]Cl vs centrifugation time, and (C) ultrasound time vs
centrifugation time.

J. Zhang et al. / Talanta 98 (2012) 145–151 149
of as long as 4 min and the 0.34 g [C6MIM]Cl provided the bestextraction result. Indeed, sufficient ultrasound time acceleratesthe formation of a fine dispersive mixture and results in higherrecoveries, whereas the extension of ultrasonic treatment timecan also result in the loss of volatile analytes and extractants dueto heat generation. Fig. 3B demonstrates a significant positiveeffect of centrifugation time from 0 min to 10 min and indicatesthat the short time allotted was not enough to break down thecloudy solution and to achieve total sediment phase. This figurealso reveals that the recovery of large analytes increased whenthe quantity of [C6MIM]Cl increased from 0.026 g to 0.034 g andthen decreased with the continuous increase in the quantity of[C6MIM]Cl. This finding may probably be due to a larger quantityof [C6MIM]Cl forming an extra amount of [C6MIM]NTf2 after thein-situ metathesis reaction, which accelerated the settlement atthe bottom of the tube. Fig. 3C shows the extraction recoverythree-dimensional response surface yielded by the model forultrasonic treatment time and centrifugation time, at a constantvalue of the quantity of [C6MIM]Cl. Same as Fig. 3A and B, boththe ultrasonic time and centrifugation time produced positiveinfluences at early stage, however the prolong time with ultra-sonication and centrifugation decreased the extraction of
Fig. 4. The matrix effect on the extraction recoveries. Extraction conditions as
follows: 10.0 mL sample solution with different humic acid concentrations
(0–5 mg/L) and no salt addition, 0.034 g of [C6MIM]Cl and 360 mL LiNTf2 aqueous
solution (0.162 g/mL) for the extraction solvent, 4 min ultrasonic treatment time,
and 10 min centrifugation at 3500 rpm.
Table 4Comparison of in-situ UA-IL-DLLME with other methods for the determination of PHU
Method Extraction time (min) Extraction solvent
PLEa LC-MS/MS 30 Dichloromethane/ace
QuEChERS LC-MS/MS 20 Acetonitrile
SPME-LC 40 –
SPME-GC-NPD 60 –
FDMEb-HPLC 25 1-dodecanol
DLLME-HPLC 4 Acetone
In-situ 4 [C6MIM]NTf2
UA-IL-DLLME HPLC
a Pressurised liquid extraction;b Floated organic drop microextraction.
Table 3The performance characteristics of the proposed method combined with HPLC-VWD.
Compound Linearity equation Linearity (mg/L) r RSD
Diuron Y¼11.486X-6.1887 0.5–500 0.9996 2.7
Diflubenzuron Y¼7.919X-14.535 0.5–500 0.9997 3.4
Teflubenzuron Y¼4.542X-8.739 0.5–500 0.9997 3.5
Flufenoxuron Y¼5.351X-14.099 0.5–500 0.9997 3.4
Chlorfluazuron Y¼7.484X-19.783 0.5–500 0.9996 2.4
RSD: relative standard deviation; LOD: limits of detection (S/N¼3); LOQ: limits of qua
analytes. Overall, and according to the results of the optimizationstudy, the optimum conditions selected for in-situ UA-IL-DLLMEare as follows: 10.0 mL sample solution with no salt addition,0.034 g of [C6MIM]Cl and 360 mL LiNTf2 aqueous solution(0.162 g/mL) for the extraction solvent, 4 min ultrasonic treat-ment time, and 10 min centrifugation at 3500 rpm.
3.3. Martix effect
Compounds with high molecular mass can affect the ionizationof lower mass molecules in complex matrices [38]. To study theinfluence of the matrix on the extraction procedures, standardsolutions with humic acid (a principal component of humic sub-stances, which exists in environmental matrices) were extractedunder the optimized conditions. Fig. 4 showed the extractionrecoveries were in the range of 93.1–106.1% for all the studiedphenylurea pesticides at different humic acid concentrations(0–5 mg/L). These results indicated there was no significant matrixeffect on the extraction efficiencies under in-situ metathesis reac-tion combined with ultrasound-assisted ionic liquid dispersiveliquid–liquid microextraction.
3.4. Evaluation of the method performance
Under the above-mentioned optimal conditions, quality fac-tors including the limits of detection (LODs), limits of quantitation(LOQs), linear calibration ranges, regression equations, and othercharacteristics of the method were investigated to evaluate theanalytical performance of the proposed method. Three replicateextractions were performed for each concentration level. Theresults are listed in Table 3. The linearity of the method wasevaluated using water samples spiked with phenylurea pesticidesat nine different concentrations ranging from 0.5 mg/L to 500 mg/L.The results showed good linearity within the concentration rangestudied for all the five phenylurea pesticides, with the correla-tion coefficients (r) ranging from 0.9996 to 0.9997. Satisfactoryprecisions (RSD: 2.4% to 3.5%, n¼6) were calculated ata concentration level of 5 mg/L of each phenylurea pesticide.The limits of detection (LODs) and limits of quantitation (LOQs)
s.
Analytical ranges LODs Ref.
tone 10–50 mg/kg 1.9–3.9 mg/kg [12]
5–500 mg/L 0.7–0.14 mg/L [13]
5–100 mg/L 0.7–4.6 mg/L [39]
1–250 mg/L 0.04–0.10 mg/L [40]
0.01–10.0 mg/L 5–10 mg/L [41]
1–200 mg/L 0.01–0.5 mg/L [42]
0.5–500 mg/L 0.05–0.08 mg/L Present work
(%) Enrichment factors LOD (mg/L) LOQ (mg/L) Recovery (%)
244 0.07 0.23 92.6
262 0.06 0.20 99.0
263 0.07 0.23 99.7
268 0.08 0.28 101.8
265 0.06 0.18 100.6
ntitation (S/N¼10).
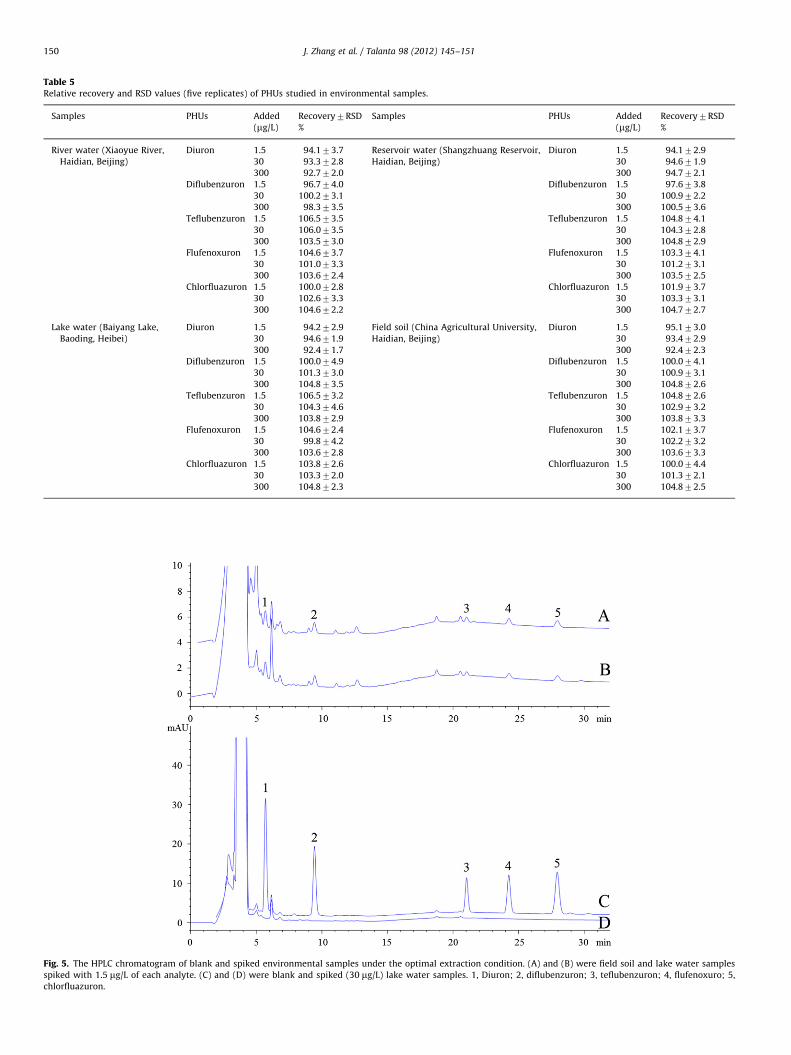
Table 5Relative recovery and RSD values (five replicates) of PHUs studied in environmental samples.
Samples PHUs Added
(mg/L)
Recovery7RSD
%
Samples PHUs Added
(mg/L)
Recovery7RSD
%
River water (Xiaoyue River,
Haidian, Beijing)
Diuron 1.5 94.173.7 Reservoir water (Shangzhuang Reservoir,
Haidian, Beijing)
Diuron 1.5 94.172.9
30 93.372.8 30 94.671.9
300 92.772.0 300 94.772.1
Diflubenzuron 1.5 96.774.0 Diflubenzuron 1.5 97.673.8
30 100.273.1 30 100.972.2
300 98.373.5 300 100.573.6
Teflubenzuron 1.5 106.573.5 Teflubenzuron 1.5 104.874.1
30 106.073.5 30 104.372.8
300 103.573.0 300 104.872.9
Flufenoxuron 1.5 104.673.7 Flufenoxuron 1.5 103.374.1
30 101.073.3 30 101.273.1
300 103.672.4 300 103.572.5
Chlorfluazuron 1.5 100.072.8 Chlorfluazuron 1.5 101.973.7
30 102.673.3 30 103.373.1
300 104.672.2 300 104.772.7
Lake water (Baiyang Lake,
Baoding, Heibei)
Diuron 1.5 94.272.9 Field soil (China Agricultural University,
Haidian, Beijing)
Diuron 1.5 95.173.0
30 94.671.9 30 93.472.9
300 92.471.7 300 92.472.3
Diflubenzuron 1.5 100.074.9 Diflubenzuron 1.5 100.074.1
30 101.373.0 30 100.973.1
300 104.873.5 300 104.872.6
Teflubenzuron 1.5 106.573.2 Teflubenzuron 1.5 104.872.6
30 104.374.6 30 102.973.2
300 103.872.9 300 103.873.3
Flufenoxuron 1.5 104.672.4 Flufenoxuron 1.5 102.173.7
30 99.874.2 30 102.273.2
300 103.672.8 300 103.673.3
Chlorfluazuron 1.5 103.872.6 Chlorfluazuron 1.5 100.074.4
30 103.372.0 30 101.372.1
300 104.872.3 300 104.872.5
Fig. 5. The HPLC chromatogram of blank and spiked environmental samples under the optimal extraction condition. (A) and (B) were field soil and lake water samples
spiked with 1.5 mg/L of each analyte. (C) and (D) were blank and spiked (30 mg/L) lake water samples. 1, Diuron; 2, diflubenzuron; 3, teflubenzuron; 4, flufenoxuro; 5,
chlorfluazuron.
J. Zhang et al. / Talanta 98 (2012) 145–151150

J. Zhang et al. / Talanta 98 (2012) 145–151 151
were calculated from pure water samples with spiked levels of1.5 mg/L and a signal-to-noise ratio (S/N) of 3 and 10, respectively.The LODs ranged from 0.06 mg/L to 0.08 mg/L, and LOQs ranged from0.18 mg/L to 0.23 mg/L. The extraction recoveries and enrichmentfactors of this method were high and ranged from 92.6% to 101.8%and 244 to 268, respectively.
A comparison with other relevant methods for the analysis ofphenylurea pesticides (Table 4) shows that the proposed methodexhibits better linearity and precision, adequately low detectionlimits, and low sample consumption. Moreover, the in-situ UA-IL-DLLME used [C6MIM]NTf2 instead of a volatile organic solvent asextraction solvent and did not require the utilization of adisperser organic solvent in the extraction procedures. Therefore,in-situ UA-IL-DLLME is, a simple, fast, easy to perform, andenvironmentally friendly technique.
3.5. Analysis of real samples
In-situ UA-IL-DLLME was applied in real environmental sam-ples, including lake, reservoir, lake water and soil, for thedetermination of the five phenylurea pesticides to study theapplicability of the proposed method. Results show that diuron,diflubenzuron, teflubenzuron, flufenoxuron, and chlorfluazuronresidues were below the detectable level in all samples (as shownin Fig. 4(a)). For the recovery experiment, environmental sampleswere spiked with standards of the five phenylurea pesticides atconcentrations of 1.5 mg/L, 30 mg/L and 300 mg/L, respectively.The results are summarized in Table 5 and the chromatogram of alake water sample spiked with 1.5 mg/L and 30 mg/L of phenylureapesticides was displayed in Fig. 4(c) and (b). As can be seen,relative recoveries were between 92.1% and 104.8%, and RSDvalues were between 1.8% and 4.9% for all the phenylureapesticides in the spiked samples. These results indicate that thein-situ UA-IL-DLLME method is feasible for the determination ofphenylurea pesticides in environmental samples Fig. 5
4. Conclusions
A novel microextraction technique based on ILs, named in-situmetathesis reaction, combined with UA-IL-DLLME was successfullyapplied in the determination of five phenylurea pesticides inenvironmental samples, whicn including lake, reservoir, lake waterand soil. In the developed method, forming the immiscible ILextraction phase and the transfer of analytes proceeded simulta-neously. The ultrasonication process promoted [C6MIM]NTf2 todisperse into the sample solution and accelerated the extraction.Optimization of the experimental variables was performed usingresponse surface methodology and experimental designs. Theresulting technique provides good repeatability, linearity rangeand enrichment factor for each compound, and matrix effects donot interfere with the quantification process. Therefore, the pro-posed method is recommended as a fast, simple, sensitive, andenvironment friendly sample preparation technique.
Acknowledgements
This work was supported by the National Natural ScienceFoundation of China (Project No. 20977112), the Program for NewCentury Excellent Talents in University(NCET-10–0777) and theSpecialized Research Fund for the Doctoral Program of HigherEducation of China (Grant No. 20090008120015).
References
[1] C. Molines, E.A. Hogendoorn, E. Dijkman, H.A.G. Heusinkveld, R.A. Baumann,J. Chromatogr. A 869 (2000) 487.
[2] A.C. Gerecke, S. Canonica, S.R. M QUOTE ller, R.P. Schwarzenbach, Environ. Sci.Technol. 35 (2001) 3915–3923.
[3] P.Y. Caux, R.A. Kent, G.T. Fan, C. Grande, Environ. Toxicol. Water Qual. 13(1998) 1.
[4] L. Lhomme, S. Brosillon, D. Wolbert, J. Dussaud, Appl. Catal B: Environ. 61(2005) 227.
[5] Directive98/83/EEC. Quality of water Intended for Human Consumption;Brussels, 1998.
[6] L. Abramsson-Zetterberg, A.C. Vikstrom, M. Tornqvist, K.-E. Hellenas., Mutat.Res./Genet. Genet. Toxicol. Environ. Mutagen. 653 (2008) 50.
[7] B. Goger, O. Kunert, C. Seger, R. Rinelli, R. Wintersteiger, Electroanalysis 13(2001) 1335–1341.
[8] P. Sharma, K. Sablok, V. Bhalla, C.Raman Suri, Biosens. Bioelectron. 26 (2011)4209.
[9] J.P. Quirino, N. Inoue, S. Terabe, J. Chromatogr. A 892 (2000) 187.[10] F. Pena, S. Cardenas, M. Gallego, M. Valcarcel, Talanta 56 (2002) 727.[11] T. Chou, S. Lin, M. Fuh, Talanta 80 (2009) 493.[12] E. Bichon, M. Dupuis, B. Le Bized, F. Andre, J. Chromatogr. B 838 (2006) 96.[13] L. Pareja, V. Cesio, H. Heinzen, A.R. Fernandez-Alba, Talanta 83 (2011) 1613.[14] J.M.F. Nogueira, T. Sandra, P. Sandra, Anal. Chim. Acta 505 (2004) 209.[15] H. Singer, S. Jaus, I. Hanke, A. Luck, J. Hollender, A.C. Alder, Environ. Pollut.
158 (2010) 3054.[16] T.A. Bellar, W.L. Budde, Anal. Chem. 60 (1988) 2076.[17] N.W. Lloyd, S.R. Dungan, S.E. Ebeler, Analyst 136 (2011) 3375.[18] J. Abulhassani, J.L. Manzoori, M. Amjadi, J. Hazard. Mater. 176 (2010) 481.[19] L. Vidal, A. Chisvert, A. Canals, A. Salvador, Talanta 81 (2010) 549.[20] X.G. Ma, M.H. Huang, Z.H. Li, J.M. Wu, J. Hazard. Mater. 194 (2011) 24.[21] G.C. Bedendo, E. Carasek, J. Chromatogr. A 1217 (2010) 7.[22] Q. Zhou, X. Zhang, G. Xie, Anal. Methods 3 (2011) 356.[23] M. Rezaee, Y. Assadi, M.M. Hosseini, E. Aghaee, F. Ahmadi, S. Berijani,
J. Chromatogr. A 1116 (2006) 1.[24] Q.X. Zhou, X.G. Zhang, J.P. Xiao, J. Chromatogr. A 1216 (2009) 4361.[25] J.J. Du, H.Y. Yan, D.D. She, B.M. Liu, G.L. Yang, Talanta 82 (2010) 698.[26] C. Cortada, L. Vidal, A. Canals, Talanta 85 (2011) 2546.[27] J. Sun, Y. Shi, J. Chen, J. Chromatogr. B 879 (2011) 3429.[28] T. Mao, B. Hao, J. He, W.L. Li, S.Q. Li, Z.N. Yu, J. Sep. Sci. 32 (2009) 3029.[29] H. Chen, P. Du, J. Chen, S.H. Hu, S.Q. Li, H.L. Liu, Talanta 81 (2010) 176.[30] S.Q. Gao, J.Y. You, X. Zheng, Y. Wang, R.B. Ren, R. Zhang, Y.P. Bai, H.Q. Zhang,
Talanta 82 (2010) 1371–1377.[31] J.H. Zhang, H.X. Gao, B. Peng, S.Q. Li, Z.Q. Zhou, J. Chromatogr. A 1218 (2011)
6621.[32] M. Baghadi, F. Shemirani, Anal. Chim. Acta 634 (2009) 186.[33] C. Yao, J.L. Anderson., Anal. Bioanal. Chem. 395 (2009) 1491.[34] S.Q. Li, H.X. Gao, J.H. Zhang, Y.B. Li, B. Peng, Z.Q. Zhou, J. Sep. Sci. 34 (2011)
3178.[35] Y.V. Heyden, C. Hartmann, D.L. Massart, L. Michel, P. Kiechle, F. Erni, Anal.
Chim. Acta 316 (1995) 15.[36] R. Rodil, A. Carro, R. Lorenzo, M. Abuın, R. Cela, J. Chromatogr. A 963 (2002)
313.[37] L. Vidal, E. Psillakis, C.E. Domini, N. Grane, F. Marken, A. Canals, Anal. Chim.
Acta 584 (2007) 189.[38] Y. Tao, J.F. Liu, X.L. Hu, H. Li, T. Wang, G.B. Jiang, J. Chromatogr. A 1216 (2009)
6259.[39] H. Lin, Y. Sung, S. Huang, J. Chromatogr. A 1012 (2003) 57.[40] H. Berrada, G. Font, J.C. Molto, J. Chromatogr. A 890 (2000) 303.[41] J. Zhou, R. Liu, G. Song, M. Zhang, Anal. Lett. 42 (2009) 1805.[42] M. Saraji, N. Tansazan, J. Sep. Sci. 32 (2009) 4186.